TL;DR#
Current research focuses on improving large language models (LLMs) reasoning capabilities through test-time scaling, which increases computational resources during inference. Two main approaches exist: sequential scaling (extending reasoning chain length) and parallel scaling (sampling multiple solutions). Prior studies suggest that longer reasoning chains lead to better performance. However, this paper challenges this assumption.
This paper investigates three state-of-the-art LLMs and discovers that longer reasoning chains do not consistently improve accuracy; in fact, correct solutions tend to be shorter than incorrect ones. The researchers attribute this to the models’ self-revision capabilities, where longer chains contain more self-corrections that often degrade performance. To address this, they propose a novel test-time scaling method called “Shortest Majority Vote” that combines parallel scaling with a focus on shorter solutions, leading to significantly improved scalability.
Key Takeaways#
Why does it matter?#
This paper is crucial because it challenges the prevailing assumptions about test-time scaling in large language models (LLMs). By revealing the limitations of existing methods and proposing a novel approach, it directs future research towards more effective and efficient LLM scaling strategies. The findings are relevant to researchers working on LLM reasoning, model efficiency, and test-time optimization.
Visual Insights#

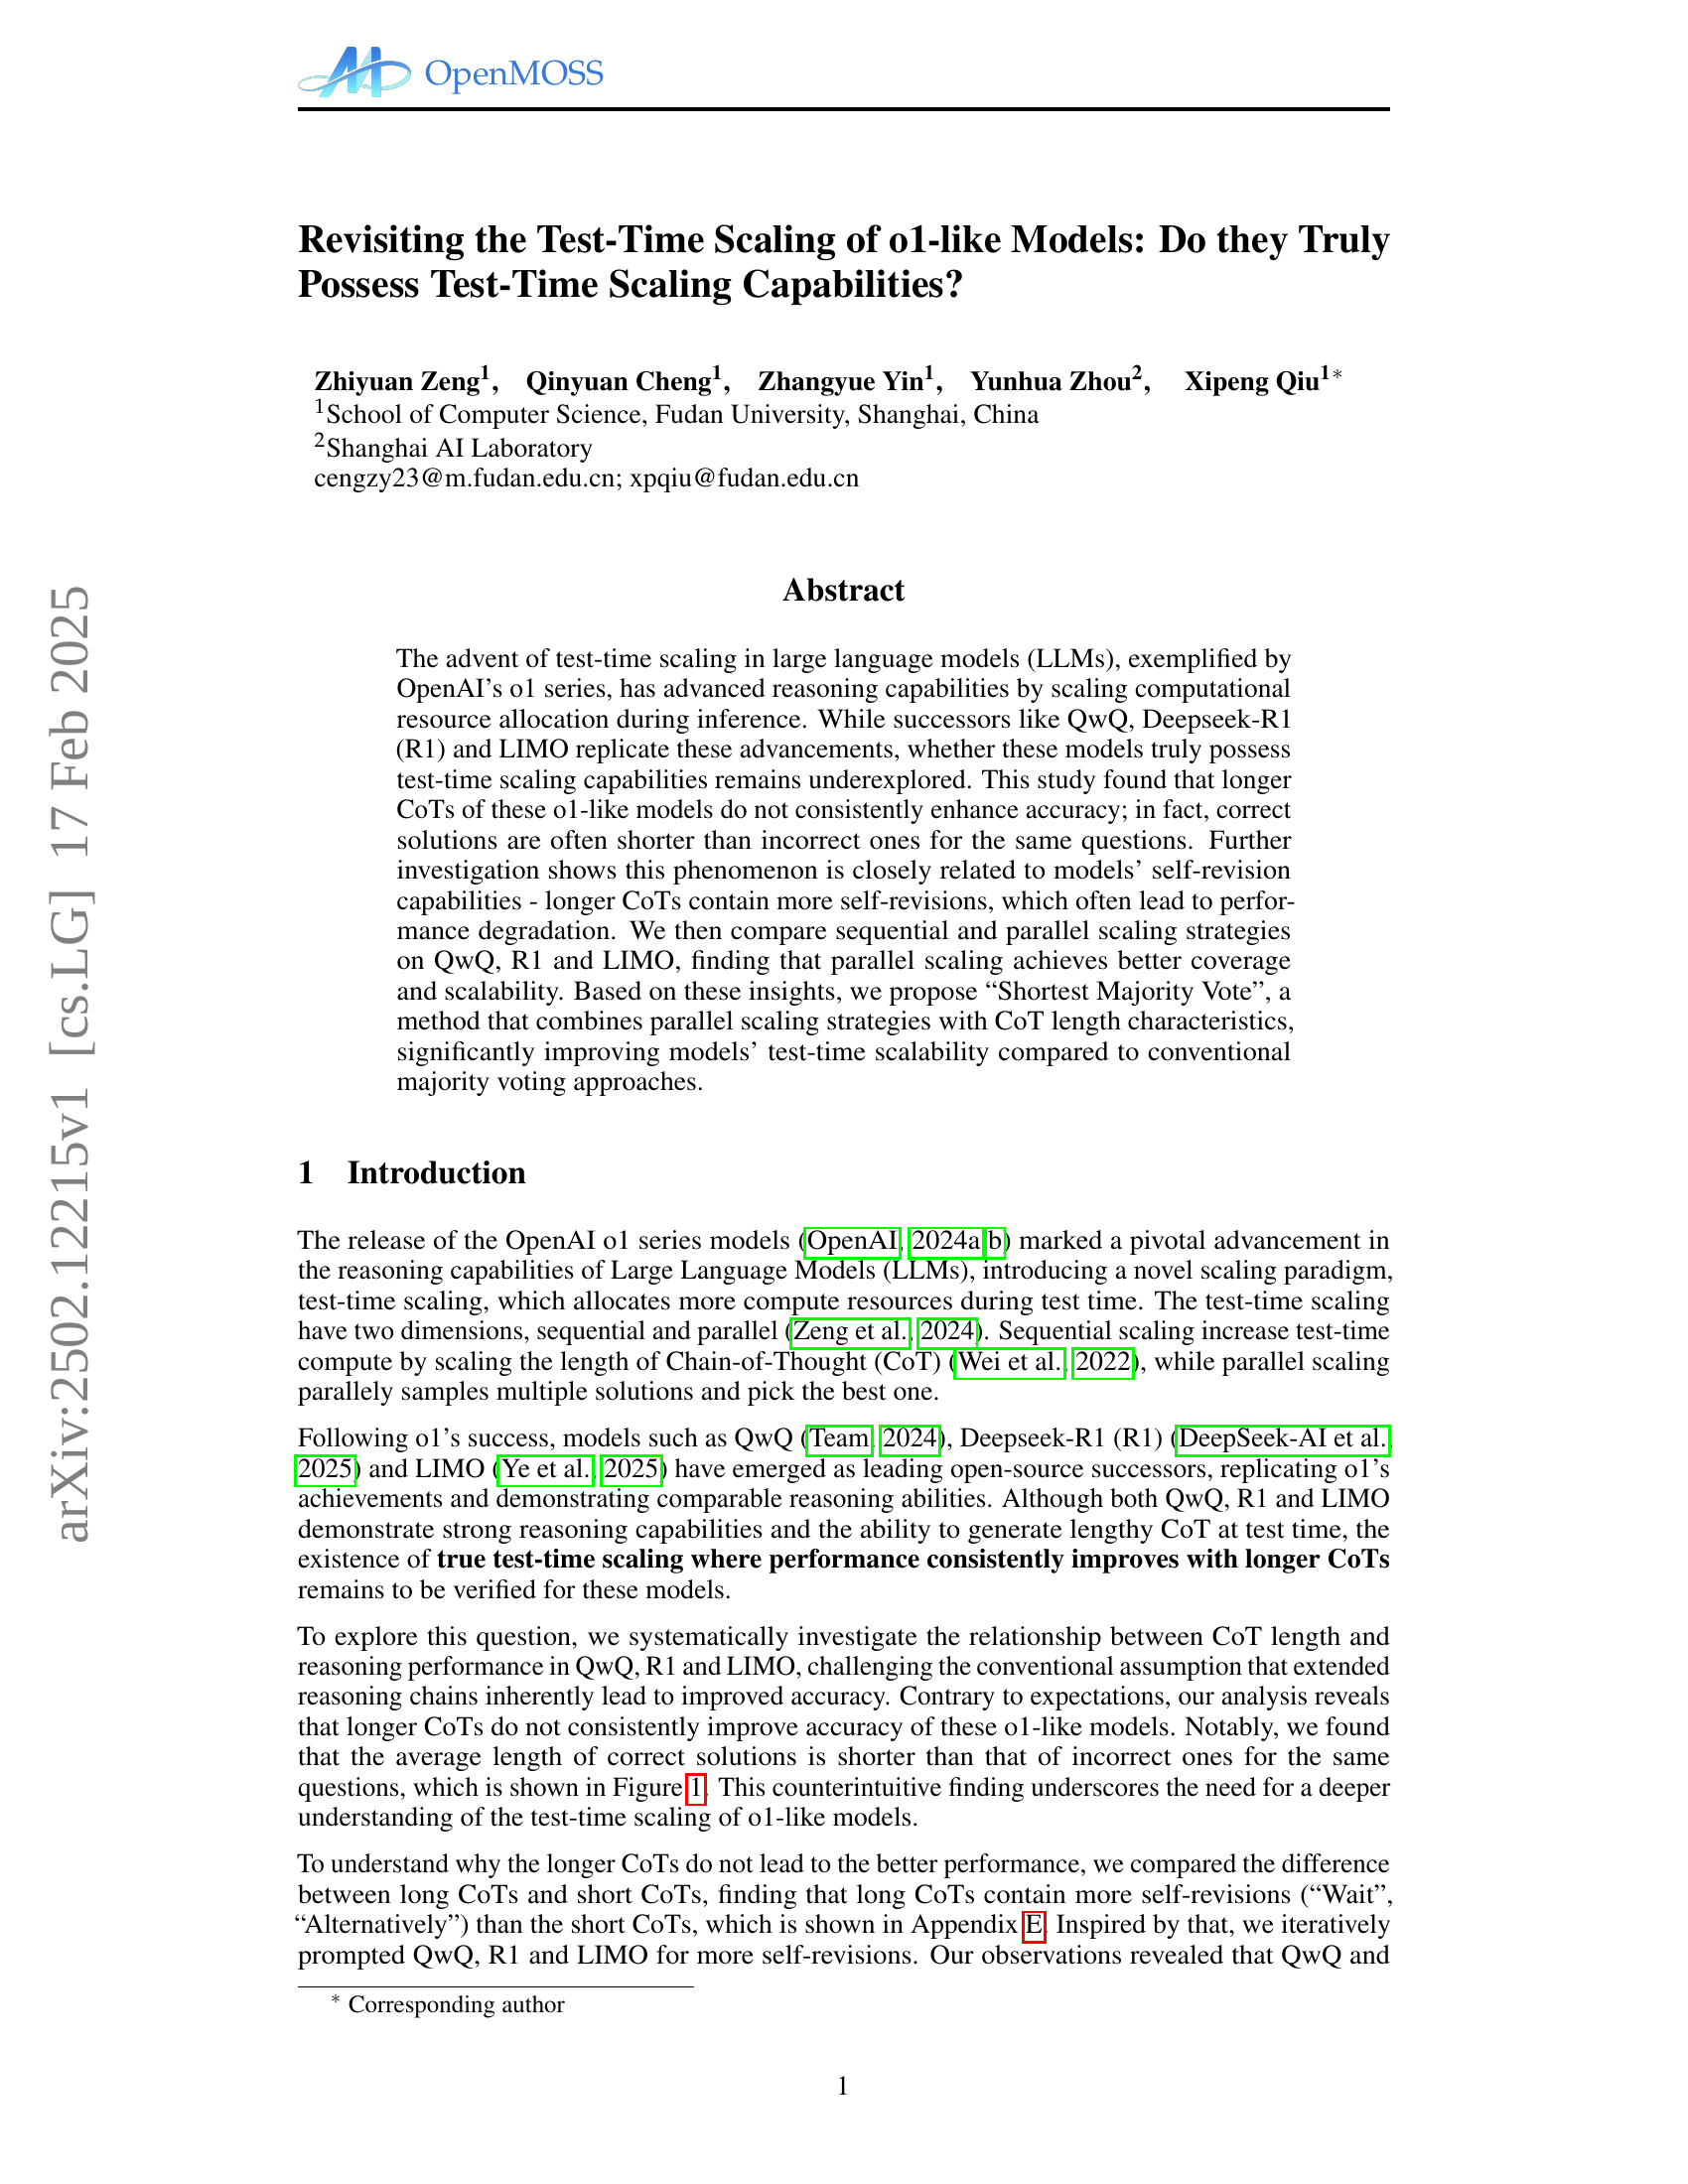
🔼 This figure compares the average lengths of correct and incorrect solutions generated by different language models for the same set of questions. The data is broken down by model, showing the average length of solutions that were correct versus those that were incorrect. The comparison reveals whether longer reasoning chains (longer solutions) are more likely to lead to correct answers or if there is a difference in solution length between correct and incorrect answers. This helps illustrate whether increasing reasoning chain length during inference consistently leads to improved accuracy.
read the caption
Figure 1: The average length of correct solutions versus incorrect solutions evaluated on the same questions. For each question, solution lengths were averaged separately for correct and incorrect responses, then averaged across all questions.
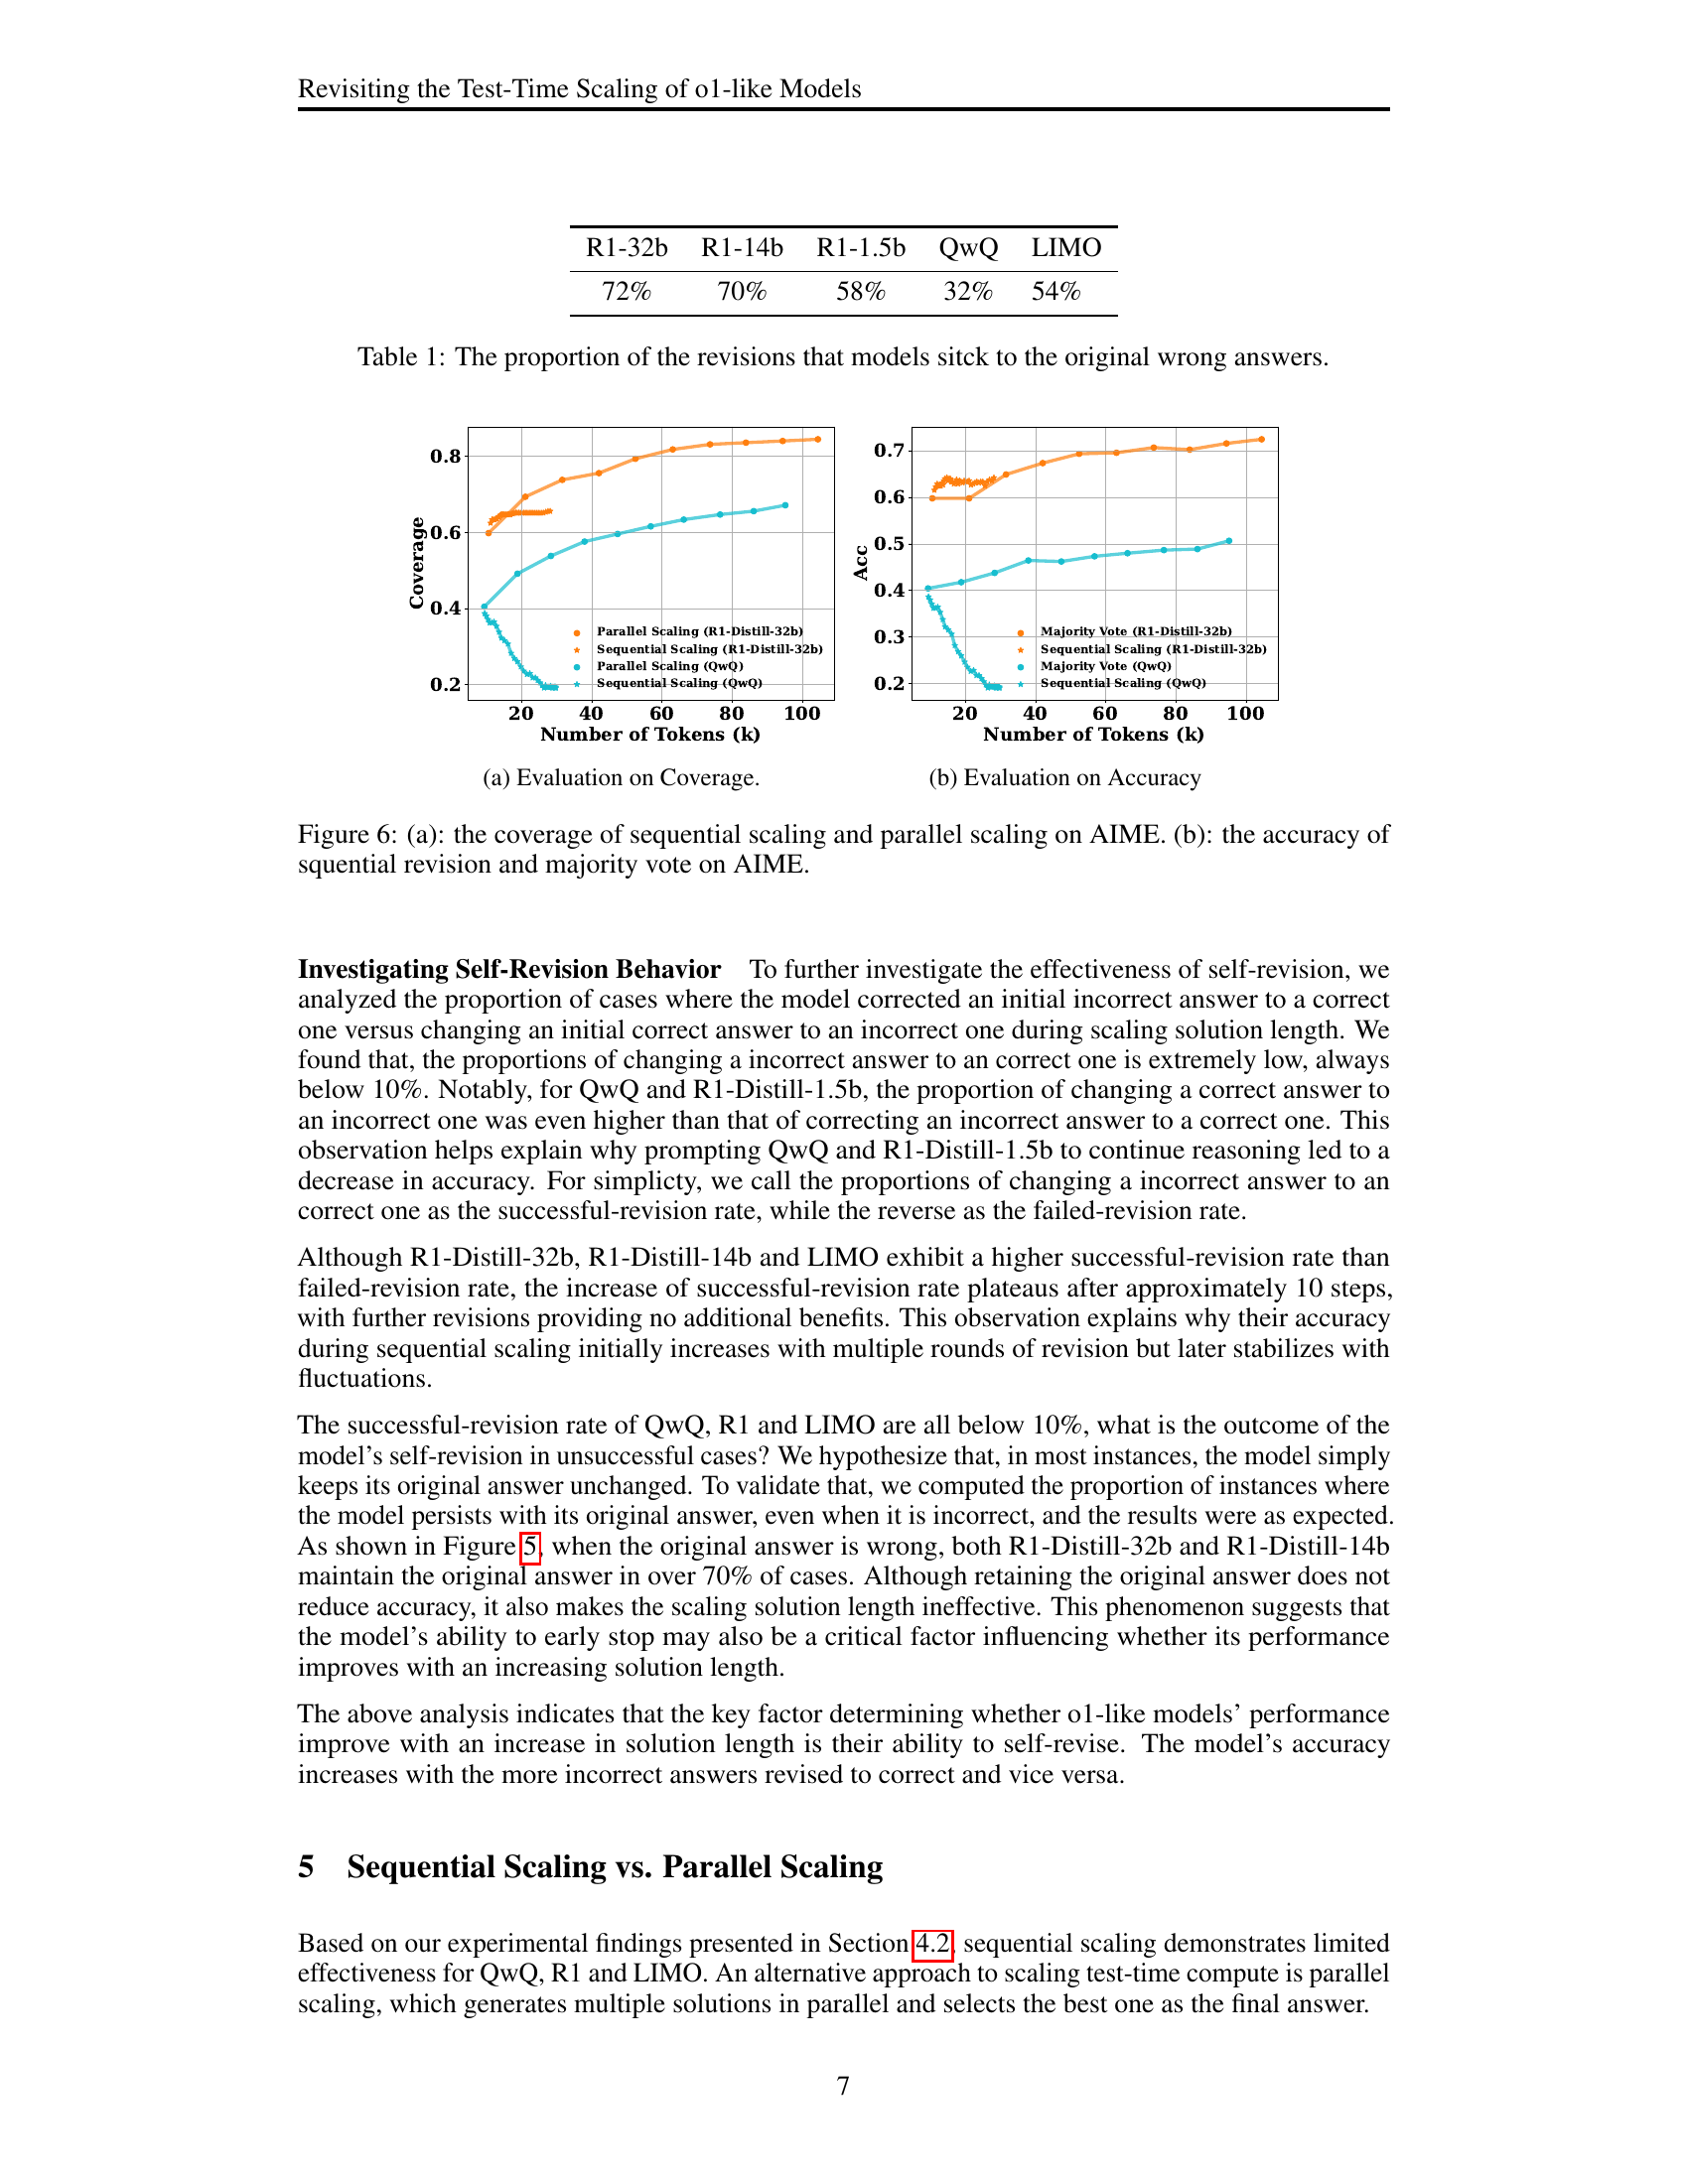
| R1-32b | R1-14b | R1-1.5b | QwQ | LIMO |
| 72% | 70% | 58% | 32% | 54% |
🔼 This table shows the percentage of times each model maintained its initially incorrect answer during the iterative self-revision process. It demonstrates the models’ tendency to persist with incorrect answers instead of correcting them, which is a key factor hindering the effectiveness of sequential scaling.
read the caption
Table 1: The proportion of the revisions that models sitck to the original wrong answers.
In-depth insights#
o1-like Models’ Scaling#
The study investigates the test-time scaling capabilities of large language models (LLMs) similar to OpenAI’s o1 series, revealing a nuanced picture. While models like QwQ, R1, and LIMO demonstrate the ability to generate lengthy Chain-of-Thought (CoT) reasoning, longer CoTs don’t consistently correlate with improved accuracy. The analysis reveals a crucial limitation: the models’ self-revision capabilities are insufficient. Longer CoTs often contain more self-revision attempts that lead to performance degradation, frequently resulting in incorrect answers longer than the correct ones. Consequently, sequential scaling (extending CoT length) proves less effective than expected. In contrast, parallel scaling (generating multiple solutions concurrently), combined with a novel strategy (Shortest Majority Vote), shows significantly better coverage and scalability by prioritizing shorter, more accurate solution clusters. Therefore, the paper challenges the conventional wisdom surrounding test-time scaling in o1-like models, highlighting the critical need for robust self-correction mechanisms to unlock the full potential of longer CoT reasoning.
Sequential Scaling Fails#
The section ‘Sequential Scaling Fails’ would delve into the limitations of solely increasing Chain-of-Thought (CoT) length to improve model performance. The authors likely demonstrate that longer CoTs don’t consistently correlate with higher accuracy. This challenges the conventional wisdom associated with test-time scaling, where increased computational resources during inference directly translate to better reasoning. The core argument probably centers on the phenomenon of self-revision within longer CoTs leading to performance degradation, as models overthink and introduce errors during iterative refinement. The analysis would likely compare the length of correct versus incorrect solutions, showing that correct solutions tend to be shorter, suggesting that excessive self-revision is detrimental. This finding highlights a crucial need to refine test-time scaling strategies beyond simple CoT lengthening, potentially exploring parallel scaling techniques to improve both accuracy and efficiency.
Parallel Scaling Triumphs#
A hypothetical section titled ‘Parallel Scaling Triumphs’ would delve into the superior performance of parallel methods over sequential approaches in scaling large language models for reasoning tasks. It would likely highlight that generating multiple solutions concurrently, then selecting the best, significantly outperforms the iterative refinement strategy of sequential scaling. This superiority would stem from parallel scaling’s ability to explore a wider solution space, avoiding the pitfalls of getting stuck in local optima or performance degradation through repeated self-revisions inherent in sequential approaches. Key findings might include improved accuracy and better coverage (pass@k scores) for parallel methods across multiple benchmarks, demonstrating their enhanced scalability and robustness in handling complex reasoning problems. The analysis would likely support that parallel scaling’s inherent efficiency and reduced risk of error accumulation during inference make it a more effective strategy for achieving better results with test-time scaling of LLMs.
Shortest Majority Vote#
The proposed method, Shortest Majority Vote, is a novel approach to enhance the efficiency of parallel test-time scaling in large language models. It cleverly addresses the issue of inconsistent accuracy improvements with increasing chain-of-thought length by incorporating solution length as a crucial factor. Instead of simply counting the number of solutions in parallel, Shortest Majority Vote prioritizes shorter solutions, which are shown to be more accurate in the study. This refinement of majority voting is particularly significant because it directly tackles the underperformance observed in longer chains-of-thought that often include numerous self-revisions leading to accuracy degradation. By weighting shorter, more accurate solutions more heavily, the algorithm effectively improves test-time scalability, thereby overcoming the limitations of traditional majority voting approaches. The method’s effectiveness is supported by empirical results, demonstrating a substantial improvement in test-time scalability, showcasing its potential to greatly optimize the performance of LLMs during inference.
Future Research Needs#
Future research should explore the inherent limitations of self-correction within LLMs and investigate methods to improve this capability. Improving the self-revision process is crucial for true test-time scaling, as demonstrated by the ineffectiveness of lengthening CoTs in the studied models. Further investigation is needed to understand the interaction between model architecture and self-correction, potentially leading to designs that naturally exhibit better self-revision capabilities. A promising avenue is to explore reinforcement learning techniques tailored to encourage effective self-correction without the negative consequences of excessively long reasoning chains. Finally, research should investigate alternative test-time scaling approaches that circumvent the limitations of sequential scaling, such as more sophisticated parallel methods or hybrid strategies that combine the strengths of both sequential and parallel methods. The development of robust evaluation metrics to measure both the efficiency and effectiveness of self-correction is also critical.
More visual insights#
More on figures

🔼 This figure shows the average lengths of solutions categorized into five groups based on their rank (from shortest to longest) for four different models (QwQ, R1-Distill-32b, R1-Distill-14b, R1-Distill-1.5b and LIMO) across four benchmarks (MATH, AIME, Omini-MATH, and GPQA). The x-axis represents the group number (1 being shortest, 5 being longest), while the y-axis represents the average solution length in tokens for each group. The figure helps visualize the diversity of solution lengths generated by each model and across the different benchmarks.
read the caption
(a) Evaluation for Solution length.

🔼 This figure shows the accuracy of different groups of solutions for four benchmark datasets (MATH, AIME, Omini-MATH, and GPQA). The solutions are categorized into five groups based on their length. Group 1 contains the shortest solutions and Group 5 contains the longest solutions. The graph displays the accuracy for each group in each dataset. This visualization helps to understand the relationship between solution length and accuracy for different models.
read the caption
(b) Evaluation for accuracy.

🔼 Figure 2 shows the results of an experiment to investigate the relationship between solution length and accuracy in the QwQ and R1 models. The models generated multiple solutions for the same questions, and these solutions were categorized into five groups based on their lengths: shortest, short, medium, long, and longest. The figure contains two subfigures: (a) shows the average length of solutions in each group, demonstrating that the average length increases with each successive group; (b) shows the average accuracy of solutions in each group, illustrating that there is no clear trend between solution length and accuracy. This indicates that longer solutions do not necessarily lead to higher accuracy.
read the caption
Figure 2: Solutions of QwQ and R1 were categorized into different groups according to their length and evaluated in terms of solution length (a) and accuracy (b). The categorization of solutions is progressed for each question independently, i.e., all groups of solutions are corresponding to the same questions.

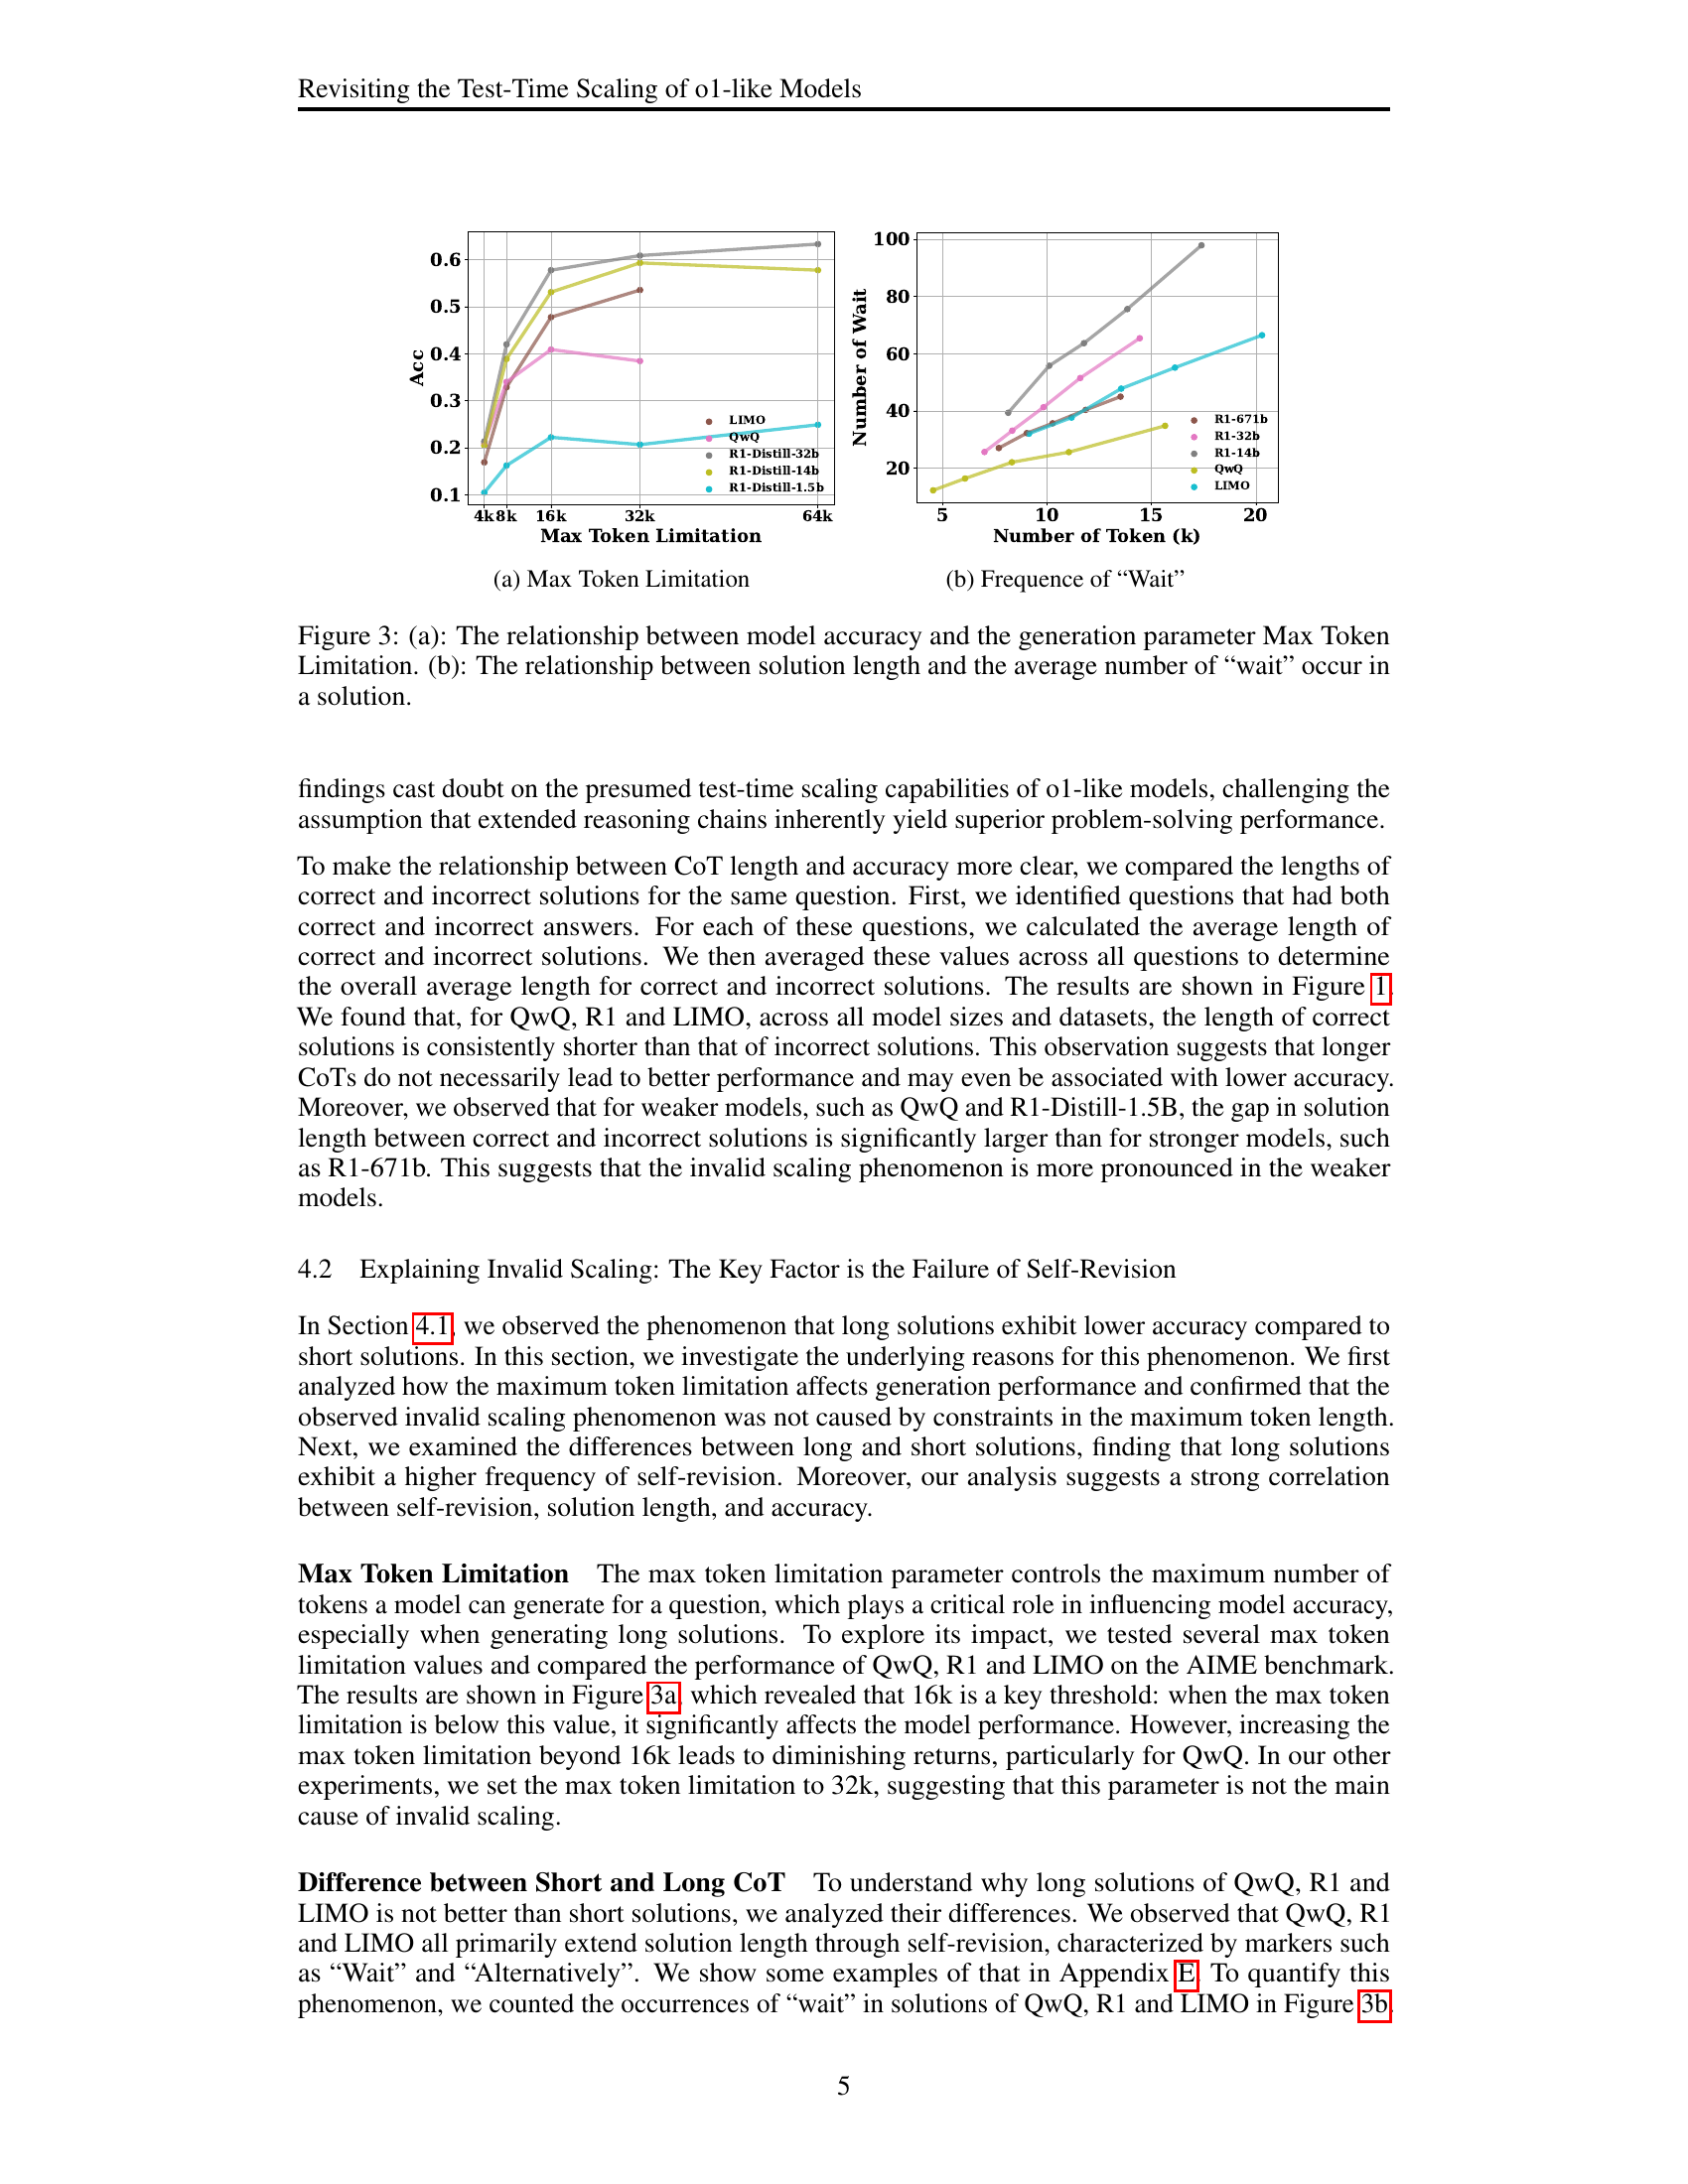
🔼 This figure shows the relationship between the model’s accuracy and the maximum number of tokens it is allowed to generate (Max Token Limitation). It helps to understand whether limiting the maximum number of tokens affects the model’s performance, particularly when generating long solutions, and whether increasing the token limit beyond a certain point provides diminishing returns.
read the caption
(a) Max Token Limitation

🔼 The figure shows the relationship between the average number of occurrences of the word ‘wait’ in a solution and the length of that solution. The word ‘wait’ is an indicator of self-revision during the solution generation process. The figure demonstrates that longer solutions tend to contain more instances of self-revision. This suggests that longer reasoning chains do not always lead to better performance, as self-revisions may introduce errors or cause the model to deviate from the correct solution path.
read the caption
(b) Frequence of “Wait”

🔼 Figure 3 demonstrates the impact of the maximum token limit and self-revision on model performance. Panel (a) shows that there’s an optimal token limit beyond which accuracy does not consistently improve, suggesting the models might not benefit from excessively long generations. Panel (b) illustrates a positive correlation between solution length and the frequency of ‘wait’ markers (indicating self-revision). This suggests that longer solutions often involve more self-correction attempts.
read the caption
Figure 3: (a): The relationship between model accuracy and the generation parameter Max Token Limitation. (b): The relationship between solution length and the average number of “wait” occur in a solution.

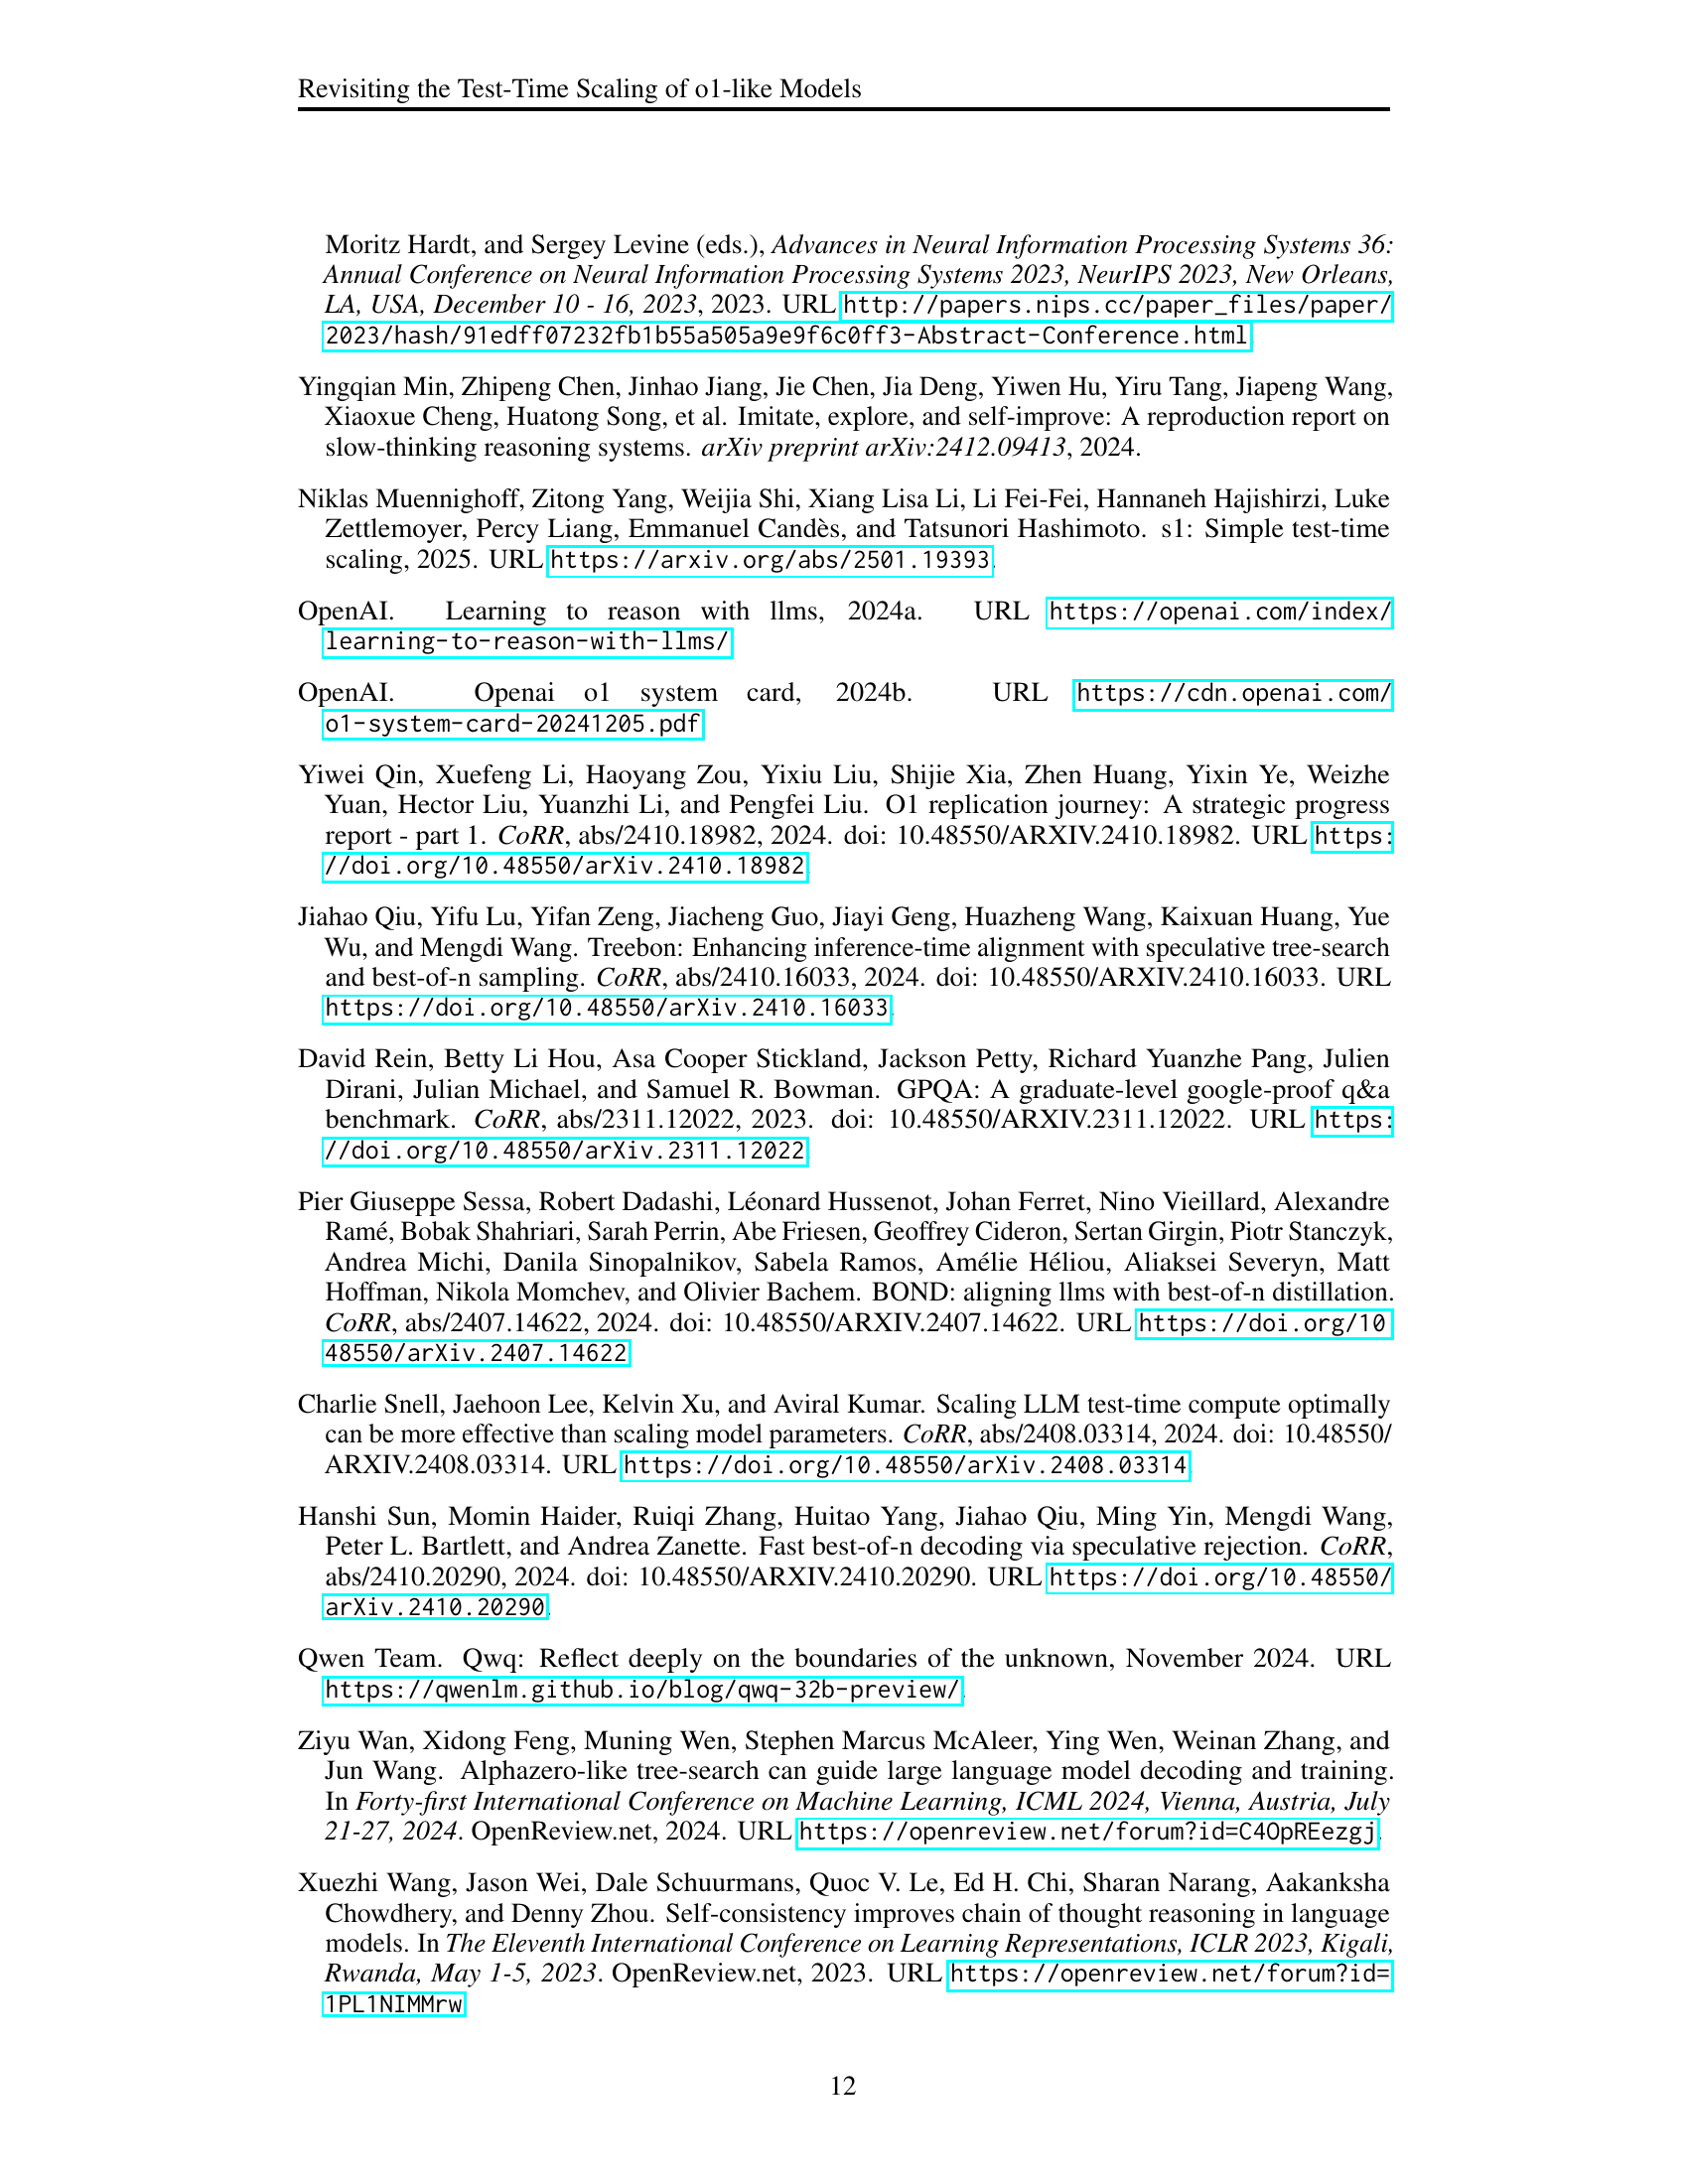
🔼 The figure shows the accuracy of three different models (R1-Distill-32b, R1-Distill-14b, and LIMO) during a sequential revision process. The x-axis represents the iteration number of the revision process, indicating how many times the model refined its answer. The y-axis displays the accuracy of the model’s response at each iteration. The plot illustrates how accuracy changes as the model iteratively revises its answer. This is related to the concept of ‘self-revision’ in large language models, where the model refines its initial response based on its own assessment.
read the caption
(a) Acc of R1-Distill-32b, 14b and LIMO

🔼 This figure (4b) presents the accuracy of the R1-Distill-1.5b and QwQ models during sequential revisions. It shows how the accuracy of these models changes as they undergo multiple self-revision iterations. The x-axis represents the number of revision iterations, and the y-axis represents the model’s accuracy. The plot allows for a comparison of the accuracy trends of these two models in response to iterative self-refinement, illustrating how their performance evolves with increasing numbers of revisions.
read the caption
(b) Acc of R1-Distill-1.5b, QwQ

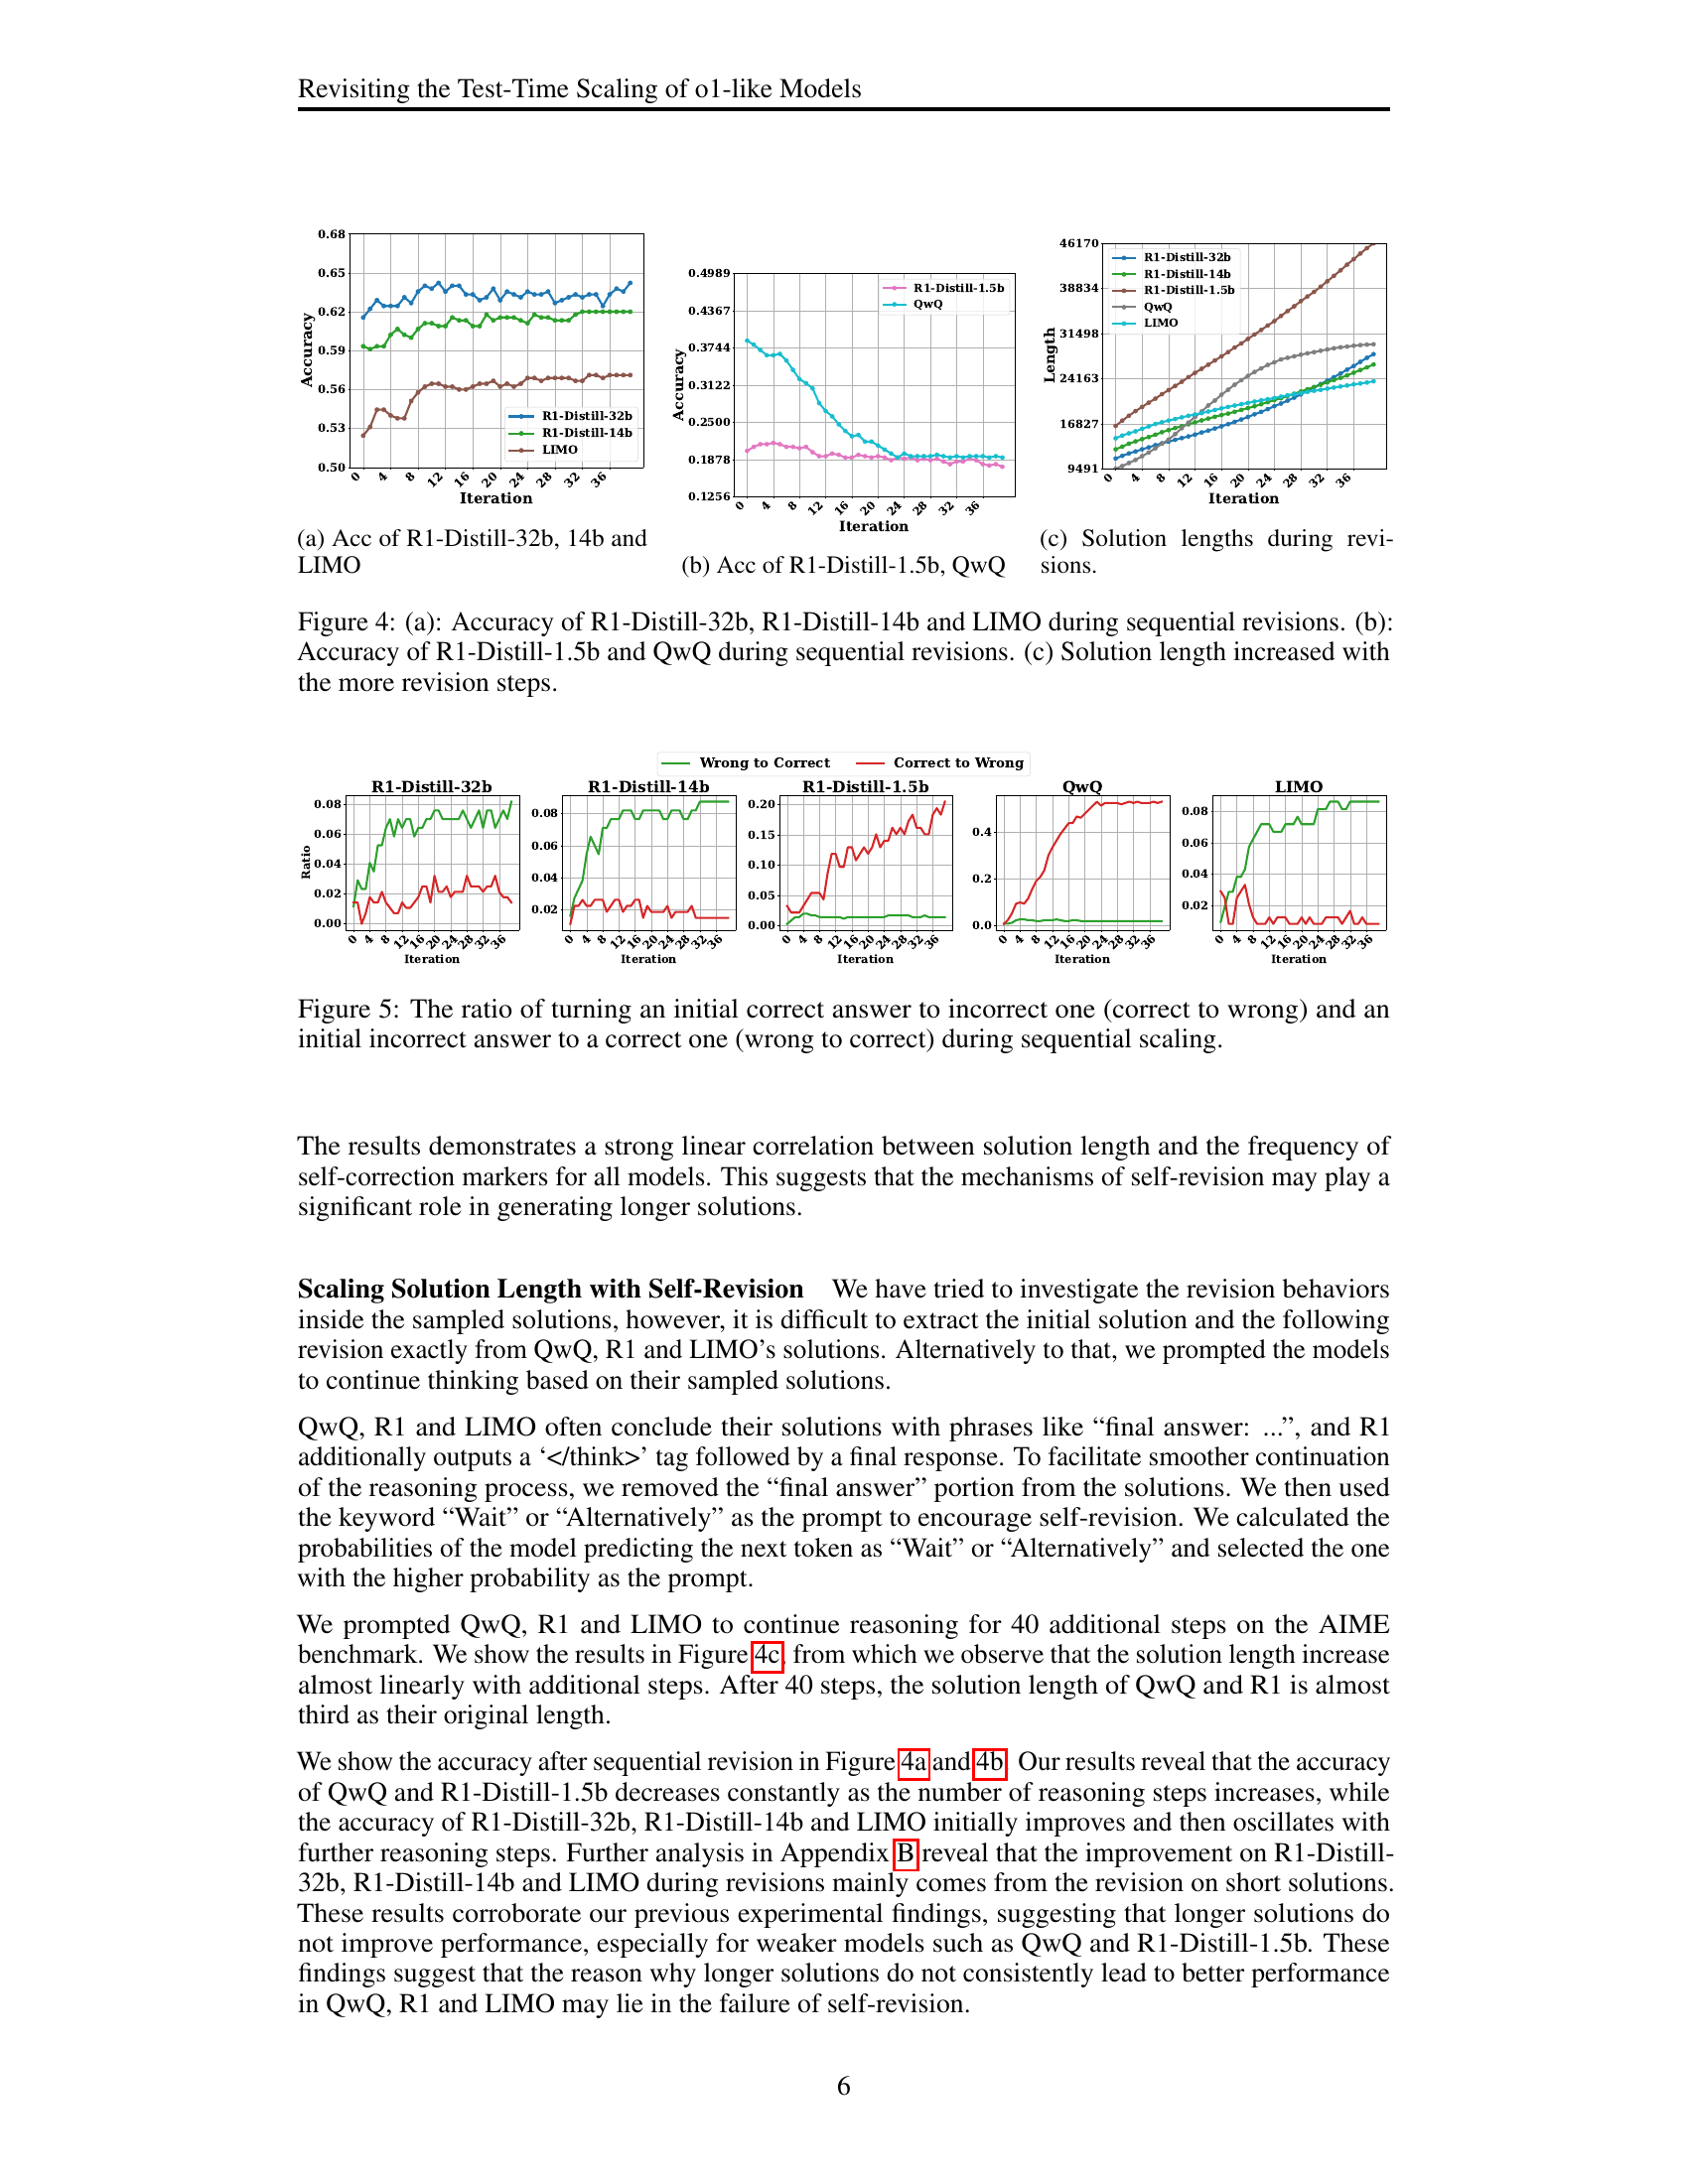
🔼 This figure shows how the length of solutions changes as the model undergoes iterative revisions during the sequential scaling process. Specifically, it visualizes the trend of solution length across multiple revision steps to illustrate whether the solution length consistently increases or shows other patterns.
read the caption
(c) Solution lengths during revisions.

🔼 This figure displays the impact of iterative refinement on model accuracy and solution length. Subfigure (a) and (b) show accuracy changes across multiple revision steps for several large language models (LLMs), highlighting variations in how effectively these models improve their answers through iterative self-correction. Subfigure (c) demonstrates a consistent increase in solution length as the number of revision steps increases, irrespective of accuracy improvements. This suggests that longer reasoning chains are not always correlated with accuracy gains in these models.
read the caption
Figure 4: (a): Accuracy of R1-Distill-32b, R1-Distill-14b and LIMO during sequential revisions. (b): Accuracy of R1-Distill-1.5b and QwQ during sequential revisions. (c) Solution length increased with the more revision steps.

🔼 This figure shows the results of an experiment investigating the effectiveness of self-revision during sequential scaling. It plots the ratio of times an initially correct answer was changed to an incorrect one (correct to wrong) against the ratio of initially incorrect answers that were changed to correct ones (wrong to correct). The x-axis represents the number of sequential revision steps, and the y-axis shows the ratio. The graph displays how the model’s self-correction ability changes as the process iterates. Different colored lines represent different language models (QwQ, R1-Distill-1.5b, R1-Distill-14b, R1-Distill-32b, and LIMO), allowing for a comparison of their performance.
read the caption
Figure 5: The ratio of turning an initial correct answer to incorrect one (correct to wrong) and an initial incorrect answer to a correct one (wrong to correct) during sequential scaling.

🔼 This figure shows the relationship between the number of tokens used and the coverage achieved by different test-time scaling strategies (sequential and parallel) on the AIME benchmark. The coverage is defined as the proportion of questions where at least one of the generated solutions is correct. This figure helps illustrate the effectiveness of parallel scaling, compared to sequential scaling, in improving the model’s ability to find correct answers.
read the caption
(a) Evaluation on Coverage.

🔼 This figure displays the accuracy of different groups of solutions categorized by their length for the QwQ and R1 models across four benchmarks (MATH, AIME, Omini-MATH, and GPQA). Each benchmark’s accuracy is shown in a separate subplot, with groups of solutions (1 to 5) arranged along the x-axis. Group 1 represents the shortest solutions, while Group 5 represents the longest solutions. The y-axis represents the accuracy of the solutions in each group. The figure illustrates whether longer solutions consistently lead to better accuracy.
read the caption
(b) Evaluation on Accuracy

🔼 Figure 6 presents a comparative analysis of sequential and parallel scaling methods on the AIME benchmark. Subfigure (a) shows the coverage (pass@k score), illustrating the proportion of times at least one of the multiple generated solutions contains the correct answer, as a function of the number of tokens used for both sequential scaling (iterative prompting for self-revision) and parallel scaling (sampling multiple solutions). Subfigure (b) displays the accuracy of these two methods under the same conditions, indicating the percentage of times the correct answer was selected.
read the caption
Figure 6: (a): the coverage of sequential scaling and parallel scaling on AIME. (b): the accuracy of squential revision and majority vote on AIME.

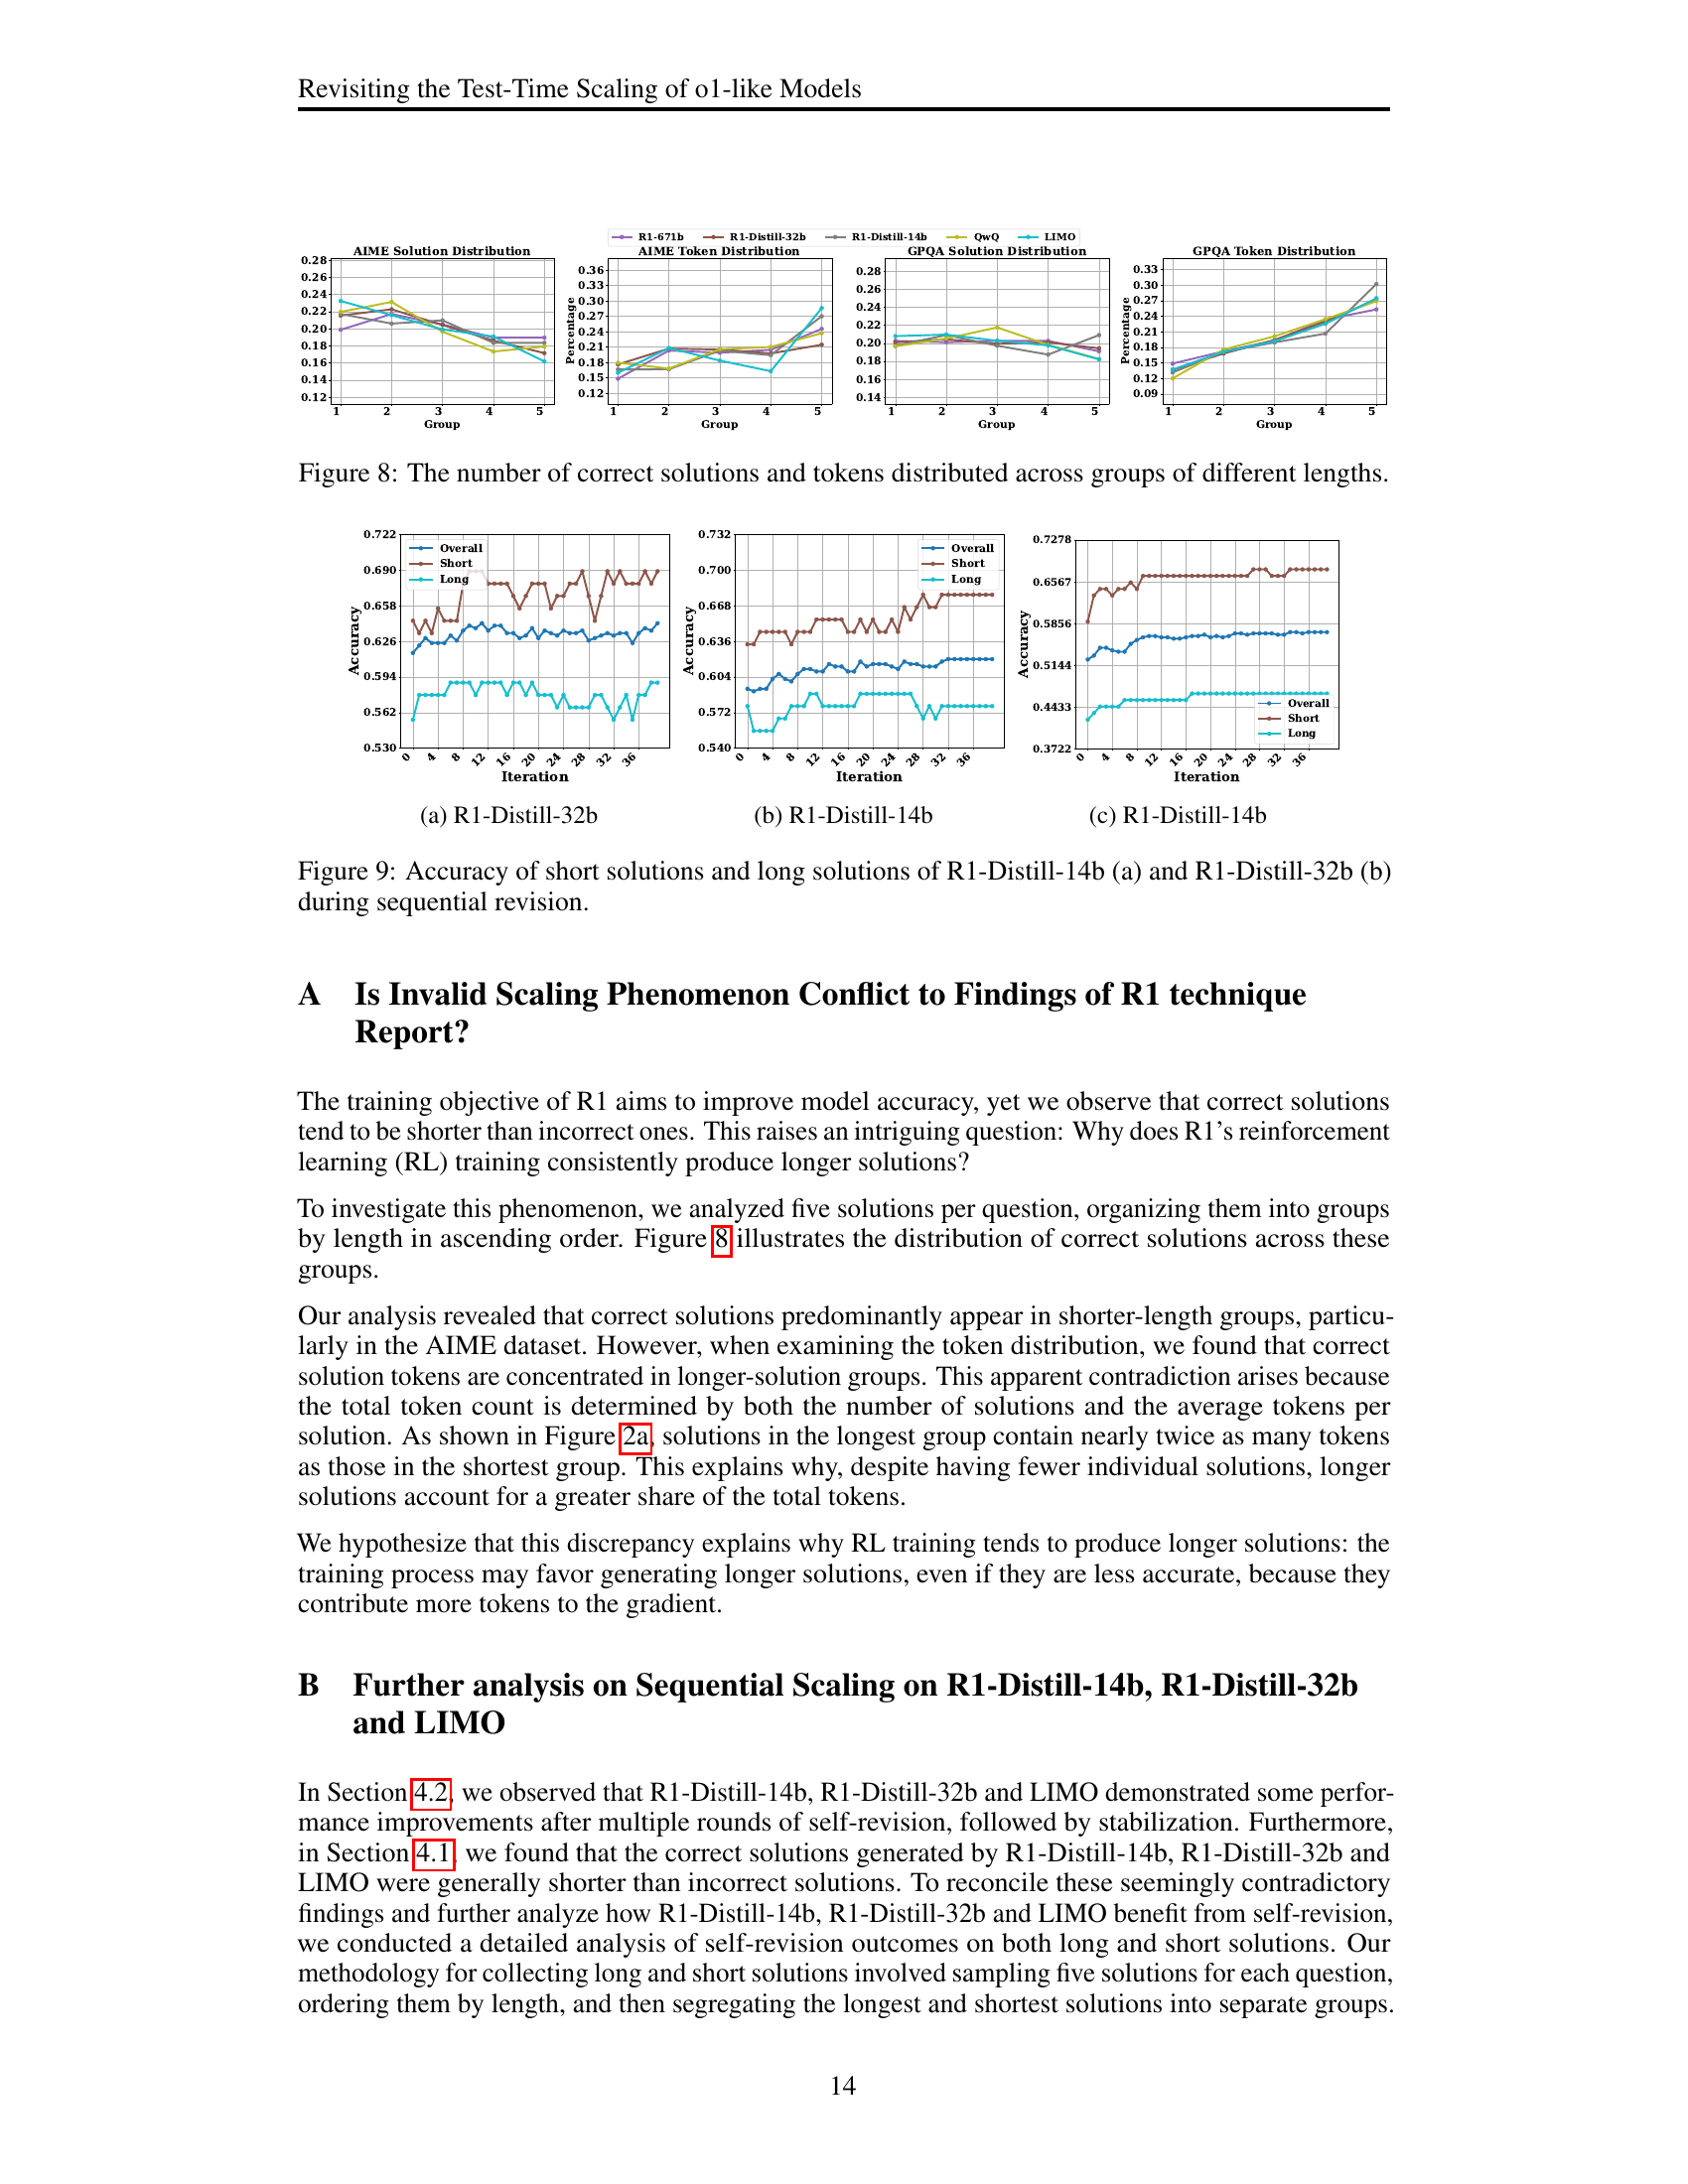
🔼 This figure (Figure 7) showcases the performance comparison of three parallel scaling methods: Majority Vote, Shortest, and Shortest Majority Vote, all evaluated on the AIME benchmark. The x-axis represents the number of tokens used during parallel solution generation, and the y-axis indicates the accuracy achieved by each method. The graph displays how the accuracy of each method changes with the increase of allocated tokens. This allows for a direct comparison of the effectiveness of these three approaches in enhancing the model’s reasoning capability through parallel scaling.
read the caption
Figure 7: Parallel-scaling performance of Majority Vote, Shortest and Shortest Majority Vote on AIME.

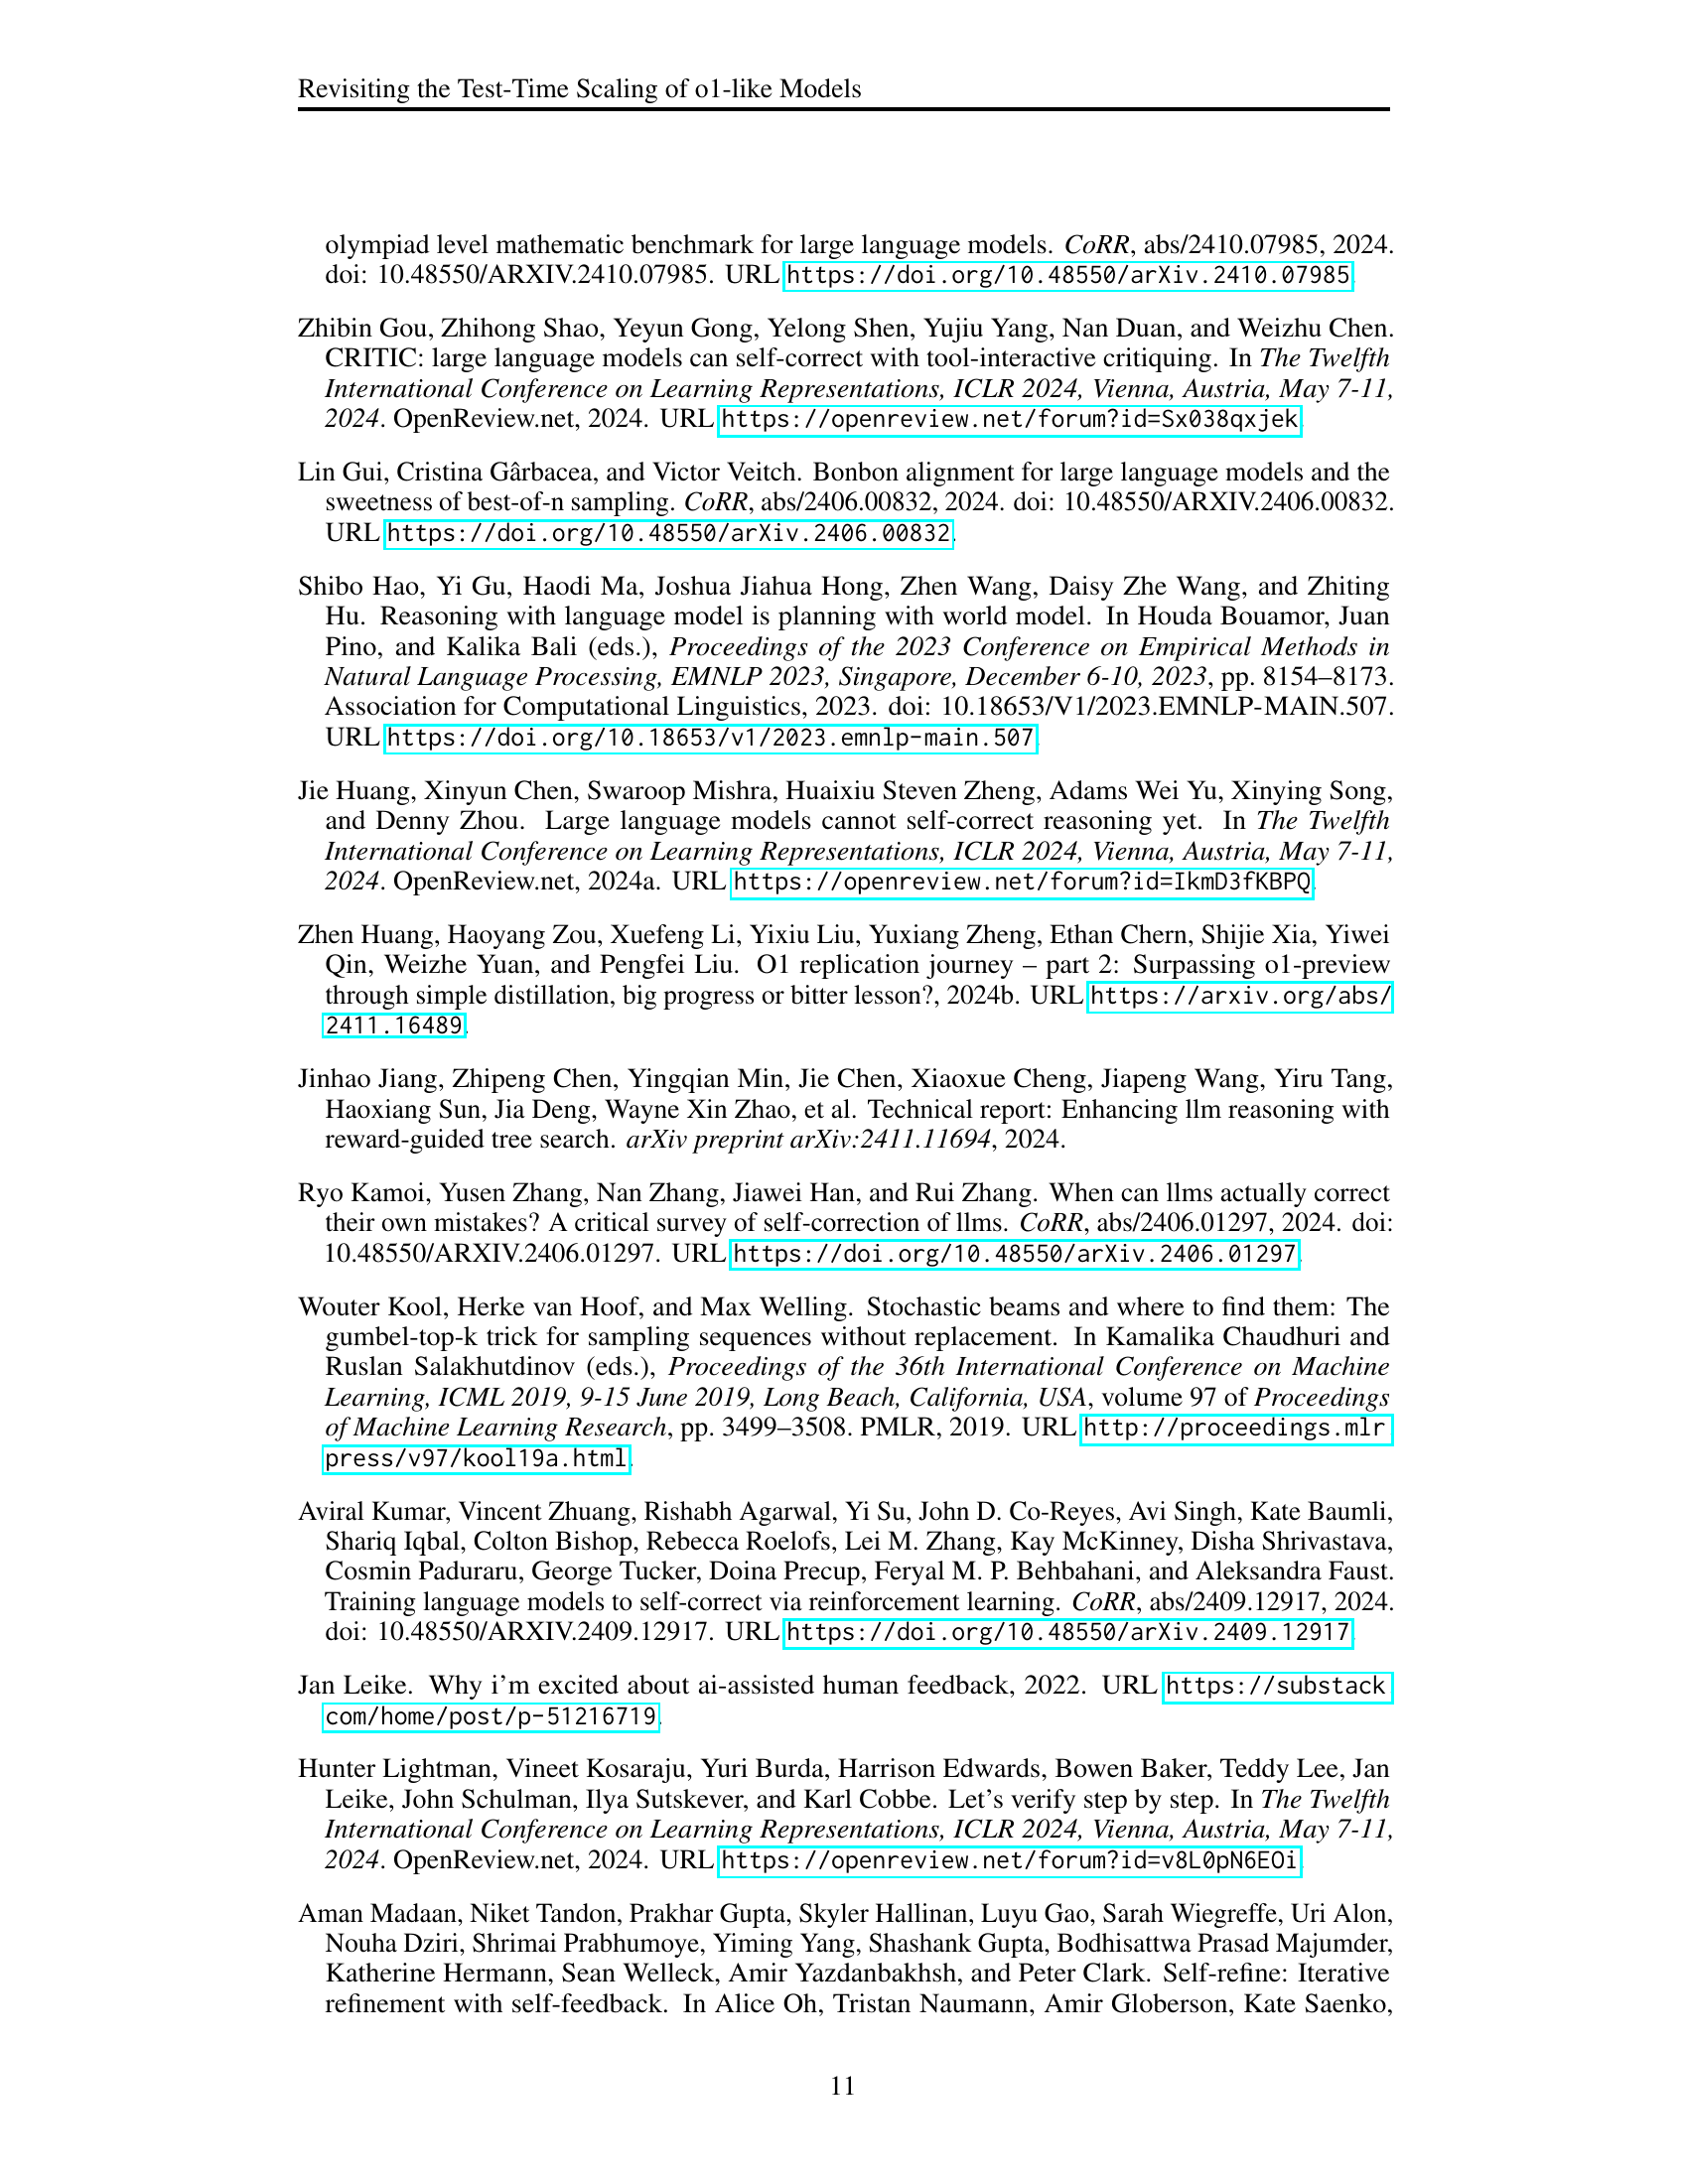
🔼 Figure 8 presents a detailed analysis of the distribution of correct solutions and their corresponding token counts across different solution length categories. The data is visualized to show how the number of correct solutions and total tokens varies as solution length increases. This helps in understanding the relationship between solution length and accuracy, revealing whether longer solutions consistently lead to more accurate answers or if there’s a different trend.
read the caption
Figure 8: The number of correct solutions and tokens distributed across groups of different lengths.
Full paper#