TL;DR#
Current LLM training methods often rely on a single, scalar reward model, which struggles to capture the full complexity and diversity of human preferences. This can lead to biased models that don’t meet the needs of all users. Collecting detailed preference data is also expensive and difficult to scale.
This paper introduces Decomposed Reward Models (DRMs) to address these issues. DRMs represent human preferences as vectors, and use Principal Component Analysis (PCA) to extract orthogonal basis vectors that capture distinct aspects of preference. These reward components can be flexibly combined to align with various user needs, offering a scalable and interpretable alternative to traditional methods. Experiments show that DRMs effectively extract meaningful preference dimensions and adapt to new users at test time without additional training.
Key Takeaways#
Why does it matter?#
This paper is important because it offers a novel and scalable solution for personalized LLM alignment by addressing the limitations of traditional reward models. Its interpretable approach using PCA to decompose human preferences opens new avenues for research in multi-objective optimization and personalized AI. The findings are highly relevant to current trends in LLM alignment and user personalization, with the potential to improve the effectiveness and fairness of future AI systems.
Visual Insights#
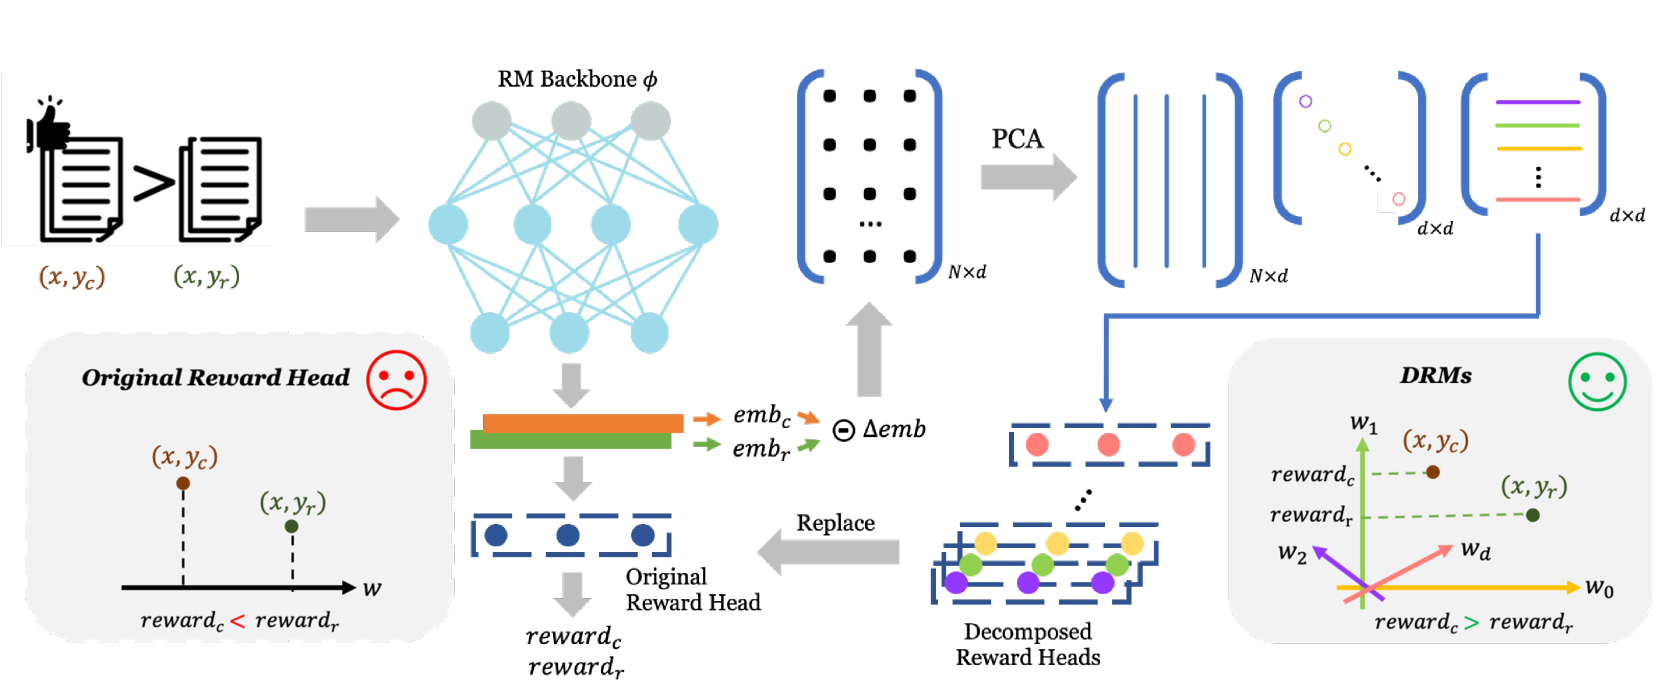
🔼 This figure illustrates how Decomposed Reward Models (DRMs) improve upon traditional reward models in capturing human preferences. The left side shows a standard single-dimensional reward model, where a single score is assigned to a prompt-response pair. This approach can lead to misclassifications because human preferences are multifaceted and complex. The right side depicts DRMs. DRMs use Principal Component Analysis (PCA) to decompose preferences into orthogonal dimensions. Each dimension represents a distinct aspect of human preference (e.g., helpfulness, safety, humor). This allows DRMs to capture the nuances of human judgment more effectively and provides an interpretable representation.
read the caption
Figure 1: Illustration of the decomposition pipeline in DRMs. In the original single-dimensional head, a prompt–response pair can be predicted incorrectly. In contrast, DRMs capture preferences along multiple dimensions, aligning more effectively with the complex and multifaceted nature of human preferences.
| Benchmark | Attribute | Gemma-2B-RM | Llama3-8B-RM | ||||
|---|---|---|---|---|---|---|---|
| Single Head | Max Value | Max Head | Single Head | Max Value | Max Head | ||
| RewardBench | Overall | 0.733 | 0.735 | head_0 | 0.862 | 0.869 | head_0 |
| Chat | 0.944 | 0.950 | head_0 | 0.983 | 0.986 | head_0 | |
| Chat Hard | 0.467 | 0.660 | head_3 | 0.684 | 0.695 | head_3 | |
| Safety | 0.759 | 0.745 | head_0, head_8 | 0.868 | 0.886 | head_0 | |
| Reasoning | 0.759 | 0.821 | head_32 | 0.912 | 0.923 | head_0 | |
| RPR | Overall | 0.714 | 0.735 | head_0 | 0.853 | 0.839 | head_0 |
| User-Friendliness | 0.506 | 0.798 | head_9, head_26 | 0.719 | 0.899 | head_10 | |
| Narrative & Storytelling | 0.662 | 0.825 | head_12 | 0.838 | 0.912 | head_5 | |
| Linguistic Creativity | 0.817 | 0.885 | head_12 | 0.875 | 0.981 | head_37 | |
| Scientific Rigor | 0.881 | 0.881 | head_34 | 0.940 | 0.964 | head_0 | |
| Humor & Entertainment | 0.690 | 0.964 | head_9 | 0.893 | 0.952 | head_37, head_74 | |
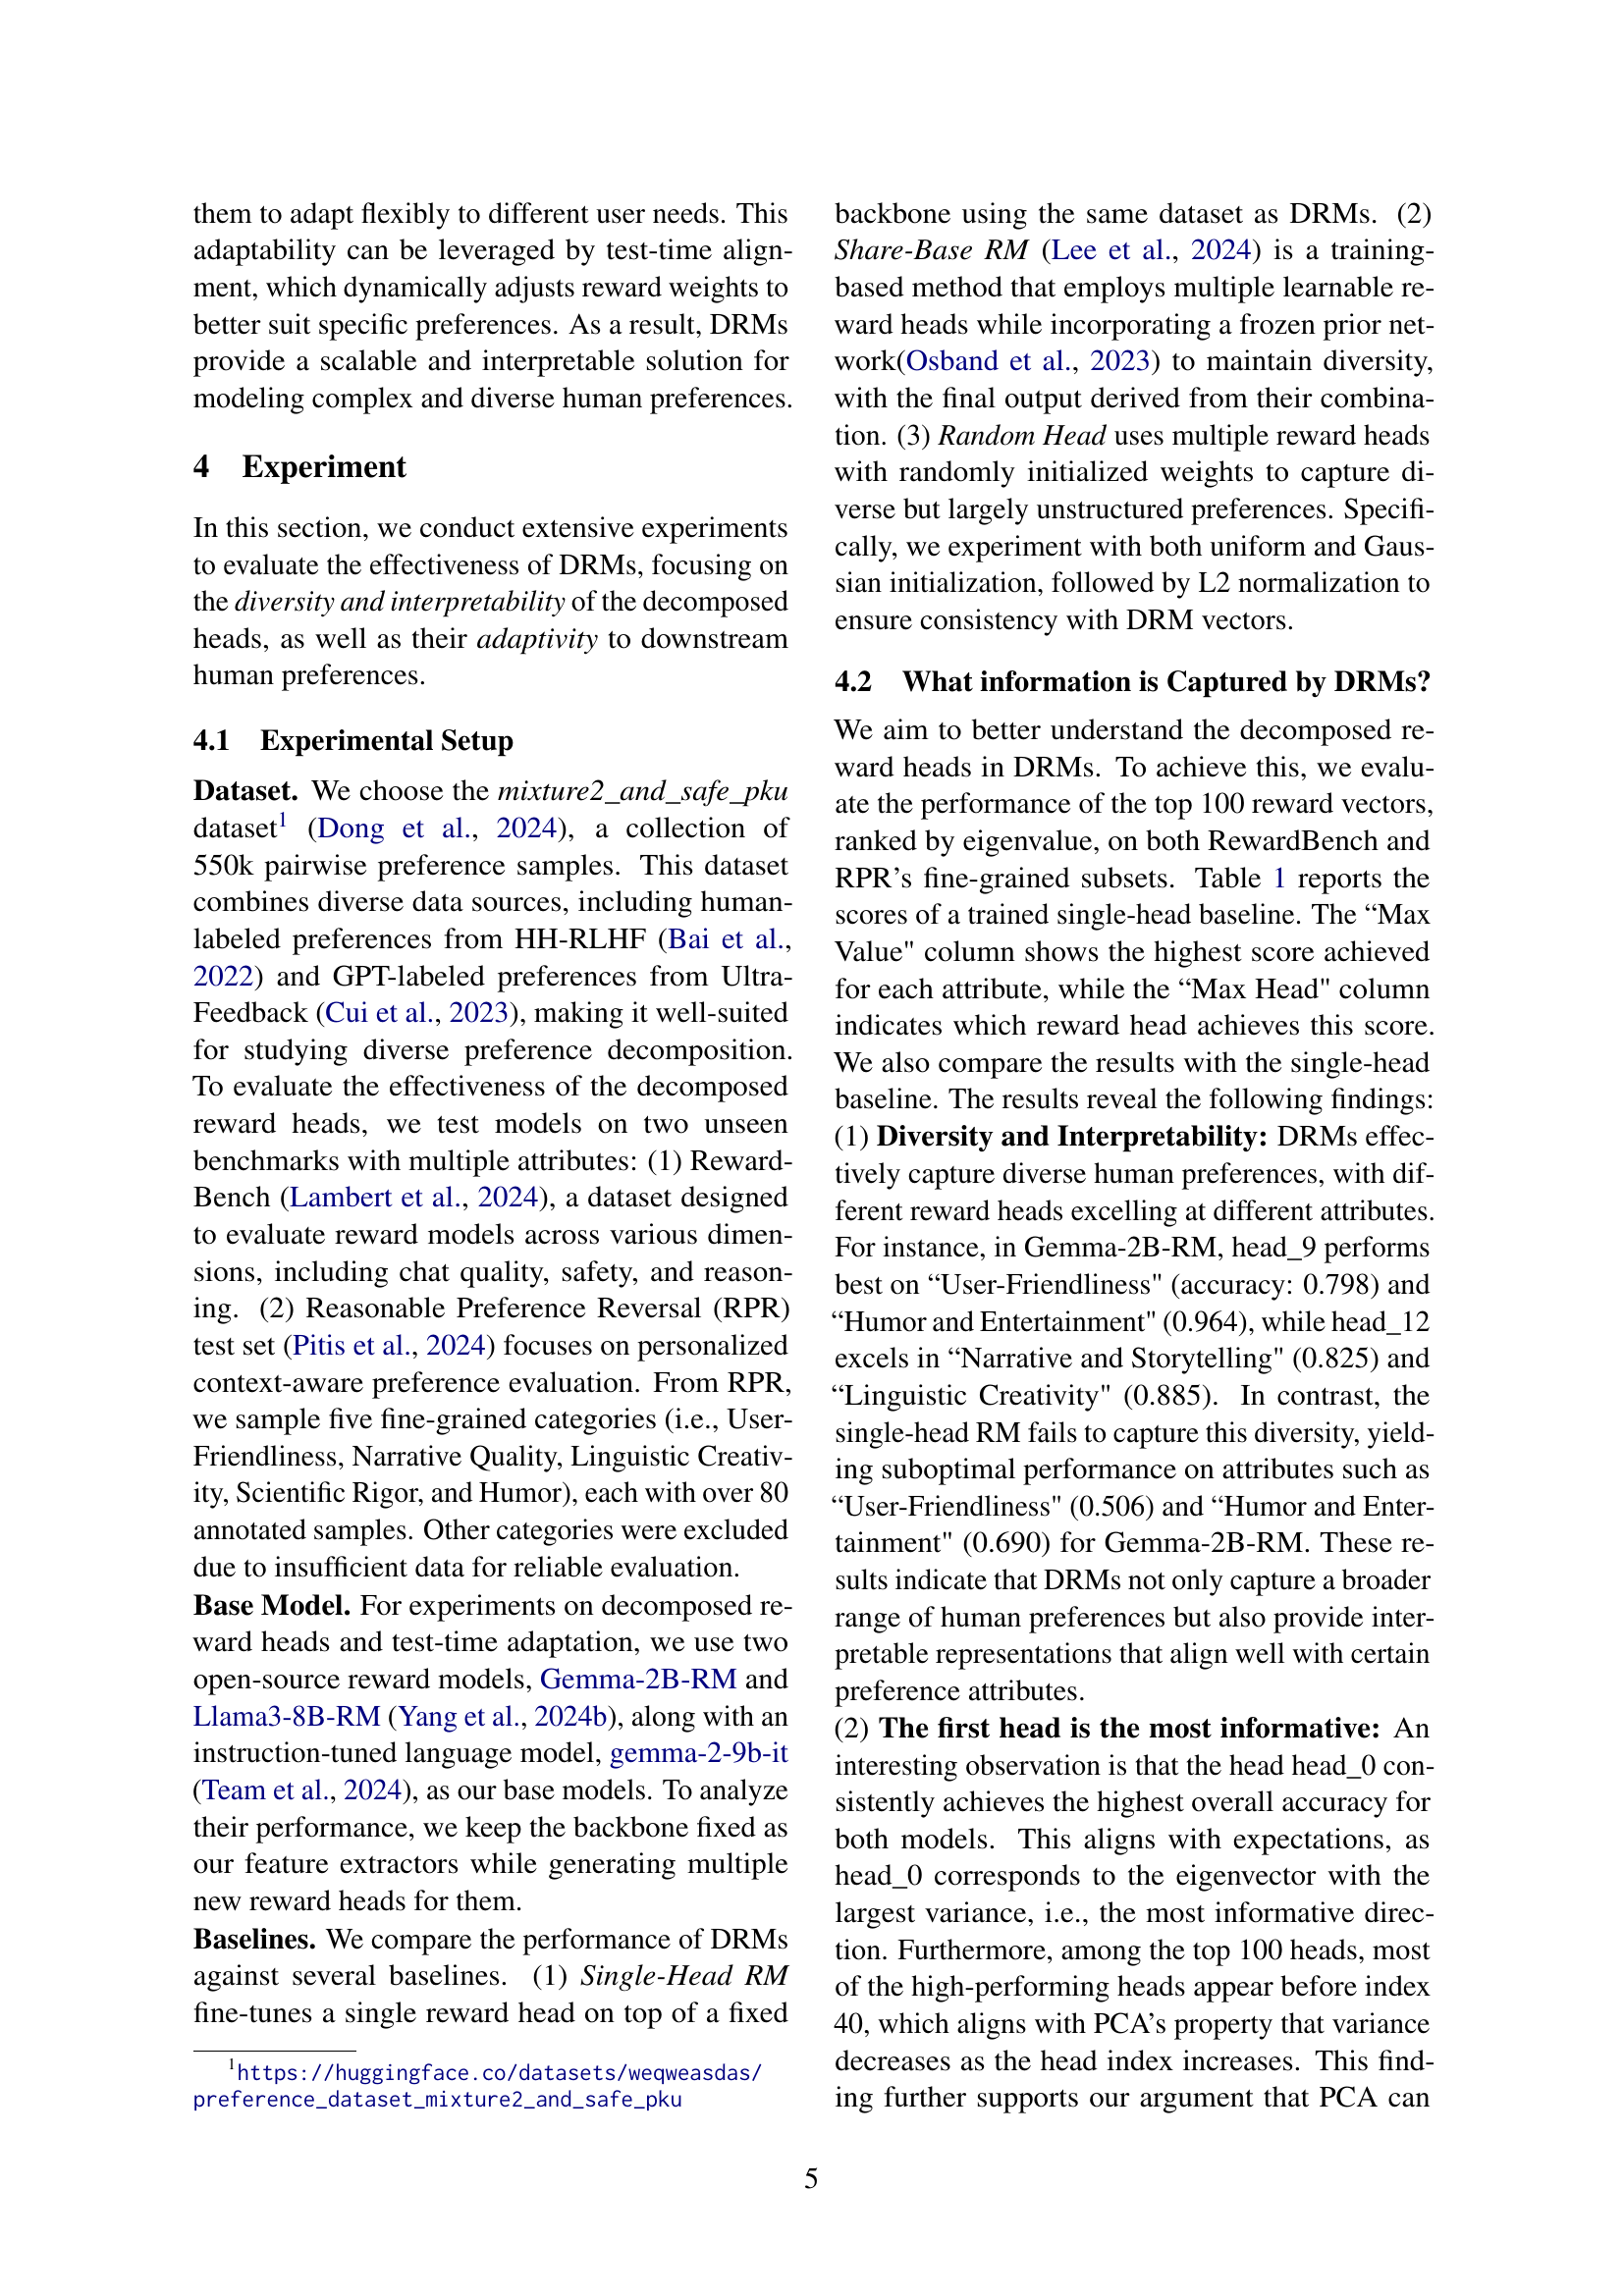
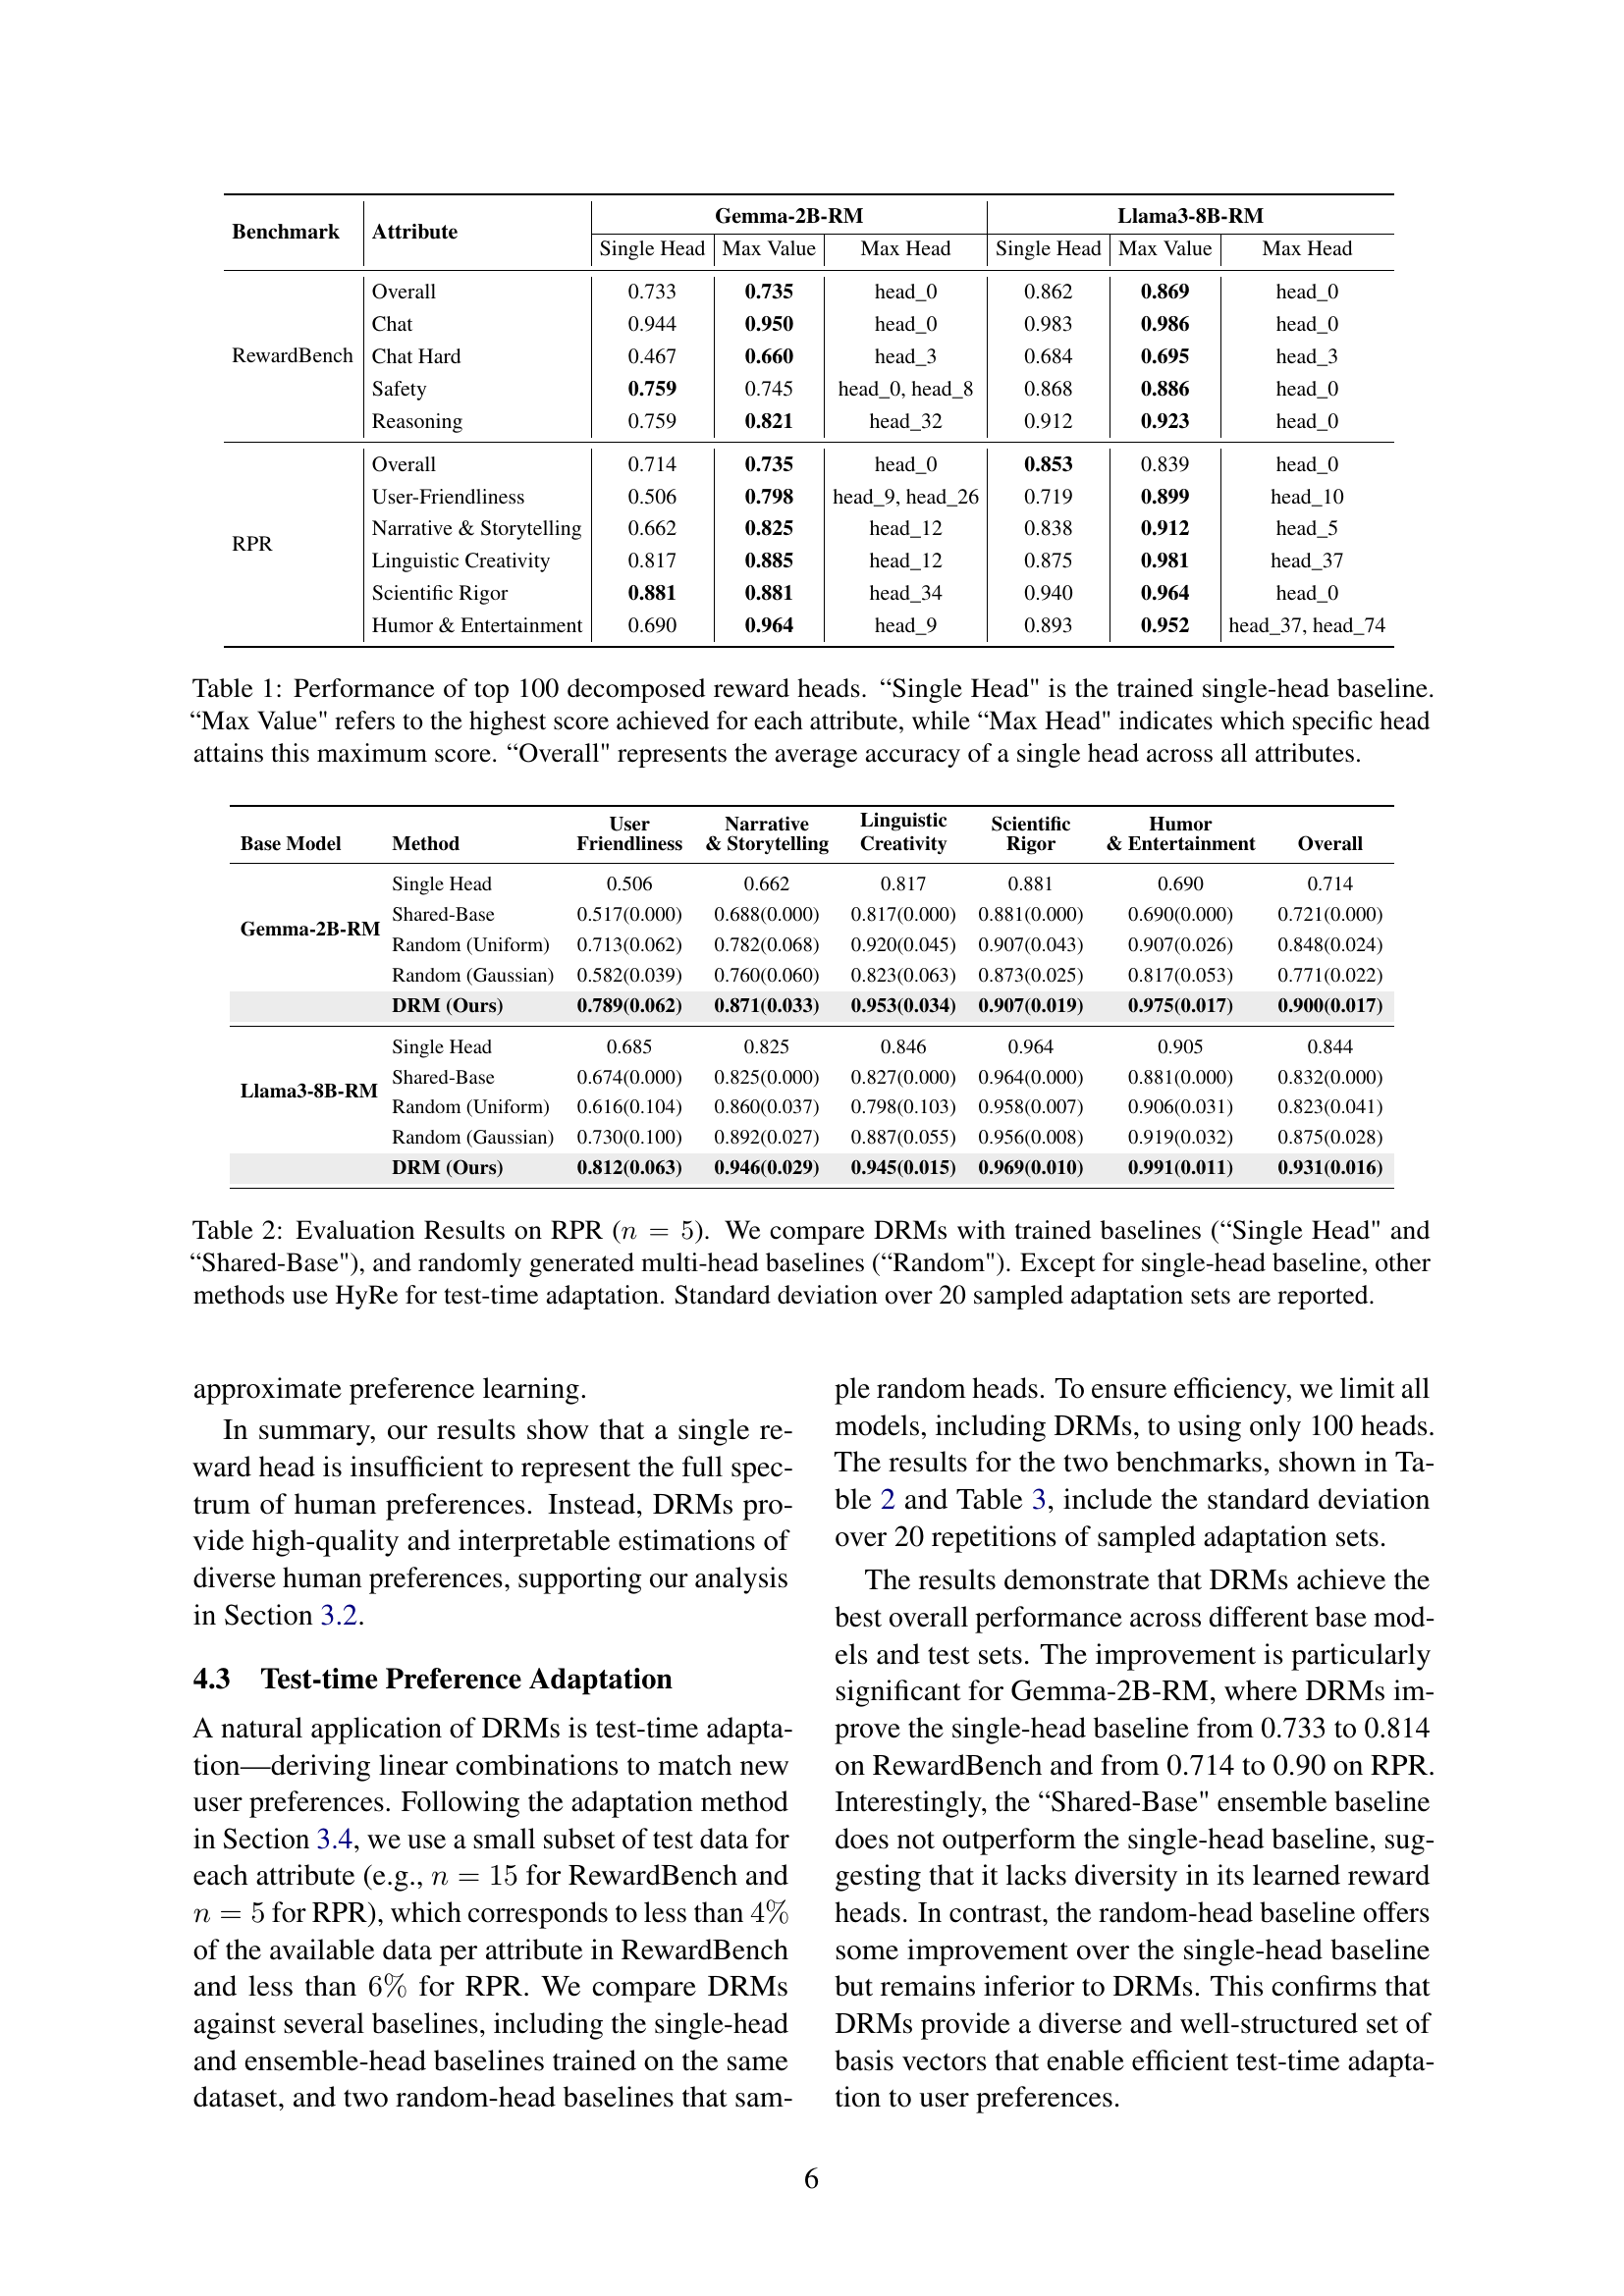
🔼 This table presents the performance of the top 100 decomposed reward heads derived from the Decomposed Reward Models (DRMs) method. It compares their performance against a single-head baseline model across multiple attributes from two benchmark datasets (RewardBench and RPR). For each attribute, the table indicates the maximum score achieved by any of the top 100 DRMs heads (‘Max Value’) and the index of the head that achieved this maximum score (‘Max Head’). The ‘Overall’ column represents the average performance across all attributes for each model (single-head baseline and the top performing DRM heads). The table helps to demonstrate the diversity and effectiveness of DRMs in capturing different facets of human preferences.
read the caption
Table 1: Performance of top 100 decomposed reward heads. “Single Head' is the trained single-head baseline. “Max Value' refers to the highest score achieved for each attribute, while “Max Head' indicates which specific head attains this maximum score. “Overall' represents the average accuracy of a single head across all attributes.
In-depth insights#
Diverse Preference#
The concept of “Diverse Preference” in the context of AI model training highlights the complexity and heterogeneity of human preferences. Simple scalar reward models often fail to capture this nuance, leading to AI systems that cater to the majority while potentially marginalizing underrepresented groups or specific needs. A key challenge lies in effectively gathering and representing this diversity, as traditional fine-grained annotation methods are expensive and difficult to scale. Novel approaches, such as the Decomposed Reward Models (DRMs) presented in the research paper, seek to overcome these limitations by extracting multiple dimensions of preference from readily available binary comparison data. These decomposed reward models allow for the creation of more nuanced and interpretable AI systems, capable of adapting to individual preferences without needing extensive retraining. Further research is crucial to better understand the underlying structure of human preferences, enabling the development of AI systems that are truly fair, inclusive, and customizable to diverse user needs.
PCA in Reward#
The application of Principal Component Analysis (PCA) to reward modeling in reinforcement learning (RL) offers a compelling approach to address the inherent complexity and diversity of human preferences. By representing preferences as vectors, PCA allows for the extraction of orthogonal basis vectors, each capturing a distinct aspect of human preference. This decomposition is crucial as traditional scalar reward models often fail to capture the full spectrum of human preferences, potentially marginalizing underrepresented groups. The resulting decomposed reward models (DRMs) enable flexible combination of these basis vectors to adapt to individual user preferences, offering an interpretable and scalable alternative. PCA’s ability to identify principal components offers significant advantages in terms of interpretability and efficiency. Instead of learning numerous individual reward parameters, DRMs leverage PCA to achieve a more compact and efficient representation of human preferences. Furthermore, the orthogonal nature of the extracted components allows for easier analysis and interpretation of the various dimensions of human evaluation. This is a key step towards building more personalized and transparent AI systems.
DRM Framework#
The Decomposed Reward Model (DRM) framework offers a novel approach to learning diverse human preferences for Large Language Model (LLM) alignment. Instead of relying on a single scalar reward, DRMs leverage Principal Component Analysis (PCA) to decompose human preferences into orthogonal basis vectors. Each vector captures a distinct aspect of preference, allowing for a more nuanced and interpretable representation. This multi-dimensional approach addresses limitations of traditional methods that struggle with the complexity and diversity of human preferences, often prioritizing majority viewpoints. The framework’s strength lies in its ability to extract diverse preference dimensions from readily available binary comparison data, avoiding the cost and scalability issues associated with collecting fine-grained preference annotations. Furthermore, DRMs enable flexible adaptation to individual users at test time by linearly combining the basis vectors with weights optimized for specific user preferences. This adaptability eliminates the need for retraining with new user data. In essence, DRMs provide a powerful, interpretable, and scalable method for personalized LLM alignment, opening avenues for improving both performance and user satisfaction.
Test-Time Adaption#
The concept of ‘Test-Time Adaptation’ in the context of personalized large language model (LLM) alignment is crucial. It addresses the challenge of adapting a pre-trained model to individual user preferences without requiring additional training. This is a significant advantage, as collecting and annotating large amounts of personalized data for training is expensive and time-consuming. The approach described leverages a decomposed reward model, extracting diverse aspects of preference via Principal Component Analysis (PCA). At test time, a small amount of user data is used to find the optimal weighting of these pre-learned preference components. This linear combination efficiently tailors the model’s behavior to the new user, making the system more personalized and adaptable. The effectiveness hinges on the quality and diversity of the initial decomposed reward vectors, allowing flexible adaptation to novel user preferences with minimal overhead. This method also increases interpretability, as the weighting of individual preference aspects can be analyzed to provide insights into the user’s values.
Interpretability#
The concept of interpretability in the context of AI models, especially large language models (LLMs), is crucial for building trust and ensuring responsible use. The paper focuses on enhancing interpretability by decomposing complex human preferences into multiple orthogonal basis vectors using Principal Component Analysis (PCA). This approach allows for a more nuanced understanding of preferences, moving beyond a single scalar reward to capture multiple facets (e.g., helpfulness, safety, humor). Each vector represents a distinct aspect of preference, making the model’s decision-making process more transparent. The linear combination of these vectors allows flexibility in adapting to different user needs without retraining, further enhancing interpretability. While the method itself uses PCA, a well-understood technique, its application to reward modeling offers novel insight into the structure of human preferences and creates a more interpretable model. However, the sheer number of resulting vectors might present a challenge, suggesting future work could focus on automated interpretation of these components and identifying which ones are most meaningful. The emphasis on explainability complements the pursuit of personalization, highlighting the potential for more tailored and trustworthy AI systems.
More visual insights#
More on figures

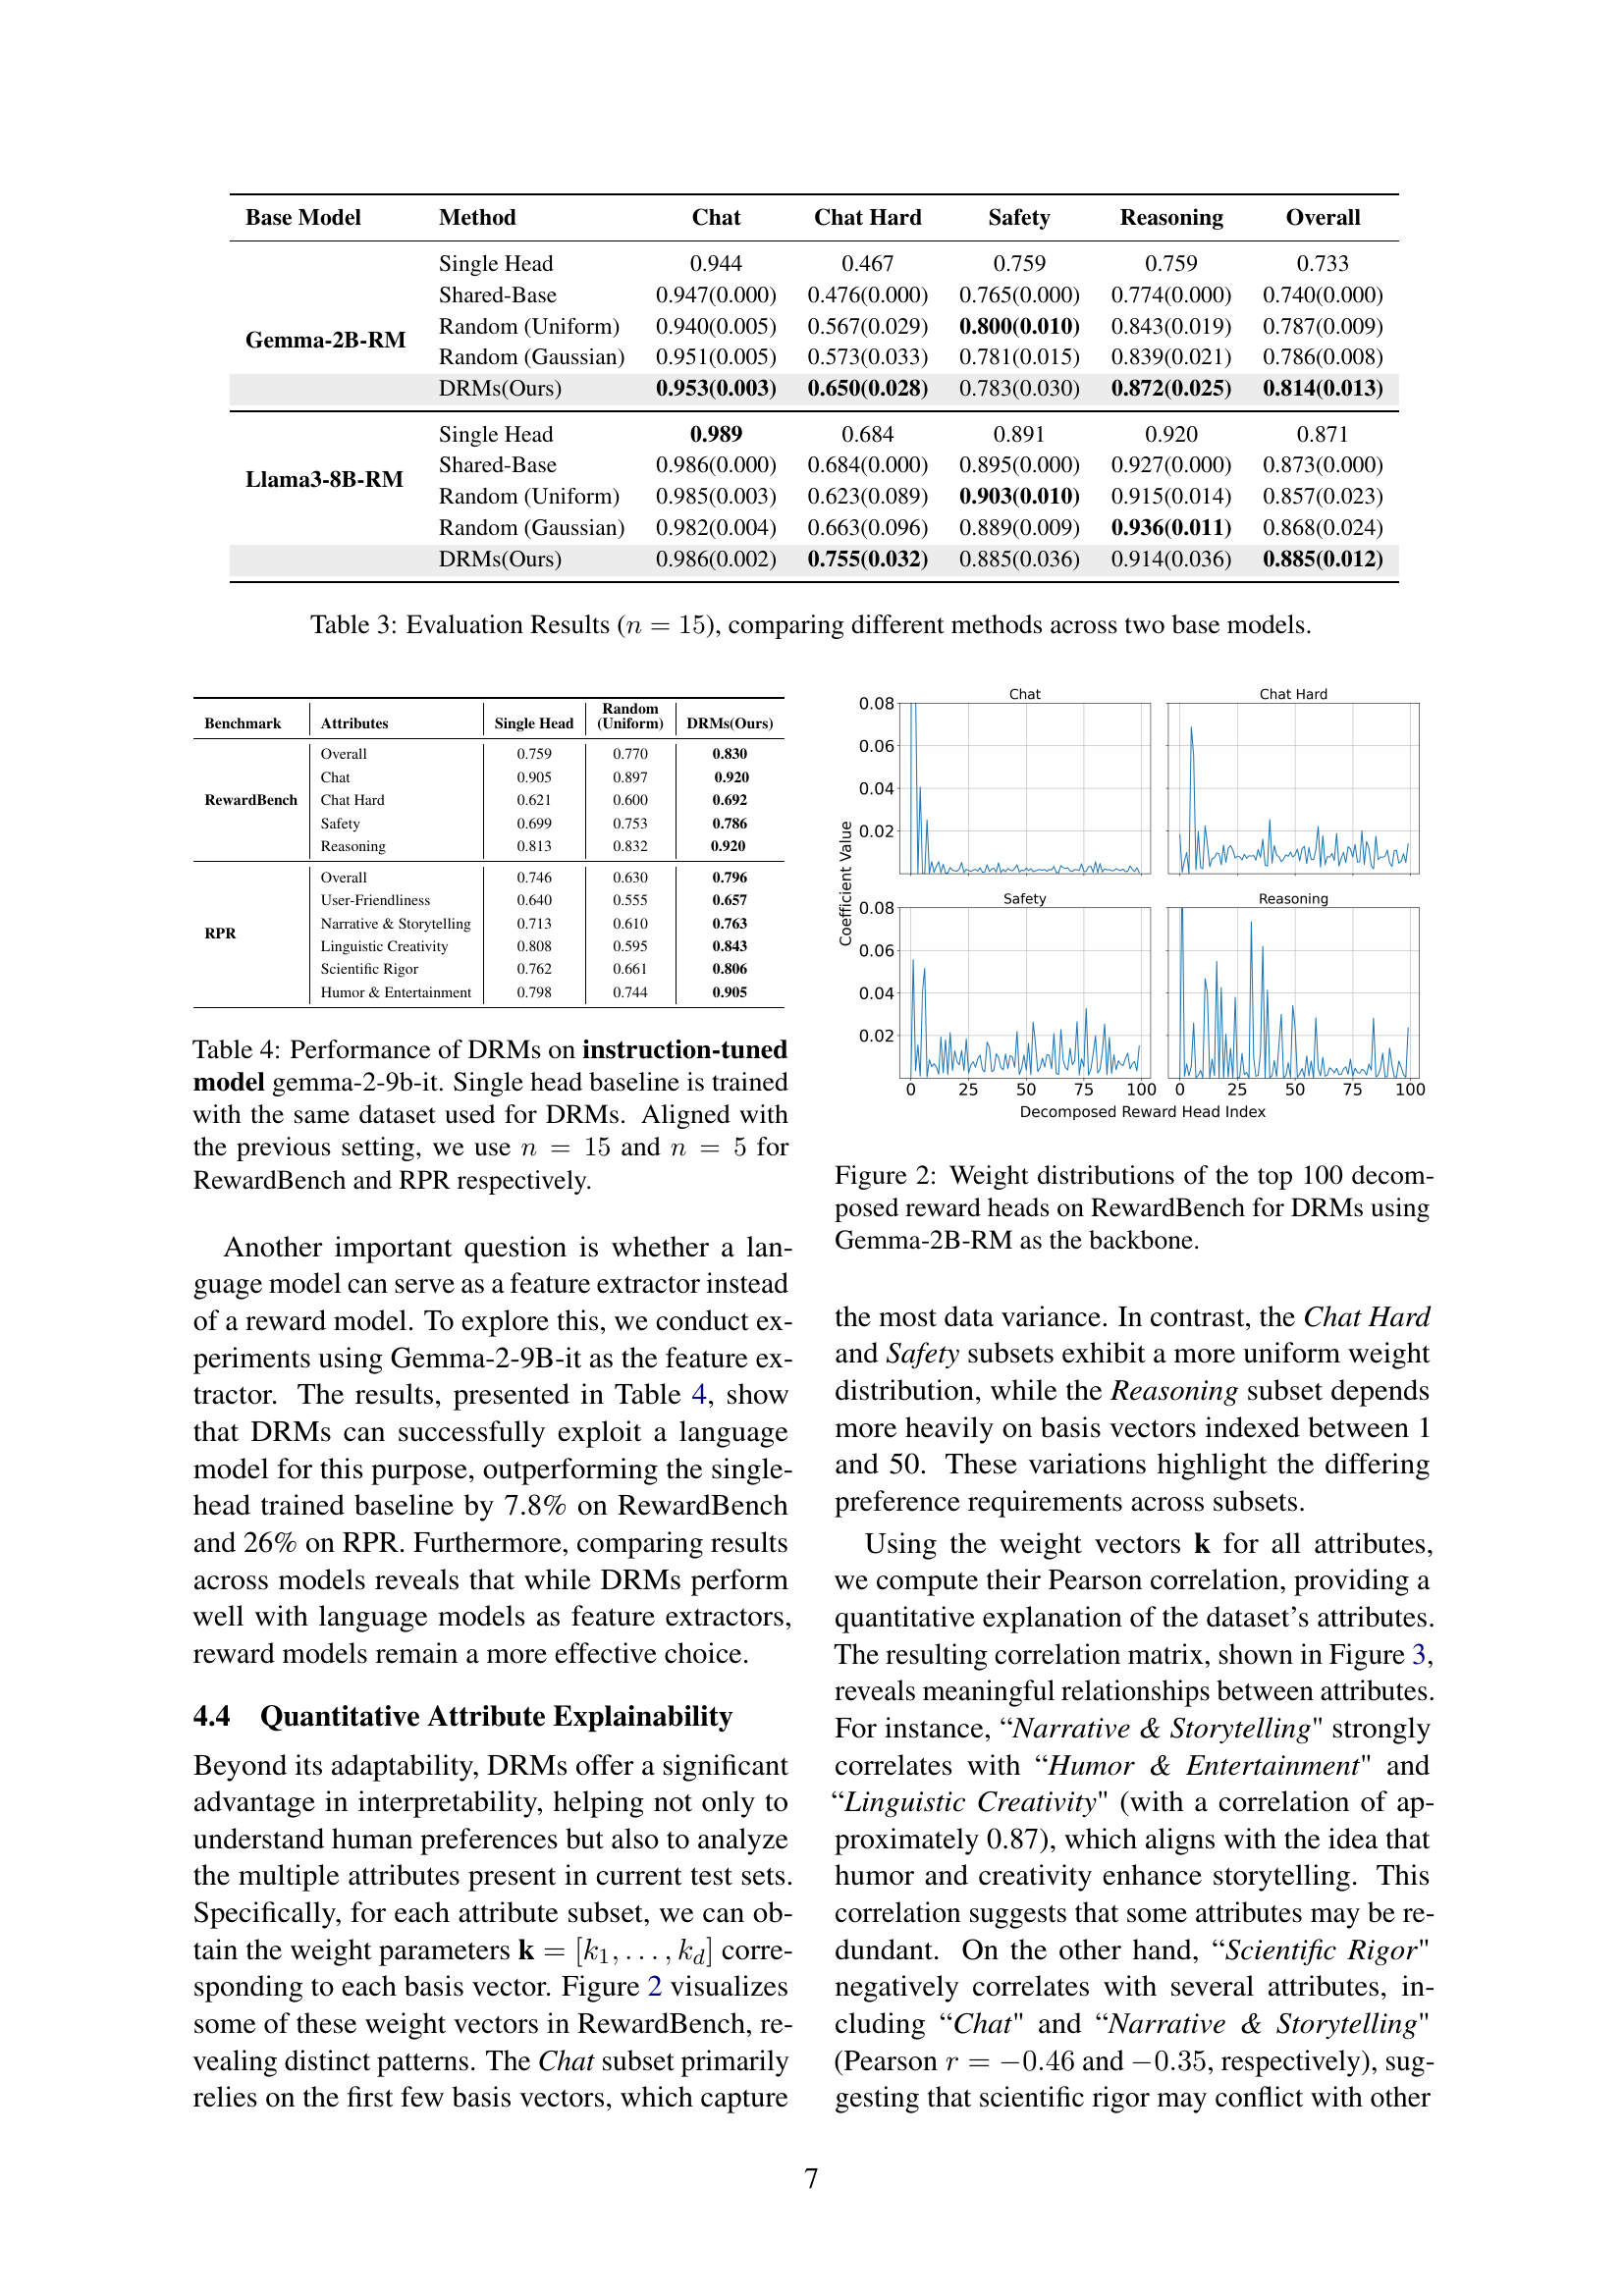
🔼 This figure visualizes the weight distributions of the top 100 most significant decomposed reward heads obtained from the Decomposed Reward Model (DRM) framework. The analysis focuses on the RewardBench dataset and utilizes Gemma-2B-RM as the underlying reward model backbone. Each decomposed head represents a distinct aspect of human preferences, and the weights indicate the relative importance of each head in determining overall reward. The graph provides insights into how these different preference aspects are weighted for various task categories within RewardBench.
read the caption
Figure 2: Weight distributions of the top 100 decomposed reward heads on RewardBench for DRMs using Gemma-2B-RM as the backbone.

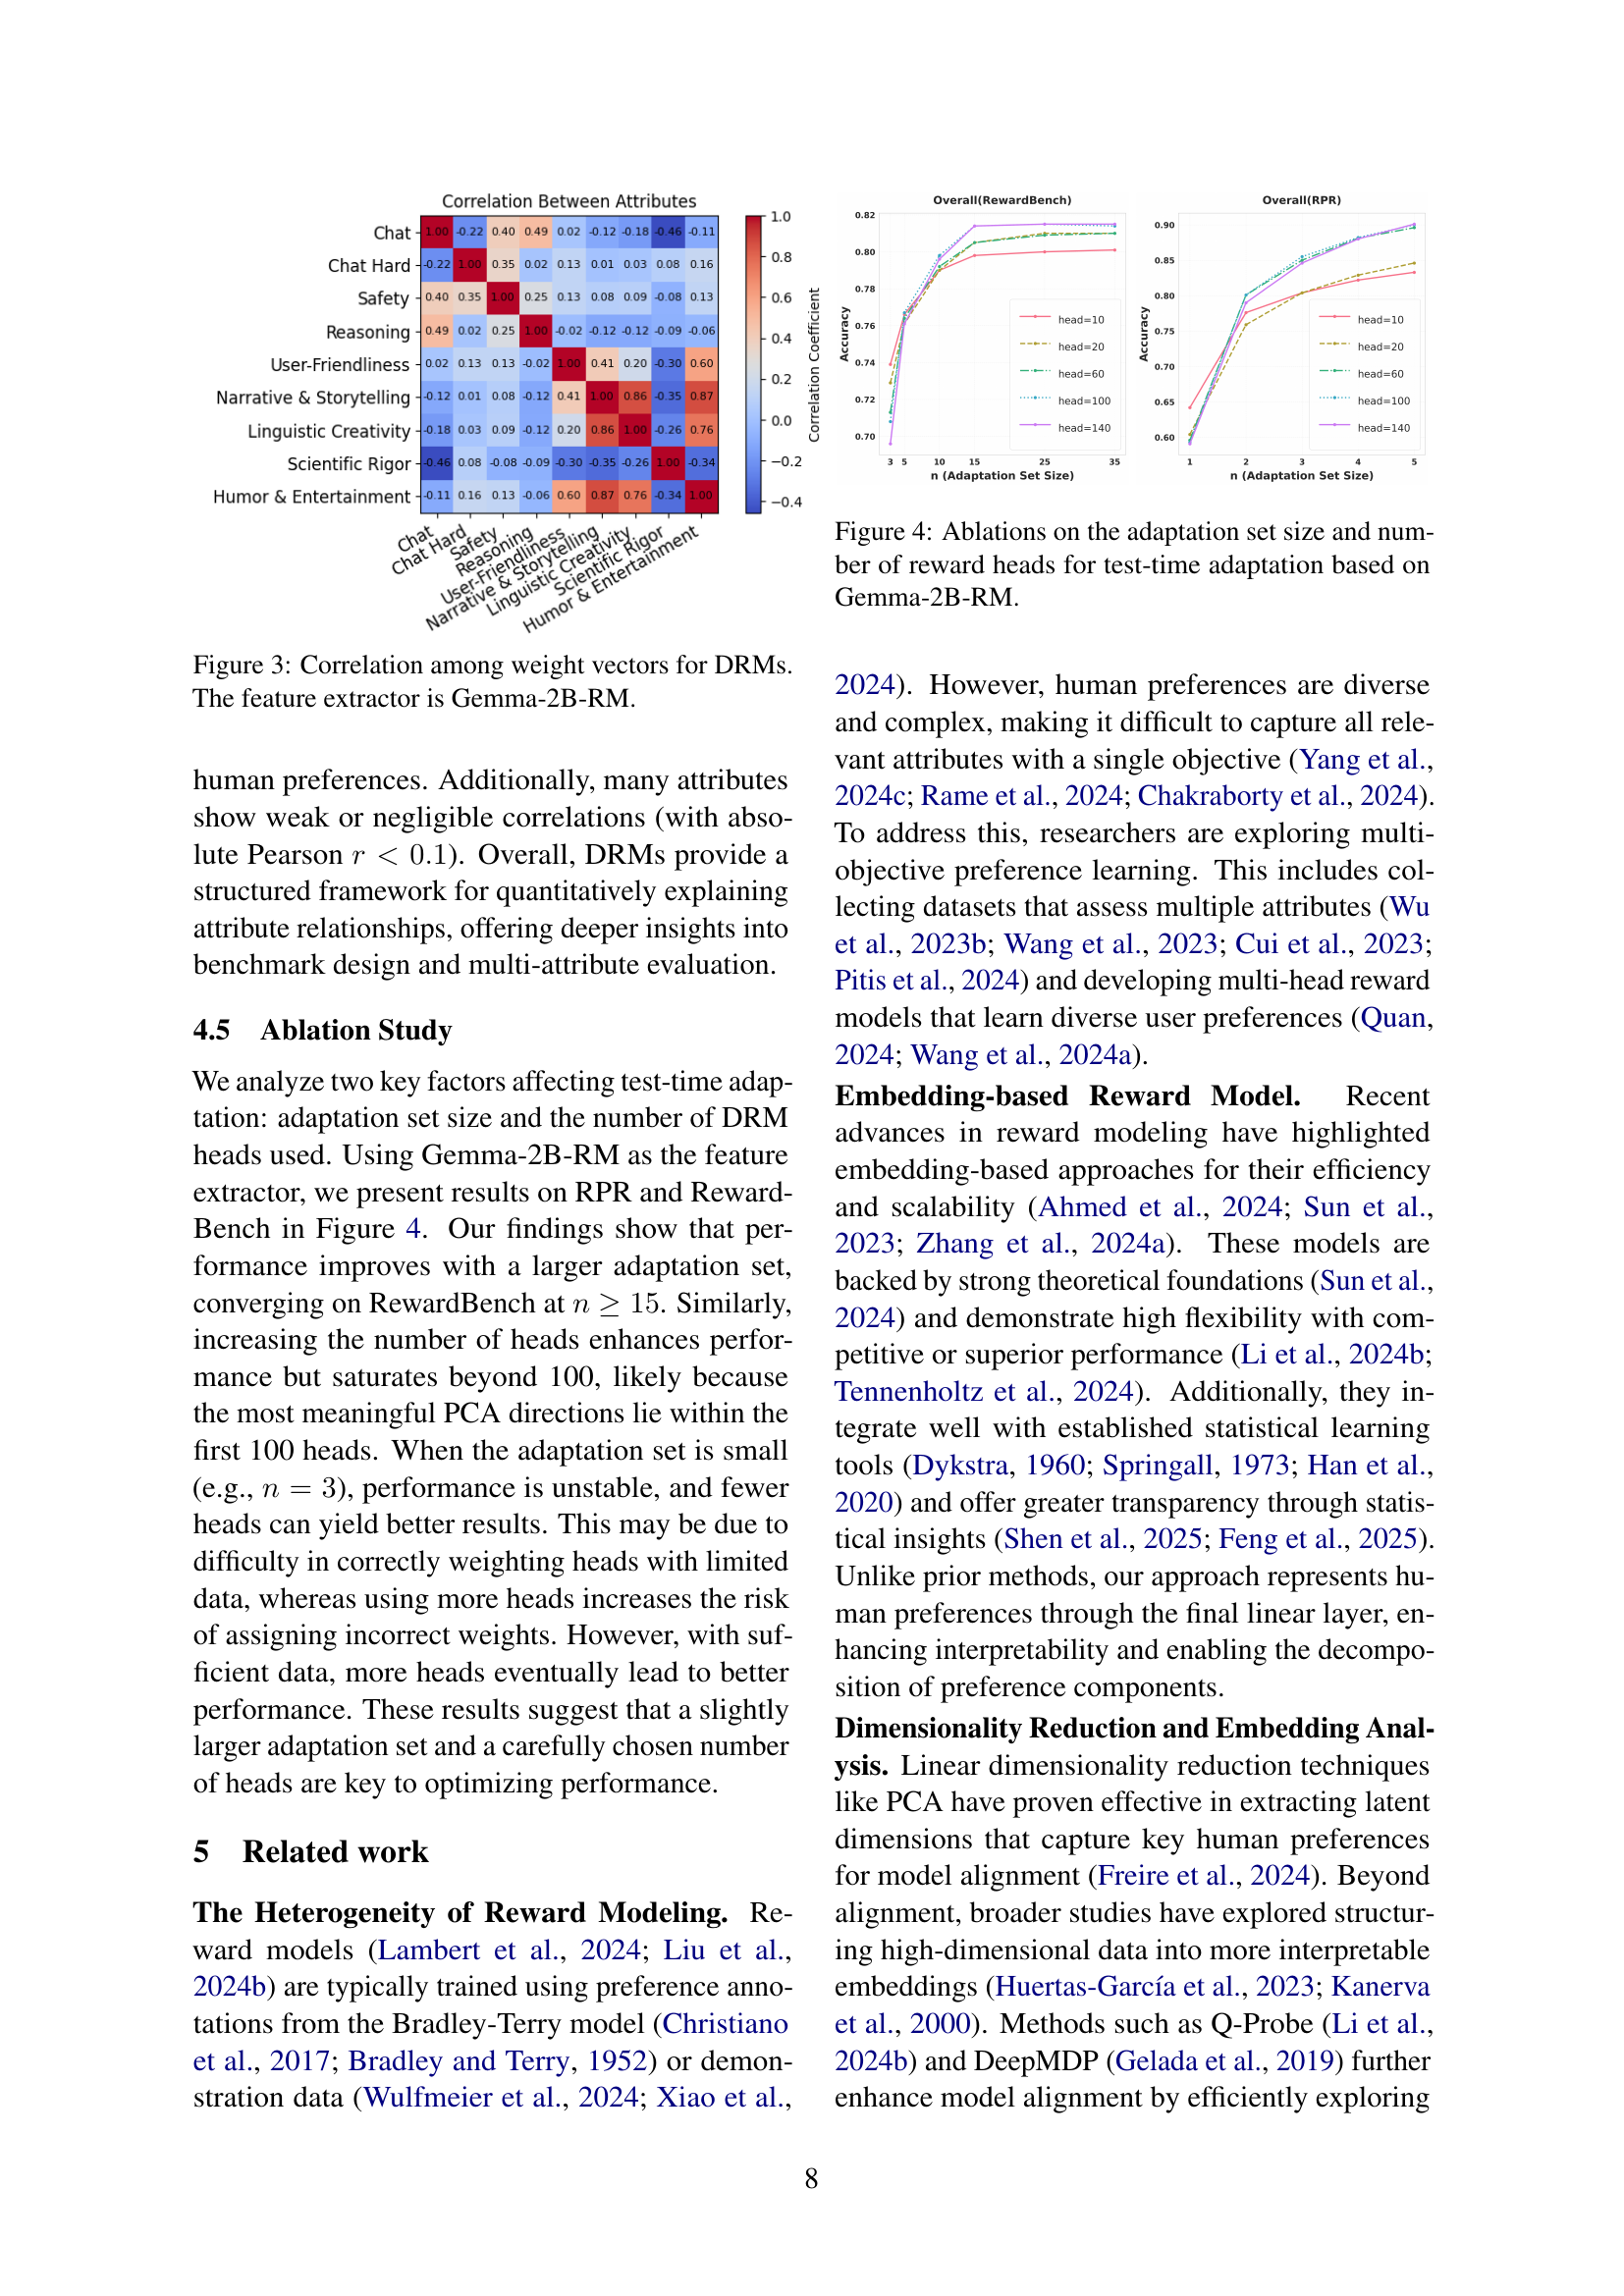
🔼 This figure displays a correlation matrix visualizing the relationships between different attributes within the RewardBench and RPR datasets. Each cell in the matrix represents the Pearson correlation coefficient between two attributes, indicating the strength and direction of their linear association. The feature extractor used to generate this correlation matrix is the Gemma-2B-RM model. Strong positive correlations suggest that these attributes frequently co-occur, while negative correlations indicate that they tend not to occur together. The magnitude of the correlation coefficient, ranging from -1 to +1, represents the strength of the relationship. This visualization helps to elucidate the underlying structure and dependencies of human preferences as captured by the DRMs.
read the caption
Figure 3: Correlation among weight vectors for DRMs. The feature extractor is Gemma-2B-RM.

🔼 This figure displays ablation studies on the Gemma-2B reward model to determine optimal hyperparameters for test-time adaptation. It shows how the model’s performance changes based on two key factors: 1) the size of the adaptation dataset used to fine-tune the model to a new user’s preferences and 2) the number of reward heads used by the model. The plots visualize how accuracy on the RewardBench and RPR benchmarks change as these parameters vary. The results reveal the effects of dataset size and the number of heads on performance, indicating optimal values for achieving the best test-time adaptation results.
read the caption
Figure 4: Ablations on the adaptation set size and number of reward heads for test-time adaptation based on Gemma-2B-RM.

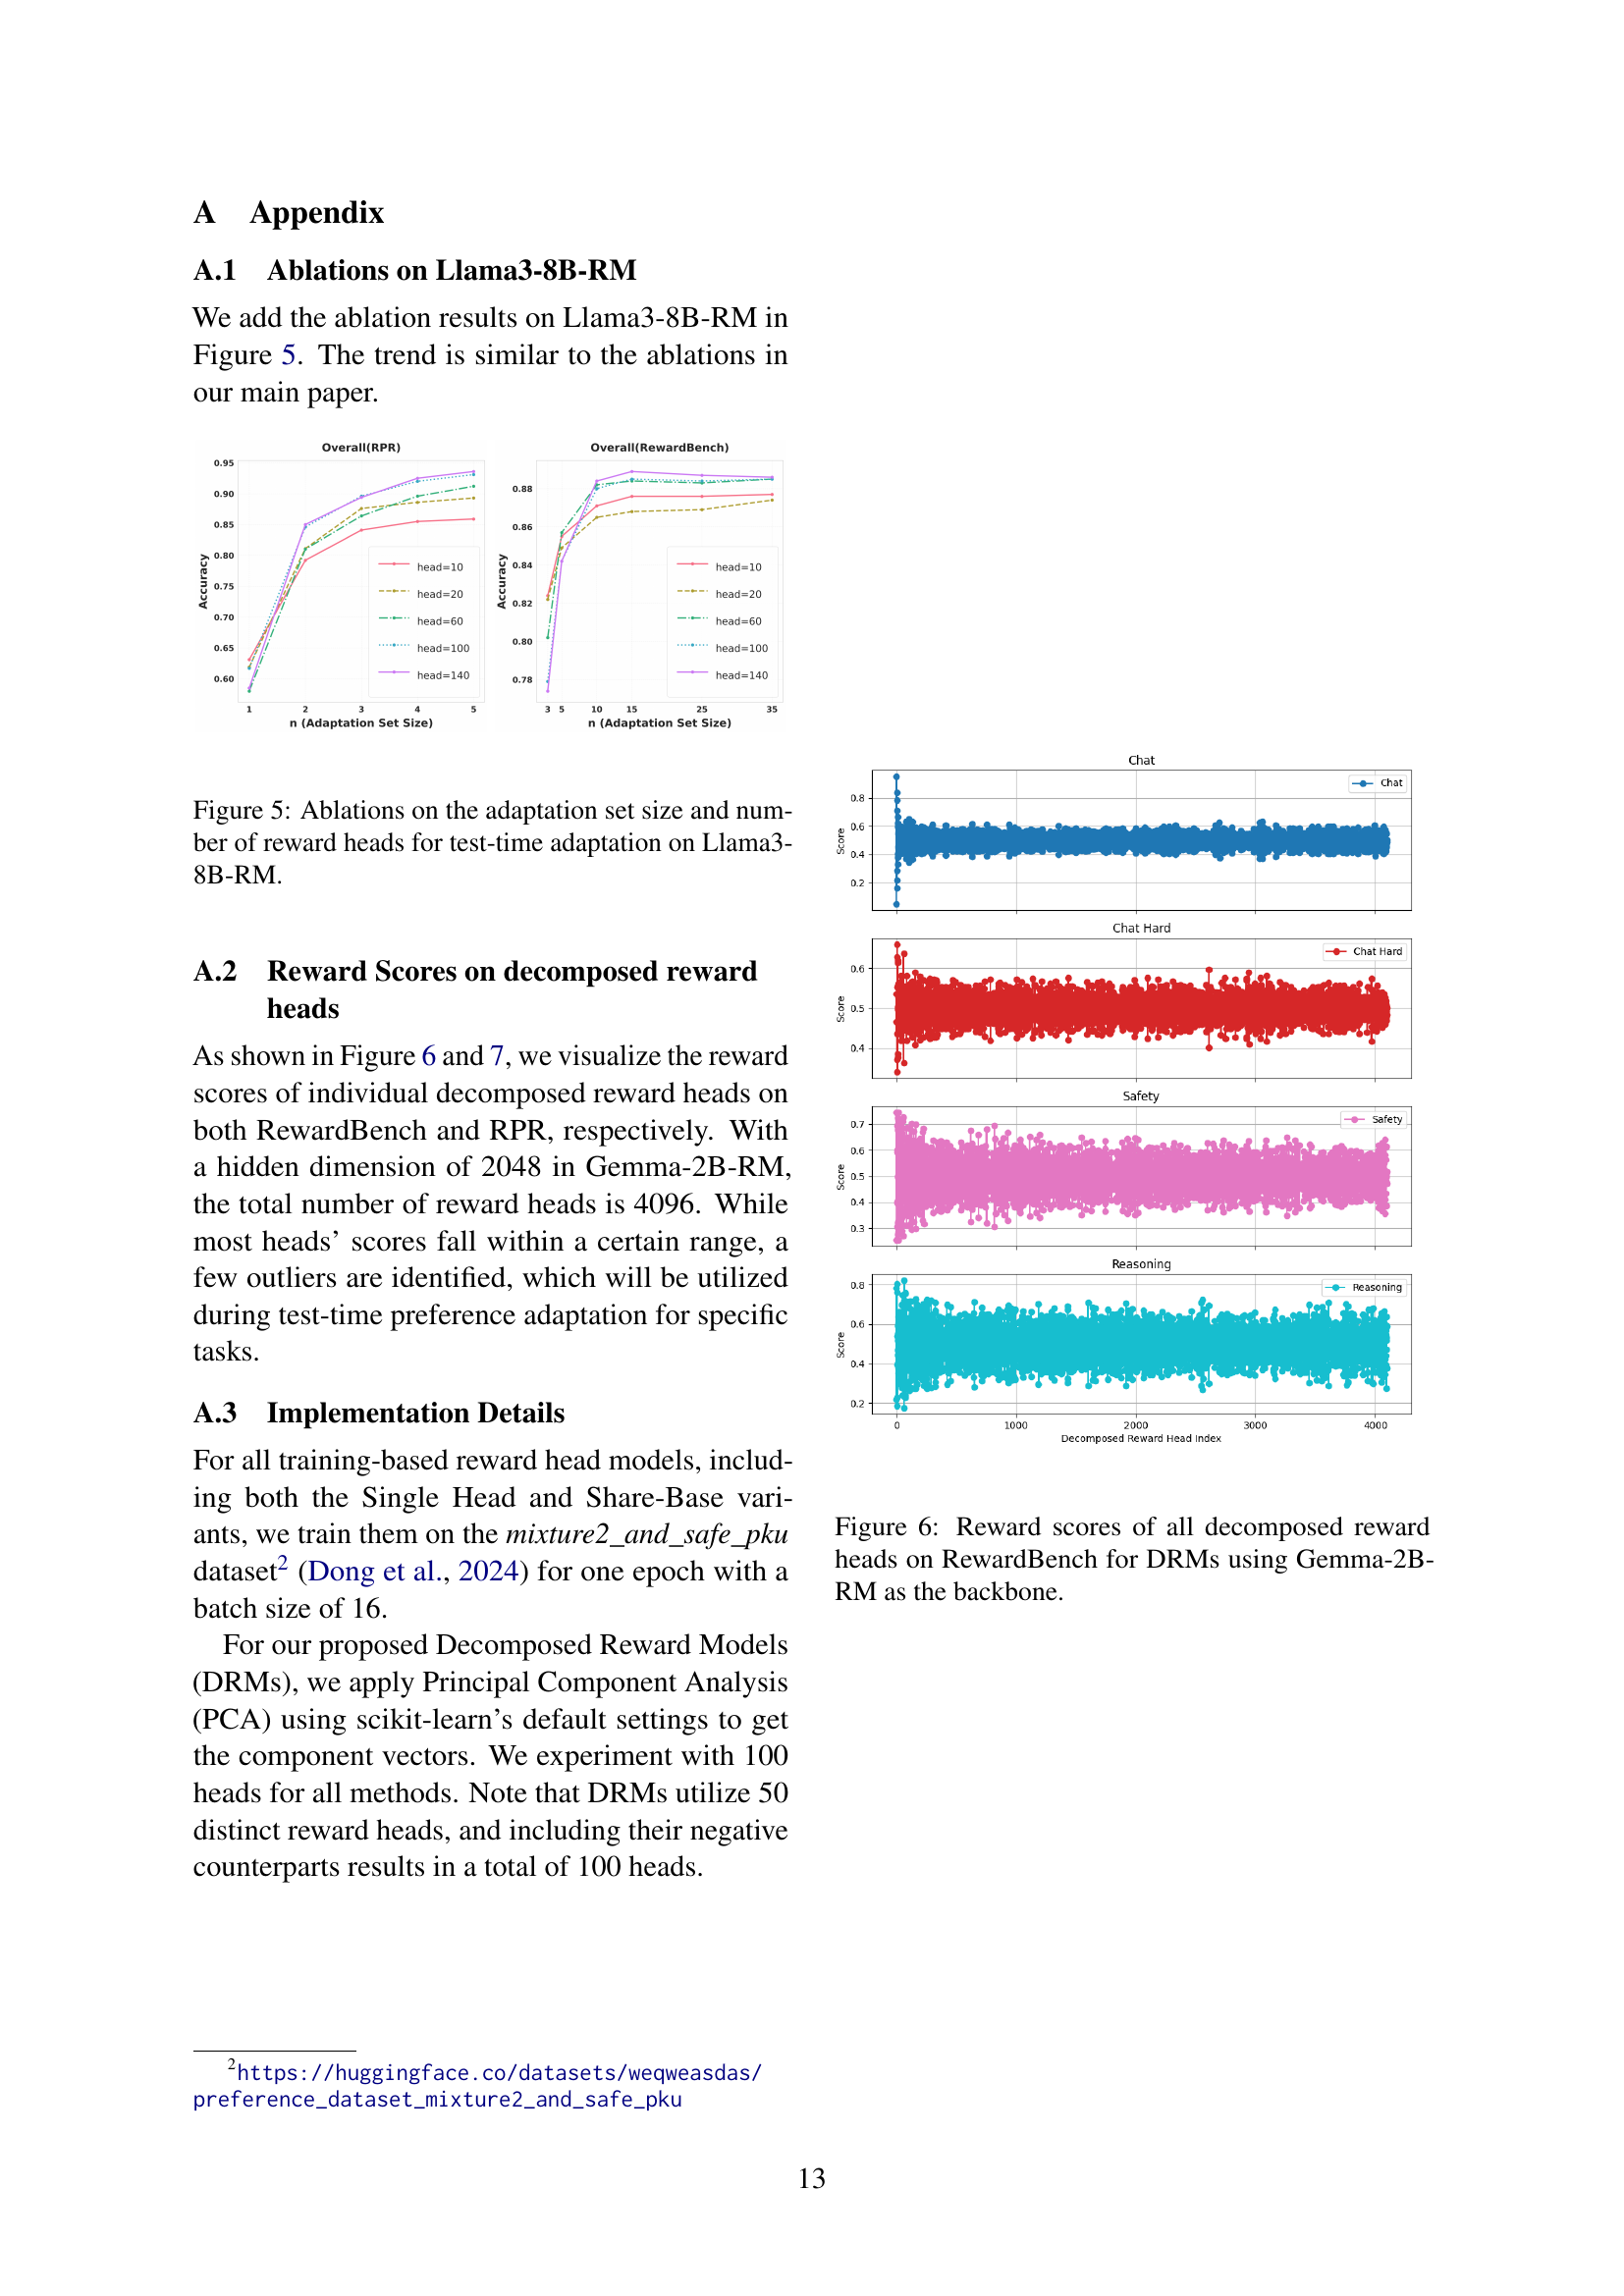
🔼 This figure displays the results of ablation studies conducted on the Llama3-8B-RM model to assess the impact of adaptation set size and the number of reward heads on the test-time adaptation performance. The left panel illustrates the effect of varying the adaptation set size (n) on the overall accuracy for both RewardBench and RPR benchmarks across different numbers of reward heads. The right panel shows how accuracy varies with the number of reward heads for a fixed adaptation set size. These experiments reveal the optimal balance between adaptation set size, number of reward heads, and model performance during test-time adaptation.
read the caption
Figure 5: Ablations on the adaptation set size and number of reward heads for test-time adaptation on Llama3-8B-RM.

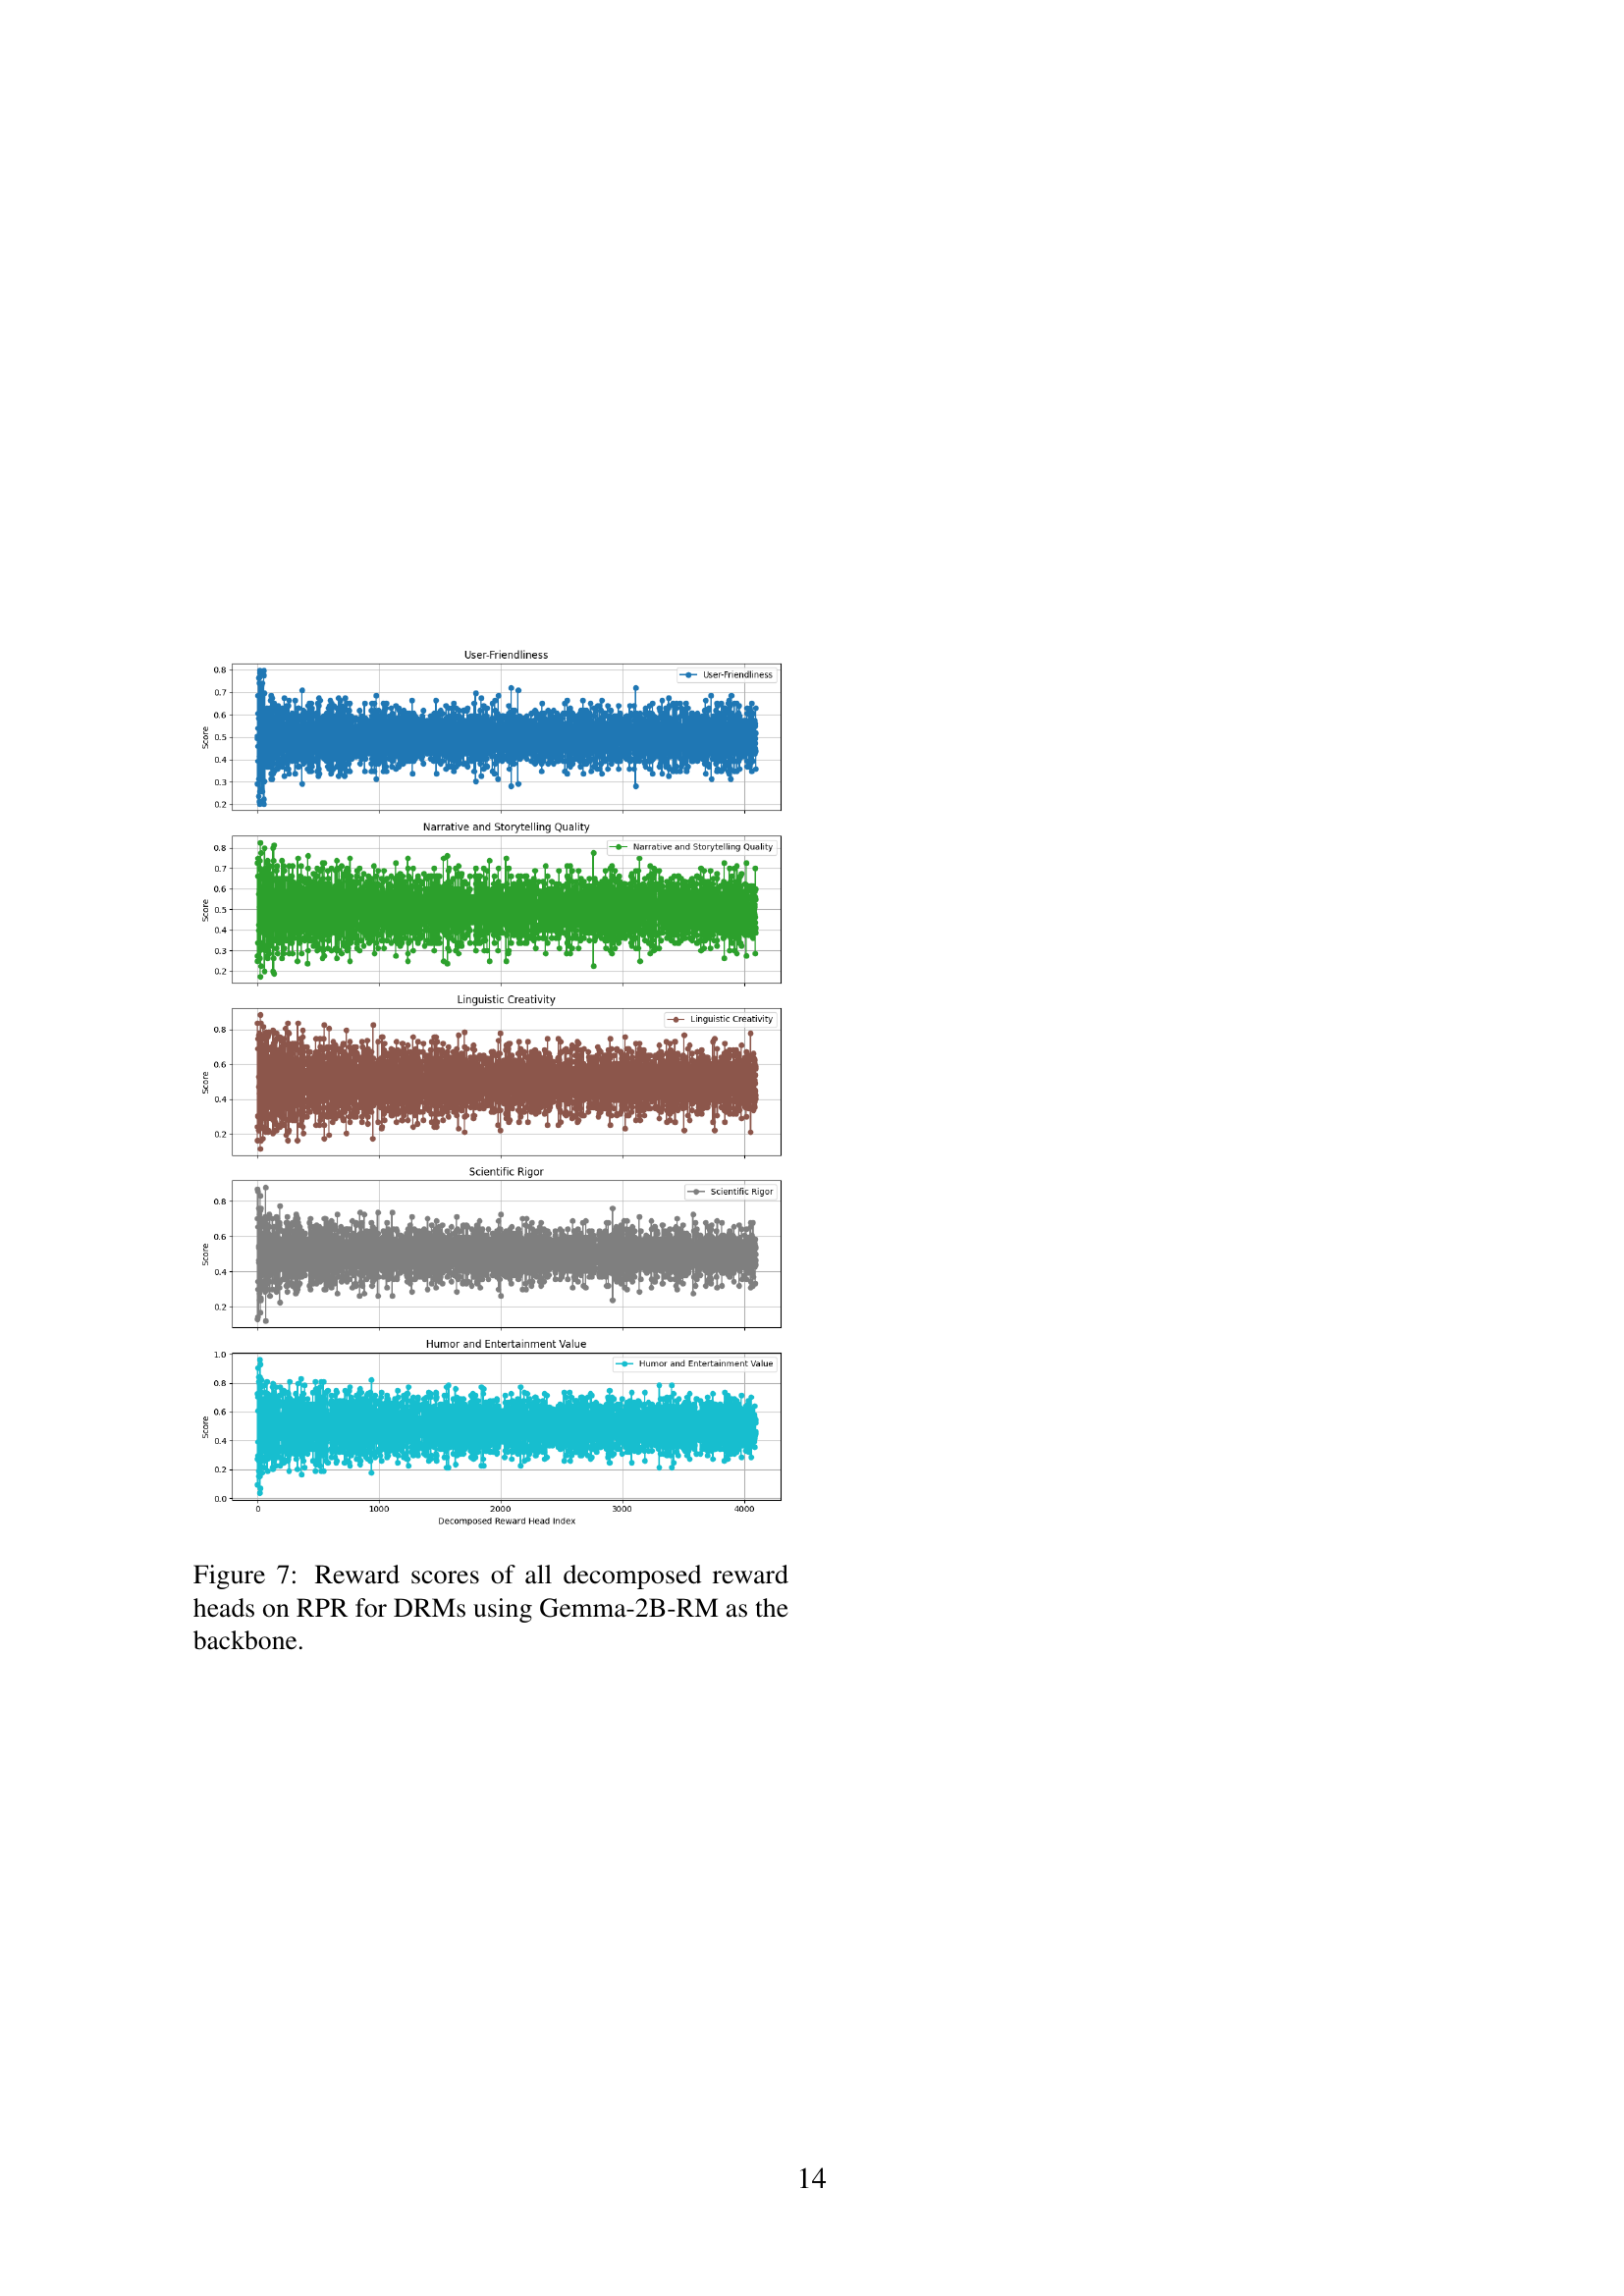
🔼 This figure visualizes the weight distribution of the top 100 most significant decomposed reward heads in the Decomposed Reward Models (DRMs) framework. These heads are ranked by their eigenvalues, representing the strength of their correlation with human preferences. The analysis is performed using the RPR dataset (Reasonable Preference Reversal), and Gemma-2B-RM serves as the backbone language model. Each line in the graph corresponds to a specific attribute from the RPR dataset. The x-axis shows the head index (ranking), while the y-axis shows the weight assigned to that particular head in relation to the corresponding attribute. This visualization helps understand which decomposed reward heads are most influential in capturing different aspects of human preferences within the RPR dataset when using Gemma-2B-RM as the backbone model.
read the caption
Figure 6: Weight distributions of the top 100 decomposed reward heads on RPR for DRMs using Gemma-2B-RM as the backbone.
More on tables
| Base Model | Method | User Friendliness | Narrative & Storytelling | Linguistic Creativity | Scientific Rigor | Humor & Entertainment | Overall |
|---|---|---|---|---|---|---|---|
| Gemma-2B-RM | Single Head | 0.506 | 0.662 | 0.817 | 0.881 | 0.690 | 0.714 |
| Shared-Base | 0.517(0.000) | 0.688(0.000) | 0.817(0.000) | 0.881(0.000) | 0.690(0.000) | 0.721(0.000) | |
| Random (Uniform) | 0.713(0.062) | 0.782(0.068) | 0.920(0.045) | 0.907(0.043) | 0.907(0.026) | 0.848(0.024) | |
| Random (Gaussian) | 0.582(0.039) | 0.760(0.060) | 0.823(0.063) | 0.873(0.025) | 0.817(0.053) | 0.771(0.022) | |
| DRM (Ours) | 0.789(0.062) | 0.871(0.033) | 0.953(0.034) | 0.907(0.019) | 0.975(0.017) | 0.900(0.017) | |
| Llama3-8B-RM | Single Head | 0.685 | 0.825 | 0.846 | 0.964 | 0.905 | 0.844 |
| Shared-Base | 0.674(0.000) | 0.825(0.000) | 0.827(0.000) | 0.964(0.000) | 0.881(0.000) | 0.832(0.000) | |
| Random (Uniform) | 0.616(0.104) | 0.860(0.037) | 0.798(0.103) | 0.958(0.007) | 0.906(0.031) | 0.823(0.041) | |
| Random (Gaussian) | 0.730(0.100) | 0.892(0.027) | 0.887(0.055) | 0.956(0.008) | 0.919(0.032) | 0.875(0.028) | |
| DRM (Ours) | 0.812(0.063) | 0.946(0.029) | 0.945(0.015) | 0.969(0.010) | 0.991(0.011) | 0.931(0.016) |
🔼 Table 2 presents a comparative analysis of different reward model approaches on the Reasonable Preference Reversal (RPR) benchmark. The results are based on five data points (n=5) in the test set and 20 different adaptation sets. The models evaluated include a single-head reward model, a shared-base reward model which leverages a frozen prior network and multiple learnable heads, and two randomly generated multi-head baselines. Except for the single-head model, all approaches utilize the HyRe test-time adaptation method. The table reports the average performance across all attributes and shows the standard deviation calculated from the twenty different sampled adaptation sets.
read the caption
Table 2: Evaluation Results on RPR (n=5𝑛5n=5italic_n = 5). We compare DRMs with trained baselines (“Single Head' and “Shared-Base'), and randomly generated multi-head baselines (“Random'). Except for single-head baseline, other methods use HyRe for test-time adaptation. Standard deviation over 20 sampled adaptation sets are reported.
| Base Model | Method | Chat | Chat Hard | Safety | Reasoning | Overall |
|---|---|---|---|---|---|---|
| Gemma-2B-RM | Single Head | 0.944 | 0.467 | 0.759 | 0.759 | 0.733 |
| Shared-Base | 0.947(0.000) | 0.476(0.000) | 0.765(0.000) | 0.774(0.000) | 0.740(0.000) | |
| Random (Uniform) | 0.940(0.005) | 0.567(0.029) | 0.800(0.010) | 0.843(0.019) | 0.787(0.009) | |
| Random (Gaussian) | 0.951(0.005) | 0.573(0.033) | 0.781(0.015) | 0.839(0.021) | 0.786(0.008) | |
| DRMs(Ours) | 0.953(0.003) | 0.650(0.028) | 0.783(0.030) | 0.872(0.025) | 0.814(0.013) | |
| Llama3-8B-RM | Single Head | 0.989 | 0.684 | 0.891 | 0.920 | 0.871 |
| Shared-Base | 0.986(0.000) | 0.684(0.000) | 0.895(0.000) | 0.927(0.000) | 0.873(0.000) | |
| Random (Uniform) | 0.985(0.003) | 0.623(0.089) | 0.903(0.010) | 0.915(0.014) | 0.857(0.023) | |
| Random (Gaussian) | 0.982(0.004) | 0.663(0.096) | 0.889(0.009) | 0.936(0.011) | 0.868(0.024) | |
| DRMs(Ours) | 0.986(0.002) | 0.755(0.032) | 0.885(0.036) | 0.914(0.036) | 0.885(0.012) |
🔼 This table presents the results of an experiment comparing different methods for adapting to user preferences, specifically focusing on the performance of Decomposed Reward Models (DRMs). The experiment uses two different base language models and evaluates the methods across various attributes within two benchmark datasets, RewardBench and RPR. The performance metrics reflect accuracy scores for each attribute, providing a detailed comparison of DRMs against other approaches like single-head reward models, shared-base reward models, and random reward models. The ’n=15’ indicates that each test involved a small adaptation dataset of 15 samples.
read the caption
Table 3: Evaluation Results (n=15𝑛15n=15italic_n = 15), comparing different methods across two base models.
| Benchmark | Attributes | Single Head | Random (Uniform) | DRM(Ours) |
|---|---|---|---|---|
| RewardBench | Overall | 0.759 | 0.770 | 0.830 |
| Chat | 0.905 | 0.897 | 0.920 | |
| Chat Hard | 0.621 | 0.600 | 0.692 | |
| Safety | 0.699 | 0.753 | 0.786 | |
| Reasoning | 0.813 | 0.832 | 0.920 | |
| RPR | Overall | 0.746 | 0.630 | 0.796 |
| User-Friendliness | 0.640 | 0.555 | 0.657 | |
| Narrative & Storytelling | 0.713 | 0.610 | 0.763 | |
| Linguistic Creativity | 0.808 | 0.595 | 0.843 | |
| Scientific Rigor | 0.762 | 0.661 | 0.806 | |
| Humor & Entertainment | 0.798 | 0.744 | 0.905 |
🔼 Table 4 presents the performance comparison of Decomposed Reward Models (DRMs) and a single-head reward model on the instruction-tuned language model gemma-2-9b-it. The evaluation is performed on two benchmarks: RewardBench and Reasonable Preference Reversal (RPR). For both benchmarks, the test dataset size is controlled: 15 samples for RewardBench and 5 for RPR. This setup is consistent with earlier experiments. The table shows the performance of DRMs compared to a standard single-head reward model that’s trained on the same data as DRMs. This allows for direct comparison of model performance and highlights the effectiveness of the DRMs approach. The results are particularly pertinent for understanding the performance of DRMs when applied to a model different from those used in the primary experiments, in this case, an instruction-tuned language model.
read the caption
Table 4: Performance of DRMs on instruction-tuned model gemma-2-9b-it. Single head baseline is trained with the same dataset used for DRMs. Aligned with the previous setting, we use n=15𝑛15n=15italic_n = 15 and n=5𝑛5n=5italic_n = 5 for RewardBench and RPR respectively.
Full paper#