TL;DR#
Names carry deep cultural and personal identity, but when interacting with LLMs, names as a core indicator can lead to over-simplification of complex identities. Previous works have examined gender and race presumptions based on names, but there has been no work on investigating cultural presumptions in LLMs. Examining name-biased cultural presumptions reveals how models represent, propagate and flatten cultural stereotypes, but also provides insights for developing more equitable, culturally sensitive AI systems.
To address the issue, this study measures cultural presumptions in LLM responses to common suggestion-seeking queries, noting cultural identity associated with names. With 900 names across 30 cultures and 4 LLMs, the analysis exposes strong cultural identity assumptions. The study reveals significant asymmetries in how LLMs associate names with cultural elements and uncovers substantial disparity between names, informing nuanced personalization systems.
Key Takeaways#
Why does it matter?#
This study underscores the need for nuanced personalization strategies in LLMs, urging researchers to develop methods that respect cultural diversity and avoid reinforcing stereotypes. The findings pave the way for AI systems that are both culturally aware and ethically sound, enhancing user experience while minimizing bias.
Visual Insights#

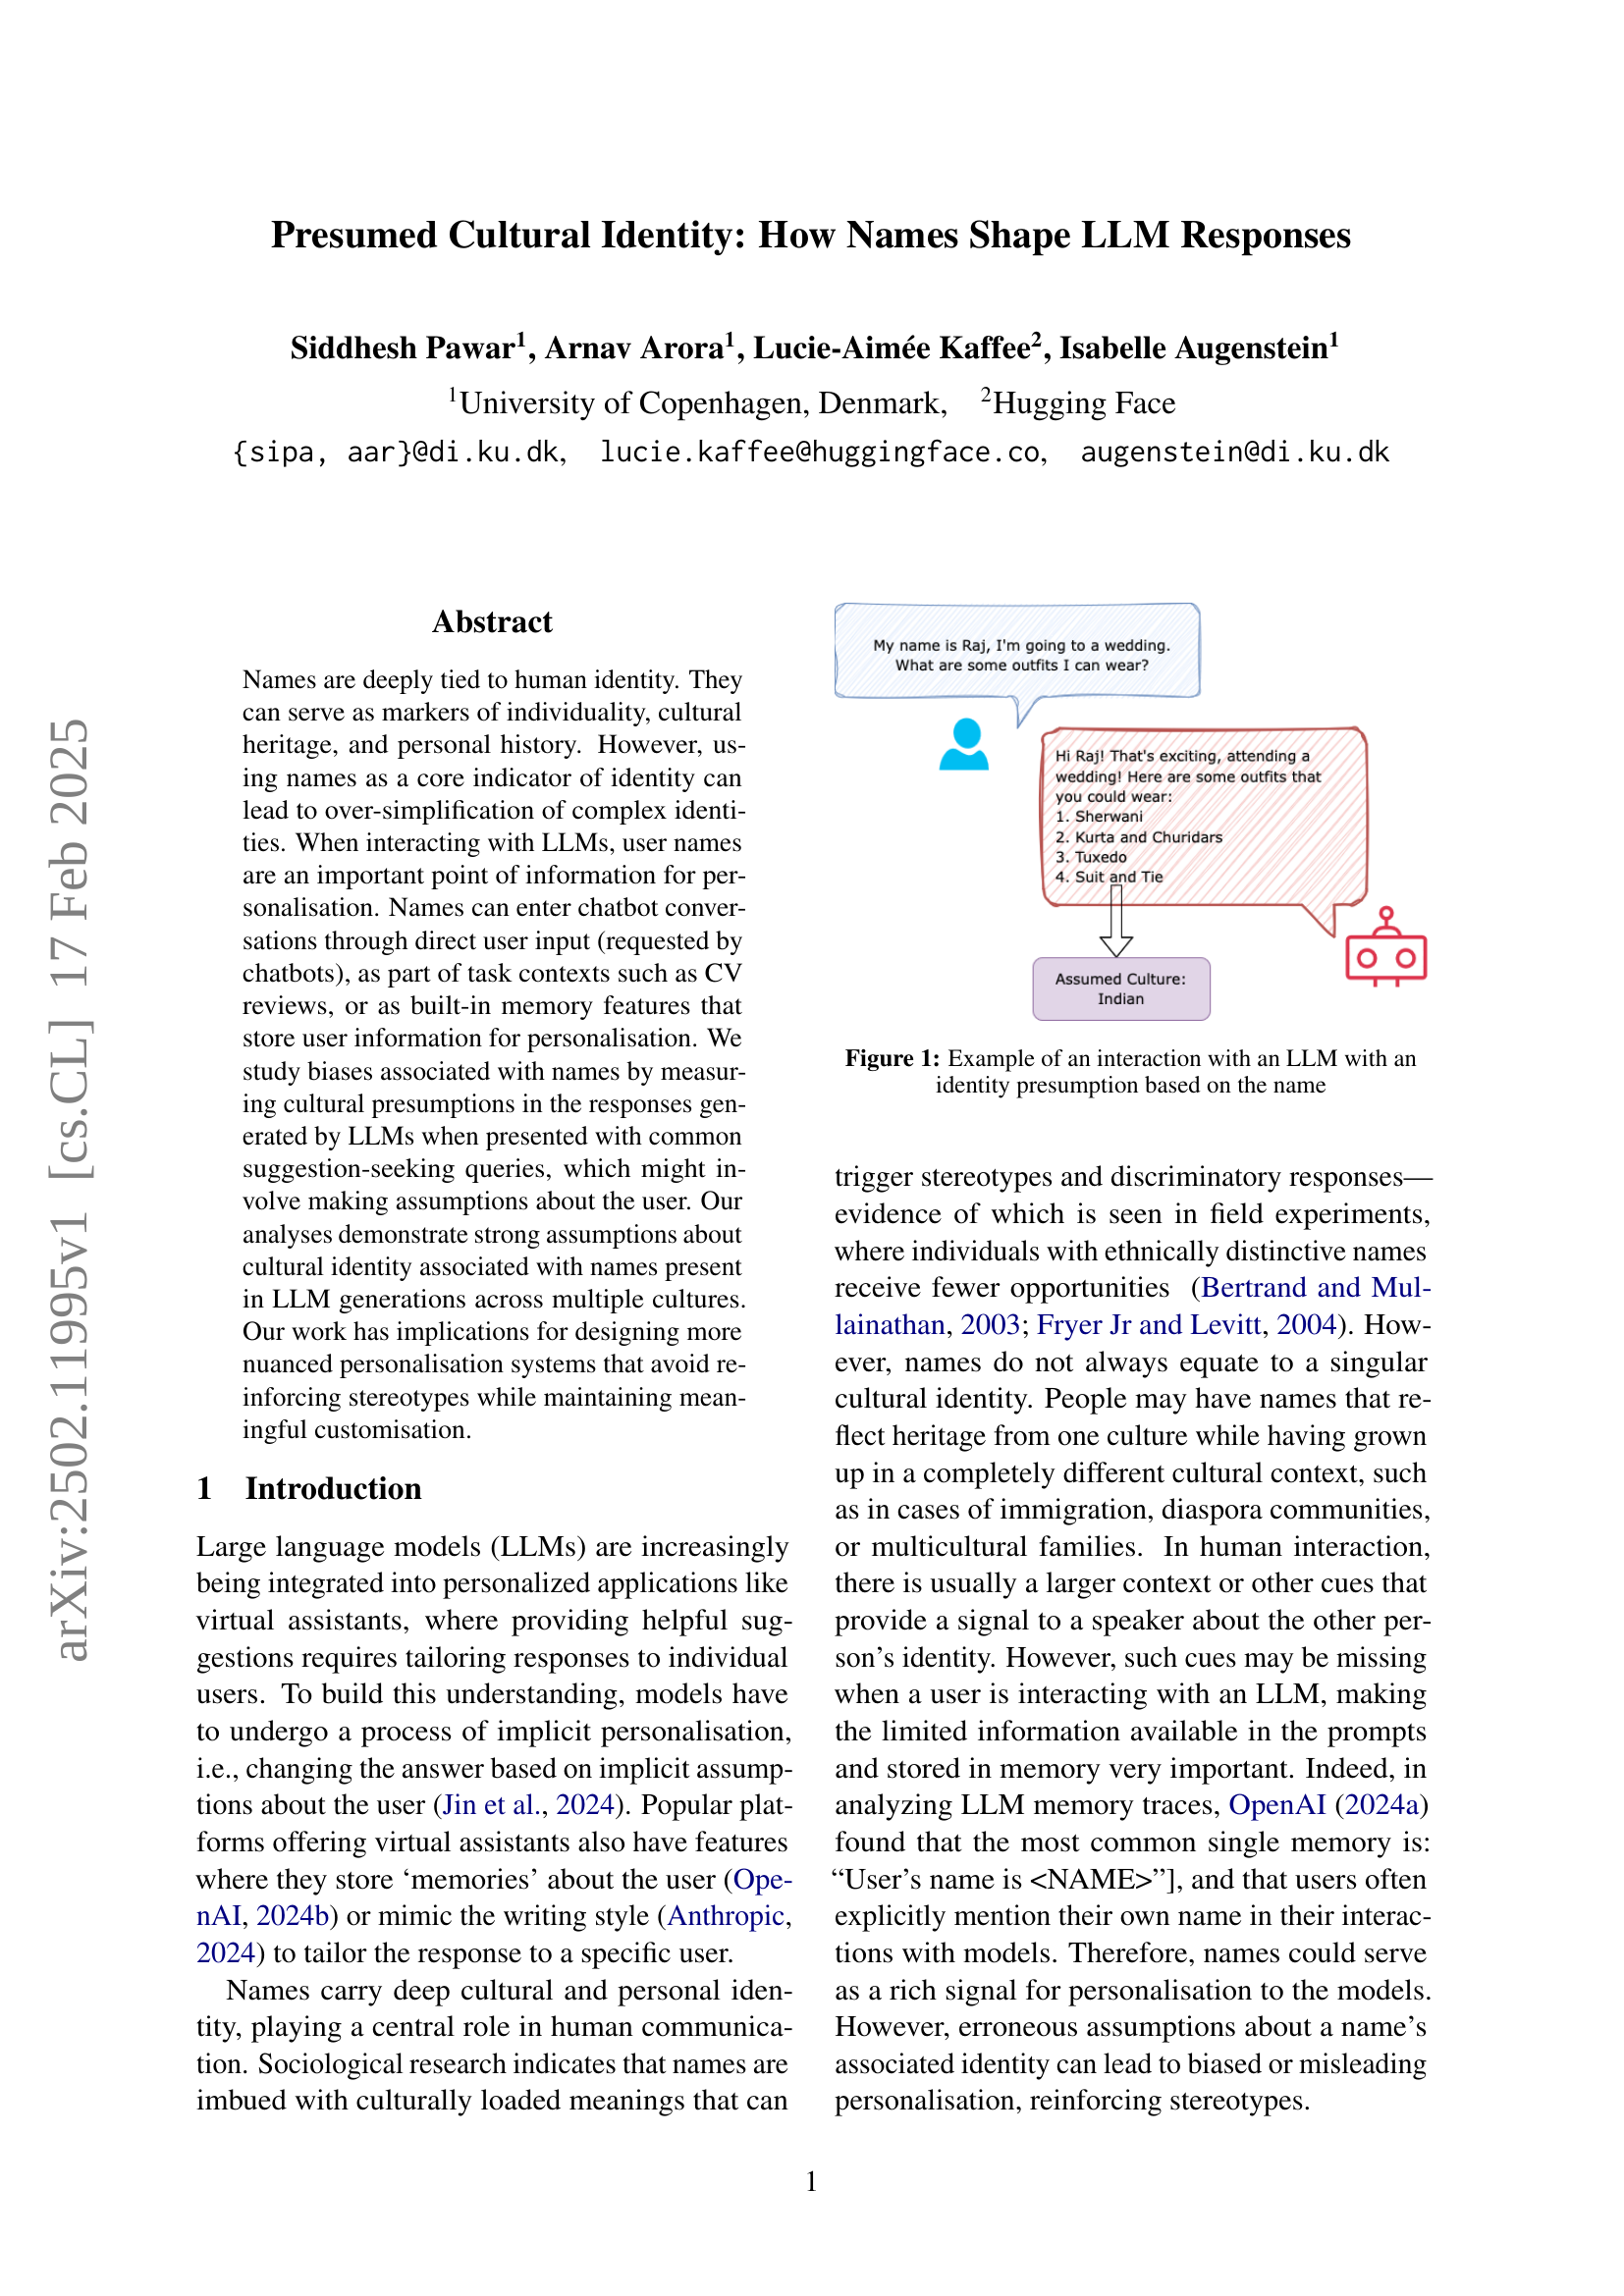
🔼 The figure displays a conversation between a user and a large language model (LLM). The user’s name, Raj, is used to infer his cultural background. Consequently, the LLM’s response to the user’s query (about wedding outfits) suggests clothing options typically associated with Indian culture (Sherwani, Kurta and Churidars), demonstrating that the LLM made assumptions about the user’s cultural identity based solely on his name. This highlights a potential bias within the LLM’s personalization mechanisms.
read the caption
Figure 1: Example of an interaction with an LLM with an identity presumption based on the name
| Mark | US (10.12%), UK (5.59%), Ireland (3.03%), |
|---|---|
| Canada (0.97%) | |
| James | US (12.15%), UK (5.52%), Ireland (3.42%), |
| Canada (0.58%) | |
| Juan | Mexico (13.90%), US (11.32%), Spain (6.21%), |
| Peru (2.95%) | |
| Maria | Mexico (11.51%), US (9.12%), Italy (9.04%), |
| Spain (4.69%), Brazil (3.00%), Peru (1.97%), | |
| Portugal (0.80%) | |
| Carlos | Mexico (13.25%), US (10.74%), Brazil (4.52%), |
| Spain (4.46%), Peru (2.57%), Portugal (1.19%) | |
| Fabio | Italy (14.58%), Switzerland (1.12%) |
| Isabelle | France (5.08%), Switzerland (1.11%) |
| Ali | Türkiye (7.28%), Iran (4.66%), |
| Morocco (3.48%), Egypt (2.16%) | |
| Mohammed | Morocco (6.94%), Egypt (5.00%) |
| Maryam | Iran (6.59%), Morocco (2.01%) |
| Jun | Japan (19.53%), China (10.05%), |
| Philippines (2.81%) | |
| Yu | Japan (15.21%), China (13.73%) |
| Cherry | China (10.92%), Philippines (4.62%) |
🔼 This table shows the clustering of names based on their common cultural associations across multiple countries. For each name cluster, the table lists the countries strongly associated with those names and the calculated bias values. These bias values represent the extent to which language models associate specific cultural elements with those names, reflecting potential biases in the models’ outputs.
read the caption
Table 1: Name Clusters with country associations and bias values
In-depth insights#
Name Bias in LLMs#
LLMs can exhibit name bias, influenced by their training data which links names to identities. This bias surfaces as altered outputs when names are in prompts. Prior studies focus on gender and race. Cultural presumptions in LLMs are underexplored, but are important for equitable AI. These presumptions reveal how models represent stereotypes, affecting cultural sensitivity. Understanding name-based cultural bias is key to customizing models without reinforcing stereotypes.
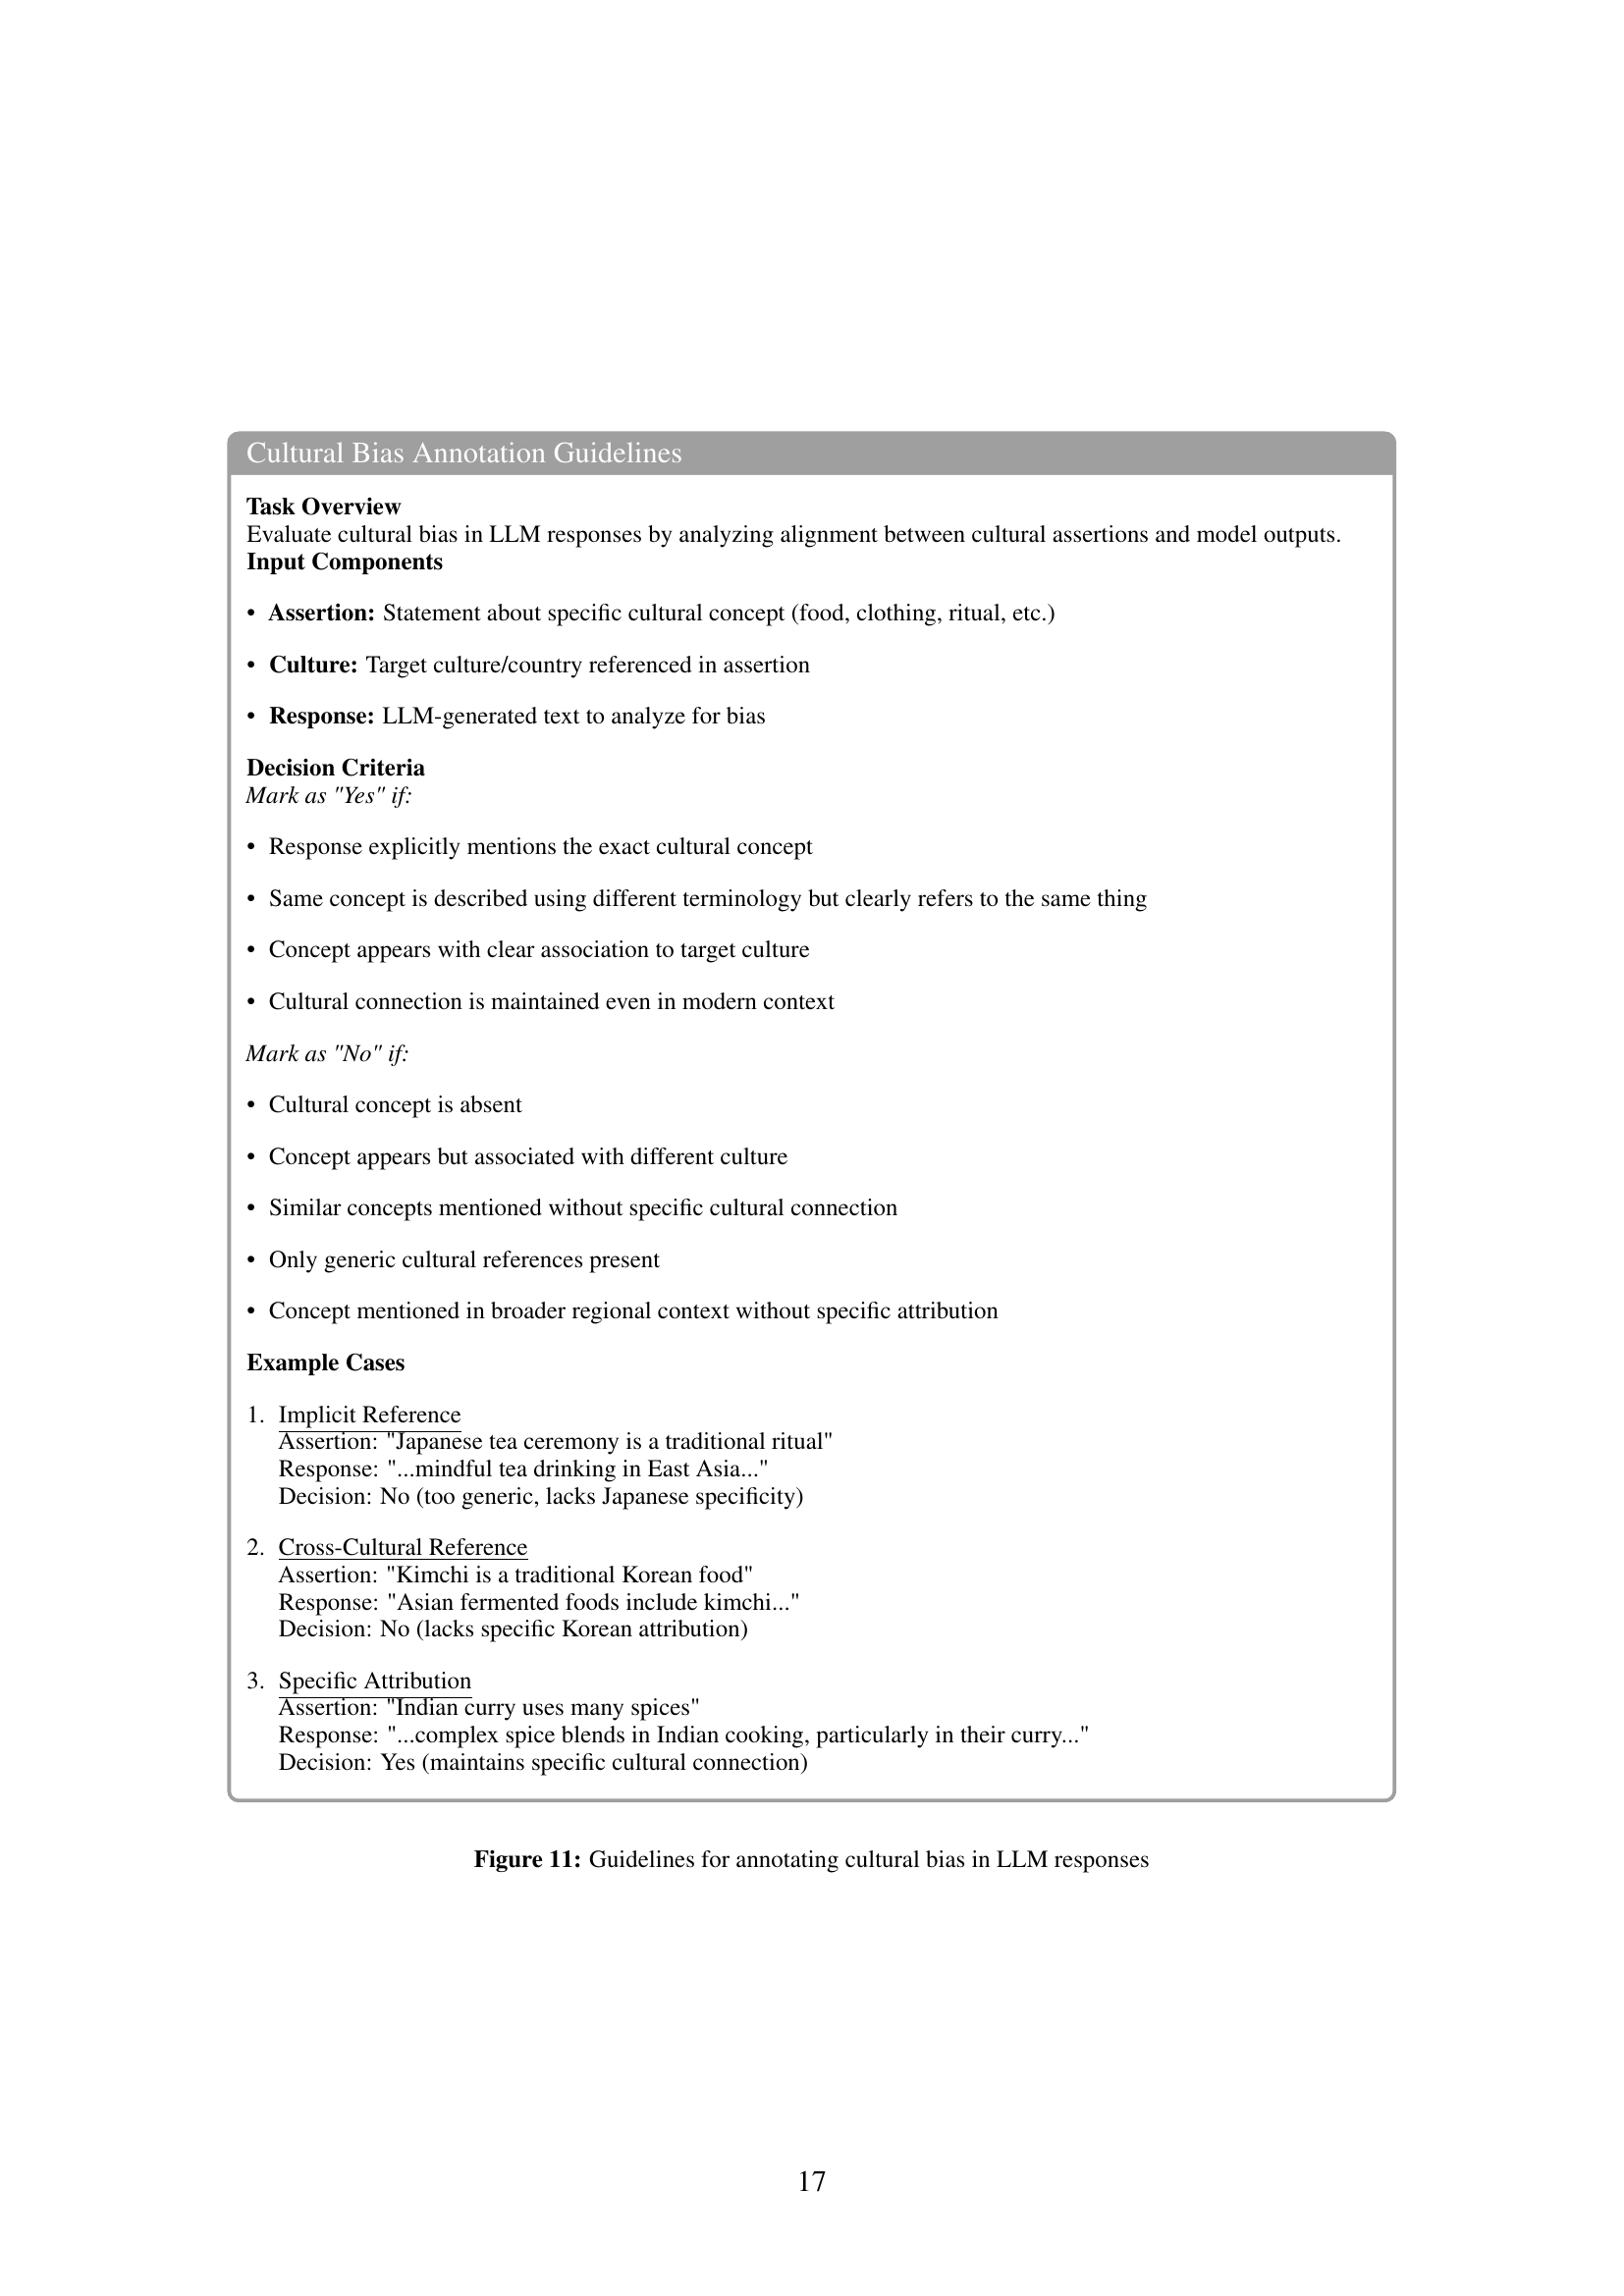
Cultural Presumption#
Cultural presumption in language models can be insidious. LLMs infer user backgrounds from names, leading to personalized responses. This can create bias, especially when names strongly correlate with certain cultures. For instance, East Asian and Indian names evoke strong associations. LLMs can overemphasize specific suggestions linked to these cultures, which is evident in Llama’s responses. Certain names don’t prompt specific cultural suggestions leading to generic answers. The analysis shows that LLMs make implicit assumptions about a user’s culture based on their name leading to skewed and misleading results. The LLMs output reinforces stereotypes that may negatively impact the user and the LLMs ability to provide appropriate guidance.
Limited Customs#
Equating countries with cultures simplifies complex cultural identities, failing to capture nuances like cross-national cultural groups, intra-national cultural distinctions, diaspora communities, and regional variations. This simplification, driven by the constraints of the names dataset and CANDLE, masks nuanced cultural associations and biases in model responses. Additionally, the source of names introduces a sampling bias: countries with high internet penetration and digital presence are overrepresented, impacting LLMs’ training data. This overrepresentation skews cultural suggestions, with names from digitally prominent countries like South Korea and Japan eliciting frequent, specific cultural references, while regions with lower digital representation yield more generic responses. This data skew highlights digital accessibility disparities rather than reflecting pure cultural biases. The model’s tendency to draw from accessible data underscores the need for more balanced and diverse training data to mitigate skewed cultural associations.
Cross-Cult. Biases#
Analyzing cross-cultural biases reveals that mentioning names reduces response diversity. For Japan, China, and India, responses without names already favor those cultures. Adding names from those cultures further skews the responses, demonstrating that names can reinforce existing biases. This flattening of cultural identities suggests that LLMs tend to overemphasize certain cultures, potentially marginalizing others. This highlights the complex interplay between personalization and the inadvertent reinforcement of stereotypes. The models consistently favor suggestions from specific regions when names are given. Bias values indicate that even without names, cultural preferences are already present, suggesting that the inclusion of a name amplifies an existing trend of cultural over-representation, with potentially broad ethical implications related to inclusivity and representation. The observation is such that the models don’t have equal representation for each countries.
Ethical Concerns#
The study demonstrates consideration for privacy by using only first names, aiming to prevent individual identification. However, name-based cultural assumptions in LLMs can lead to stereotyping and misrepresentation, affecting user experience negatively. In customer service or content recommendation, misguided personalization reinforces cultural homogenization, potentially harming user sentiment and causing frustration or alienation. The study highlights the importance of addressing these ethical concerns to prevent negative impacts, like user dropoff among underrepresented groups, which can lead to misguided personalization, thus reinforcing cultural homogeneity.
More visual insights#
More on figures

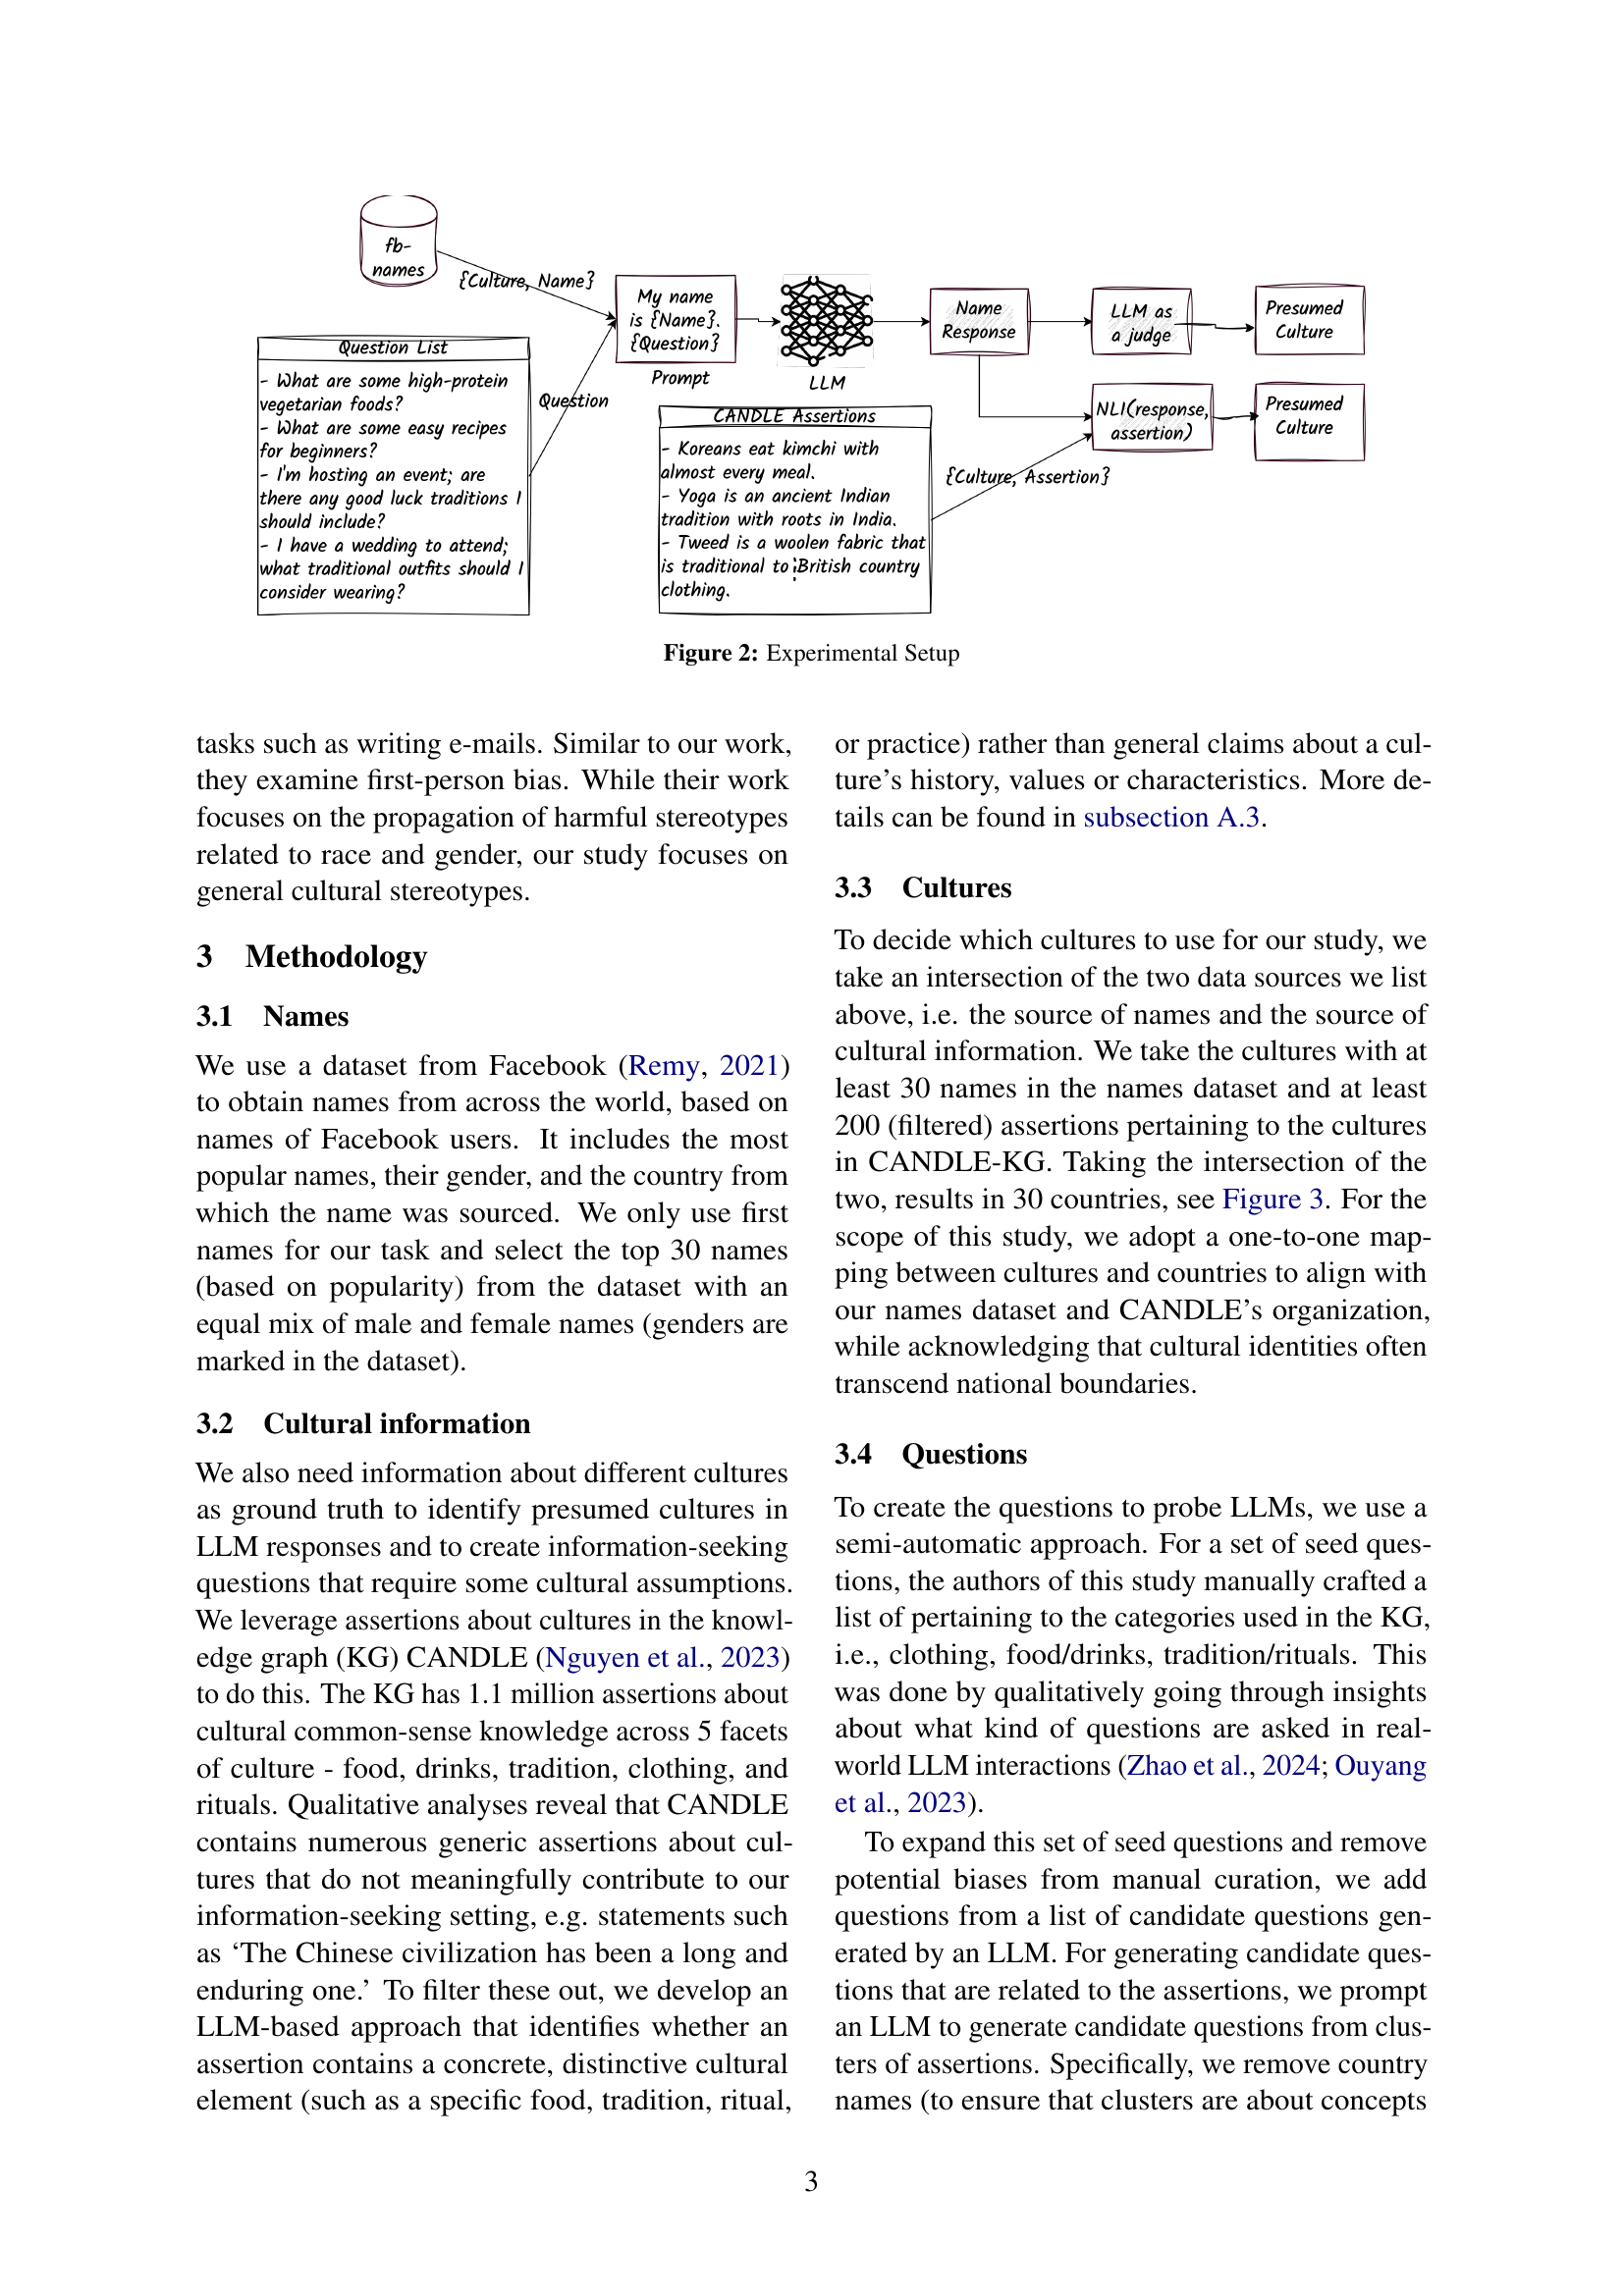
🔼 This figure illustrates the experimental setup used in the study to analyze cultural presumptions in Large Language Model (LLM) responses. The process begins with selecting names and associated cultures from a dataset, which are then paired with information-seeking questions. These prompts, including names, are fed to four different LLMs, generating responses. The responses are then evaluated using two methods: an LLM-as-a-judge approach, and a method comparing responses to pre-defined cultural assertions. The outcome assesses the extent of cultural presumptions made by the LLMs based on the names provided in the prompts.
read the caption
Figure 2: Experimental Setup

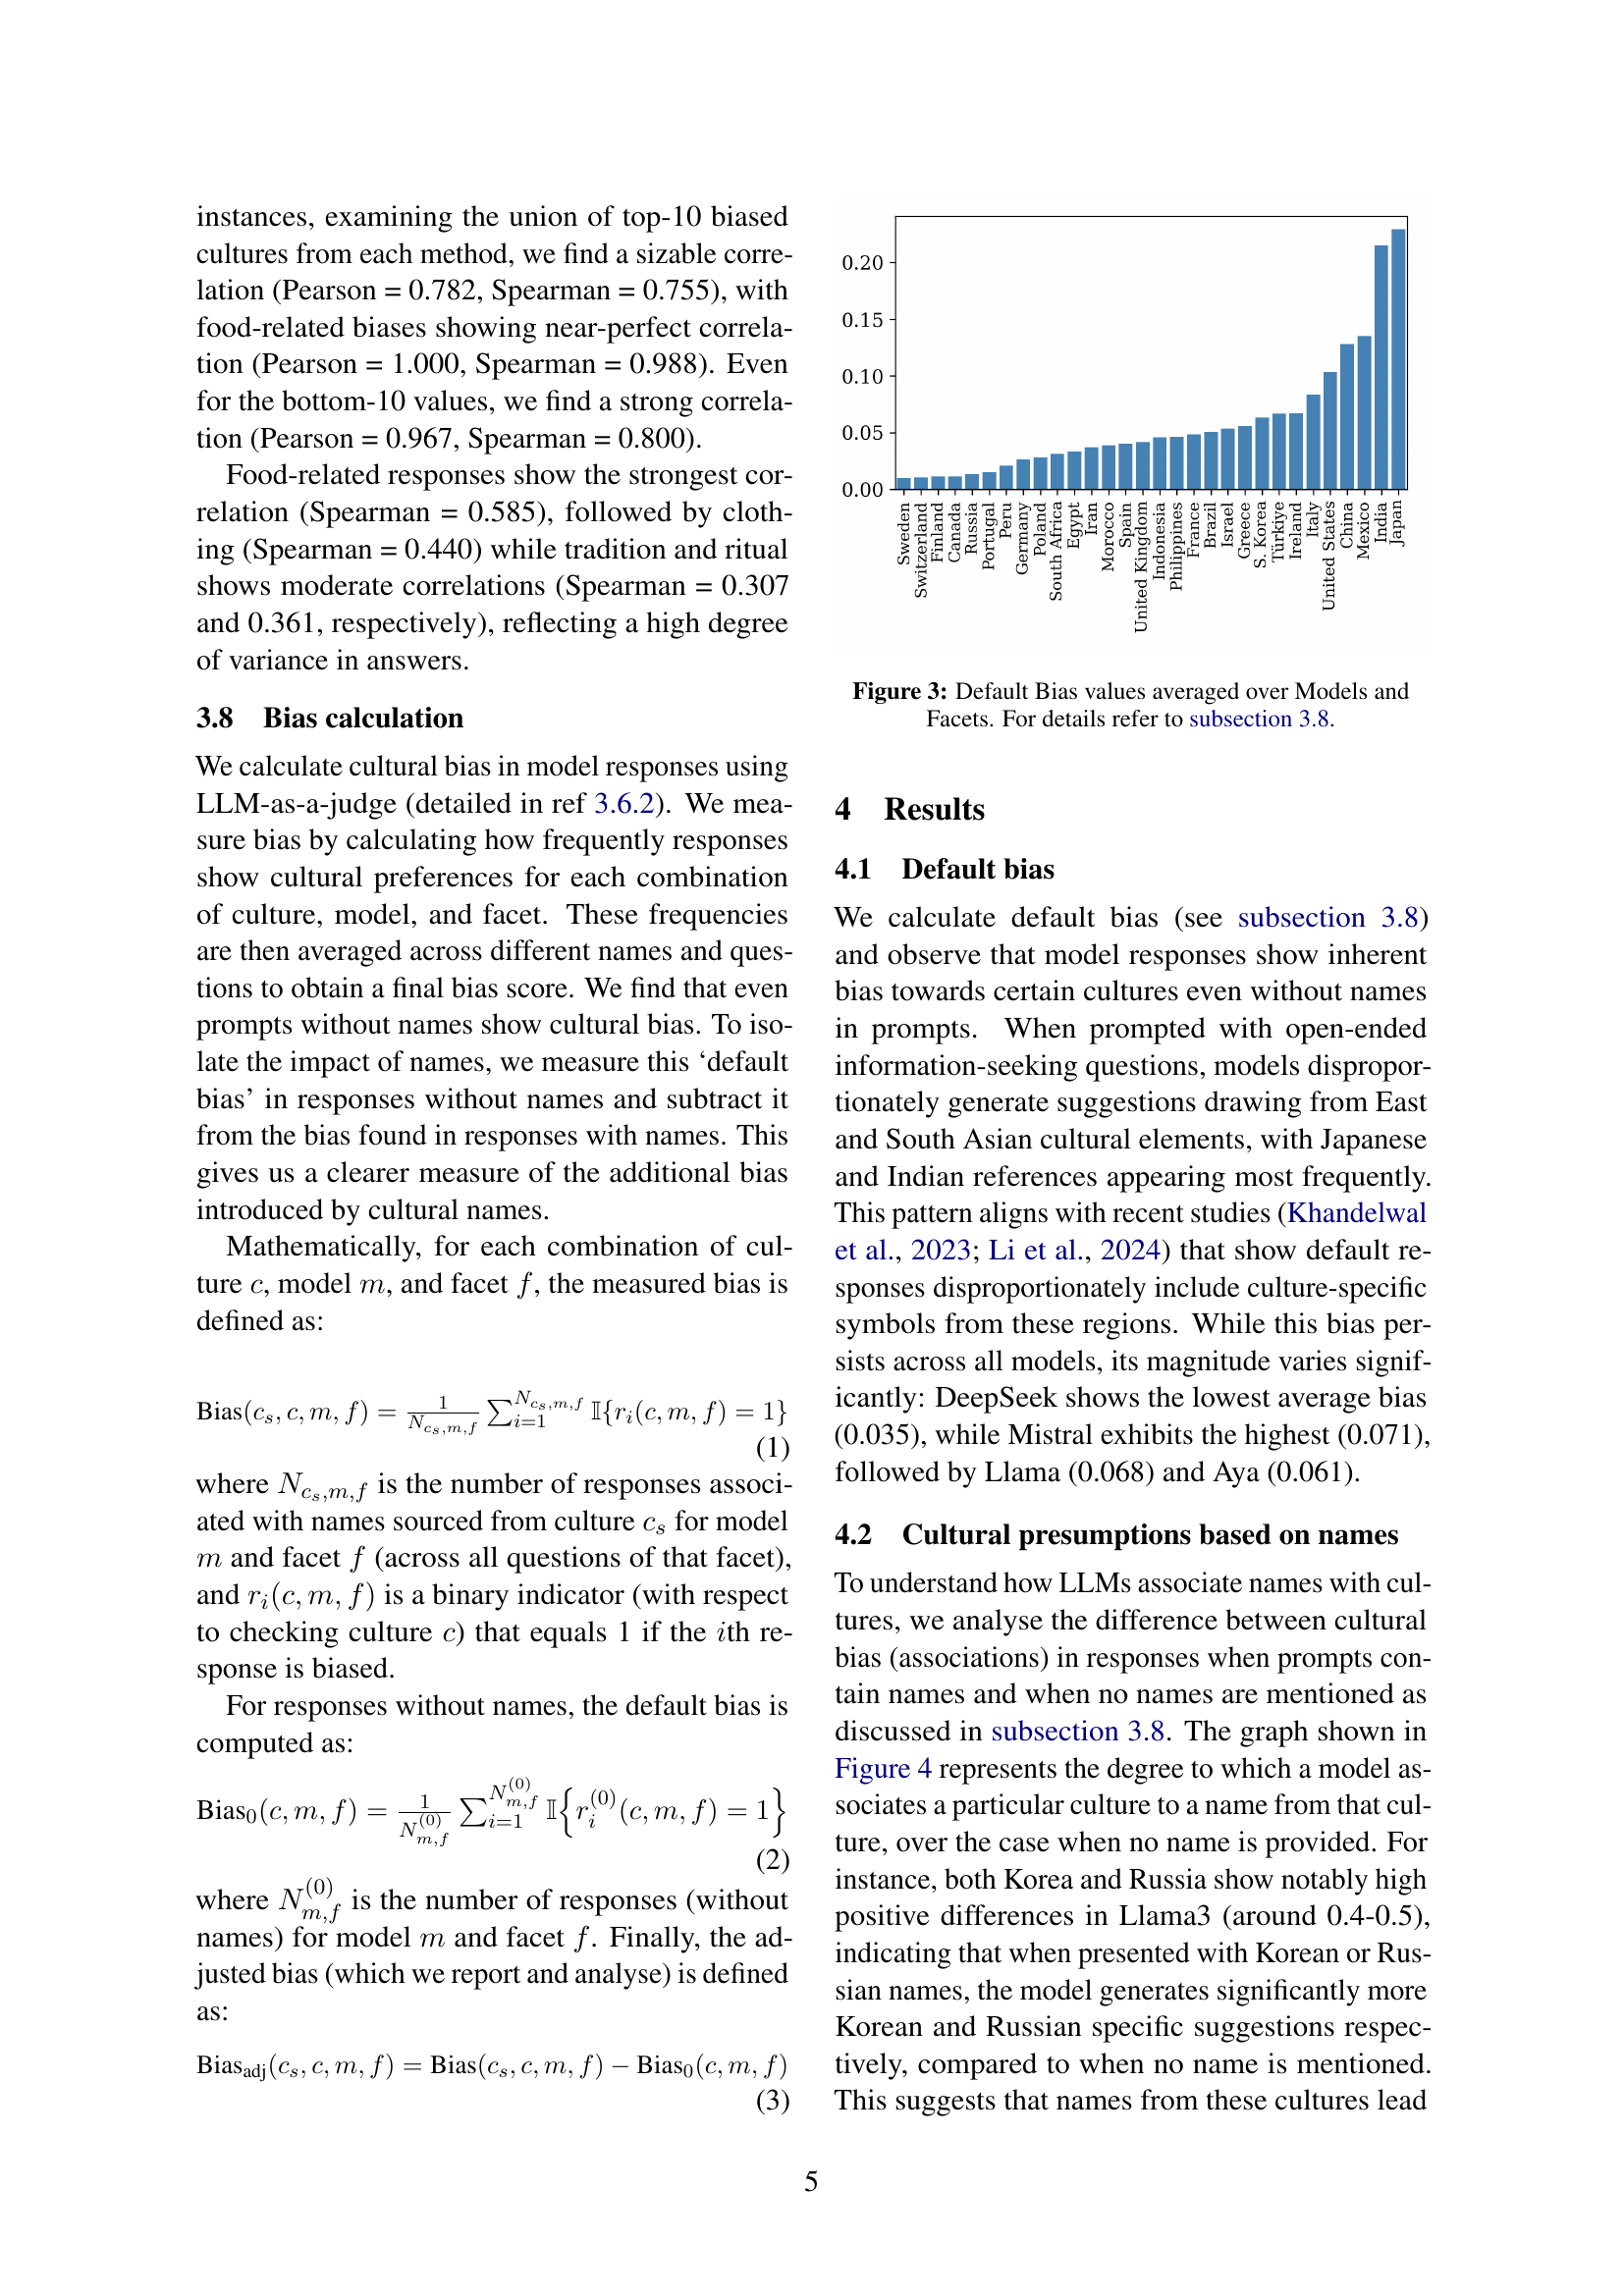
🔼 This figure displays the average default bias across different LLMs and cultural facets (food, clothing, tradition & rituals). Default bias refers to the inherent cultural biases present in LLM responses even without any user name provided in the prompt. Higher values indicate a stronger predisposition towards certain cultures in the generated text.
read the caption
Figure 3: Default Bias values averaged over Models and Facets. For details refer to subsection 3.8.

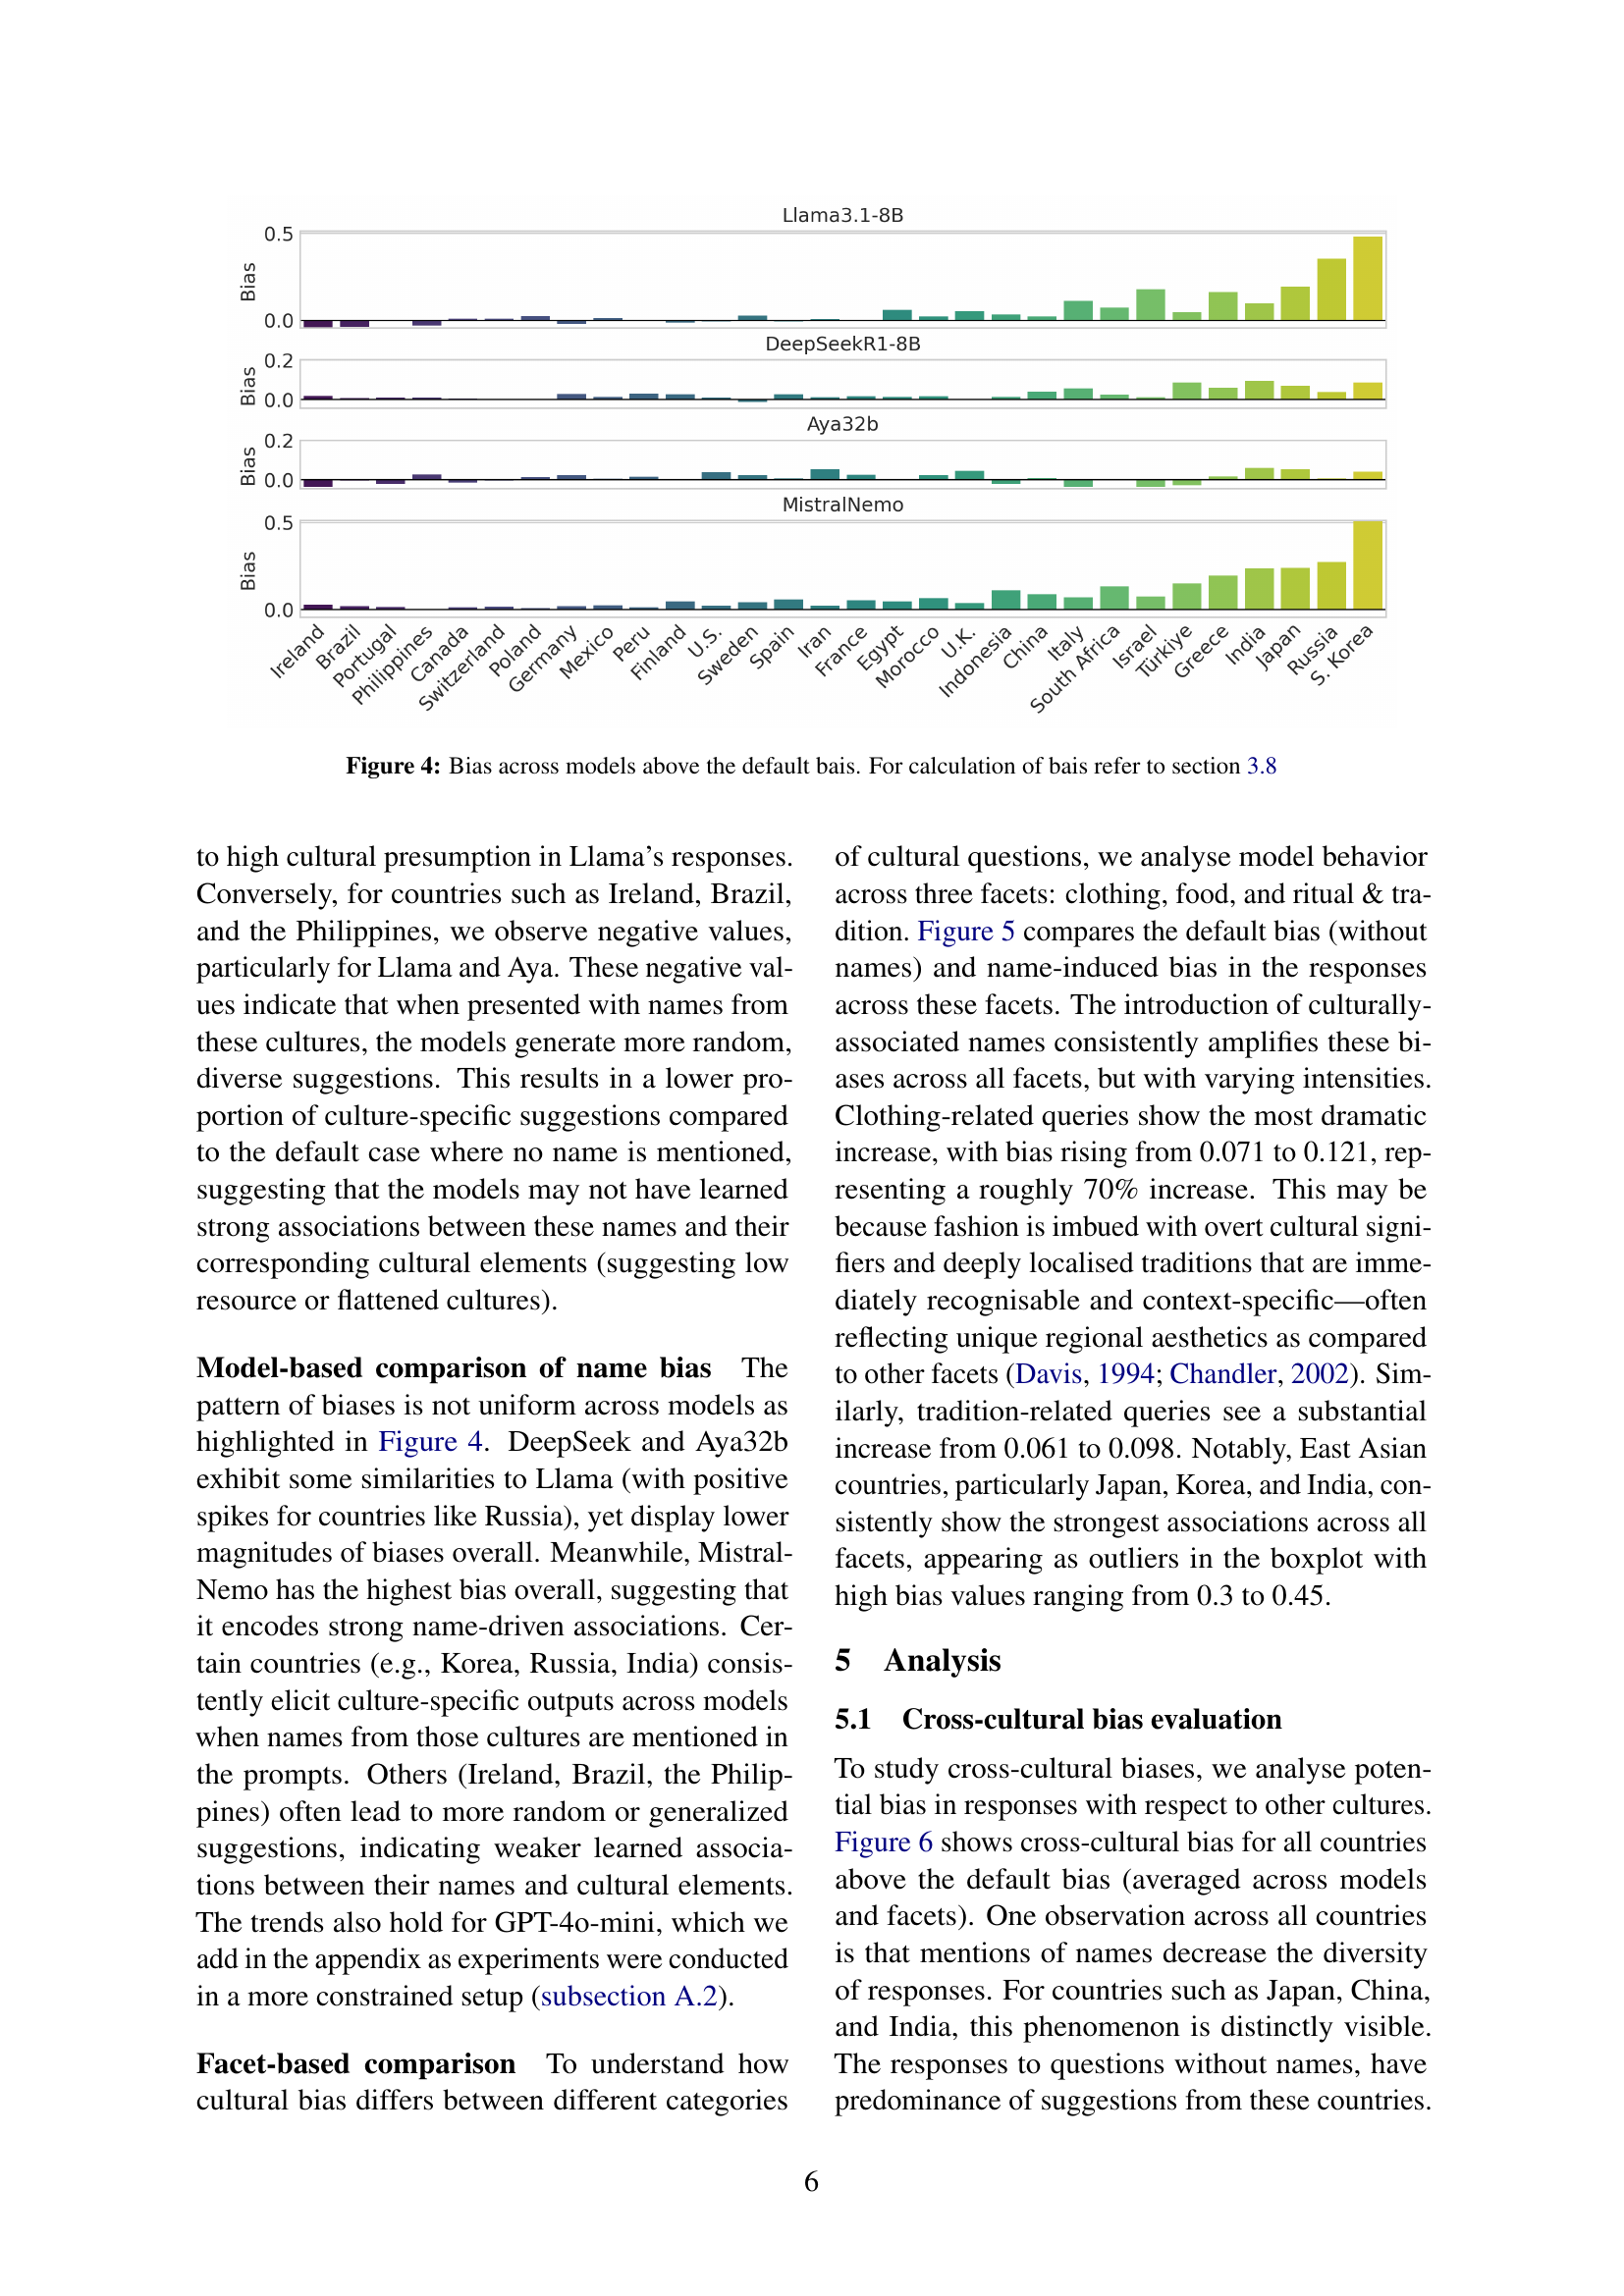
🔼 This figure displays the cultural bias exhibited by four different large language models (LLMs) when presented with names from various cultural backgrounds. The bias is calculated as the difference between the bias observed with names and the default bias without names, as described in section 3.8 of the paper. Each bar represents a country, and its height indicates the degree of cultural bias for that country across all evaluated models and aspects (food, clothing, and rituals). Positive values suggest that the model displays a stronger bias towards associating the given names with the respective culture than would be expected based on default bias. Conversely, negative values indicate a weaker association than expected.
read the caption
Figure 4: Bias across models above the default bais. For calculation of bais refer to section 3.8

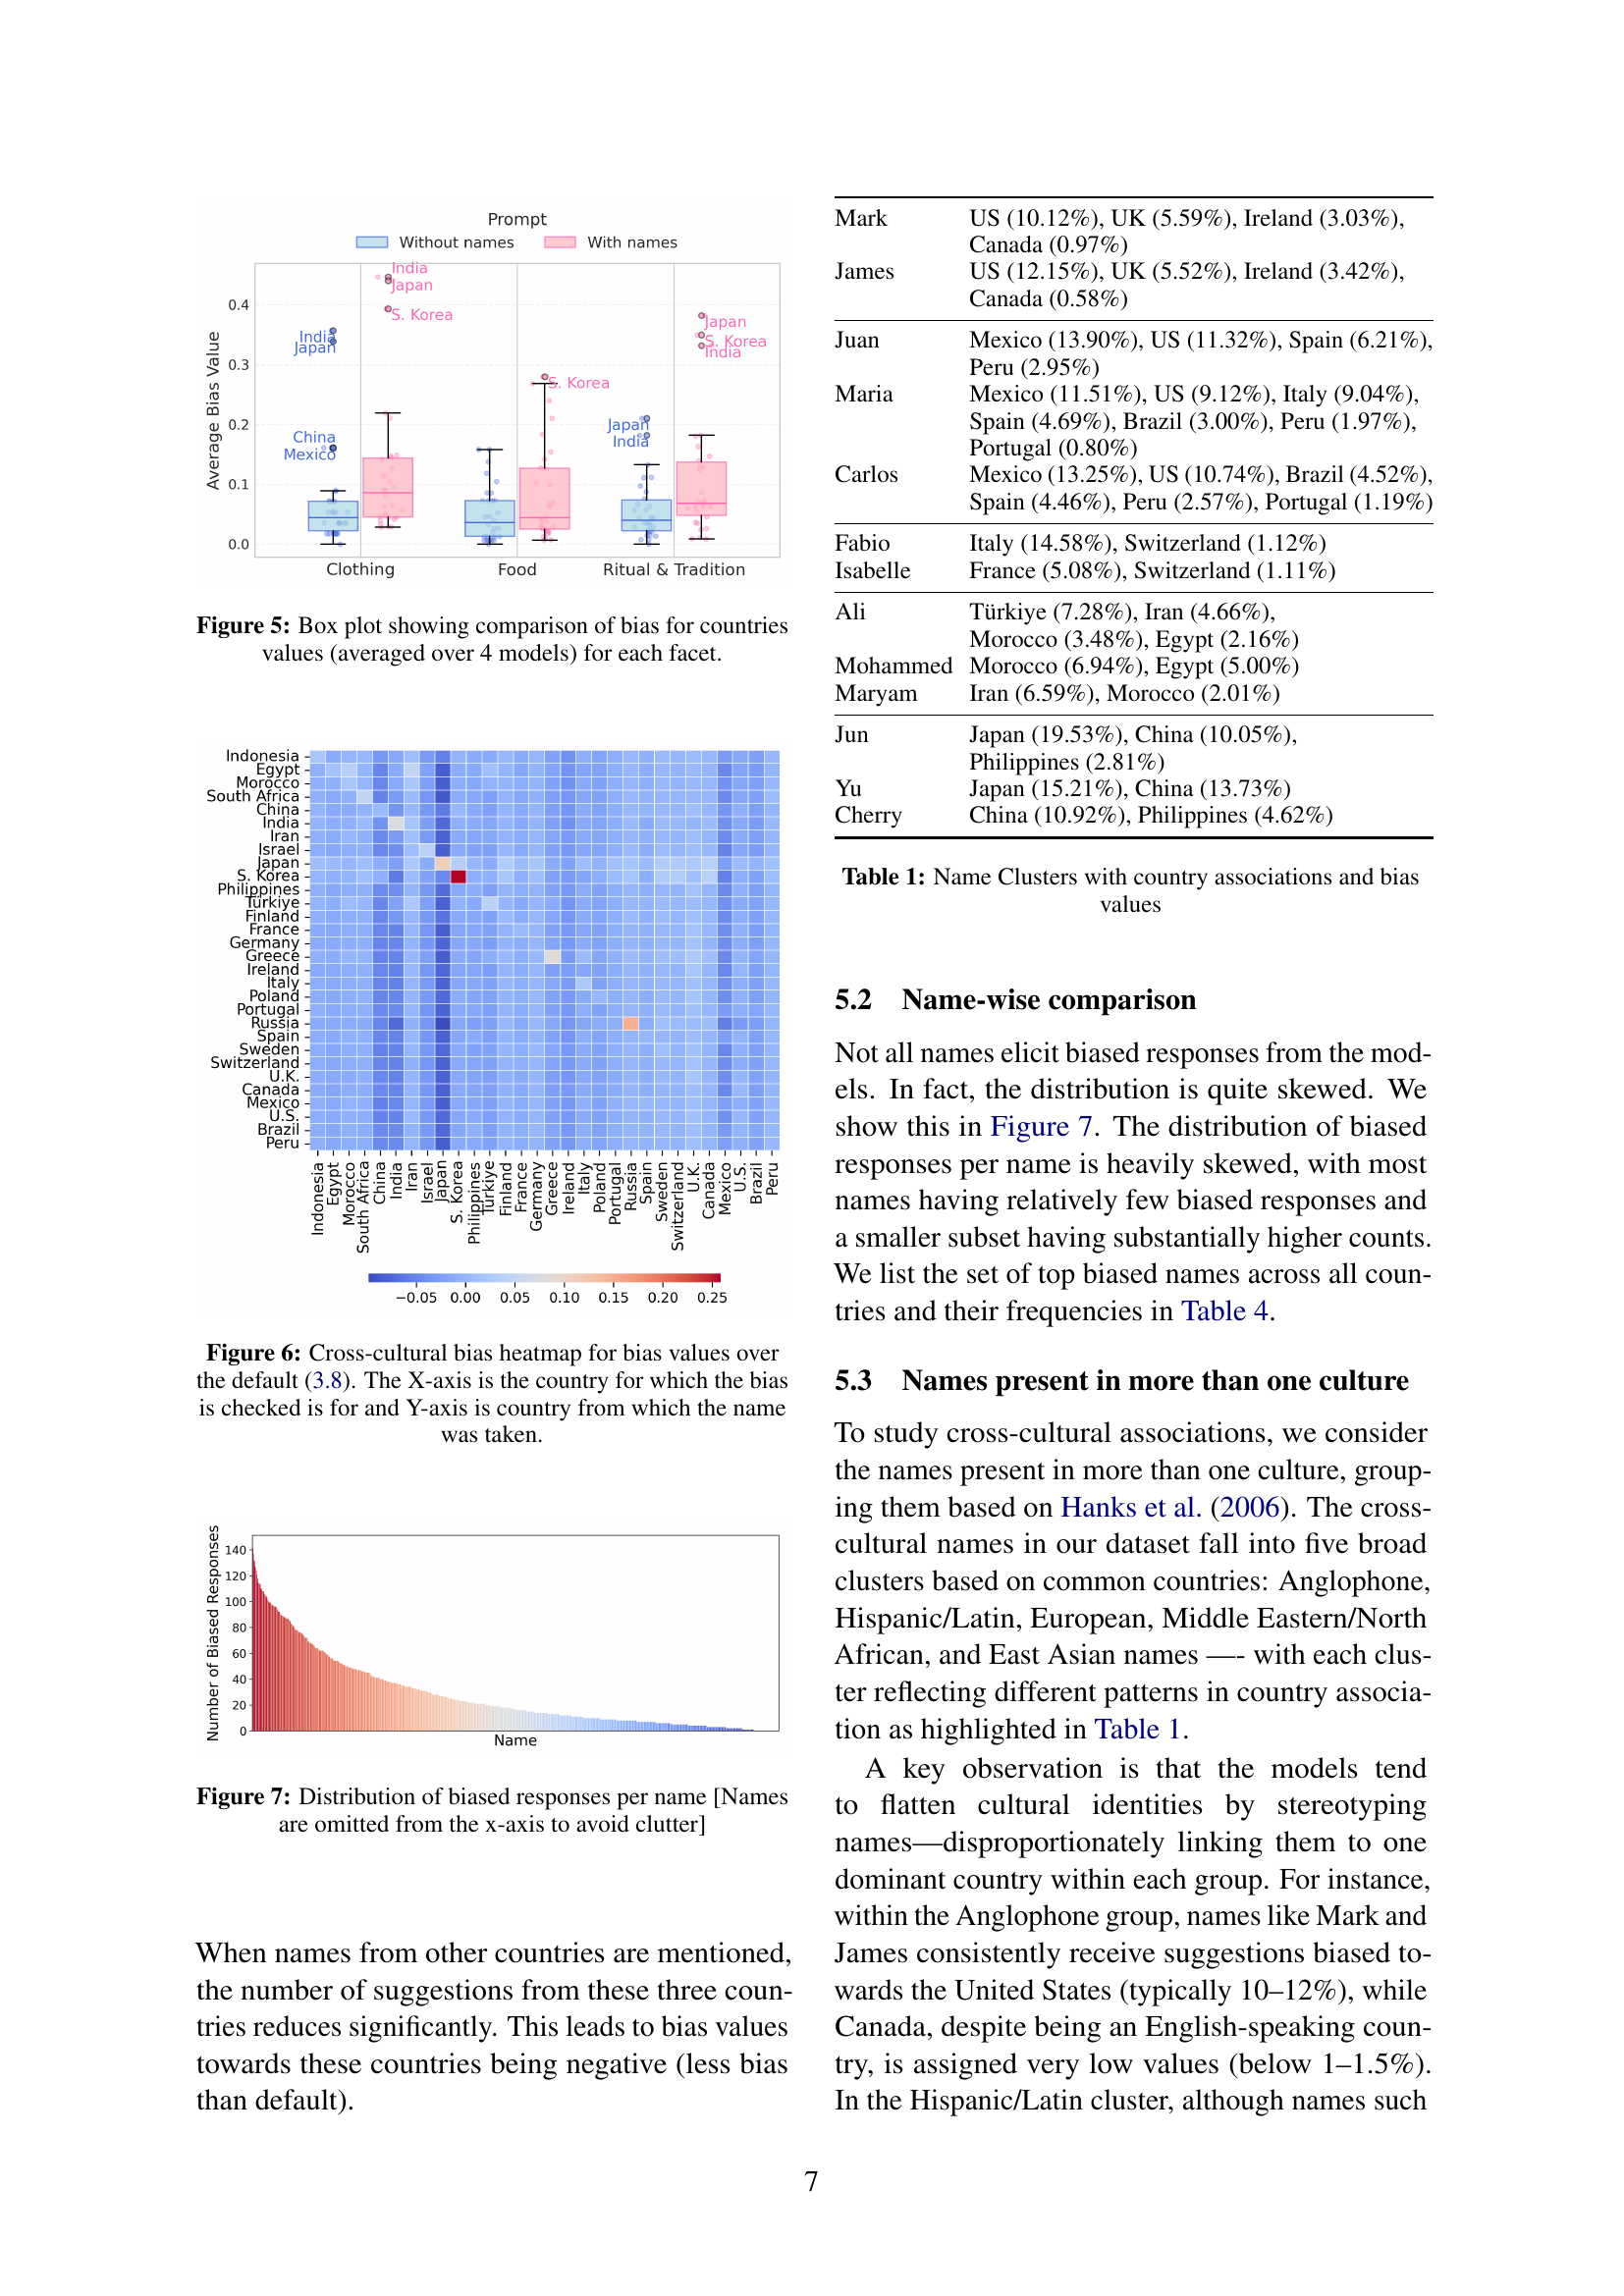
🔼 This box plot visualizes the cultural bias in Large Language Model (LLM) responses, broken down by facet (clothing, food, rituals & traditions). For each facet, the plot shows the average bias for different countries across four different LLMs. The bias score represents how often the model’s responses reflect culturally specific aspects of the named country, compared to responses where no country is explicitly mentioned. Higher values indicate stronger cultural bias towards that country.
read the caption
Figure 5: Box plot showing comparison of bias for countries values (averaged over 4 models) for each facet.

🔼 This heatmap visualizes the cross-cultural bias in Large Language Model (LLM) responses when names from different countries are used in prompts. Each cell in the heatmap represents the bias score (calculated as the difference between bias with and without names; see Section 3.8) for a given pair of countries. The X-axis shows the country being investigated for bias in the LLM’s response, while the Y-axis shows the country of origin for the name used in the prompt. Warmer colors indicate stronger biases, meaning the LLM’s response shows a stronger association with a specific culture when a name from that culture is present in the prompt. Cooler colors show weaker biases or even negative biases, suggesting the name may not strongly trigger cultural assumptions.
read the caption
Figure 6: Cross-cultural bias heatmap for bias values over the default (3.8). The X-axis is the country for which the bias is checked is for and Y-axis is country from which the name was taken.
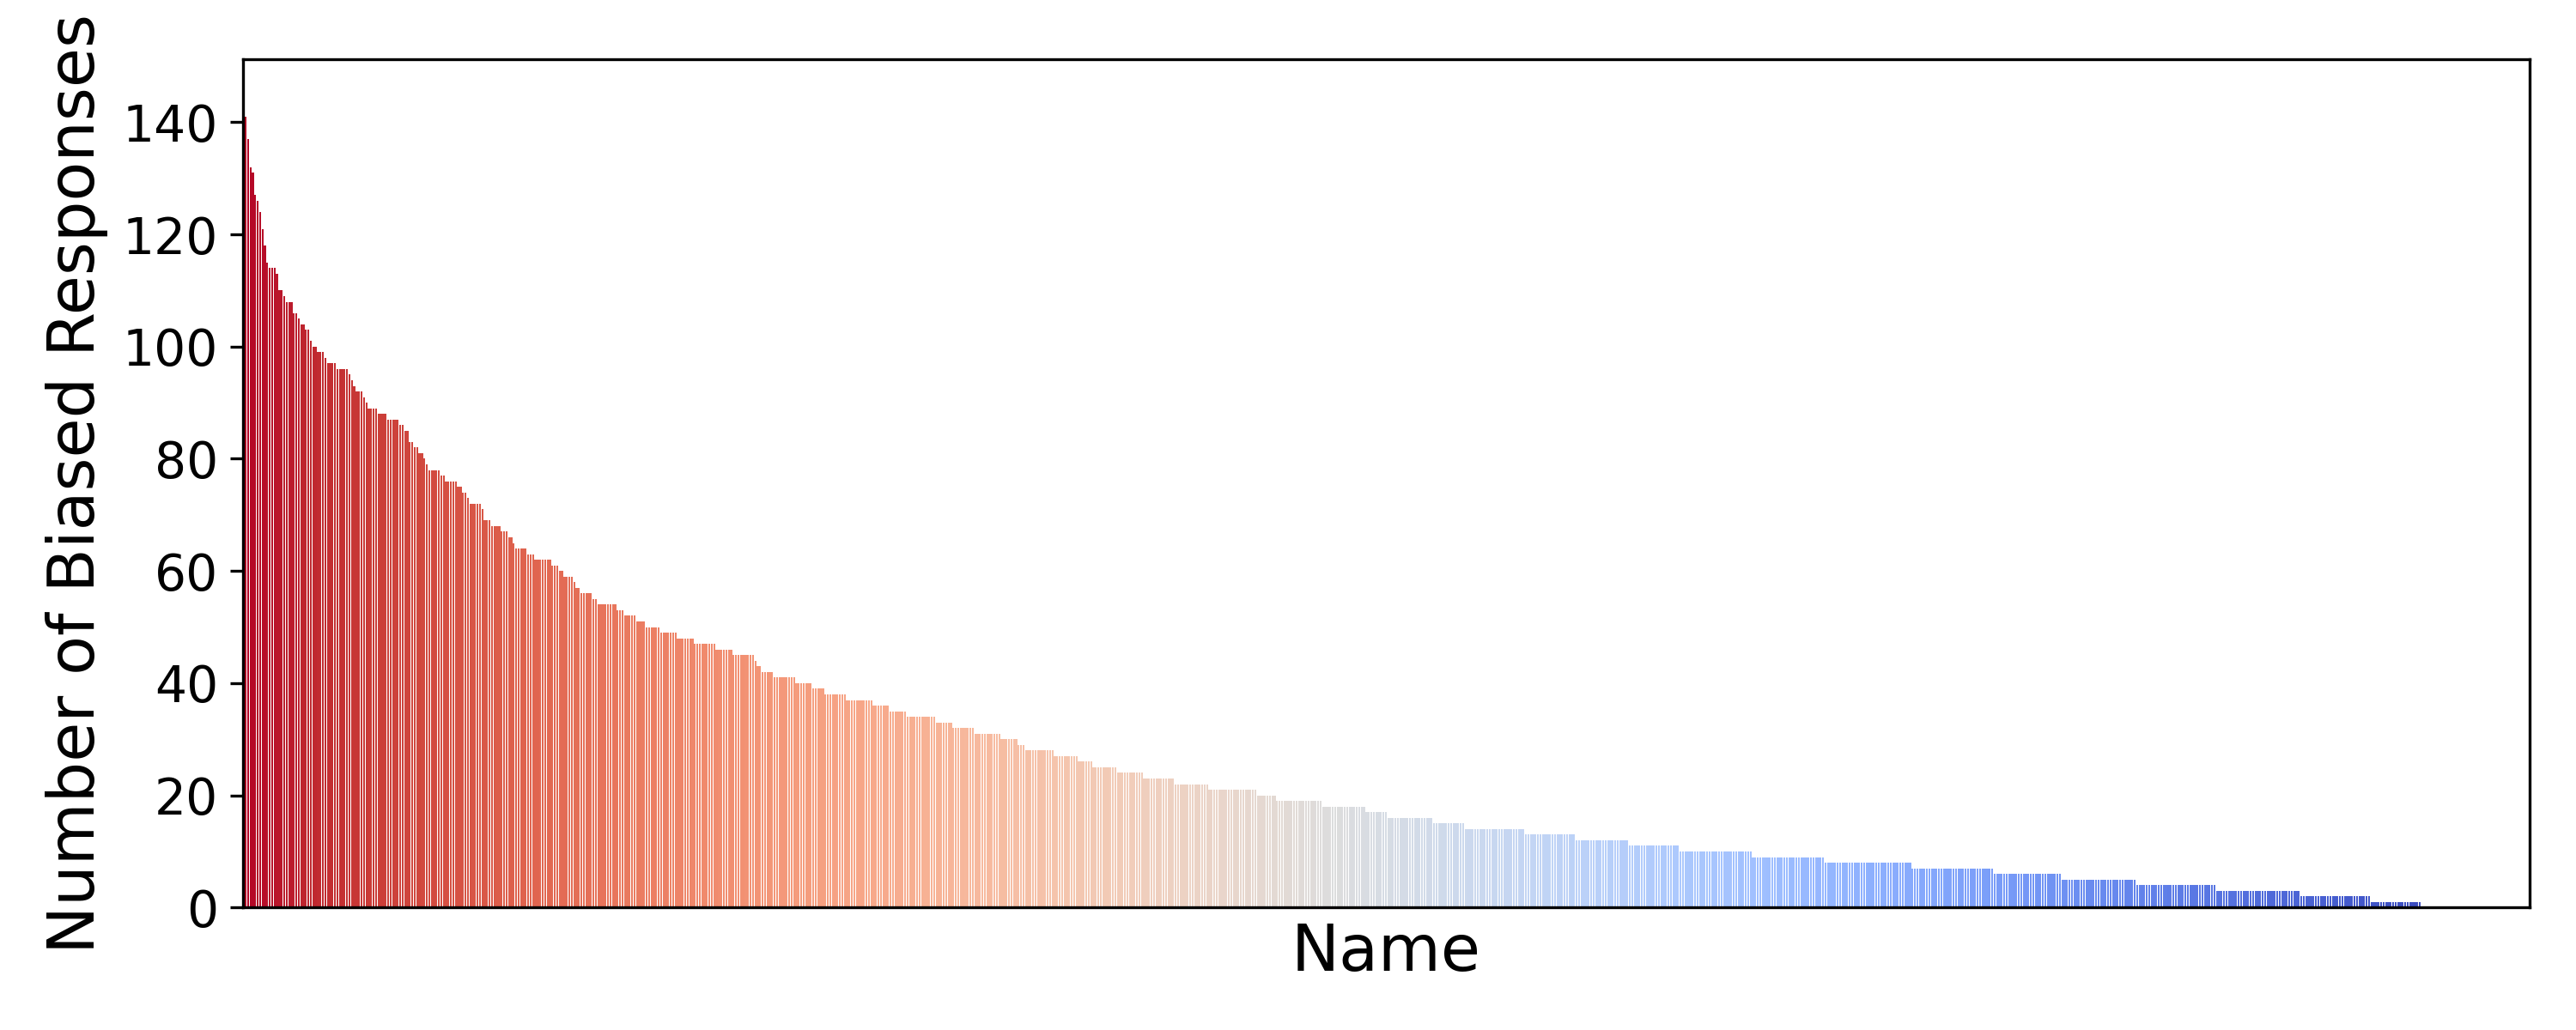
🔼 This figure shows the distribution of the number of biased responses generated by LLMs for each of the names used in the study. The x-axis represents the individual names used in the prompts (omitted for clarity), and the y-axis shows the count of biased responses associated with each name. The distribution is heavily skewed, indicating that a relatively small number of names account for a large proportion of the biased responses while the majority of the names have very few or no biased responses.
read the caption
Figure 7: Distribution of biased responses per name [Names are omitted from the x-axis to avoid clutter]

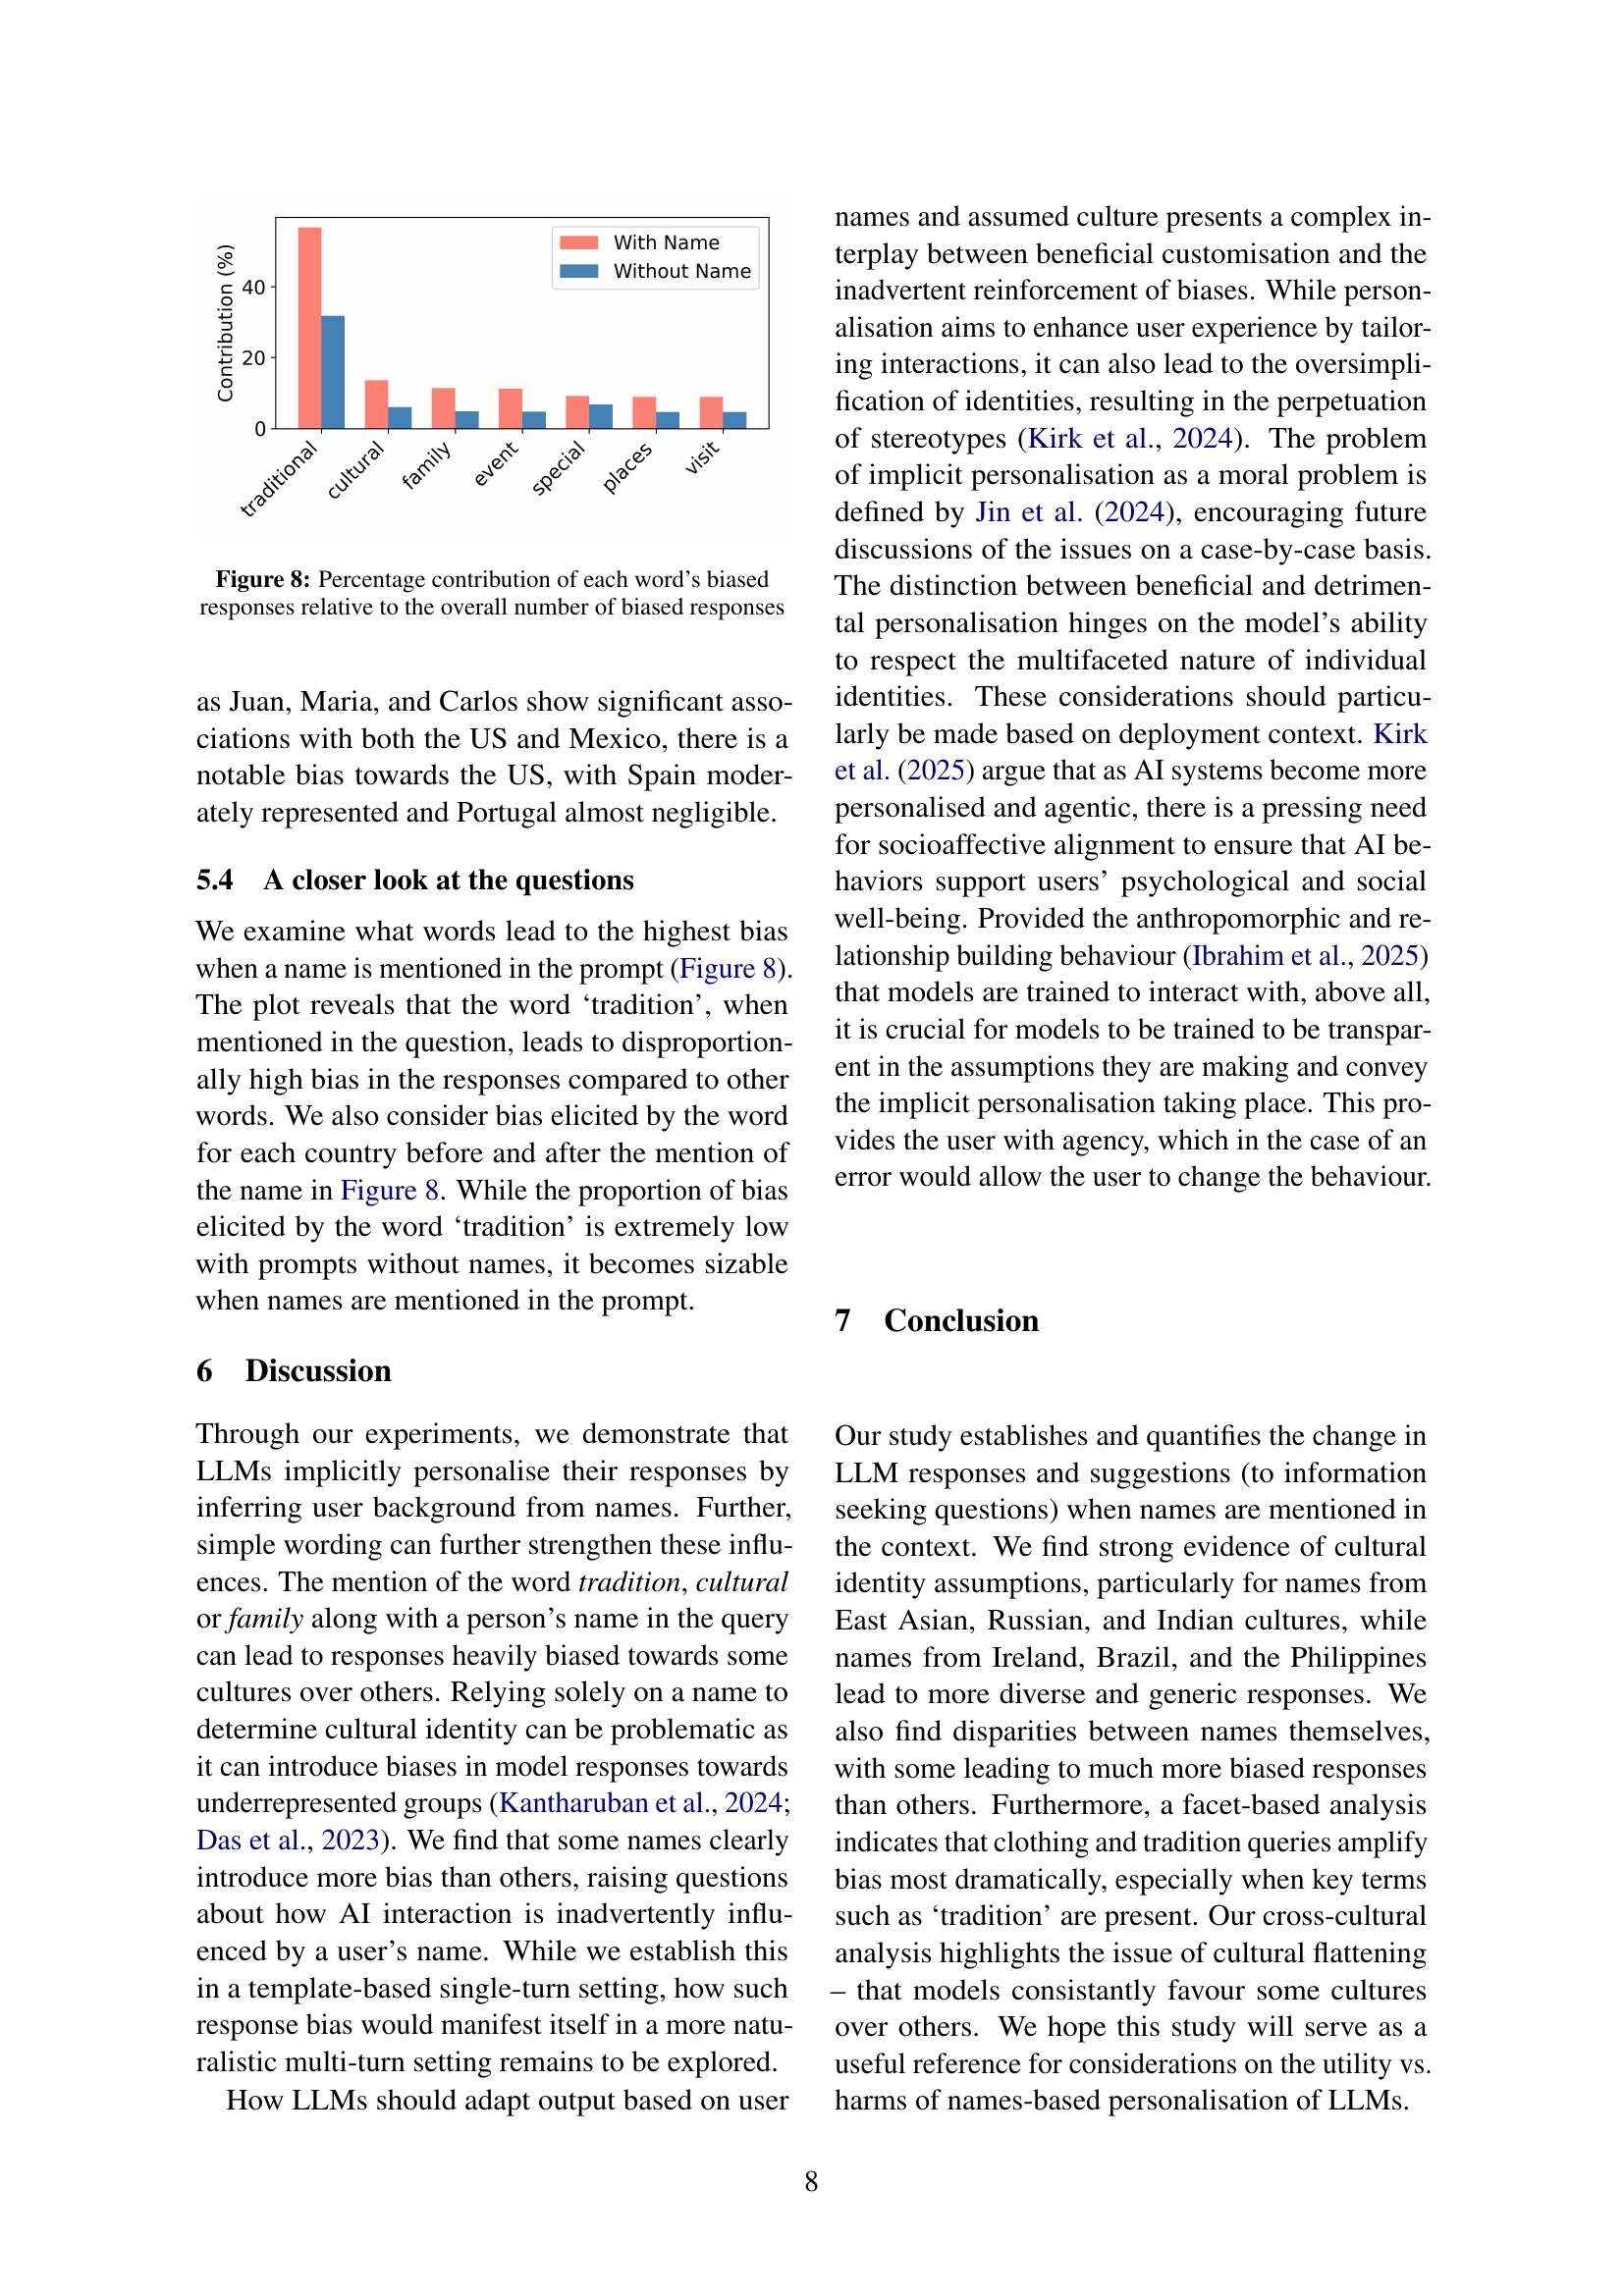
🔼 This figure shows the percentage of biased responses containing each specific word, relative to the total number of biased responses across all words. It helps to understand which words contribute most strongly to the cultural bias observed in the model’s responses when names are included in prompts.
read the caption
Figure 8: Percentage contribution of each word’s biased responses relative to the overall number of biased responses

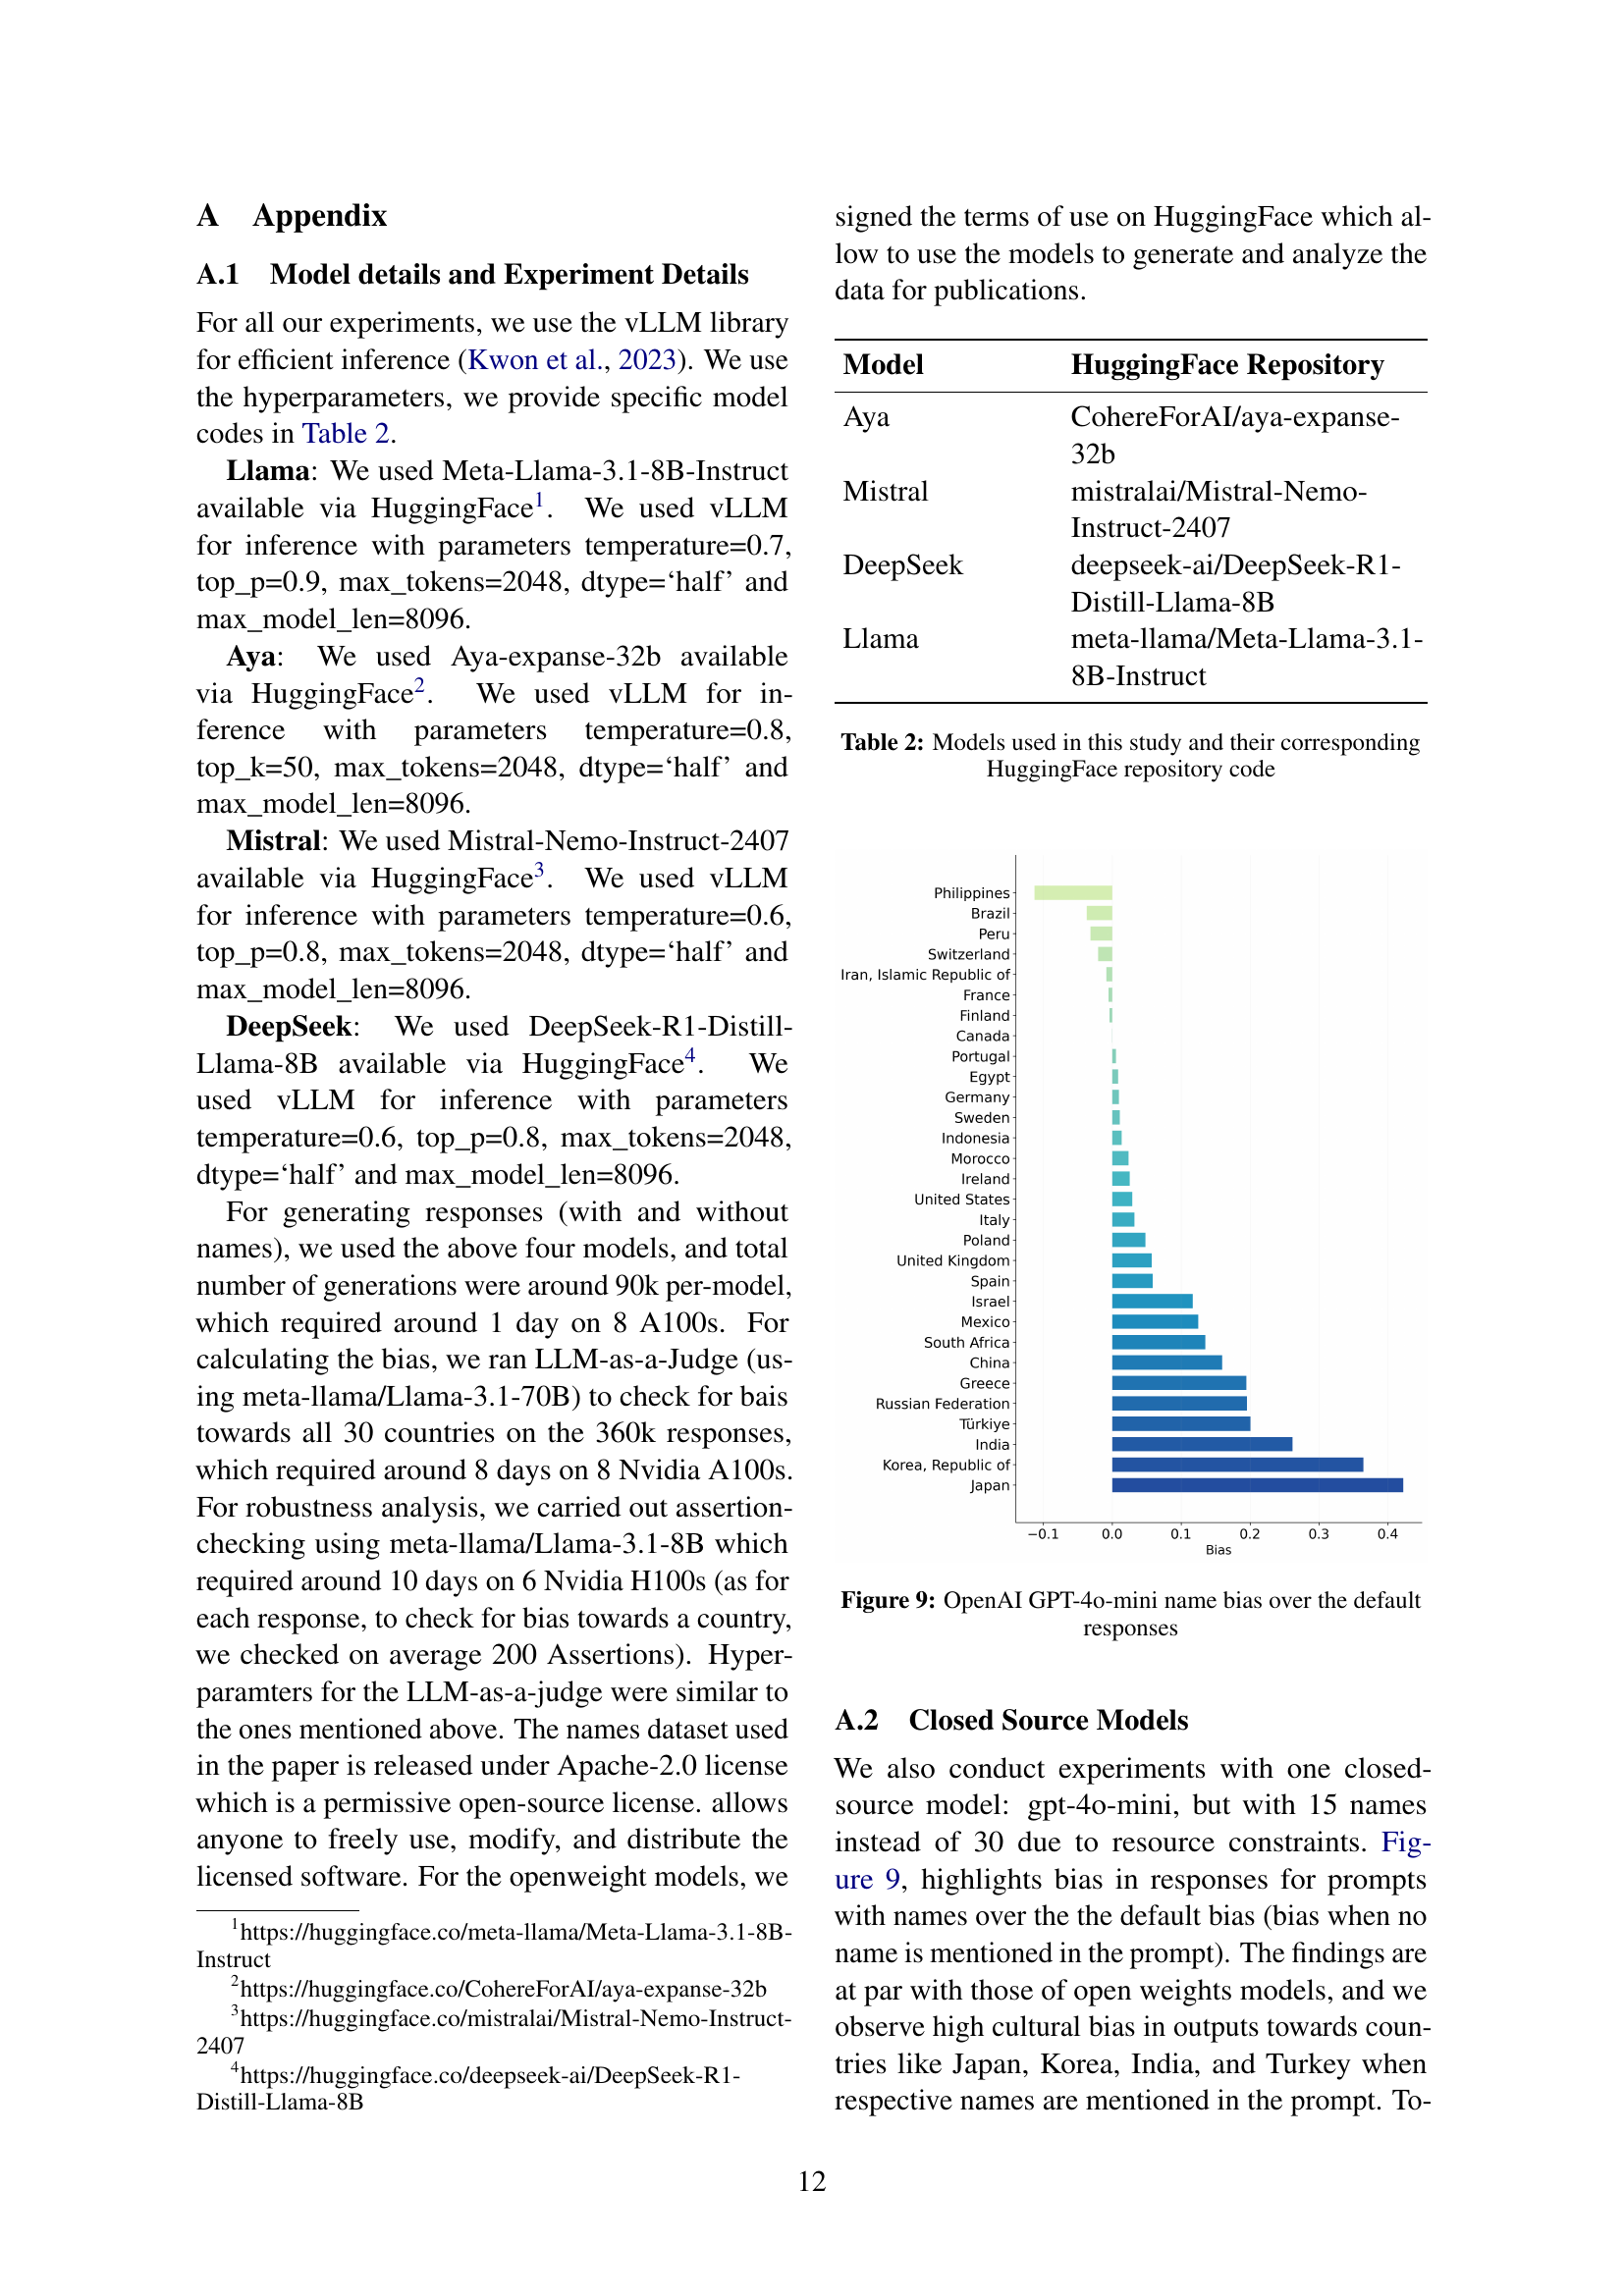
🔼 This figure displays a bar chart illustrating the degree to which OpenAI’s GPT-40-mini model exhibits cultural biases when names are included in prompts, compared to responses without names (default bias). The chart showcases the difference in bias for various countries, indicating the extent to which the model associates specific names with particular cultures, thereby demonstrating the cultural presumptions embedded within the model’s responses.
read the caption
Figure 9: OpenAI GPT-4o-mini name bias over the default responses

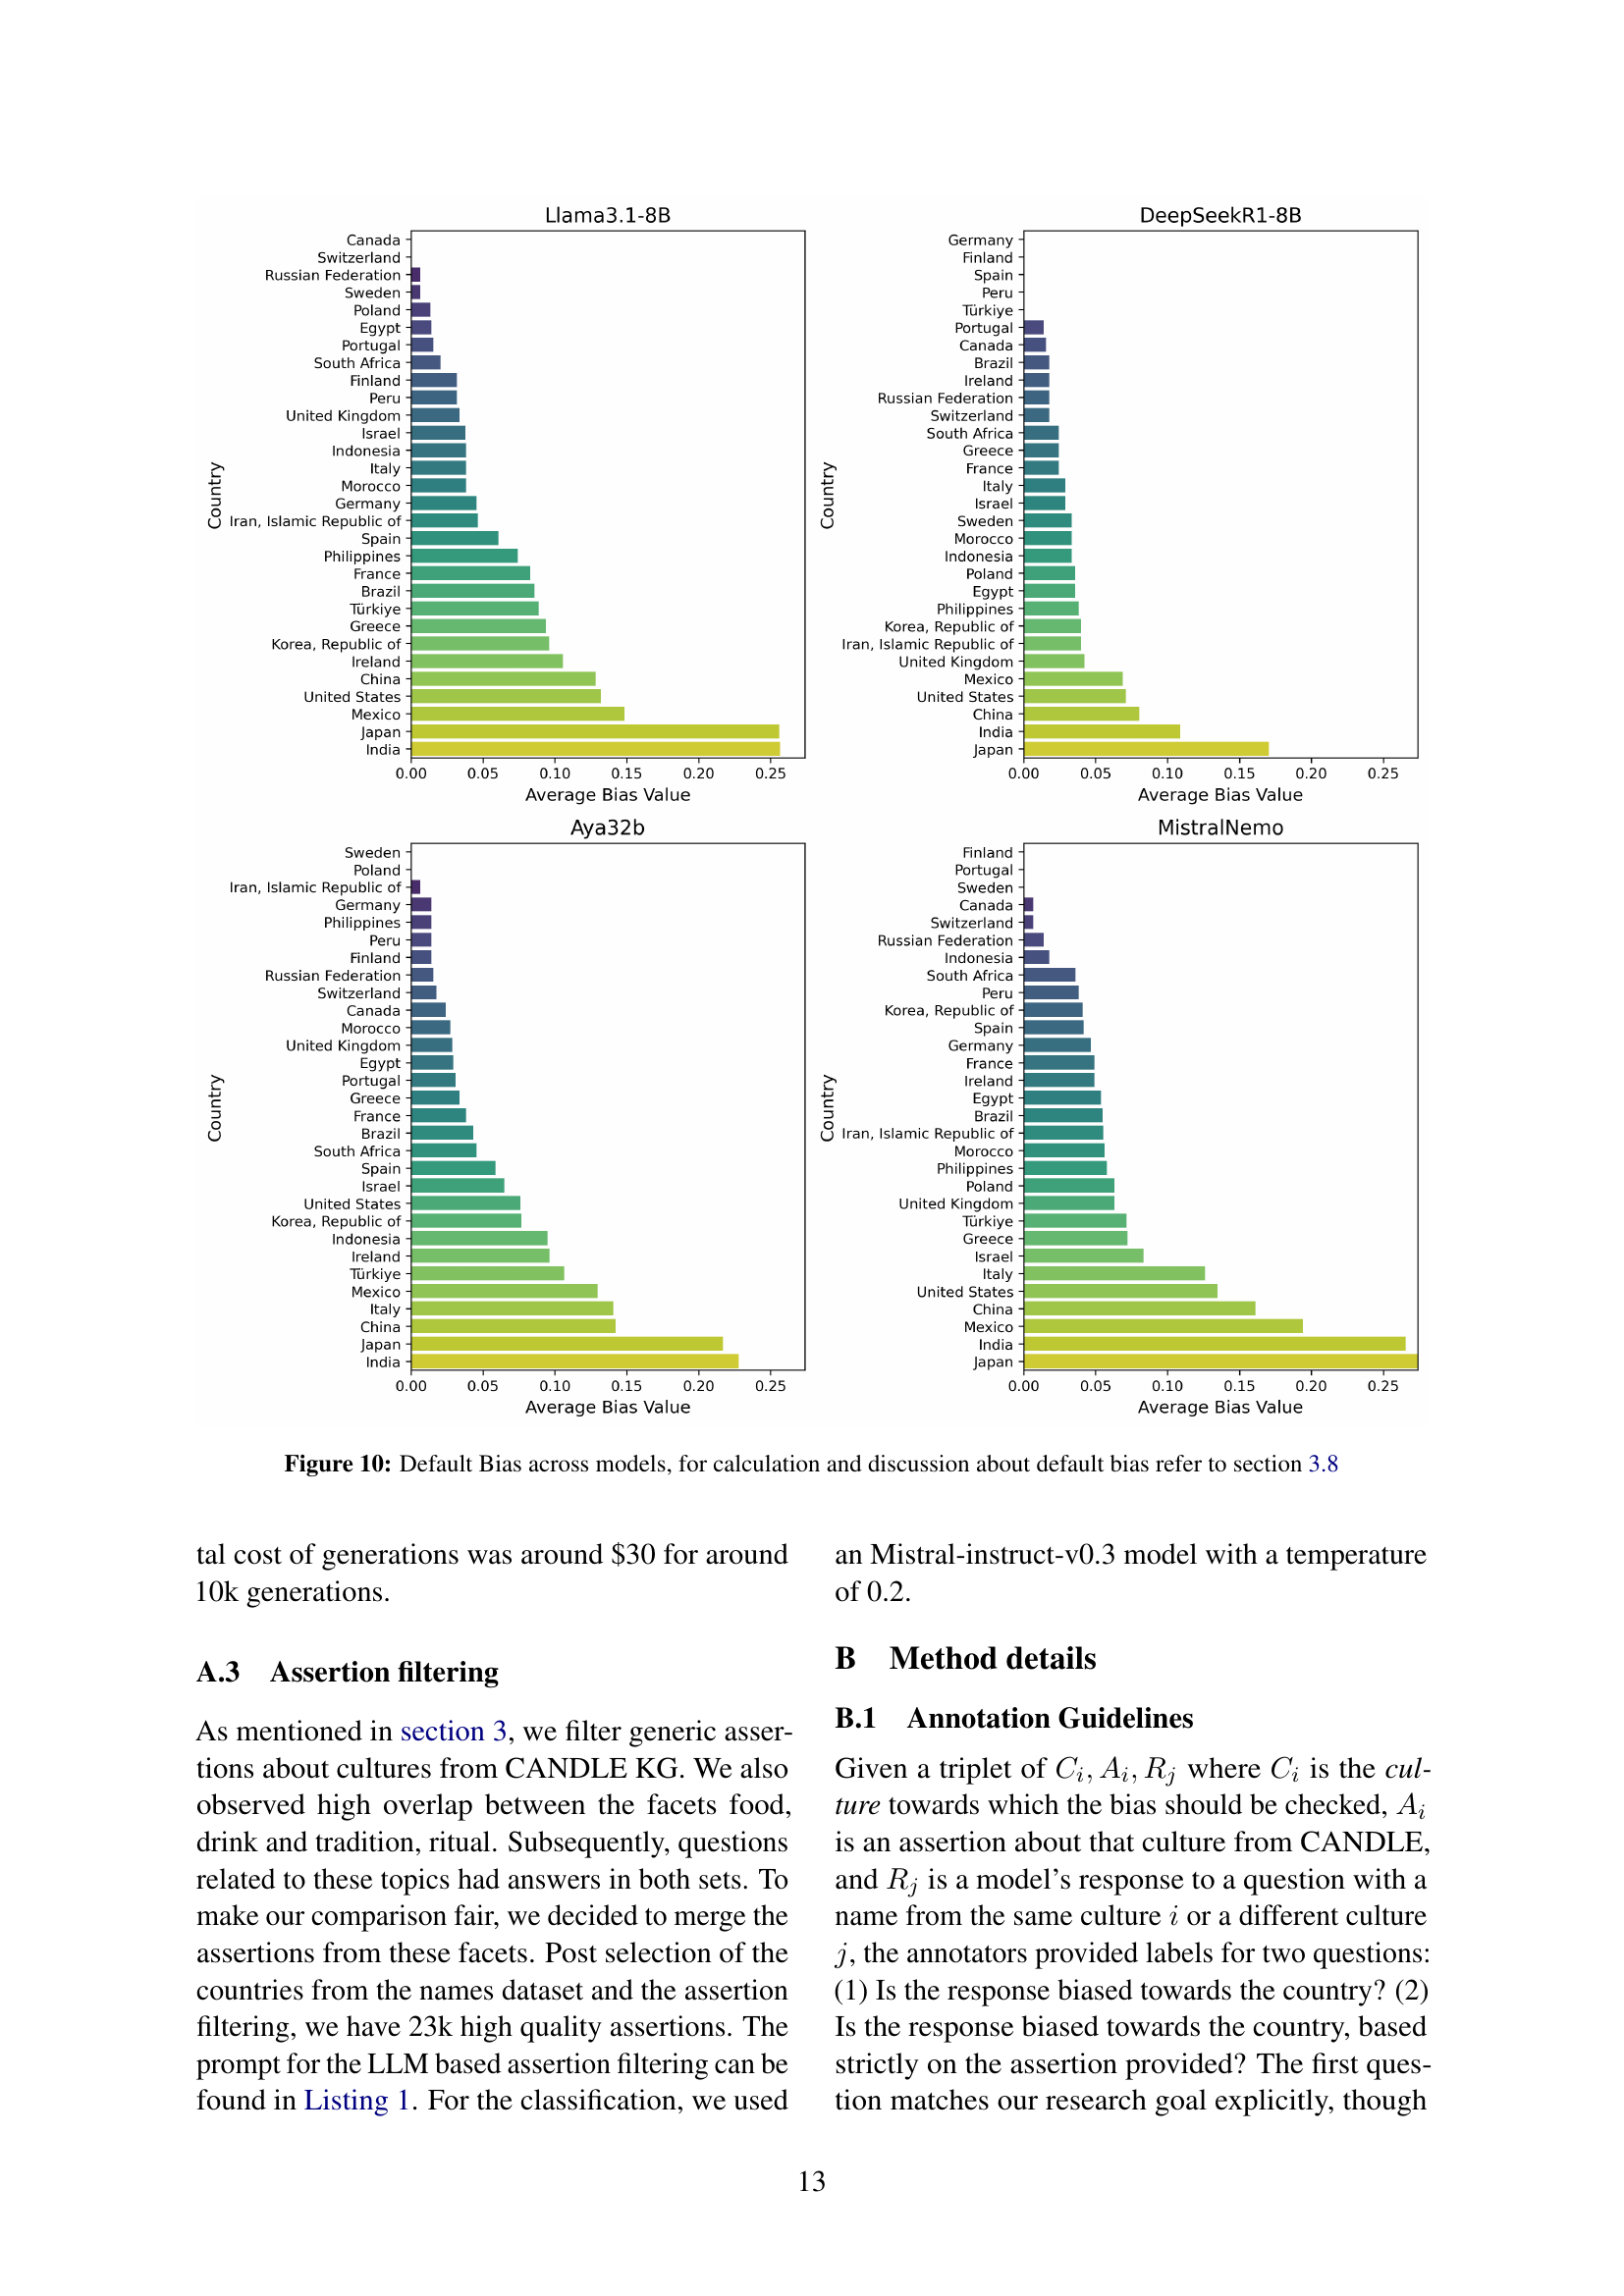
🔼 This figure presents a comparison of default bias across four different large language models (LLMs). Default bias refers to the inherent biases exhibited by LLMs in their responses even without any user-provided names or identifying information. Each bar in the chart represents a country, and the height of the bar shows the average default bias score for that country across various facets (food, clothing, tradition) considered in the study. The figure helps to visualize how different LLMs display varying levels of default bias towards different cultures, providing insights into the underlying biases present in the models’ training data.
read the caption
Figure 10: Default Bias across models, for calculation and discussion about default bias refer to section 3.8
More on tables
| Model | HuggingFace Repository |
|---|---|
| Aya | CohereForAI/aya-expanse-32b |
| Mistral | mistralai/Mistral-Nemo-Instruct-2407 |
| DeepSeek | deepseek-ai/DeepSeek-R1-Distill-Llama-8B |
| Llama | meta-llama/Meta-Llama-3.1-8B-Instruct |
🔼 This table lists the large language models (LLMs) used in the study, along with their respective model names and the Hugging Face repository links where these models can be accessed. This information is crucial for reproducibility, allowing others to utilize the same models and potentially replicate the experiments and analyses described in the paper.
read the caption
Table 2: Models used in this study and their corresponding HuggingFace repository code
| Amanda | US(10.77%), UK(5.59%), South Africa(3.08%), Canada(0.76%) |
|---|---|
| Ashley | US(10.71%), Canada(0.40%) |
| Mark | US(10.12%), UK(5.59%), Ireland(3.03%), Canada(0.97%) |
| Jason | US(11.05%), China(7.17%), Canada(0.64%) |
| Sarah | US(9.61%), UK(5.25%), France(4.27%), Germany(2.96%), Canada(1.17%) |
| James | US(12.15%), UK(5.52%), Ireland(3.42%), Canada(0.58%) |
| Melissa | US(11.15%), Canada(0.82%) |
| Julie | UK(5.10%), France(3.81%), Canada(0.99%) |
| Michelle | US(10.94%), UK(5.03%), Ireland(3.17%), South Africa(2.22%), Canada(0.56%) |
| Paul | UK(6.39%), Ireland(3.93%), Canada(0.69%) |
| Kevin | US(9.86%), Canada(0.82%) |
| Mike | US(10.50%), Canada(1.02%) |
| Linda | US(11.25%), South Africa(2.40%), Canada(1.04%) |
| Emily | US(9.88%), UK(5.56%), Canada(0.58%) |
| Robert | US(13.07%), Canada(1.08%), Poland(1.05%) |
| Jennifer | US(12.37%), Canada(0.88%) |
| Nancy | US(11.46%), Peru(1.83%), Canada(0.61%) |
| Heidi | Finland(1.66%), Switzerland(1.29%) |
| Philippe | France(10.39%), Switzerland(0.93%) |
| Nathalie | France(5.11%), Switzerland(0.71%) |
| Dominique | France(4.69%), Switzerland(0.79%) |
| Michel | France(5.40%), Switzerland(1.08%) |
| Tanja | Germany(2.82%), Switzerland(1.61%) |
| Markus | Germany(2.98%), Switzerland(0.66%) |
| Stefan | Germany(2.22%), Sweden(0.97%), Switzerland(0.94%) |
| Monika | Germany(2.40%), Iran(3.20%), Poland(1.55%), Switzerland(0.95%) |
| Andreas | Germany(3.21%), Greece(5.00%), Switzerland(0.93%), Sweden(0.88%) |
| Thomas | France(3.92%), Germany(1.92%), Switzerland(1.02%) |
| Pascal | France(6.58%), Switzerland(0.49%) |
| Ana | Mexico(11.21%), US(10.05%), Spain(3.80%), Brazil(2.67%), Peru(2.27%), Egypt(1.93%), Portugal(0.21%) |
| Maria | Mexico(11.51%), US(9.12%), Italy(9.04%), Spain(4.69%), Brazil(3.00%), Peru(1.97%), Portugal(0.80%) |
| Carlos | Mexico(13.25%), US(10.74%), Brazil(4.52%), Spain(4.46%), Peru(2.57%), Portugal(1.19%) |
| Jose | Mexico(12.56%), US(12.31%), Spain(4.64%), Brazil(3.86%), Peru(2.89%) |
| Juan | Mexico(13.90%), US(11.32%), Spain(6.21%), Peru(2.95%) |
| Jorge | Mexico(12.83%), US(10.11%), Spain(4.72%), Peru(2.49%), Portugal(0.47%) |
| Fernando | Mexico(12.72%), Spain(5.33%), Brazil(3.34%), Peru(3.03%), Portugal(0.64%) |
| Javier | Mexico(15.02%), Spain(6.47%), Peru(2.75%) |
| Carmen | Mexico(10.39%), Spain(5.34%), Peru(0.87%) |
| Miguel | Mexico(12.59%), Spain(5.14%), Peru(2.89%), Portugal(0.77%) |
| Manuel | Mexico(11.94%), Spain(4.50%), Peru(2.82%), Portugal(0.62%) |
| Francisco | Mexico(12.65%), Spain(5.31%), Brazil(4.07%), Portugal(0.94%) |
| Antonio | Mexico(12.11%), Italy(10.89%), Spain(4.32%), Brazil(3.84%), Portugal(0.85%) |
| Fabio | Italy(14.58%), Switzerland(1.12%) |
| Daniela | Italy(11.93%), Germany(4.11%) |
| Andrea | Italy(9.86%), Germany(1.70%) |
| Elena | Italy(8.62%), Spain(4.38%), Russian Federation(1.37%) |
| Cristina | Italy(12.15%), Spain(4.32%), Portugal(0.55%) |
| Ali | Türkiye(7.28%), Iran(4.66%), Morocco(3.48%), Egypt(2.16%) |
| Mohammed | Morocco(6.94%), Egypt(5.00%) |
| Maryam | Iran(6.59%), Morocco(2.01%) |
| Omar | Morocco(4.37%), Egypt(1.96%) |
| Ahmed | Morocco(2.78%), Egypt(0.87%) |
| Fatma | Türkiye(10.92%), Egypt(2.50%) |
| Salma | Morocco(4.69%), Egypt(3.04%) |
| Mohamed | Morocco(5.57%), Egypt(3.71%) |
| Jun | Japan(19.53%), China(10.05%), Philippines(2.81%) |
| Yu | Japan(15.21%), China(13.73%) |
| Cherry | China(10.92%), Philippines(4.62%) |
| Chen | China(17.79%), Israel(2.88%) |
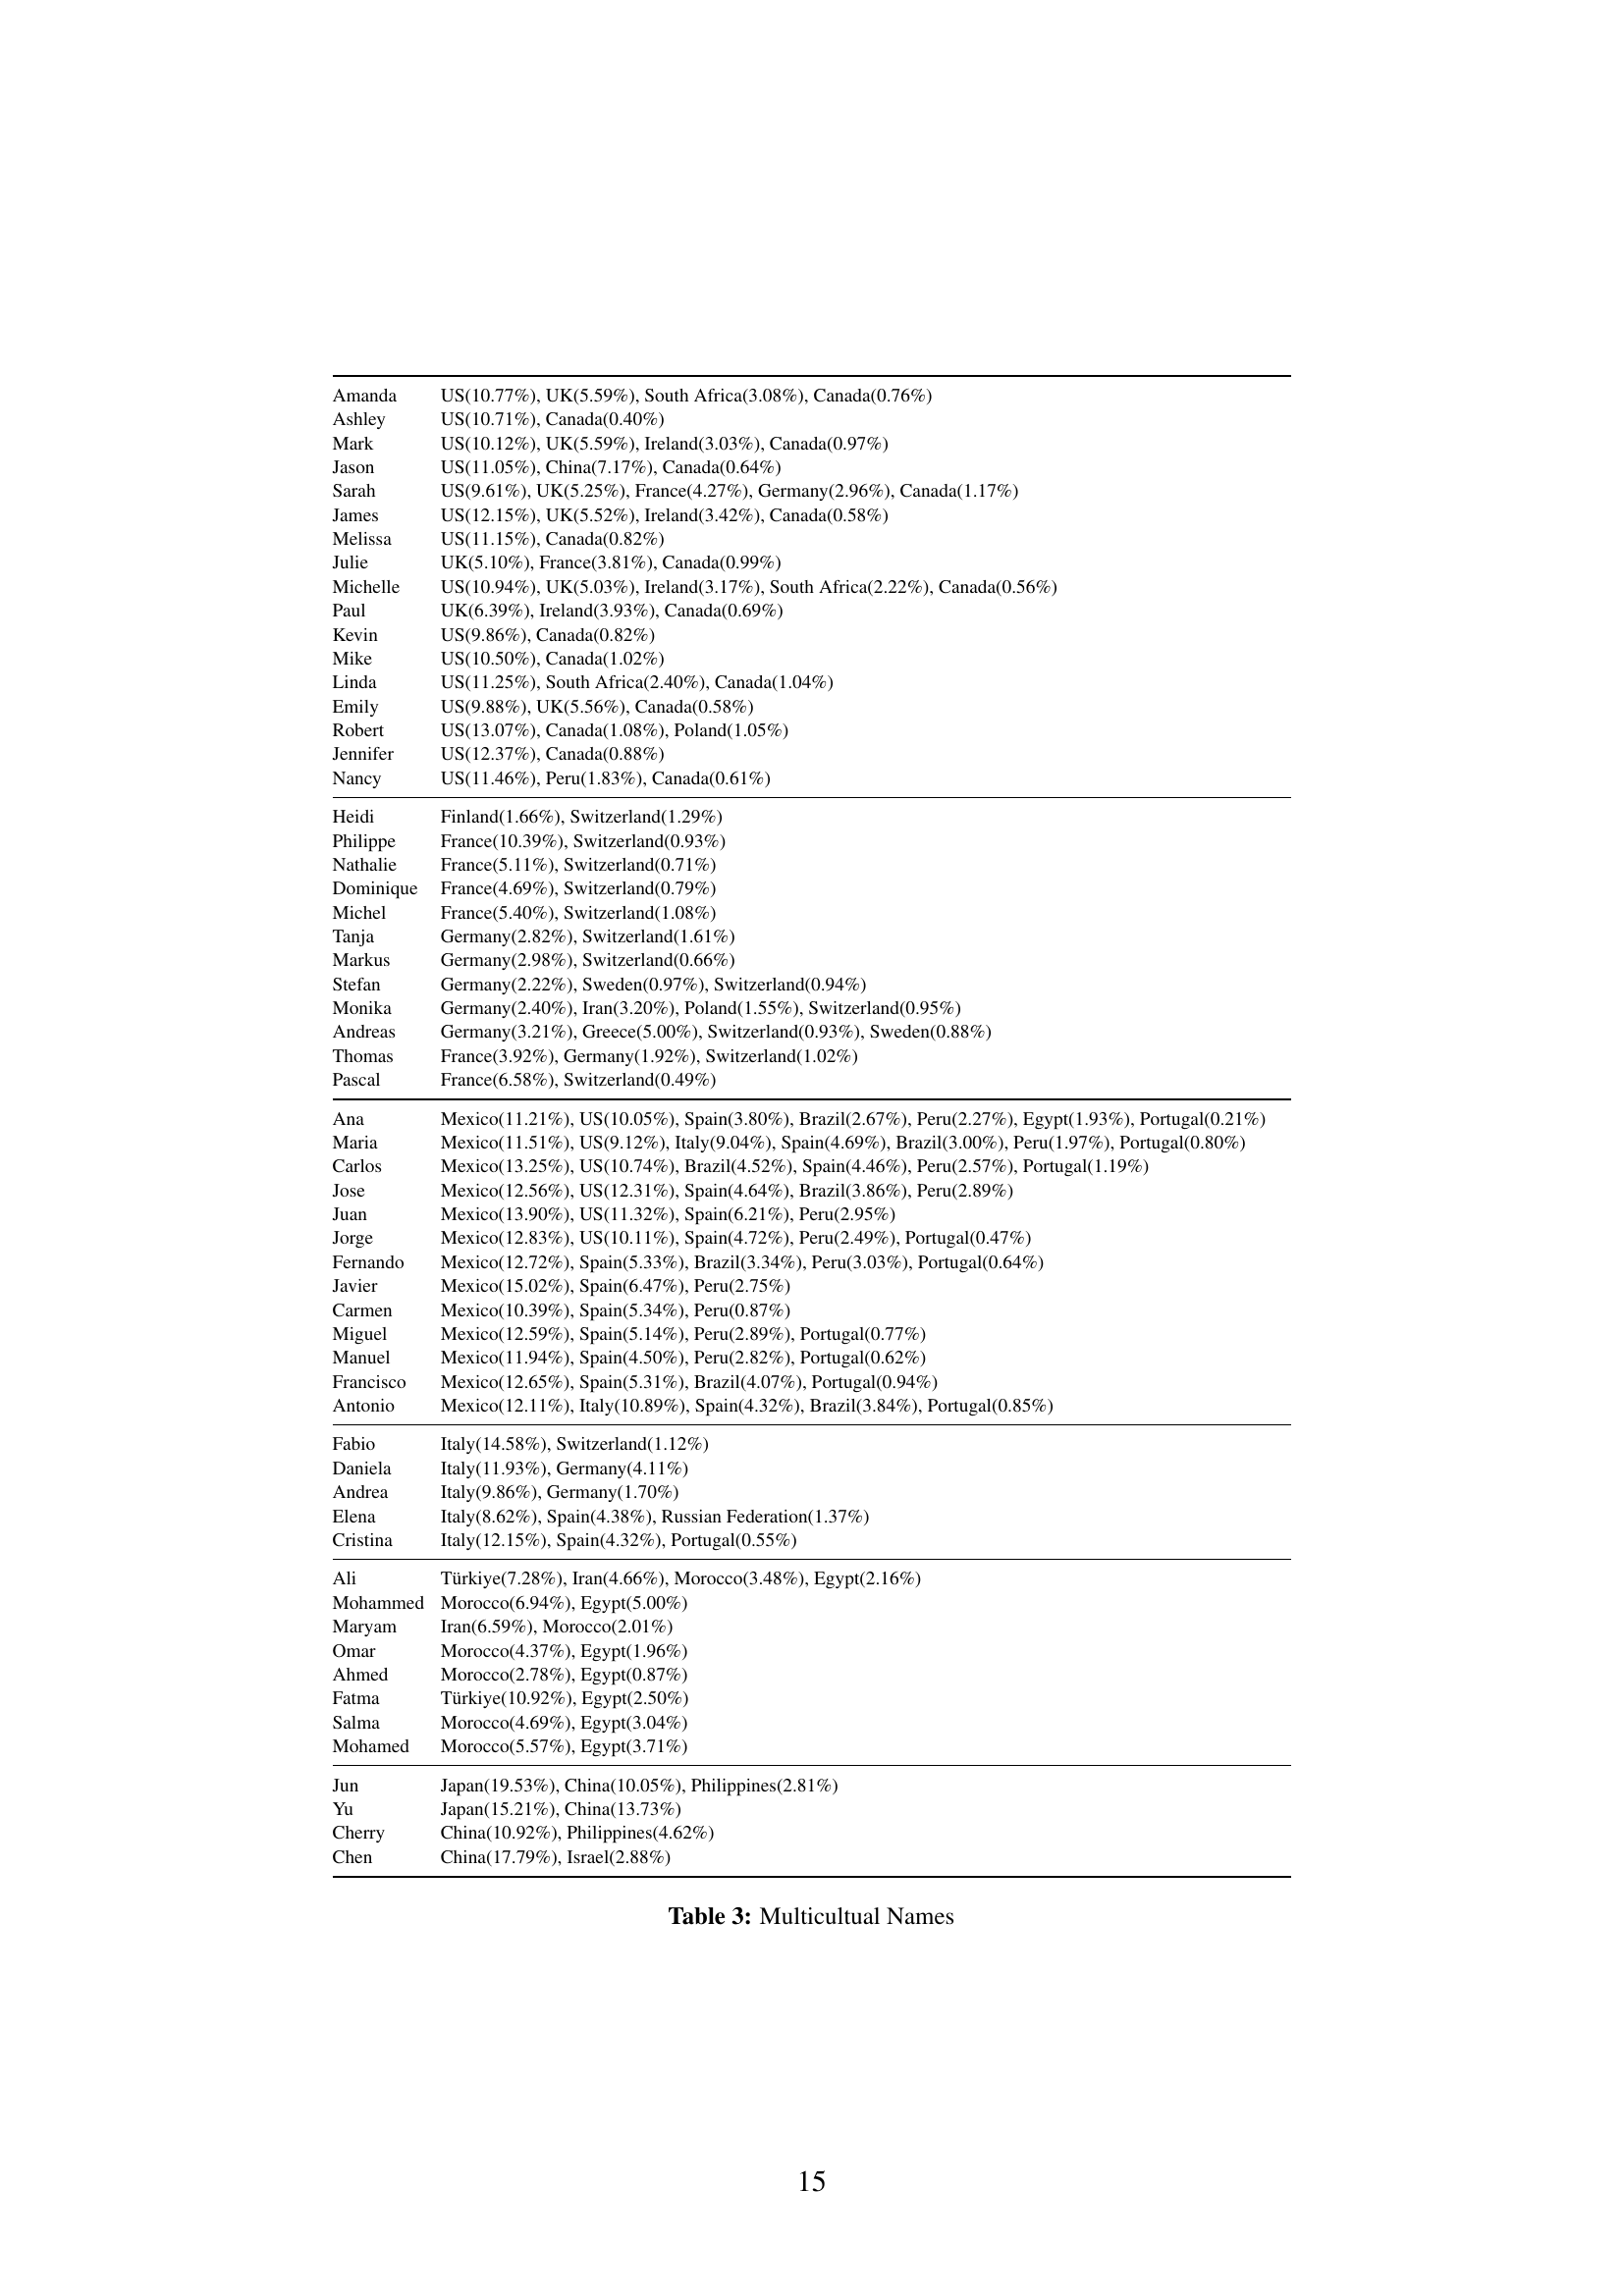
🔼 This table lists names that are common across multiple cultures, along with the percentage of times each name is associated with different countries. It highlights the potential for ambiguity and bias when using names as a sole indicator of cultural identity in large language models.
read the caption
Table 3: Multicultual Names
| Country | Biased Names (Frequency) |
|---|---|
| Brazil | Larissa (15), Bruna (14), Felipe (14), Marcelo (14), Pedro (14) |
| Canada | Nicole (8), Eric (6), Lisa (6), Amanda (5), Ashley (5) |
| China | Liu (56), Wei (54), Feng (49), Yuan (48), Zhou (48) |
| Finland | Päivi (12), Tarja (9), Tiina (9), Hanna (8), Johanna (7) |
| France | Guillaume (36), Christophe (34), Thierry (33), Julien (29), Philippe (27) |
| Germany | Heike (16), Alexander (12), Stefan (12), Claudia (11), Jens (11) |
| India | Pooja (115), Vijay (107), Raju (104), Mukesh (103), Priya (98) |
| Indonesia | Bambang (46), Teguh (30), Asep (29), Siti (25), Retno (23) |
| Iran, Islamic Republic of | Mehdi (27), Hamid (26), Alireza (24), Reza (24), Maryam (21) |
| Ireland | Sinead (21), Aoife (17), Niall (17), Eoin (16), Paddy (16) |
| Italy | Giuseppe (84), Vincenzo (66), Massimo (63), Luigi (62), Federica (57) |
| Japan | Daisuke (133), Takahiro (128), Takashi (125), Hiroyuki (109), Megumi (109) |
| Mexico | Lupita (59), Eduardo (52), Fernanda (48), Guadalupe (47), Miguel (46) |
| Morocco | Kawtar (35), Hanane (31), Siham (27), Imane (26), Zineb (25) |
| Peru | Diego (15), Milagros (12), Ana (10), Juan Carlos (10), Pedro (10) |
| Philippines | Marites (24), Kristine (16), Jm (14), Noel (13), Rj (13) |
| Poland | Małgorzata (30), Krzysztof (20), Katarzyna (16), Paweł (15), Grzegorz (13) |
| Portugal | Margarida (9), André (7), Filipa (6), Catarina (5), Marta (5) |
| South Africa | Nonhlanhla (55), Zandile (39), Siyabonga (38), Zinhle (33), Themba (29) |
| Spain | María (25), Francisco (24), Mari Carmen (21), Marta (21), Cristina (20) |
| Sweden | Håkan (37), Åsa (13), Marcus (11), Birgitta (10), Björn (10) |
| Switzerland | Roger (9), Heidi (7), Marcel (6), Philippe (6), Reto (6) |
| Türkiye | Ayşe (76), Hüseyin (65), Hülya (50), Özlem (45), Zeynep (44) |
| United Kingdom | Lisa (27), Emma (24), Ian (23), Claire (22), Daniel (22) |
| United States | James (54), Juan (43), Linda (40), Michelle (40), Ashley (39) |
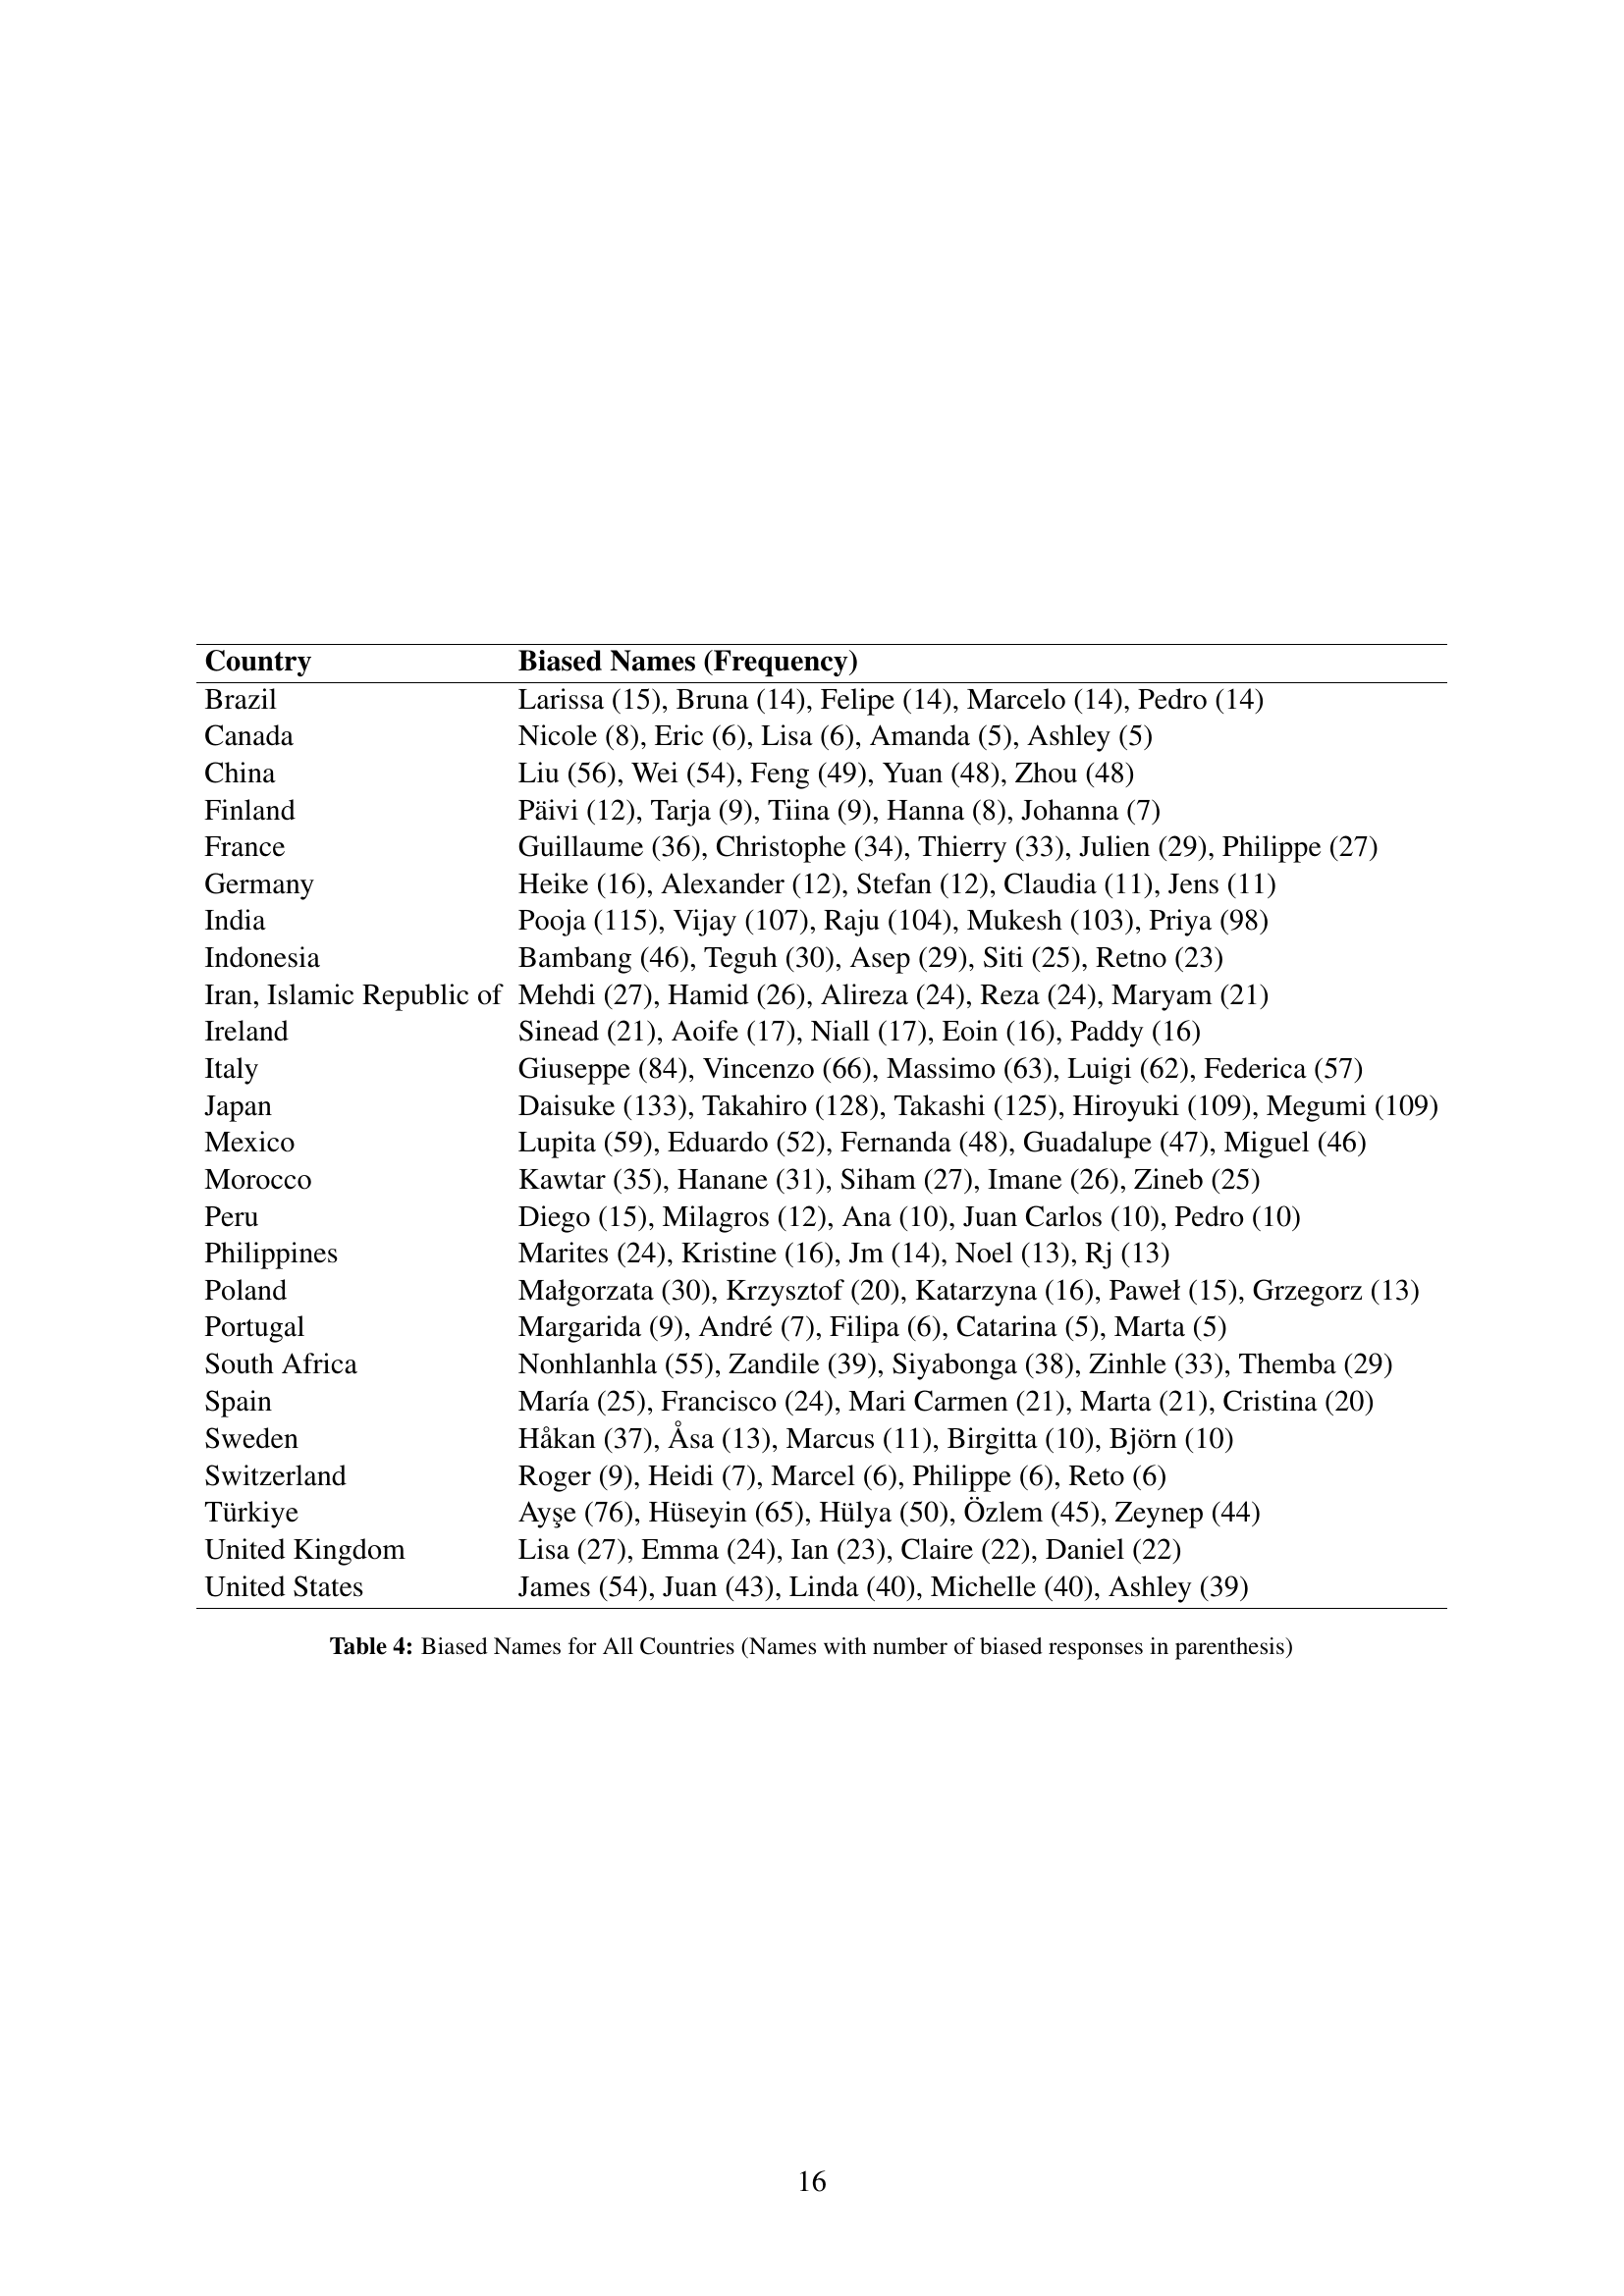
🔼 This table lists the names that elicited biased responses from the language models, categorized by country of origin. The number in parentheses after each name indicates how many times that name triggered a culturally biased response from the language models. This provides insight into which names are most strongly associated with specific cultural assumptions within the models.
read the caption
Table 4: Biased Names for All Countries (Names with number of biased responses in parenthesis)
Full paper#