TL;DR#
Generating 3D molecules is vital for designing drugs & materials. Existing methods rely on 3D diffusion, yet they sometimes make invalid molecules and don’t use big 1D molecule datasets. To solve this, we can use language models, which are guaranteed validity. How do we bring 1D language advantages to 3D generation? It’s tough, as previous methods lack effective language models, powerful 3D models, or efficient transfer learning.
NExT-Mol, tackles this by combining 1D language models with 3D diffusion. We pretrain a large language model on molecules, then predict 3D shapes using a diffusion model. Key innovations include scaling up the language model and refining the diffusion model. This makes sure validity, is scalable, and accurate. By leveraging pretrained language, NExT-Mol demonstrates strong performance in molecule generation and conformer prediction.
Key Takeaways#
Why does it matter?#
This research addresses key limitations in 3D molecule generation, offering a scalable & valid foundation model for drug discovery. It provides new insights for combining language models with diffusion techniques & opens avenues for structure-based design.
Visual Insights#

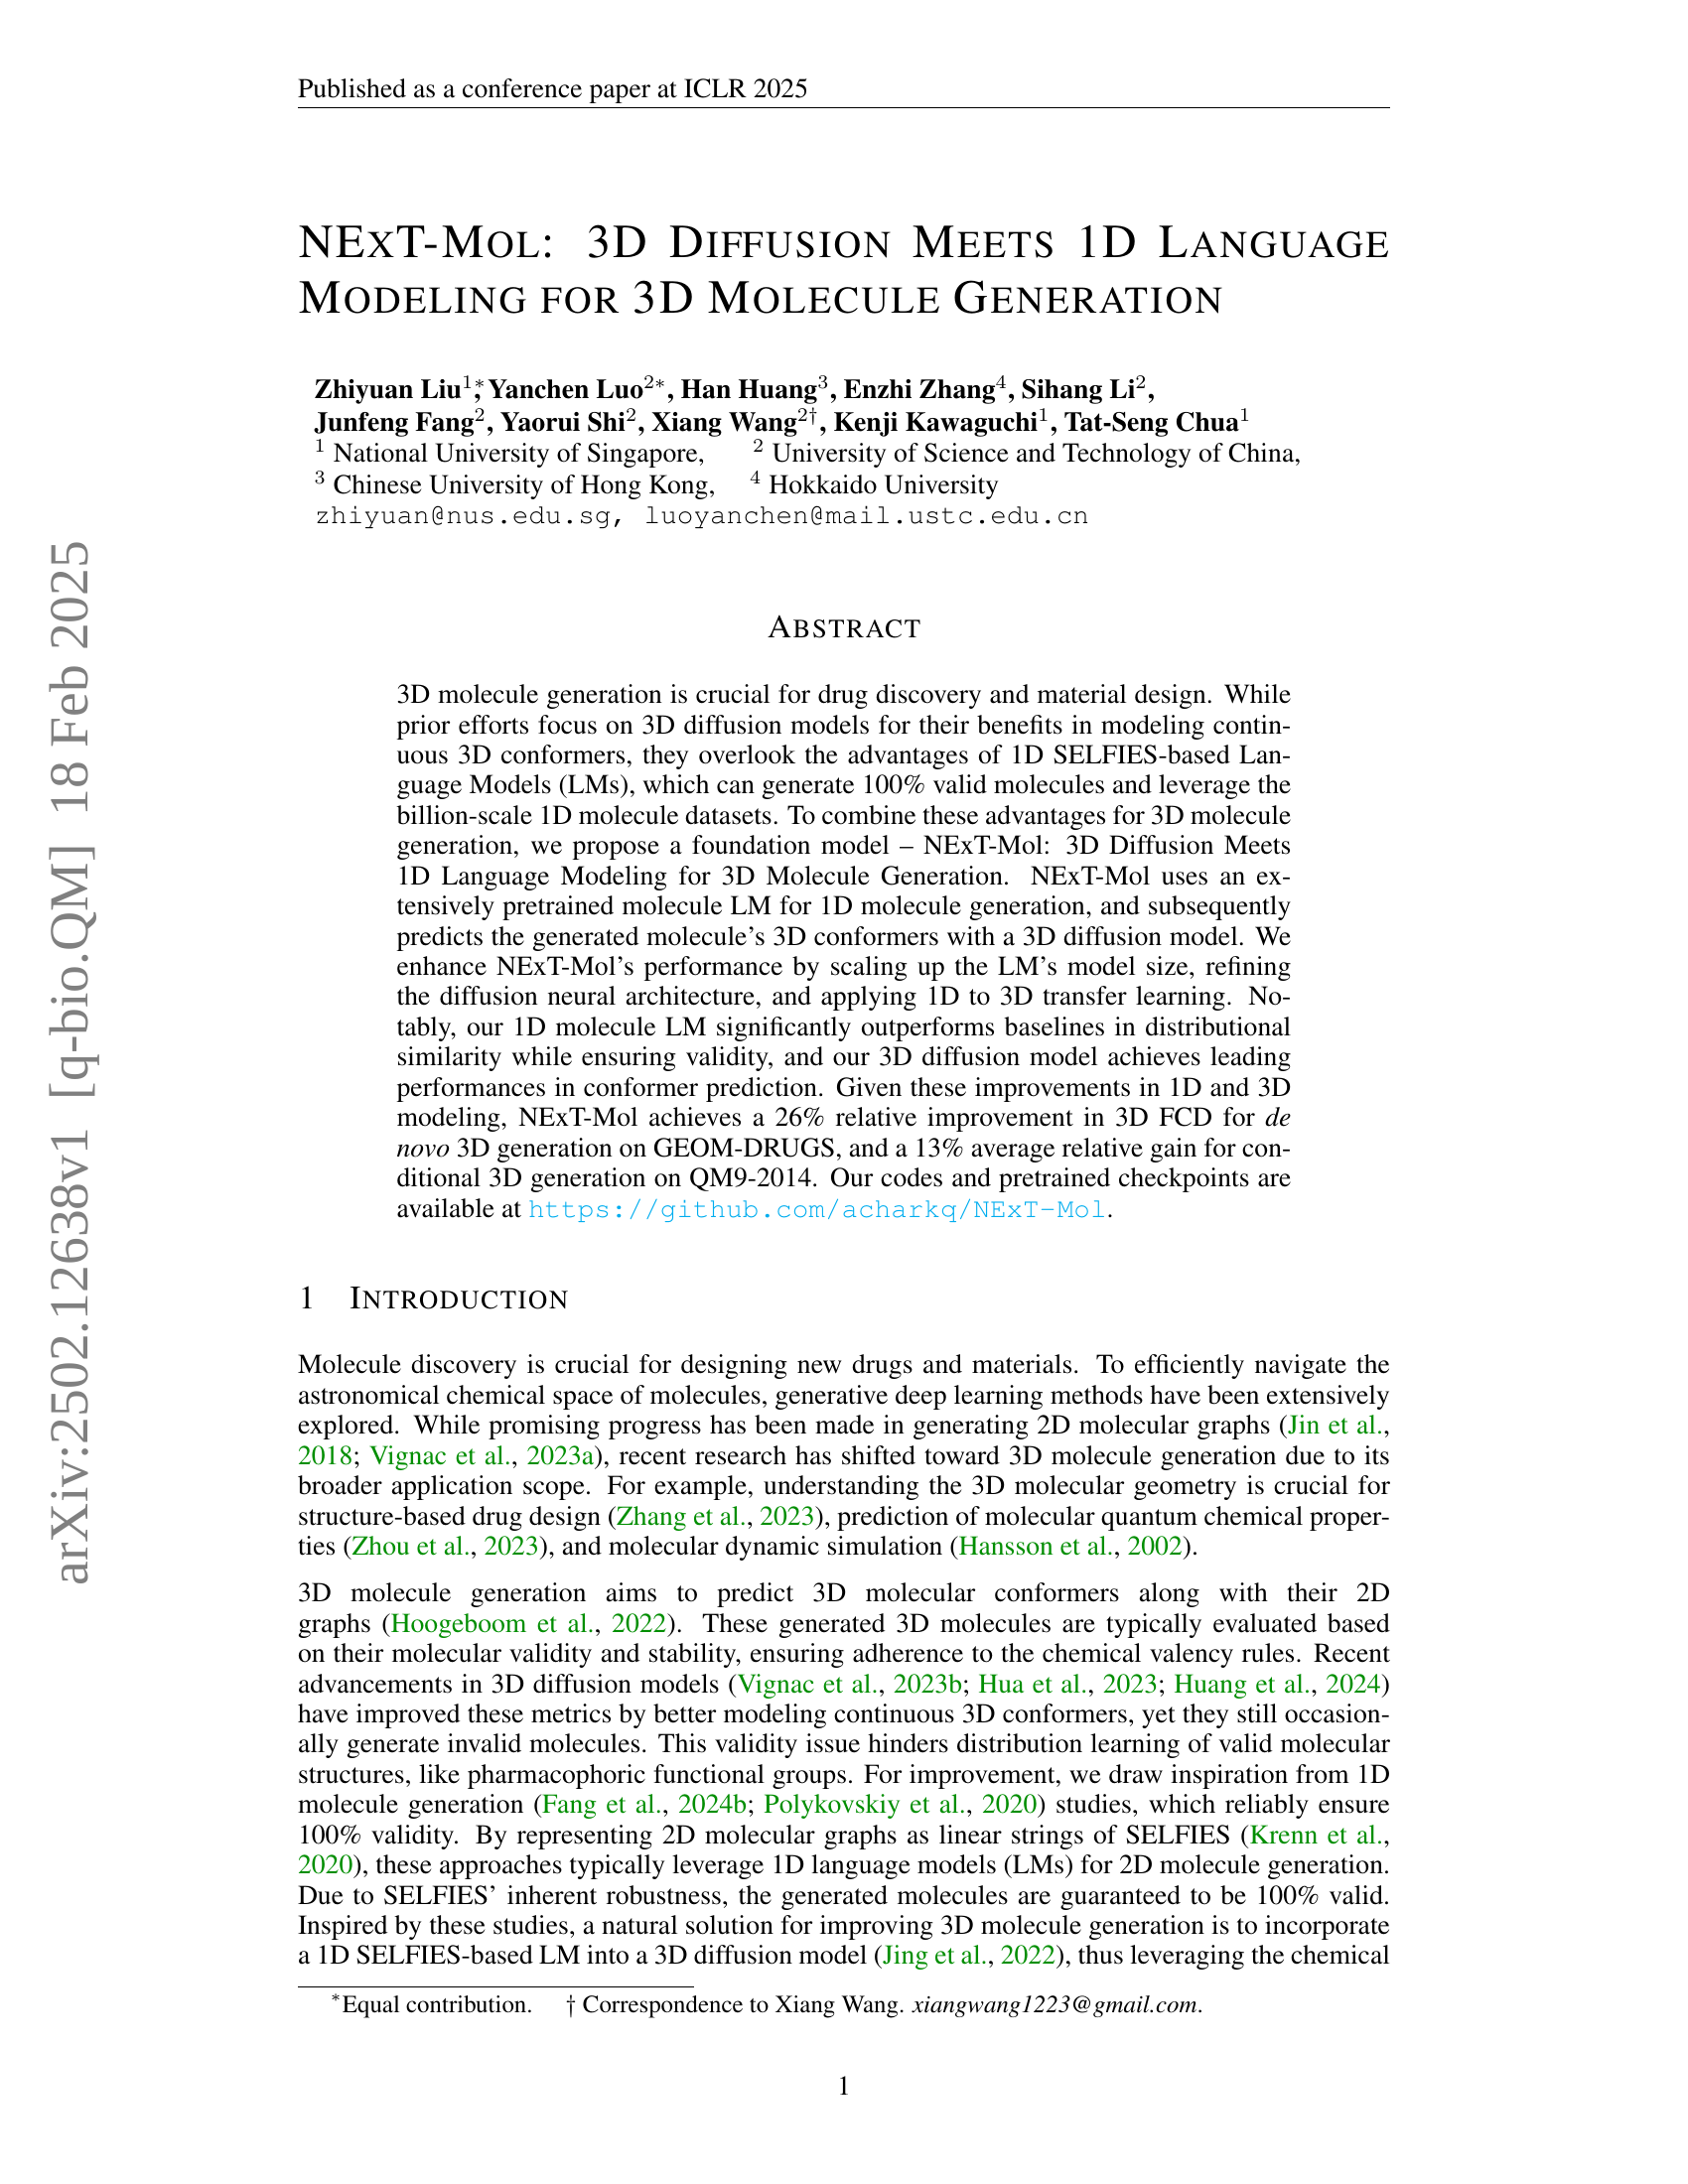
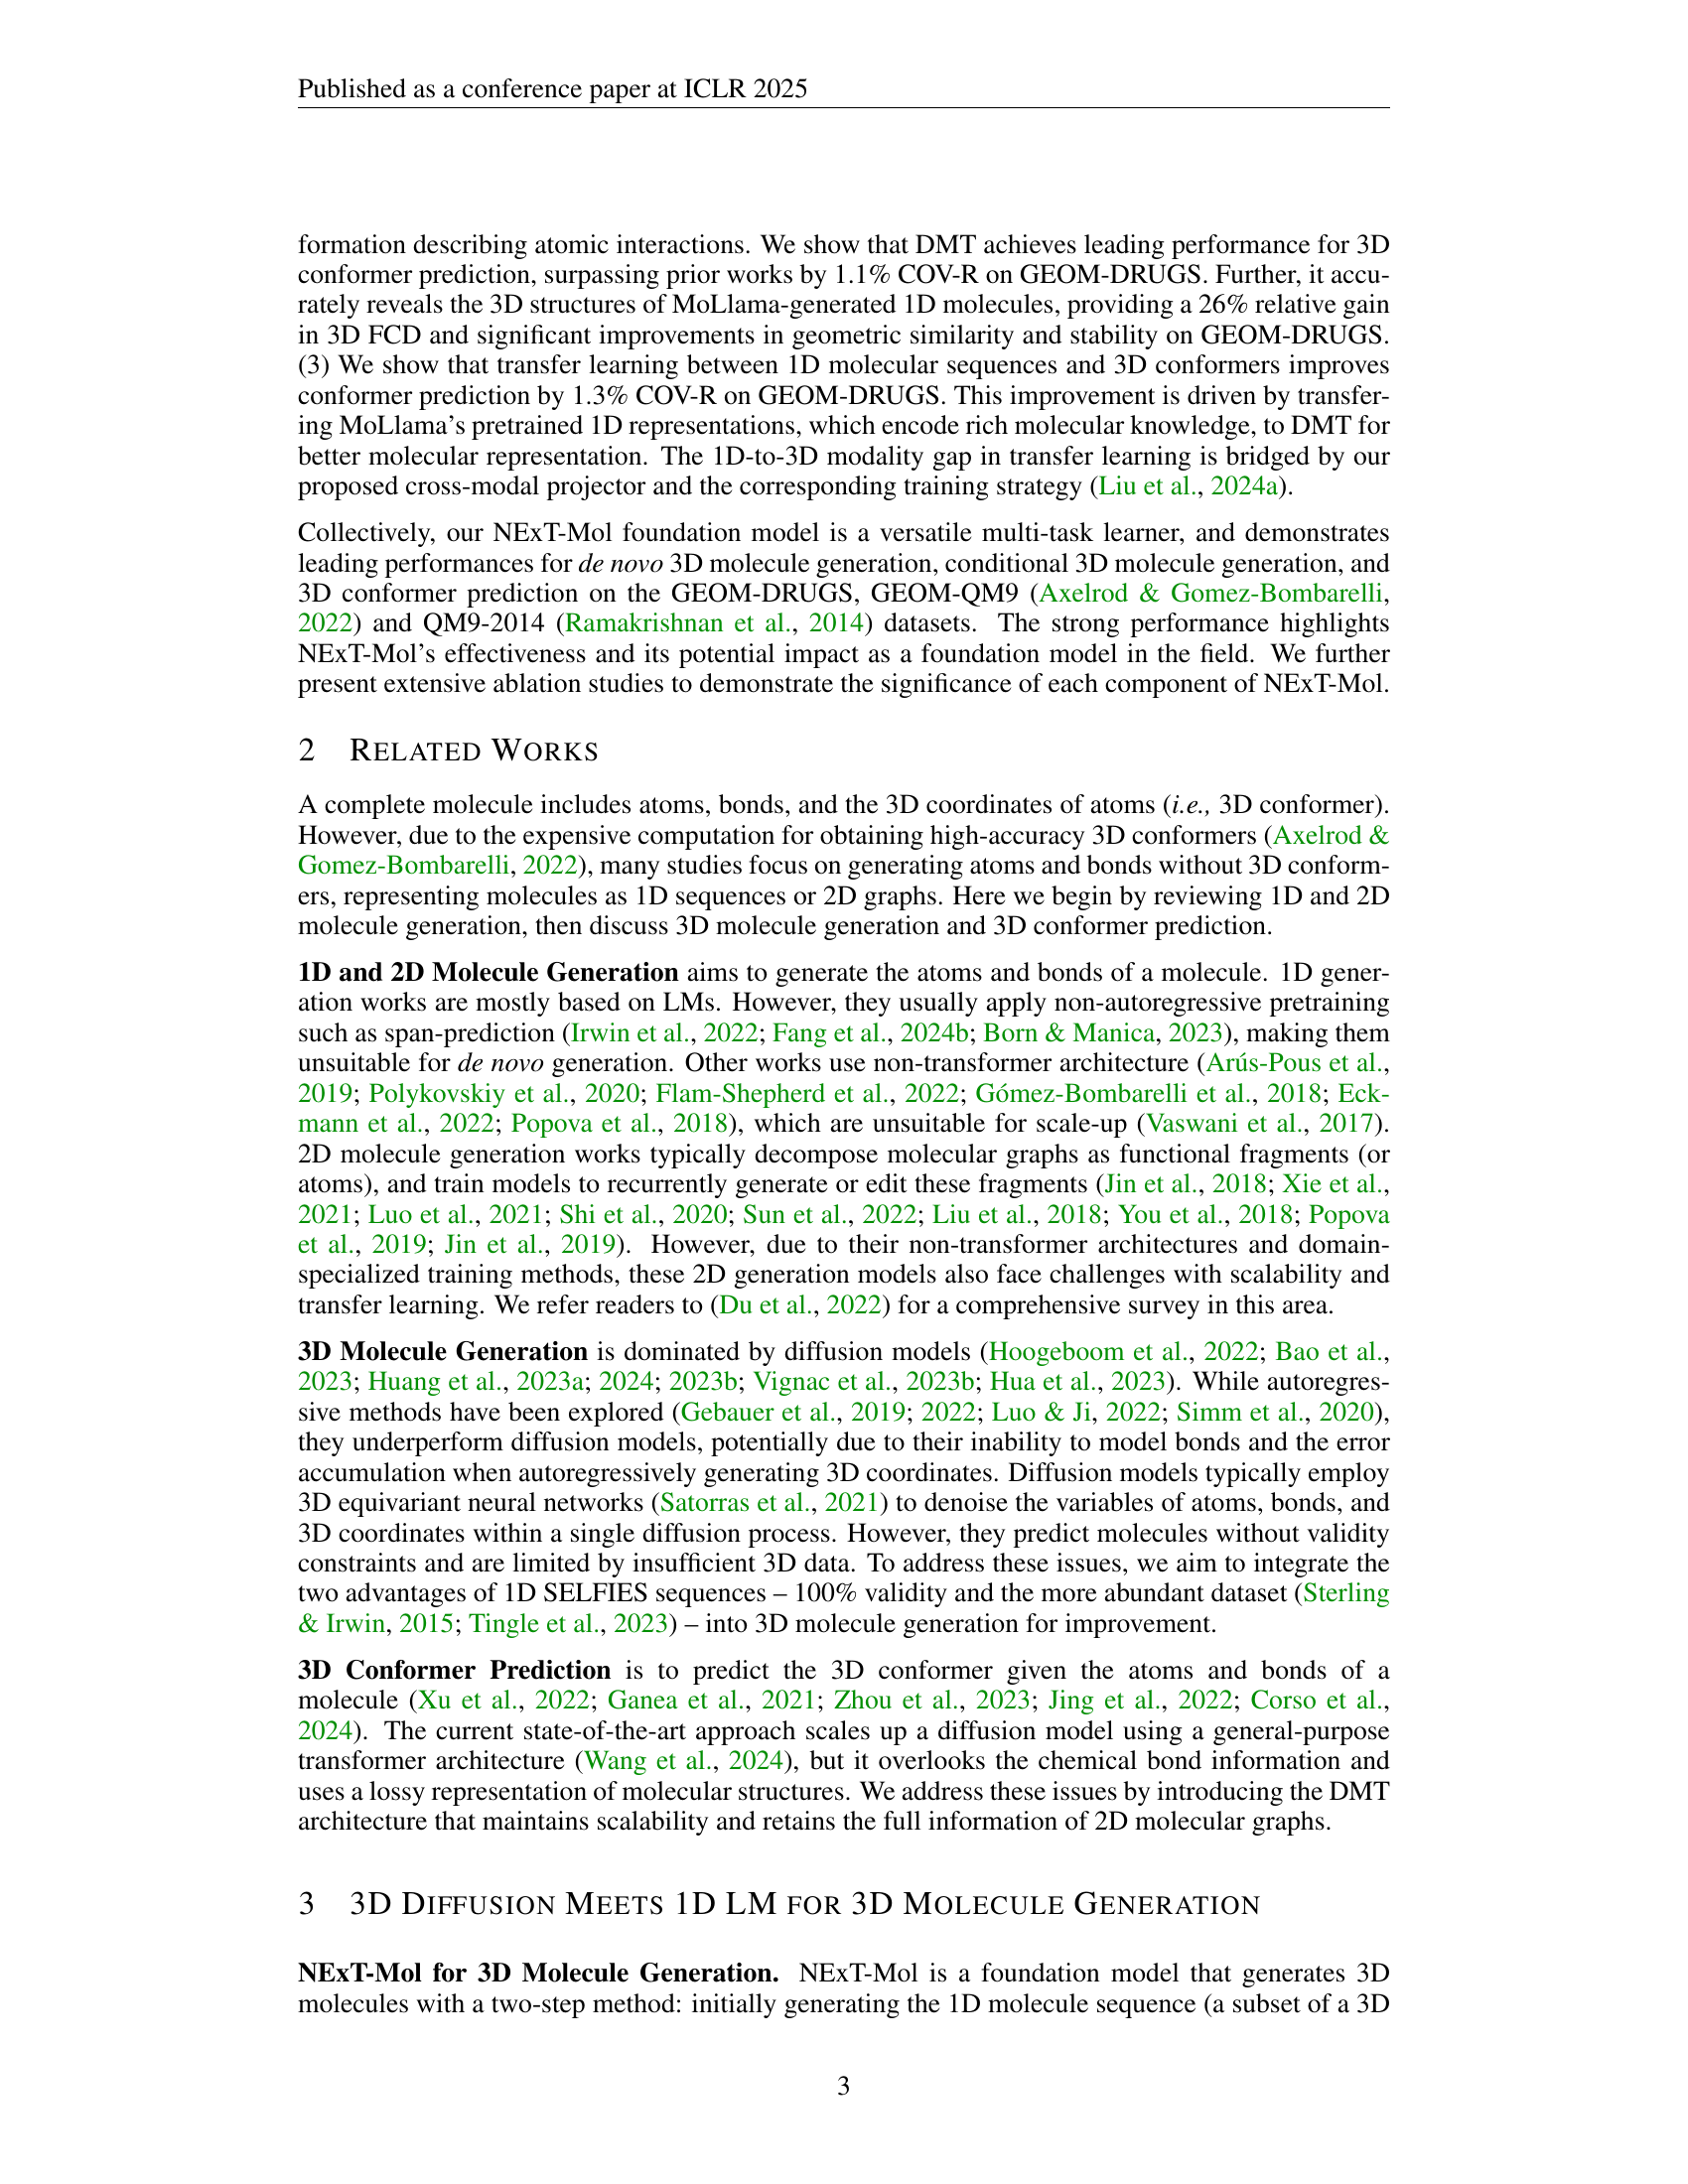
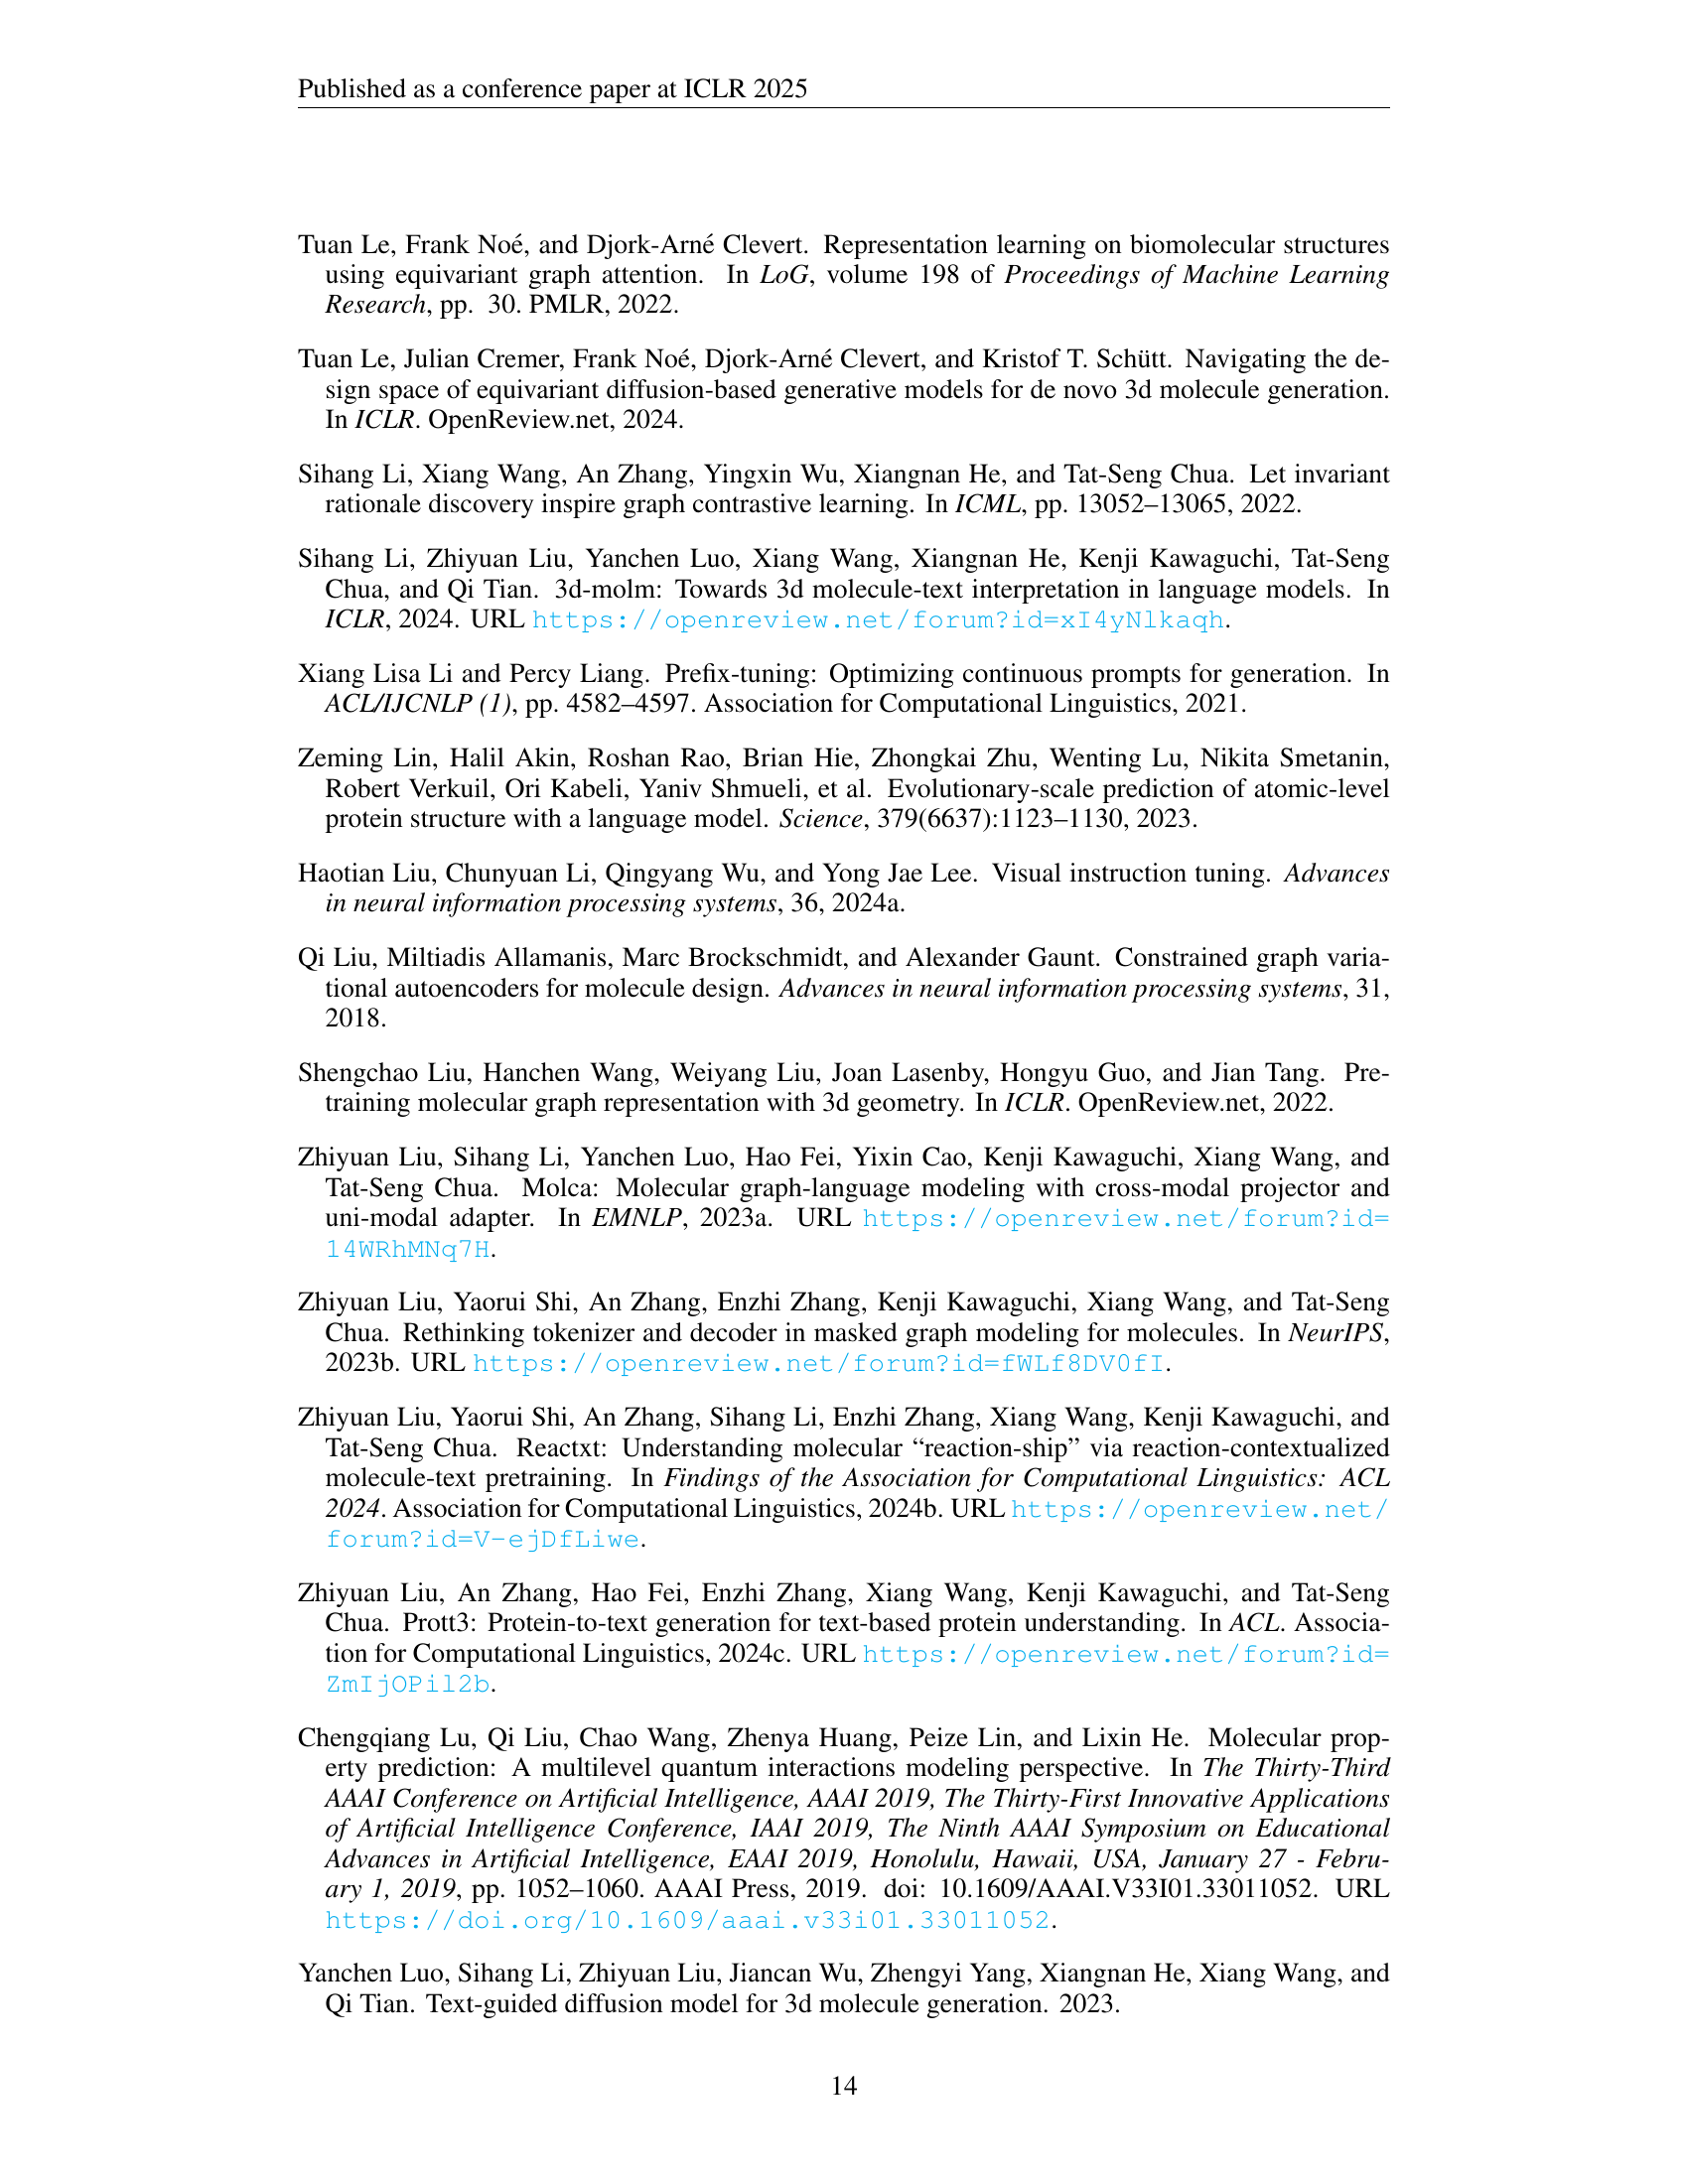
🔼 The figure illustrates the NEXT-Mol model architecture, a novel foundation model for 3D molecule generation. It’s a two-stage process. First, a large language model (LLM) called MoLlama generates a 1D representation (SELFIES string) of a molecule. This 1D string, which guarantees 100% valid molecules, is then fed into a 3D diffusion model (DMT) to predict the 3D conformer (3D structure) of the molecule. Critically, transfer learning is employed: the knowledge gained by MoLlama in learning 1D molecular representations is transferred to improve the accuracy of the 3D conformer predictions by DMT. The figure visually depicts these three key components (MoLlama, DMT, and the transfer learning) and their interactions, showcasing the overall process of generating 3D molecular structures.
read the caption
Figure 1: Overview of our NExT-Mol foundation model for 3D molecule generation. NExT-Mol consists of three key components: (1) MoLlama, a large LM for generating 1D molecule sequences; (2) DMT, a diffusion model to predict 3D conformers from the 1D sequences; and (3) NExT-Mol leverages transfer learning to enhance DMT’s 3D prediction with MoLlama’s 1D representations.
| (1) | (2) |
| (3) | (4) |
🔼 This table lists the datasets used for each of the three tasks performed in the paper: de novo 3D molecule generation, conditional 3D molecule generation, and 3D conformer prediction. For each task, the specific dataset(s) used are detailed, providing a clear overview of the data used to train and evaluate the models.
read the caption
Table 1: Datasets for each task.
In-depth insights#
3D meets 1D#
The fusion of 3D and 1D representations in molecule generation is a promising avenue. 3D diffusion models excel at modeling continuous conformers, but can struggle with validity. Conversely, 1D language models based on SELFIES guarantee valid molecules and can leverage vast datasets. Combining these approaches, as seen in NExT-Mol, allows for both accurate 3D structure prediction and 100% validity. This hybrid strategy offers a way to capitalize on the strengths of both methodologies for improved molecule generation.
MoLlama Boost#
The ‘MoLlama Boost’ concept likely explores how pre-trained MoLlama can enhance downstream tasks. It potentially leverages MoLlama’s learned representations to improve performance in tasks like 3D conformer prediction or molecule generation. One possible mechanism is using MoLlama’s embeddings as initial features for a downstream model, providing a richer starting point than random initialization. The key benefit would be improved generalization and faster convergence, especially when data is limited. Also this may improve geometric metrics, since extensive pre-training might help the model learn general chemical heuristics.
DMT Architecture#
The Diffusion Molecular Transformer (DMT) architecture is a critical component, leveraging Relational Multi-Head Self-Attention (RMHA) and adaptive layernorm (adaLN). RMHA iteratively refines atom and pair representations, capturing intricate molecular graph structures by incorporating information about atomic interactions. Unlike some models which compromise on retaining complete 2D molecular graph data, DMT retains this detail, ensuring a more faithful representation. The multi-head version of RMHA utilizes query, key, and value transformations to capture diverse relationships, and also pair representation, and then aggregates the output adaptively informed by these structural details, enhancing overall performance. Further, random rotation augmentations are applied to improve DMT’s equivariance to rotated inputs, helping the 3D diffusion process work more effectively. By combining RMHA, adaLN, and a well-designed diffusion process, DMT achieves leading performance in 3D conformer prediction.
Beyond Validity#
Validity in molecule generation extends beyond mere chemical feasibility, impacting crucial aspects like distributional similarity and 3D geometry learning. 100% validity aids models in capturing true target distributions, essential for real-world applications. It grounds 3D structure prediction on sound 2D structures. Improved validity enhances geometric similarity. Essentially, ensuring molecules are valid isn’t just about creating something chemically possible, but about building a solid foundation for meaningful and accurate molecular design.
Edit NEXT-Mol#
While “Edit NEXT-Mol” isn’t present, I can discuss potential model editing capabilities. Model editing allows targeted knowledge updates without retraining, crucial for adapting NEXT-Mol. Considering NEXT-Mol’s architecture (LM + Diffusion), editing could involve refining the LM’s chemical knowledge or adjusting the diffusion model’s geometric understanding. Techniques like knowledge distillation could transfer specific chemical rules. Alternatively, methods like adapter modules could selectively modify existing parameters. Model editing might enable bias correction, improve performance on specific molecular classes, or correct known limitations like scaffold generalization or property prediction accuracy. Effective model editing would require identifying influential parameters, understanding their relationship to specific chemical properties, and carefully applying modifications. This is particularly valuable for tasks like structure-based design or drug-drug interaction prediction to update chemical rules.
More visual insights#
More on figures

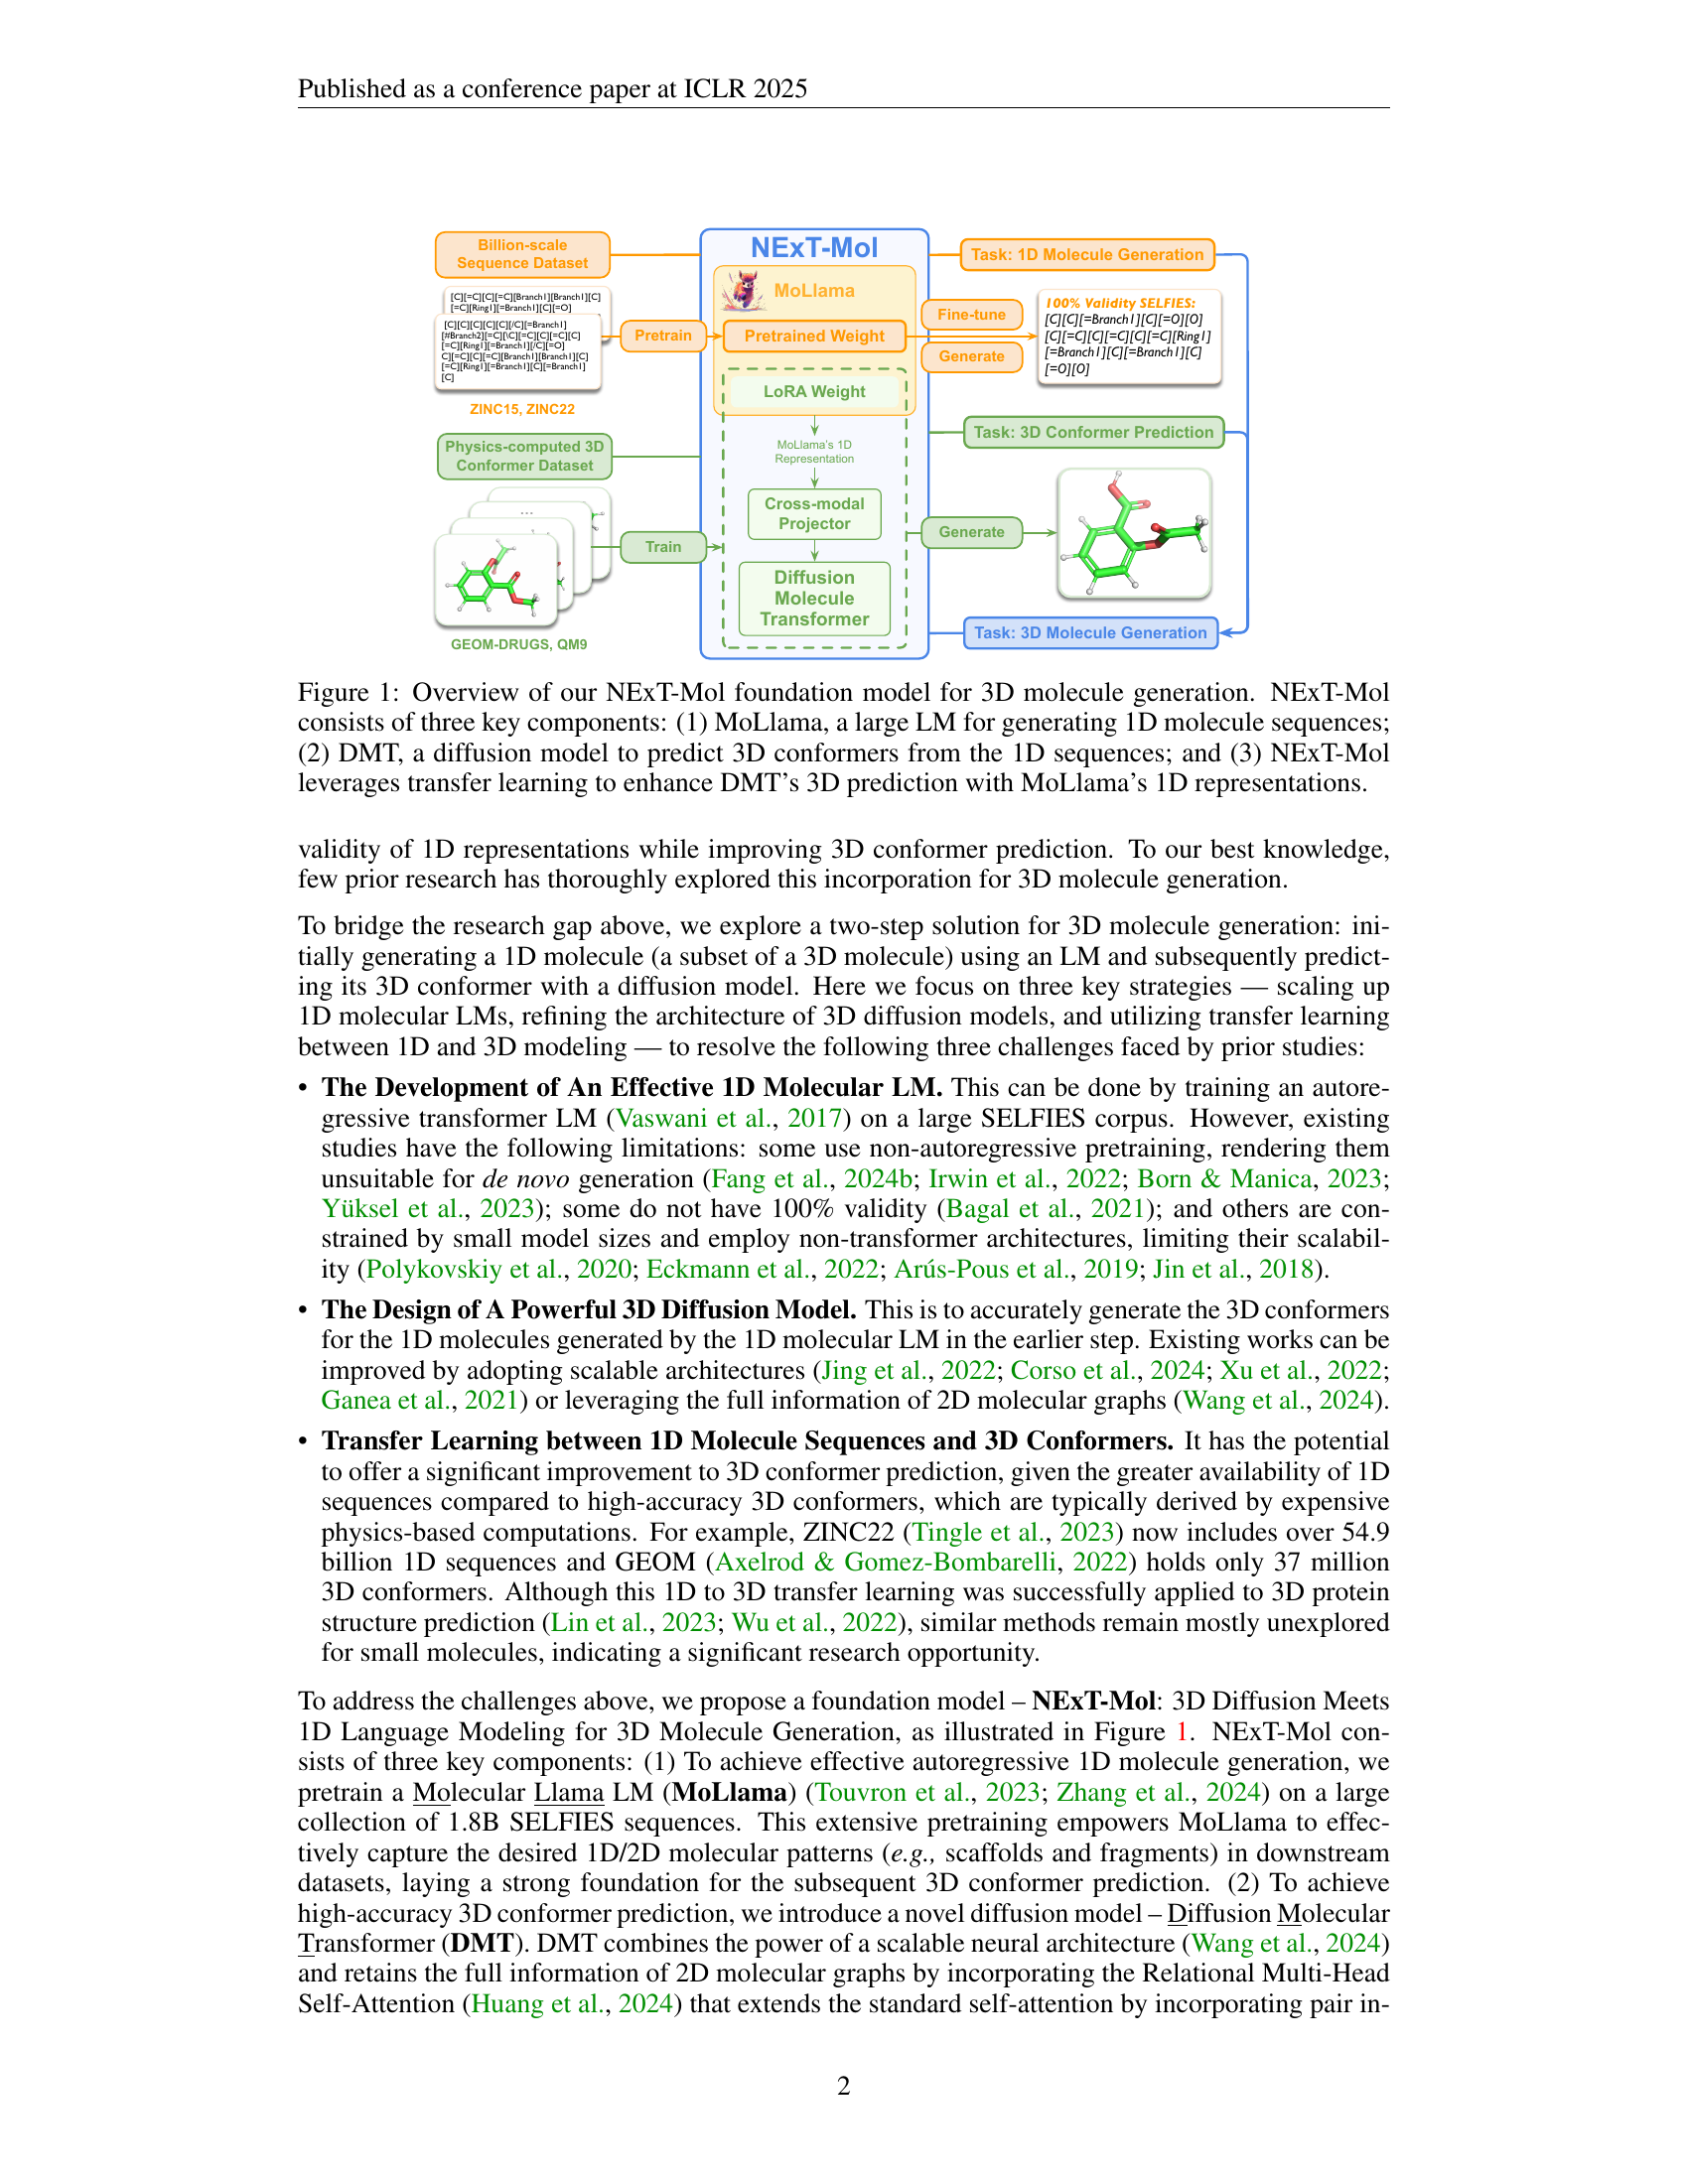
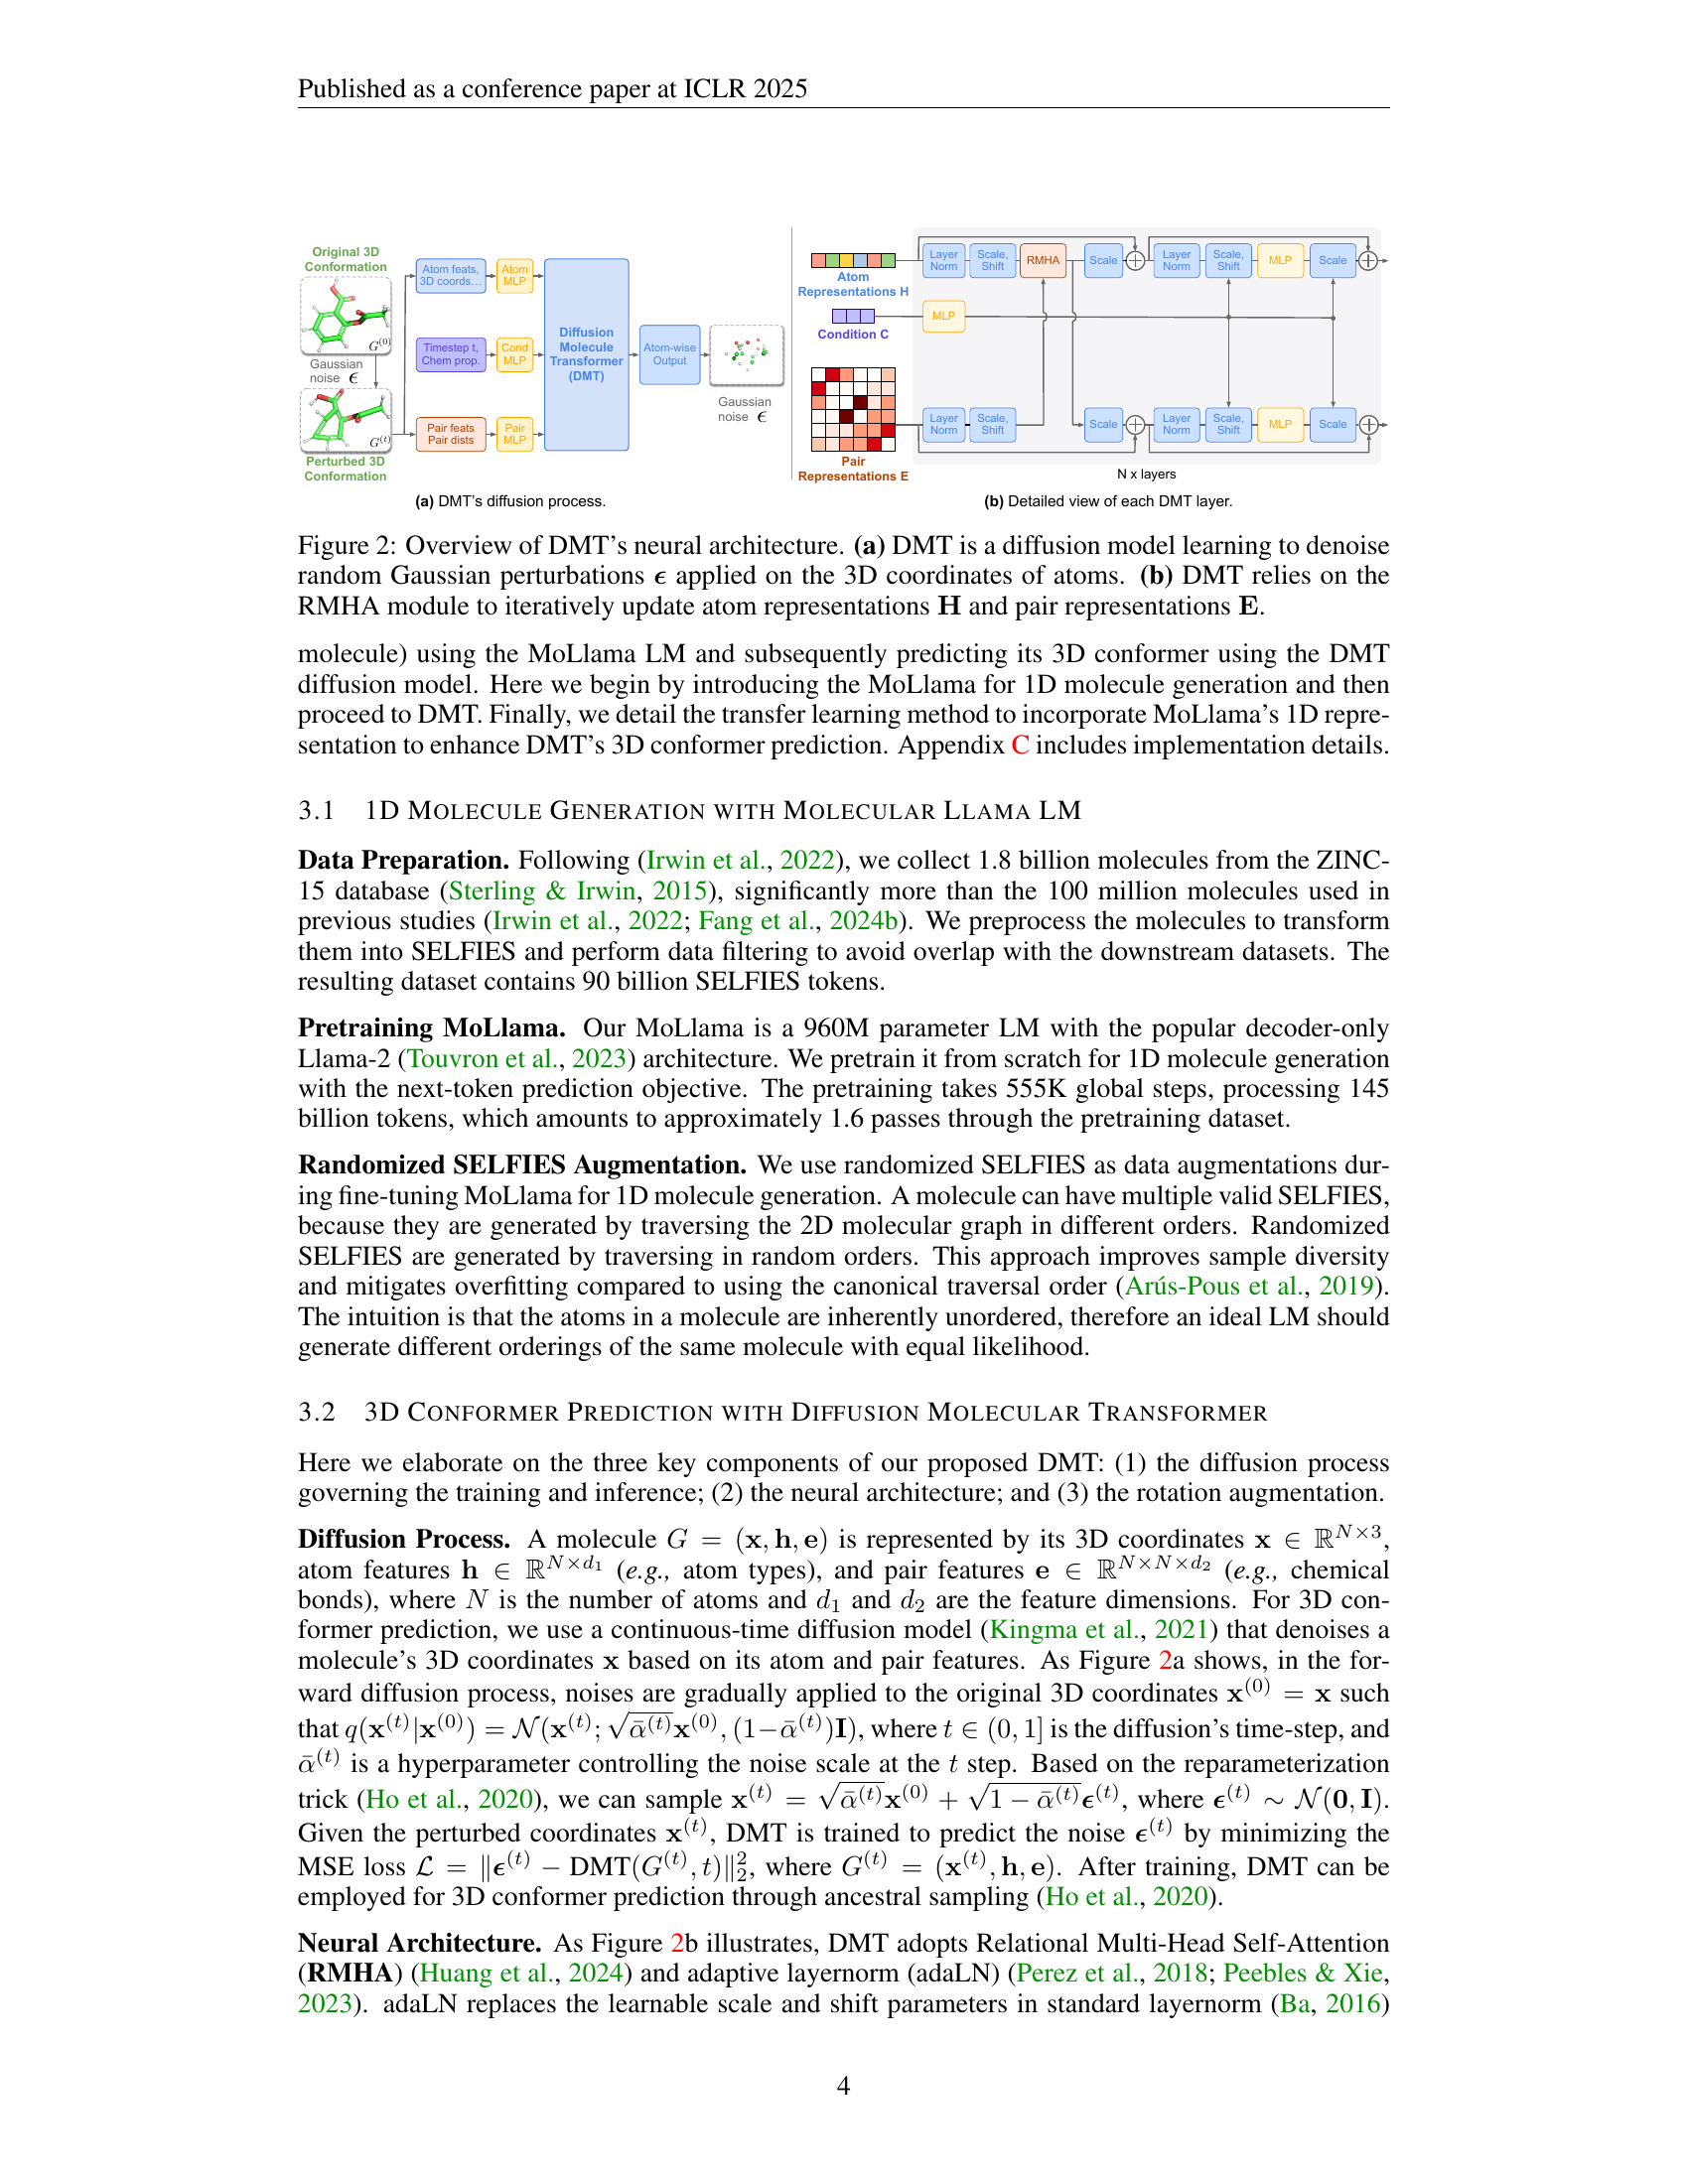
🔼 Figure 2 details the architecture of the Diffusion Molecular Transformer (DMT), a core component of the NEXT-Mol model. Panel (a) illustrates the diffusion process itself: DMT takes as input a 3D molecular structure, adds random Gaussian noise to the 3D atomic coordinates, and then learns to progressively remove that noise to generate a refined structure. Panel (b) zooms in on a single layer of the DMT neural network, showing how it uses Relational Multi-Head Self-Attention (RMHA) to simultaneously update representations of individual atoms (H) and the relationships between pairs of atoms (E). This iterative refinement process, repeated across multiple layers, allows DMT to predict accurate 3D conformations.
read the caption
Figure 2: Overview of DMT’s neural architecture. (a) DMT is a diffusion model learning to denoise random Gaussian perturbations ϵbold-italic-ϵ\bm{\epsilon}bold_italic_ϵ applied on the 3D coordinates of atoms. (b) DMT relies on the RMHA module to iteratively update atom representations 𝐇𝐇\mathbf{H}bold_H and pair representations 𝐄𝐄\mathbf{E}bold_E.

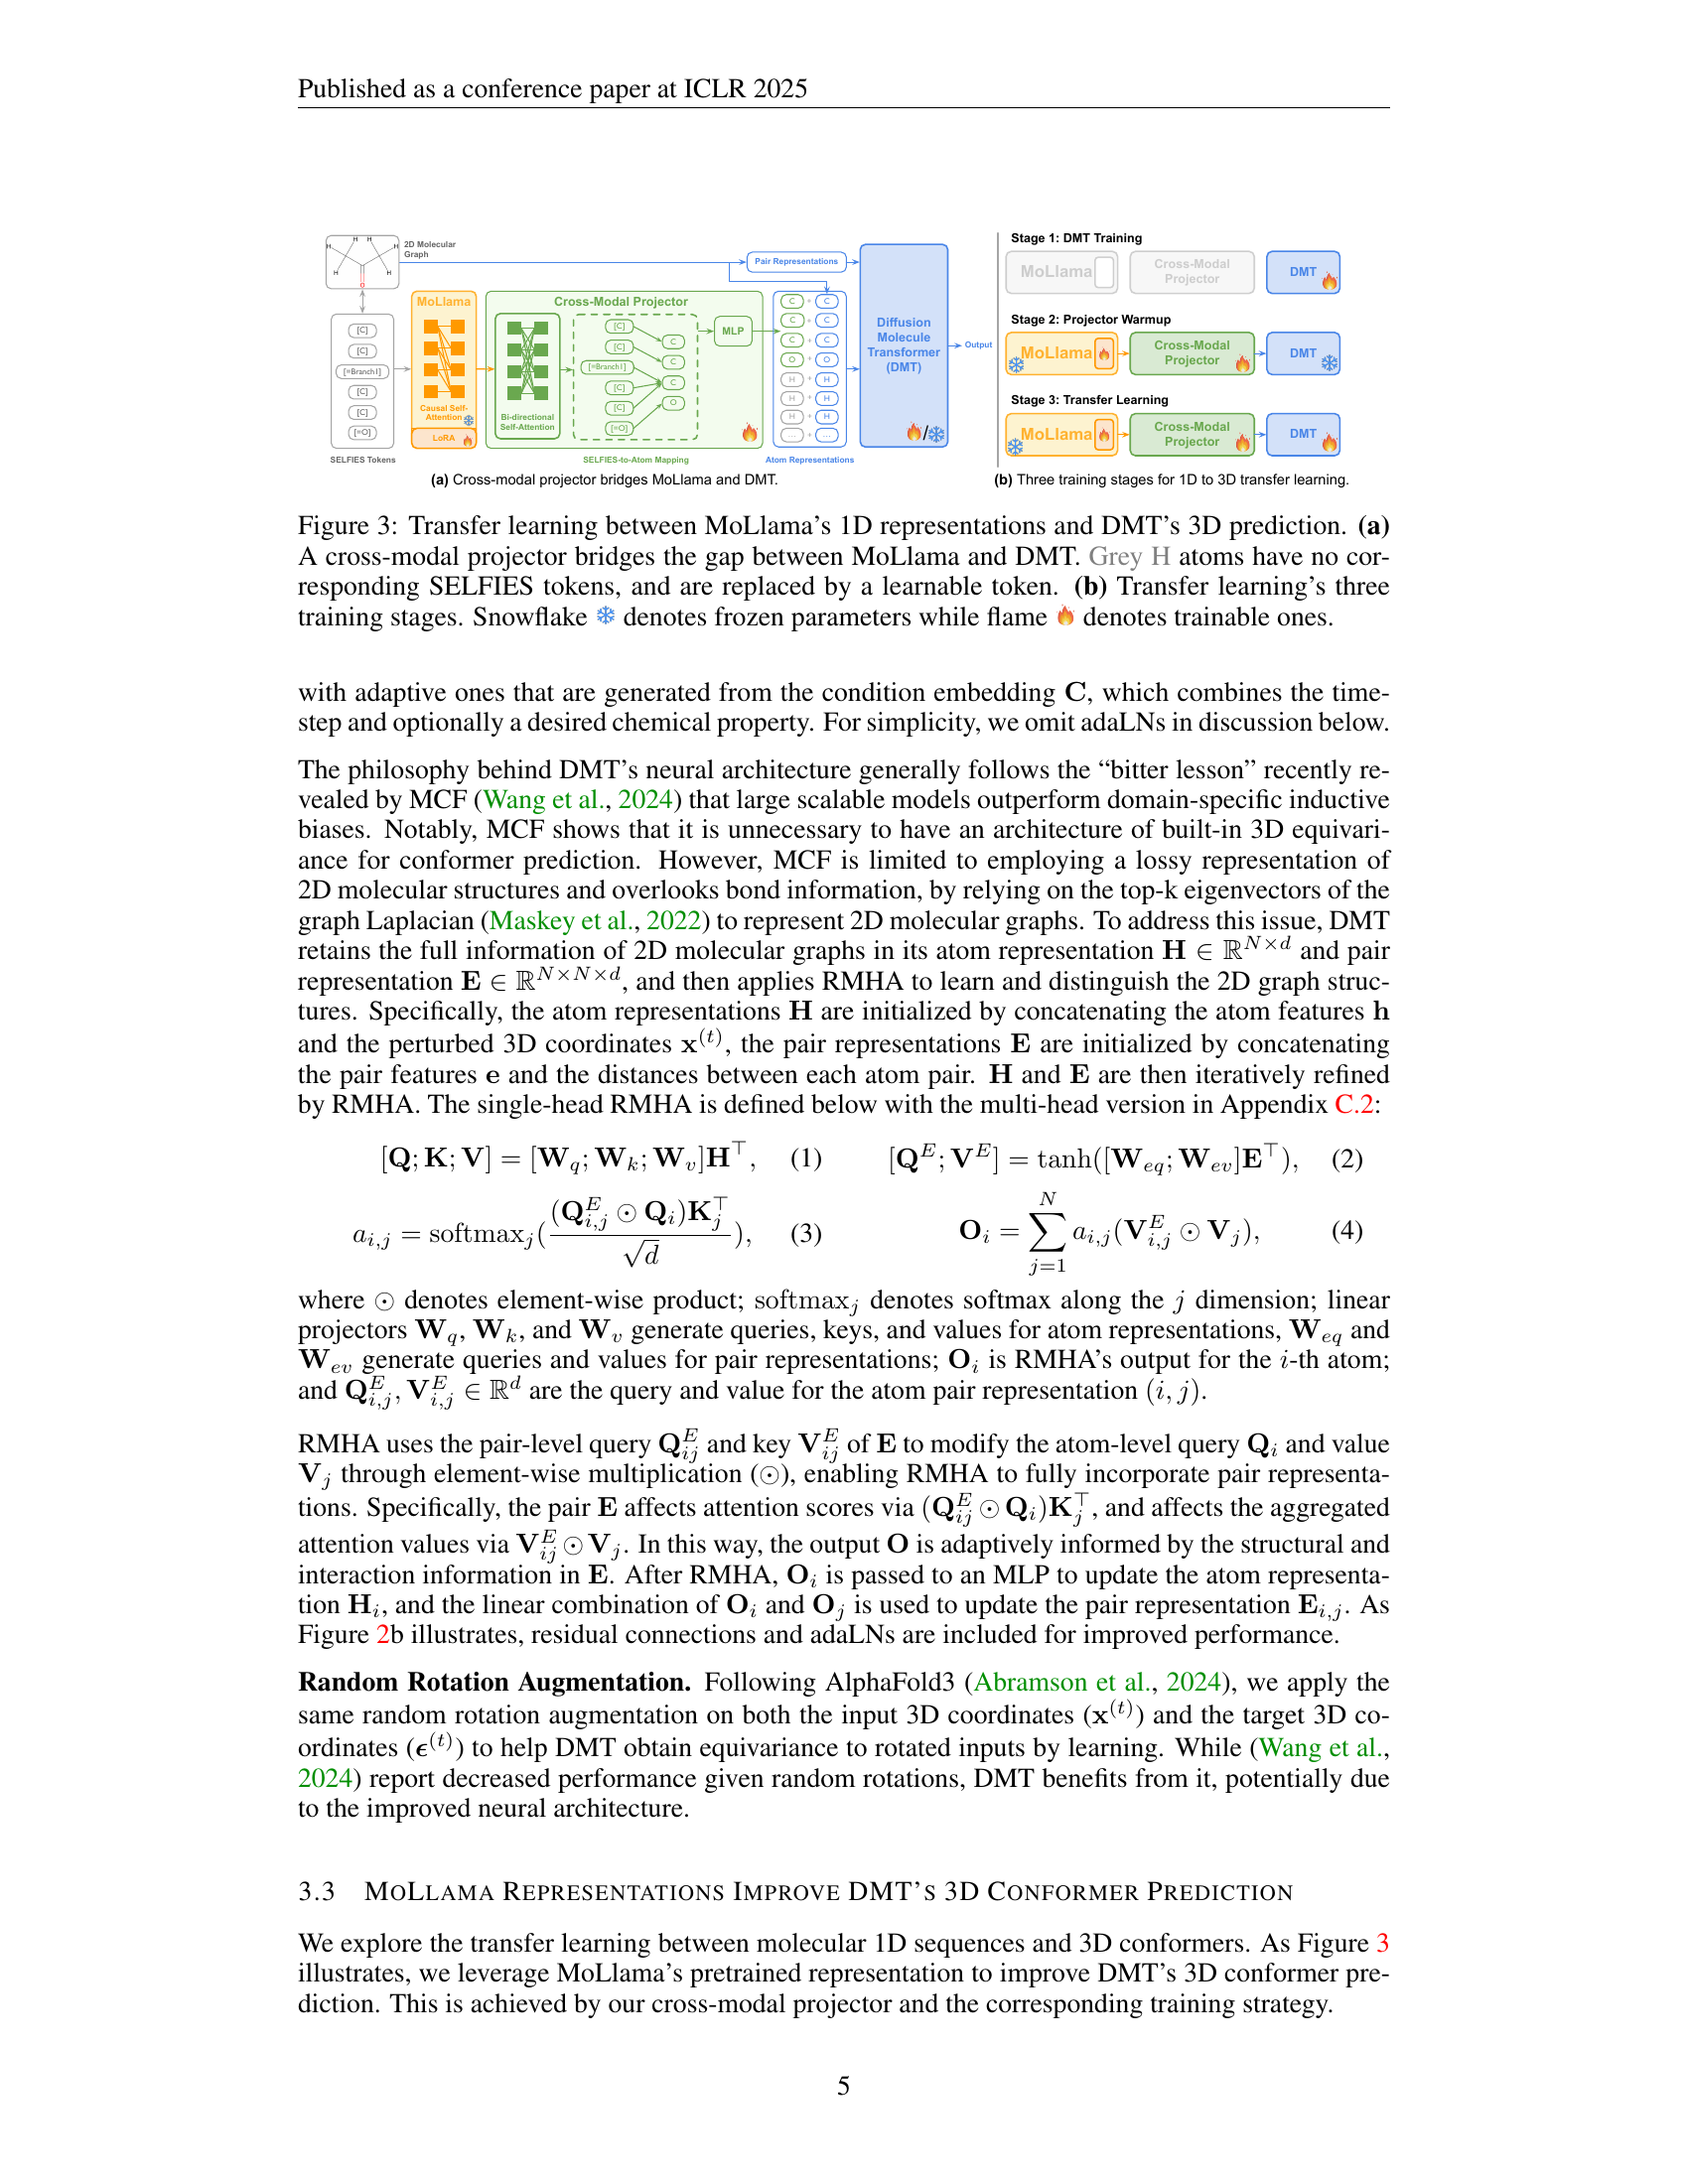
🔼 Figure 3 illustrates the transfer learning process used in NEXT-Mol to leverage 1D molecular representations from MoLlama to improve 3D conformer prediction with DMT. Panel (a) details the cross-modal projector, which bridges MoLlama’s output (SELFIES tokens) and the DMT’s 3D prediction. The projector addresses how the 1D sequence doesn’t directly map to atoms in 3D structure (especially for Hydrogen atoms, indicated in grey). Panel (b) outlines the three training stages for transfer learning: 1) DMT is initially trained in isolation, 2) the projector is warmed-up with MoLlama parameters frozen, and 3) the entire model is fine-tuned. The use of snowflakes and flames in Panel (b) visually denotes which model components are frozen versus trainable during each stage.
read the caption
Figure 3: Transfer learning between MoLlama’s 1D representations and DMT’s 3D prediction. (a) A cross-modal projector bridges the gap between MoLlama and DMT. Grey H atoms have no corresponding SELFIES tokens, and are replaced by a learnable token. (b) Transfer learning’s three training stages. Snowflake denotes frozen parameters while flame denotes trainable ones.

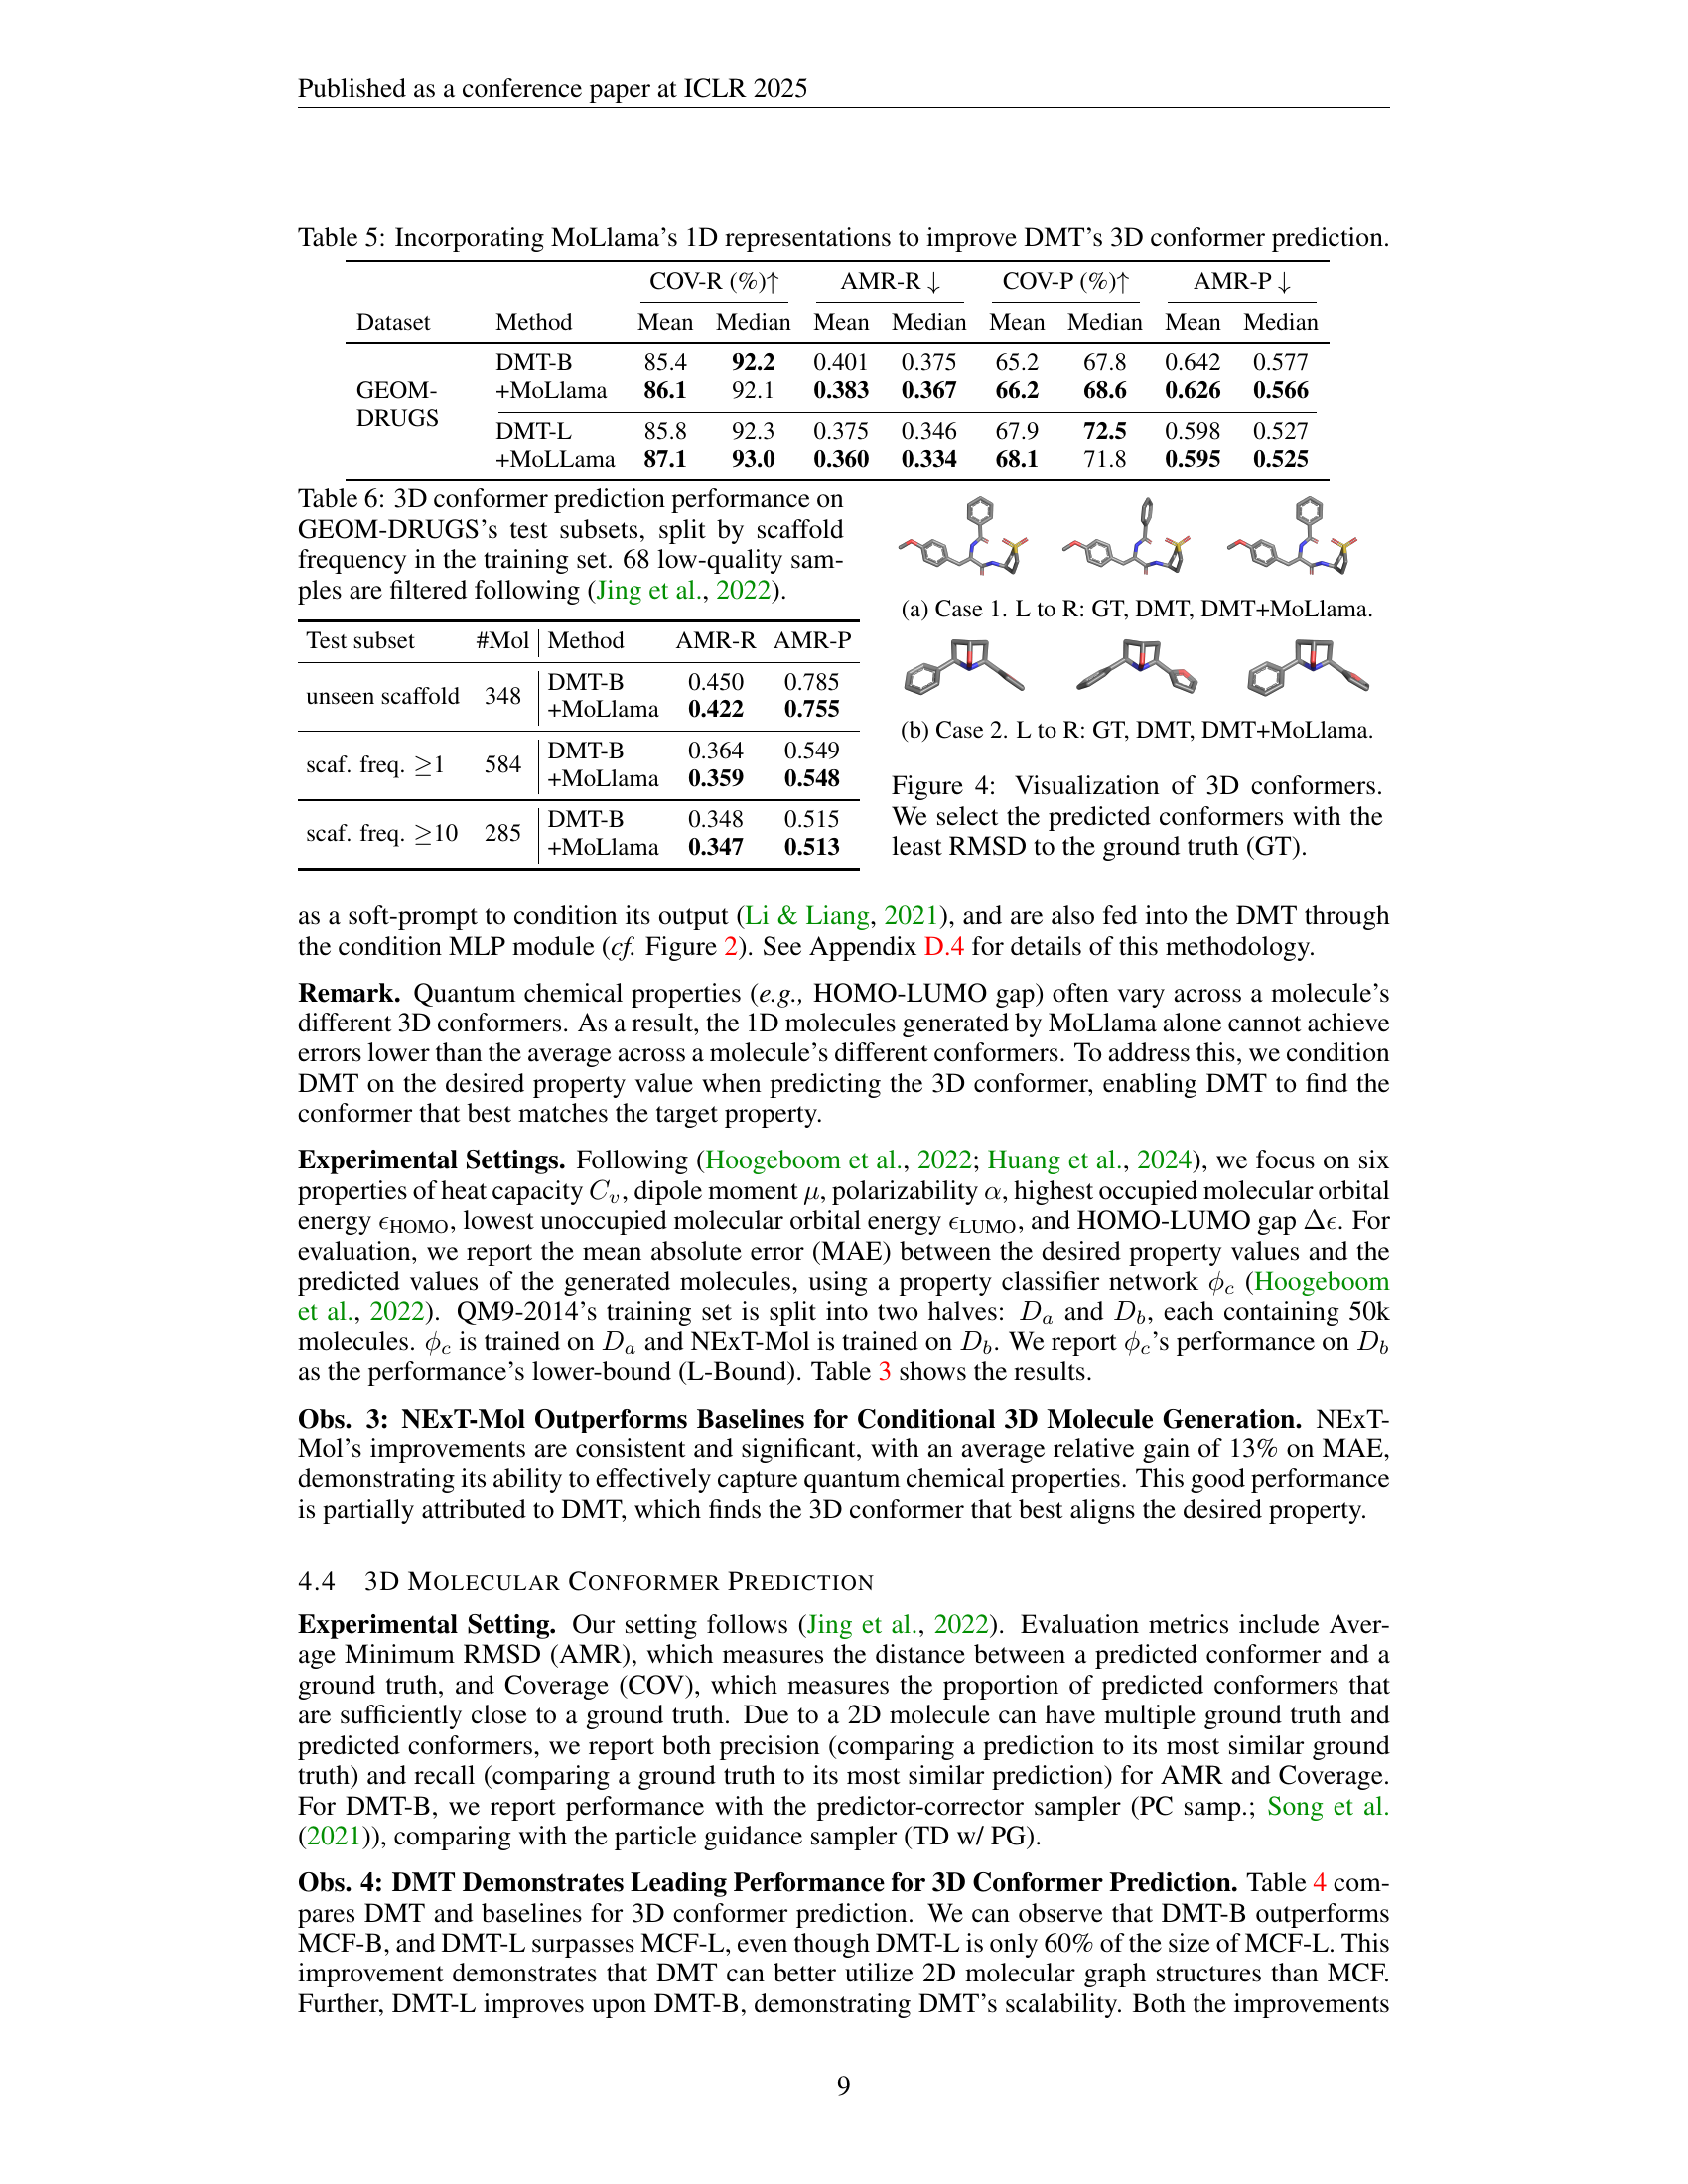
🔼 This table presents the results of 3D conformer prediction experiments conducted on the GEOM-DRUGS dataset. The key aspect is that the dataset is split into subsets based on the scaffold frequency observed within the training set. This allows for an evaluation of how well the model generalizes to unseen molecular structures (those with infrequent scaffolds). The results are broken down for different model configurations (DMT-B and DMT-B with MoLlama) and show metrics like AMR-R (Average Minimum RMSD Recall) and AMR-P (Average Minimum RMSD Precision) for three subsets: unseen scaffolds, scaffolds with frequency ≥1, and scaffolds with frequency ≥10. This detailed breakdown helps to assess the model’s performance on various degrees of structural novelty. The caption also notes that 68 low-quality samples were removed from the dataset before evaluation, following the methodology of a prior study (Jing et al., 2022).
read the caption
Table 6: 3D conformer prediction performance on GEOM-DRUGS’s test subsets, split by scaffold frequency in the training set. 68 low-quality samples are filtered following (Jing et al., 2022).

🔼 The figure visualizes 3D conformers generated by three different methods: ground truth (GT), DMT (Diffusion Molecular Transformer), and DMT+MoLlama (DMT combined with MoLlama, a language model). The image showcases how the addition of MoLlama enhances DMT’s ability to accurately predict the 3D structure of a molecule, as demonstrated by the reduction in the root mean square deviation (RMSD) between the predicted conformer and ground truth.
read the caption
(a) Case 1. L to R: GT, DMT, DMT+MoLlama.

🔼 This figure visualizes the 3D conformers generated by three different methods: the ground truth conformer, the conformer predicted by the Diffusion Molecular Transformer (DMT) model alone, and the conformer predicted by the DMT model enhanced with MoLlama’s 1D representations. The goal is to show the improvement in 3D conformer prediction accuracy when incorporating MoLlama’s 1D information, as reflected by the Root Mean Square Deviation (RMSD) values.
read the caption
(b) Case 2. L to R: GT, DMT, DMT+MoLlama.

🔼 Figure 4 showcases a comparison of ground truth (GT) 3D molecular conformations with those predicted by two models: DMT (Diffusion Molecular Transformer) alone and DMT enhanced by incorporating MoLlama’s 1D representations. For each molecule, the predicted conformer with the lowest Root Mean Square Deviation (RMSD) from the ground truth is selected for display. This visual comparison highlights the improvement in 3D conformer prediction accuracy achieved by integrating the 1D language model, showcasing NExT-Mol’s ability to generate more accurate and realistic 3D molecular structures.
read the caption
Figure 4: Visualization of 3D conformers. We select the predicted conformers with the least RMSD to the ground truth (GT).

🔼 This figure shows the impact of varying the number of sampling steps on the performance of the Diffusion Molecule Transformer (DMT-B) model for 3D conformer prediction. The x-axis represents the number of sampling steps (on a logarithmic scale), and the y-axis shows the Average Minimum Root Mean Square Deviation (AMR). Separate lines are shown for both AMR-Recall and AMR-Precision, illustrating the precision and recall trade-offs at different sampling step counts. The results are presented for the GEOM-DRUGS and GEOM-QM9 datasets, revealing how the model’s accuracy changes as the number of sampling steps increases. The plot demonstrates the relationship between the computational cost (more sampling steps equals more computation) and the accuracy of the model.
read the caption
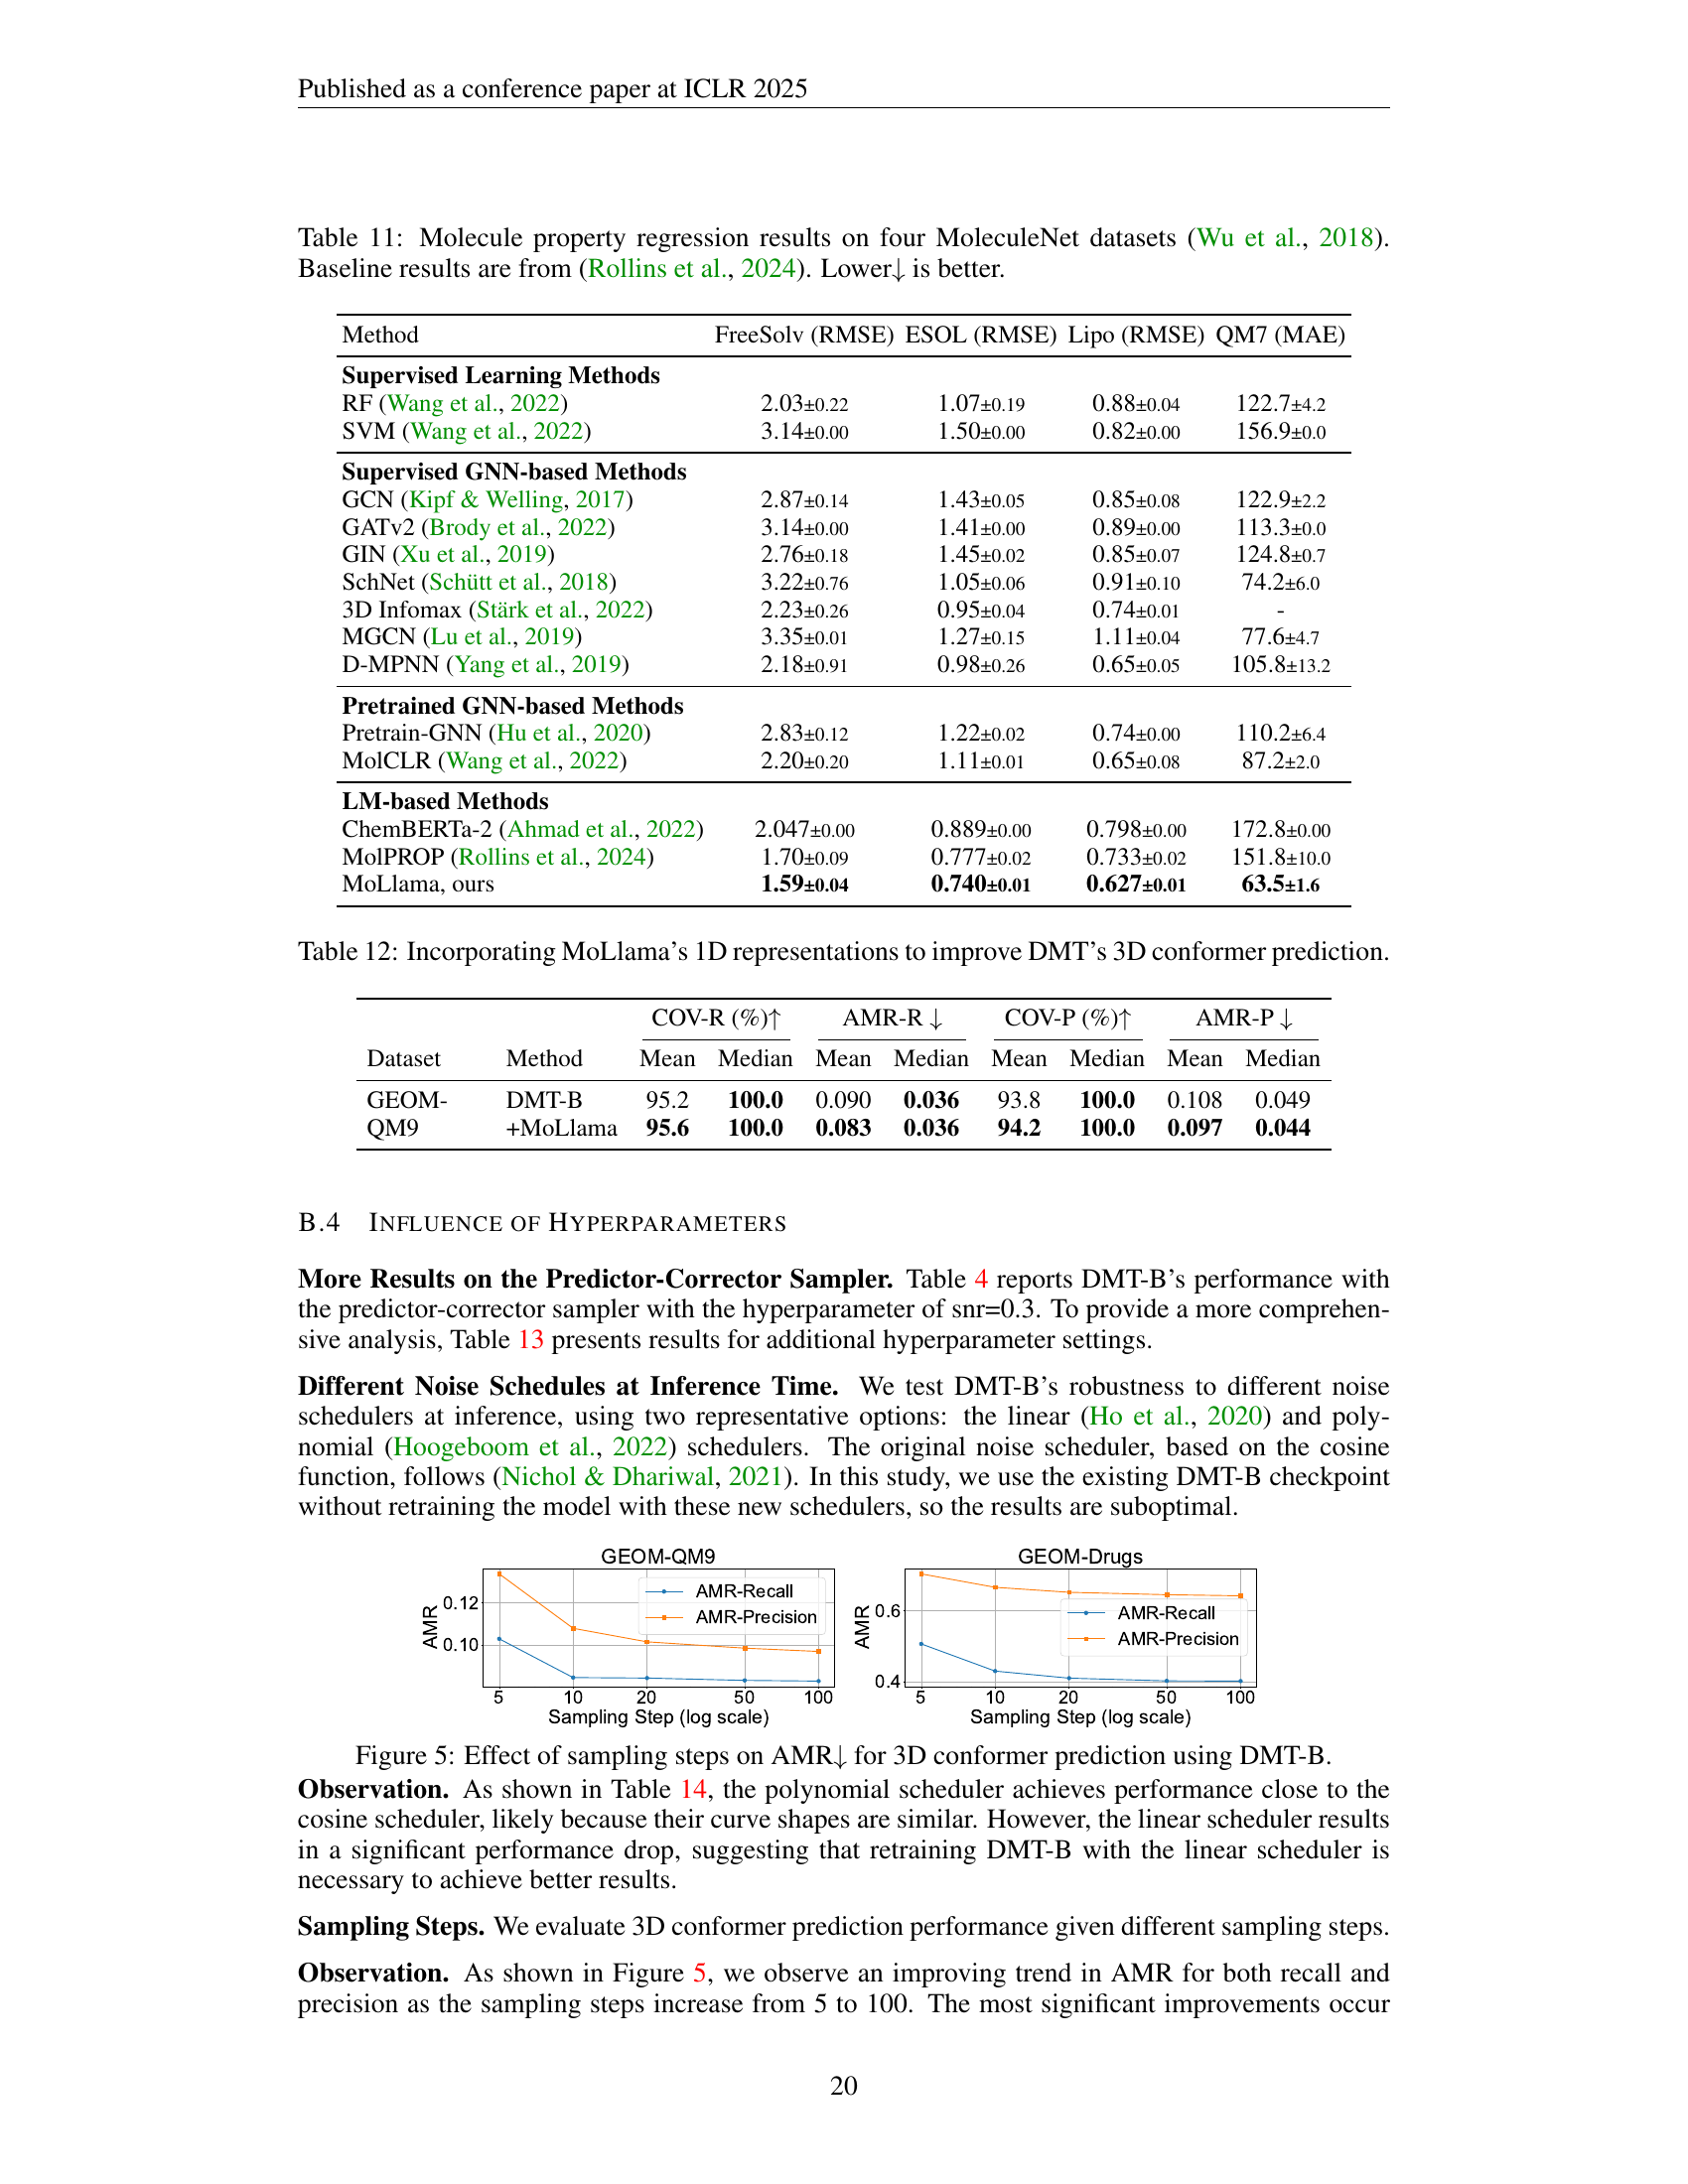
Figure 5: Effect of sampling steps on AMR↓↓\downarrow↓ for 3D conformer prediction using DMT-B.

🔼 Figure 6 presents a comparison of the computational time required for generating conformers using different methods on the GEOM-Drugs dataset’s test set. The graph visually represents the efficiency of various approaches in predicting molecular conformations, comparing the time taken by different methods (DMT-B, DMT-L, OMEGA, and TD w/ PG). This comparison highlights the relative computational efficiency of each method, providing insights into their practical applicability in drug discovery and material design processes, where efficient generation of conformers is crucial.
read the caption
Figure 6: Comparison of conformer generation time on the test set of the GEOM-Drugs dataset using various methods.

🔼 This figure visualizes 3D conformers predicted by DMT-B and DMT-B enhanced with MoLlama’s 1D representations. Each row shows the ground truth conformer, a conformer predicted by DMT-B alone, and a conformer predicted by DMT-B incorporating MoLlama’s 1D information. The root mean square deviation (RMSD) values between each prediction and the ground truth conformer are shown. The improvements in prediction accuracy after incorporating MoLlama’s representations are evident in the lower RMSD values.
read the caption
(a) Ground truth.

🔼 The figure shows a comparison of predicted and actual 3D conformers. Specifically, it displays a predicted 3D molecular structure generated using the Diffusion Molecular Transformer (DMT-B) model. The caption indicates a root mean square deviation (RMSD) value of 0.90 between the predicted and true conformer, suggesting a relatively large difference in structural geometry. The visual representation highlights the discrepancies between the predicted and actual structures of the molecule.
read the caption
(b) DMT-B’s prediction (RMSD = 0.90).

🔼 This figure shows the result of 3D conformer prediction using the DMT-B model enhanced with MoLlama’s 1D representations. Specifically, it displays a predicted 3D conformer with a low Root Mean Square Deviation (RMSD) of 0.05 compared to the ground truth. This illustrates the model’s improved ability to generate accurate 3D molecular structures, particularly when leveraging information from the MoLlama language model.
read the caption
(c) DMT-B + MoLlama’s prediction (RMSD = 0.05).

🔼 Figure 7 visualizes 3D conformers and the results predicted by DMT-B and DMT-B+MoLlama. For each molecule, the conformer with the lowest RMSD to the ground truth is selected. The ground truths are selected from the test set of GEOM-DRUGS with unseen scaffolds in the training set.
read the caption
(d) Ground truth.

🔼 This figure shows a comparison of three 3D conformers: a ground truth conformer, a conformer predicted using the DMT-B model, and a conformer predicted using DMT-B combined with MoLlama’s 1D representations. The root mean square deviation (RMSD) between the ground truth conformer and DMT-B’s prediction is 0.87 angstroms. This illustrates the improvement achieved by incorporating the 1D representations from MoLlama to improve the accuracy of 3D conformer prediction. Lower RMSD values indicate better prediction accuracy.
read the caption
(e) DMT-B’s prediction (RMSD = 0.87).

🔼 This figure visualizes the 3D conformer prediction results for a molecule. The image shows three 3D conformers: (a) the ground truth conformer obtained from the GEOM-DRUGS dataset, (b) the conformer predicted using only the DMT-B model, and (c) the conformer predicted using both the DMT-B and MoLlama models. The Root Mean Square Deviation (RMSD) values, a measure of structural similarity between the conformers, are provided to quantify the differences between the predicted conformers and the ground truth. Lower RMSD values indicate better prediction accuracy.
read the caption
(f) DMT-B + MoLlama’s prediction (RMSD = 0.06).

🔼 This figure visualizes a 3D conformer predicted by DMT-B, with and without using MoLlama’s 1D representations, alongside its ground truth conformer. The root-mean-square deviation (RMSD) values are provided to quantify the difference between predicted and ground truth conformers. The image showcases the model’s capability to generate accurate and valid conformers when incorporating MoLlama’s representations.
read the caption
(g) Ground truth.

🔼 This figure shows a comparison of three different 3D conformers for a molecule. The first conformer is the ground truth, which represents the actual 3D structure of the molecule. The second conformer was generated by the Diffusion Molecular Transformer (DMT-B) model without the assistance of the Molecular Llama (MoLlama) Language Model. The third conformer was generated by DMT-B with the assistance of MoLlama. The Root Mean Square Deviation (RMSD) values are provided for each conformer to quantify the differences between the predicted conformers and the ground truth. A lower RMSD value indicates a better prediction. In this instance, the conformer predicted by DMT-B in conjunction with MoLlama shows a significantly lower RMSD value than the conformer predicted by DMT-B alone, highlighting the effectiveness of incorporating the MoLlama Language Model to enhance the prediction accuracy of the 3D conformers.
read the caption
(h) DMT-B’s prediction (RMSD = 0.84).

🔼 This figure visualizes a 3D conformer predicted by the model DMT-B enhanced with MoLlama’s 1D representations. It shows the predicted conformer’s spatial arrangement of atoms, demonstrating how incorporating MoLlama’s 1D representation improves the model’s ability to accurately predict 3D conformers. The RMSD (Root Mean Square Deviation) value of 0.07 indicates a relatively good match between the predicted and ground truth conformers, highlighting the effectiveness of the model.
read the caption
(i) DMT-B + MoLlama’s prediction (RMSD = 0.07).

🔼 Figure 7 visualizes 3D conformers and the prediction results by DMT-B and DMT-B+MoLlama. For each model, the conformer with the least RMSD to the ground truth conformer is selected. The conformers in the figure are selected from the test set of GEOM-DRUGS with unseen scaffolds in the training set.
read the caption
(j) Ground truth.

🔼 This figure is a visualization of 3D conformers. It shows the ground truth conformer, the conformer predicted by DMT-B (a diffusion molecular transformer model), and the conformer predicted by DMT-B+MoLlama (DMT-B combined with a molecular language model, MoLlama). The image displays the predicted conformers with the lowest RMSD (root mean square deviation) values compared to the ground truth conformer. The goal is to demonstrate the improved accuracy of 3D conformer prediction when MoLlama is integrated with DMT-B. The RMSD values are displayed for each prediction, quantifying the difference between the predicted and ground truth conformers.
read the caption
(k) DMT-B’s prediction (RMSD = 0.86).
More on tables
| Task | Dataset |
|---|---|
| De novo 3D Mol Gen | GEOM-DRUGS, QM9-2014 |
| Conditional 3D Mol Gen | QM9-2014 |
| 3D Conformer Pred | GEOM-DRUGS, GEOM-QM9 |
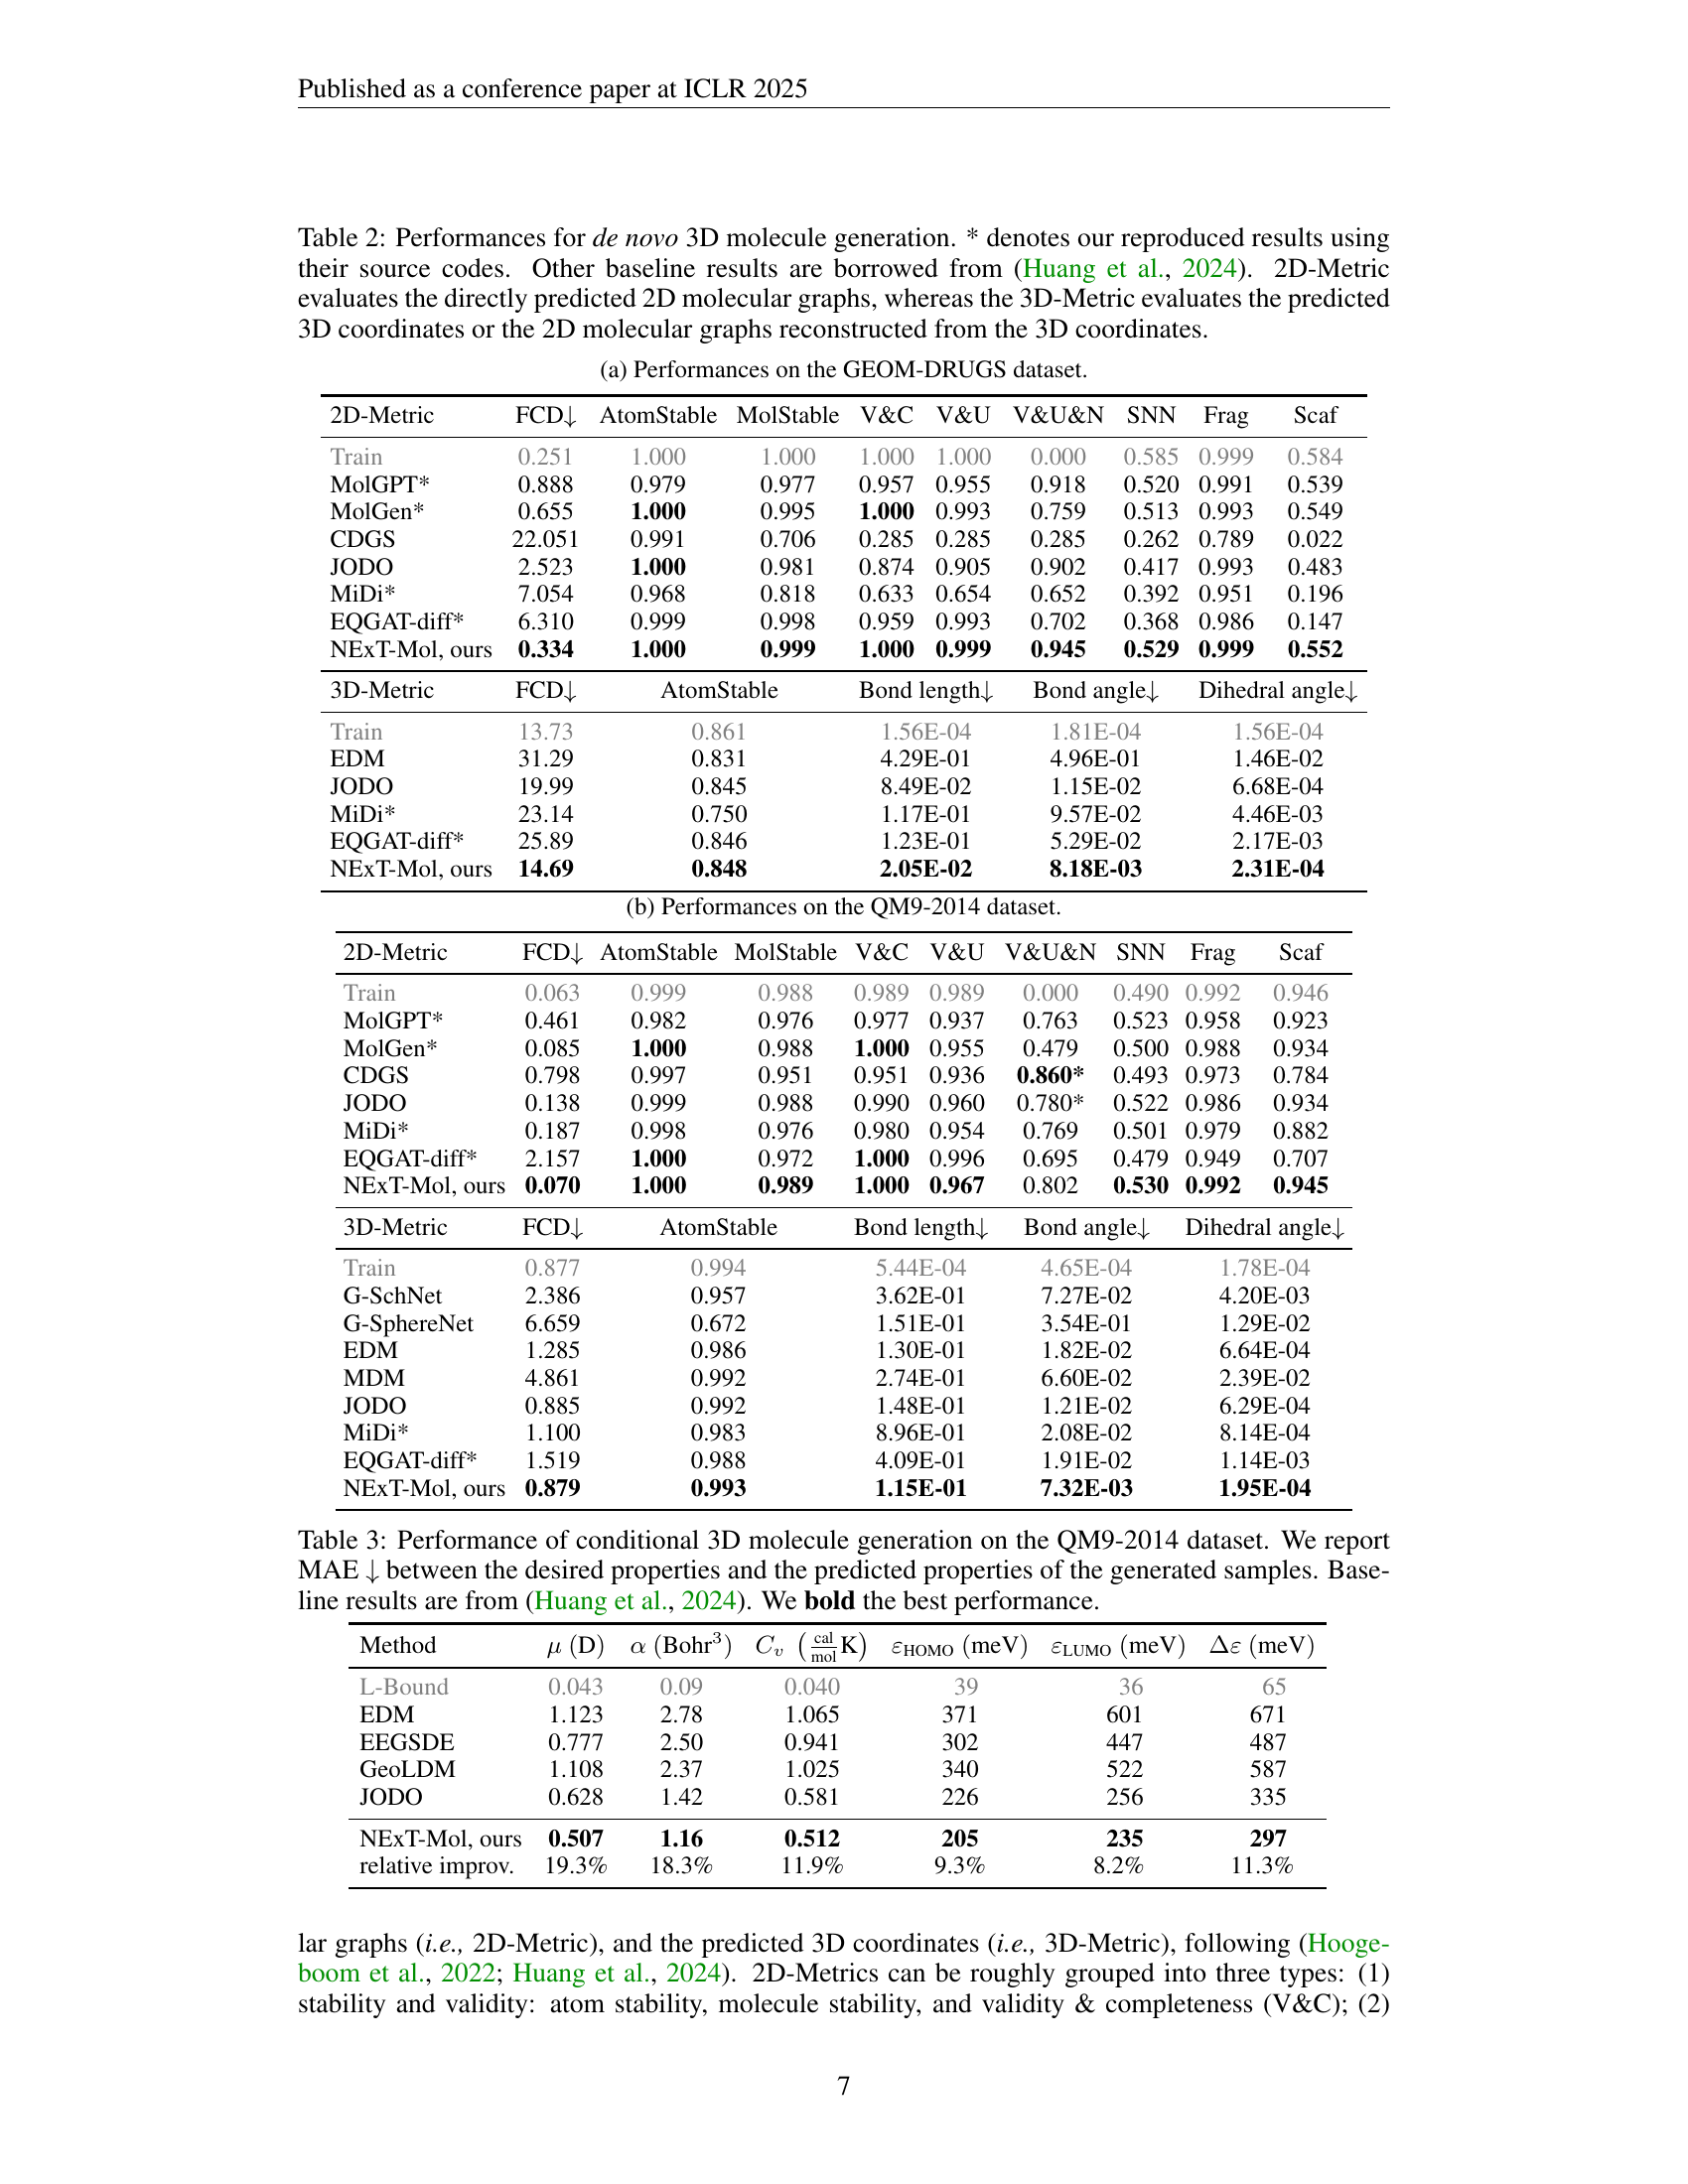
🔼 This table presents the performance comparison of different models on de novo 3D molecule generation. The results are evaluated using two sets of metrics: 2D-Metrics and 3D-Metrics. 2D-Metrics assess the quality of the directly predicted 2D molecular graphs, while 3D-Metrics evaluate the predicted 3D coordinates, or the 2D graphs reconstructed from these 3D coordinates. The table includes several metrics within both the 2D and 3D categories to comprehensively evaluate different aspects of molecule generation, including validity, stability, diversity, and similarity to known molecules. Results marked with an asterisk (*) indicate that those values were reproduced by the authors using the original source code from the cited papers, while others are taken directly from a prior study by Huang et al. (2024). This allows for a direct comparison of NEXT-Mol’s performance against existing state-of-the-art methods.
read the caption
Table 2: Performances for de novo 3D molecule generation. * denotes our reproduced results using their source codes. Other baseline results are borrowed from (Huang et al., 2024). 2D-Metric evaluates the directly predicted 2D molecular graphs, whereas the 3D-Metric evaluates the predicted 3D coordinates or the 2D molecular graphs reconstructed from the 3D coordinates.
| 2D-Metric | FCD | AtomStable | MolStable | V&C | V&U | V&U&N | SNN | Frag | Scaf |
|---|---|---|---|---|---|---|---|---|---|
| Train | 0.251 | 1.000 | 1.000 | 1.000 | 1.000 | 0.000 | 0.585 | 0.999 | 0.584 |
| MolGPT* | 0.888 | 0.979 | 0.977 | 0.957 | 0.955 | 0.918 | 0.520 | 0.991 | 0.539 |
| MolGen* | 0.655 | 1.000 | 0.995 | 1.000 | 0.993 | 0.759 | 0.513 | 0.993 | 0.549 |
| CDGS | 22.051 | 0.991 | 0.706 | 0.285 | 0.285 | 0.285 | 0.262 | 0.789 | 0.022 |
| JODO | 2.523 | 1.000 | 0.981 | 0.874 | 0.905 | 0.902 | 0.417 | 0.993 | 0.483 |
| MiDi* | 7.054 | 0.968 | 0.818 | 0.633 | 0.654 | 0.652 | 0.392 | 0.951 | 0.196 |
| EQGAT-diff* | 6.310 | 0.999 | 0.998 | 0.959 | 0.993 | 0.702 | 0.368 | 0.986 | 0.147 |
| NExT-Mol, ours | 0.334 | 1.000 | 0.999 | 1.000 | 0.999 | 0.945 | 0.529 | 0.999 | 0.552 |
| 3D-Metric | FCD | AtomStable | Bond length | Bond angle | Dihedral angle | ||||
| Train | 13.73 | 0.861 | 1.56E-04 | 1.81E-04 | 1.56E-04 | ||||
| EDM | 31.29 | 0.831 | 4.29E-01 | 4.96E-01 | 1.46E-02 | ||||
| JODO | 19.99 | 0.845 | 8.49E-02 | 1.15E-02 | 6.68E-04 | ||||
| MiDi* | 23.14 | 0.750 | 1.17E-01 | 9.57E-02 | 4.46E-03 | ||||
| EQGAT-diff* | 25.89 | 0.846 | 1.23E-01 | 5.29E-02 | 2.17E-03 | ||||
| NExT-Mol, ours | 14.69 | 0.848 | 2.05E-02 | 8.18E-03 | 2.31E-04 | ||||
🔼 Table 2 presents the performance of the NEXT-Mol model on the GEOM-DRUGS dataset for de novo 3D molecule generation. It compares NEXT-Mol against various other methods, evaluating both 2D and 3D metrics. The 2D metrics assess the quality of the generated 2D molecular graphs, including atom stability, molecule stability, validity, uniqueness, and novelty. The 3D metrics evaluate the quality of the generated 3D molecule coordinates based on root-mean-square deviation (RMSD) from ground truth conformers, considering fragment, scaffold, and overall similarity. The table provides a comprehensive comparison of NEXT-Mol with other models, allowing for a detailed assessment of its effectiveness in generating novel and accurate 3D molecular structures.
read the caption
(a) Performances on the GEOM-DRUGS dataset.
| 2D-Metric | FCD | AtomStable | MolStable | V&C | V&U | V&U&N | SNN | Frag | Scaf |
|---|---|---|---|---|---|---|---|---|---|
| Train | 0.063 | 0.999 | 0.988 | 0.989 | 0.989 | 0.000 | 0.490 | 0.992 | 0.946 |
| MolGPT* | 0.461 | 0.982 | 0.976 | 0.977 | 0.937 | 0.763 | 0.523 | 0.958 | 0.923 |
| MolGen* | 0.085 | 1.000 | 0.988 | 1.000 | 0.955 | 0.479 | 0.500 | 0.988 | 0.934 |
| CDGS | 0.798 | 0.997 | 0.951 | 0.951 | 0.936 | 0.860* | 0.493 | 0.973 | 0.784 |
| JODO | 0.138 | 0.999 | 0.988 | 0.990 | 0.960 | 0.780* | 0.522 | 0.986 | 0.934 |
| MiDi* | 0.187 | 0.998 | 0.976 | 0.980 | 0.954 | 0.769 | 0.501 | 0.979 | 0.882 |
| EQGAT-diff* | 2.157 | 1.000 | 0.972 | 1.000 | 0.996 | 0.695 | 0.479 | 0.949 | 0.707 |
| NExT-Mol, ours | 0.070 | 1.000 | 0.989 | 1.000 | 0.967 | 0.802 | 0.530 | 0.992 | 0.945 |
| 3D-Metric | FCD | AtomStable | Bond length | Bond angle | Dihedral angle | ||||
| Train | 0.877 | 0.994 | 5.44E-04 | 4.65E-04 | 1.78E-04 | ||||
| G-SchNet | 2.386 | 0.957 | 3.62E-01 | 7.27E-02 | 4.20E-03 | ||||
| G-SphereNet | 6.659 | 0.672 | 1.51E-01 | 3.54E-01 | 1.29E-02 | ||||
| EDM | 1.285 | 0.986 | 1.30E-01 | 1.82E-02 | 6.64E-04 | ||||
| MDM | 4.861 | 0.992 | 2.74E-01 | 6.60E-02 | 2.39E-02 | ||||
| JODO | 0.885 | 0.992 | 1.48E-01 | 1.21E-02 | 6.29E-04 | ||||
| MiDi* | 1.100 | 0.983 | 8.96E-01 | 2.08E-02 | 8.14E-04 | ||||
| EQGAT-diff* | 1.519 | 0.988 | 4.09E-01 | 1.91E-02 | 1.14E-03 | ||||
| NExT-Mol, ours | 0.879 | 0.993 | 1.15E-01 | 7.32E-03 | 1.95E-04 | ||||
🔼 Table 2(b) presents the results of de novo 3D molecule generation on the QM9-2014 dataset. The table presents metrics evaluating the quality of the generated molecules across several aspects, including 2D and 3D structural metrics. 2D metrics assess aspects like atom and molecule stability, as well as validity and uniqueness. 3D metrics evaluate geometric similarity and stability by comparing predicted and true 3D structures. This allows comparison of NEXT-Mol’s performance against other state-of-the-art methods for generating molecules.
read the caption
(b) Performances on the QM9-2014 dataset.
| Method | ||||||
| L-Bound | 0.043 | 0.09 | 0.040 | 39 | 36 | 65 |
| EDM | 1.123 | 2.78 | 1.065 | 371 | 601 | 671 |
| EEGSDE | 0.777 | 2.50 | 0.941 | 302 | 447 | 487 |
| GeoLDM | 1.108 | 2.37 | 1.025 | 340 | 522 | 587 |
| JODO | 0.628 | 1.42 | 0.581 | 226 | 256 | 335 |
| NExT-Mol, ours | 0.507 | 1.16 | 0.512 | 205 | 235 | 297 |
| relative improv. | 19.3% | 18.3% | 11.9% | 9.3% | 8.2% | 11.3% |
🔼 This table presents the results of conditional 3D molecule generation on the QM9-2014 dataset. The goal was to generate molecules with specific target properties (quantum chemical properties). The table shows the Mean Absolute Error (MAE) between the desired properties and the predicted properties for each method evaluated. Lower MAE values indicate better performance. Baseline results are included for comparison, and the best-performing method for each property is highlighted in bold.
read the caption
Table 3: Performance of conditional 3D molecule generation on the QM9-2014 dataset. We report MAE ↓↓\downarrow↓ between the desired properties and the predicted properties of the generated samples. Baseline results are from (Huang et al., 2024). We bold the best performance.
| COV-R (%) | AMR-R | COV-P (%) | AMR-P | ||||||
| Method | Model Size | Mean | Median | Mean | Median | Mean | Median | Mean | Median |
| Model size 100M | |||||||||
| OMEGA | - | 53.4 | 54.6 | 0.841 | 0.762 | 40.5 | 33.3 | 0.946 | 0.854 |
| GeoMol | 0.3M | 44.6 | 41.4 | 0.875 | 0.834 | 43.0 | 36.4 | 0.928 | 0.841 |
| GeoDiff | 1.6M | 42.1 | 37.8 | 0.835 | 0.809 | 24.9 | 14.5 | 1.136 | 1.090 |
| Torsional Diffusion | 1.6M | 72.7 | 80.0 | 0.582 | 0.565 | 55.2 | 56.9 | 0.778 | 0.729 |
| TD w/ PG | 1.6M | 77.0 | 82.6 | 0.543 | 0.520 | 68.9 | 78.1 | 0.656 | 0.594 |
| TD w/ PG* | 1.6M | 73.8 | 79.3 | 0.566 | 0.539 | 65.2 | 70.8 | 0.680 | 0.615 |
| MCF-S | 13M | 79.4 | 87.5 | 0.512 | 0.492 | 57.4 | 57.6 | 0.761 | 0.715 |
| MCF-B | 64M | 84.0 | 91.5 | 0.427 | 0.402 | 64.0 | 66.2 | 0.667 | 0.605 |
| DMT-B, ours | 55M | 85.4 | 92.2 | 0.401 | 0.375 | 65.2 | 67.8 | 0.642 | 0.577 |
| DMT-B, PC samp. | 55M | 85.5 | 91.2 | 0.396 | 0.370 | 67.6 | 71.5 | 0.623 | 0.546 |
| Model size 100M | |||||||||
| MCF-L | 242M | 84.7 | 92.2 | 0.390 | 0.247 | 66.8 | 71.3 | 0.618 | 0.530 |
| DMT-L, ours | 150M | 85.8 | 92.3 | 0.375 | 0.346 | 67.9 | 72.5 | 0.598 | 0.527 |
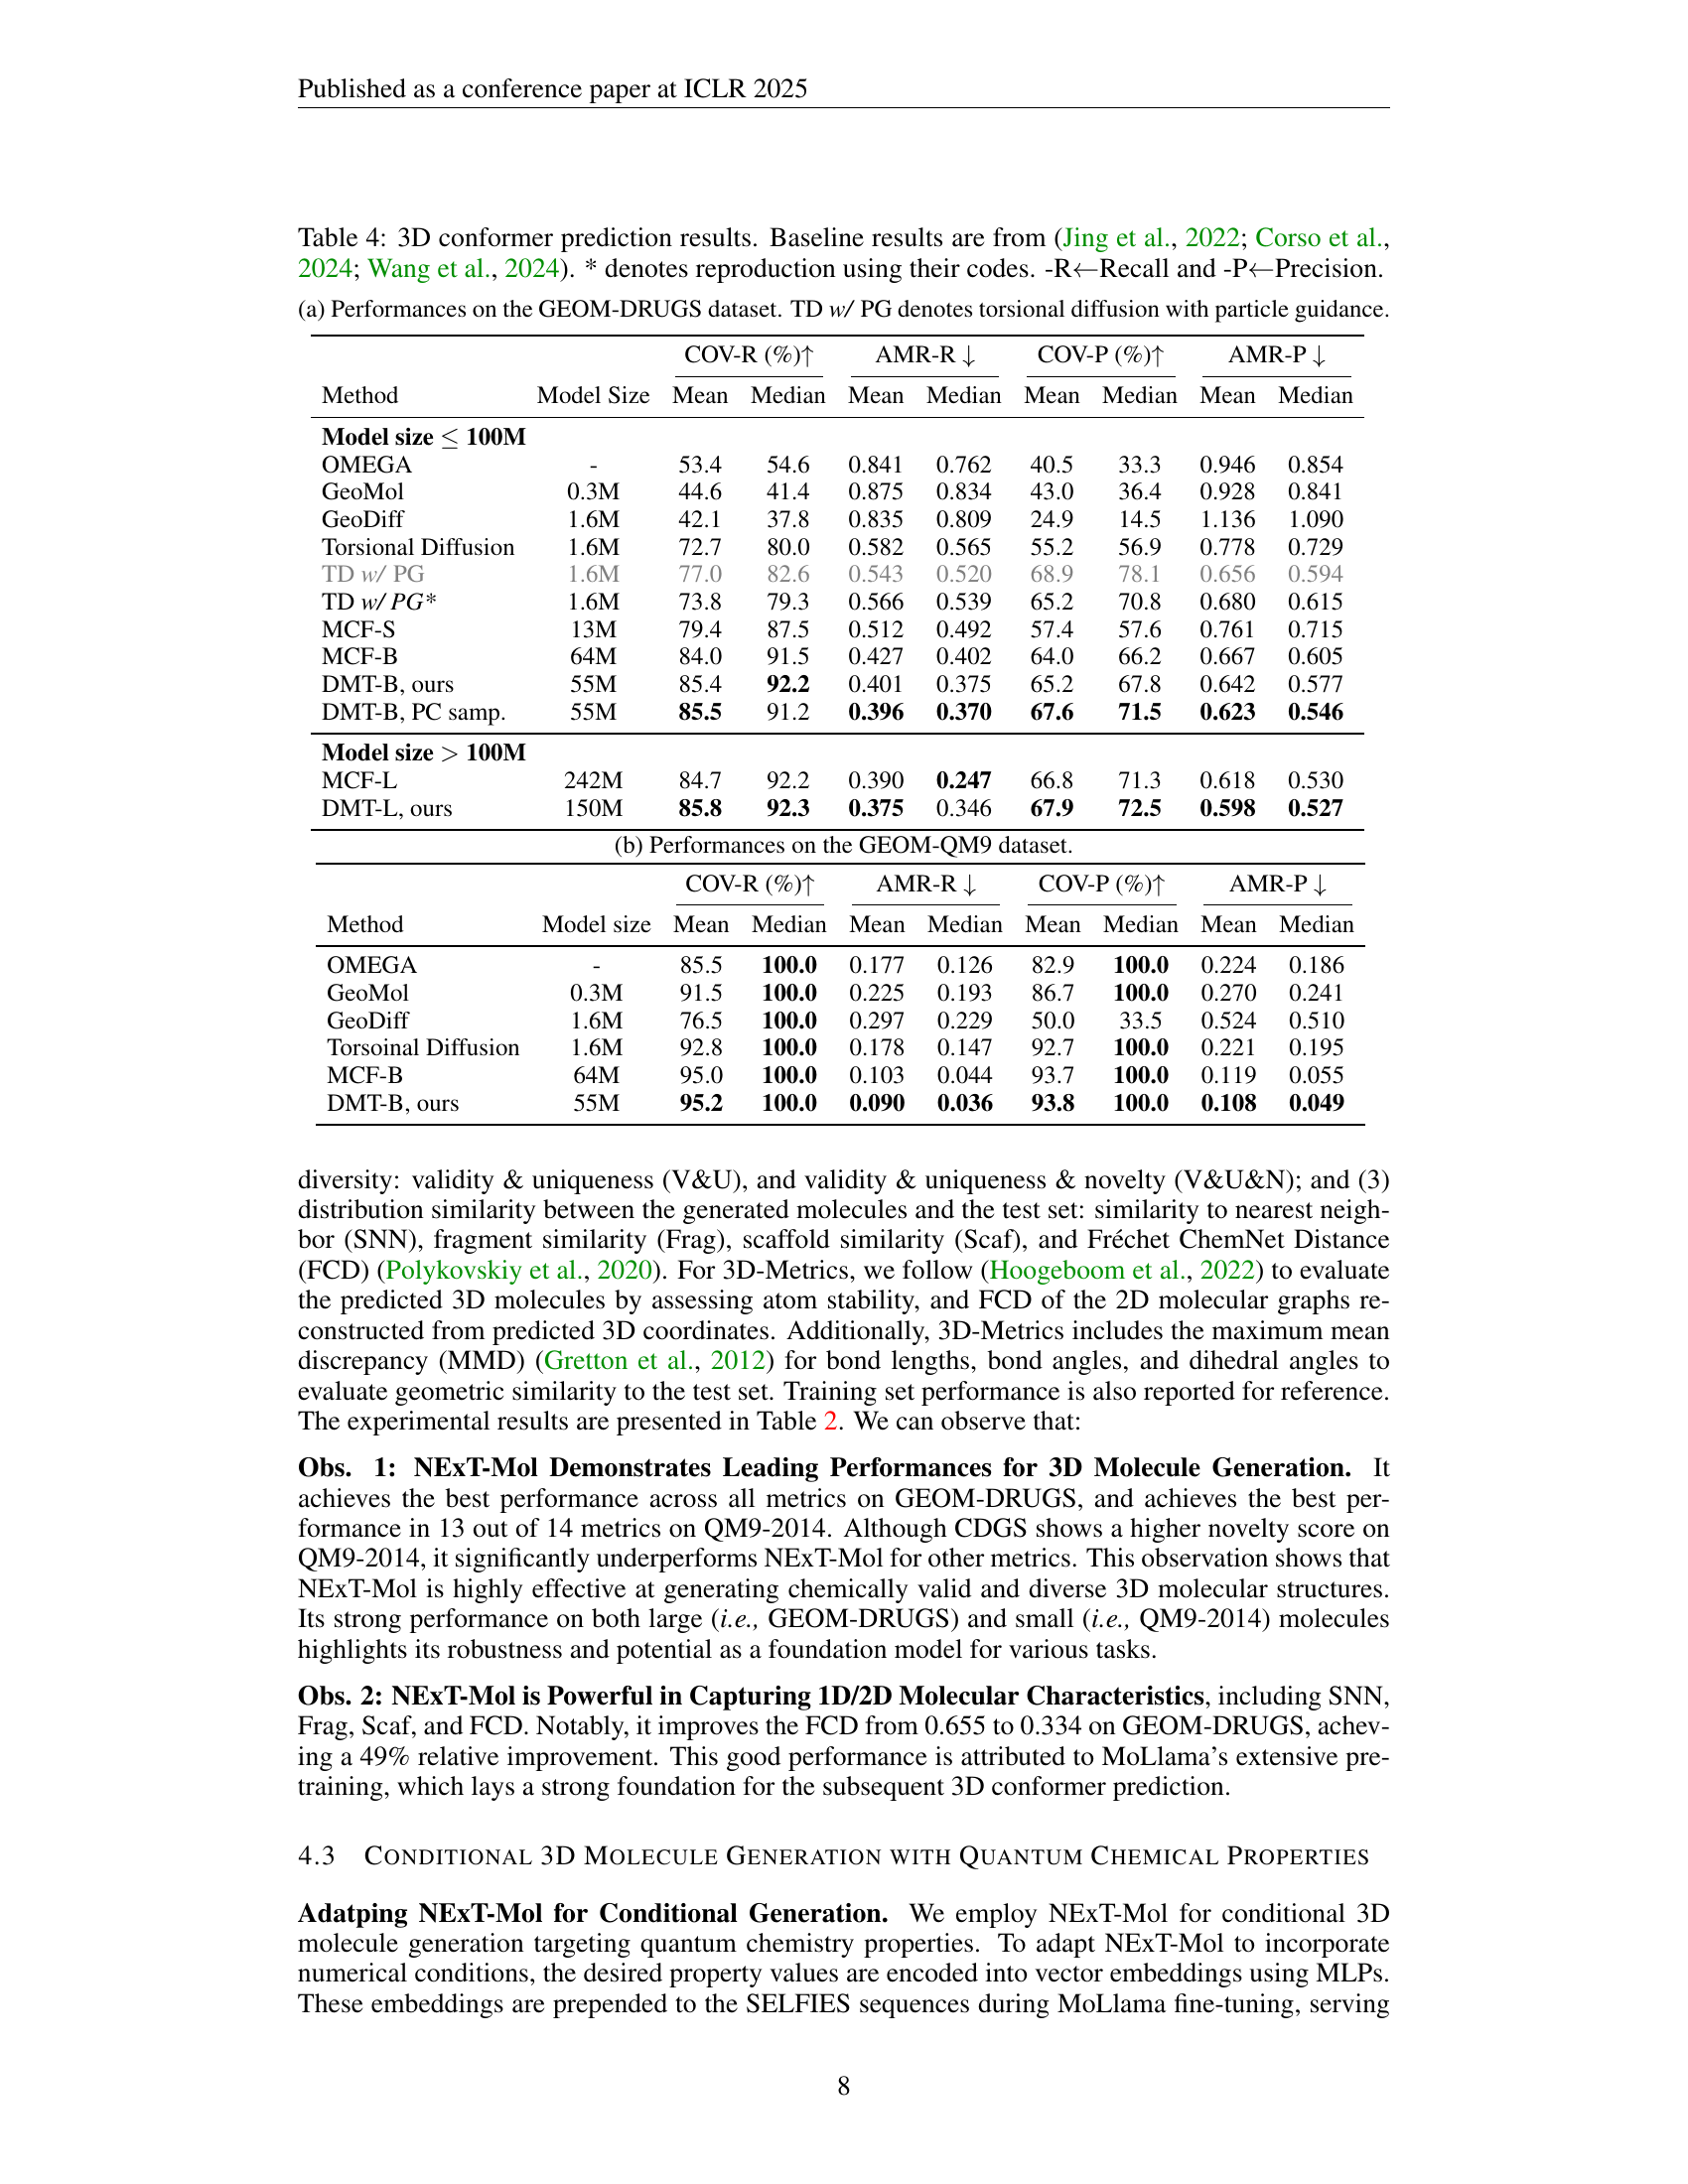
🔼 Table 4 presents the results of 3D conformer prediction experiments. It compares the performance of the proposed Diffusion Molecular Transformer (DMT) model against several baselines from recent literature. The metrics used to evaluate the models’ performance include Coverage (COV) and Average Minimum Root Mean Square Deviation (AMR), both reported as Recall and Precision. The table shows the mean and median values of these metrics for different model sizes, helping to understand the impact of model scale on performance. Results are presented for both the GEOM-DRUGS and GEOM-QM9 datasets. The caption indicates that some baseline results were reproduced using the authors’ code for better comparability.
read the caption
Table 4: 3D conformer prediction results. Baseline results are from (Jing et al., 2022; Corso et al., 2024; Wang et al., 2024). * denotes reproduction using their codes. -R←←\leftarrow←Recall and -P←←\leftarrow←Precision.
| COV-R (%) | AMR-R | COV-P (%) | AMR-P | ||||||
|---|---|---|---|---|---|---|---|---|---|
| Method | Model size | Mean | Median | Mean | Median | Mean | Median | Mean | Median |
| OMEGA | - | 85.5 | 100.0 | 0.177 | 0.126 | 82.9 | 100.0 | 0.224 | 0.186 |
| GeoMol | 0.3M | 91.5 | 100.0 | 0.225 | 0.193 | 86.7 | 100.0 | 0.270 | 0.241 |
| GeoDiff | 1.6M | 76.5 | 100.0 | 0.297 | 0.229 | 50.0 | 33.5 | 0.524 | 0.510 |
| Torsoinal Diffusion | 1.6M | 92.8 | 100.0 | 0.178 | 0.147 | 92.7 | 100.0 | 0.221 | 0.195 |
| MCF-B | 64M | 95.0 | 100.0 | 0.103 | 0.044 | 93.7 | 100.0 | 0.119 | 0.055 |
| DMT-B, ours | 55M | 95.2 | 100.0 | 0.090 | 0.036 | 93.8 | 100.0 | 0.108 | 0.049 |
🔼 This table presents the performance comparison of different methods for 3D conformer prediction on the GEOM-DRUGS dataset. The metrics used are COV-R (Coverage Recall), AMR-R (Average Minimum RMSD Recall), COV-P (Coverage Precision), and AMR-P (Average Minimum RMSD Precision). The table includes results for various methods, including OMEGA, GeoMol, GeoDiff, Torsional Diffusion (TD) with and without Particle Guidance (PG), MCF models (small and large), and the proposed DMT model (both small and large). The Model Size column shows the number of parameters for each model to provide context regarding model capacity.
read the caption
(a) Performances on the GEOM-DRUGS dataset. TD w/ PG denotes torsional diffusion with particle guidance.
| COV-R (%) | AMR-R | COV-P (%) | AMR-P | ||||||
|---|---|---|---|---|---|---|---|---|---|
| Dataset | Method | Mean | Median | Mean | Median | Mean | Median | Mean | Median |
| GEOM-DRUGS | DMT-B | 85.4 | 92.2 | 0.401 | 0.375 | 65.2 | 67.8 | 0.642 | 0.577 |
| +MoLlama | 86.1 | 92.1 | 0.383 | 0.367 | 66.2 | 68.6 | 0.626 | 0.566 | |
| DMT-L | 85.8 | 92.3 | 0.375 | 0.346 | 67.9 | 72.5 | 0.598 | 0.527 | |
| +MoLLama | 87.1 | 93.0 | 0.360 | 0.334 | 68.1 | 71.8 | 0.595 | 0.525 | |
🔼 This table presents the performance of the NEXT-Mol model on the GEOM-QM9 dataset for the de novo 3D molecule generation task. It provides a quantitative assessment of the model’s ability to generate novel 3D molecules using various metrics. These metrics evaluate different aspects of the generated molecules, including their validity, structural properties, and similarity to molecules in the training dataset. Both 2D and 3D metrics are provided to offer a comprehensive evaluation.
read the caption
(b) Performances on the GEOM-QM9 dataset.
| Test subset | #Mol | Method | AMR-R | AMR-P |
|---|---|---|---|---|
| unseen scaffold | 348 | DMT-B | 0.450 | 0.785 |
| +MoLlama | 0.422 | 0.755 | ||
| scaf. freq. 1 | 584 | DMT-B | 0.364 | 0.549 |
| +MoLlama | 0.359 | 0.548 | ||
| scaf. freq. 10 | 285 | DMT-B | 0.348 | 0.515 |
| +MoLlama | 0.347 | 0.513 |
🔼 This table presents the results of experiments evaluating the impact of incorporating MoLlama’s pretrained 1D molecular representations into DMT (Diffusion Molecular Transformer), a 3D diffusion model for conformer prediction. It shows a comparison of the performance of DMT alone versus DMT enhanced with MoLlama’s representations on two datasets, GEOM-DRUGS and GEOM-QM9. The metrics used are COV-R (Coverage Recall), AMR-R (Average Minimum RMSD Recall), COV-P (Coverage Precision), and AMR-P (Average Minimum RMSD Precision), illustrating improvements achieved by leveraging the 1D representations for 3D prediction.
read the caption
Table 5: Incorporating MoLlama’s 1D representations to improve DMT’s 3D conformer prediction.
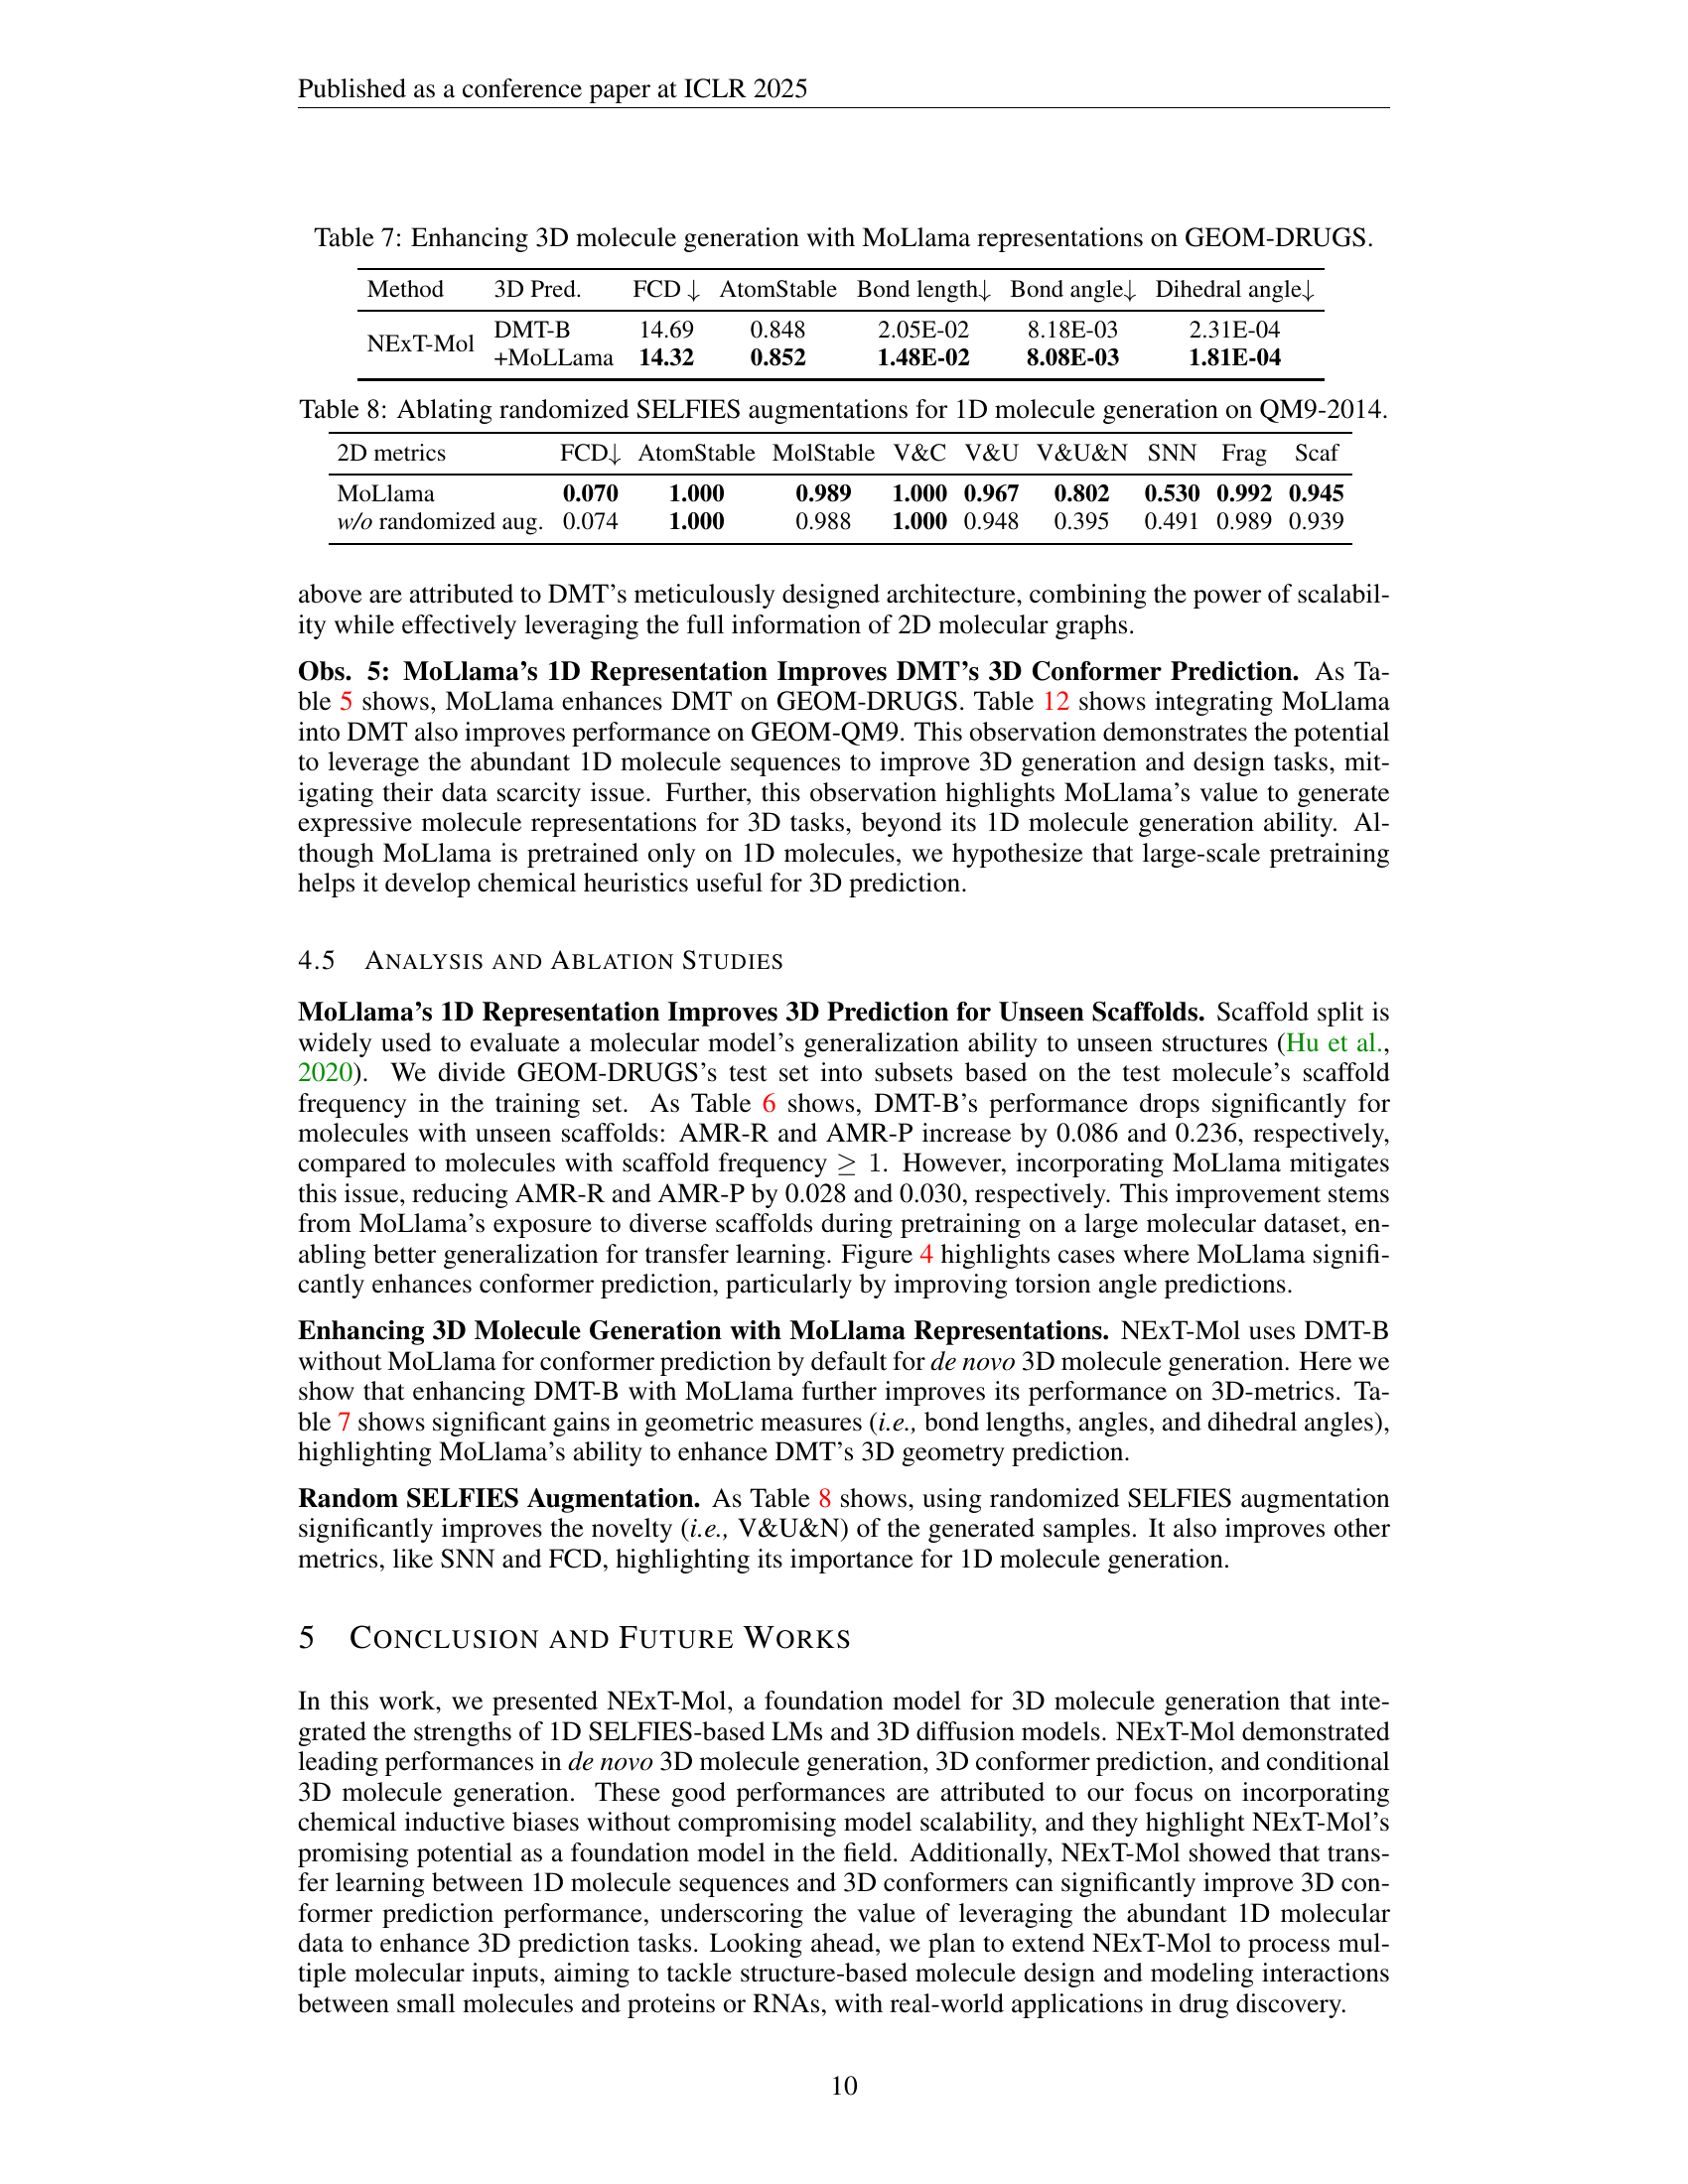
🔼 Table 7 presents a comparison of the performance of enhancing 3D molecule generation by incorporating MoLlama representations on the GEOM-DRUGS dataset. It compares the performance of a baseline model (DMT-B) with NEXT-Mol which integrates MoLlama representations. The metrics used include FCD (Fréchet ChemNet Distance), AtomStable, MolStable, Bond length, Bond angle, and Dihedral angle, assessing the quality and stability of the generated 3D molecular structures. The results show the impact of MoLlama’s 1D molecular representations on the various aspects of 3D generation.
read the caption
Table 7: Enhancing 3D molecule generation with MoLlama representations on GEOM-DRUGS.
| Method | 3D Pred. | FCD | AtomStable | Bond length | Bond angle | Dihedral angle |
|---|---|---|---|---|---|---|
| NExT-Mol | DMT-B | 14.69 | 0.848 | 2.05E-02 | 8.18E-03 | 2.31E-04 |
| +MoLLama | 14.32 | 0.852 | 1.48E-02 | 8.08E-03 | 1.81E-04 |
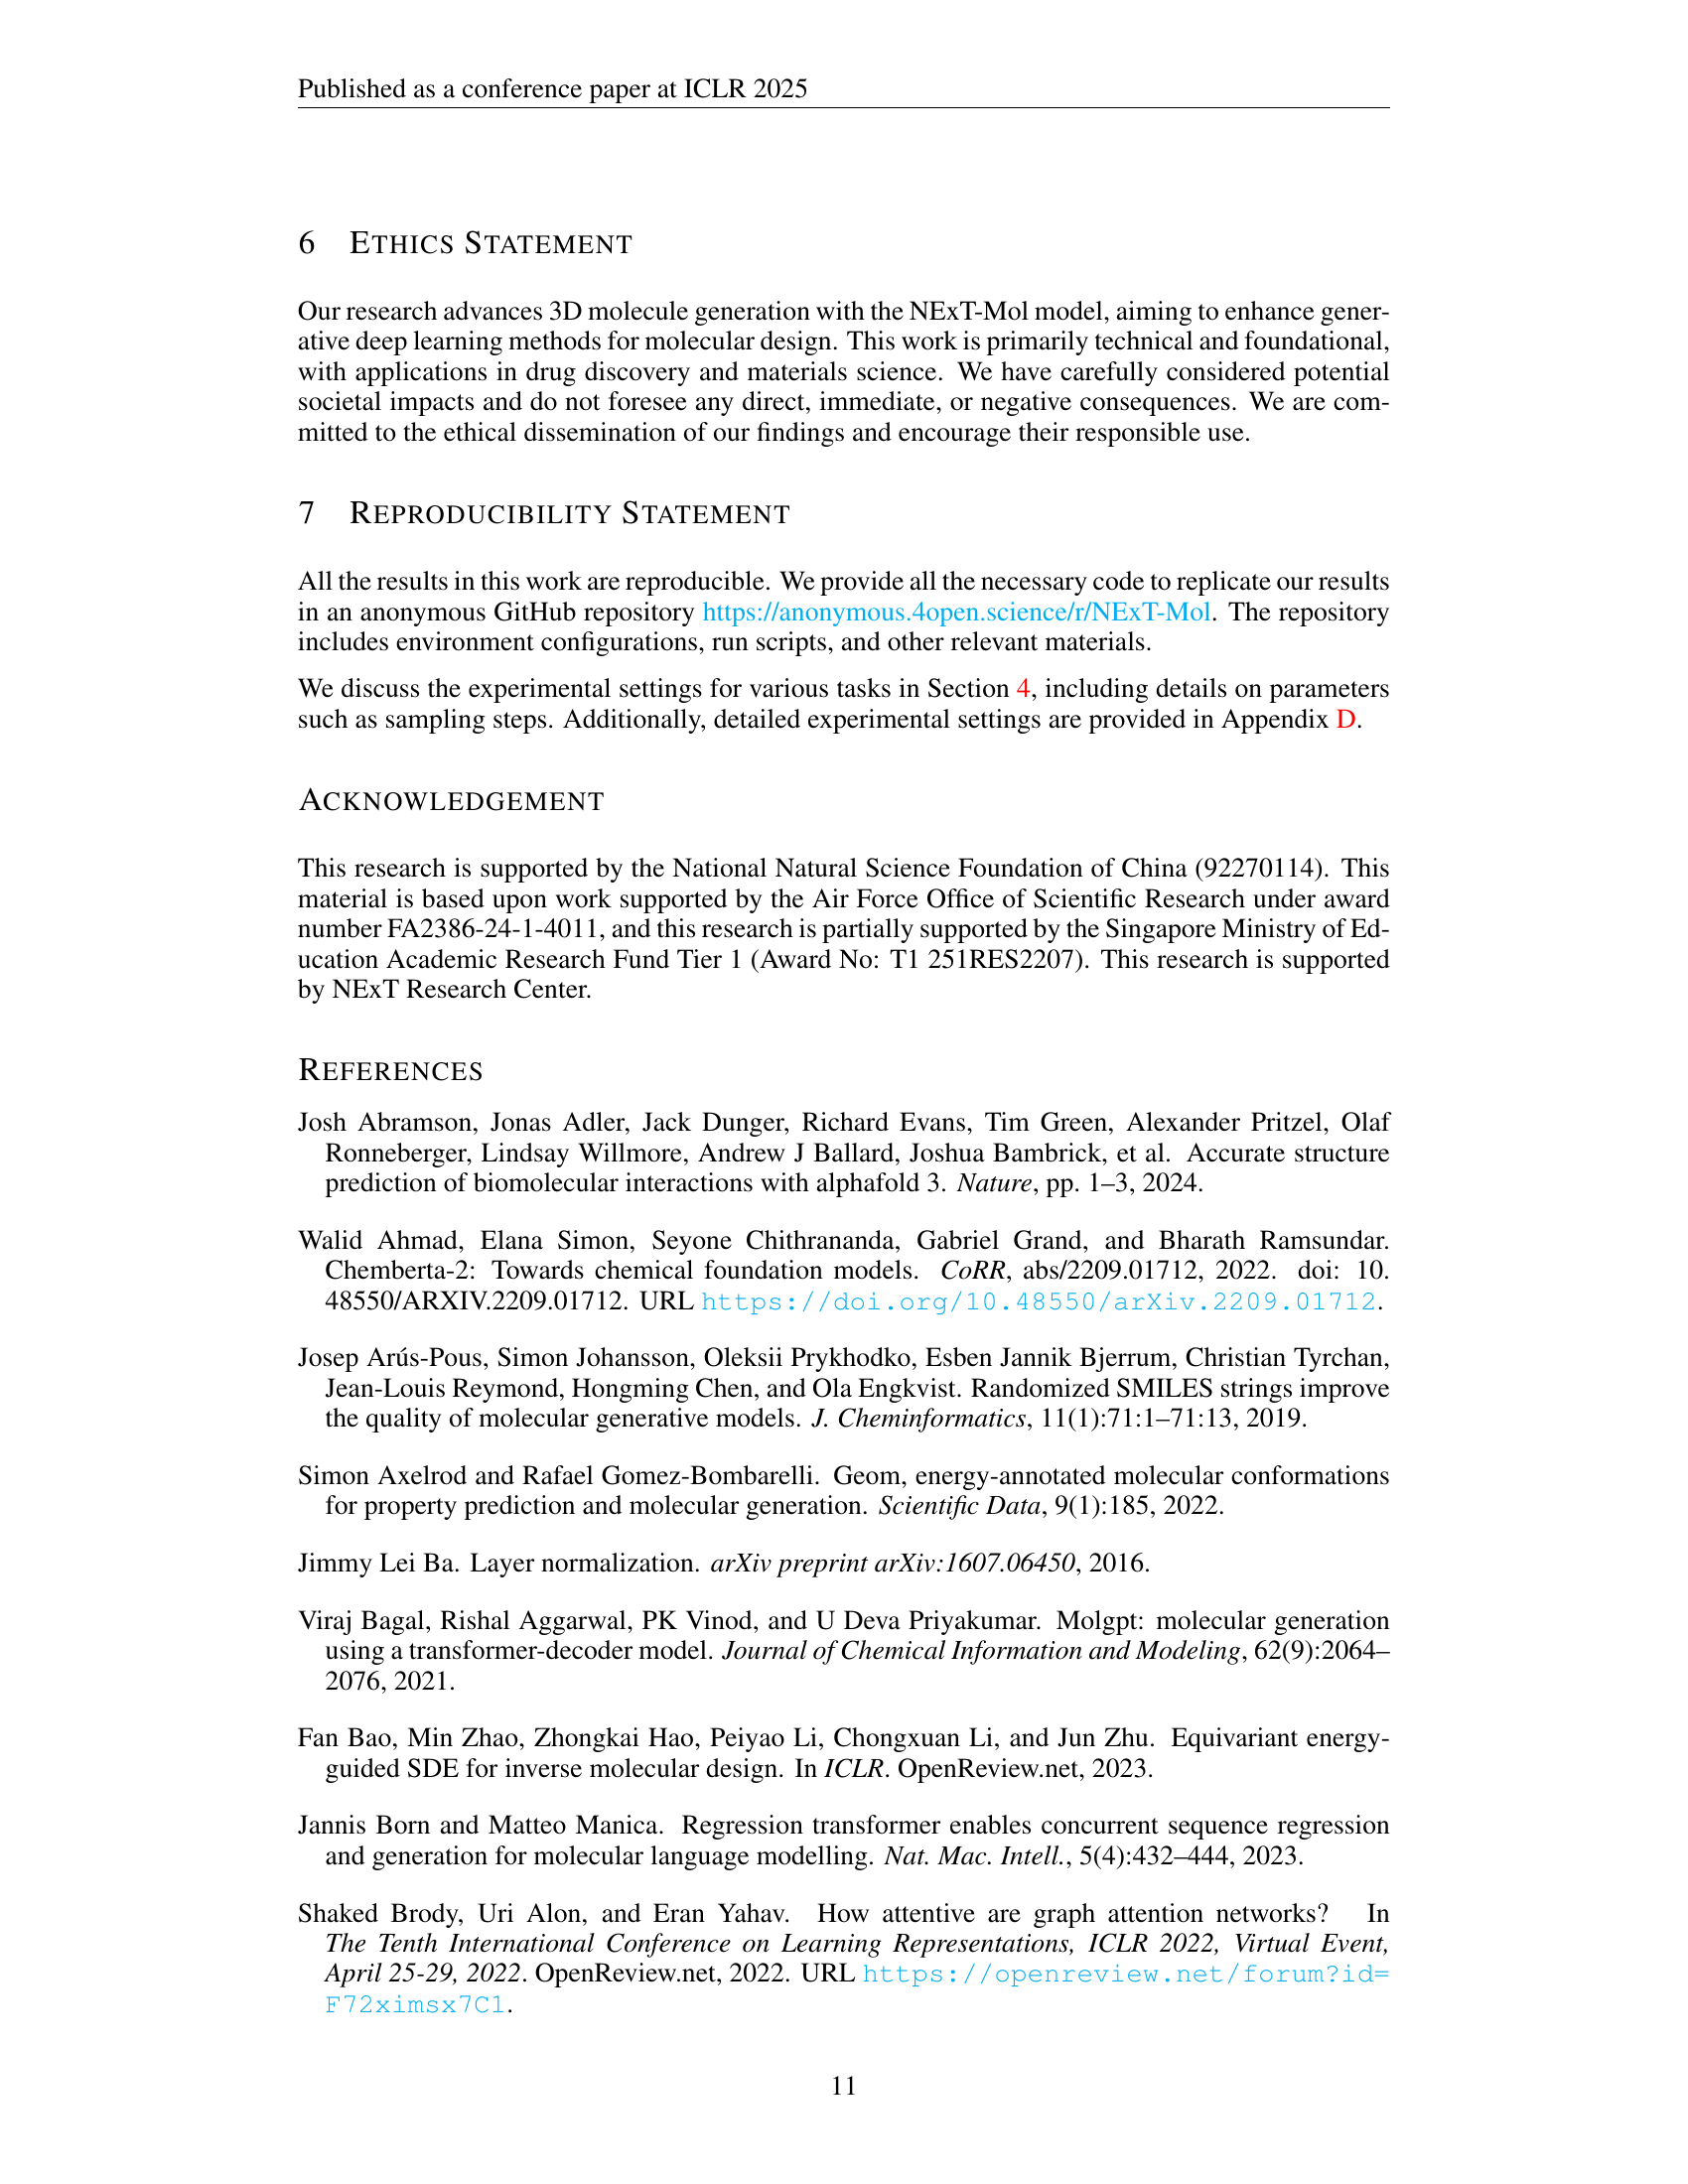
🔼 This table presents the ablation study of randomized SELFIES augmentations in the 1D molecular generation task on QM9-2014 dataset. It shows the performance of the model (MoLlama) with and without this data augmentation technique, comparing various metrics such as FCD (Fréchet ChemNet Distance), atom stability, molecule stability, validity & completeness (V&C), validity & uniqueness (V&U), validity & uniqueness & novelty (V&U&N), similarity to nearest neighbor (SNN), fragment similarity (Frag), and scaffold similarity (Scaf). This analysis helps to understand the impact of this specific data augmentation strategy on the overall performance of the 1D molecule generation model.
read the caption
Table 8: Ablating randomized SELFIES augmentations for 1D molecule generation on QM9-2014.
| 2D metrics | FCD | AtomStable | MolStable | V&C | V&U | V&U&N | SNN | Frag | Scaf |
|---|---|---|---|---|---|---|---|---|---|
| MoLlama | 0.070 | 1.000 | 0.989 | 1.000 | 0.967 | 0.802 | 0.530 | 0.992 | 0.945 |
| w/o randomized aug. | 0.074 | 1.000 | 0.988 | 1.000 | 0.948 | 0.395 | 0.491 | 0.989 | 0.939 |
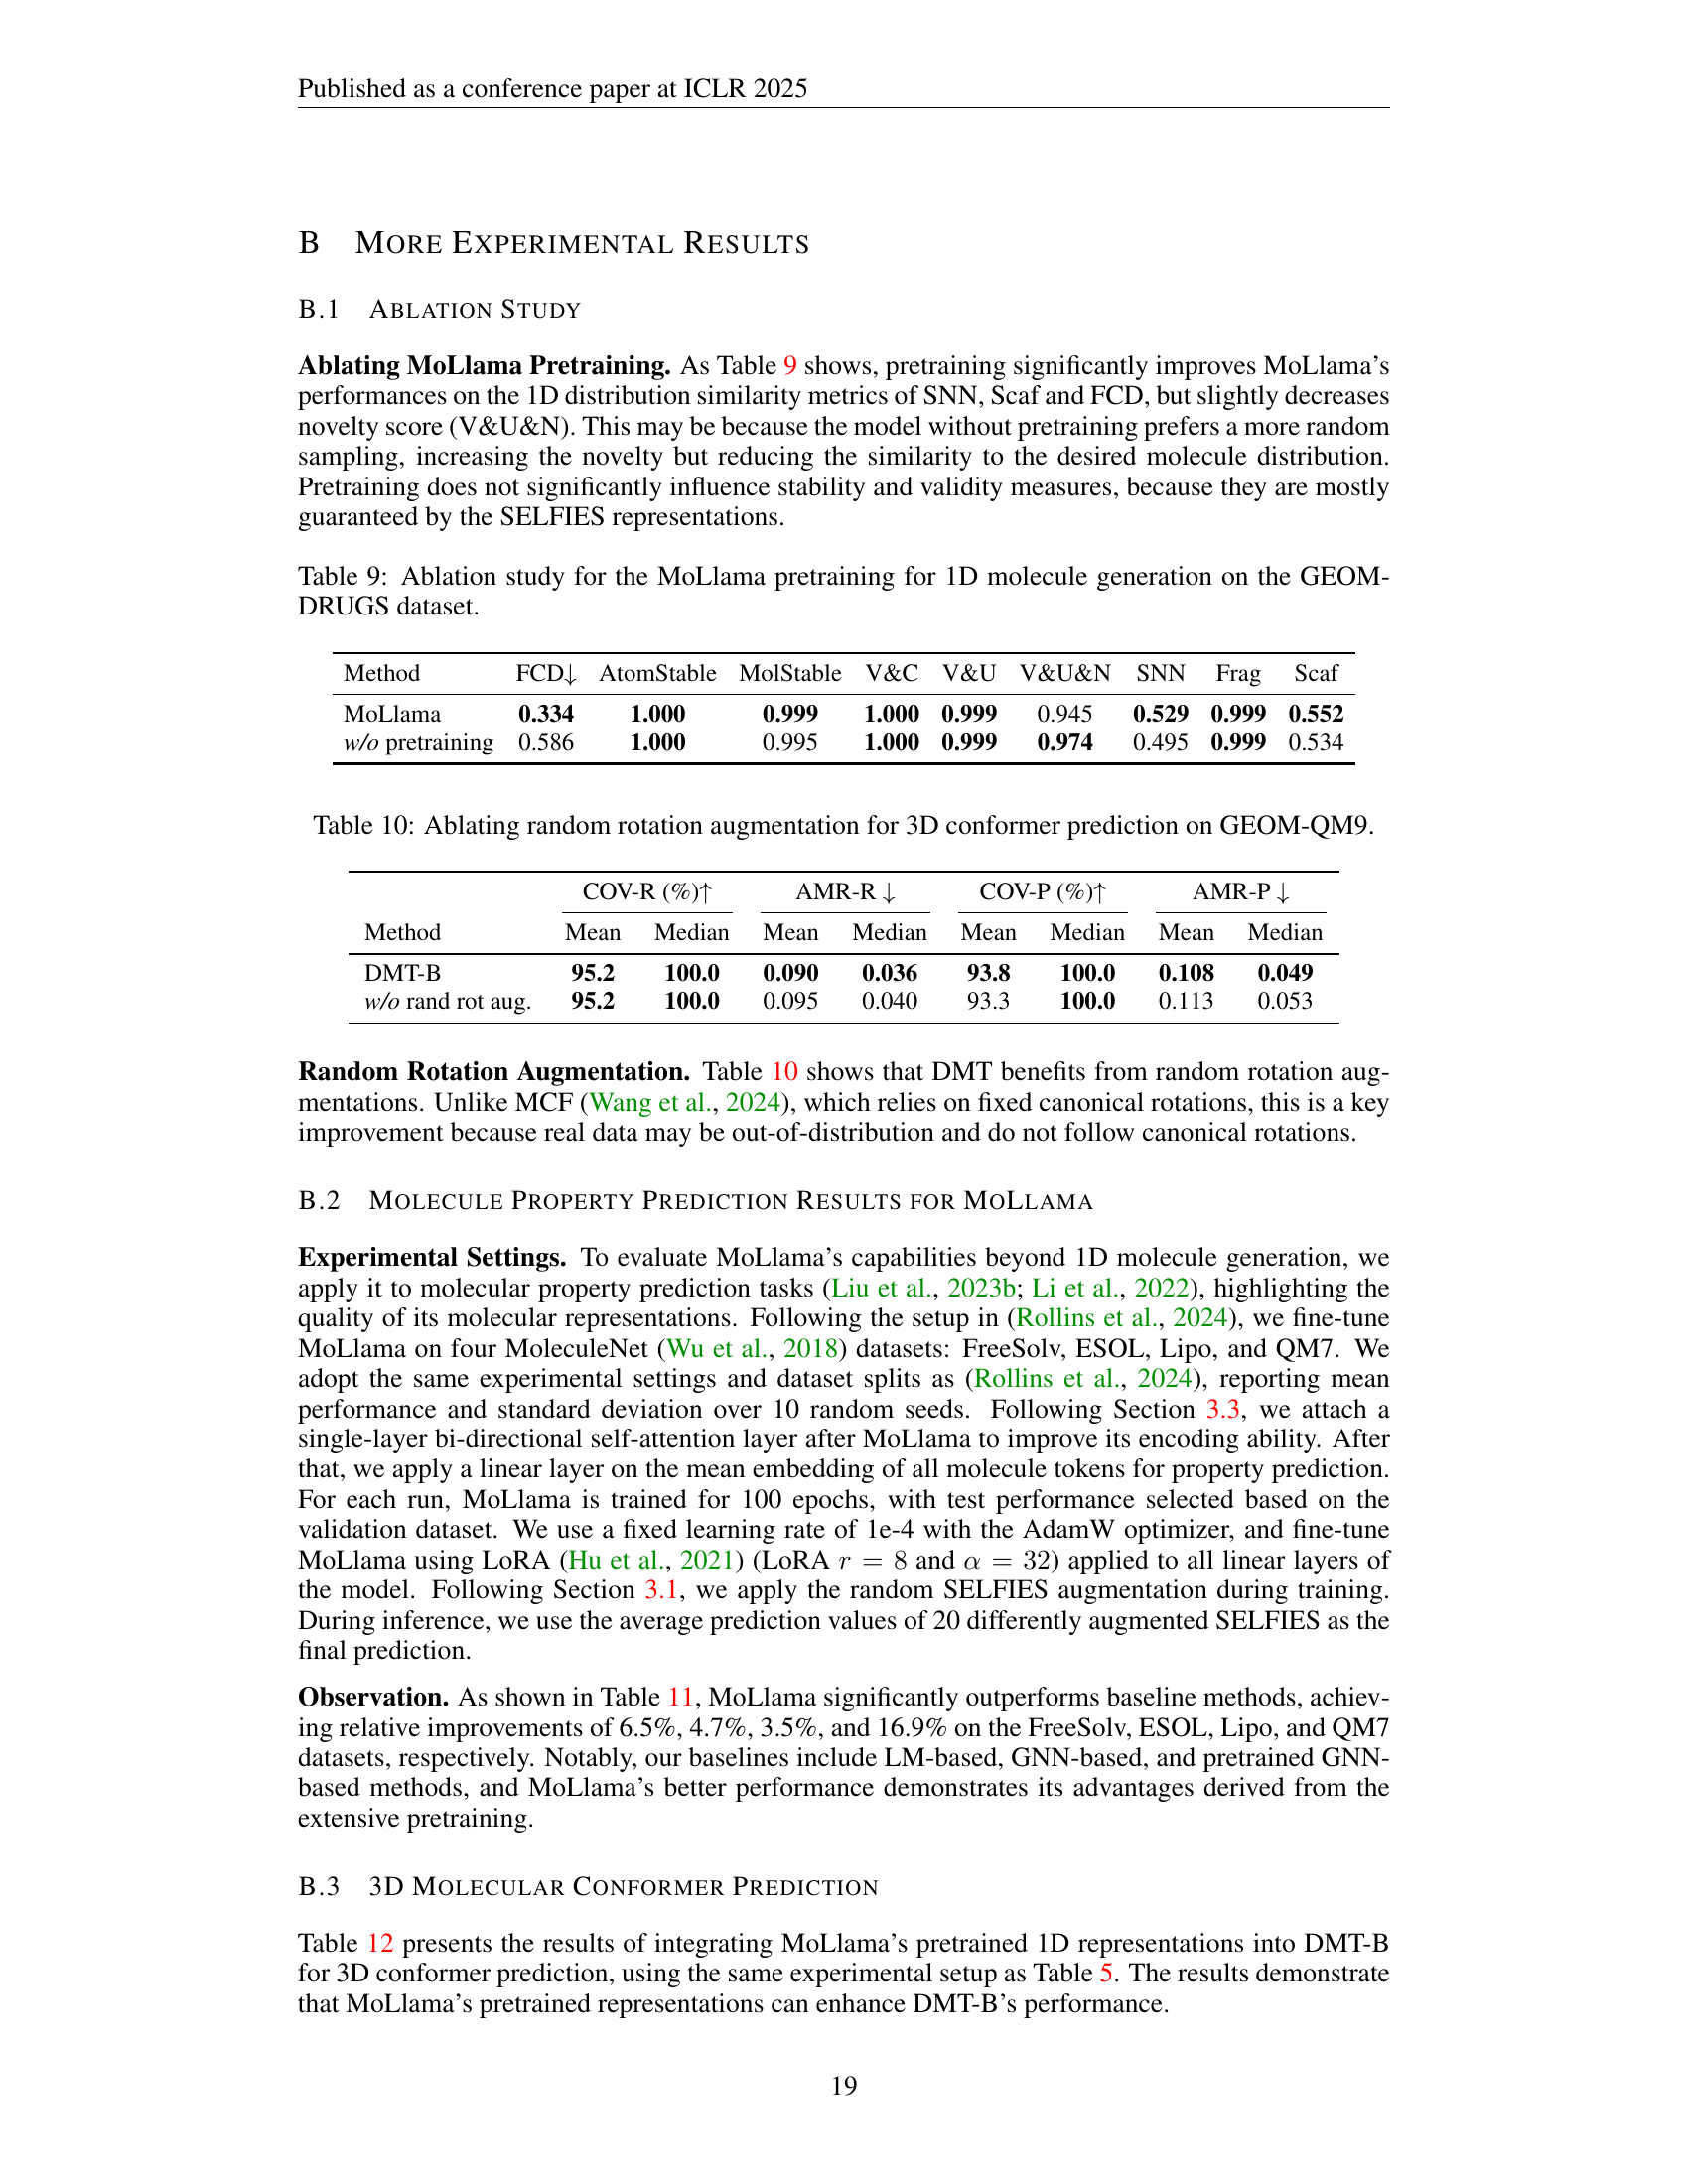
🔼 This ablation study analyzes the impact of pretraining the MoLlama model on 1D molecule generation using the GEOM-DRUGS dataset. The table compares the performance metrics (FCD, AtomStable, MolStable, V&C, V&U, V&U&N, SNN, Frag, and Scaf) of MoLlama models with and without pretraining. These metrics assess different aspects of the generated molecules, including their validity, stability, diversity, and similarity to real molecules. The results show the effect of pretraining on these metrics, demonstrating the benefit of pretraining for improved performance in several areas.
read the caption
Table 9: Ablation study for the MoLlama pretraining for 1D molecule generation on the GEOM-DRUGS dataset.
| Method | FCD | AtomStable | MolStable | V&C | V&U | V&U&N | SNN | Frag | Scaf |
|---|---|---|---|---|---|---|---|---|---|
| MoLlama | 0.334 | 1.000 | 0.999 | 1.000 | 0.999 | 0.945 | 0.529 | 0.999 | 0.552 |
| w/o pretraining | 0.586 | 1.000 | 0.995 | 1.000 | 0.999 | 0.974 | 0.495 | 0.999 | 0.534 |
🔼 This table presents the ablation study results on the effect of random rotation augmentation for 3D conformer prediction using the Diffusion Molecular Transformer (DMT) model on the GEOM-QM9 dataset. It shows a comparison of the model’s performance with and without random rotation augmentation, assessing metrics such as Coverage-Recall (COV-R), Average Minimum RMSD-Recall (AMR-R), Coverage-Precision (COV-P), and Average Minimum RMSD-Precision (AMR-P). The results help determine the impact of this data augmentation technique on the model’s ability to accurately predict 3D molecular conformations.
read the caption
Table 10: Ablating random rotation augmentation for 3D conformer prediction on GEOM-QM9.
| COV-R (%) | AMR-R | COV-P (%) | AMR-P | |||||
|---|---|---|---|---|---|---|---|---|
| Method | Mean | Median | Mean | Median | Mean | Median | Mean | Median |
| DMT-B | 95.2 | 100.0 | 0.090 | 0.036 | 93.8 | 100.0 | 0.108 | 0.049 |
| w/o rand rot aug. | 95.2 | 100.0 | 0.095 | 0.040 | 93.3 | 100.0 | 0.113 | 0.053 |
🔼 Table 11 presents a comparison of the performance of various methods on four different MoleculeNet datasets (Wu et al., 2018), focusing on the prediction of molecular properties. The results are reported in terms of root mean squared error (RMSE) for FreeSolv, ESOL, and Lipophilicity datasets, and mean absolute error (MAE) for the QM7 dataset. The table showcases different machine learning methods, including supervised learning techniques, graph neural networks (GNNs), and pretrained GNN-based methods, highlighting their performance against the newly proposed model (MoLlama). The baseline results for comparison are taken from Rollins et al. (2024). Lower values indicate better performance.
read the caption
Table 11: Molecule property regression results on four MoleculeNet datasets (Wu et al., 2018). Baseline results are from (Rollins et al., 2024). Lower↓↓\downarrow↓ is better.
| Method | FreeSolv (RMSE) | ESOL (RMSE) | Lipo (RMSE) | QM7 (MAE) |
|---|---|---|---|---|
| Supervised Learning Methods | ||||
| RF (Wang et al., 2022) | 2.03±0.22 | 1.07±0.19 | 0.88±0.04 | 122.7±4.2 |
| SVM (Wang et al., 2022) | 3.14±0.00 | 1.50±0.00 | 0.82±0.00 | 156.9±0.0 |
| Supervised GNN-based Methods | ||||
| GCN (Kipf & Welling, 2017) | 2.87±0.14 | 1.43±0.05 | 0.85±0.08 | 122.9±2.2 |
| GATv2 (Brody et al., 2022) | 3.14±0.00 | 1.41±0.00 | 0.89±0.00 | 113.3±0.0 |
| GIN (Xu et al., 2019) | 2.76±0.18 | 1.45±0.02 | 0.85±0.07 | 124.8±0.7 |
| SchNet (Schütt et al., 2018) | 3.22±0.76 | 1.05±0.06 | 0.91±0.10 | 74.2±6.0 |
| 3D Infomax (Stärk et al., 2022) | 2.23±0.26 | 0.95±0.04 | 0.74±0.01 | - |
| MGCN (Lu et al., 2019) | 3.35±0.01 | 1.27±0.15 | 1.11±0.04 | 77.6±4.7 |
| D-MPNN (Yang et al., 2019) | 2.18±0.91 | 0.98±0.26 | 0.65±0.05 | 105.8±13.2 |
| Pretrained GNN-based Methods | ||||
| Pretrain-GNN (Hu et al., 2020) | 2.83±0.12 | 1.22±0.02 | 0.74±0.00 | 110.2±6.4 |
| MolCLR (Wang et al., 2022) | 2.20±0.20 | 1.11±0.01 | 0.65±0.08 | 87.2±2.0 |
| LM-based Methods | ||||
| ChemBERTa-2 (Ahmad et al., 2022) | 2.047±0.00 | 0.889±0.00 | 0.798±0.00 | 172.8±0.00 |
| MolPROP (Rollins et al., 2024) | 1.70±0.09 | 0.777±0.02 | 0.733±0.02 | 151.8±10.0 |
| MoLlama, ours | 1.59±0.04 | 0.740±0.01 | 0.627±0.01 | 63.5±1.6 |
🔼 This table presents the results of incorporating MoLlama’s pretrained 1D representations into DMT-B for 3D conformer prediction. The experiments compare the performance of DMT-B alone against DMT-B enhanced with MoLlama’s representations, evaluating on the GEOM-QM9 dataset. The metrics used are Coverage (COV-R) and Average Minimum RMSD (AMR-R) for recall and COV-P and AMR-P for precision, showcasing the improved accuracy and coverage achieved by incorporating 1D information.
read the caption
Table 12: Incorporating MoLlama’s 1D representations to improve DMT’s 3D conformer prediction.
| COV-R (%) | AMR-R | COV-P (%) | AMR-P | ||||||
|---|---|---|---|---|---|---|---|---|---|
| Dataset | Method | Mean | Median | Mean | Median | Mean | Median | Mean | Median |
| GEOM-QM9 | DMT-B | 95.2 | 100.0 | 0.090 | 0.036 | 93.8 | 100.0 | 0.108 | 0.049 |
| +MoLlama | 95.6 | 100.0 | 0.083 | 0.036 | 94.2 | 100.0 | 0.097 | 0.044 | |
🔼 This table presents the results of 3D conformer prediction experiments conducted on the GEOM-DRUGS dataset. It compares the performance of the Diffusion Molecular Transformer (DMT) model using different predictor-corrector sampler settings (snr values). The metrics used to evaluate the model’s performance are Coverage-Recall (COV-R), Average Minimum RMSD-Recall (AMR-R), Coverage-Precision (COV-P), and Average Minimum RMSD-Precision (AMR-P). The table shows how the model’s performance changes across different hyperparameters for the sampling process, allowing for a detailed analysis of the model’s behavior in different scenarios.
read the caption
Table 13: Performances of 3D conformer prediction on the GEOM-DRUGS dataset.
| COV-R (%) | AMR-R | COV-P (%) | AMR-P | |||||
|---|---|---|---|---|---|---|---|---|
| Model | Mean | Median | Mean | Median | Mean | Median | Mean | Median |
| DMT-B, PC samp., snr=0.2 | 85.3 | 91.5 | 0.398 | 0.372 | 66.5 | 69.2 | 0.633 | 0.560 |
| DMT-B, PC samp., snr=0.3 | 85.5 | 91.2 | 0.396 | 0.370 | 67.6 | 71.5 | 0.623 | 0.546 |
| DMT-B, PC samp., snr=0.4 | 73.8 | 79.9 | 0.535 | 0.501 | 68.0 | 72.1 | 0.621 | 0.548 |
🔼 This table presents the results of a study comparing the performance of a diffusion model for 3D conformer prediction using three different noise schedules during inference: linear, cosine, and polynomial. The model, DMT-B, is evaluated on the GEOM-DRUGS dataset using metrics such as Coverage (COV-R and COV-P) and Average Minimum RMSD (AMR-R and AMR-P). The cosine schedule represents the original setting while the others represent variations applied during the inference phase, without re-training the model. The results show how the choice of noise schedule affects the model’s ability to accurately predict 3D conformers.
read the caption
Table 14: DMT-B’s 3D conformer prediction performances on the GEOM-DRUGS dataset when using different noise schedulers at inference time.
| COV-R (%) | AMR-R | COV-P (%) | AMR-P | |||||
|---|---|---|---|---|---|---|---|---|
| Noise schedule | Mean | Median | Mean | Median | Mean | Median | Mean | Median |
| linear | 62.7 | 62.7 | 0.648 | 0.634 | 60.3 | 60.6 | 0.726 | 0.624 |
| cosine, original | 85.4 | 92.2 | 0.401 | 0.375 | 65.2 | 67.8 | 0.642 | 0.577 |
| polynomial | 84.9 | 91.7 | 0.454 | 0.421 | 64.5 | 66.2 | 0.685 | 0.619 |
🔼 This table presents the results of experiments evaluating the effect of different batch sizes on the performance of the Diffusion Molecular Transformer (DMT-B) model for 3D conformer prediction using the GEOM-DRUGS dataset. The metrics used to assess model performance include Coverage (COV-R, COV-P) and Average Minimum Root Mean Square Deviation (AMR-R, AMR-P), which measure the similarity between predicted and ground truth conformers. The table shows the mean and median values of these metrics across multiple runs, providing a comprehensive evaluation of the impact of batch size on model accuracy and stability.
read the caption
Table 15: DMT-B’s 3D conformer prediction performances on the GEOM-DRUGS dataset when using different batch sizes.
| COV-R (%) | AMR-R | COV-P (%) | AMR-P | |||||
|---|---|---|---|---|---|---|---|---|
| Batch size | Mean | Median | Mean | Median | Mean | Median | Mean | Median |
| 128 | 85.5 | 92.4 | 0.395 | 0.366 | 65.1 | 68.0 | 0.644 | 0.575 |
| 256, original | 85.4 | 92.2 | 0.401 | 0.375 | 65.2 | 67.8 | 0.642 | 0.577 |
| 512 | 85.1 | 92.0 | 0.410 | 0.377 | 64.9 | 67.7 | 0.645 | 0.582 |
🔼 Table 16 presents the results of 3D molecule stability evaluation on two datasets, GEOM-DRUGS and QM9-2014. The metric used is ‘MolStable’, representing molecular stability. The table compares the performance of NEXT-Mol to several baselines, including EDM, JODO, MiDi, EQGAT-diff, G-SchNet, G-SphereNet, and MDM. The results are shown separately for the two datasets, allowing for a direct comparison of performance across various methods. The asterisk (*) indicates that those particular results were reproduced by the authors of the paper using the original source code.
read the caption
Table 16: 3D Molecule stability performances. * denotes our reproduced results.
| 3D-Metric | MolStable |
|---|---|
| Train | 0.028 |
| EDM | 0.002 |
| JODO | 0.010 |
| MiDi* | 0.003 |
| EQGAT | 0.025 |
| NExT-Mol, ours | 0.027 |
🔼 Table 2(a) presents the performance of de novo 3D molecule generation on the GEOM-DRUGS dataset. It evaluates multiple aspects of the generated molecules, including their validity (AtomStable, MolStable, V&C, V&U, V&U&N), distribution similarity (SNN, Frag, Scaf), and geometric similarity (FCD). The table compares the performance of NEXT-Mol with various baselines, providing a comprehensive evaluation of the model’s ability to generate realistic and novel 3D molecular structures.
read the caption
(a) GEOM-DRGUS dataset.
| 3D-Metric | MolStable |
|---|---|
| Train | 0.953 |
| G-SchNet | 0.681 |
| G-SphereNet | 0.134 |
| EDM | 0.817 |
| MDM | 0.896 |
| JODO | 0.934 |
| MiDi* | 0.842 |
| EQGAT | 0.889 |
| NExT-Mol, ours | 0.946 |
🔼 Table 2 presents the performance of de novo 3D molecule generation on the QM9-2014 dataset. The table shows various metrics evaluating the quality of the generated molecules. These include measures of the molecule’s validity (atom stability, molecule stability, validity and completeness), uniqueness (V&U, V&U&N), and similarity to known molecules (FCD, SNN, fragment, scaffold). The table compares the performance of the proposed NEXT-Mol model against several existing baselines.
read the caption
(b) QM9-2014 dataset.
🔼 This table lists the hyperparameters used during the pretraining of the MoLlama language model. It details settings for various aspects of the model architecture, training process, and optimization, including hidden layer sizes, activation functions, attention head counts, learning rates, weight decay, and gradient clipping. These hyperparameters are crucial for controlling the model’s capacity, training stability, and generalization performance.
read the caption
Table 17: Hyperparameter for pretraining MoLlama.
| hidden size | 2048 | hidden act | silu |
|---|---|---|---|
| intermediate size | 5632 | batch size | 512 |
| max position embeddings | 512 | warmup steps | 2000 |
| num attention heads | 32 | min lr | 4.00E-05 |
| num hidden layers | 22 | init lr | 4.00E-04 |
| num key value heads | 4 | weight decay | 1.00E-01 |
| n query groups | 4 | grad clip | 1.0 |
🔼 This table lists the hyperparameters used for training the two diffusion molecular transformer (DMT) models: DMT-B and DMT-L. It details the architecture configurations, including the number of layers, hidden layer sizes for both atom and pair representations, the number of attention heads, and the total number of parameters for each model. These settings are crucial for understanding the differences in the complexity and performance between the two DMT models.
read the caption
Table 18: Hyperparameters of the DMT-B and DMT-L models.
Full paper#