TL;DR#
Current PRMs use rule-based methods to divide reasoning steps, which overlook crucial decision points. The methods results in coarse divisions lacking decision-making insights. Existing PRMs face challenges in balancing annotation costs and division granularity, limiting their broad use due to high building costs and reliance on fixed symbols. Thus, more informative step dividing methods are in urgent needs.
This paper presents AdaptiveStep, a novel method that divides reasoning steps based on the model’s confidence in predicting the next word. This approach yields informative steps, enhancing reward model learning without manual annotation. The resulting AdaptiveStep Process Reward Model (ASPRM) outperforms existing PRMs in mathematical reasoning and code generation, reducing construction costs significantly. ASPRM also demonstrates strong transferability and generalization.
Key Takeaways#
Why does it matter?#
This paper introduces AdaptiveStep, a novel and efficient method for training Process Reward Models (PRMs) by dynamically dividing reasoning steps based on model confidence. It outperforms existing PRMs, reduces construction costs, and shows strong generalization, opening new avenues for improving LLM reasoning and code generation.
Visual Insights#

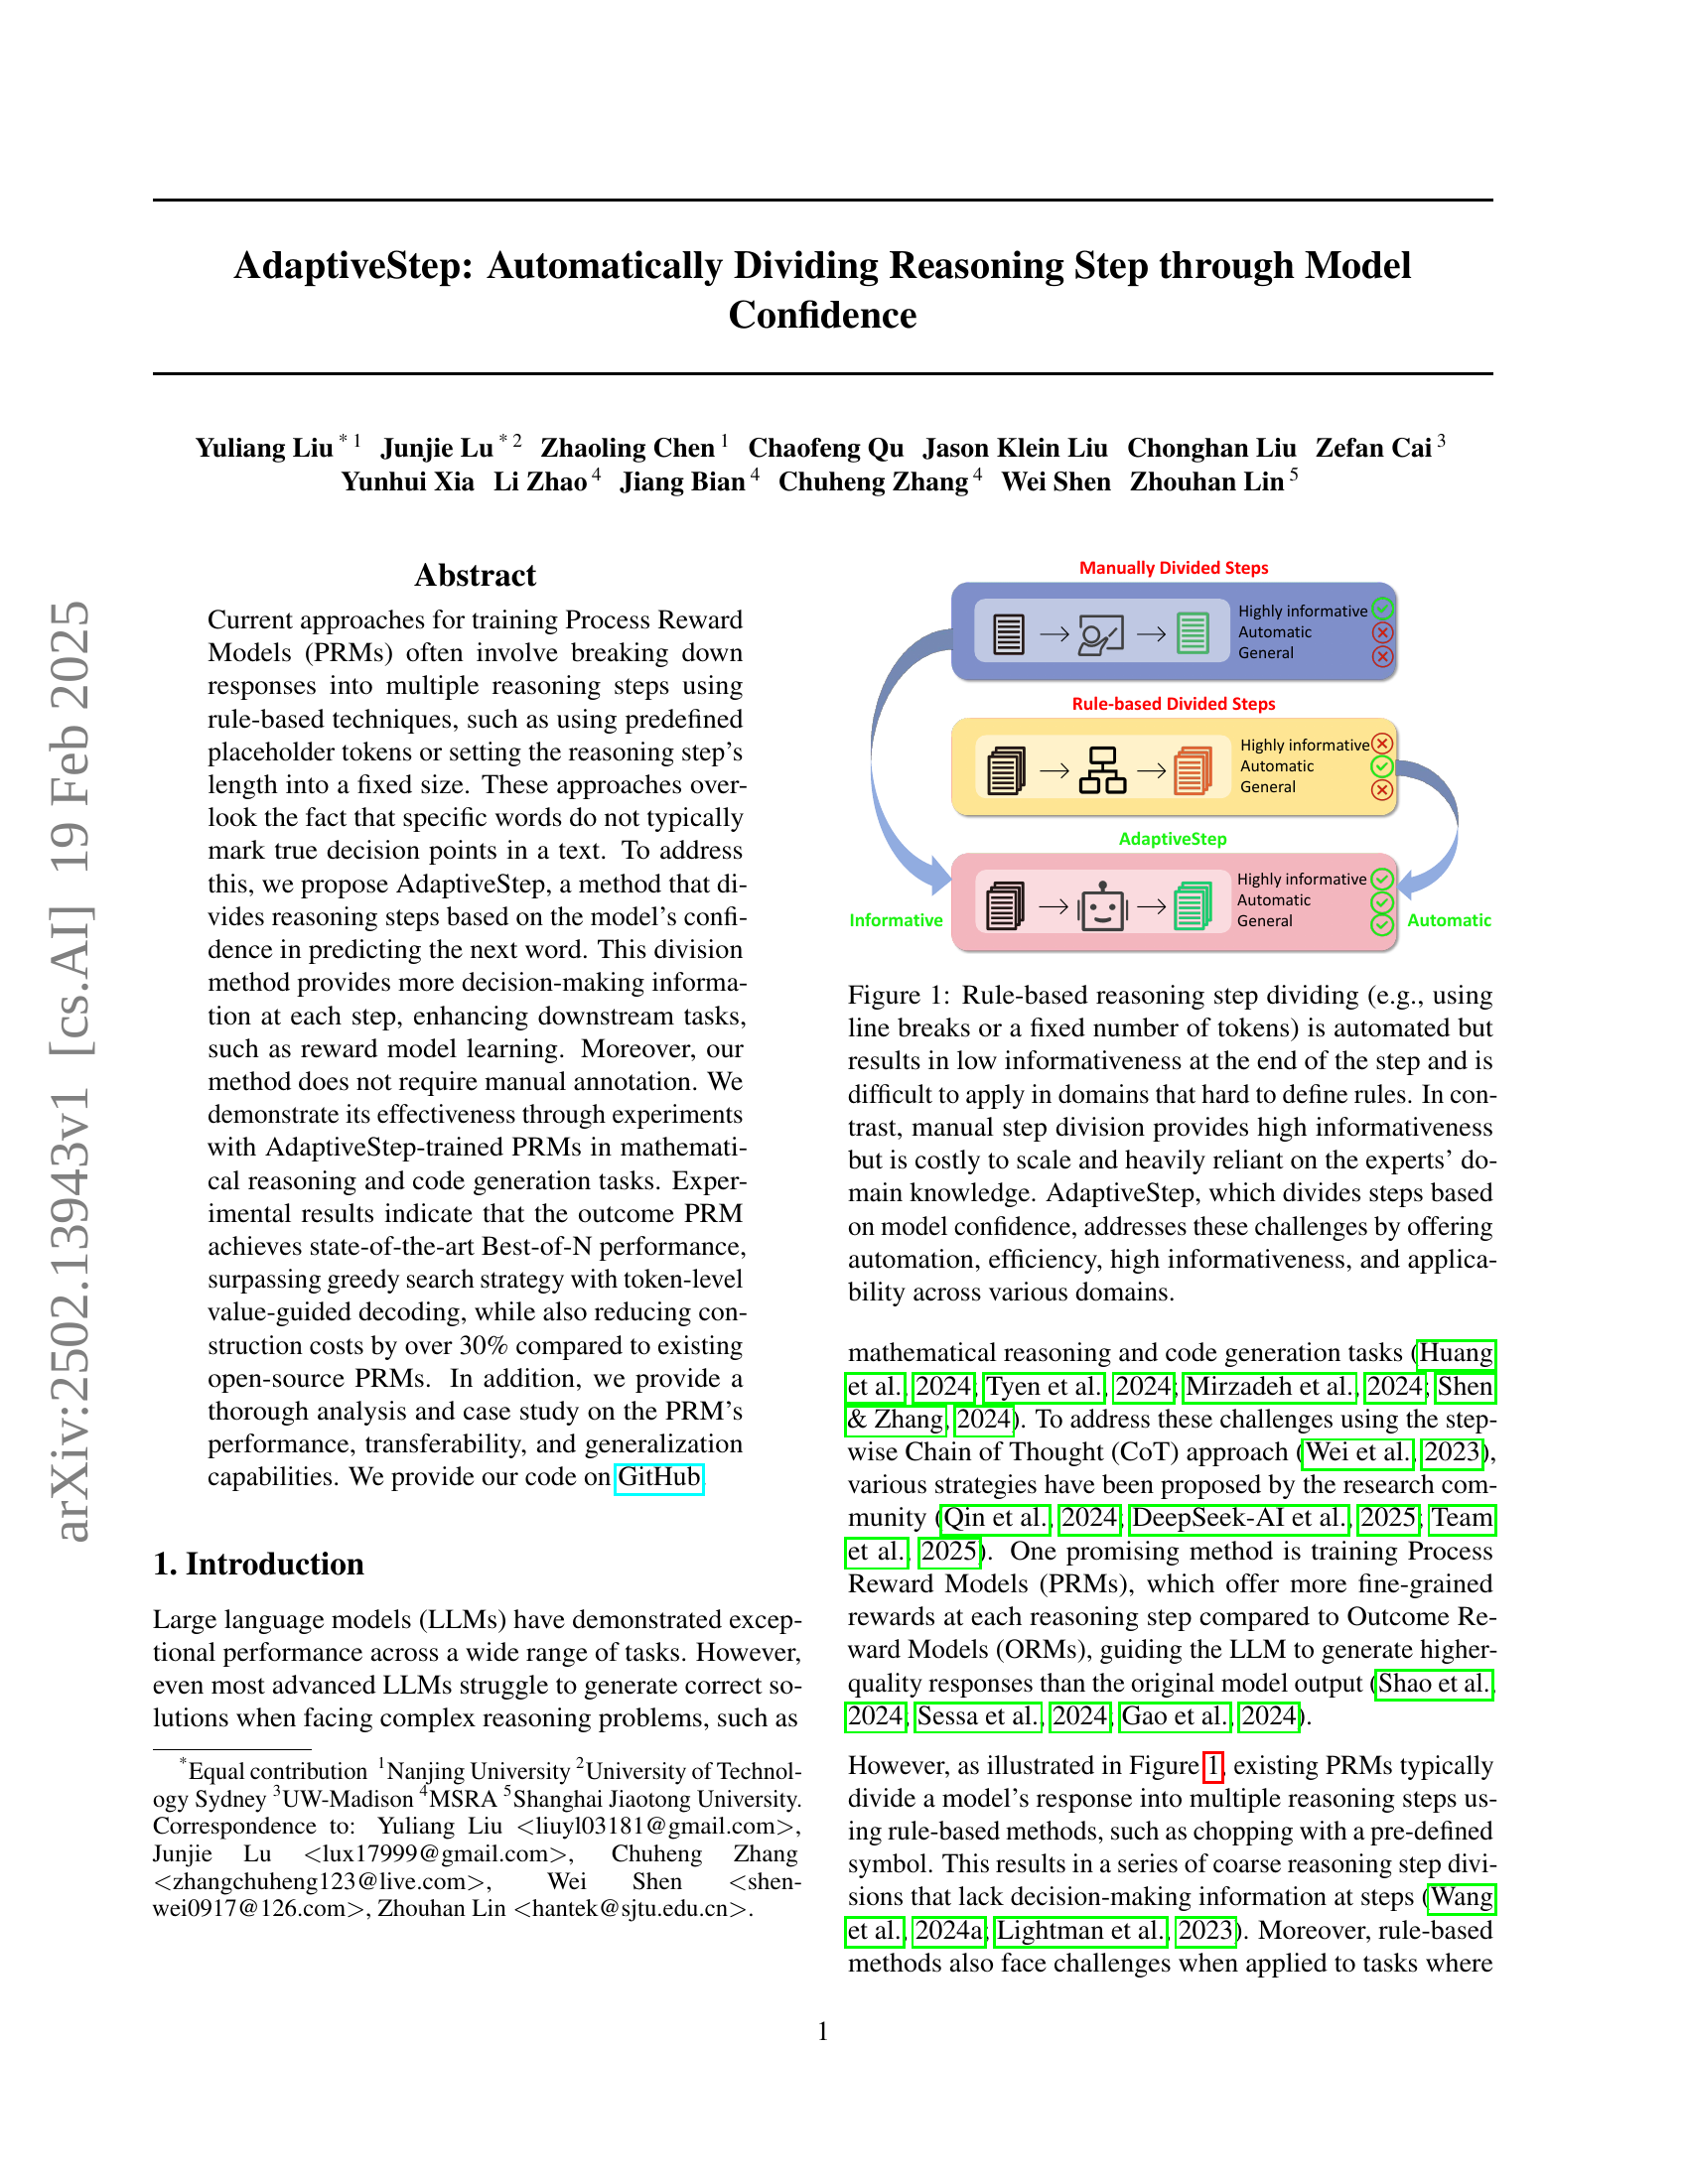
🔼 This figure compares three different methods for dividing reasoning steps in a process reward model (PRM). Rule-based methods automate step division using simple cues like line breaks or fixed token counts. However, these methods often result in steps that are uninformative, particularly towards the end, and are difficult to adapt to diverse domains where defining clear rules is challenging. Manual division, on the other hand, produces highly informative steps but is expensive and relies heavily on expert knowledge, thus limiting scalability. AdaptiveStep, the proposed method, addresses these limitations by automatically dividing steps according to the model’s confidence in predicting the next word. This approach offers the benefits of automation and efficiency while producing informative steps applicable to a wide variety of domains.
read the caption
Figure 1: Rule-based reasoning step dividing (e.g., using line breaks or a fixed number of tokens) is automated but results in low informativeness at the end of the step and is difficult to apply in domains that hard to define rules. In contrast, manual step division provides high informativeness but is costly to scale and heavily reliant on the experts’ domain knowledge. AdaptiveStep, which divides steps based on model confidence, addresses these challenges by offering automation, efficiency, high informativeness, and applicability across various domains.
| Dataset | Inference Model | A/P@1 | Math-Shepherd | ER-PRM | ASPRM-L / -M | ASPRM-D |
|---|---|---|---|---|---|---|
| GSM8k | MetaMath-M | 77.10 | 75.66↓ | 75.13↓ | 79.53↑ / 77.33↑ | / |
| MetaMath-L | 81.80 | 81.73↓ | 81.58↓ | 83.47↑ / 82.56↑ | / | |
| MATH500 | MetaMath-M | 25.00 | 27.60↑ | 27.80↑ | 28.60↑ / 26.80↑ | / |
| MetaMath-L | 38.80 | 41.00↑ | 38.60↓ | 42.00↑ / 41.20↑ | / | |
| LeetCodeDataset | LCD-DS | 26.28 | / | / | / | 28.00↑ |
| LiveCodeBench | LCD-DS | 19.21 | / | / | / | 19.92↑ |
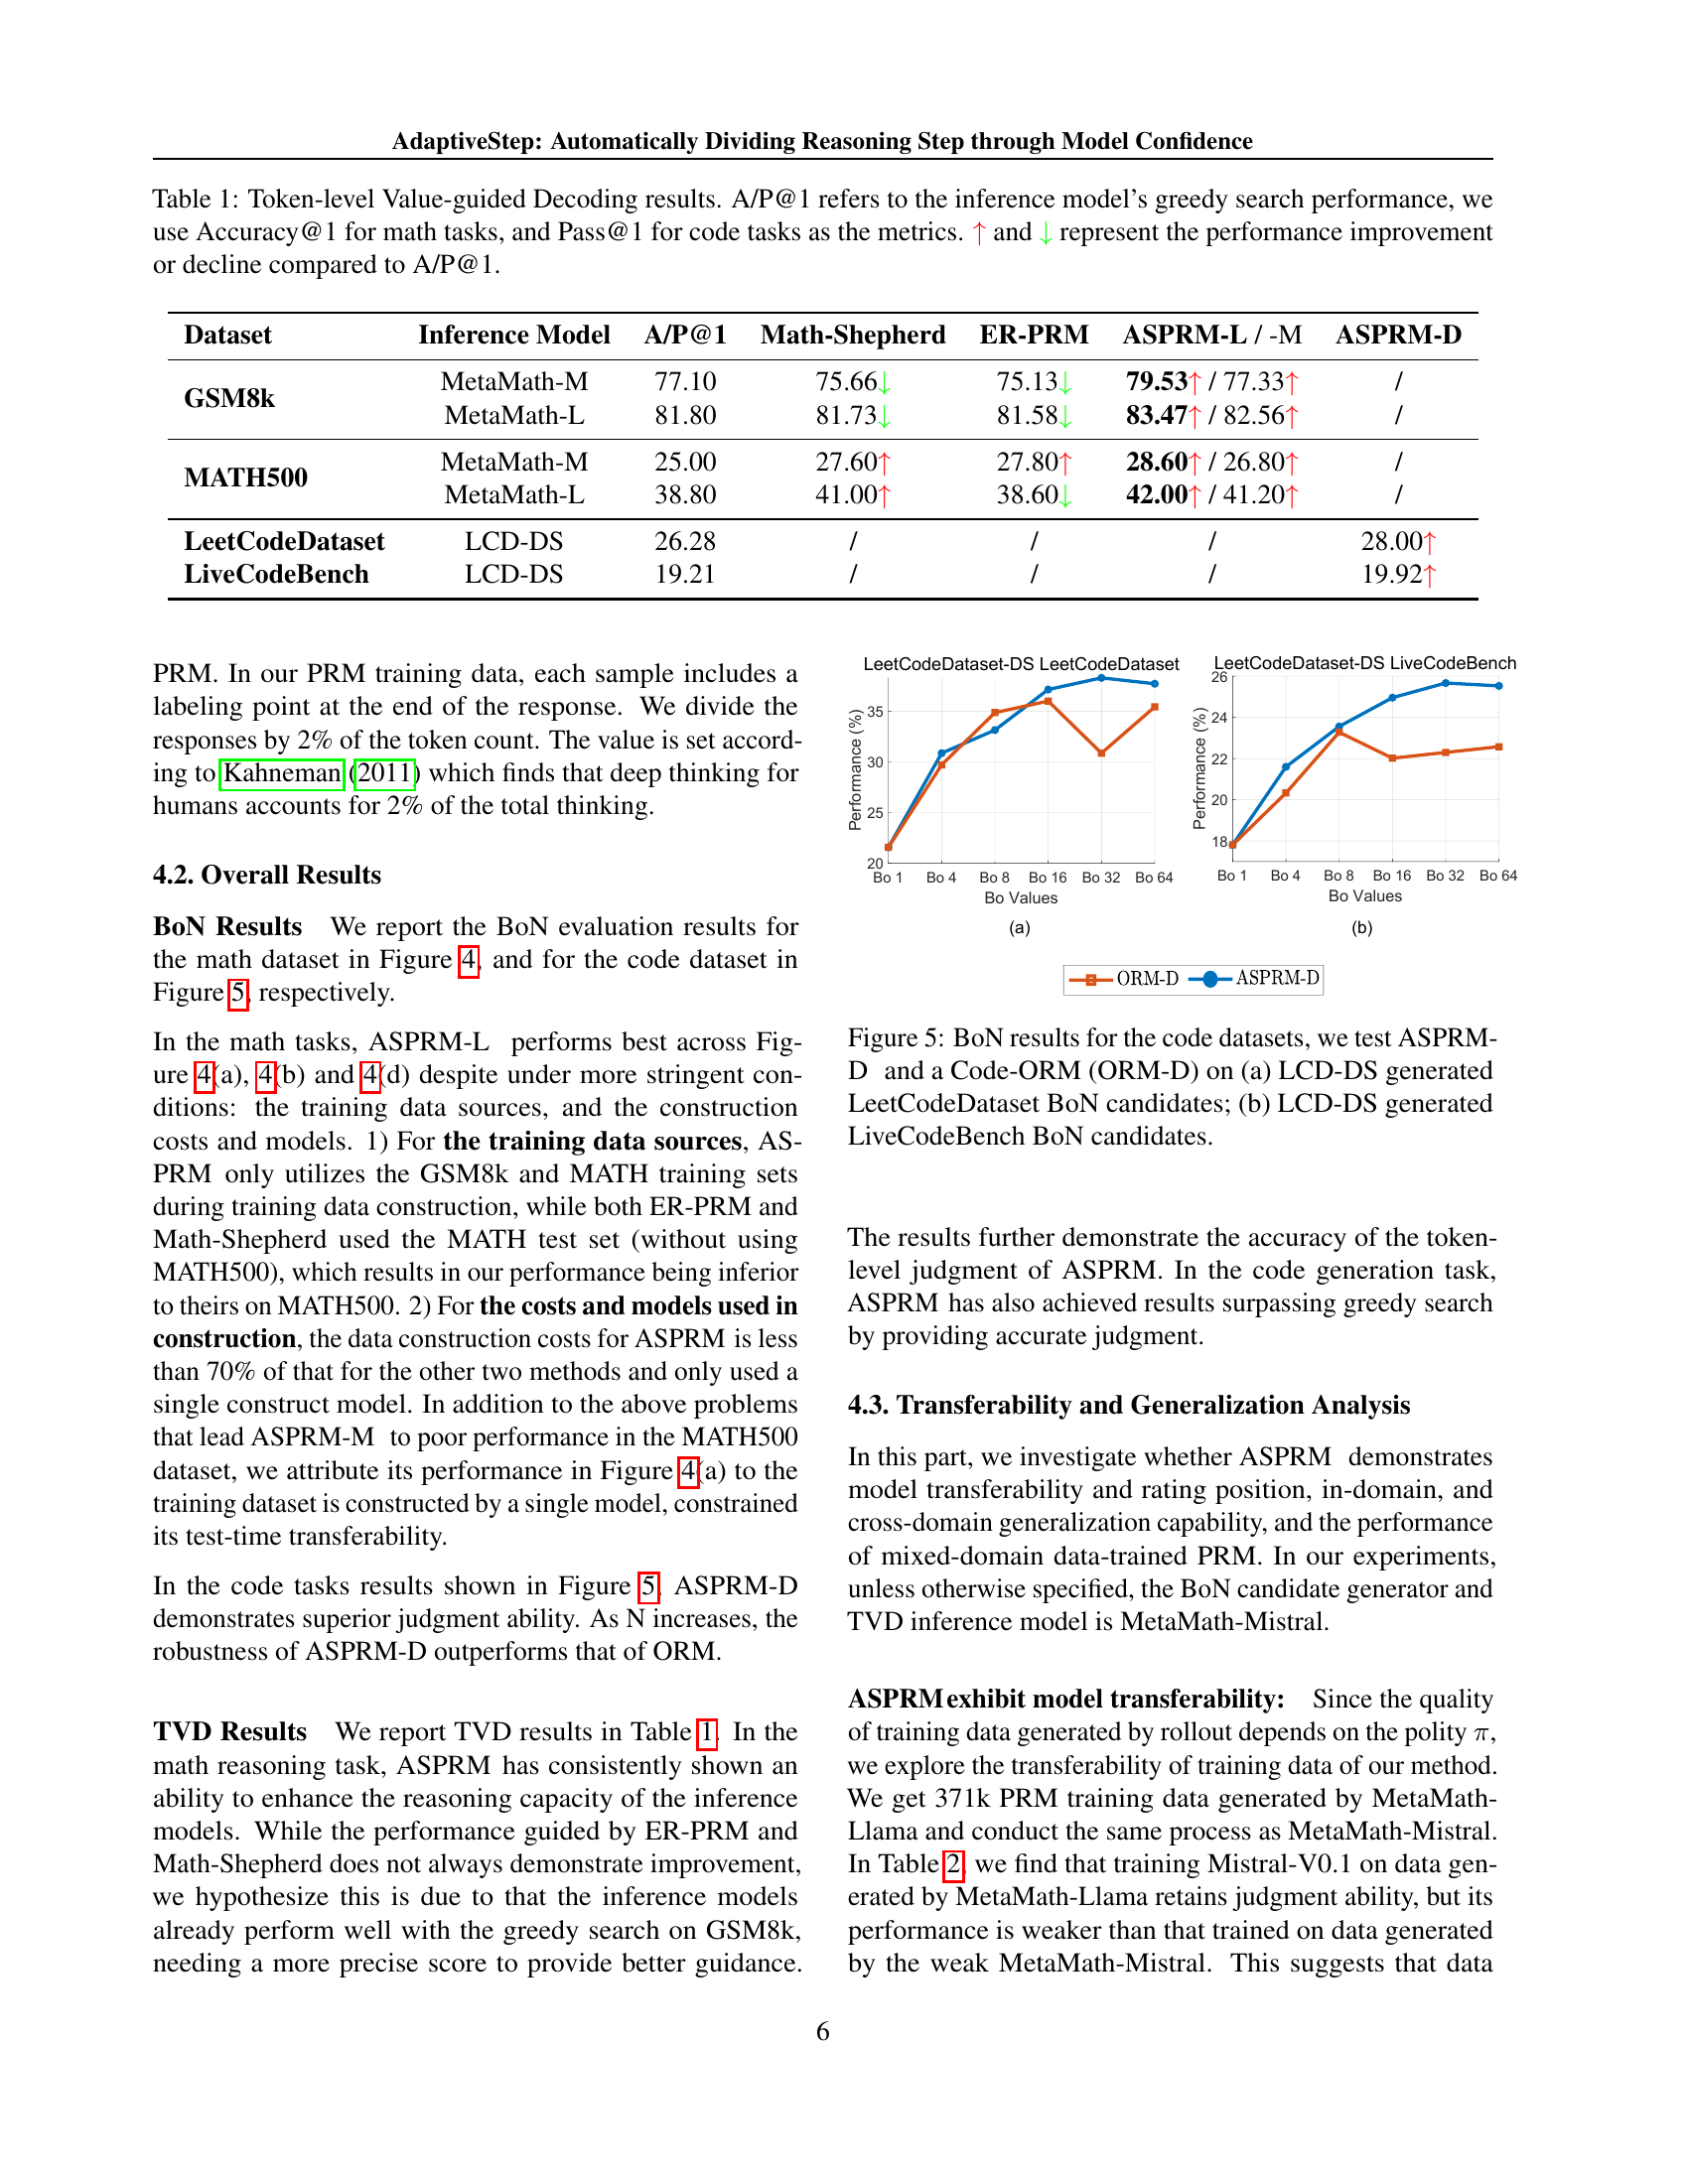
🔼 This table presents the results of Token-level Value-guided Decoding (TVD). It compares the performance of different models (including Math-Shepherd, ER-PRM, and the proposed ASPRM) on various datasets (GSM8k, MATH500, LeetCodeDataset, and LiveCodeBench). The evaluation metrics are Accuracy@1 for mathematical reasoning tasks and Pass@1 for code generation tasks. A/P@1 represents the performance of the greedy search method. The up arrow (↑) and down arrow (↓) symbols indicate whether the TVD method improved or reduced performance compared to the greedy search baseline.
read the caption
Table 1: Token-level Value-guided Decoding results. A/P@1 refers to the inference model’s greedy search performance, we use Accuracy@1 for math tasks, and Pass@1 for code tasks as the metrics. ↑ and ↓ represent the performance improvement or decline compared to A/P@1.
In-depth insights#
AdaptiveSteps PRM#
AdaptiveStep PRM aims to refine Process Reward Models by dynamically adjusting reasoning step divisions based on model confidence. Instead of rule-based or fixed-length steps, it leverages prediction confidence for potentially more informative divisions, crucial for complex tasks. This adaptive approach seeks to balance automation with informativeness, addressing the limitations of existing PRMs. By focusing on decision-making points, the intention is to enhance downstream tasks like reward model learning and improve overall reasoning performance while potentially reducing annotation costs. The goal is to more precisely guide LLMs.
Model Confidence#
When dividing reasoning steps, the probability of a sampled token can act as a metric for model confidence. High confidence implies the model is certain about the next token, while low confidence suggests difficulty in token selection. AdaptiveStep leverages this, identifying key decision points in the reasoning process where the model struggles, such as within mathematical expressions or at noun selections. These points then serve as the boundaries for dividing the reasoning steps. A threshold based on the token count determines which tokens fall below the confidence level and become breaking points. This approach is valuable because it shifts from rule-based division to a data-driven method based on the model’s actual performance, potentially capturing nuances overlooked by fixed rules and allowing a reward model to focus on the most uncertain and critical parts of the reasoning process.
Token TVD#
Token-level Value-guided Decoding (TVD) likely refers to a strategy that leverages a reward model (PRM) to guide token selection during decoding. The core idea is to use the PRM as a value function, assessing the quality or correctness of each potential token at each step of the decoding process. When the model encounters low confidence, the PRM can be triggered to evaluate the tokens, selecting the token that the PRM considers most promising. TVD enhances reasoning capacity of the inference models. This allows for a more fine-grained control over the generated output, potentially improving the overall coherence, accuracy, and relevance of the generated text, especially in tasks requiring complex reasoning or adherence to specific constraints. The value of PRM improves the overall performance in downstream tasks.
Code&Math General#
The concept of a ‘Code&Math General’ evaluation is compelling, suggesting a unified benchmark for assessing AI reasoning across diverse domains. It would reveal true generalization by testing models on problems that require both mathematical computation and programmatic execution. A robust Code&Math General test could incorporate challenges like algorithm design with numerical constraints, code optimization with mathematical modeling, or even automated theorem proving within a code environment. This would demand models that seamlessly integrate symbolic reasoning with numerical computation, a crucial step toward more versatile and intelligent AI systems, rather than specialized tools limited to single domains.
Limited Transfers#
Limited Transfer refers to a scenario where a model trained on one dataset or task struggles to perform well on a different, but related, dataset or task. This highlights the challenges in achieving true generalization and domain adaptation in machine learning. Several factors can contribute to this phenomenon, including differences in data distributions, feature representations, and task objectives. Overcoming these limitations requires developing techniques that can effectively capture and transfer knowledge across diverse domains, such as domain adaptation methods, meta-learning algorithms, and transfer learning techniques. Addressing the challenges of limited transfer is crucial for building robust and adaptable AI systems that can generalize to new and unseen environments.
More visual insights#
More on figures

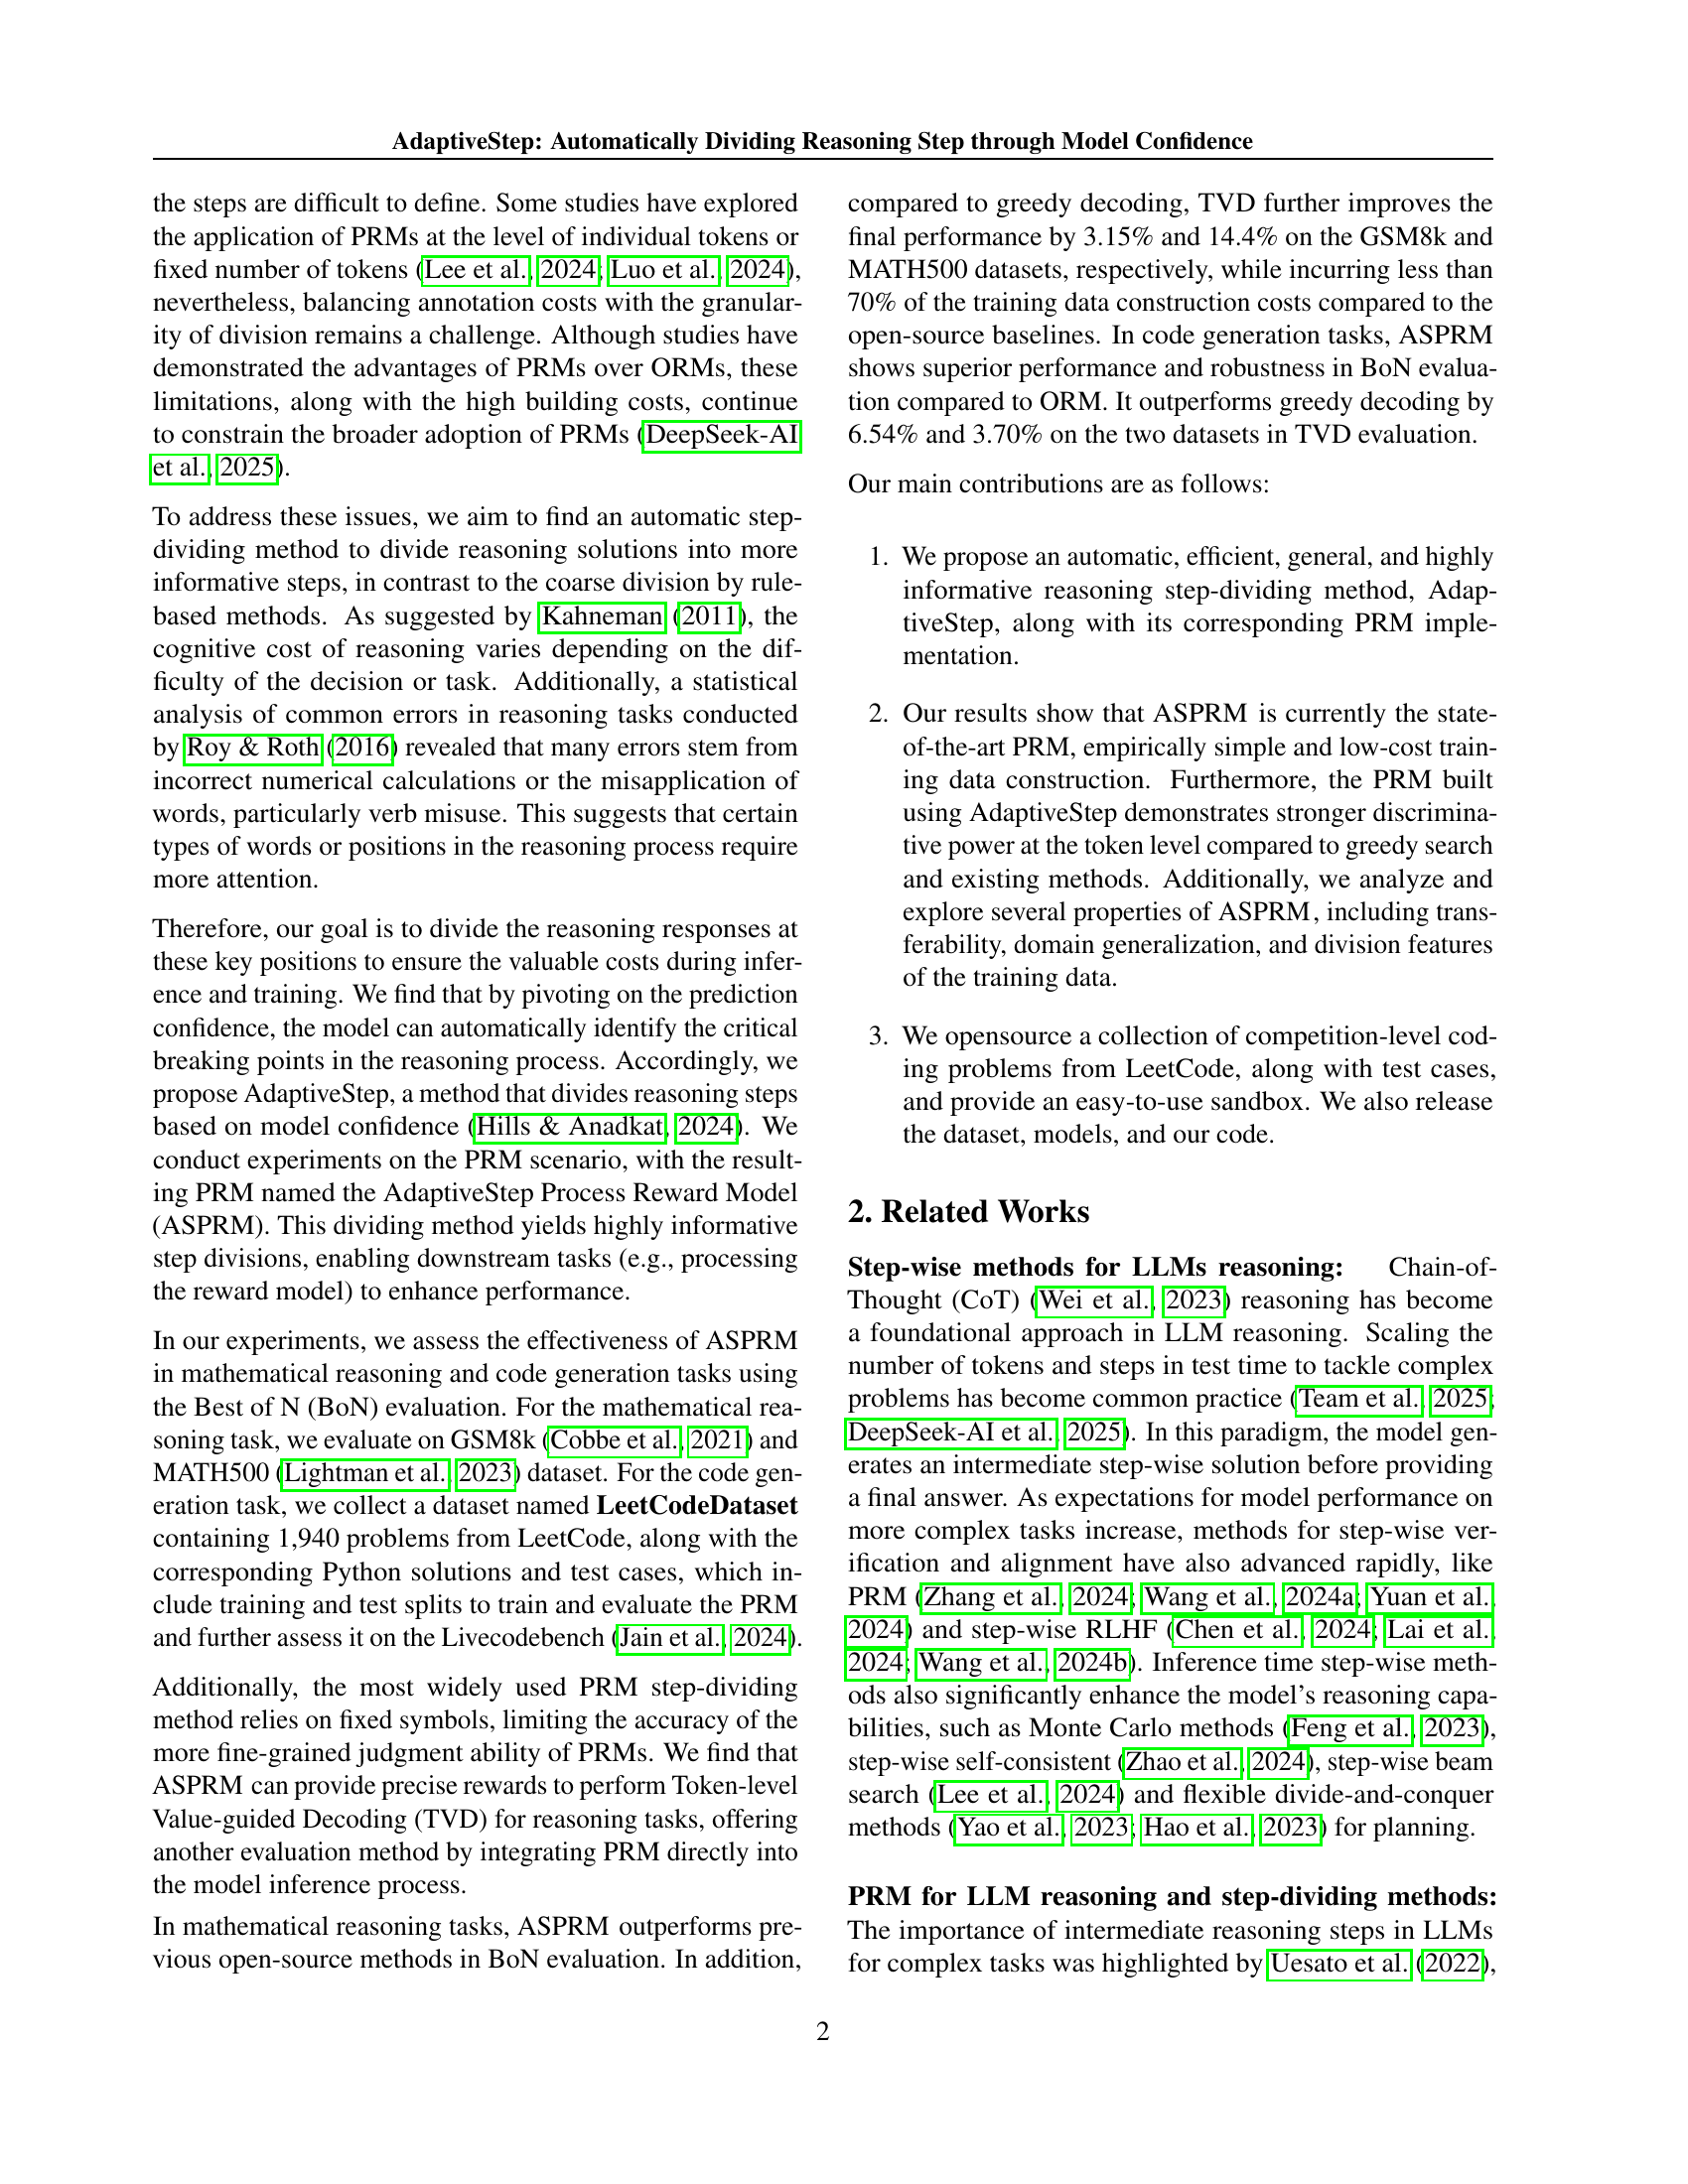
🔼 Figure 2 illustrates the AdaptiveStep process. Panel (a) details the training data construction pipeline. First, samples are drawn from a dataset, and model confidence scores are calculated. Then, a threshold is determined from the aggregate confidence distribution, and reasoning steps are divided based on this threshold. Each step is labeled using rollout. Panel (b) compares AdaptiveStep with rule-based methods for step division. Rule-based methods use predefined symbols or fixed token lengths (e.g., line breaks). In contrast, AdaptiveStep divides steps based on model confidence. The figure shows that AdaptiveStep identifies critical breaking points in reasoning (mathematical expressions, noun selections, final answer decisions), unlike rule-based methods, which show higher confidence at artificial boundaries like line breaks.
read the caption
Figure 2: Method overview. a) ASPRM Training Data Construction Pipeline. Step 1: Sample from the dataset of a given domain, collecting confidence scores and samples for the training data. Then, accumulate the confidence distribution of all samples and determine the threshold. Step 2: Divide reasoning steps based on the threshold and label the steps using rollout. b) The difference between Rule-based method and AdaptiveStep division. The Rule-based method divides the reasoning process using predefined symbols or fixed token counts (e.g., line breaks, as shown in the figure), while AdaptiveStep divides reasoning steps based on model confidence. We observe that the model tends to divide reasoning steps at key decision points, such as within mathematical expressions, at noun selections, and when determining the final answer. In contrast, we find that the confidence at line breaks is particularly high.
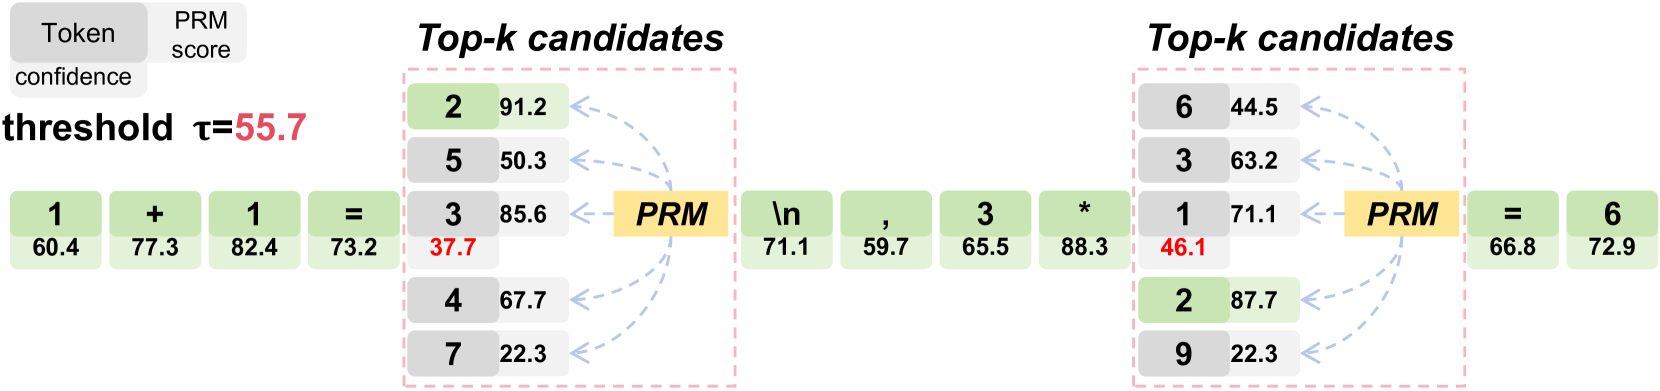
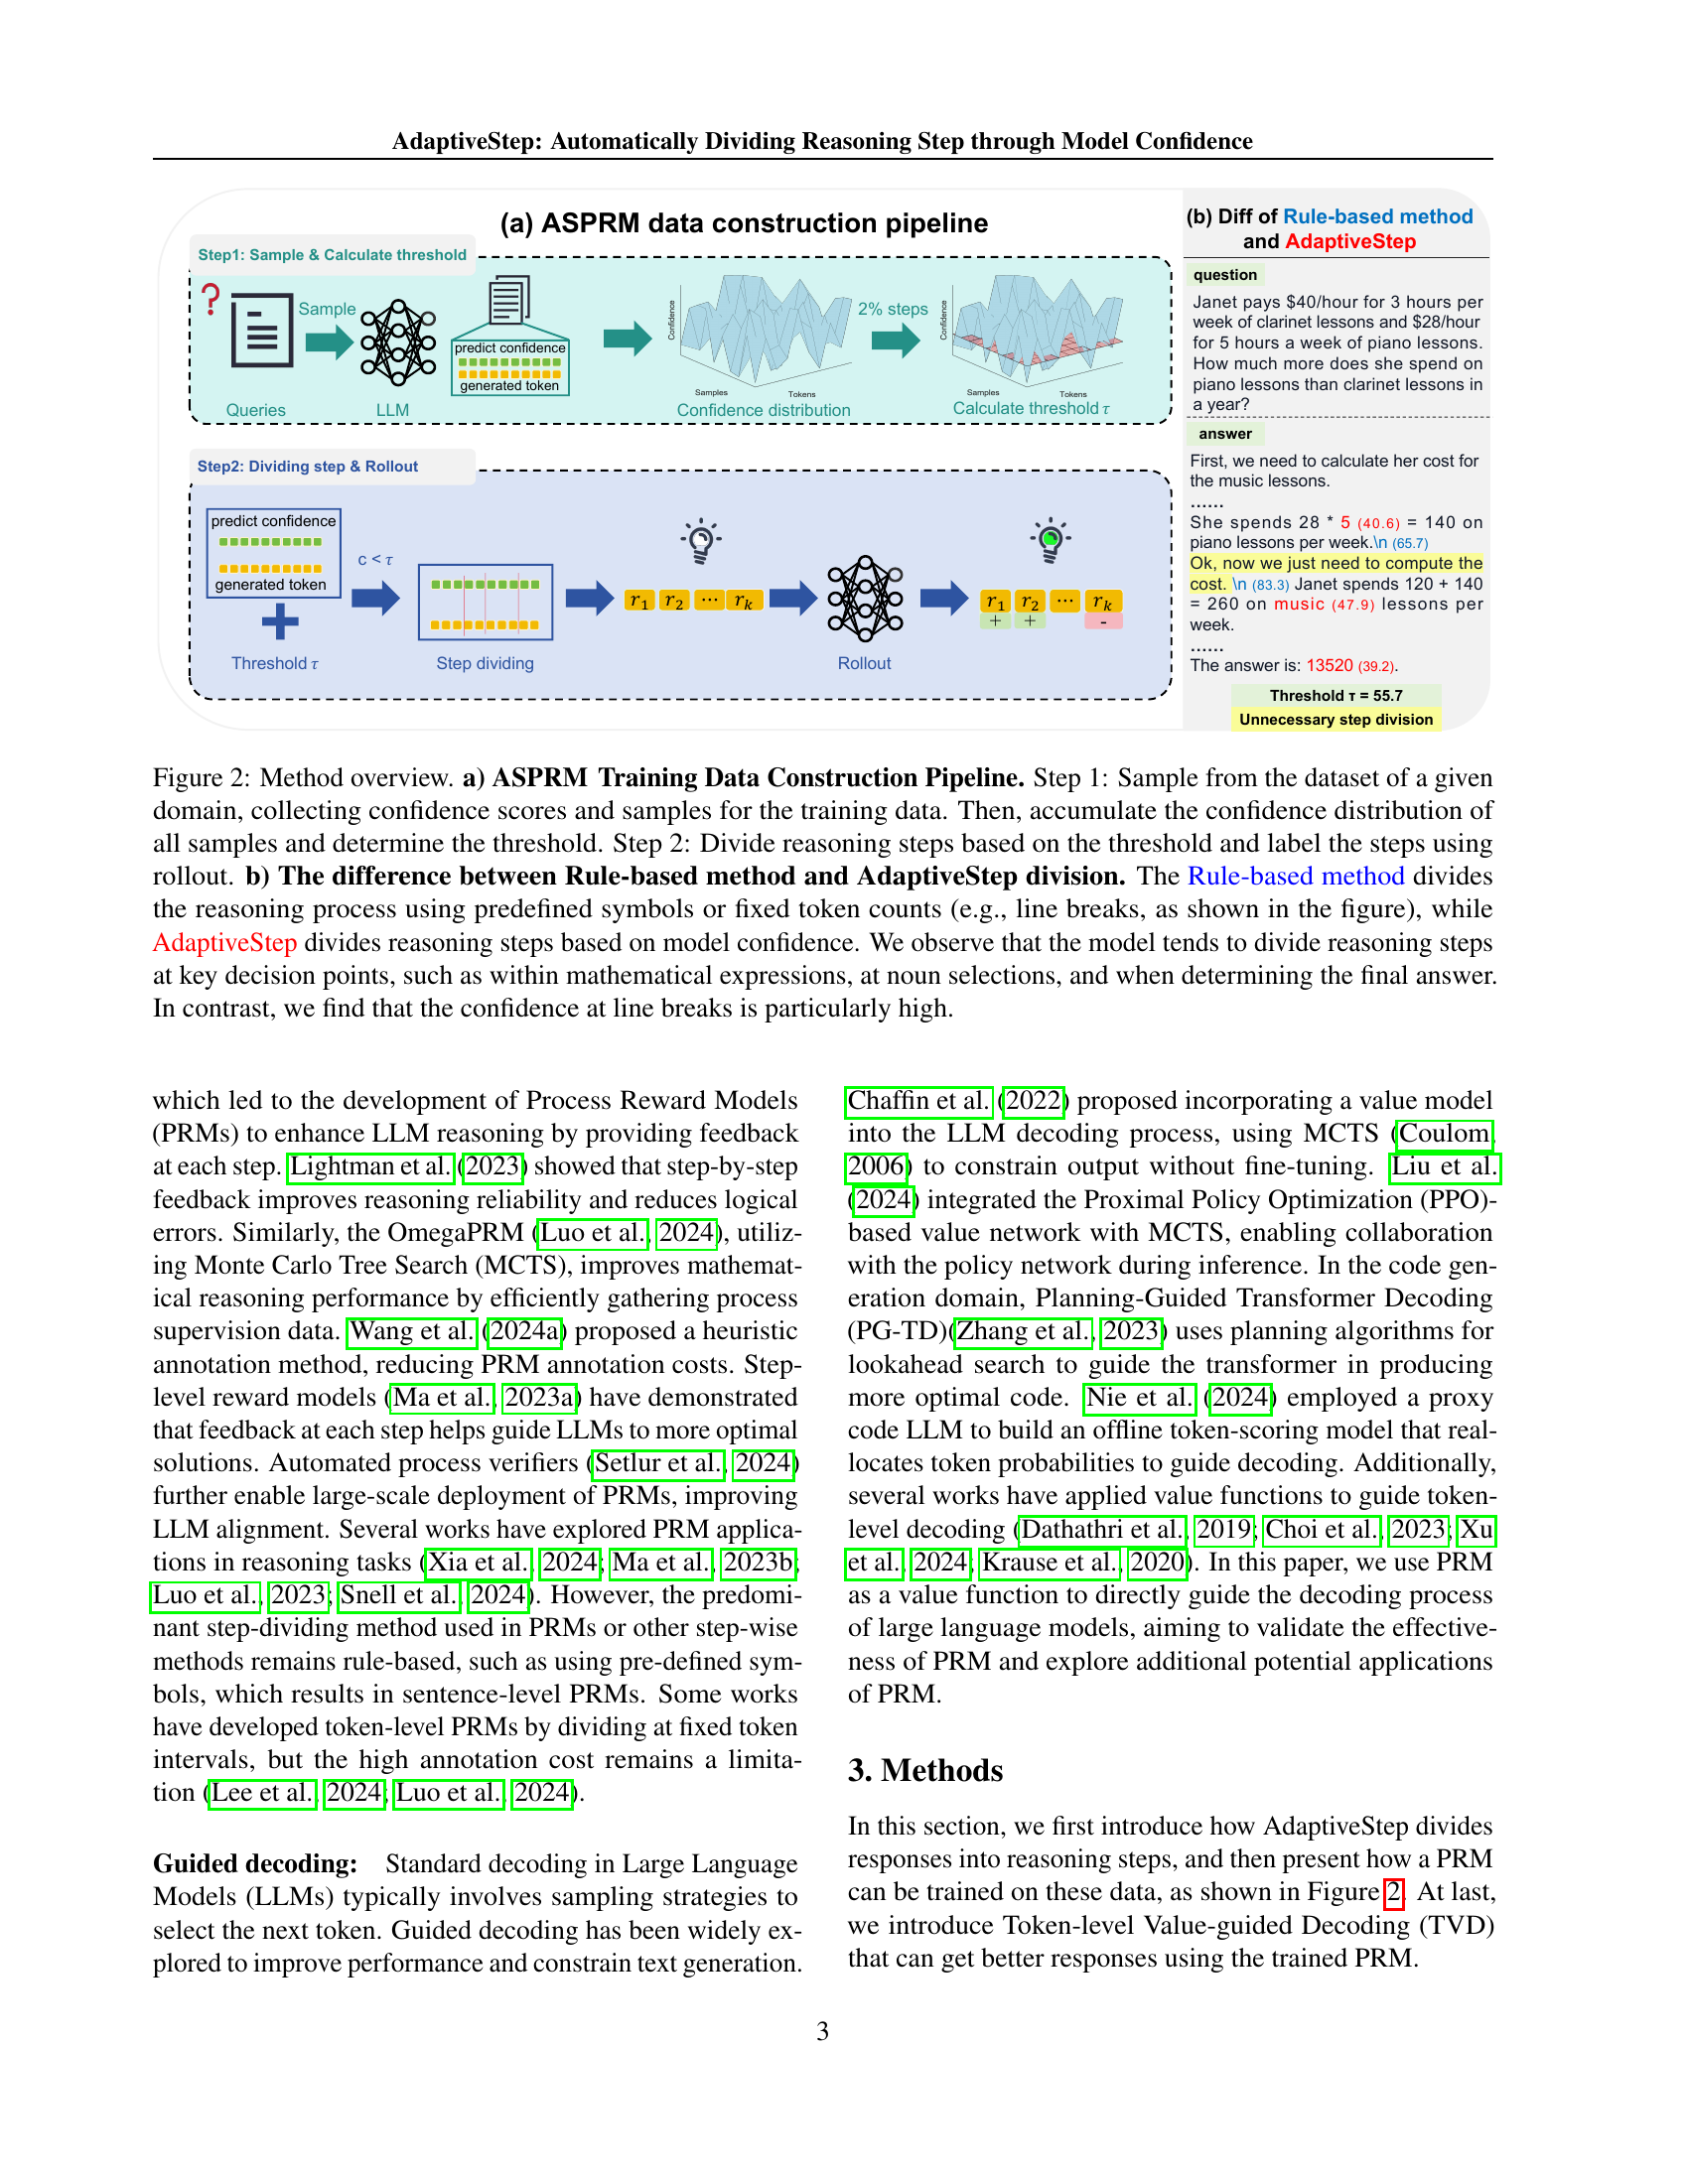
🔼 Figure 3 illustrates the Token-level Value-guided Decoding (TVD) process. A simple example is used to show how the method works. The model generates tokens, and their predicted confidence scores and PRM scores are displayed. Green tokens represent tokens selected by the TVD process, while gray tokens were not selected. The example problem is ‘3 * (1 + 1) = ?’, with the correct answer being 6. The model’s confidence is low (below threshold τ) when calculating 1+1. This low confidence indicates a decision point, where the model needs to decide which number to multiply by 3. The PRM helps guide the model to select the best token (based on its calculated reward) to reach the correct final answer. Red confidence scores highlight instances where the confidence of the top-predicted candidate falls below the threshold.
read the caption
Figure 3: We illustrate Token-level Value-guided Decoding (TVD) with a simple example. The green token denotes the selected tokens, while the gray token indicates the tokens that were not selected. The question is 3 * (1 + 1) = ?, and the correct output is 6. In this case, the model exhibits low confidence (where cy<τsubscript𝑐𝑦𝜏c_{y}<\tauitalic_c start_POSTSUBSCRIPT italic_y end_POSTSUBSCRIPT < italic_τ) when calculating the result of 1+1, and subsequently determines which number to multiply by 3. The PRM should select the best token based on its judgment to arrive at the correct final answer. As shown in the top-left corner, for each token, the middle box represents the token itself, the bottom box shows the predicted confidence, and the box on the right displays the PRM score. The red confidence score indicates that the confidence of the Top-1 predicted candidate is lower than the threshold.

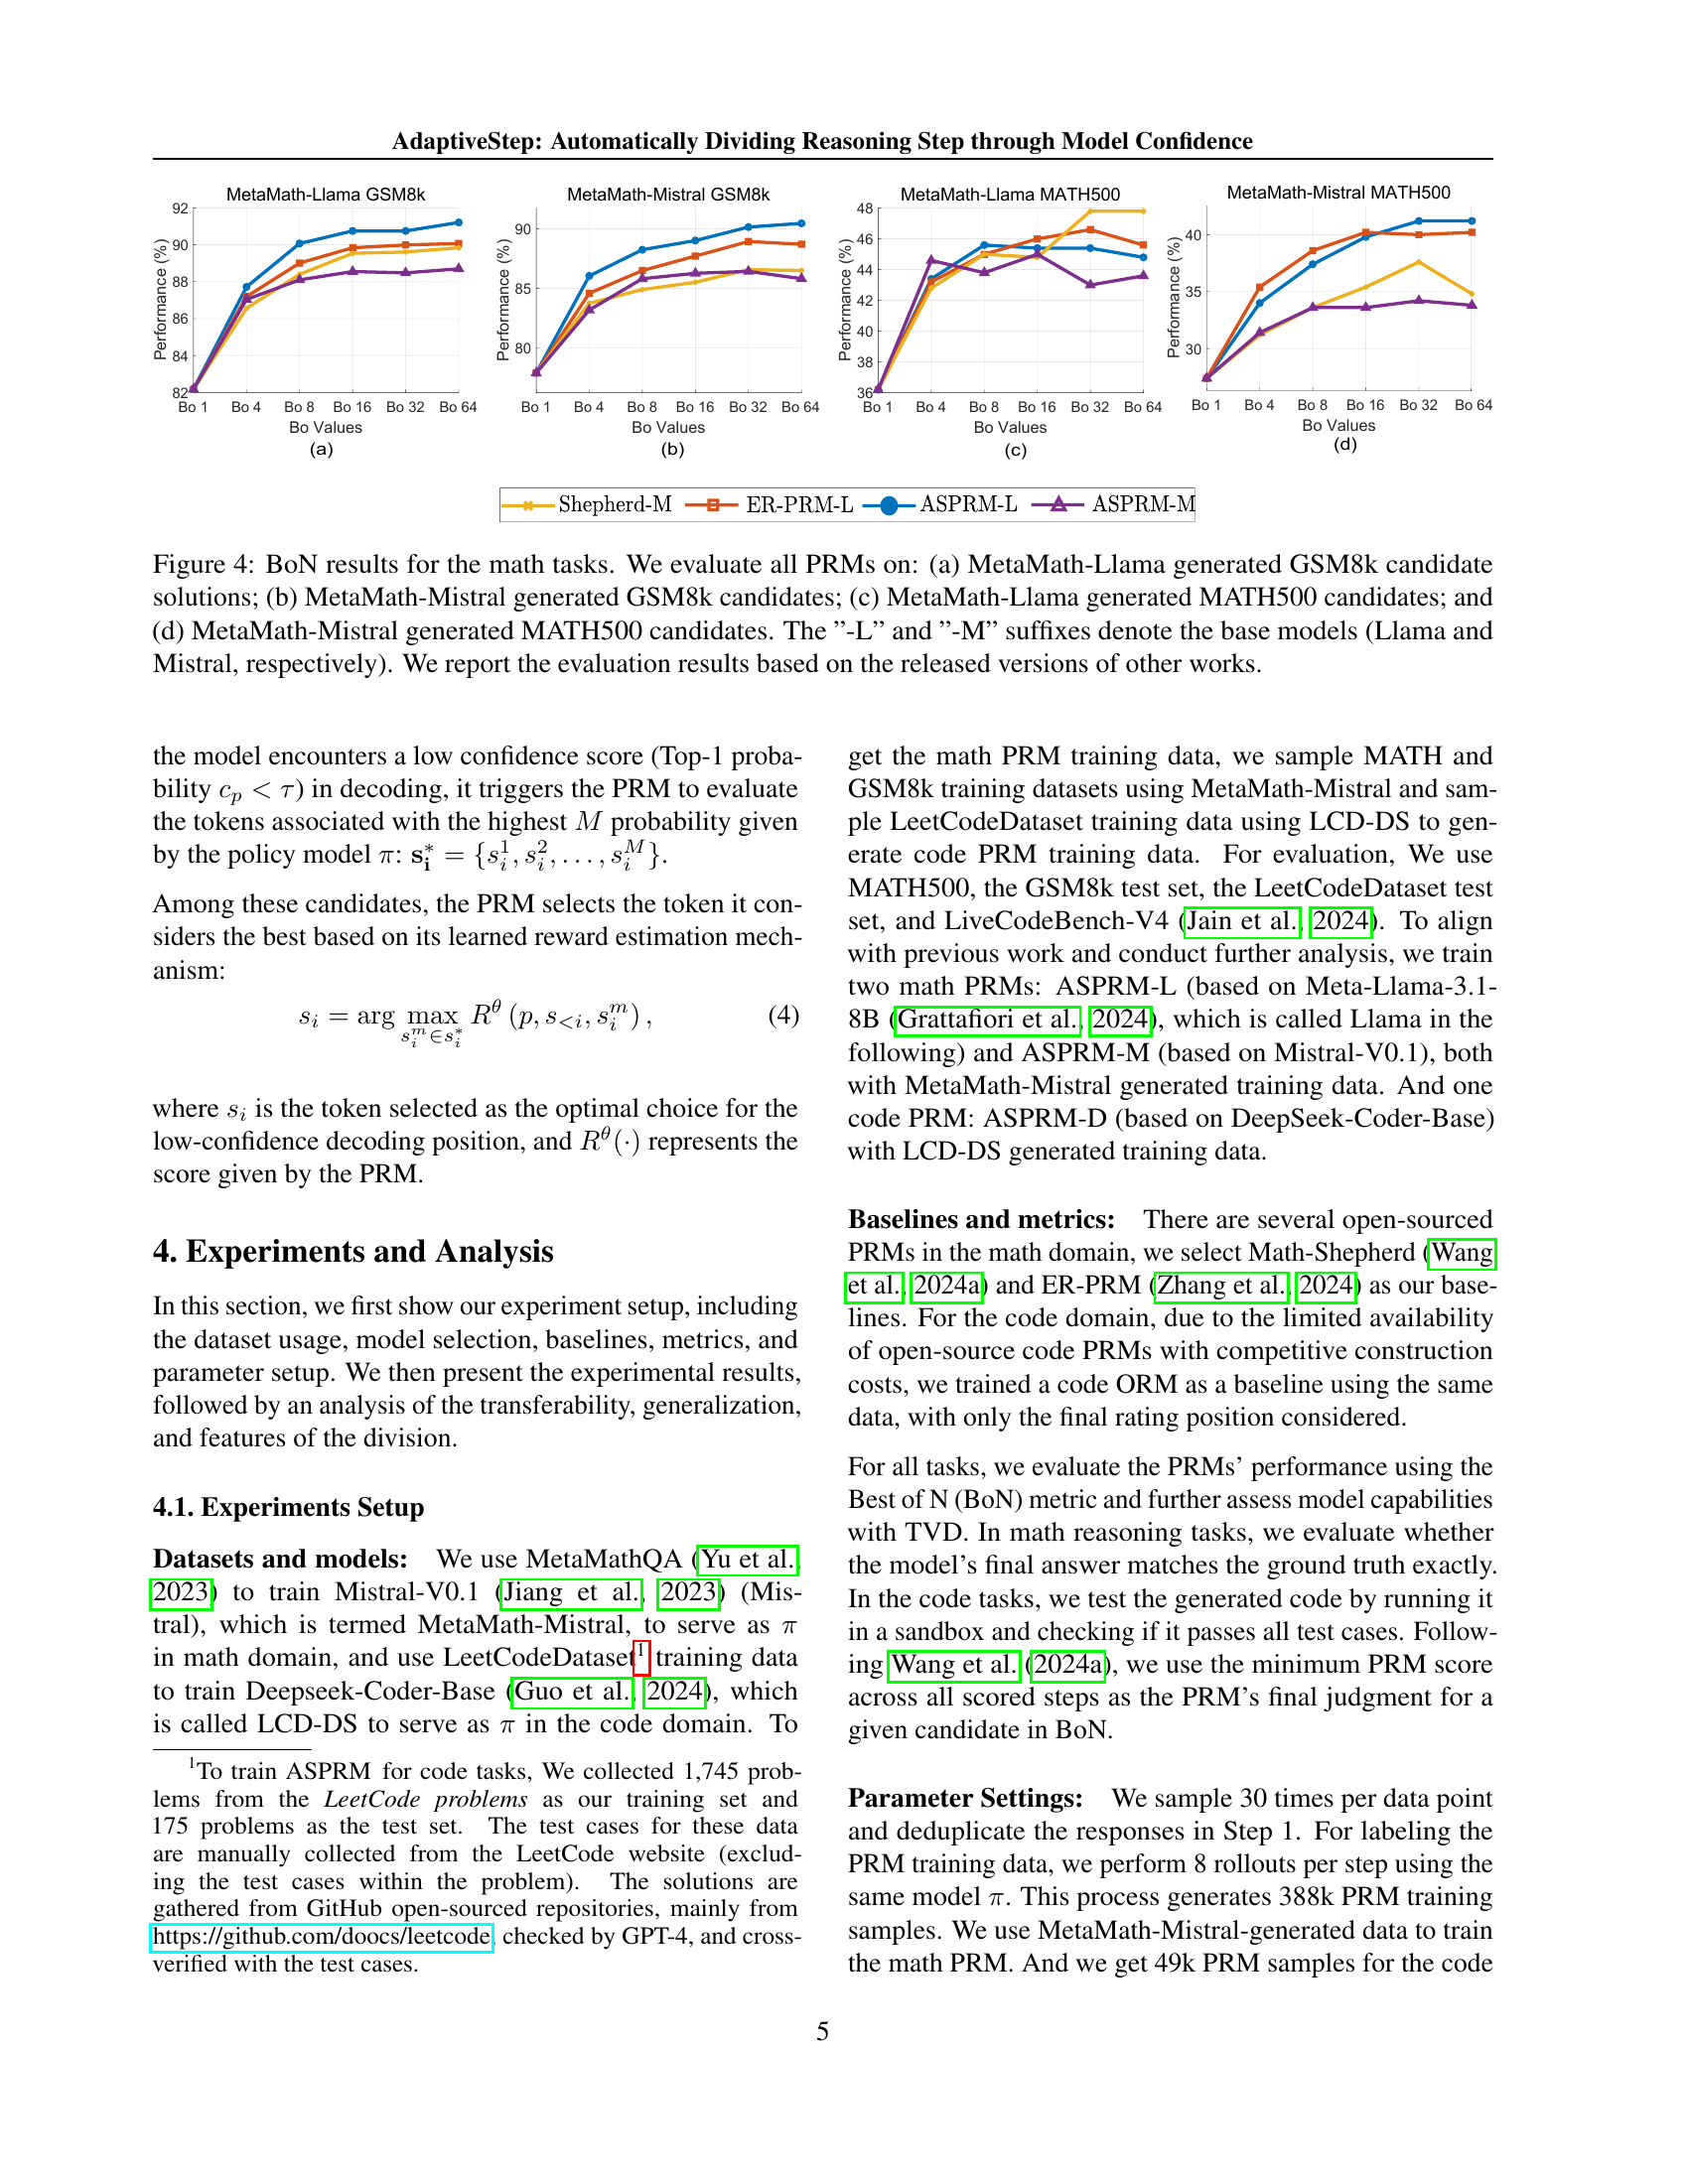
🔼 Figure 4 presents the Best-of-N (BoN) performance results for various Process Reward Models (PRMs) on mathematical reasoning tasks. The models were tested on two datasets, GSM8k and MATH500, with candidate solutions generated using two different LLMs, Llama and Mistral. Subfigures (a) and (b) show the results for GSM8k using Llama and Mistral respectively, while subfigures (c) and (d) display the MATH500 results using Llama and Mistral respectively. The suffixes ‘-L’ and ‘-M’ denote the base models used (Llama and Mistral). The results shown are based on previously published work, using the released versions of those models.
read the caption
Figure 4: BoN results for the math tasks. We evaluate all PRMs on: (a) MetaMath-Llama generated GSM8k candidate solutions; (b) MetaMath-Mistral generated GSM8k candidates; (c) MetaMath-Llama generated MATH500 candidates; and (d) MetaMath-Mistral generated MATH500 candidates. The ”-L” and ”-M” suffixes denote the base models (Llama and Mistral, respectively). We report the evaluation results based on the released versions of other works.

🔼 Figure 5 presents the Best-of-N (BoN) evaluation results for code generation tasks using two datasets: LeetCodeDataset and LiveCodeBench. Both datasets’ BoN candidates were generated using the LCD-DS model. The figure compares the performance of the AdaptiveStep Process Reward Model (ASPRM-D) with a baseline Outcome Reward Model (ORM-D). Subfigure (a) shows the results for the LeetCodeDataset while subfigure (b) displays the results for the LiveCodeBench dataset. This allows for a comparison of the two models across different datasets and provides insight into the effectiveness of ASPRM-D in code generation tasks.
read the caption
Figure 5: BoN results for the code datasets, we test ASPRM-D and a Code-ORM (ORM-D) on (a) LCD-DS generated LeetCodeDataset BoN candidates; (b) LCD-DS generated LiveCodeBench BoN candidates.

🔼 This figure presents the Best-of-N (BoN) results for mathematical reasoning tasks. It displays the performance of several PRMs (Process Reward Models), including ASPRM (AdaptiveStep Process Reward Model) and baselines like Math-Shepherd and ER-PRM, across four different experimental setups. The setups vary in the base LLMs used (Llama and Mistral) and the datasets used for evaluation (GSM8k and MATH500). Each bar graph shows the BoN performance at different values of N (the number of candidates considered), indicating how the performance improves as more candidates are evaluated.
read the caption
(a)

🔼 This figure presents a comparison of the Best-of-N (BoN) evaluation results for the code generation task. Specifically, it illustrates the performance of the AdaptiveStep Process Reward Model (ASPRM) against an Outcome Reward Model (ORM) baseline, using the BoN metric across different numbers of candidate solutions (Bo1, Bo4, Bo8, Bo16, Bo32, Bo64). The x-axis represents the number of candidates considered in the BoN evaluation, and the y-axis shows the accuracy (percentage of correctly solved problems). The results highlight the superior performance and robustness of ASPRM compared to the ORM, particularly as the number of considered candidates increases. The graph is divided into two parts, (a) and (b), each showing a different dataset used for evaluation.
read the caption
(b)

🔼 This figure displays the results of the Best-of-N (BoN) evaluation for mathematical reasoning tasks, specifically on the MATH500 dataset. It compares the performance of different PRMs (Process Reward Models), including the proposed ASPRM (AdaptiveStep Process Reward Model) and baselines such as Shepherd-MER-PRM and others. The x-axis represents different values of ‘N’ (the number of candidates considered in BoN), while the y-axis represents the accuracy achieved. The figure shows how the ASPRM achieves state-of-the-art results in BoN evaluations for mathematical reasoning tasks. The labels ‘-L’ and ‘-M’ indicate the base models used (Llama and Mistral, respectively).
read the caption
(c)

🔼 This figure displays the Best-of-N (BoN) results for mathematical reasoning tasks using the MetaMath-Mistral generated MATH500 candidate solutions. The x-axis represents different values of N (the number of candidates considered), indicating the diversity of the solutions explored. The y-axis represents the accuracy achieved. The plot compares the performance of several different PRMs, including ASPRM-L (trained on Llama), ASPRM-M (trained on Mistral), and two baselines (Math-Shepherd and ER-PRM). The figure shows the performance comparison across different values of N, allowing analysis of the effectiveness of each PRM model at different levels of diversity considered in the evaluation.
read the caption
(d)
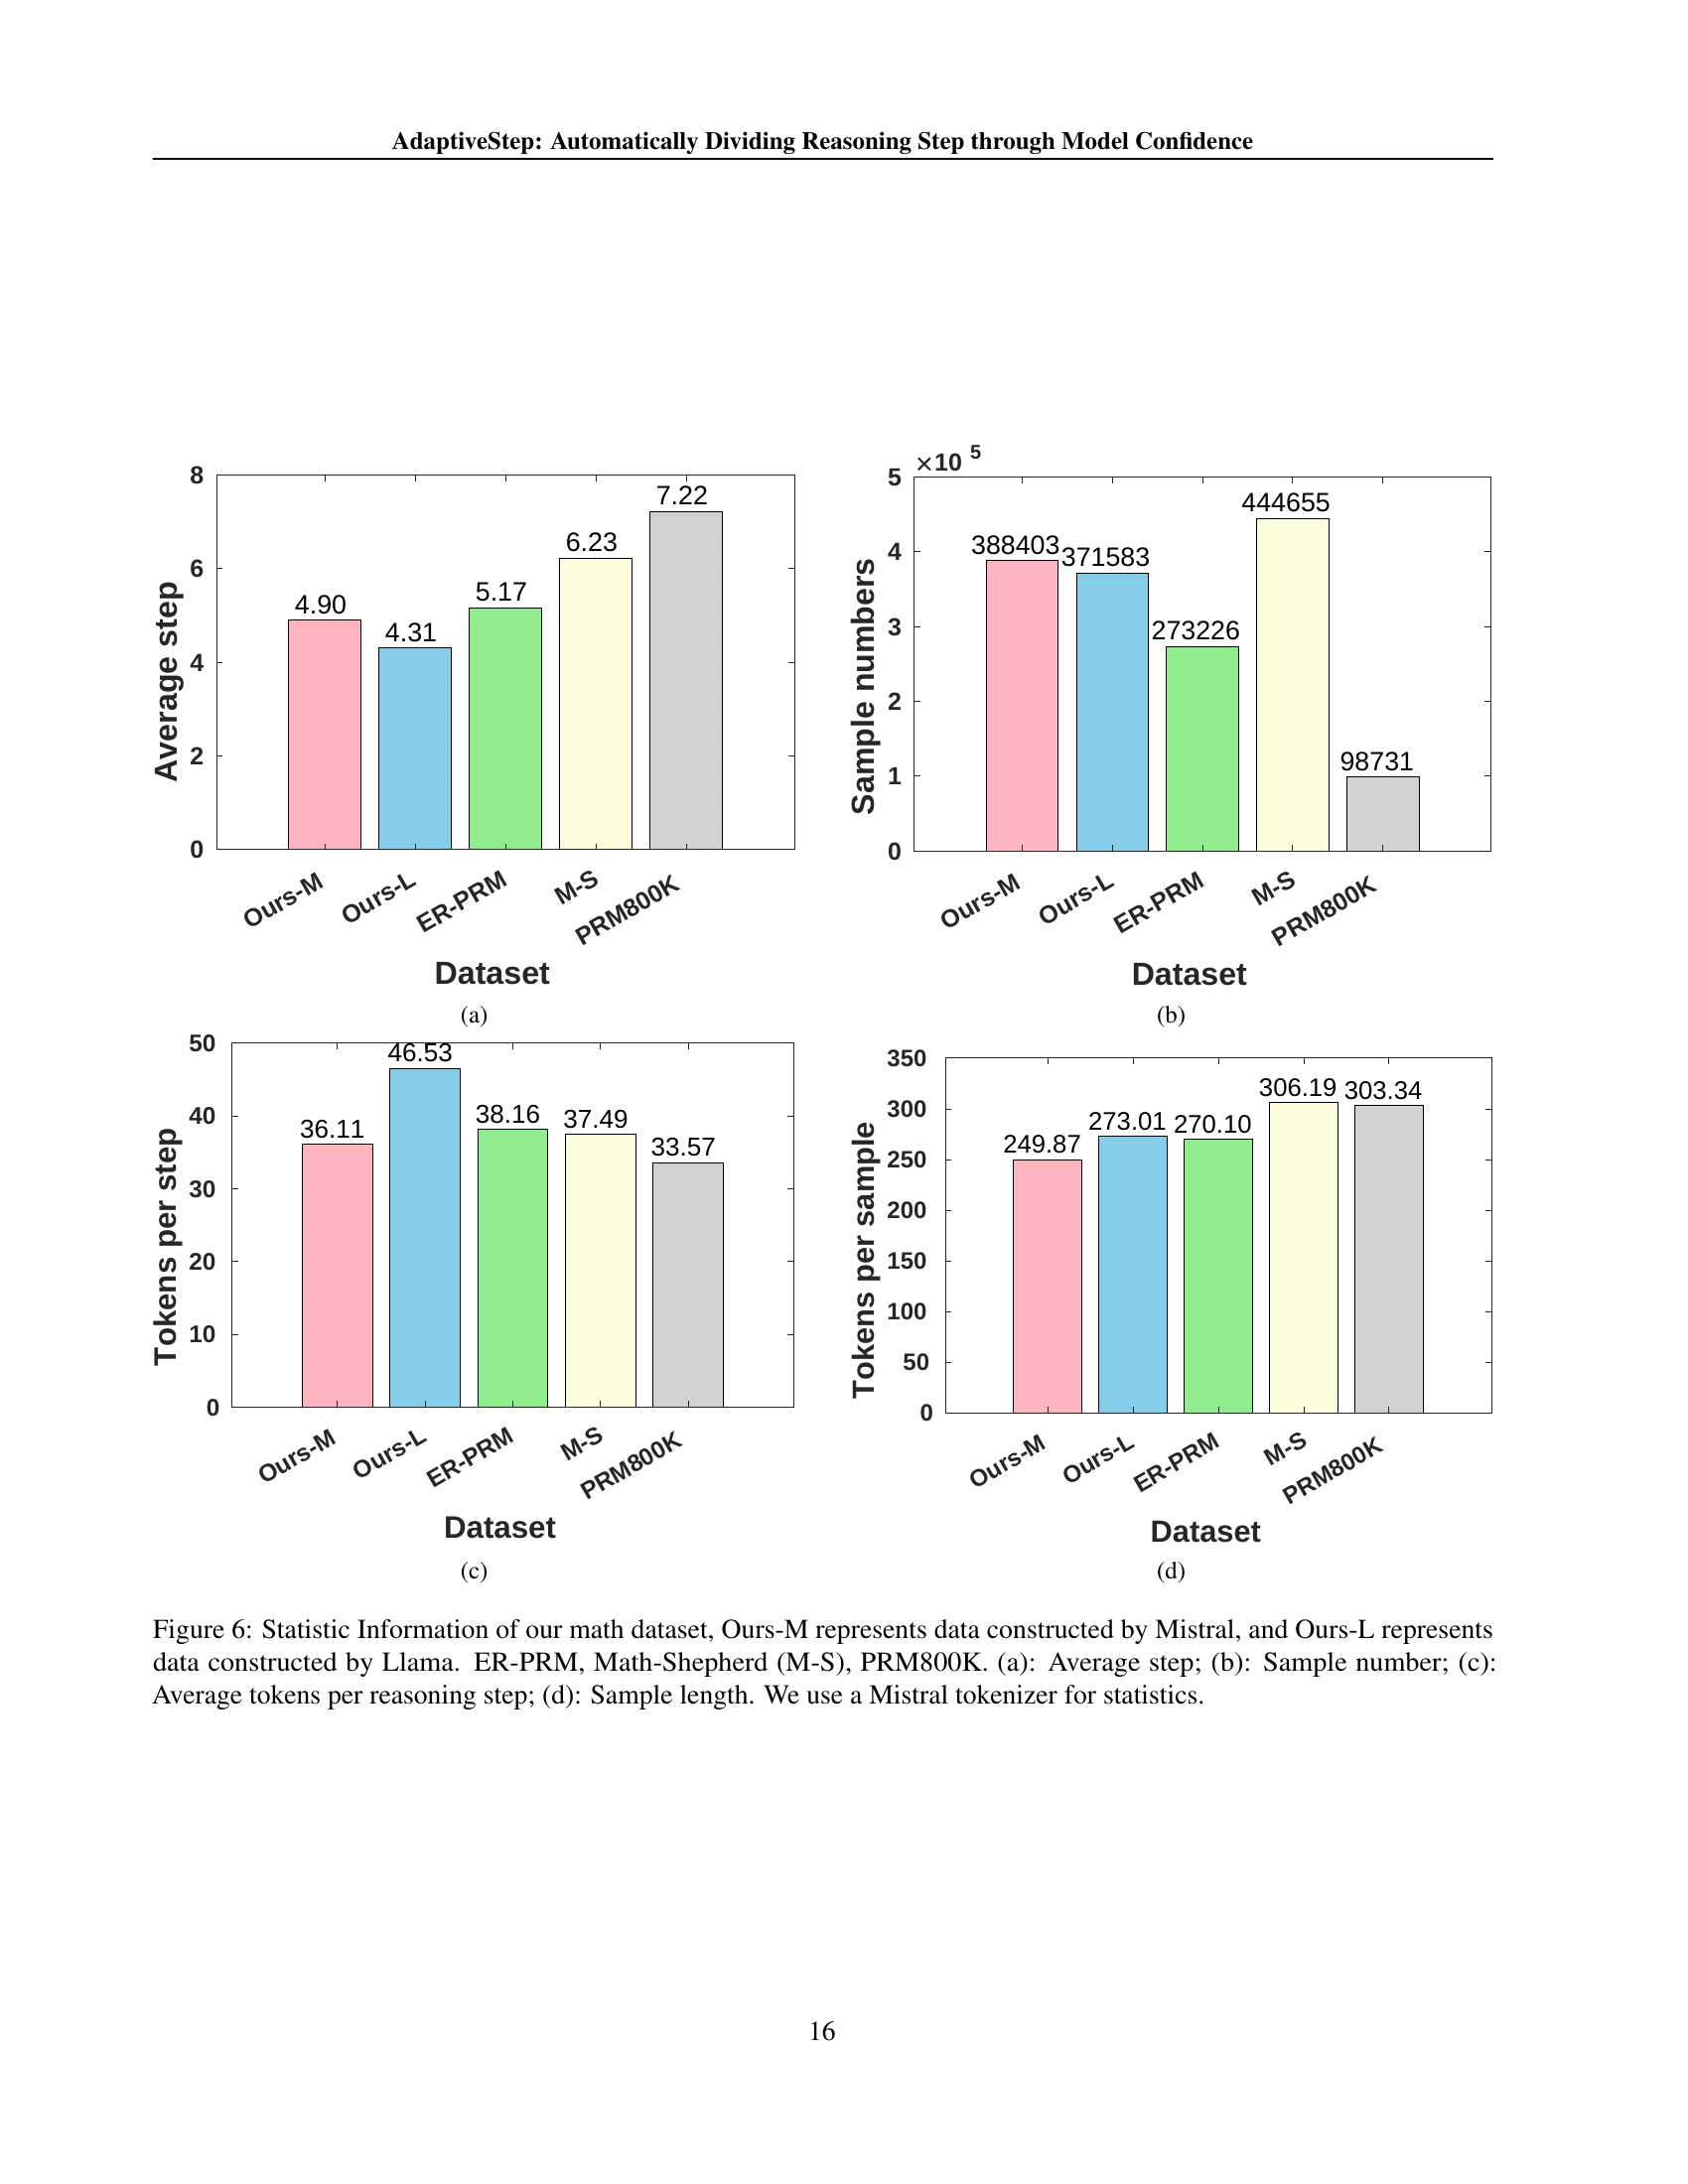
🔼 Figure 6 presents a comparative analysis of four different methods used to construct training data for a Process Reward Model (PRM) applied to mathematical reasoning tasks. The methods compared are: data generated using the Mistral model (Ours-M), data generated using the Llama model (Ours-L), data from the ER-PRM model, data from the Math-Shepherd model, and data from the PRM800K model. The figure displays four subplots: (a) shows the average number of reasoning steps generated by each method, (b) shows the total number of samples generated by each method, (c) shows the average number of tokens per reasoning step, and (d) shows the average length (in tokens) of each sample. A Mistral tokenizer was consistently used for all statistical calculations. This visualization allows for direct comparison of the characteristics of the training data produced by each method, illustrating potential differences in efficiency, granularity, and data volume.
read the caption
Figure 6: Statistic Information of our math dataset, Ours-M represents data constructed by Mistral, and Ours-L represents data constructed by Llama. ER-PRM, Math-Shepherd (M-S), PRM800K. (a): Average step; (b): Sample number; (c): Average tokens per reasoning step; (d): Sample length. We use a Mistral tokenizer for statistics.

🔼 This figure presents the results of the Best-of-N (BoN) evaluation for mathematical reasoning tasks. It shows the performance of various PRMs (Process Reward Models), including ASPRM (AdaptiveStep PRM), on two datasets: GSM8k and MATH500. The models are evaluated using different base models (Llama and Mistral). The x-axis represents different values of N, while the y-axis shows the accuracy achieved. This allows for a comparison of the different PRMs’ effectiveness in selecting the best solution from multiple generated responses. The plots are categorized by the base LLMs and datasets, enabling a detailed analysis of their relative strengths and weaknesses.
read the caption
(a)
More on tables
| Setup | Test Dataset | Bo64 / TVD |
|---|---|---|
| L to M | M-MATH500 | 34.20↓ / 27.60↑ |
| M-GSM8k | 83.40↓ / 77.94↑ | |
| L-MATH500 | 41.80↓ / 41.40↑ | |
| L-GSM8k | 87.87↓ / 82.49↓ |
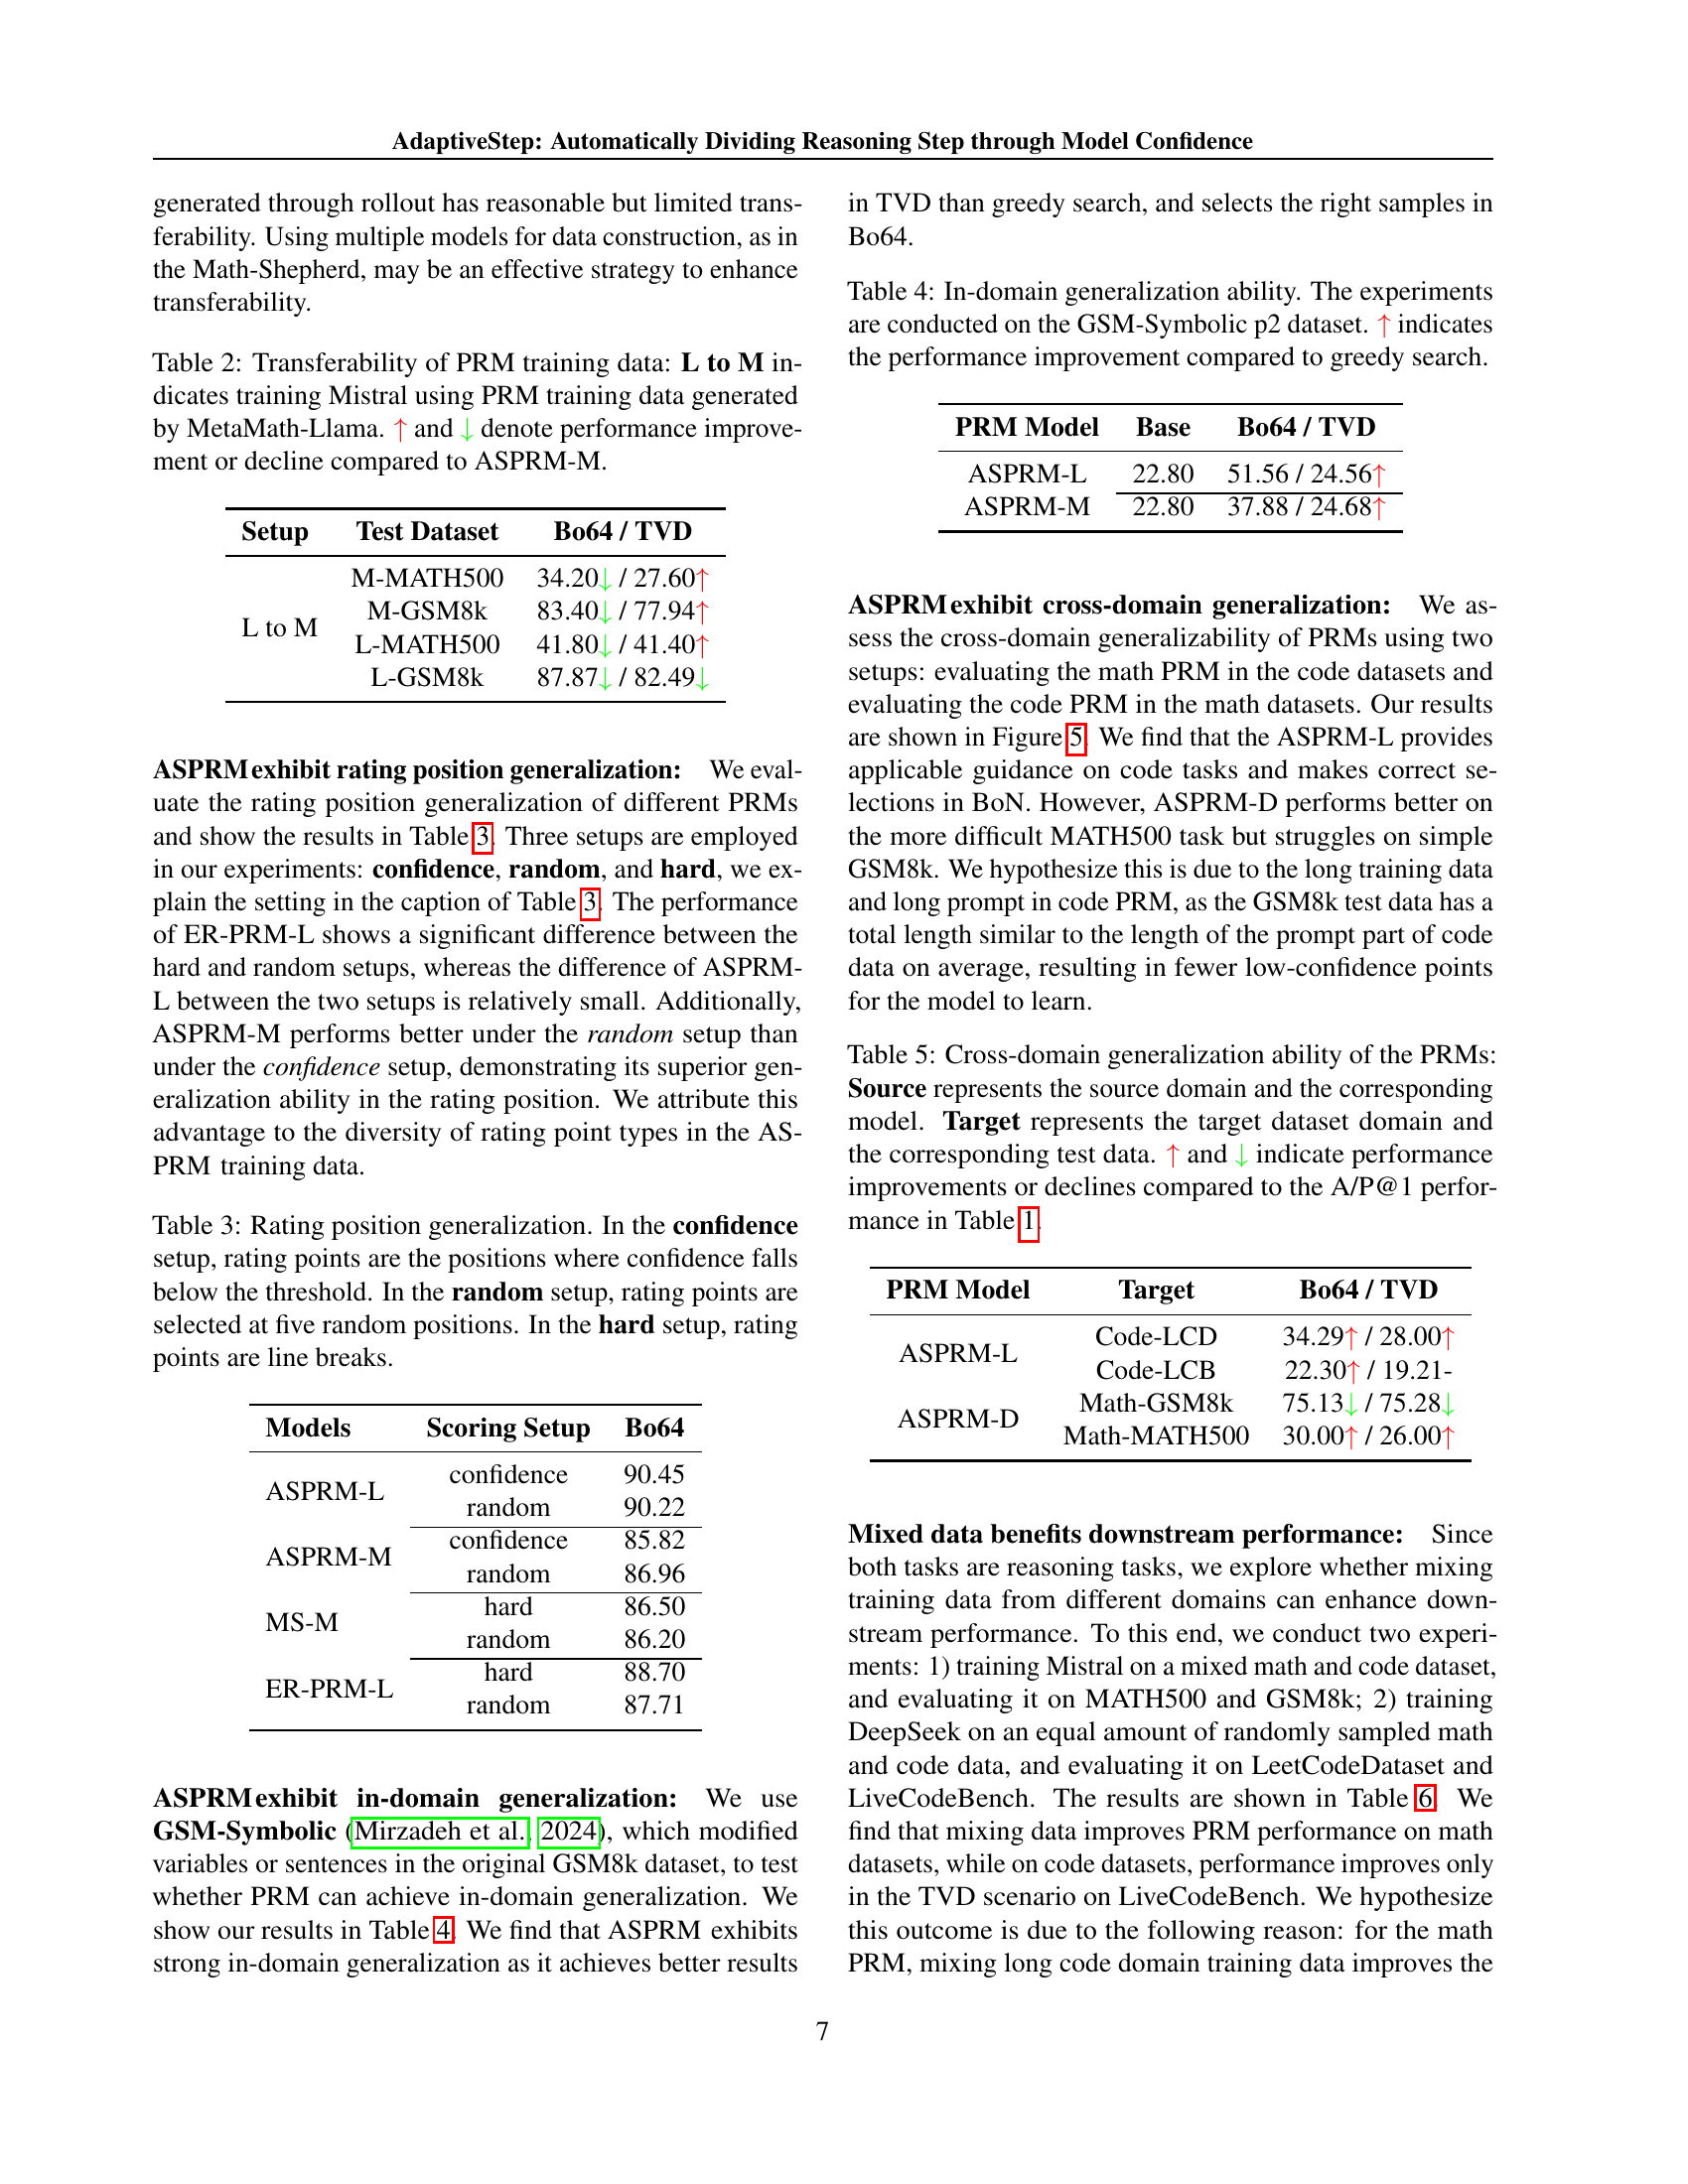
🔼 This table presents the results of an experiment assessing the transferability of Process Reward Model (PRM) training data. Specifically, it investigates whether a PRM trained on data generated by one language model (MetaMath-Llama) can effectively be used with a different language model (Mistral). The ‘L to M’ setup denotes training the Mistral model using PRM data originally generated by the Llama model. The table compares the performance of this setup against the performance of the Mistral model trained on its own data (‘ASPRM-M’). The ‘BoN’ metric (Best-of-N) and the ‘TVD’ method (Token-level Value-guided Decoding) are used for evaluation, for two different datasets (MATH500 and GSM8k). The up and down arrows (↑↓) indicate whether the performance improved or decreased compared to the baseline (ASPRM-M).
read the caption
Table 2: Transferability of PRM training data: L to M indicates training Mistral using PRM training data generated by MetaMath-Llama. ↑ and ↓ denote performance improvement or decline compared to ASPRM-M.
| Models | Scoring Setup | Bo64 |
|---|---|---|
| ASPRM-L | confidence | 90.45 |
| random | 90.22 | |
| ASPRM-M | confidence | 85.82 |
| random | 86.96 | |
| MS-M | hard | 86.50 |
| random | 86.20 | |
| ER-PRM-L | hard | 88.70 |
| random | 87.71 |
🔼 This table presents the results of an experiment assessing the generalization ability of different methods for selecting rating positions in a process reward model (PRM). Three different setups were used: 1) Confidence: Rating points are identified where model confidence falls below a pre-defined threshold, reflecting areas of uncertainty in the model’s reasoning process. 2) Random: Five rating points are randomly selected within the response. 3) Hard: Rating points are fixed to line breaks in the text. The table compares the performance (BoN@64) under each condition, demonstrating how well each method generalizes to different rating position selection strategies.
read the caption
Table 3: Rating position generalization. In the confidence setup, rating points are the positions where confidence falls below the threshold. In the random setup, rating points are selected at five random positions. In the hard setup, rating points are line breaks.
| PRM Model | Base | Bo64 / TVD |
|---|---|---|
| ASPRM-L | 22.80 | 51.56 / 24.56↑ |
| ASPRM-M | 22.80 | 37.88 / 24.68↑ |
🔼 This table presents the results of evaluating the in-domain generalization capabilities of different PRM models. The evaluation was performed on the GSM-Symbolic p2 dataset, a modified version of the GSM8k dataset designed to test the models’ ability to handle variations in problem wording or structure. The table compares the performance of different PRMs (including ASPRM models) using the Best-of-N (BoN) metric and Token-level Value-guided Decoding (TVD). The ‘Base’ column shows the accuracy achieved using greedy search (baseline), while BoN/TVD columns represent the performance improvement using the Best-of-N strategy and TVD, respectively. The up arrow (↑) indicates a performance improvement compared to the baseline greedy search results.
read the caption
Table 4: In-domain generalization ability. The experiments are conducted on the GSM-Symbolic p2 dataset. ↑ indicates the performance improvement compared to greedy search.
| PRM Model | Target | Bo64 / TVD |
|---|---|---|
| ASPRM-L | Code-LCD | 34.29↑ / 28.00↑ |
| Code-LCB | 22.30↑ / 19.21- | |
| ASPRM-D | Math-GSM8k | 75.13↓ / 75.28↓ |
| Math-MATH500 | 30.00↑ / 26.00↑ |
🔼 This table presents the results of evaluating the transferability of the Process Reward Models (PRMs) across different domains. It shows the performance (using BoN and TVD metrics) of models trained on one domain (Source) when applied to a different domain (Target). The ‘Source’ column indicates the training data domain and the corresponding PRM, while the ‘Target’ column specifies the evaluation dataset and its domain. Performance improvements (↑) or declines (↓) relative to the original model’s greedy search performance (A/P@1, from Table 1) are also indicated, giving a clear comparison of how well the PRMs generalize to new, unseen domains.
read the caption
Table 5: Cross-domain generalization ability of the PRMs: Source represents the source domain and the corresponding model. Target represents the target dataset domain and the corresponding test data. ↑ and ↓ indicate performance improvements or declines compared to the A/P@1 performance in Table 1.
| Base Model | Train | Test | Bo64 / TVD |
|---|---|---|---|
| Mistral | M+C | GSM8k | 86.35↑ / 77.79↑ |
| M+C | MATH500 | 35.40↑ / 29.00↑ | |
| Deepseek | C+M | LCD | 37.71- / 28.00- |
| C+M | LCB | 24.96↓ / 20.33↑ |
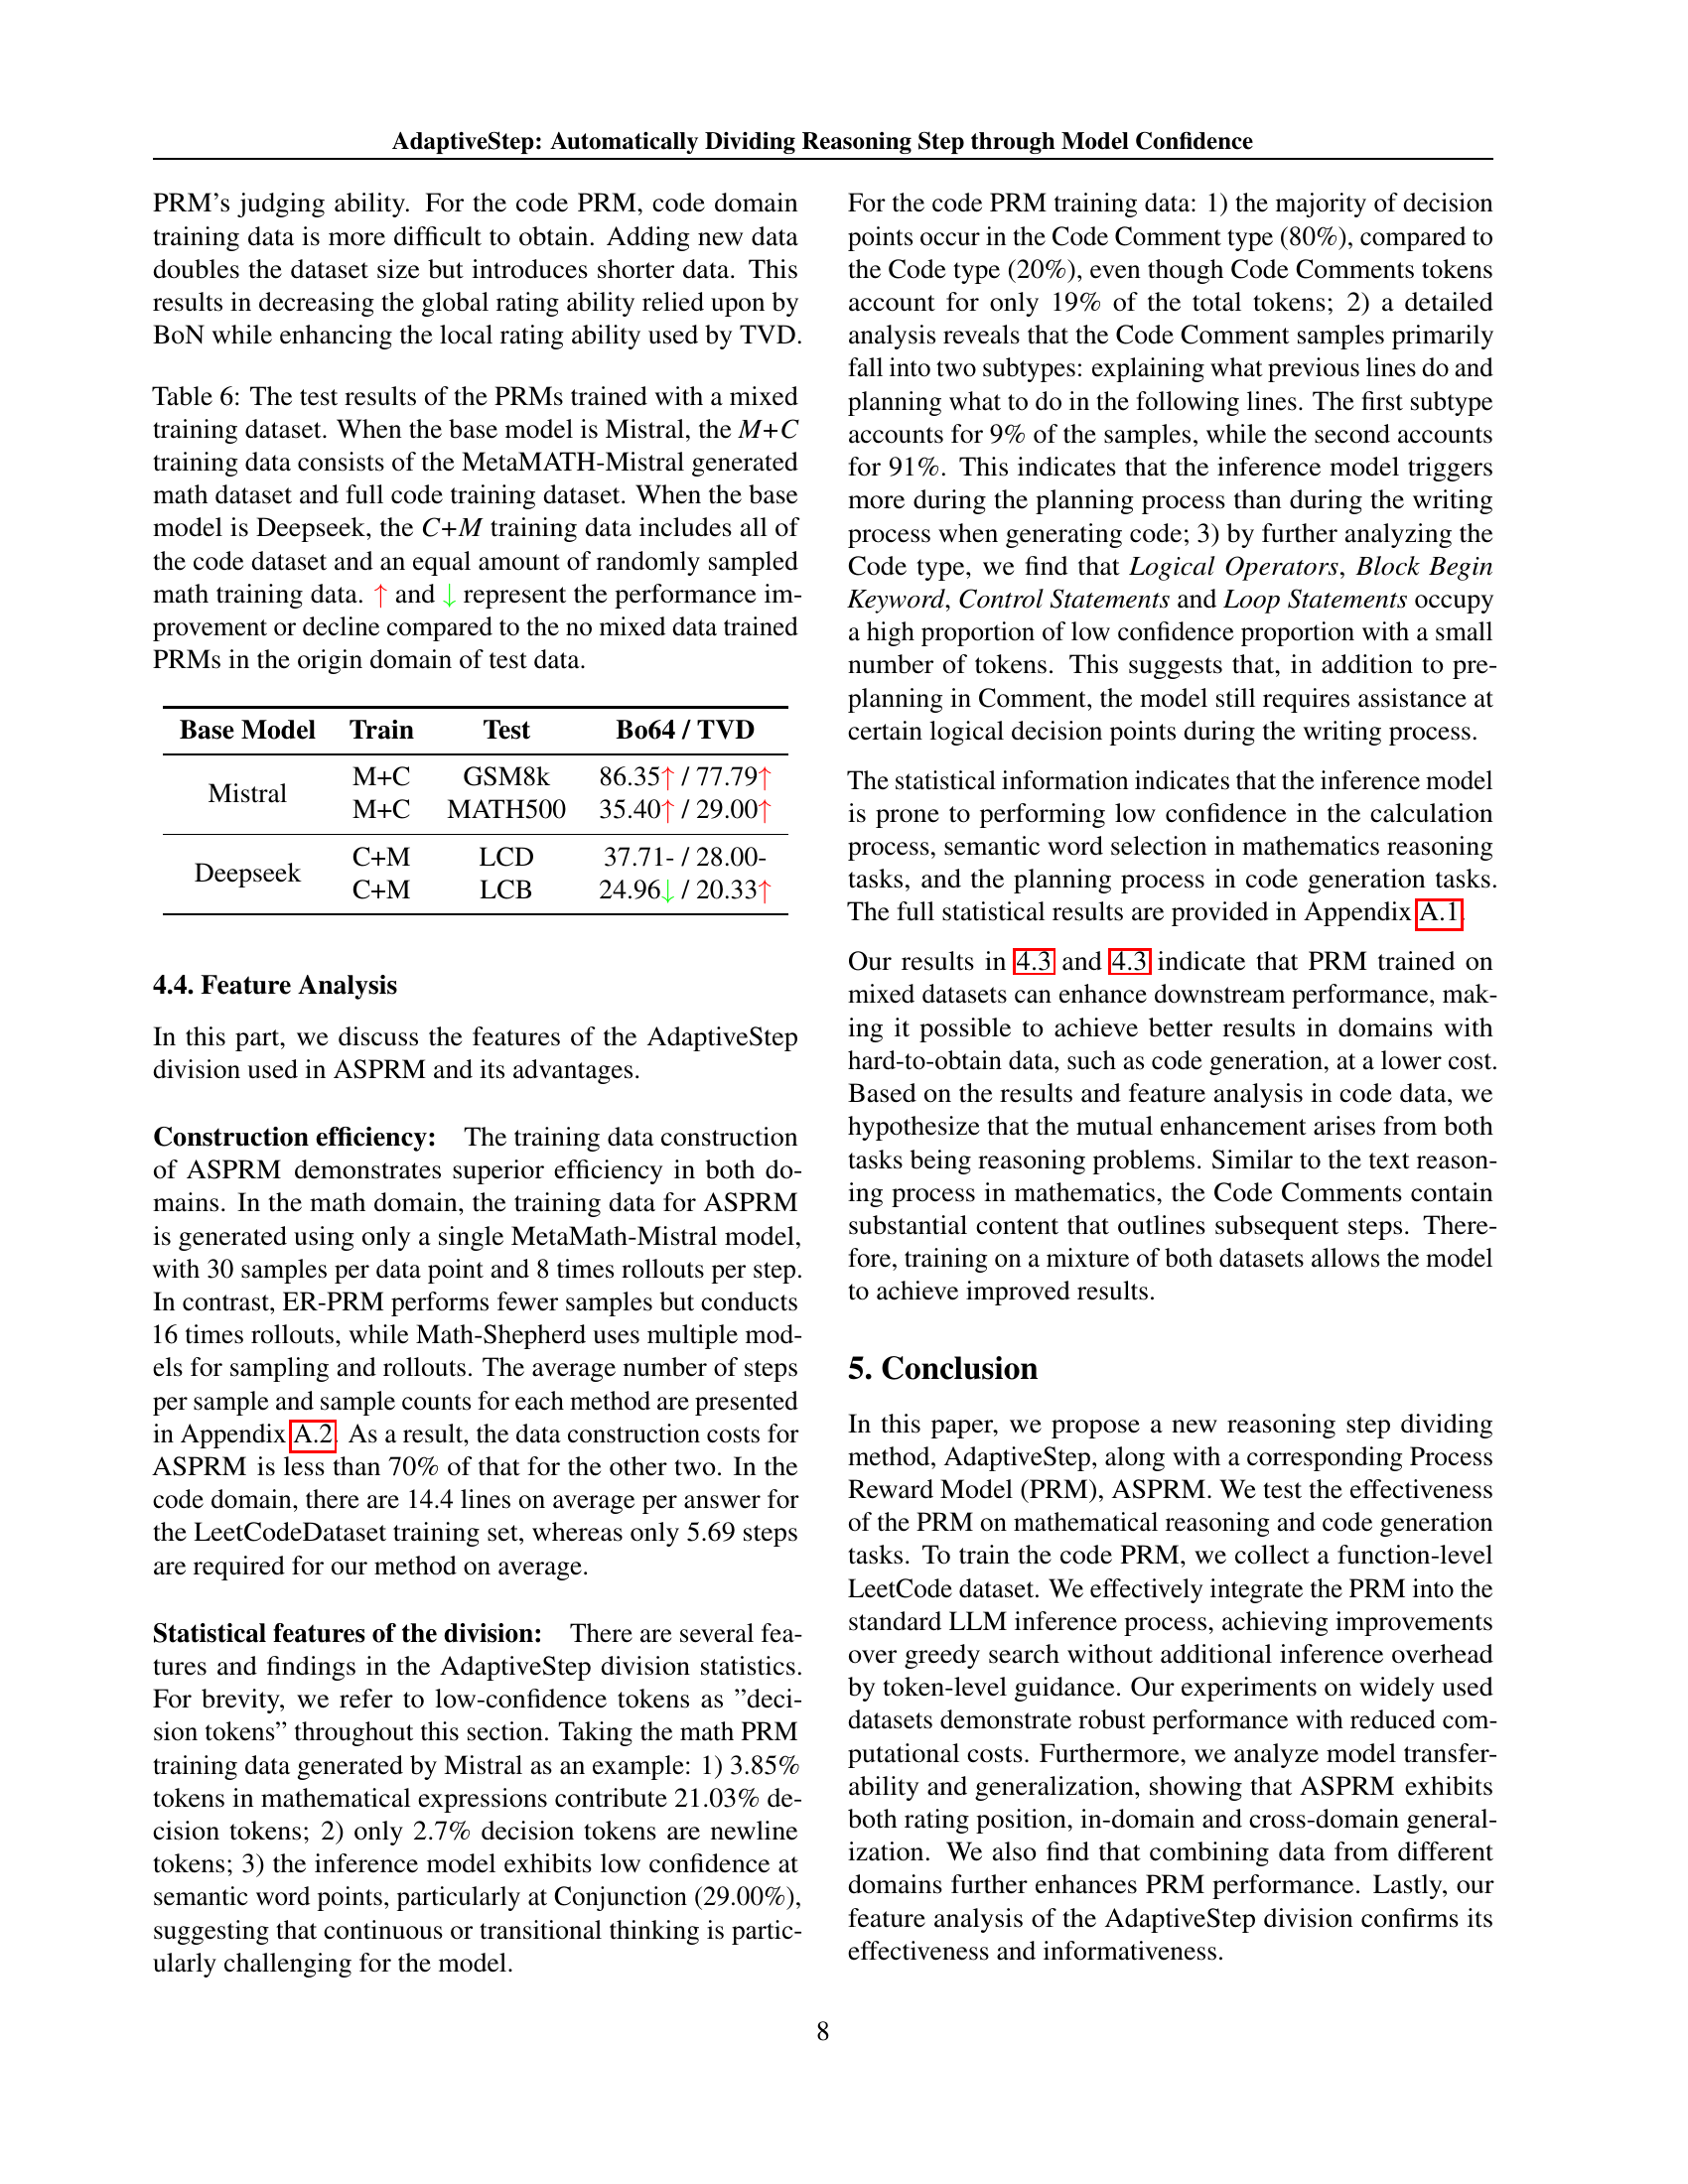
🔼 This table presents the results of evaluating Process Reward Models (PRMs) trained on mixed datasets containing both mathematical reasoning and code generation data. Two base models were used: Mistral and DeepSeek. For Mistral, the mixed dataset (M+C) combined MetaMath-Mistral generated math data with the complete code training dataset. For DeepSeek, the mixed dataset (C+M) used the entire code dataset along with an equal amount of randomly selected math data. The table shows the performance (BoN and TVD) of these mixed-data PRMs on the original math and code test datasets, comparing them to PRMs trained without mixed data to highlight the impact of data mixing on the model’s performance.
read the caption
Table 6: The test results of the PRMs trained with a mixed training dataset. When the base model is Mistral, the M+C training data consists of the MetaMATH-Mistral generated math dataset and full code training dataset. When the base model is Deepseek, the C+M training data includes all of the code dataset and an equal amount of randomly sampled math training data. ↑ and ↓ represent the performance improvement or decline compared to the no mixed data trained PRMs in the origin domain of test data.
| Categories | Subtypes | Position | |
|---|---|---|---|
| Token type proportion (78m) | decision token proportion (1517k) | ||
| Natural Sentence | New line break | 3.85% | 2.70% |
| Punctuation | 26.92% | 4.61% | |
| Reasoning | Symbolic Reasoning | 15.39% | 6.79% |
| Math Formula | 3.85% | 21.03% | |
| Entity | Noun | 15.38% | 11.01% |
| Semantics | Conjunction | 20.51% | 29.00% |
| Verb | 6.41% | 5.34% | |
| Determiner | 7.69% | 2.64% | |
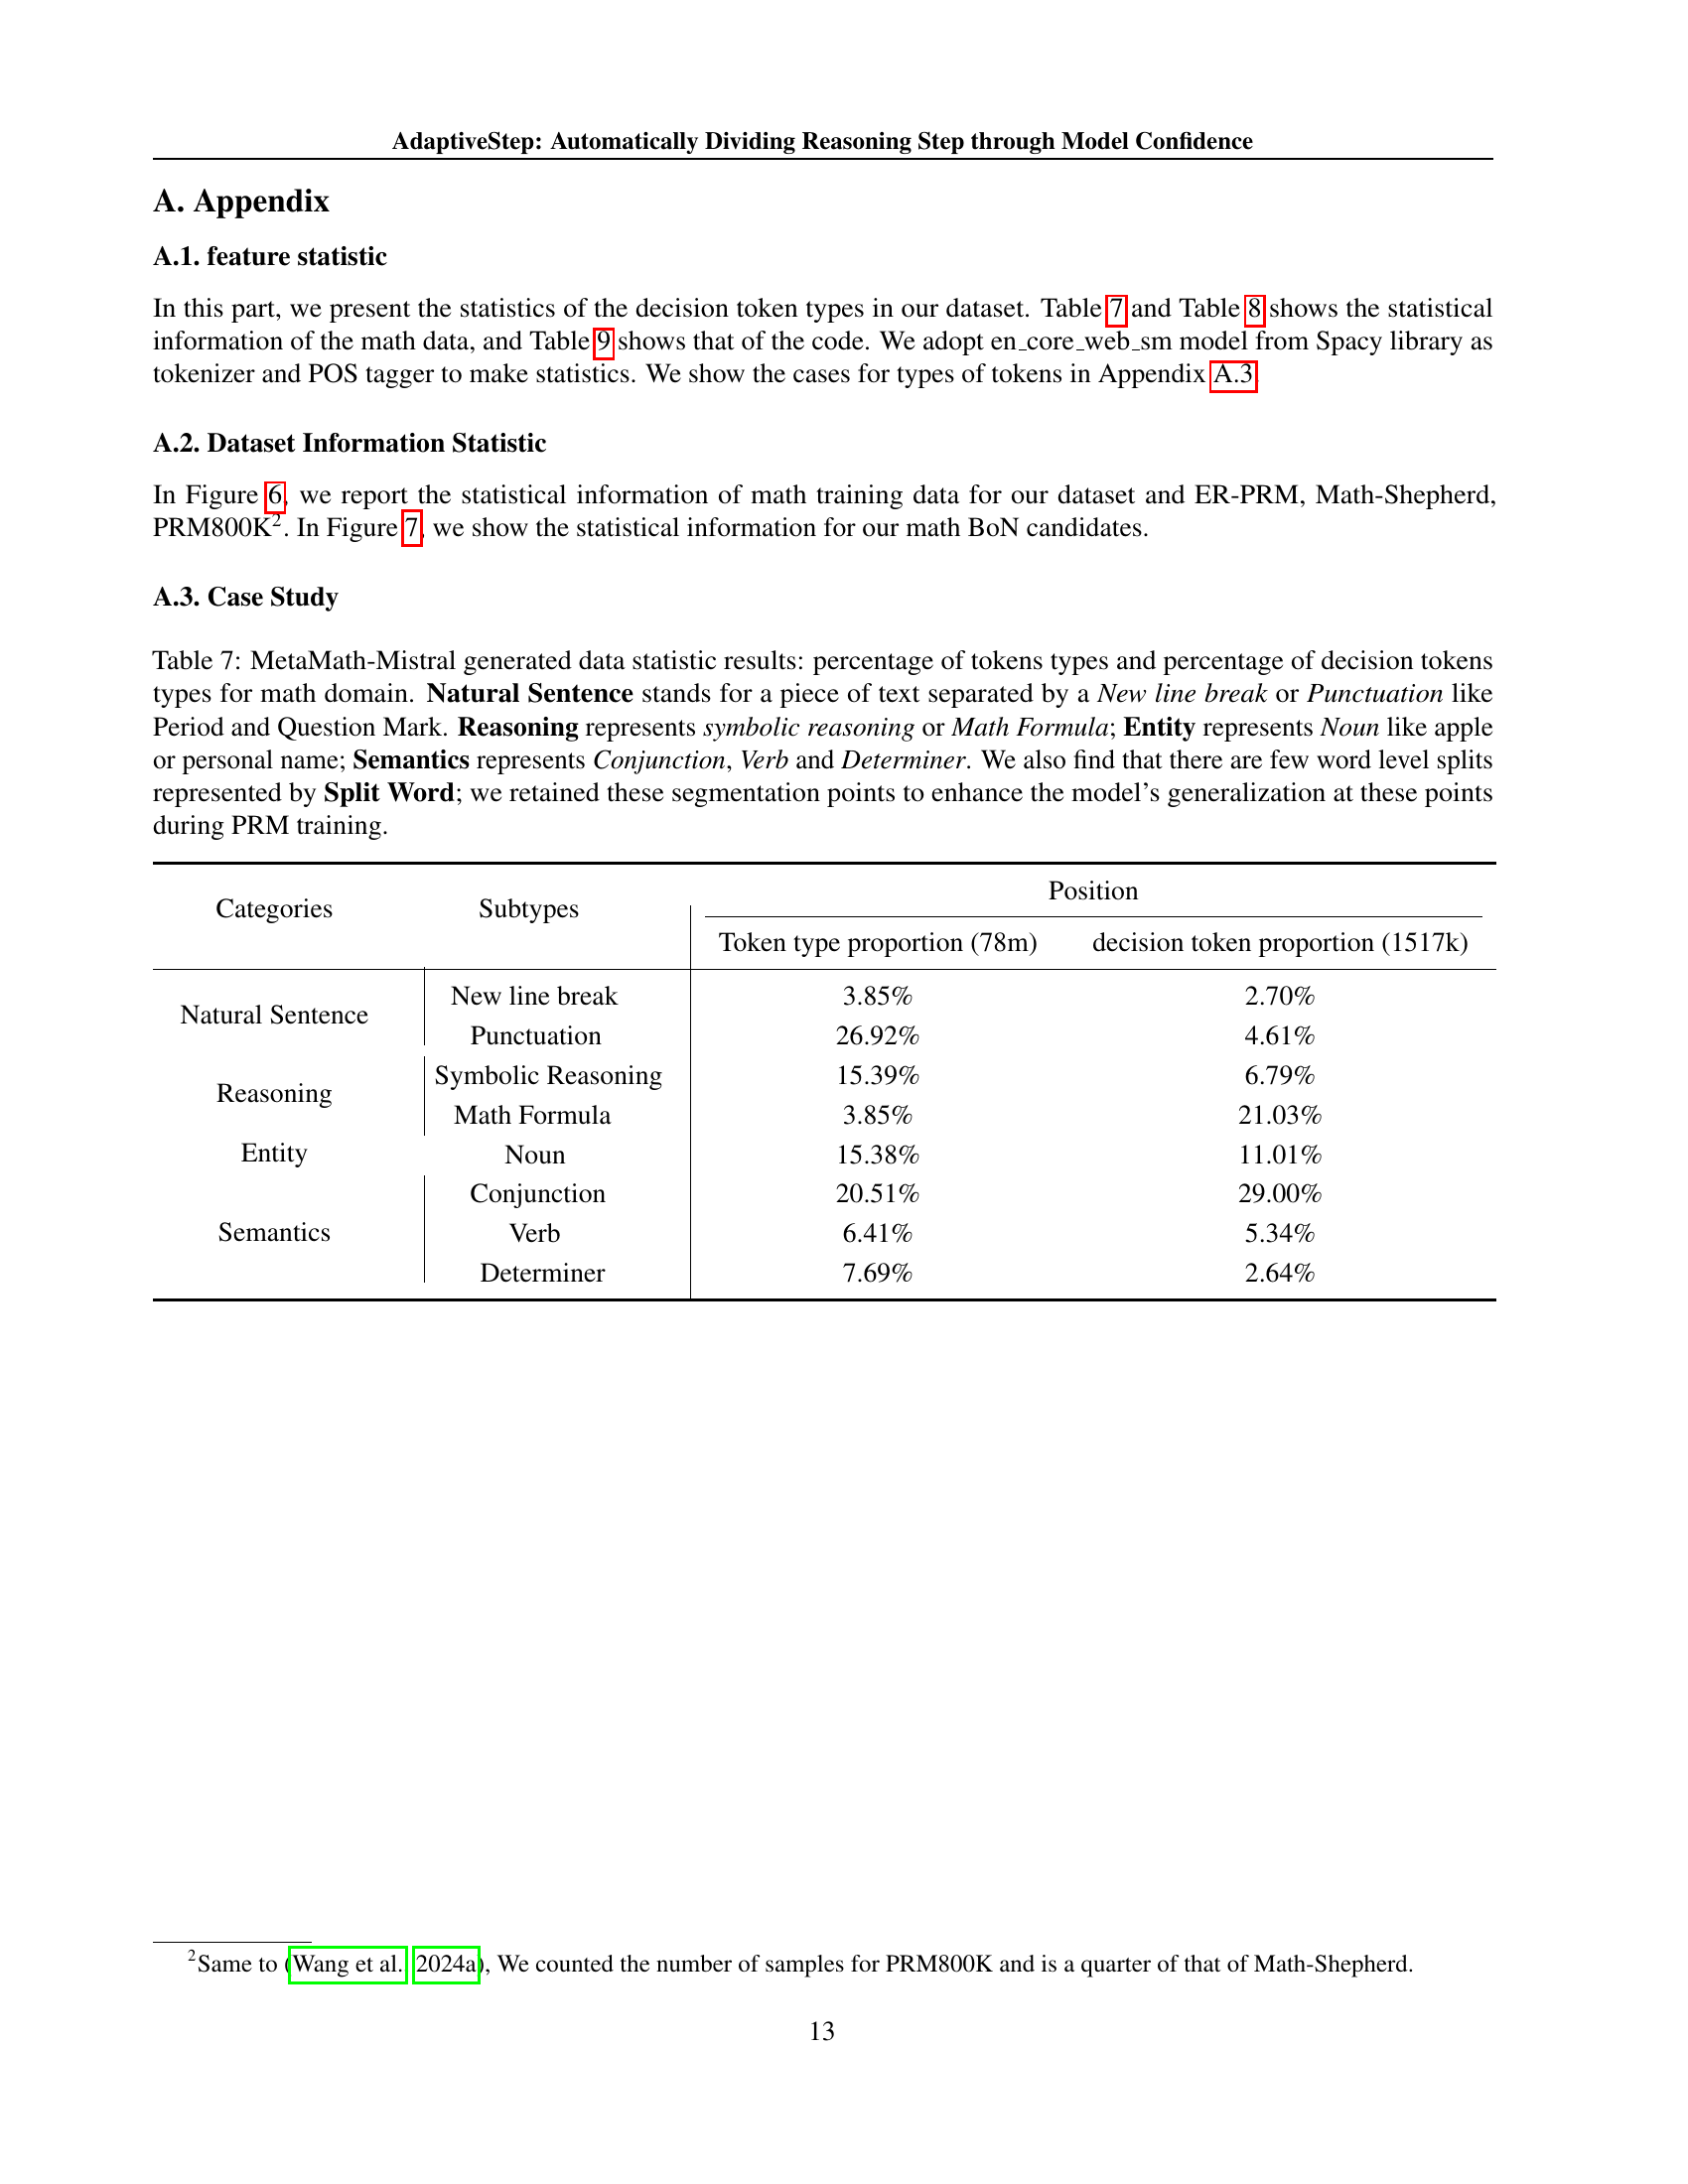
🔼 Table 7 presents a statistical analysis of token types and decision token types within the MetaMath-Mistral generated dataset for mathematical reasoning tasks. It breaks down the data into categories (Natural Sentence, Reasoning, Entity, Semantics) and subcategories (e.g., types of punctuation, math formulas, nouns, conjunctions, verbs, determiners). For each category and subcategory, the table shows the percentage of tokens belonging to that category/subcategory in the overall dataset, as well as the percentage of those tokens that are considered ‘decision tokens’ (tokens indicating a point where the model has low confidence and a new reasoning step begins). The table also notes the inclusion of a few ‘Split Word’ tokens, which represent word-level segmentation points retained to improve model generalization during PRM training.
read the caption
Table 7: MetaMath-Mistral generated data statistic results: percentage of tokens types and percentage of decision tokens types for math domain. Natural Sentence stands for a piece of text separated by a New line break or Punctuation like Period and Question Mark. Reasoning represents symbolic reasoning or Math Formula; Entity represents Noun like apple or personal name; Semantics represents Conjunction, Verb and Determiner. We also find that there are few word level splits represented by Split Word; we retained these segmentation points to enhance the model’s generalization at these points during PRM training.
| Categories | Subtypes | Position | |
|---|---|---|---|
| Token type proportion (81m) | decision token proportion (1413k) | ||
| Natural Sentence | New line break | 2.47% | 6.69% |
| Punctuation | 28.40% | 14.91% | |
| Reasoning | Symbolic Reasoning | 16.05% | 5.66% |
| Math Formula | 3.7% | 20.24% | |
| Entity | Noun | 14.82% | 7.35% |
| Semantics | Conjunction | 20.99% | 23.48% |
| Verb | 6.17% | 5.24% | |
| Determiner | 7.4% | 2.99% | |
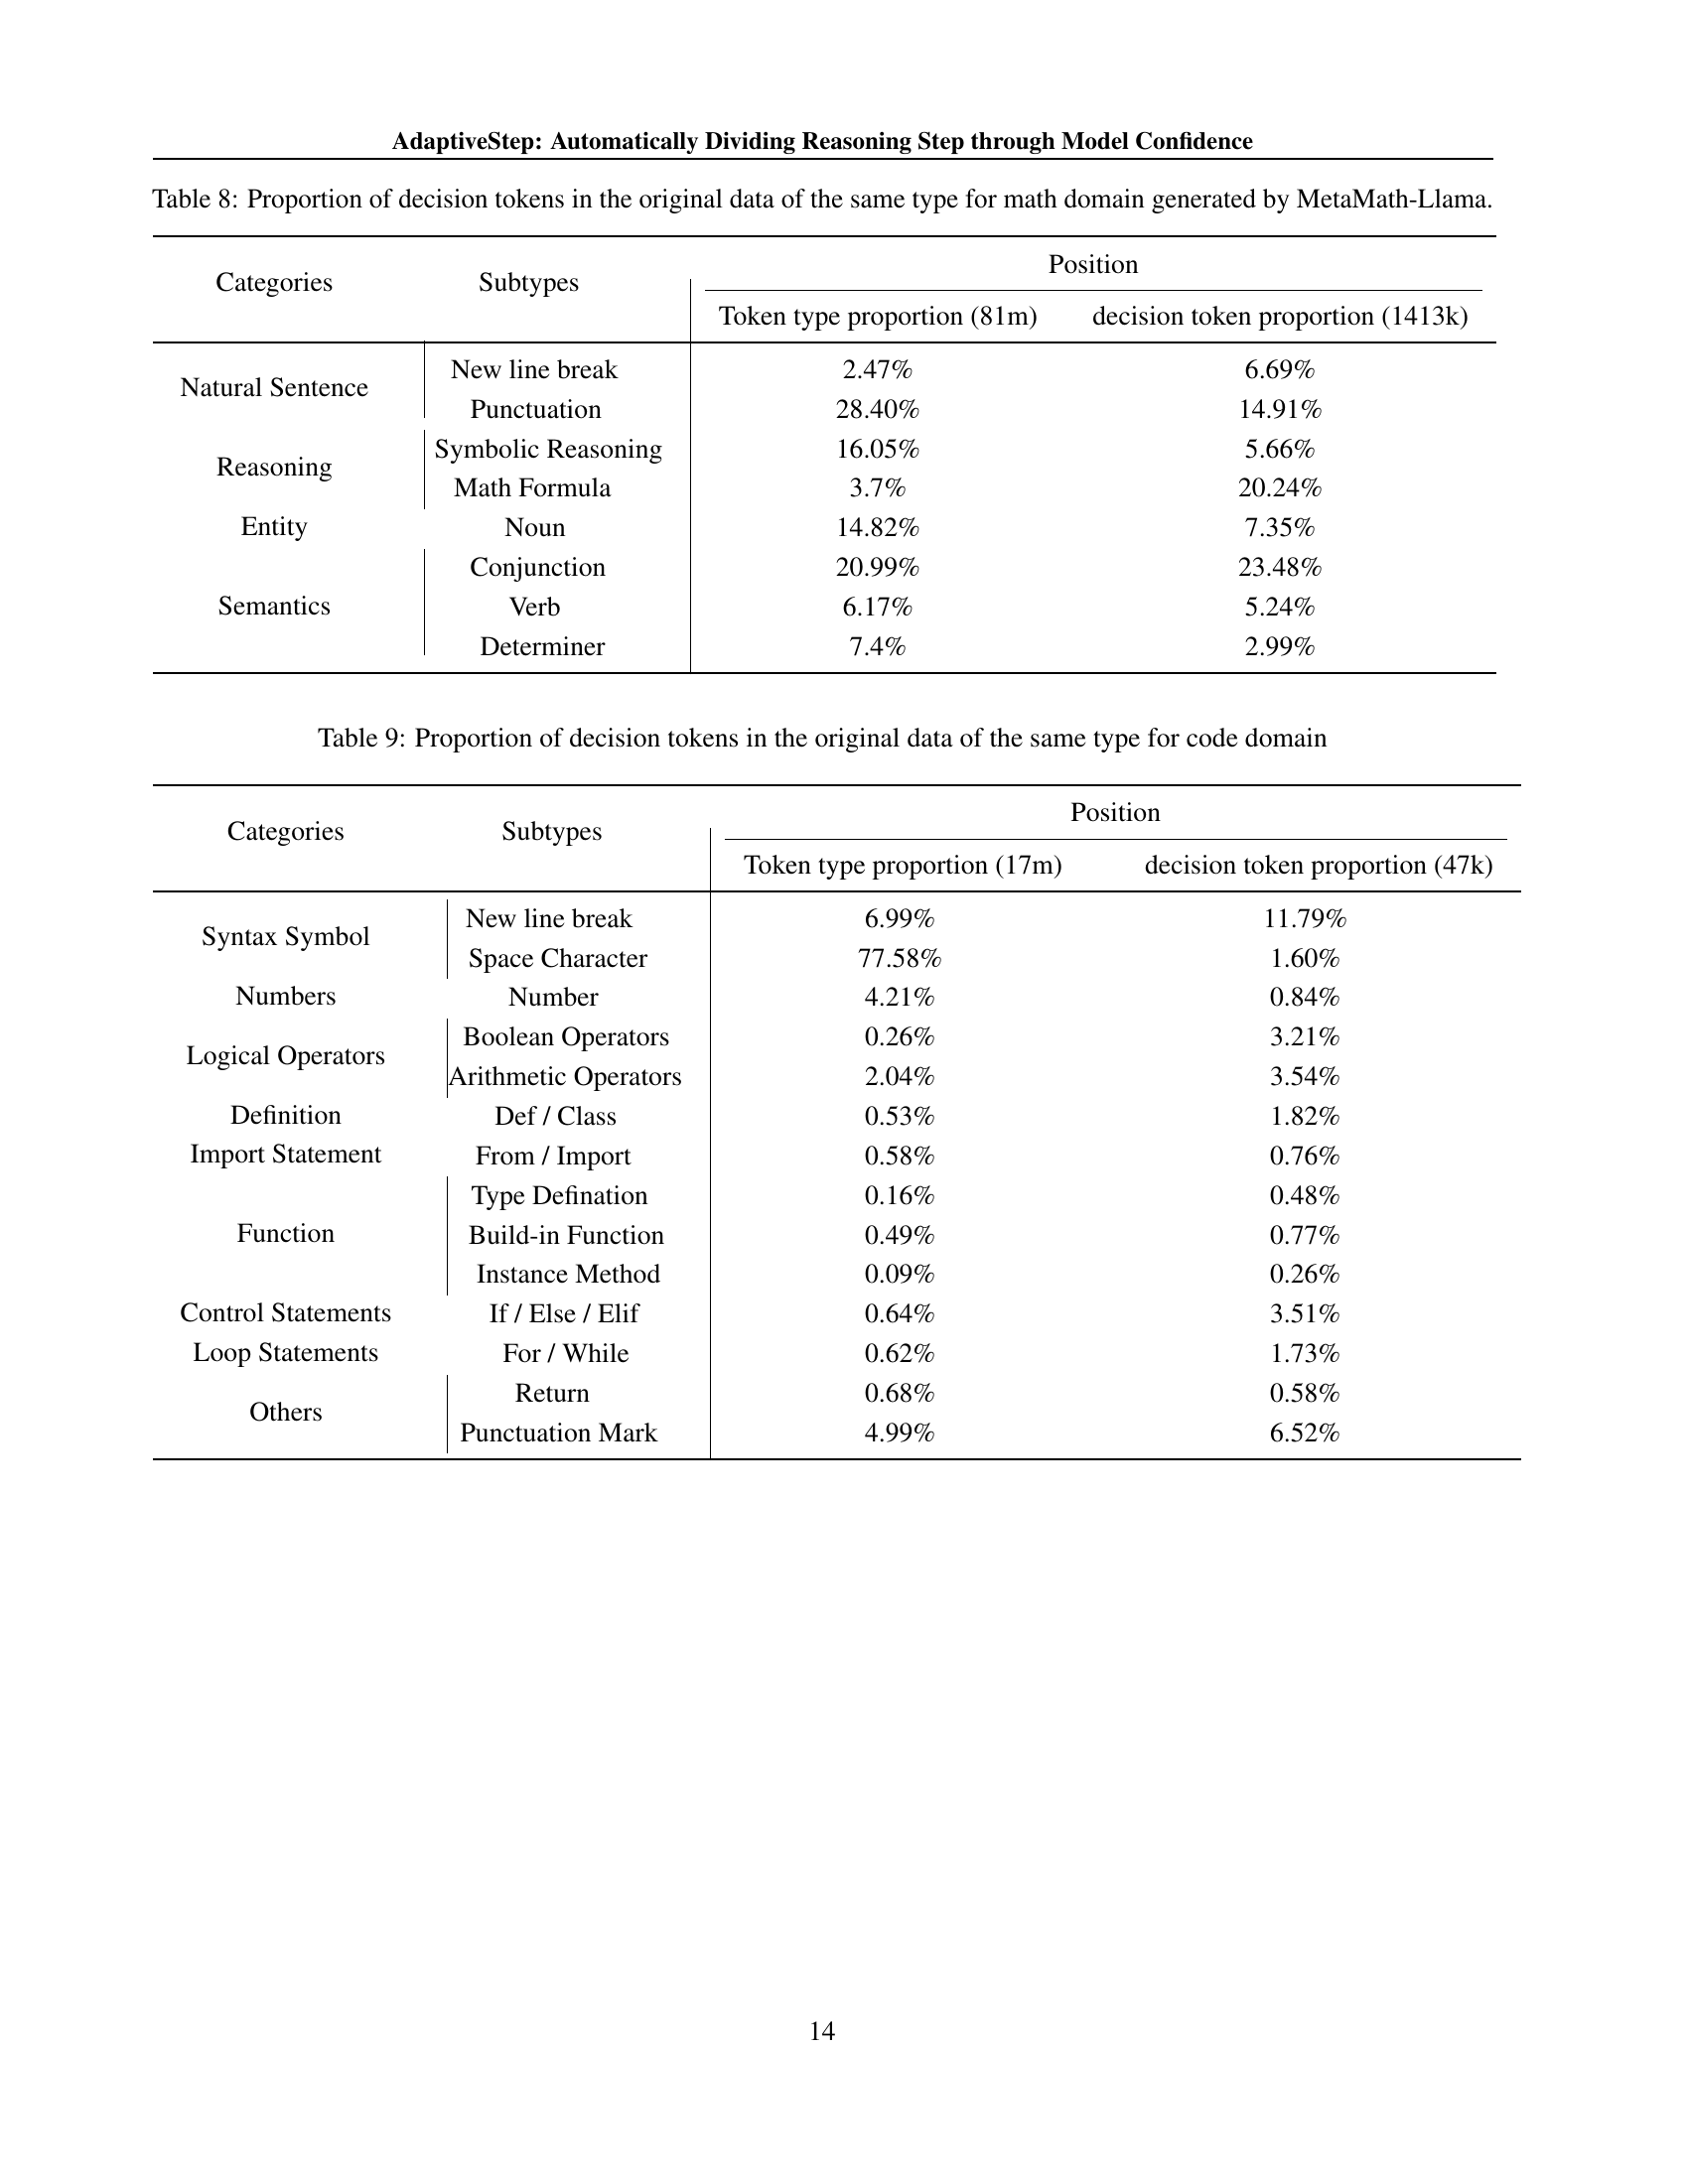
🔼 This table presents a statistical breakdown of decision tokens within mathematical reasoning data generated using the MetaMath-Llama model. It categorizes tokens into types (Natural Sentence, Reasoning, Entity, Semantics) and subtypes (e.g., New line break, Punctuation, Math Formula, Noun, Conjunction, Verb, Determiner). For each category and subcategory, the table shows the proportion of all tokens and the proportion of decision tokens among all generated tokens. Decision tokens are defined as those with low model confidence, indicating points where the model is less certain about the next token prediction.
read the caption
Table 8: Proportion of decision tokens in the original data of the same type for math domain generated by MetaMath-Llama.
| Categories | Subtypes | Position | |
|---|---|---|---|
| Token type proportion (17m) | decision token proportion (47k) | ||
| Syntax Symbol | New line break | 6.99% | 11.79% |
| Space Character | 77.58% | 1.60% | |
| Numbers | Number | 4.21% | 0.84% |
| Logical Operators | Boolean Operators | 0.26% | 3.21% |
| Arithmetic Operators | 2.04% | 3.54% | |
| Definition | Def / Class | 0.53% | 1.82% |
| Import Statement | From / Import | 0.58% | 0.76% |
| Function | Type Defination | 0.16% | 0.48% |
| Build-in Function | 0.49% | 0.77% | |
| Instance Method | 0.09% | 0.26% | |
| Control Statements | If / Else / Elif | 0.64% | 3.51% |
| Loop Statements | For / While | 0.62% | 1.73% |
| Others | Return | 0.68% | 0.58% |
| Punctuation Mark | 4.99% | 6.52% | |
🔼 This table presents a statistical analysis of the types of tokens identified as ‘decision tokens’ within the code domain data. Decision tokens are those where the model exhibits low confidence in its prediction. The table breaks down the proportion of these decision tokens across various categories of code tokens (e.g., syntax symbols, numbers, logical operators, function calls, control statements), and the sub-types within each category. This analysis reveals which types of tokens are more likely to represent critical decision points during the code generation process, offering insights into model behavior and potential areas for improvement.
read the caption
Table 9: Proportion of decision tokens in the original data of the same type for code domain
| Categories | Trigger type(234k) | Token type (17m) | Line number(1599k) |
|---|---|---|---|
| Code | 47k (19.95%) | 4m (26.15%) | 1280k(80.02%) |
| Code comment | 187k (80.05%) | 13m (73.85%) | 319k(19.98%) |
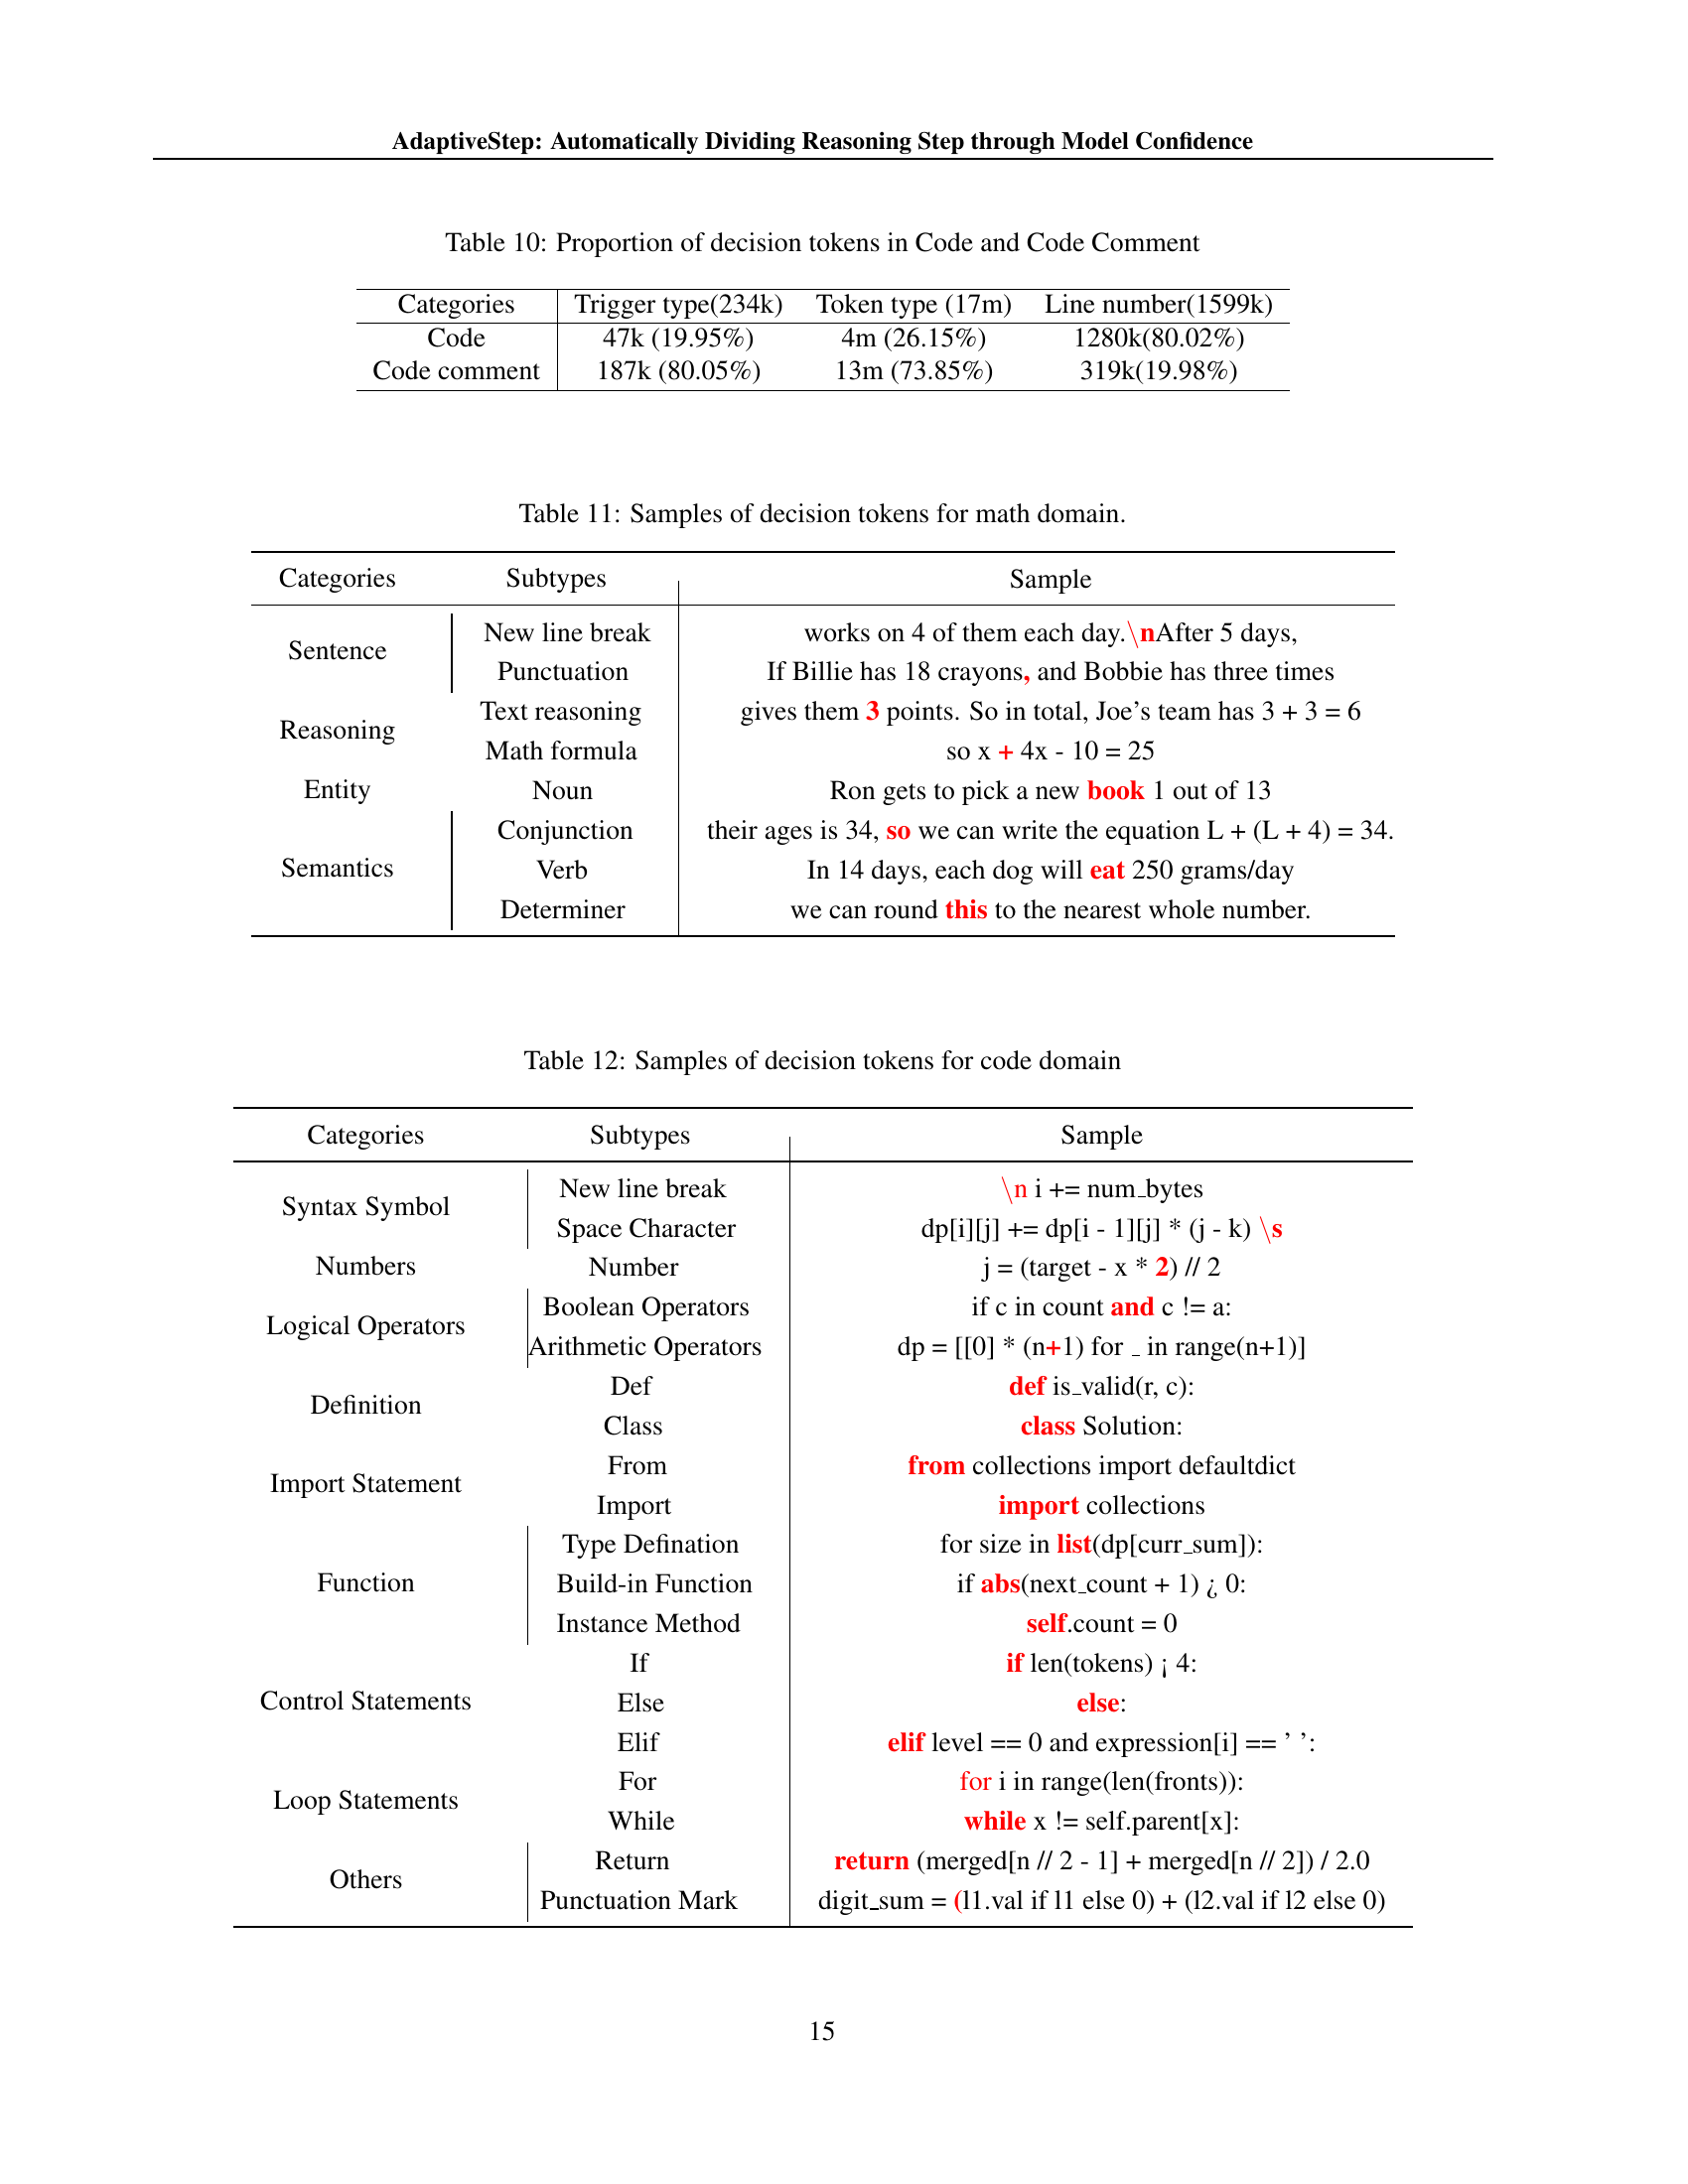
🔼 This table shows the distribution of decision tokens within code and code comments. It breaks down the proportion of decision tokens by their type (trigger, token, line number) and category (code, code comment). This helps to understand the characteristics of decision points within different parts of the code and offers insights into the nature of the reasoning process during code generation.
read the caption
Table 10: Proportion of decision tokens in Code and Code Comment
| Categories | Subtypes | Sample |
|---|---|---|
| Sentence | New line break | works on 4 of them each day.\nAfter 5 days, |
| Punctuation | If Billie has 18 crayons, and Bobbie has three times | |
| Reasoning | Text reasoning | gives them 3 points. So in total, Joe’s team has 3 + 3 = 6 |
| Math formula | so x + 4x - 10 = 25 | |
| Entity | Noun | Ron gets to pick a new book 1 out of 13 |
| Semantics | Conjunction | their ages is 34, so we can write the equation L + (L + 4) = 34. |
| Verb | In 14 days, each dog will eat 250 grams/day | |
| Determiner | we can round this to the nearest whole number. |
🔼 This table provides examples of decision tokens identified by the AdaptiveStep method in mathematical reasoning tasks. Decision tokens represent points in the reasoning process where the model exhibits low confidence in predicting the next word, indicating a potential break between reasoning steps. The table shows different categories of tokens (such as natural sentences, reasoning steps, entities, and semantics), sub-types of tokens within those categories, and illustrative examples of how these tokens appear in the context of a mathematical reasoning problem.
read the caption
Table 11: Samples of decision tokens for math domain.
| Categories | Subtypes | Sample |
| Syntax Symbol | New line break | \n i += num_bytes |
| Space Character | dp[i][j] += dp[i - 1][j] * (j - k) \s | |
| Numbers | Number | j = (target - x * 2) // 2 |
| Logical Operators | Boolean Operators | if c in count and c != a: |
| Arithmetic Operators | dp = [[0] * (n+1) for _ in range(n+1)] | |
| Definition | Def | def is_valid(r, c): |
| Class | class Solution: | |
| Import Statement | From | from collections import defaultdict |
| Import | import collections | |
| Function | Type Defination | for size in list(dp[curr_sum]): |
| Build-in Function | if abs(next_count + 1) ¿ 0: | |
| Instance Method | self.count = 0 | |
| Control Statements | If | if len(tokens) ¡ 4: |
| Else | else: | |
| Elif | elif level == 0 and expression[i] == ’ ’: | |
| Loop Statements | For | for i in range(len(fronts)): |
| While | while x != self.parent[x]: | |
| Others | Return | return (merged[n // 2 - 1] + merged[n // 2]) / 2.0 |
| Punctuation Mark | digit_sum = (l1.val if l1 else 0) + (l2.val if l2 else 0) |
🔼 This table provides examples of decision tokens identified by the AdaptiveStep method in the code generation domain. Decision tokens represent points in the code where the model exhibits low confidence when generating the next token. The table is categorized by syntactic elements (e.g., numbers, operators, control statements) to illustrate where AdaptiveStep tends to identify these critical breakpoints in the code generation process.
read the caption
Table 12: Samples of decision tokens for code domain
Full paper#