TL;DR#
Large language models (LLMs) have shown great performance in reasoning tasks, and increasing compute during testing can further improve accuracy. However, typical evaluations assume the system always answers, neglecting confidence and real-world scenarios where incorrect answers have costs. This paper addresses whether a model is confident in its answer and whether it is appropriate to always provide a response.
This paper introduces confidence scores for selective question answering, enabling models to abstain when uncertain. They find that increased compute not only improves accuracy but also confidence in correct answers. By evaluating models with varying response risks, the authors show the benefits of confidence-aware test-time scaling. The paper suggests reporting evaluations under these settings.
Key Takeaways#
Why does it matter?#
This paper is important for researchers because it addresses the limitations of existing test-time scaling evaluations by considering confidence in model responses. It introduces a method for evaluating models in settings with non-zero response risk, offering a more realistic assessment of performance. This opens new avenues for investigating confidence-aware question answering and its applications in practical scenarios.
Visual Insights#

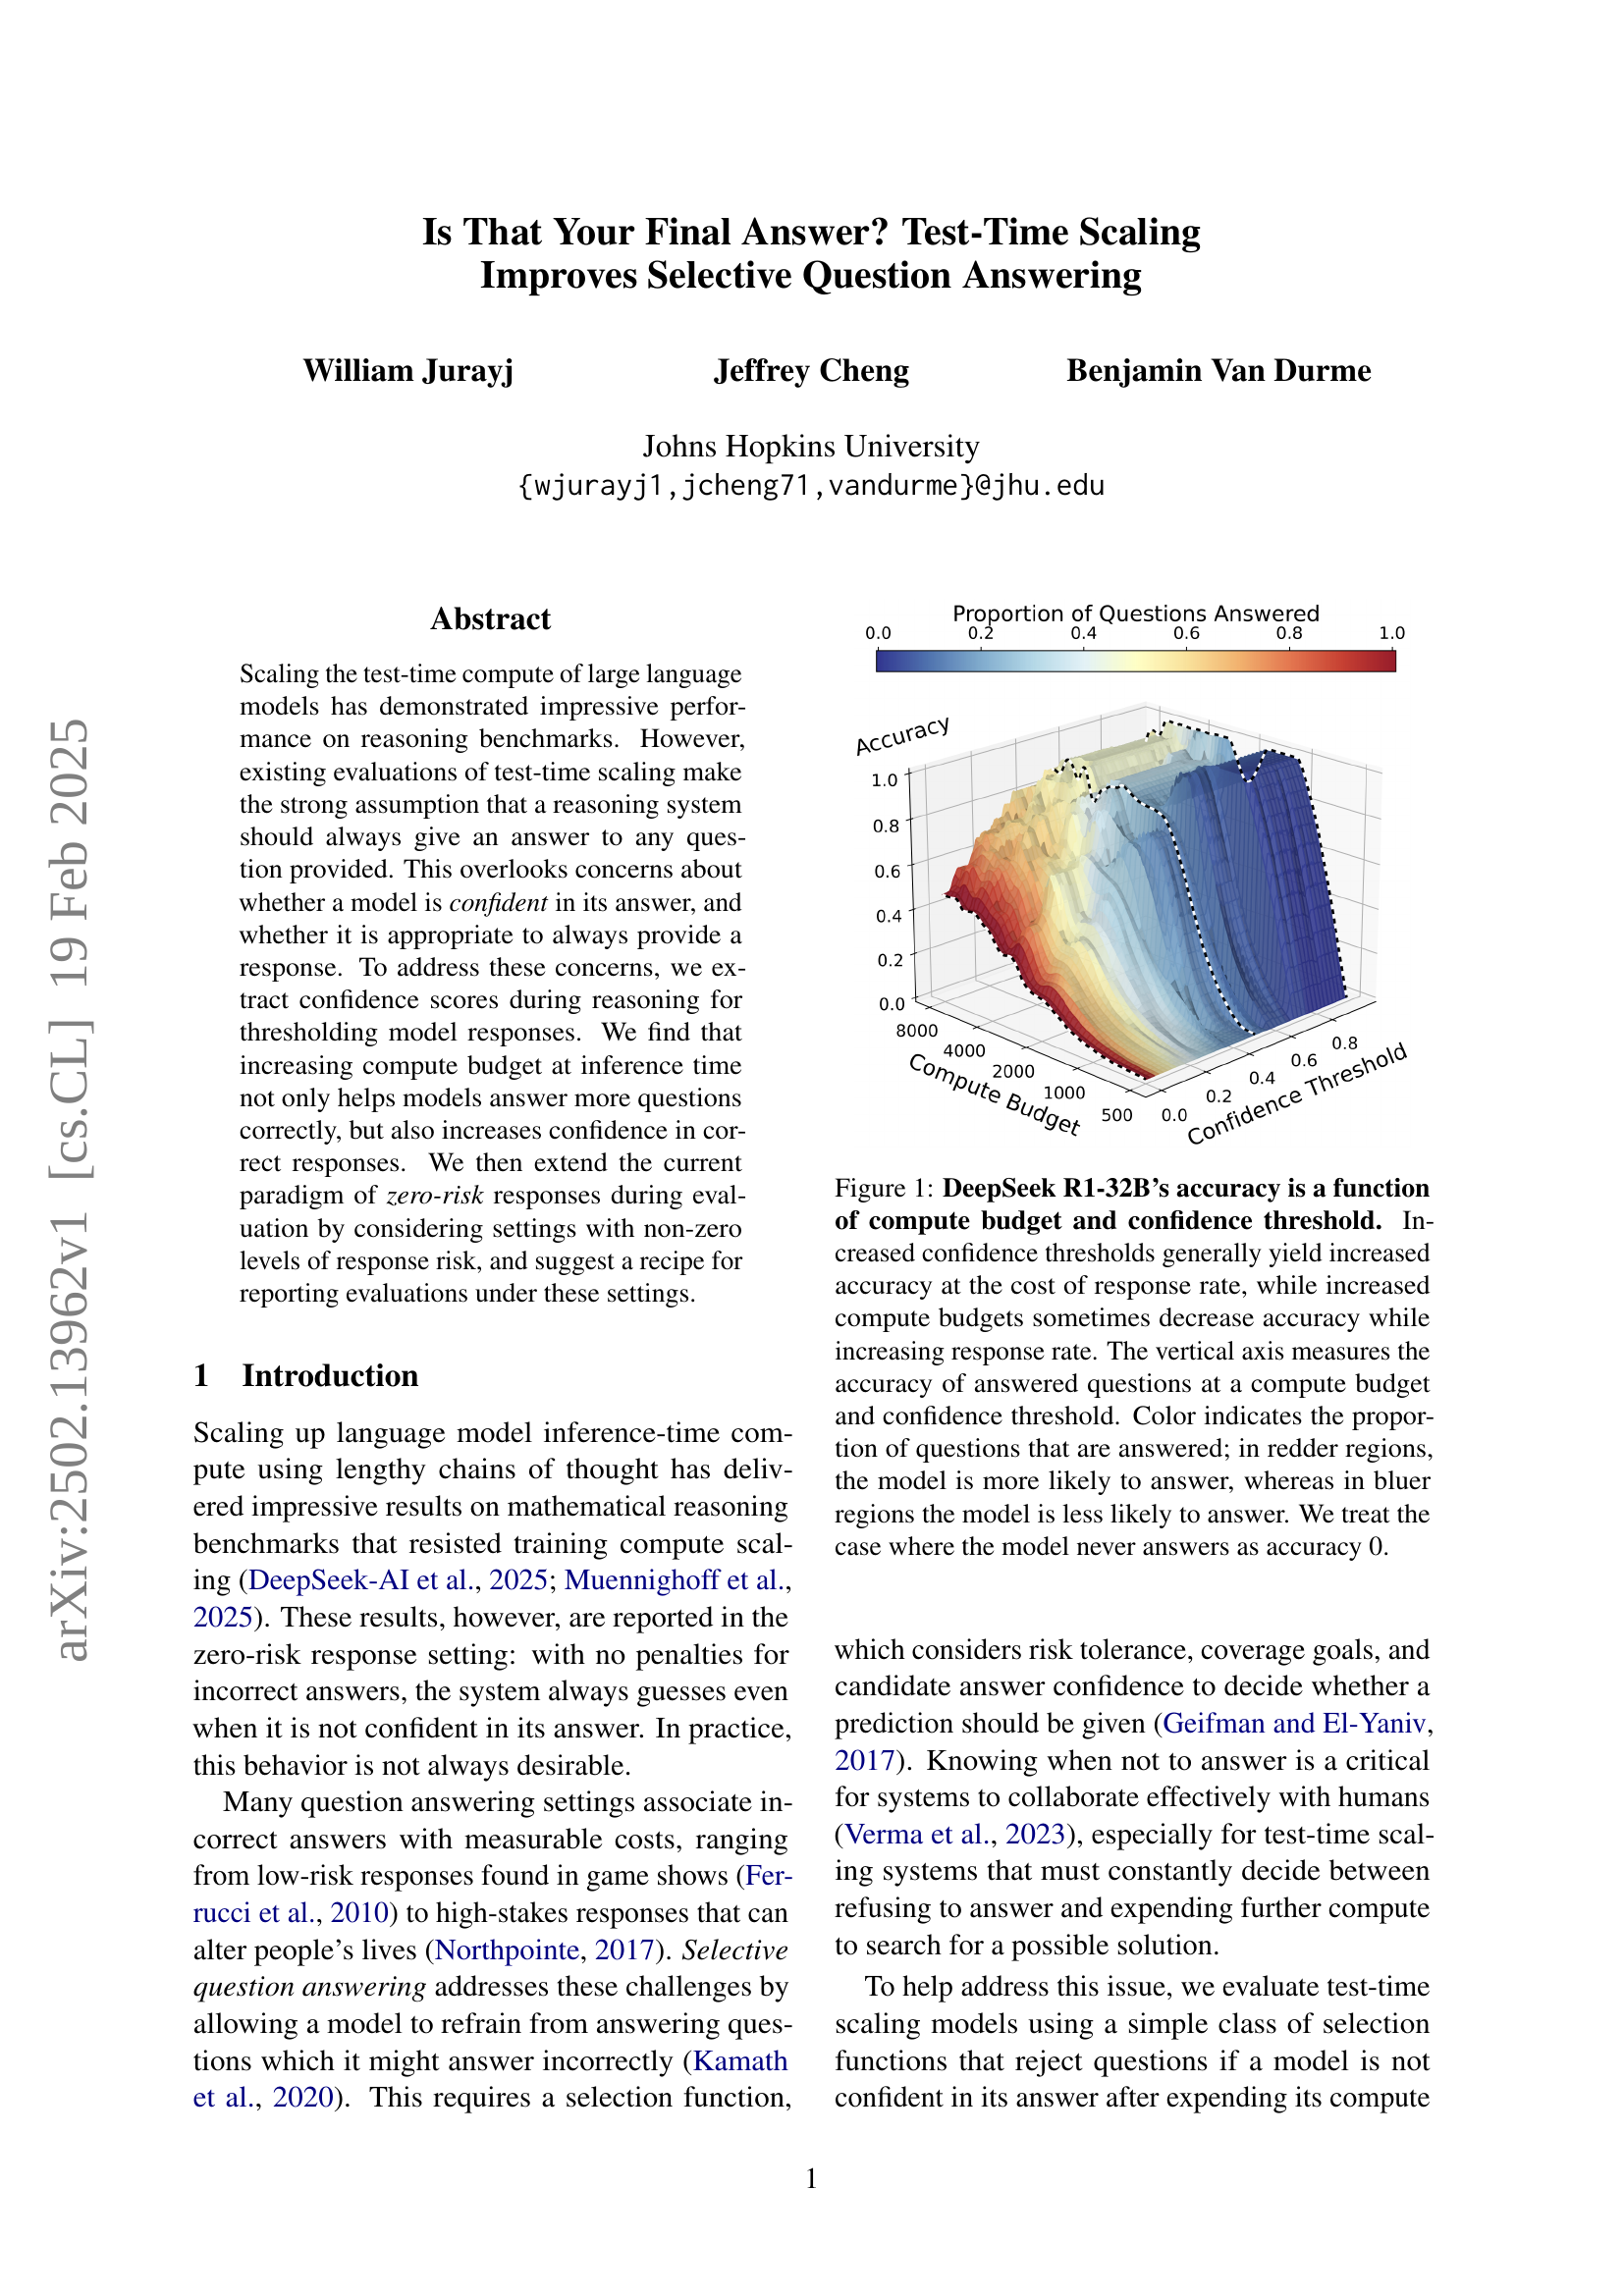
🔼 This figure shows the relationship between a language model’s accuracy, compute budget, and confidence threshold. The x-axis represents the compute budget (the amount of computational resources used), and the y-axis shows the accuracy of the model’s answers. The z-axis (the third dimension) represents the confidence threshold (how certain the model needs to be before providing an answer). The color of each point on the 3D surface represents the proportion of questions answered at that budget and threshold: redder colors indicate a higher proportion of questions answered, while bluer colors indicate a lower proportion. The figure demonstrates a complex interplay: Higher confidence thresholds generally improve accuracy but reduce the number of questions answered, and increasing compute budget can sometimes increase the number of answers but not always improve accuracy.
read the caption
Figure 1: DeepSeek R1-32B’s accuracy is a function of compute budget and confidence threshold. Increased confidence thresholds generally yield increased accuracy at the cost of response rate, while increased compute budgets sometimes decrease accuracy while increasing response rate. The vertical axis measures the accuracy of answered questions at a compute budget and confidence threshold. Color indicates the proportion of questions that are answered; in redder regions, the model is more likely to answer, whereas in bluer regions the model is less likely to answer. We treat the case where the model never answers as accuracy 0.
In-depth insights#
Test-Time Scaling#
Test-time scaling refers to techniques that increase the computational budget at inference. This strategy has shown promise in enhancing the performance of large language models (LLMs) on reasoning tasks. It typically involves extending the reasoning process, allowing the model to explore more possibilities and refine its answers. However, the success depends on effectively managing the increased compute to ensure that it translates into more accurate and reliable responses. The current evaluations of test-time scaling often assume that the model should always provide an answer, overlooking scenarios where abstaining might be more beneficial, especially when the model’s confidence is low. Selective question answering, which allows models to abstain from answering when uncertain, can address this limitation. By incorporating confidence measures and considering the risk associated with incorrect answers, we can develop more robust and practical systems that leverage test-time scaling effectively. This approach aligns better with real-world applications where incorrect responses can have significant consequences, making the ability to defer or seek human expertise a valuable asset.
Jeopardy Eval#
While the provided text doesn’t explicitly contain a section labeled ‘Jeopardy Eval’, the paper’s discussion of Jeopardy Odds is highly relevant. It highlights a crucial point: conventional evaluation metrics like accuracy are insufficient when models can abstain from answering. In a ‘Jeopardy’ setting, where incorrect answers incur penalties equal to the reward for correct ones, simply maximizing accuracy leads to suboptimal behavior. The key insight is that test-time compute can improve confidence, and this improved confidence is valuable for making informed decisions about when to answer and when to abstain. Specifically, the paper demonstrates that by using a confidence threshold and scaling compute, models can achieve higher utility in the Jeopardy setting compared to always answering, highlighting the value of selective question answering. Future research needs to focus on efficient allocation of compute to meet confidence demands, so that the optimal amount of compute can be allocated at test time.
Confidence Scaling#
Confidence scaling in language models is crucial for reliable decision-making, especially in selective question answering. As models scale with test-time compute, their confidence in correct answers increases, presenting an opportunity to abstain from answering when unsure, reducing the risk of incorrect responses. Existing evaluations often overlook the impact of confidence, assuming a model should always provide an answer. Evaluating performance under different utility functions (Exam Odds, Jeopardy Odds, High-Stakes Odds) reveals how scaling affects accuracy and decision-making under varying risk levels. Test-time scaling can help models differentiate between correct and incorrect answers, improving overall performance by allowing abstention. The optimal utility is achieved at high confidence thresholds, which is influenced by the compute budget. A confidence scaling-aware approach encourages the development of more reliable and trustworthy question answering systems.
Utility Functions#
The utility function’s core goal is to capture the trade-off between accuracy and abstention, going beyond simple accuracy metrics that are trivially maximized by always guessing. It introduces a cost for incorrect answers and a reward for correct ones. The paper further discusses three specific scenarios: Exam Odds (no cost for wrong answers), Jeopardy Odds (cost of incorrect is equal to the reward for correct), and High-Stakes Odds (where incorrect costs outweigh correct rewards). The Jeopardy setting is crucial as it clearly highlights the value of abstaining, showcasing how scaling can improve decisions in real-world scenarios. The utility functions presented, while simplified, offer a valuable lens through which to evaluate model performance in settings where avoiding errors is as important as providing correct answers. It moves beyond traditional evaluations to emphasize practical decision-making and the ability to gauge confidence.
Refusal Choice#
Refusal choice is critical in question answering, especially when incorrect answers have costs. Selective QA addresses this, allowing models to abstain if uncertain. This contrasts with zero-risk settings where answers are always given, overlooking confidence. Balancing accuracy and abstention is key, avoiding trivial optimization by infrequent answering. Utility functions, like in Jeopardy, weigh correct answers against penalties for incorrect ones, incentivizing refusal. Test-time scaling can improve confidence, aiding refusal decisions. Models benefit from scaling since it improves confidence. Confidence thresholds can trigger abstention. Furthermore, test-time scaling helps models identify when to refrain from answering, improving overall utility, particularly when wrong answers are costly, reflecting real-world scenarios where abstaining is preferable to providing incorrect information.
More visual insights#
More on figures

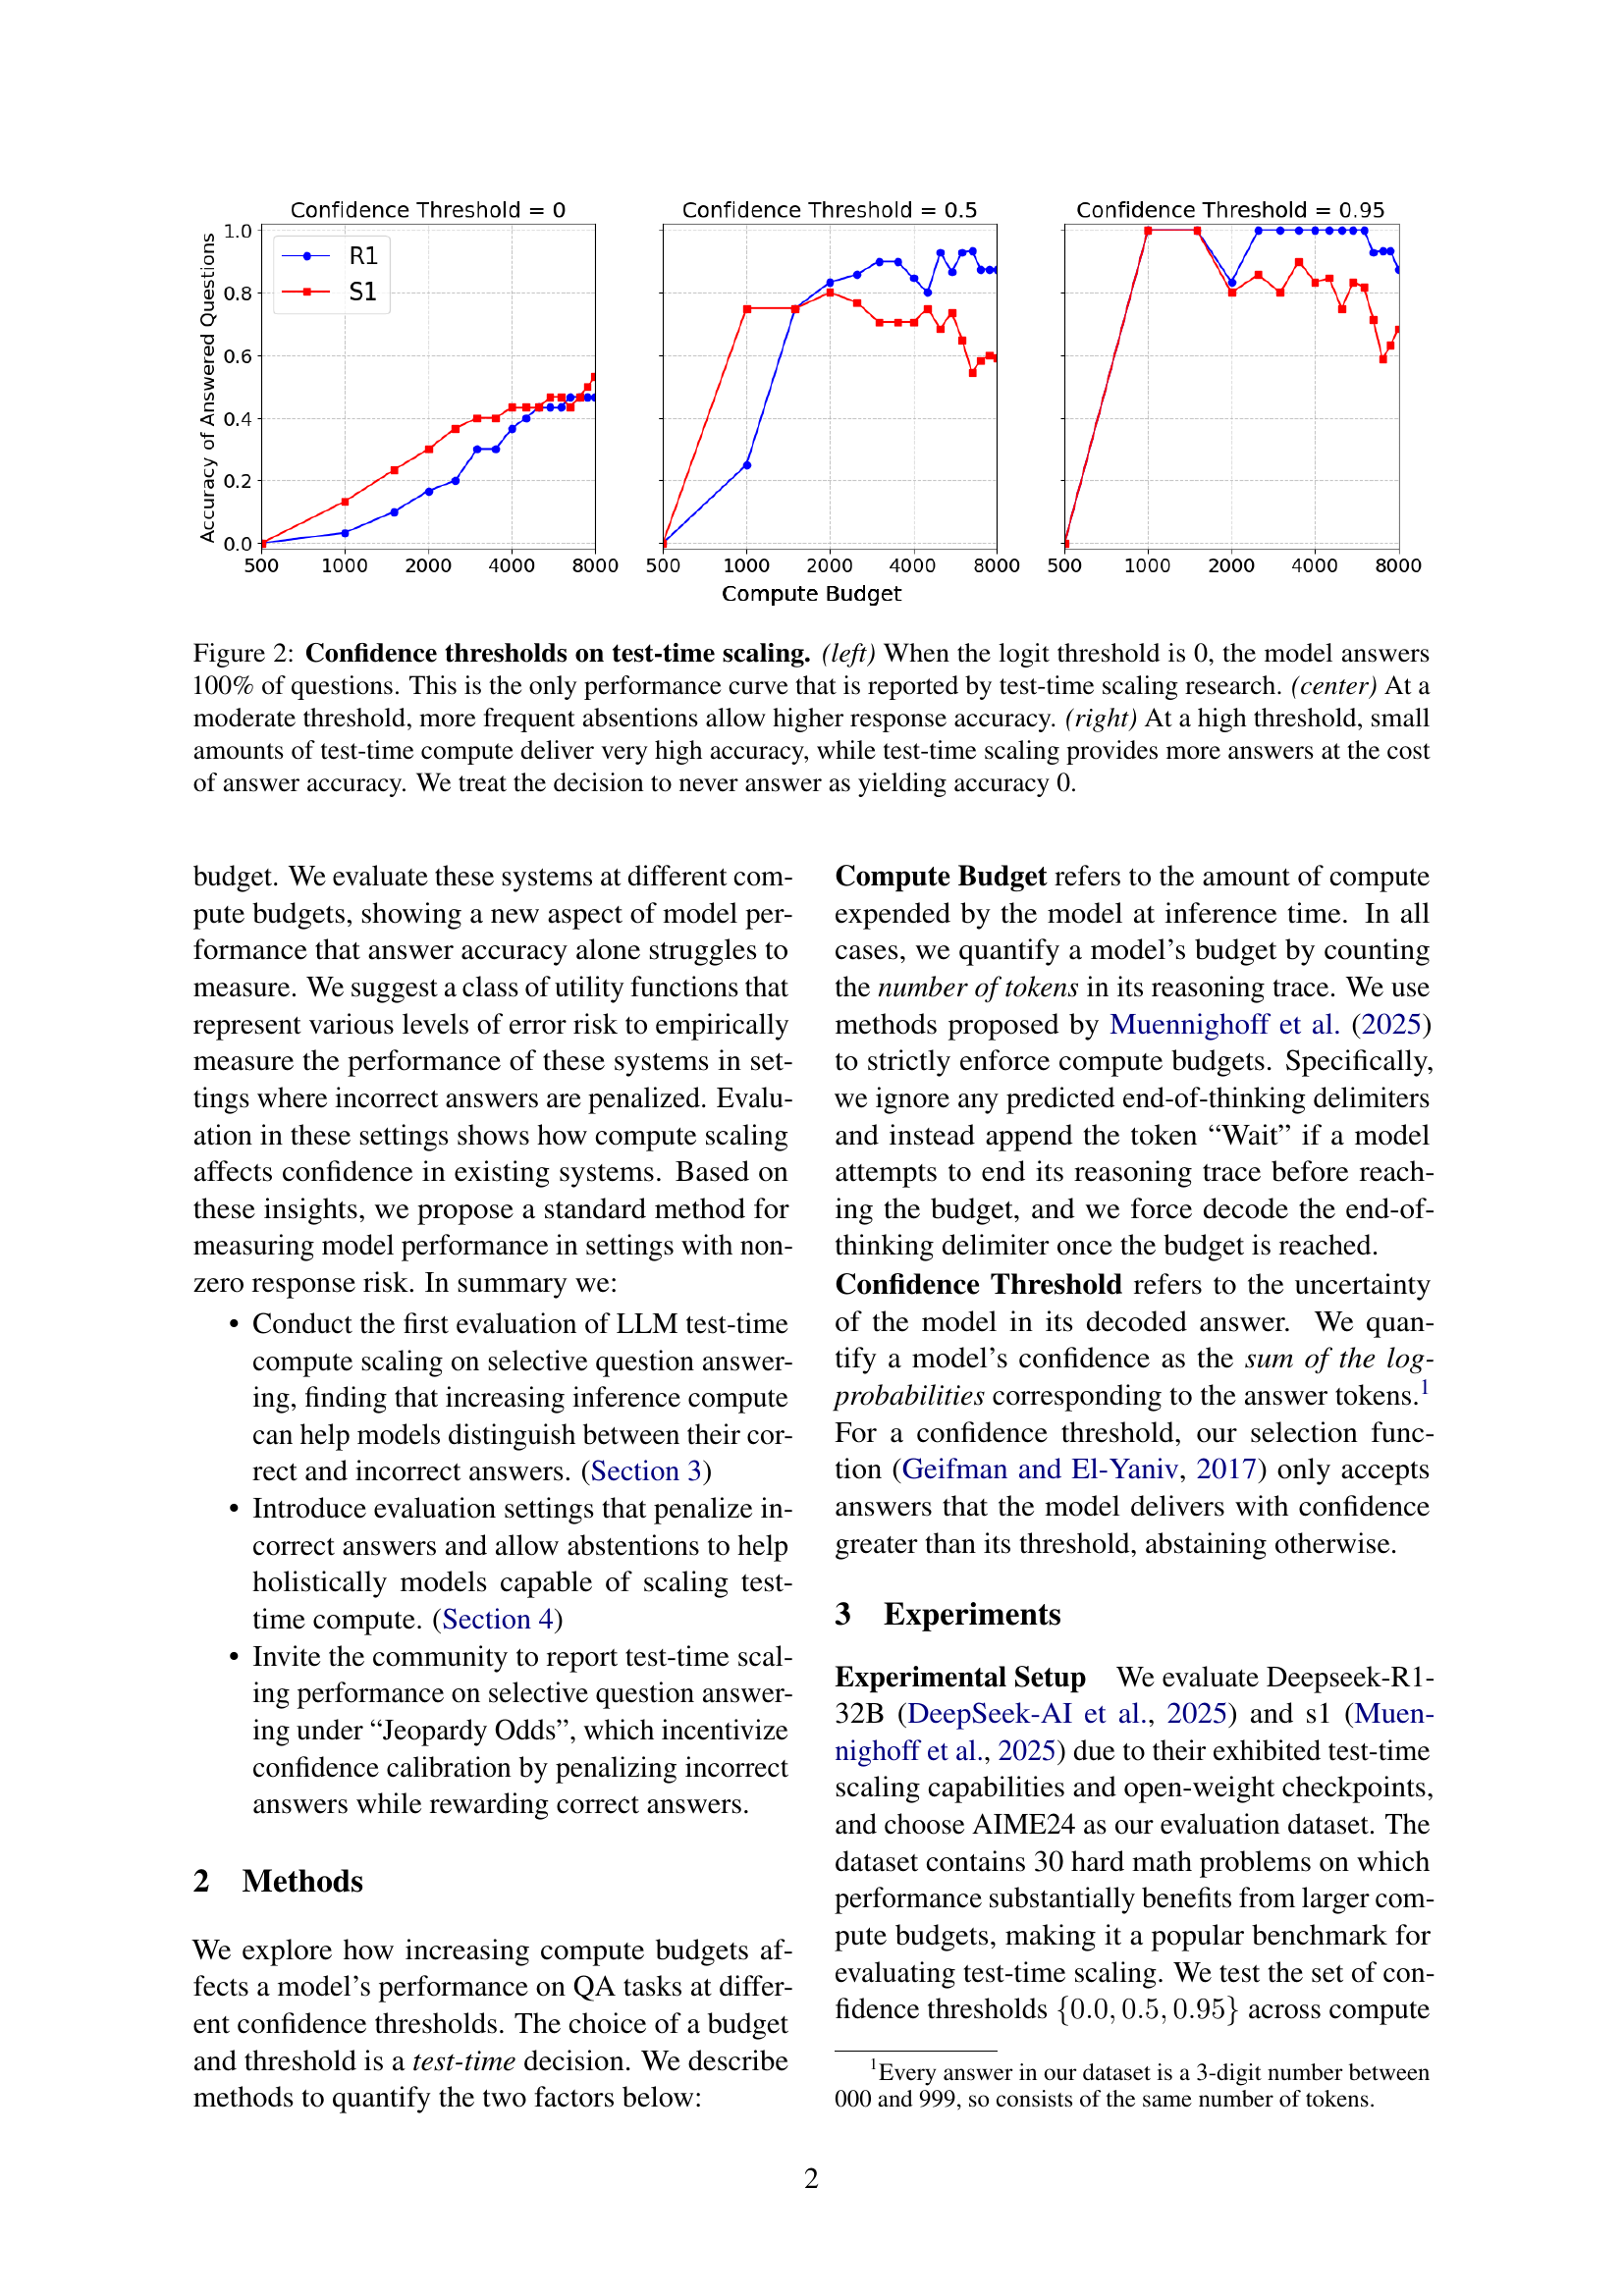
🔼 This figure displays the effects of confidence thresholds on the accuracy of test-time scaling. The left panel shows the standard test-time scaling performance where the model always answers (threshold = 0), demonstrating increased accuracy with increased compute budget. The center panel shows the effect of a moderate confidence threshold (0.5), resulting in fewer answers but higher accuracy. The right panel illustrates the effect of a high confidence threshold (0.95), where even with minimal compute, high accuracy is achieved, though fewer questions are answered in total. The key takeaway is that a higher confidence threshold improves accuracy but at the cost of answering fewer questions. A decision not to answer is considered an accuracy of 0.
read the caption
Figure 2: Confidence thresholds on test-time scaling. (left) When the logit threshold is 0, the model answers 100% of questions. This is the only performance curve that is reported by test-time scaling research. (center) At a moderate threshold, more frequent absentions allow higher response accuracy. (right) At a high threshold, small amounts of test-time compute deliver very high accuracy, while test-time scaling provides more answers at the cost of answer accuracy. We treat the decision to never answer as yielding accuracy 0.

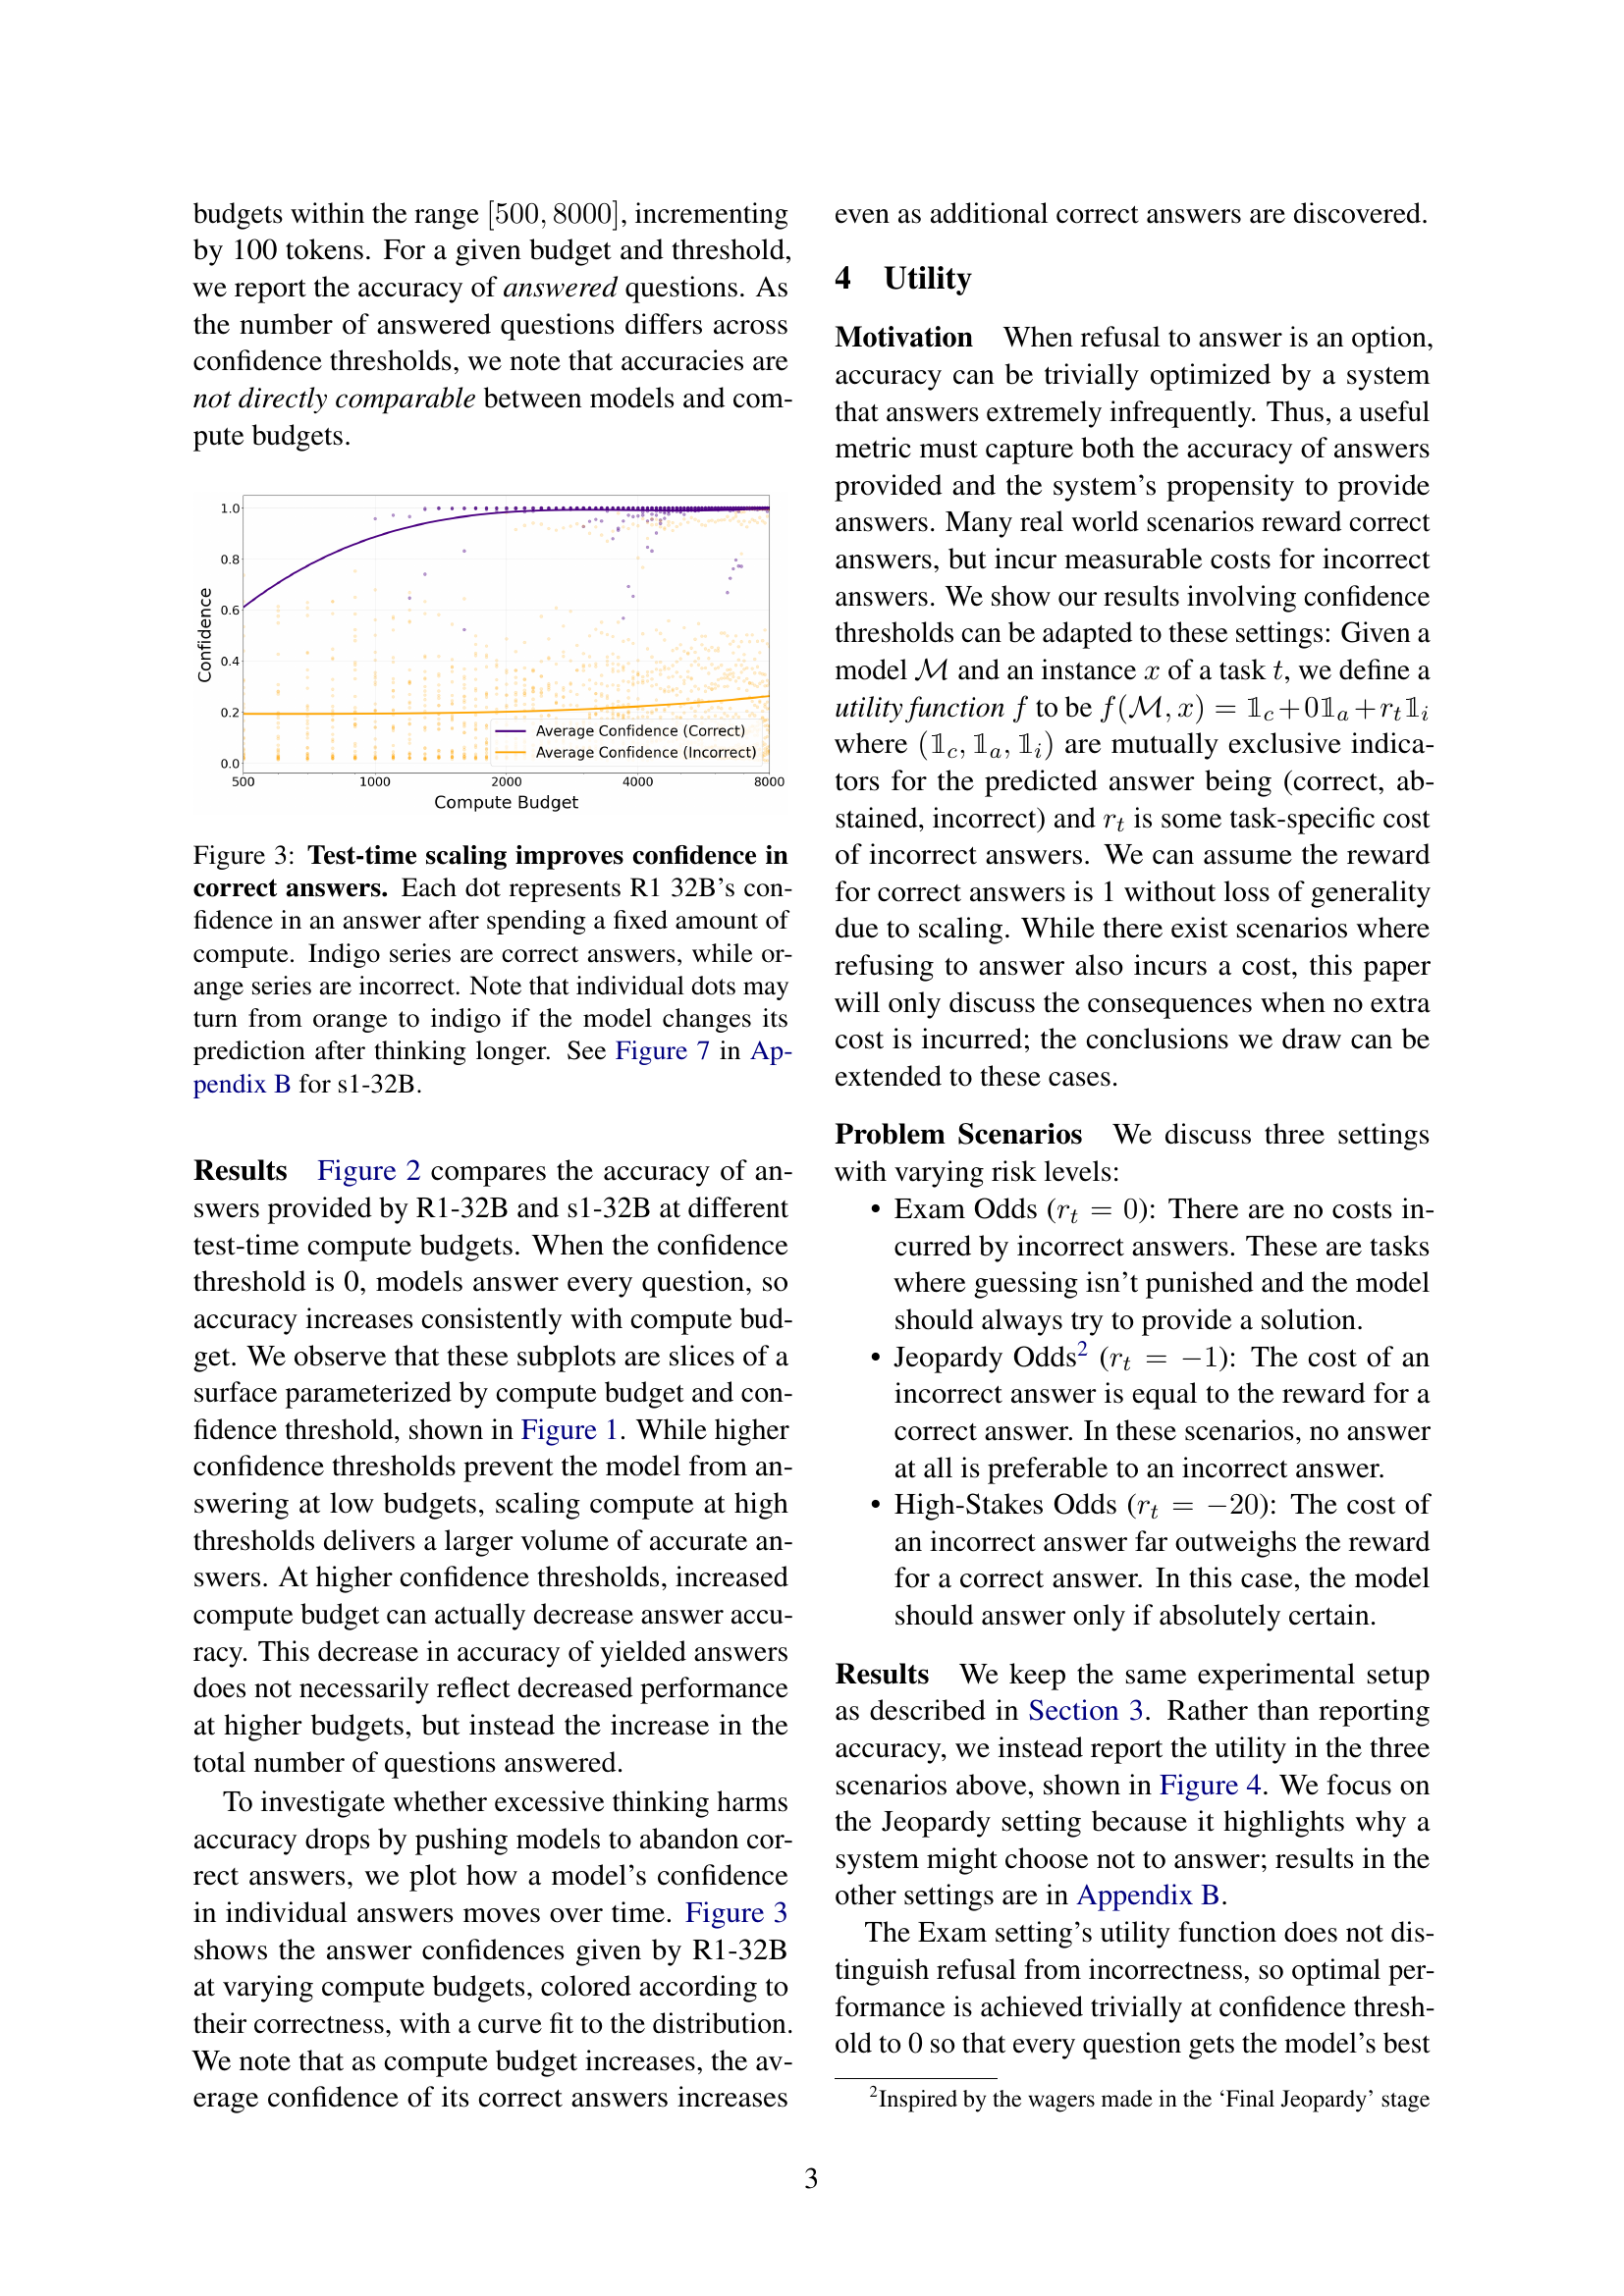
🔼 This figure visualizes how test-time scaling affects the confidence of a large language model (LLM) in its answers. Each point represents the LLM’s confidence in a single answer after a specific amount of computation. Correct answers are shown in indigo, and incorrect answers are shown in orange. Importantly, the same answer might be represented by both an orange and indigo dot depending on whether the final answer is correct or incorrect after additional computation, illustrating how more computation may improve the correctness of answers.
read the caption
Figure 3: Test-time scaling improves confidence in correct answers. Each dot represents R1 32B’s confidence in an answer after spending a fixed amount of compute. Indigo series are correct answers, while orange series are incorrect. Note that individual dots may turn from orange to indigo if the model changes its prediction after thinking longer. See Figure 7 in Appendix B for s1-32B.

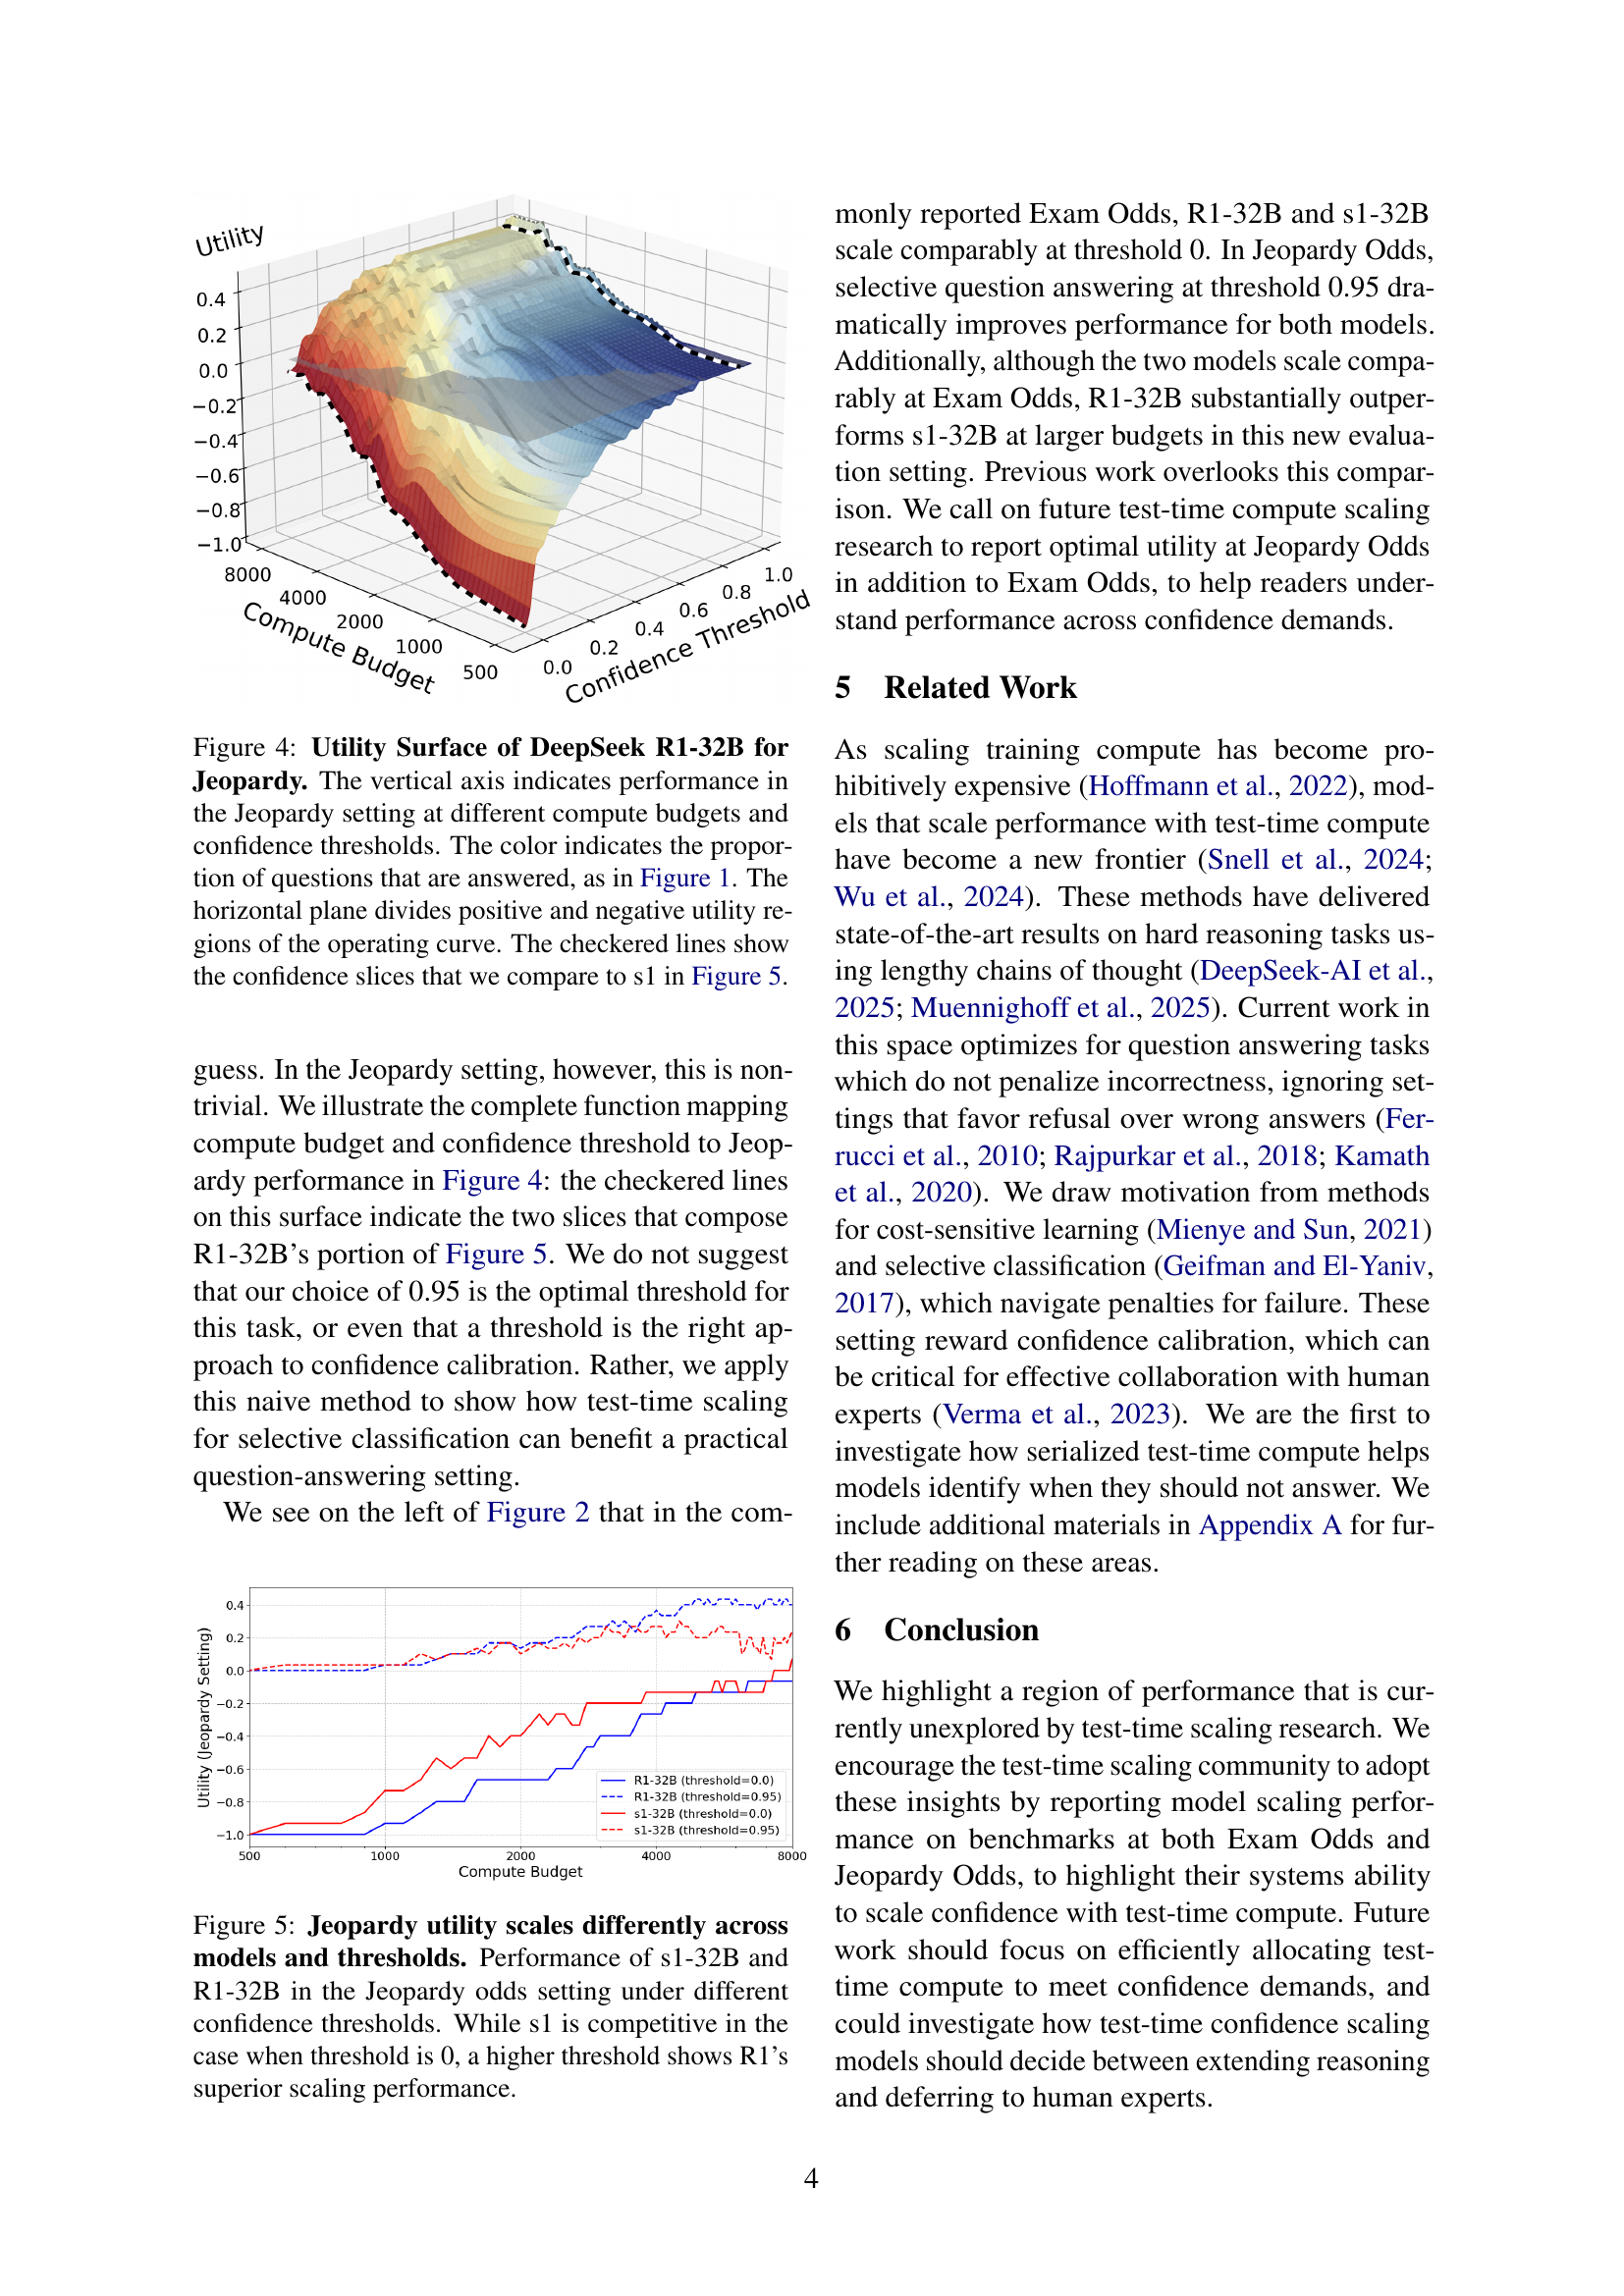
🔼 This figure displays a 3D surface plot showing the utility of the DeepSeek R1-32B model in the Jeopardy setting. The x-axis represents the compute budget, the y-axis represents the confidence threshold, and the z-axis represents the utility. The color of the surface indicates the proportion of questions answered, with redder areas indicating a higher proportion of answered questions. The horizontal plane at z=0 separates positive utility (above the plane) from negative utility (below the plane). The checkered lines highlight specific confidence thresholds (slices) that are further analyzed and compared to another model (s1) in Figure 5.
read the caption
Figure 4: Utility Surface of DeepSeek R1-32B for Jeopardy. The vertical axis indicates performance in the Jeopardy setting at different compute budgets and confidence thresholds. The color indicates the proportion of questions that are answered, as in Figure 1. The horizontal plane divides positive and negative utility regions of the operating curve. The checkered lines show the confidence slices that we compare to s1 in Figure 5.

🔼 This figure compares the performance of two language models, s1-32B and R1-32B, on a question-answering task using the ‘Jeopardy Odds’ evaluation metric. The Jeopardy Odds metric penalizes incorrect answers equally to the reward for correct answers, incentivizing models to only answer when highly confident. The x-axis represents the compute budget allocated to the model during inference. The y-axis shows the utility achieved, which combines accuracy and the frequency of answering. Different lines represent different confidence thresholds used by the models to determine whether to answer a question. The figure shows that while the two models perform similarly when the confidence threshold is low (always answering), R1-32B exhibits significantly better performance than s1-32B when a higher confidence threshold is applied (answering only when very confident), demonstrating R1-32B’s superior ability to leverage increased compute budget to improve accuracy while maintaining confidence.
read the caption
Figure 5: Jeopardy utility scales differently across models and thresholds. Performance of s1-32B and R1-32B in the Jeopardy odds setting under different confidence thresholds. While s1 is competitive in the case when threshold is 0, a higher threshold shows R1’s superior scaling performance.

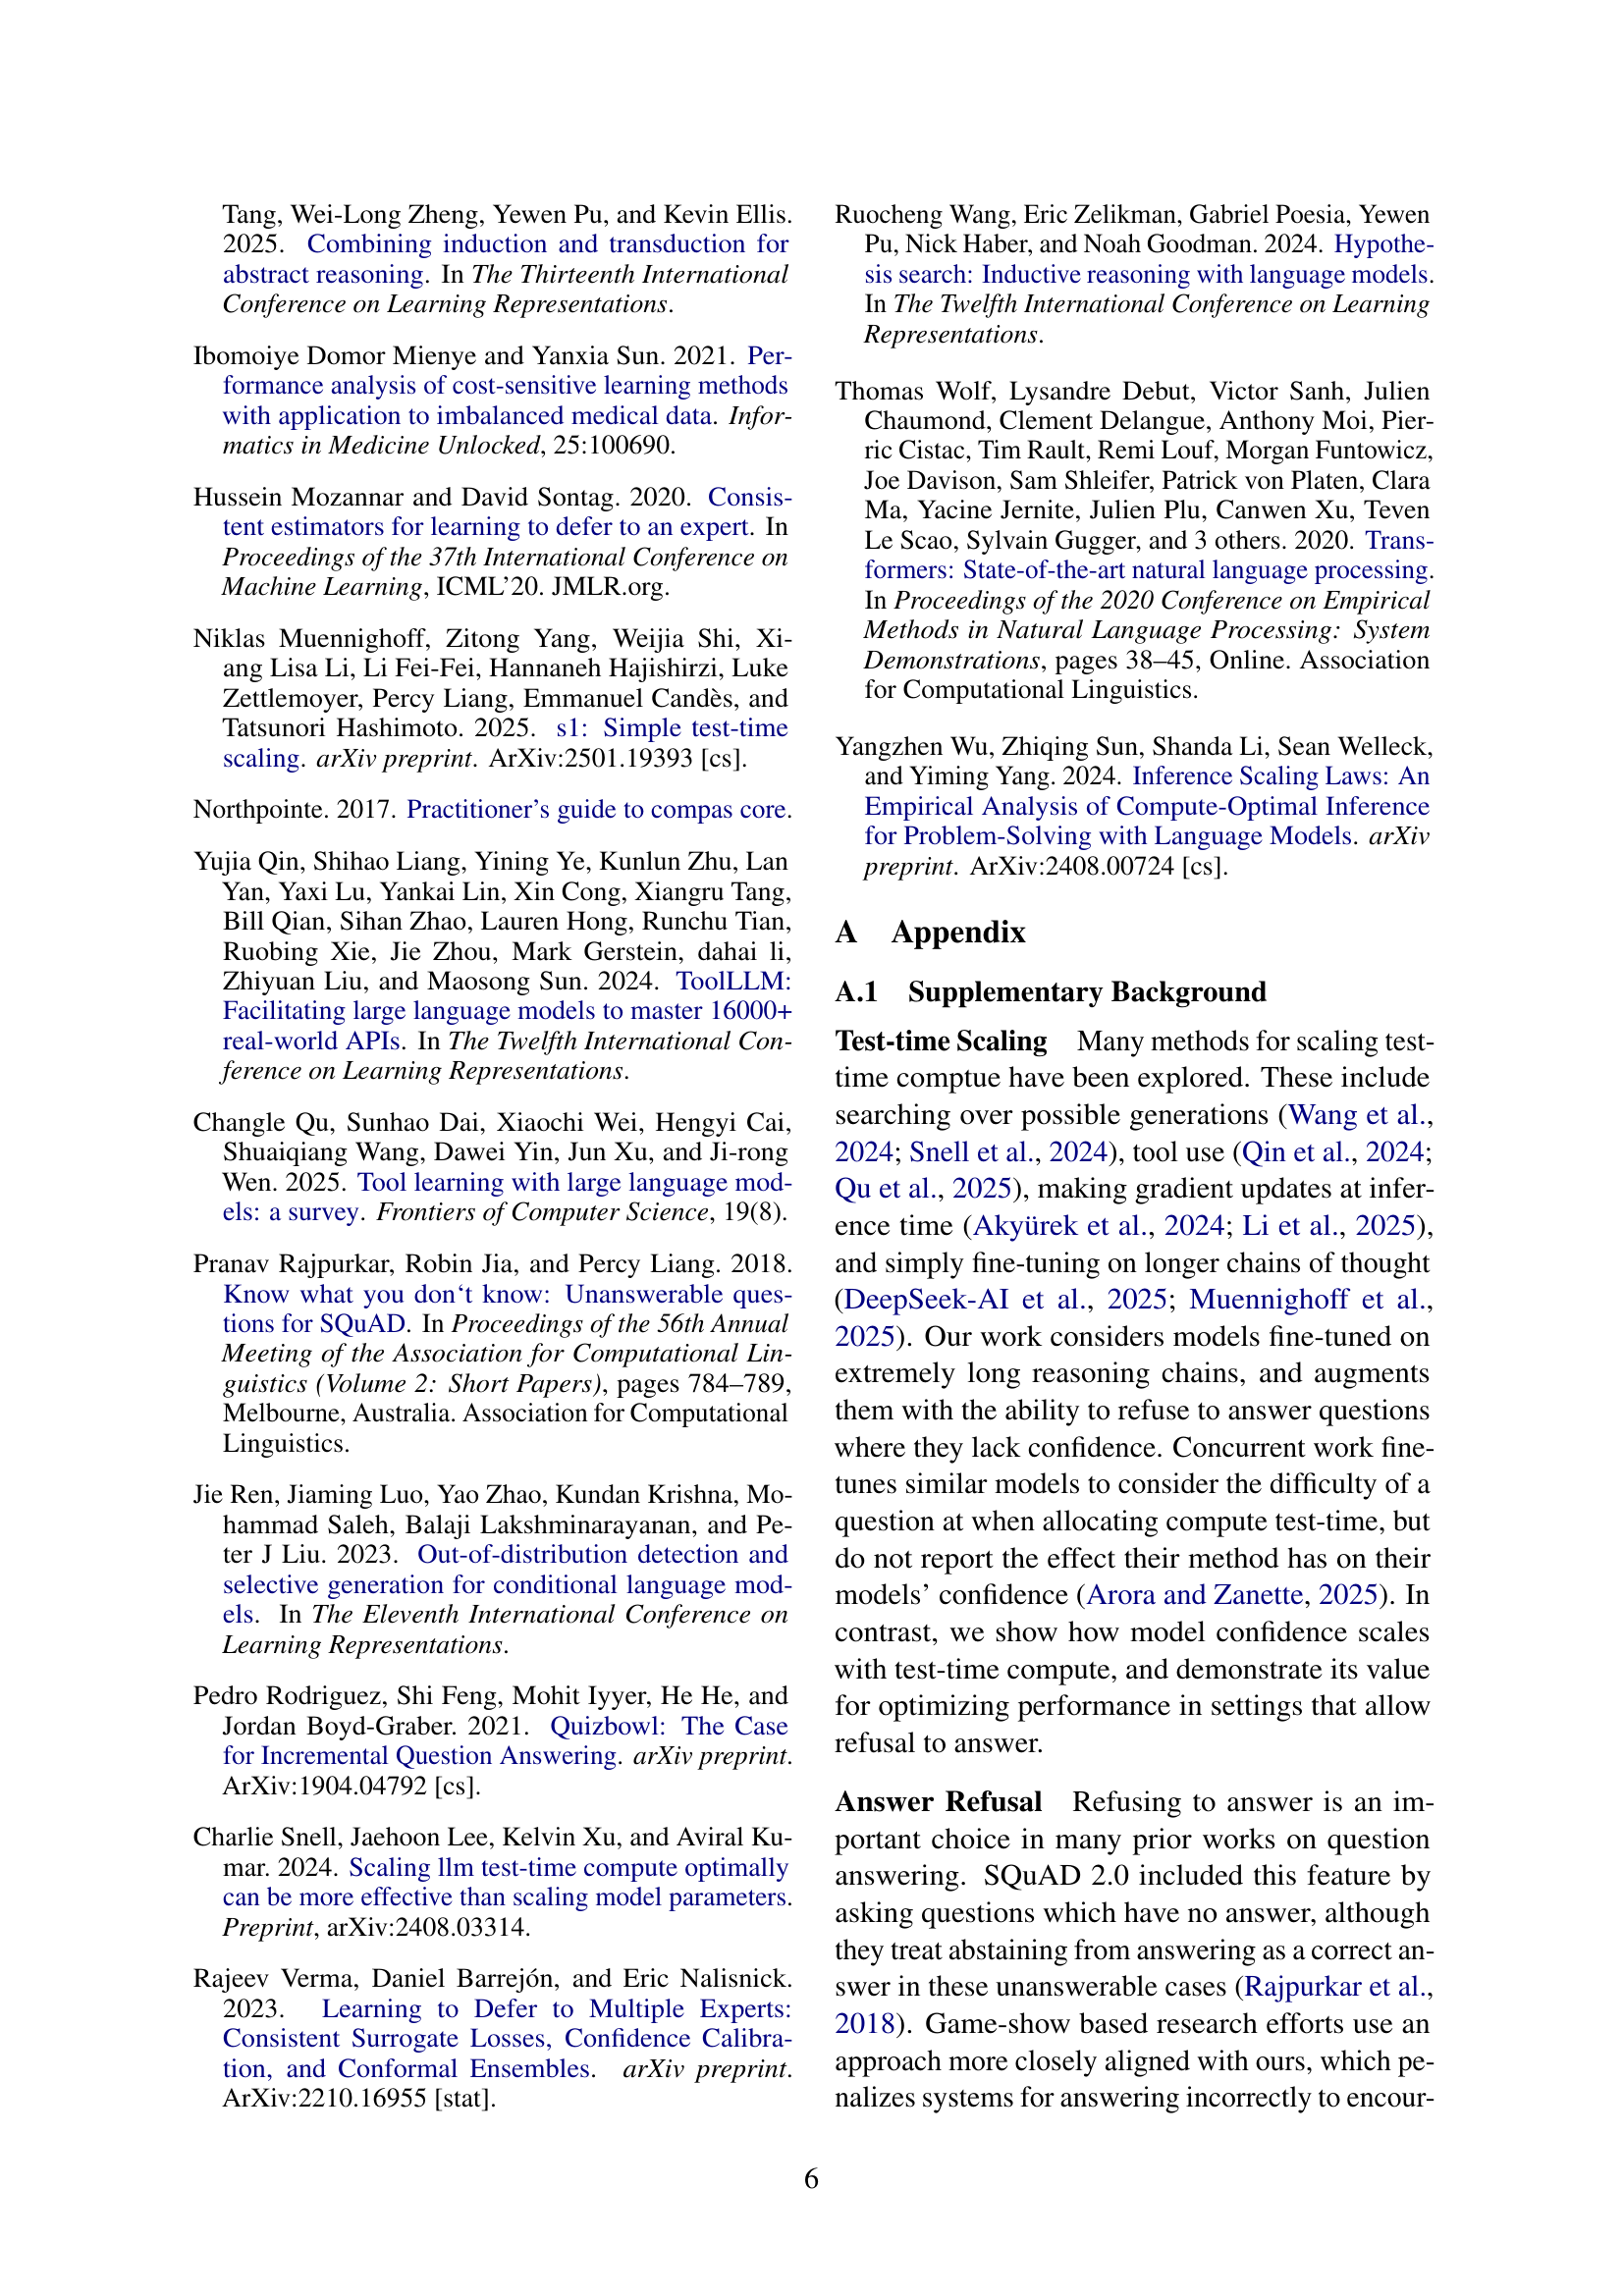
🔼 This figure shows the relationship between compute budget, confidence threshold, accuracy, and response rate for the s1-32B model. The x-axis represents the compute budget, and the y-axis represents the confidence threshold. The z-axis represents the accuracy of the model’s answers, with higher values indicating greater accuracy. The color of each point on the surface indicates the proportion of questions answered at that specific budget and threshold, ranging from blue (low proportion) to red (high proportion). The figure demonstrates that increasing the confidence threshold generally improves accuracy but reduces the response rate (fewer questions answered). Increasing the compute budget can sometimes increase response rate but may not always lead to higher accuracy. The plot also highlights a tradeoff between answering more questions and achieving high accuracy.
read the caption
Figure 6: s1-32B’s answer accuracy is a function of compute budget and confidence threshold. Increased confidence thresholds generally yield increased accuracy at the cost of response rate, while increased compute budgets sometimes decrease accuracy while increasing response rate. The vertical axis indicates the accuracy for answered questions at a compute budget and logit threshold. The color indicates the proportion of questions that are answered; in redder regions, the model is more likely to answer, whereas in bluer regions the model is less likely to answer. We treat the decision to never answer as accuracy 0.

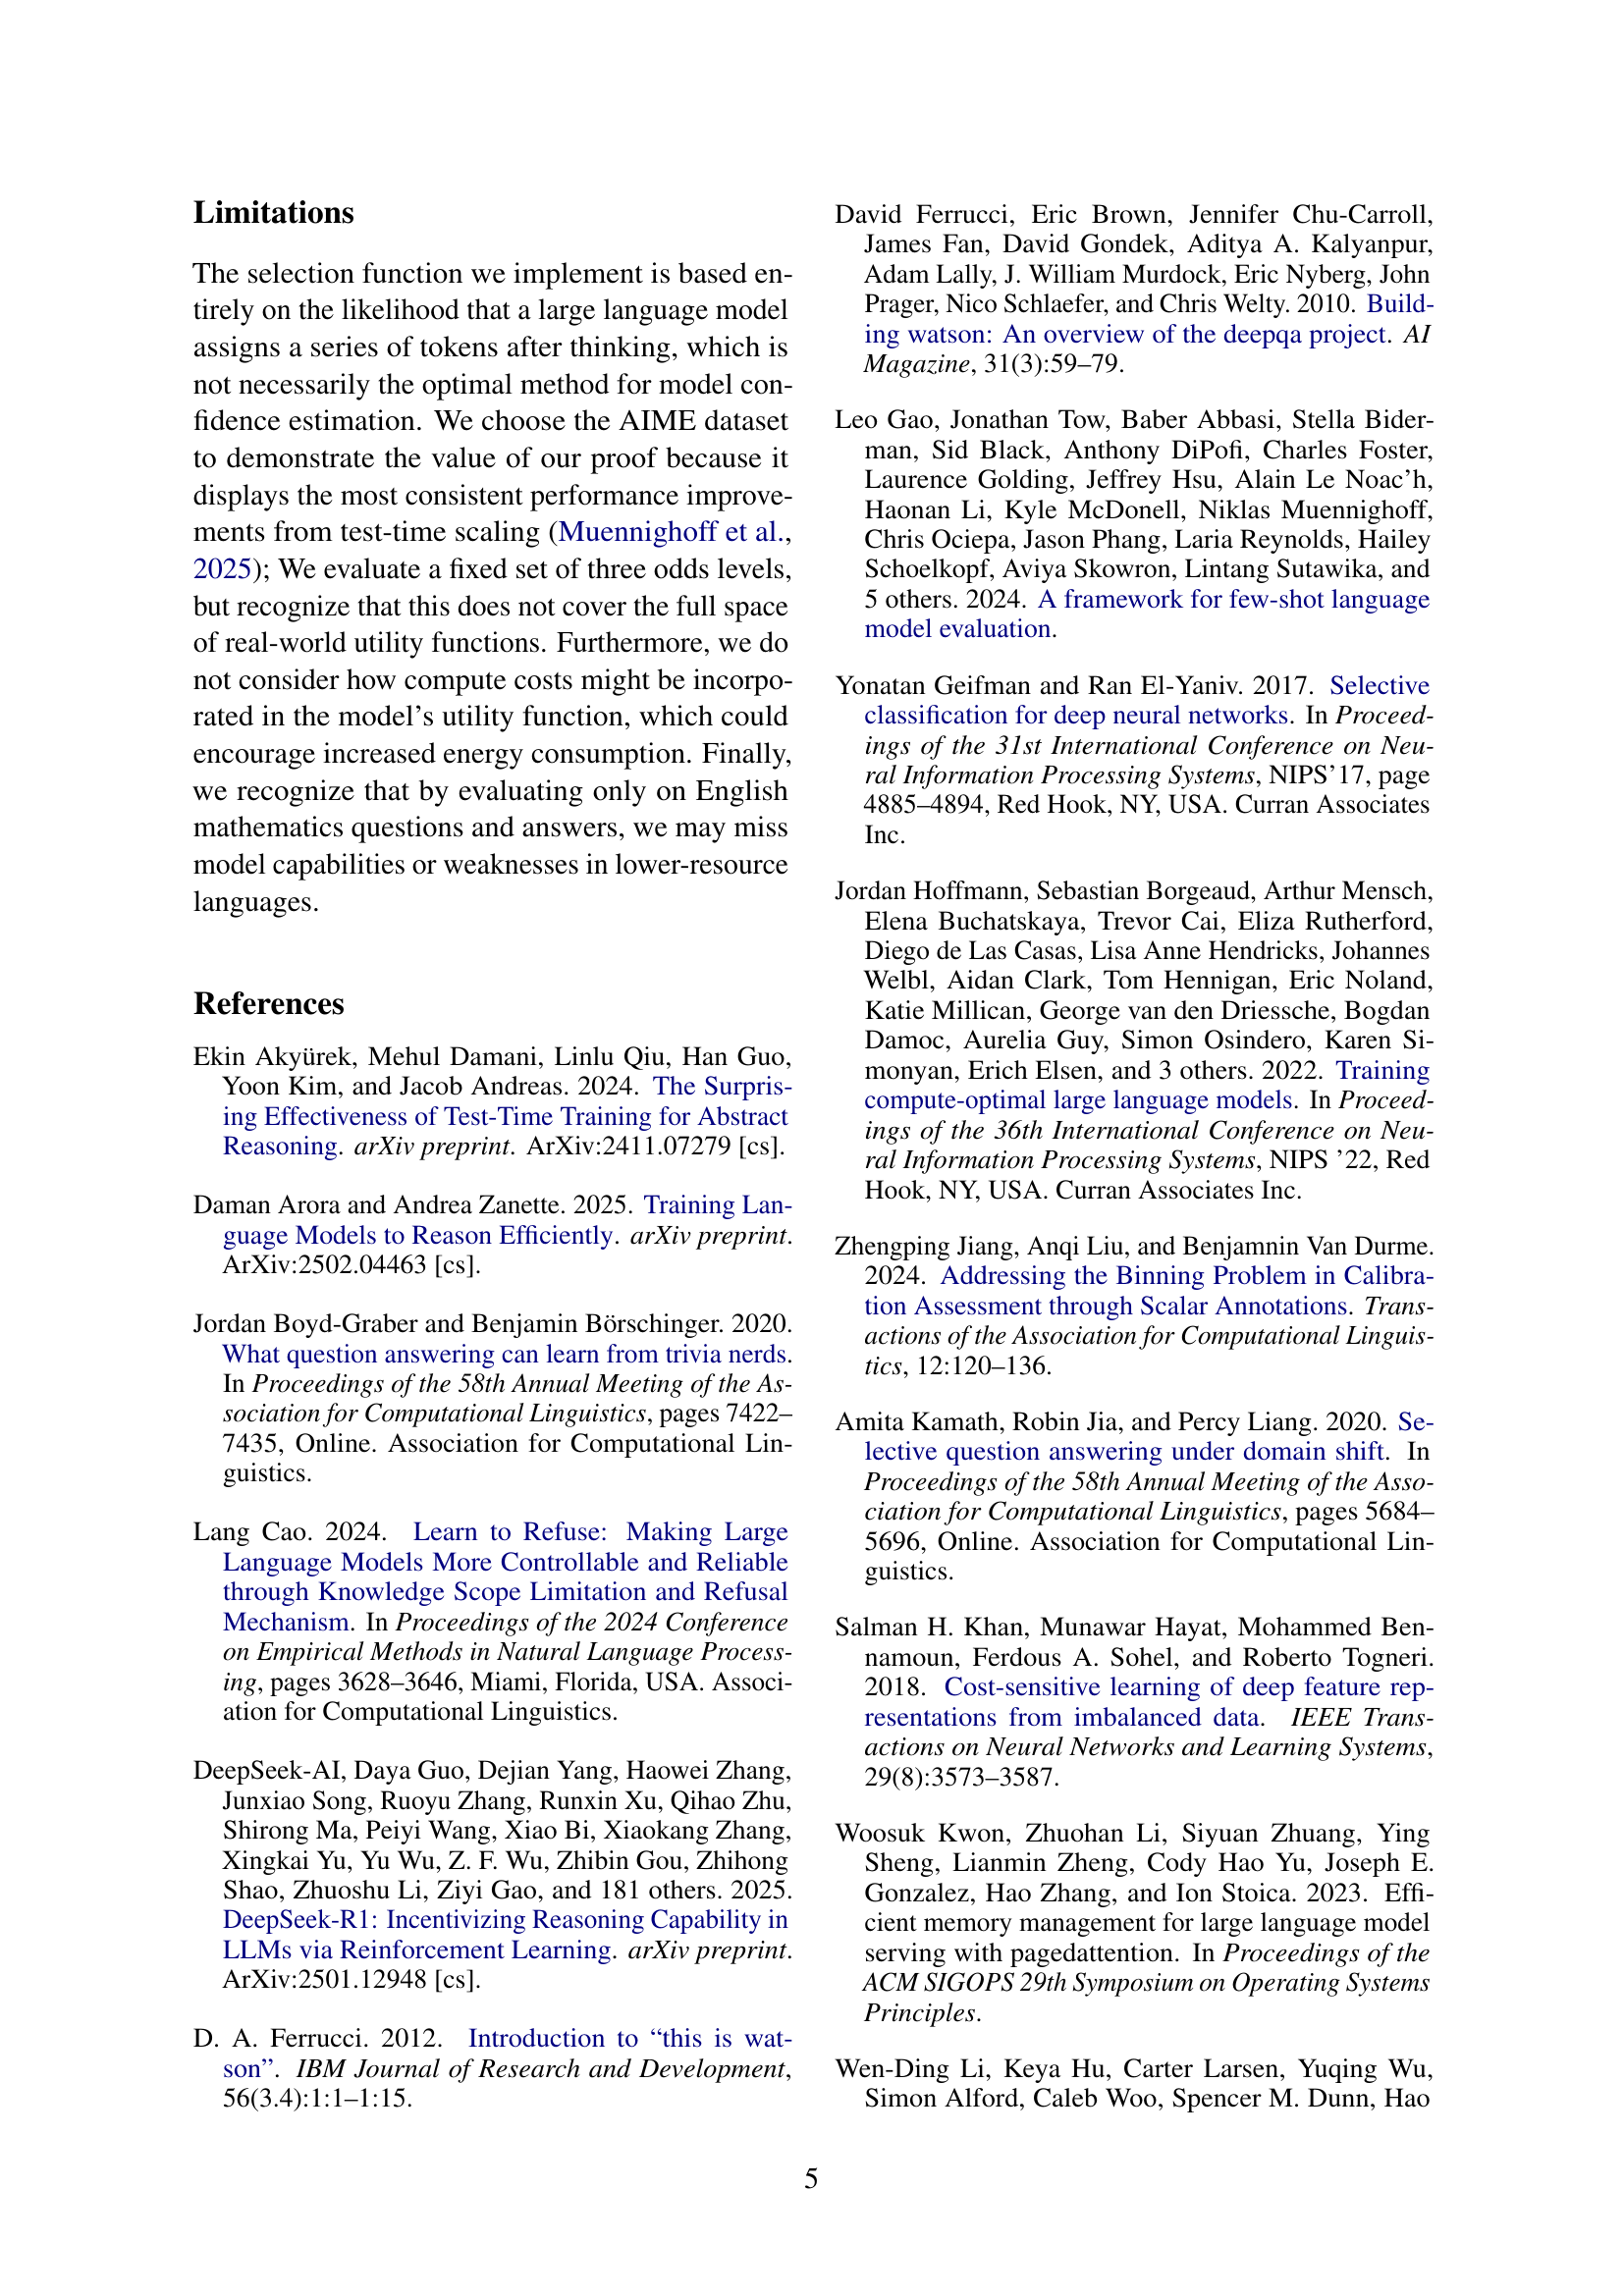
🔼 This figure visualizes how test-time scaling affects the confidence of the language model s1-32B in its answers. Each point represents the model’s confidence in a single answer after a specific computation time. Correct answers are shown in indigo, and incorrect answers in orange. Importantly, a single point can change color if the model revises its answer after additional computation. The graph highlights that increased computation generally leads to higher confidence in correct answers but that this effect is less pronounced for s1-32B compared to R1-32B (see Figure 3 for a comparison).
read the caption
Figure 7: Test-time scaling improves confidence in correct answers. Each dot represents s1-32B’s confidence in an answer after spending a fixed amount of compute. Indigo series indicate correct answers, while orange series are incorrect. Note that individual dots may switch colors if the model changes its prediction after thinking longer. s1-32B does not separate its correct answers from its incorrect answers as effectively as R1-32B. See Figure 3 for R1-32B.

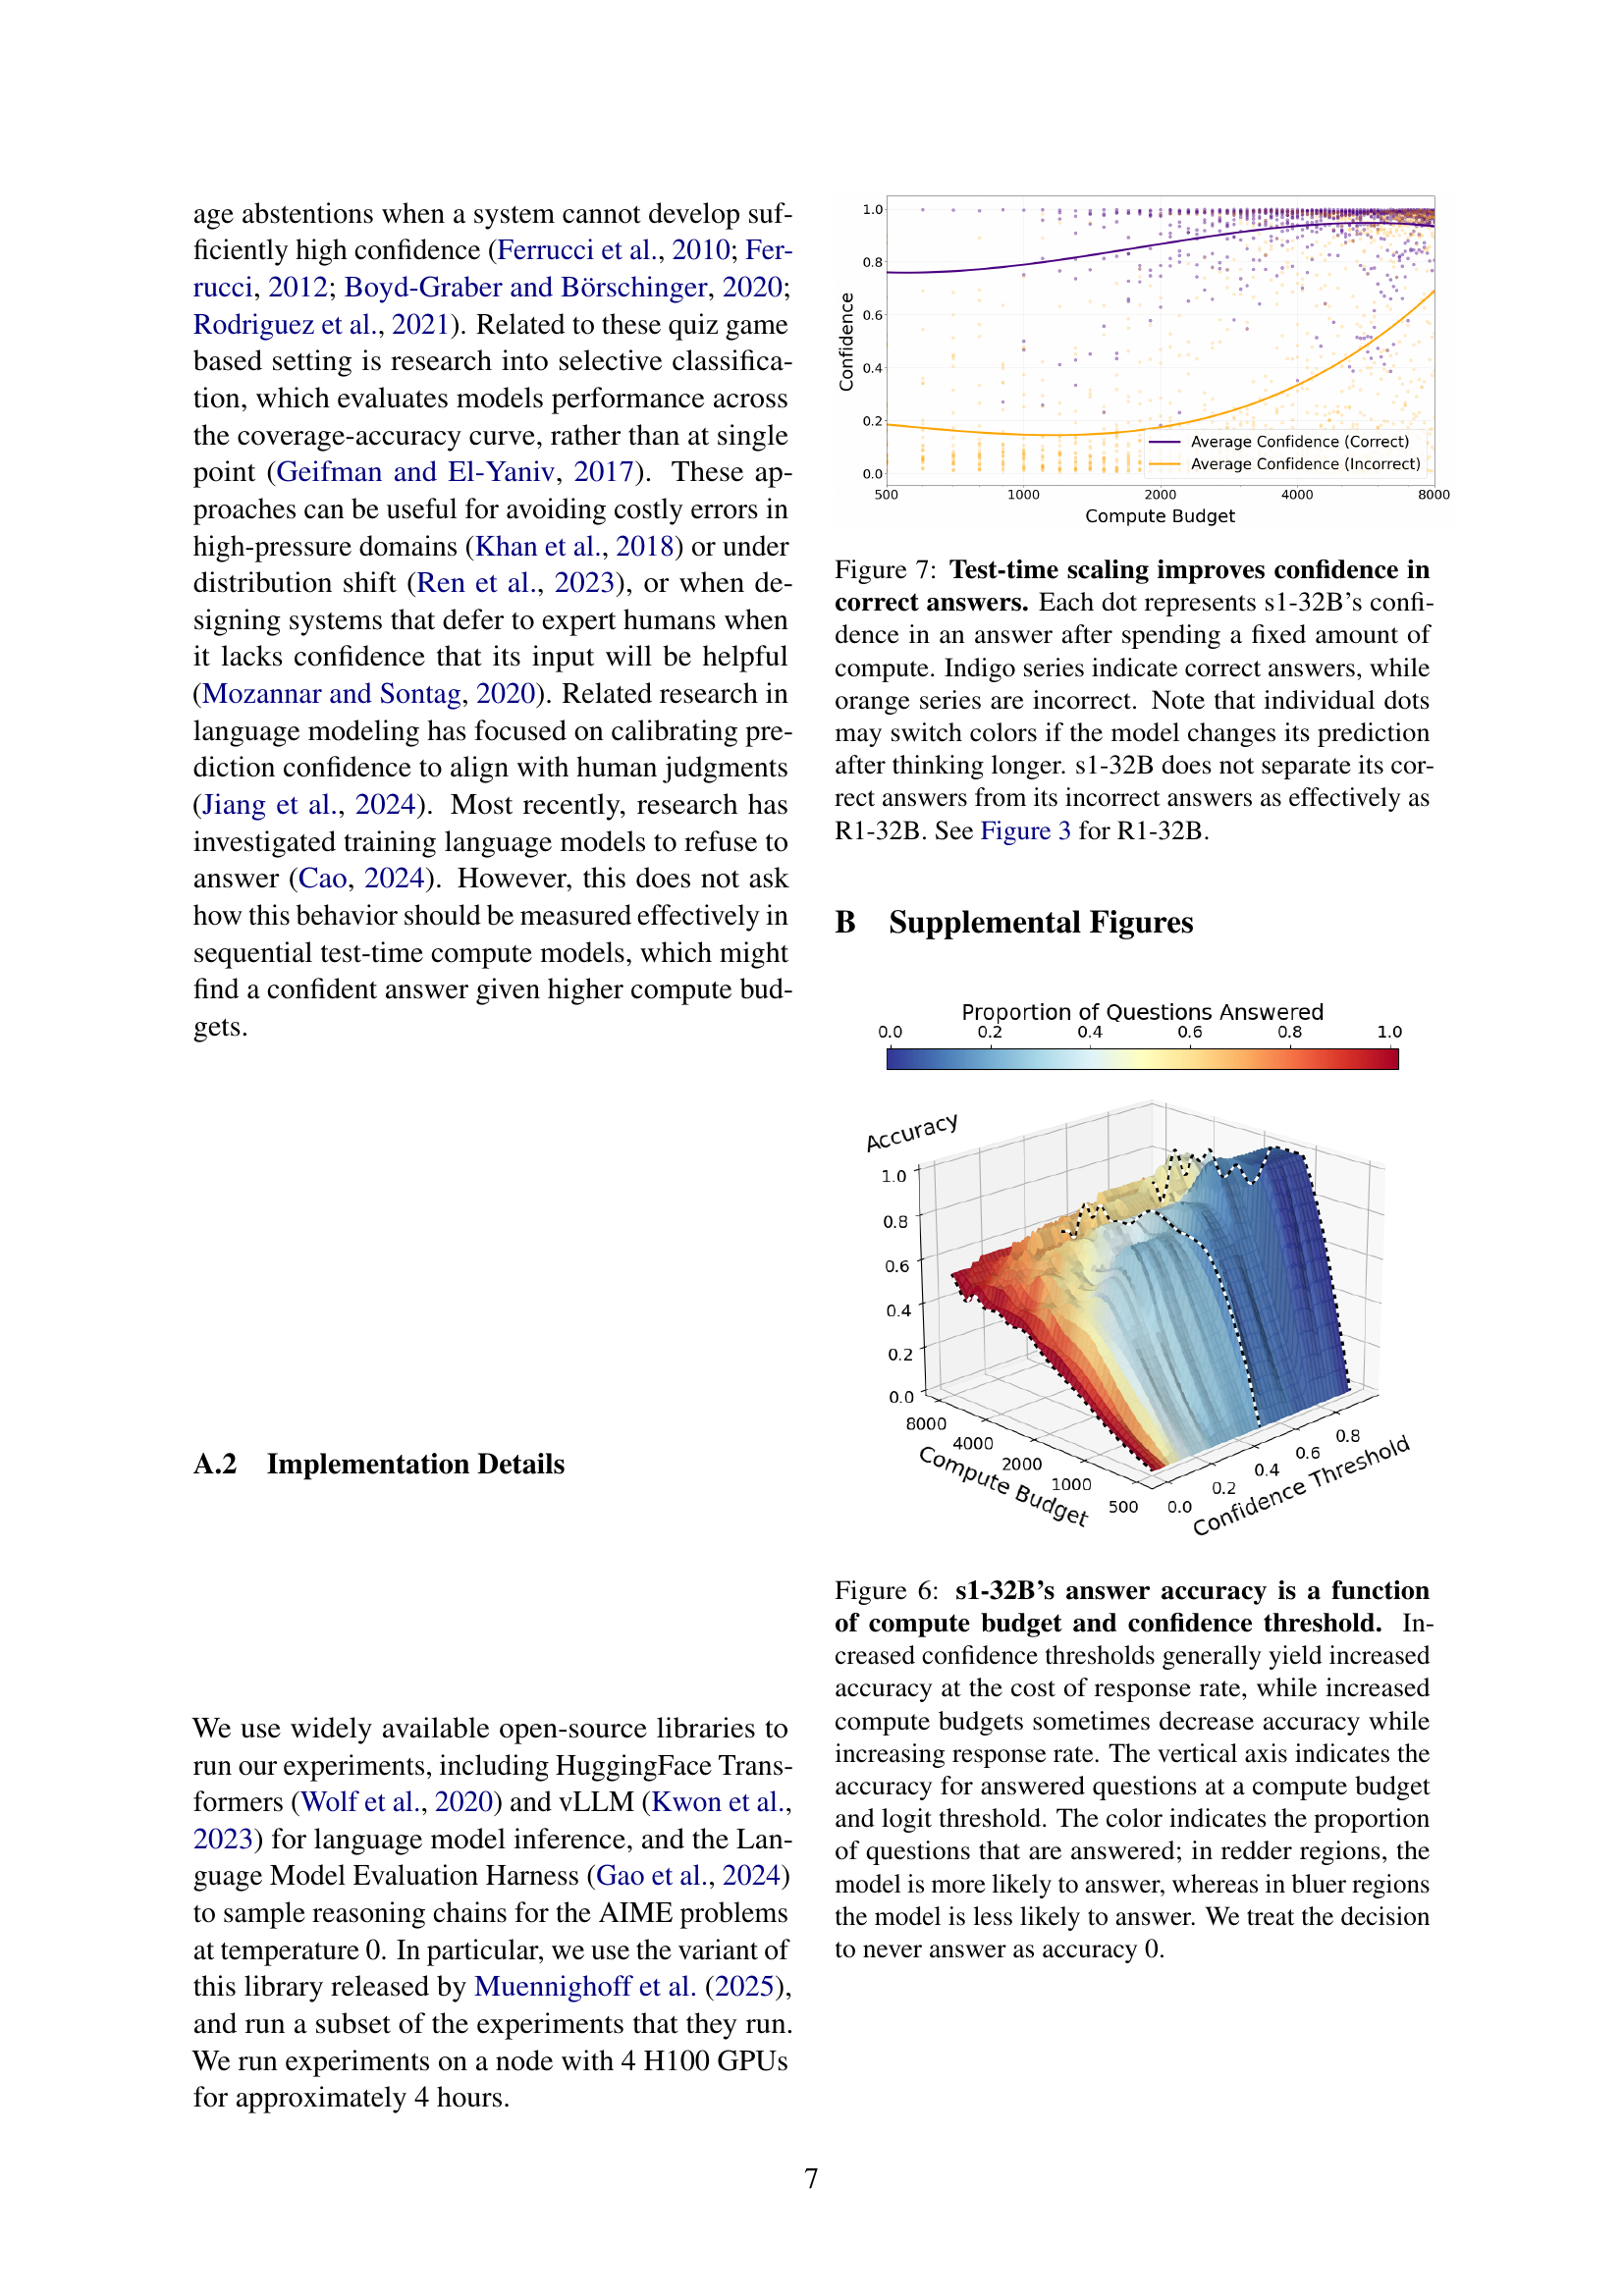
🔼 This figure displays the utility surface for the s1-32B model in the Jeopardy setting. The x-axis represents the compute budget, and the y-axis represents the confidence threshold. The z-axis shows the utility, which combines accuracy and the cost of incorrect answers. Redder areas indicate a higher proportion of questions answered, while bluer areas show fewer answers. The horizontal plane at utility = 0 separates regions of positive and negative utility. Checkered lines highlight specific confidence thresholds that are compared to the R1-32B model in Figure 5. The volume above the zero-utility plane is notably smaller for s1-32B than for R1-32B, demonstrating its inferior performance in this scenario.
read the caption
Figure 8: Utility Surface of s1-32B for Jeopardy. The vertical axis indicates performance in the Jeopardy setting at different compute budgets and confidence thresholds. The color indicates the proportion of questions that are answered; in redder regions, the model is more likely answer, whereas in bluer regions the model is less likely to answer. The horizontal plane divides positive and negative utility regions of the operating curve. The checkered lines indicate the threshold slices that we compare against R1-32B in Figure 5. Note the relatively lower volume above the break-even point of 0 corresponds to s1-32B’s broadly inferior performance at these odds.
Full paper#