TL;DR#
Current Large Language Model (LLM) serving systems are not optimized for the evolving landscape of dynamic, general-purpose agentic programs. Existing systems often ignore dependencies between programs and calls, leading to missed optimization opportunities and significant waiting times. This results from head-of-line blocking at both the individual LLM request and the program levels. Addressing these issues is critical for enhancing the efficiency and responsiveness of AI agents.
To tackle these challenges, this paper introduces Autellix, an LLM serving system designed to treat programs as first-class citizens. Autellix intercepts LLM calls and enriches schedulers with program-level context, utilizing two scheduling algorithms: Program-Level Attained Service (PLAS) for single-threaded programs and Adaptive Thread-Level Attained Service (ATLAS) for distributed programs. Evaluation demonstrates that Autellix improves throughput by 4-15x compared to state-of-the-art systems, while maintaining comparable latency.
Key Takeaways#
Why does it matter?#
This paper introduces Autellix, a novel LLM serving system, addressing key challenges in deploying LLM agents. Its program-aware scheduling and load balancing improve efficiency and reduce latency. As LLM agents become more prevalent, Autellix provides valuable insights and methods for researchers to optimize their performance and scalability, paving the way for more efficient and responsive AI systems.
Visual Insights#

🔼 This figure shows a simple chatbot interaction workflow. The workflow is represented as a sequence diagram, showing the interaction between a human user, the chatbot agent (which uses an LLM internally), and an optional tool. The user inputs a message, the chatbot agent receives the message and uses its internal LLM to generate a response. The chatbot may then optionally interact with a tool to assist in generating the response (e.g., accessing a search engine or database). Finally, the chatbot agent returns its response to the human user. This is a straightforward, sequential process, representing one type of agentic program where each agent’s activities are fairly simple and directly respond to the user.
read the caption
(a) Chatbot
In-depth insights#
Agentic Program DAG#
Agentic program DAGs represent a shift from static LLM applications to dynamic, general-purpose programs. They model the complex interactions between LLM calls, external tools, and human inputs as a directed acyclic graph, capturing the program’s control flow. This is a crucial abstraction because it acknowledges dependencies between LLM calls, enabling optimization opportunities. Traditional LLM serving systems, designed for independent requests, often miss these dependencies, leading to suboptimal performance. By treating programs as first-class citizens and understanding their DAG structure, it becomes possible to prioritize and schedule LLM calls more effectively, reducing end-to-end latency and improving overall system throughput. The DAG representation also allows for identifying critical paths and prioritizing calls that contribute most to program completion.
Program-Aware Scheduling#
Program-aware scheduling is a critical area in optimizing LLM serving systems. Traditional schedulers often treat LLM requests in isolation, neglecting dependencies and context within programs. This leads to suboptimal performance, as evidenced by head-of-line blocking and inefficient resource utilization. Program-aware scheduling aims to address these limitations by incorporating program-level information, such as dependencies between calls and cumulative execution time, into scheduling decisions. This approach allows for more informed prioritization, preemption, and resource allocation, ultimately reducing end-to-end latency and improving overall system throughput. By understanding the context of each LLM call within its parent program, the scheduler can make more intelligent decisions, leading to improved efficiency and fairness.
Autellix Architecture#
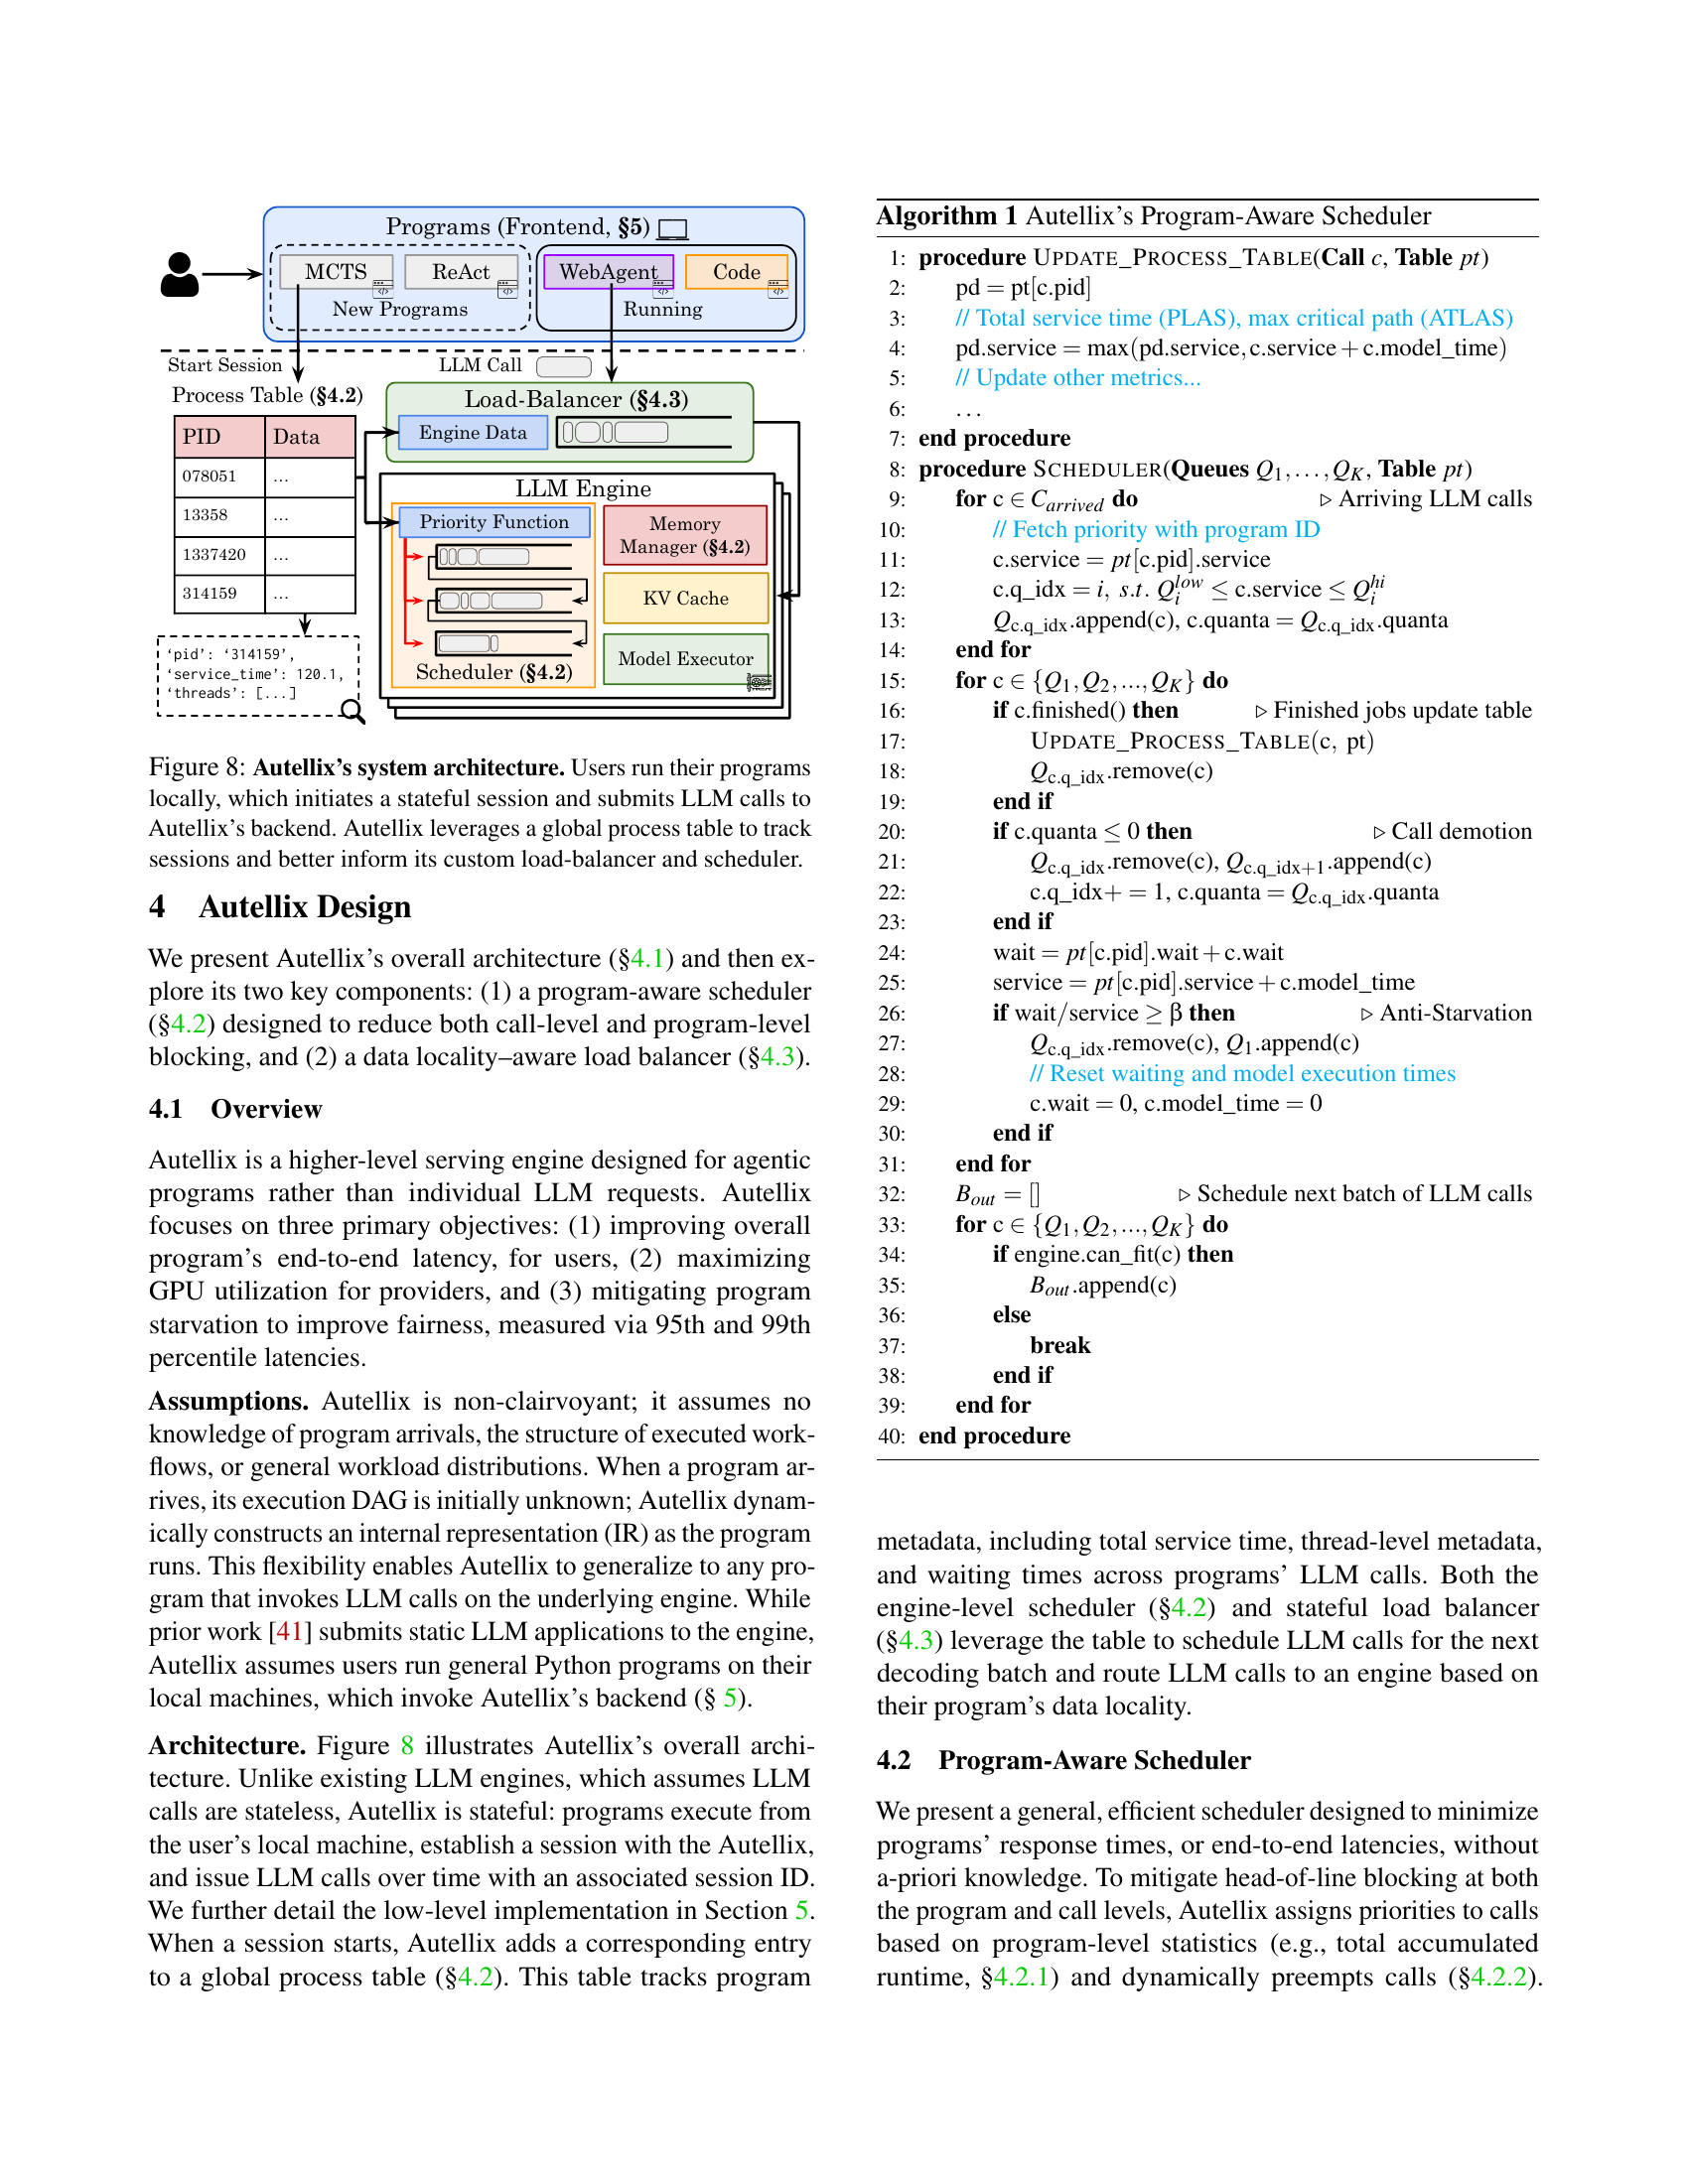
Autellix’s architecture centers around a stateful backend that contrasts with typical stateless LLM engines. Programs execute from the user’s local machine, initiating a session with the Autellix backend and sending LLM calls with session IDs. A global process table tracks program metadata like service time and thread information, guiding the scheduler and load balancer. The architecture aims to improve end-to-end latency, maximize GPU utilization, and prevent program starvation. It utilizes a non-clairvoyant approach, dynamically building an internal representation of the program’s execution graph as it runs, enabling generalization to diverse programs using LLM calls. Figure 8 illustrates the architecture’s components, including LLM engines, priority function, memory manager, model executor, and scheduler, working in concert to optimize performance.
KV Cache Locality#
KV cache locality is critical for LLM serving efficiency. Reusing cached key-value states across LLM calls reduces redundant computation and speeds up inference. Agentic workloads highlight two key aspects: intra-program locality where calls within the same program often share common prefixes (e.g., system prompts, conversation history) leading to high cache hit rates and inter-program locality where calls across programs might only share the system prompt leading to lower hit rates. Efficiently exploiting intra-program locality via techniques like prefix caching and shared memory is key. The load balancer is critical to maintain locality, while balancing load across multiple engines. Prioritizing routing request to the right engine depending on program characteristics, it is crucial to improve overall efficiency. For short LLM calls with minimal history, common system prompts may negate the need to maintain data locality.
ATLAS:Thread Aware#
While the specific heading ‘ATLAS: Thread Aware’ might not be directly present, the paper discusses ‘ATLAS (Adaptive Thread-Level Attained Service),’ an algorithm designed to manage multi-threaded programs, where awareness of individual thread progress and inter-dependencies is crucial. It likely alludes to the algorithm’s capability to prioritize LLM calls stemming from critical threads within a program, particularly in dynamic DAGs representing complex agentic tasks. The core concept is to avoid straggler threads that could delay overall program completion, aligning with the goal of minimizing end-to-end latency. The ‘thread aware’ aspect indicates that ATLAS doesn’t treat all threads equally; instead, it dynamically adapts its scheduling based on the cumulative service time and estimated critical path of each thread. This contrasts with simpler policies that treat all LLM calls uniformly, regardless of their importance to the overall program’s progress. By accounting for thread-level contributions to the critical path, ATLAS likely enables a more efficient resource allocation and improved program completion times, ensuring that threads essential for rapid progress receive the necessary priority.
More visual insights#
More on figures

🔼 This figure illustrates the execution workflow of a ReAct (Reasoning and Acting) agent, a type of agentic program. The ReAct agent iteratively cycles between generating text with an LLM and interacting with its environment (using tools or human input). Each cycle begins with an LLM call (represented by the rectangle with ‘LLM Agent’ inside), producing an action or response. The agent then executes an action in the environment (represented by a rectangle with ‘Tool’). Subsequent LLM calls build upon the outcome of tool use or human interaction, iterating the process until the task is solved or a termination condition is met. The workflow is dynamic and non-deterministic, as the specific number and order of LLM calls and actions depend on the situation and the LLM’s output.
read the caption
(b) ReAct Agent
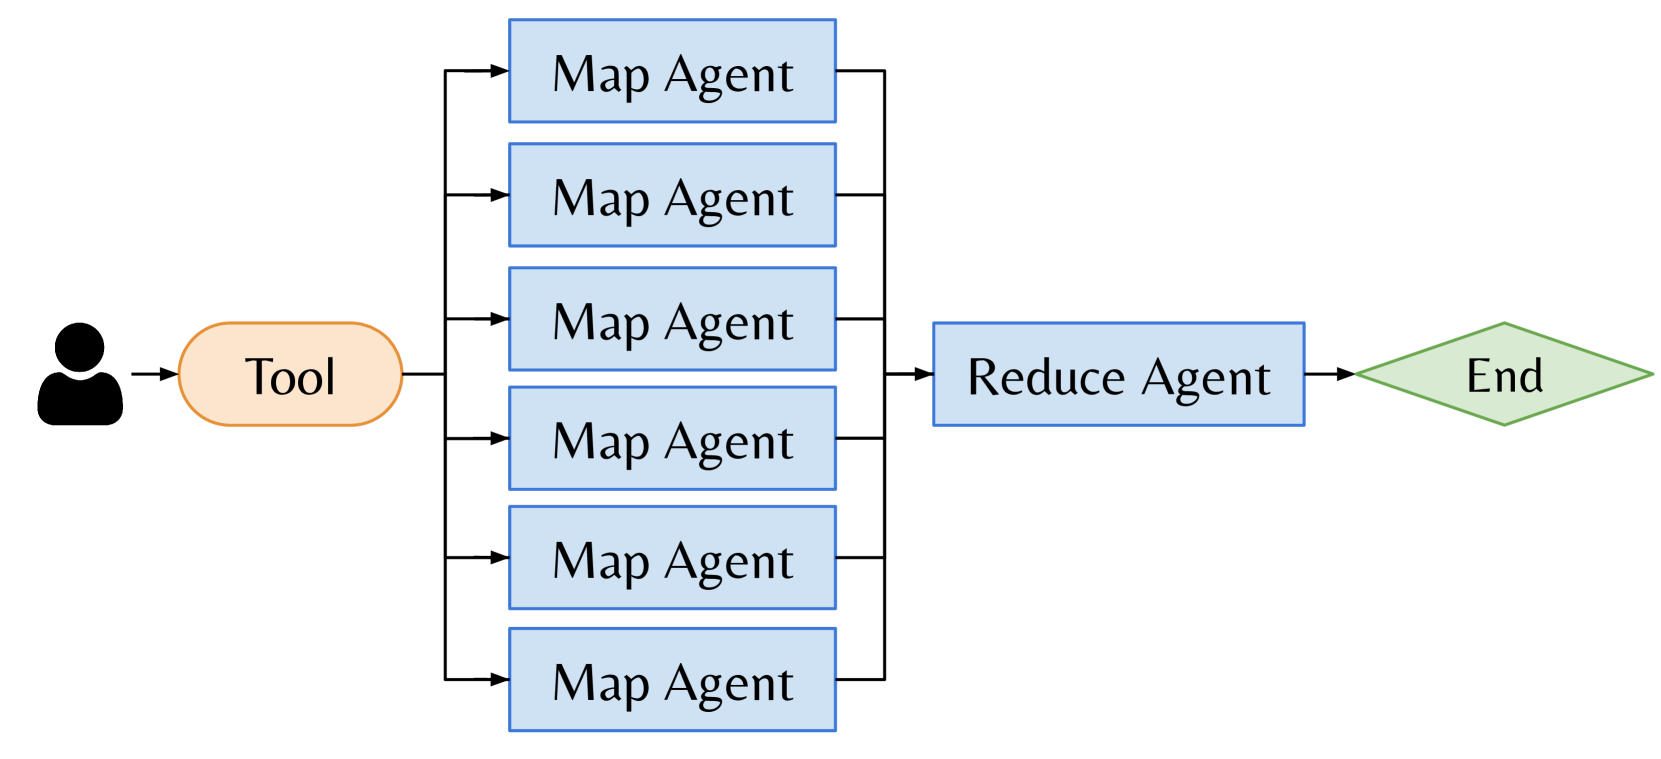
🔼 This figure shows a MapReduce workflow as an example of a multi-threaded agentic program. MapReduce consists of multiple agents working in parallel on sub-tasks and combines the results at the end. The figure illustrates the dynamic nature of the workflow with agents performing LLM calls, accessing tools, and ultimately merging to produce a final result. Each agent’s path is depicted as a directed acyclic graph (DAG), showing multiple stages involving calls to LLMs and interactions with external tools.
read the caption
(c) Map-Reduce

🔼 This figure illustrates a Monte Carlo Tree Search (MCTS) agentic program. MCTS is a widely used search and planning algorithm where multiple threads are created and used to search the decision space. Each thread represents a sequence of LLM calls and external interrupts (tool calls or human inputs) that can vary over time. The figure shows that multi-threaded programs generally form directed acyclic graphs (DAGs) where the number of threads that fork and merge varies. The complexity of the workflow depends on the number of threads and their respective sequences of LLM calls and interrupts.
read the caption
(d) Monte Carlo Tree Search

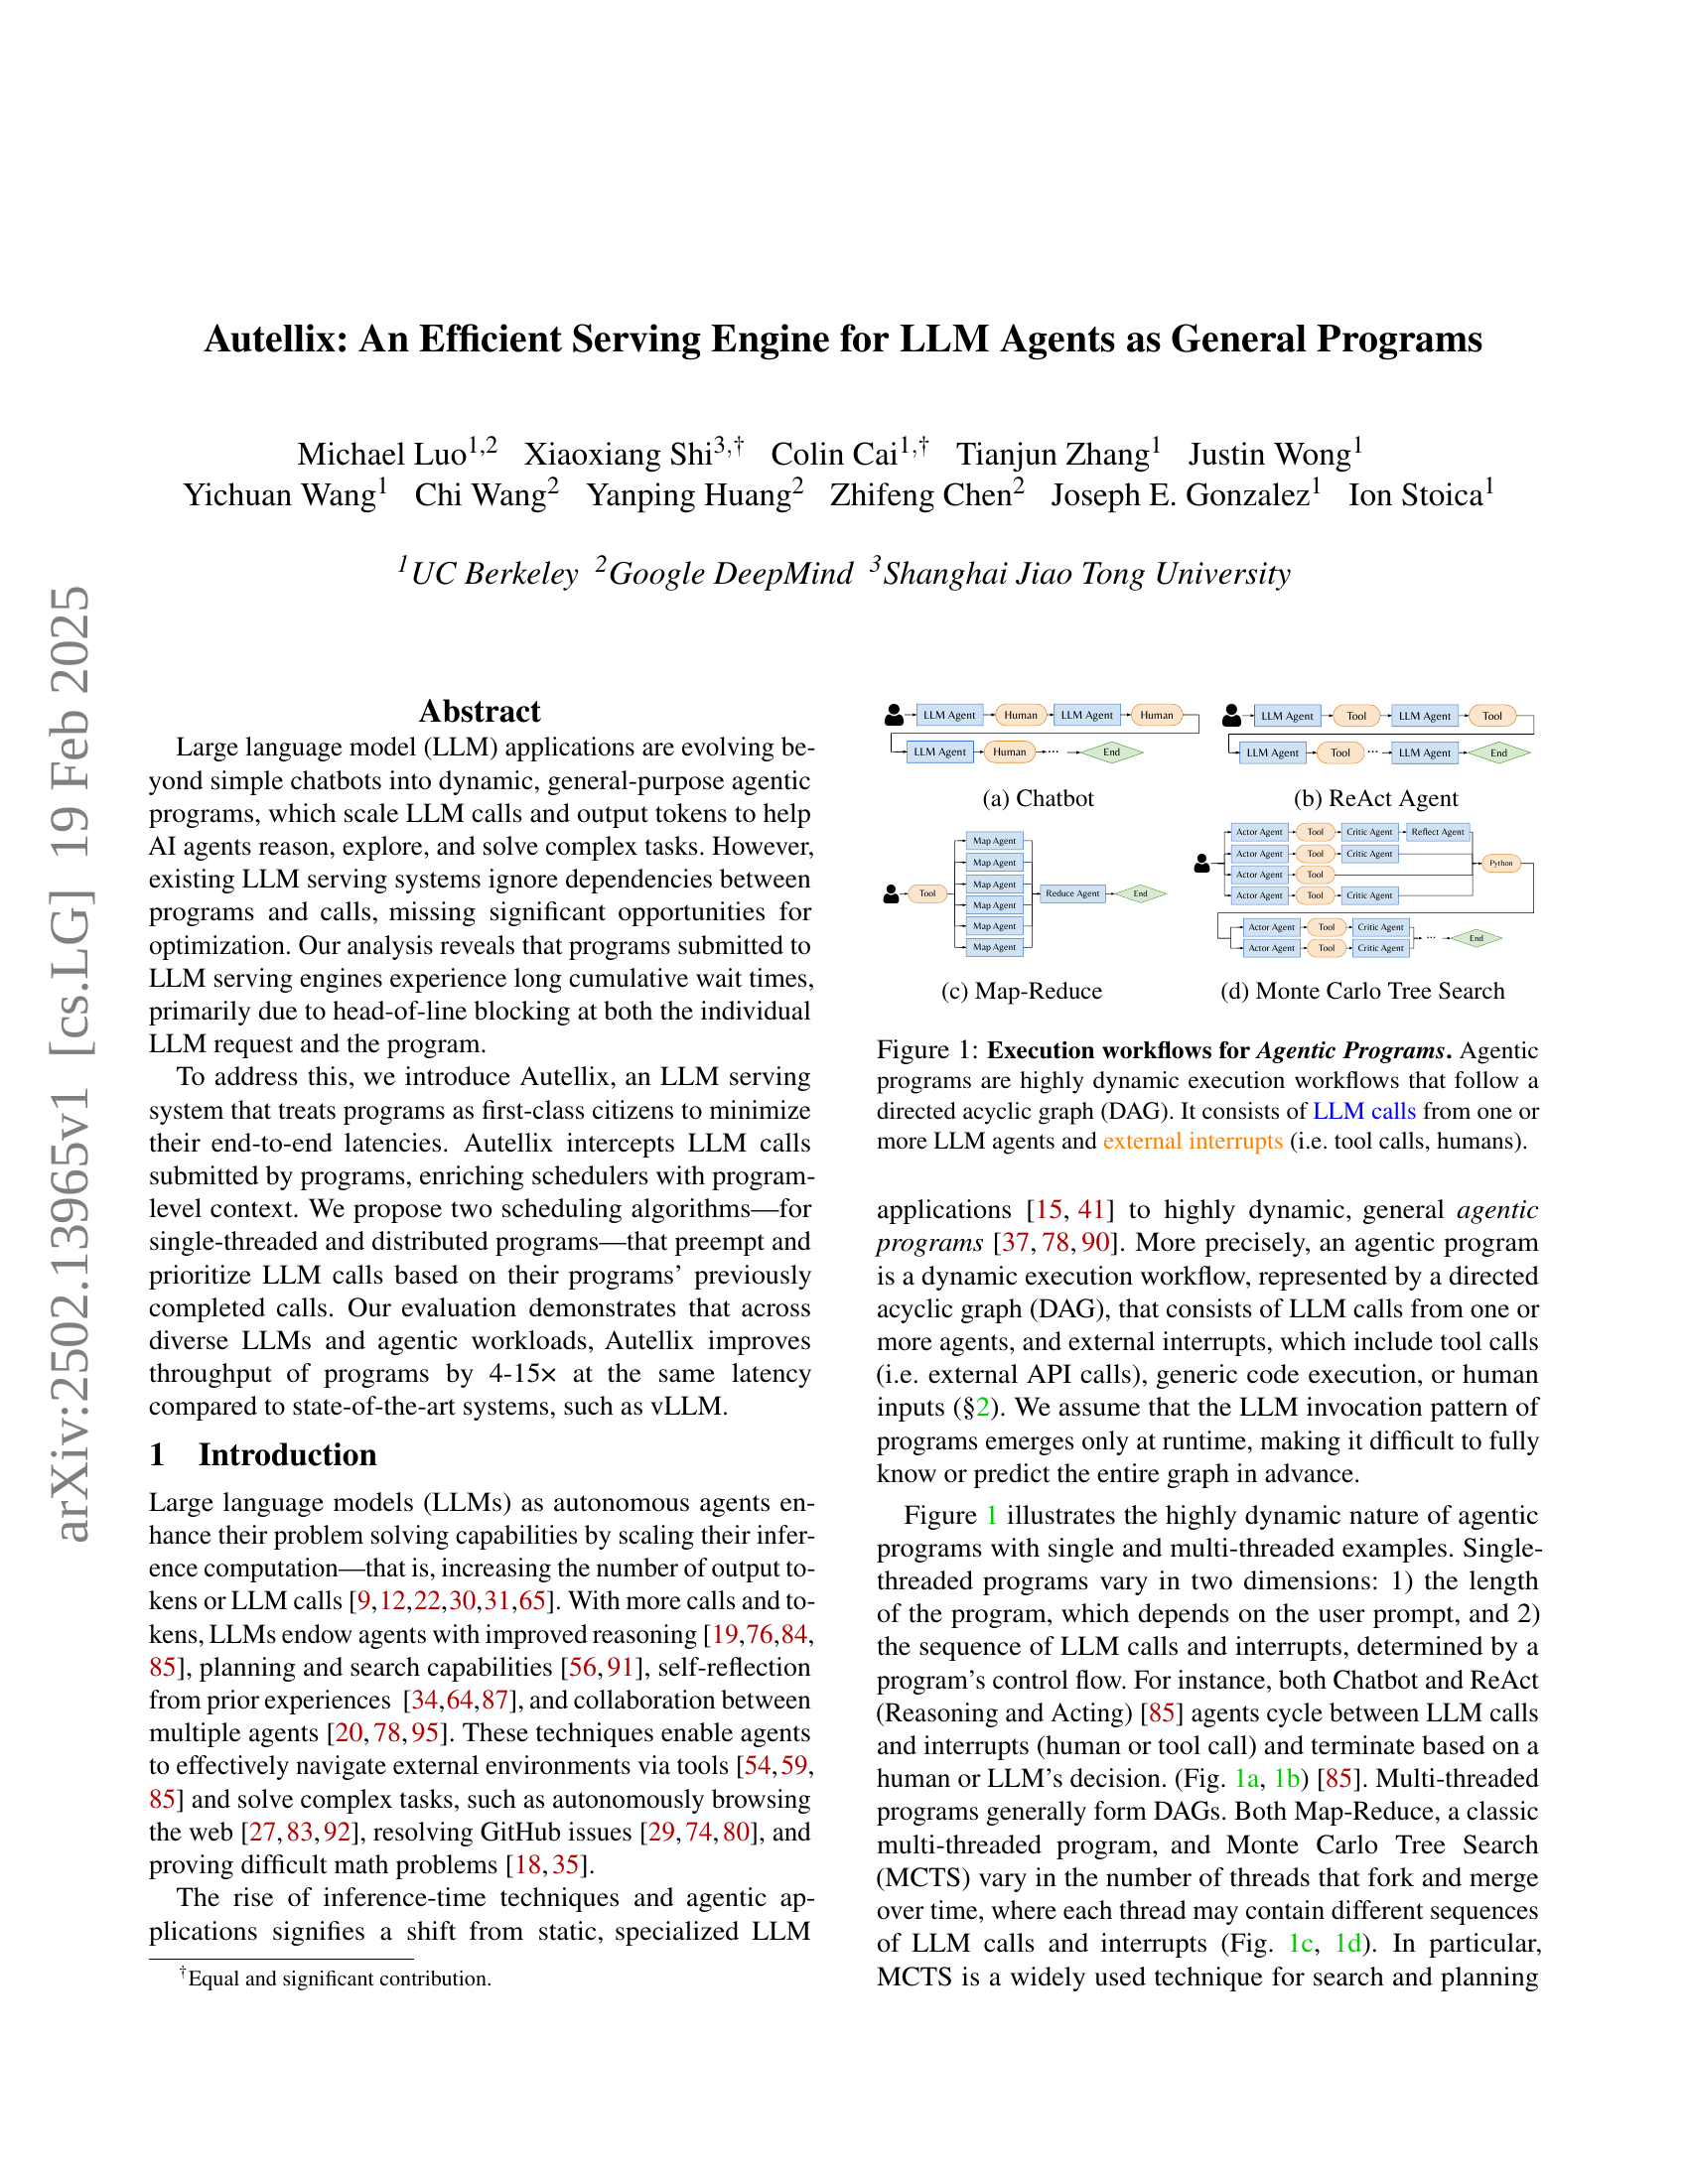
🔼 This figure illustrates the dynamic nature of agentic programs, which are AI programs that use LLMs to reason and interact with tools and humans. Unlike simple chatbots, these programs don’t follow a predetermined flow; instead, their execution path resembles a directed acyclic graph (DAG). The nodes in the DAG represent LLM calls made by one or more LLM agents, while the edges show the flow of execution. The figure shows four examples: (a) a simple chatbot, where interactions are sequential; (b) a ReAct agent, combining reasoning and action; (c) a Map-Reduce agent, performing parallel processing; and (d) a Monte Carlo Tree Search agent, using a tree-like structure for planning and decision making. Each example highlights the highly dynamic nature of these programs, where the sequence and number of LLM calls and interactions (tools or human input) are not fixed beforehand but depend on the specific situation and context.
read the caption
Figure 1: Execution workflows for Agentic Programs. Agentic programs are highly dynamic execution workflows that follow a directed acyclic graph (DAG). It consists of LLM calls from one or more LLM agents and external interrupts (i.e. tool calls, humans).

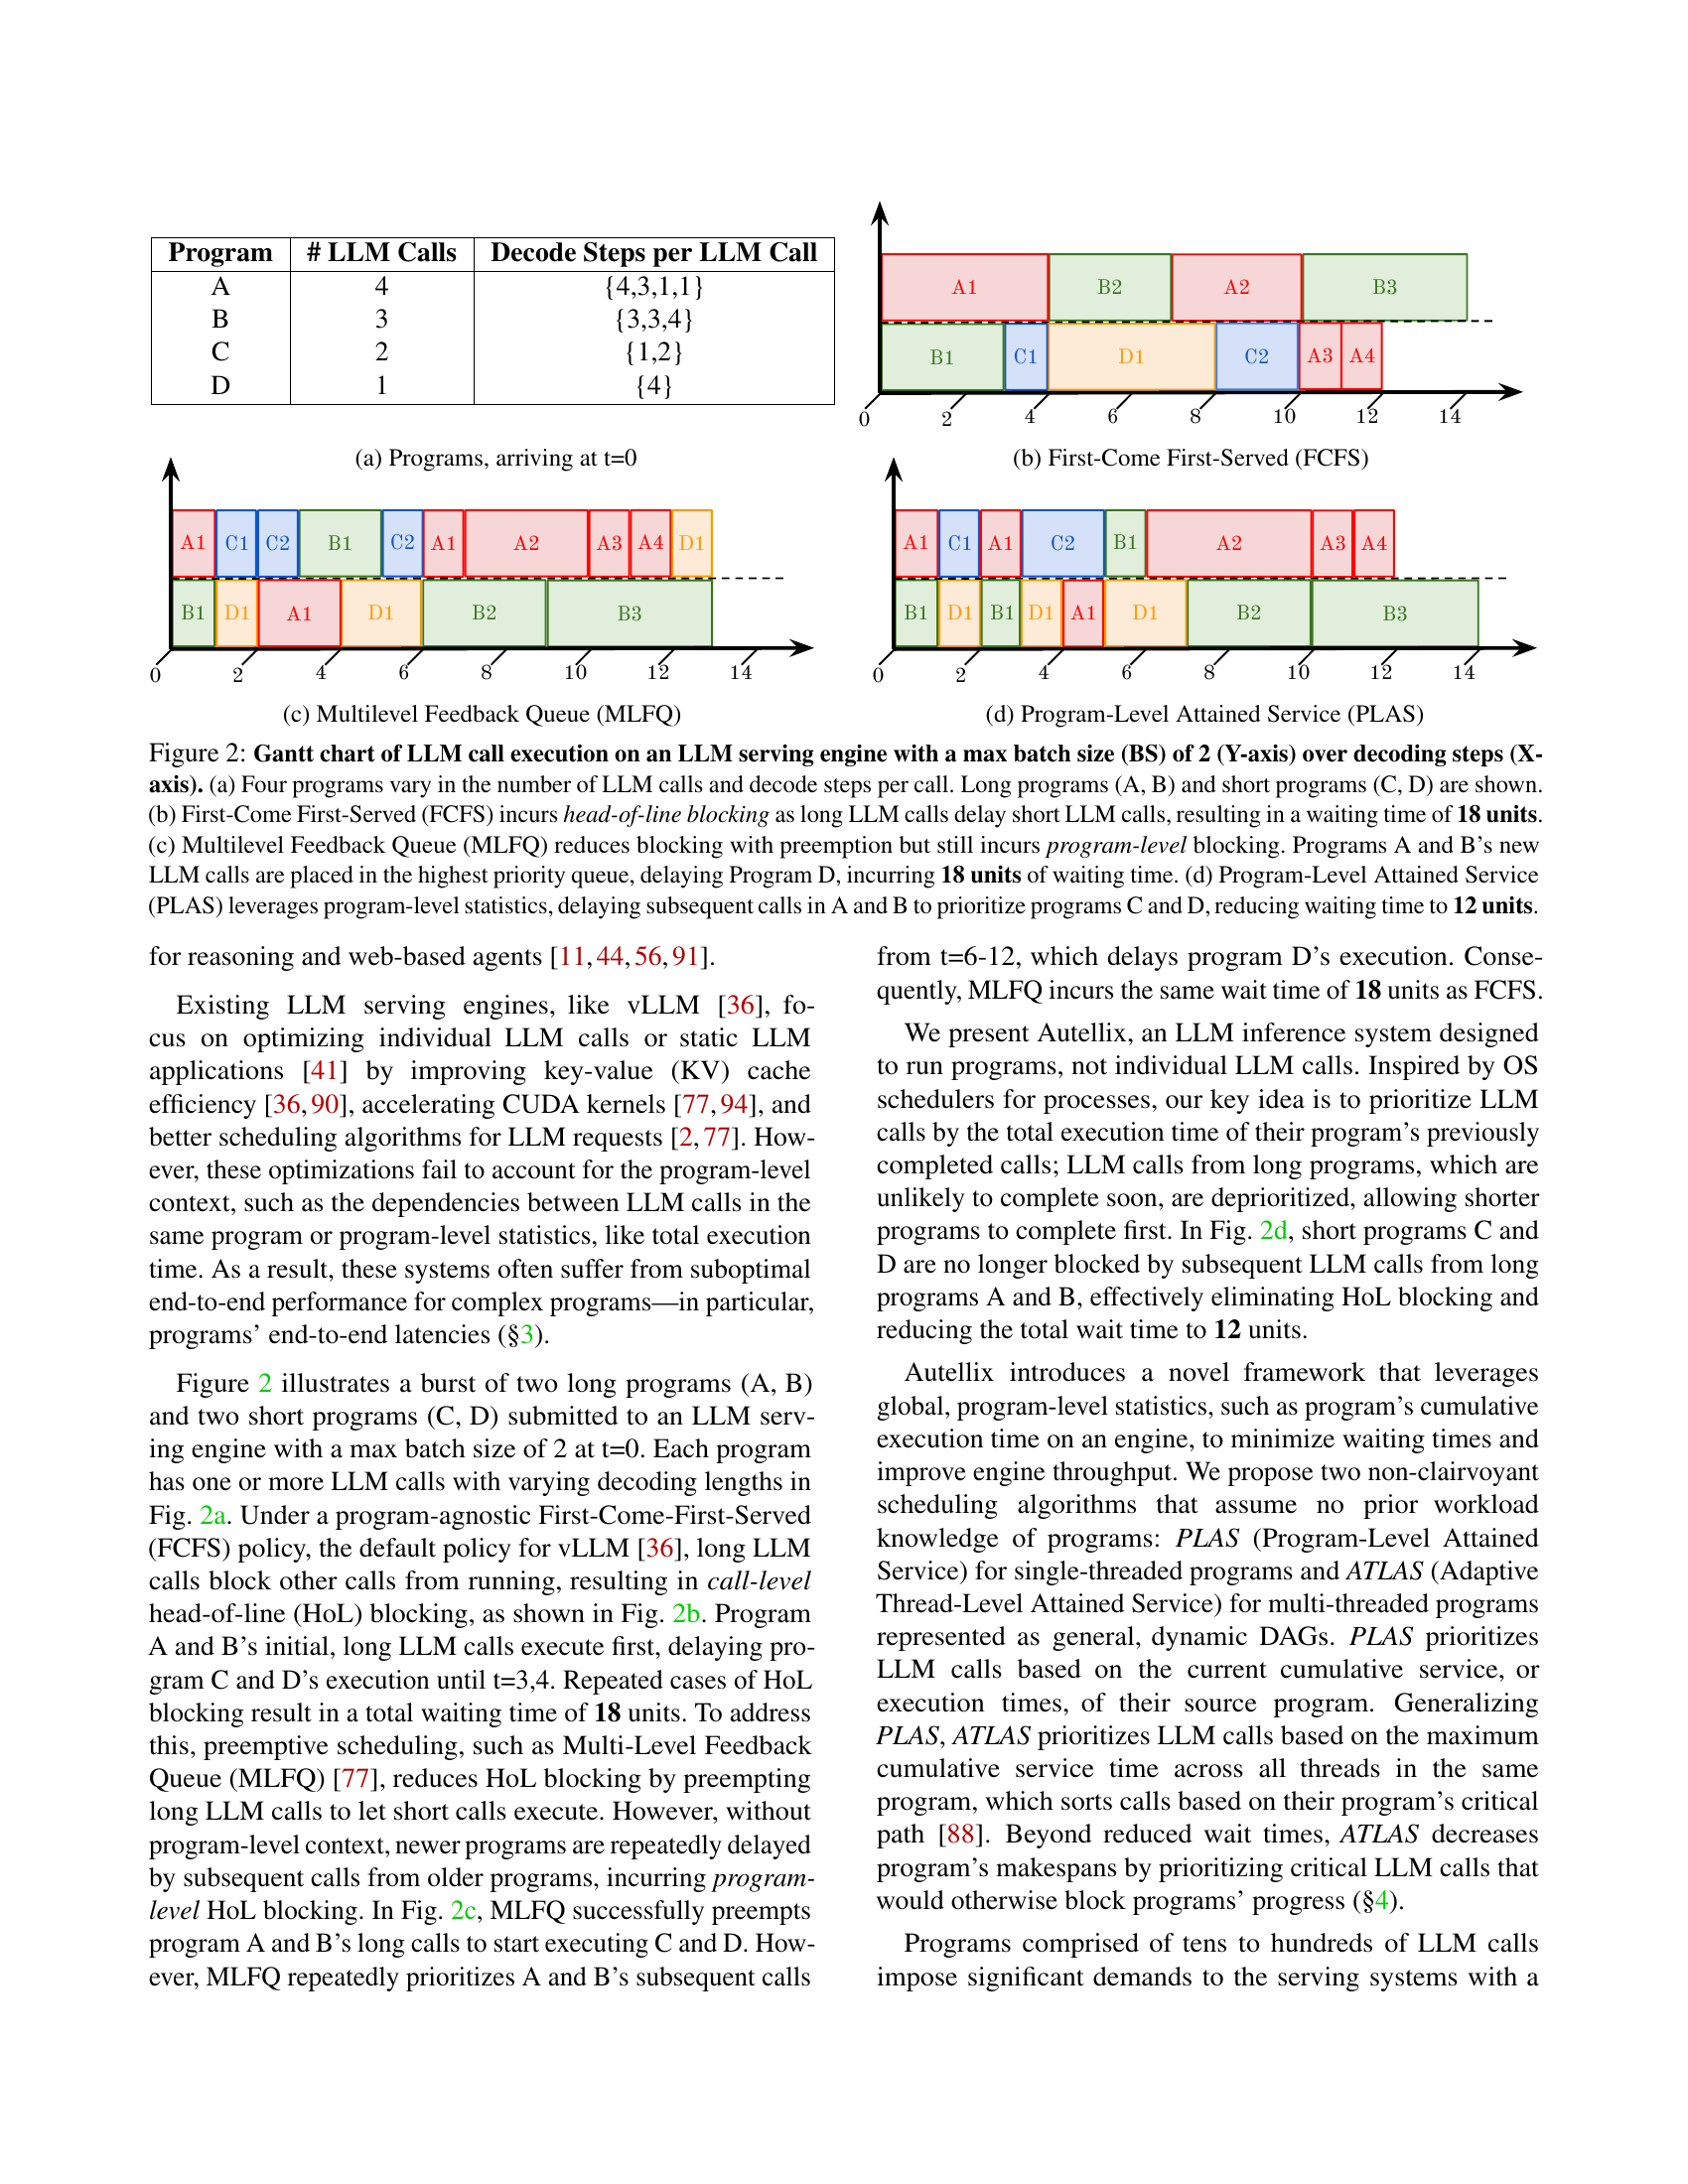
🔼 This figure shows the arrival of four different programs at time t=0. Each program consists of a different number of LLM calls, and the number of decode steps per LLM call also varies among programs. This illustrates the diversity in workloads that an LLM serving engine needs to handle.
read the caption
(a) Programs, arriving at t=0

🔼 This Gantt chart visualizes the execution of four programs (A, B, C, D) with varying numbers of LLM calls and decoding steps per call, under a First-Come, First-Served (FCFS) scheduling policy. The chart demonstrates how longer programs (A and B) block the execution of shorter programs (C and D) due to head-of-line (HOL) blocking, resulting in significant waiting times. This illustrates a key performance challenge that the paper addresses: program-level blocking.
read the caption
(b) First-Come First-Served (FCFS)

🔼 This Gantt chart illustrates the execution of LLM calls from four programs (A, B, C, D) with varying numbers of calls and decode steps per call, under the Multilevel Feedback Queue (MLFQ) scheduling algorithm. MLFQ is a preemptive scheduling algorithm that prioritizes shorter tasks. In this figure, we observe that although MLFQ successfully preempts the long calls from programs A and B to allow the execution of short calls from programs C and D, it still incurs program-level blocking due to repeatedly prioritizing the new calls from programs A and B. This results in a total waiting time of 18 units, same as FCFS, showing that preemption alone without considering program-level context is not enough to solve the head-of-line blocking problem.
read the caption
(c) Multilevel Feedback Queue (MLFQ)

🔼 This Gantt chart illustrates the execution of LLM calls from four programs (A, B, C, D) with varying lengths and decode steps, using Program-Level Attained Service (PLAS). Unlike First-Come, First-Served (FCFS) and Multilevel Feedback Queue (MLFQ) scheduling, PLAS prioritizes LLM calls based on the program’s previously completed calls. This addresses head-of-line blocking at both individual LLM request and program levels, enabling short programs to complete faster. In this example, PLAS prioritizes programs C and D’s calls over A and B’s resulting in a total wait time of 12 units compared to 18 units for FCFS and MLFQ.
read the caption
(d) Program-Level Attained Service (PLAS)

🔼 This figure demonstrates how different scheduling algorithms handle LLM call execution within an LLM serving engine. Four programs with varying numbers of LLM calls and decode steps are introduced. (a) shows the program structure. (b) shows the First-Come First-Served (FCFS) algorithm, where long calls block short calls, resulting in 18 units of waiting time. (c) depicts Multilevel Feedback Queue (MLFQ), which reduces blocking through preemption but still suffers from program-level blocking, with a waiting time of 18 units. (d) illustrates Program-Level Attained Service (PLAS), which uses program-level statistics to prioritize calls and reduce waiting time to 12 units.
read the caption
Figure 2: Gantt chart of LLM call execution on an LLM serving engine with a max batch size (BS) of 2 (Y-axis) over decoding steps (X-axis). (a) Four programs vary in the number of LLM calls and decode steps per call. Long programs (A, B) and short programs (C, D) are shown. (b) First-Come First-Served (FCFS) incurs head-of-line blocking as long LLM calls delay short LLM calls, resulting in a waiting time of 18 units. (c) Multilevel Feedback Queue (MLFQ) reduces blocking with preemption but still incurs program-level blocking. Programs A and B’s new LLM calls are placed in the highest priority queue, delaying Program D, incurring 18 units of waiting time. (d) Program-Level Attained Service (PLAS) leverages program-level statistics, delaying subsequent calls in A and B to prioritize programs C and D, reducing waiting time to 12 units.

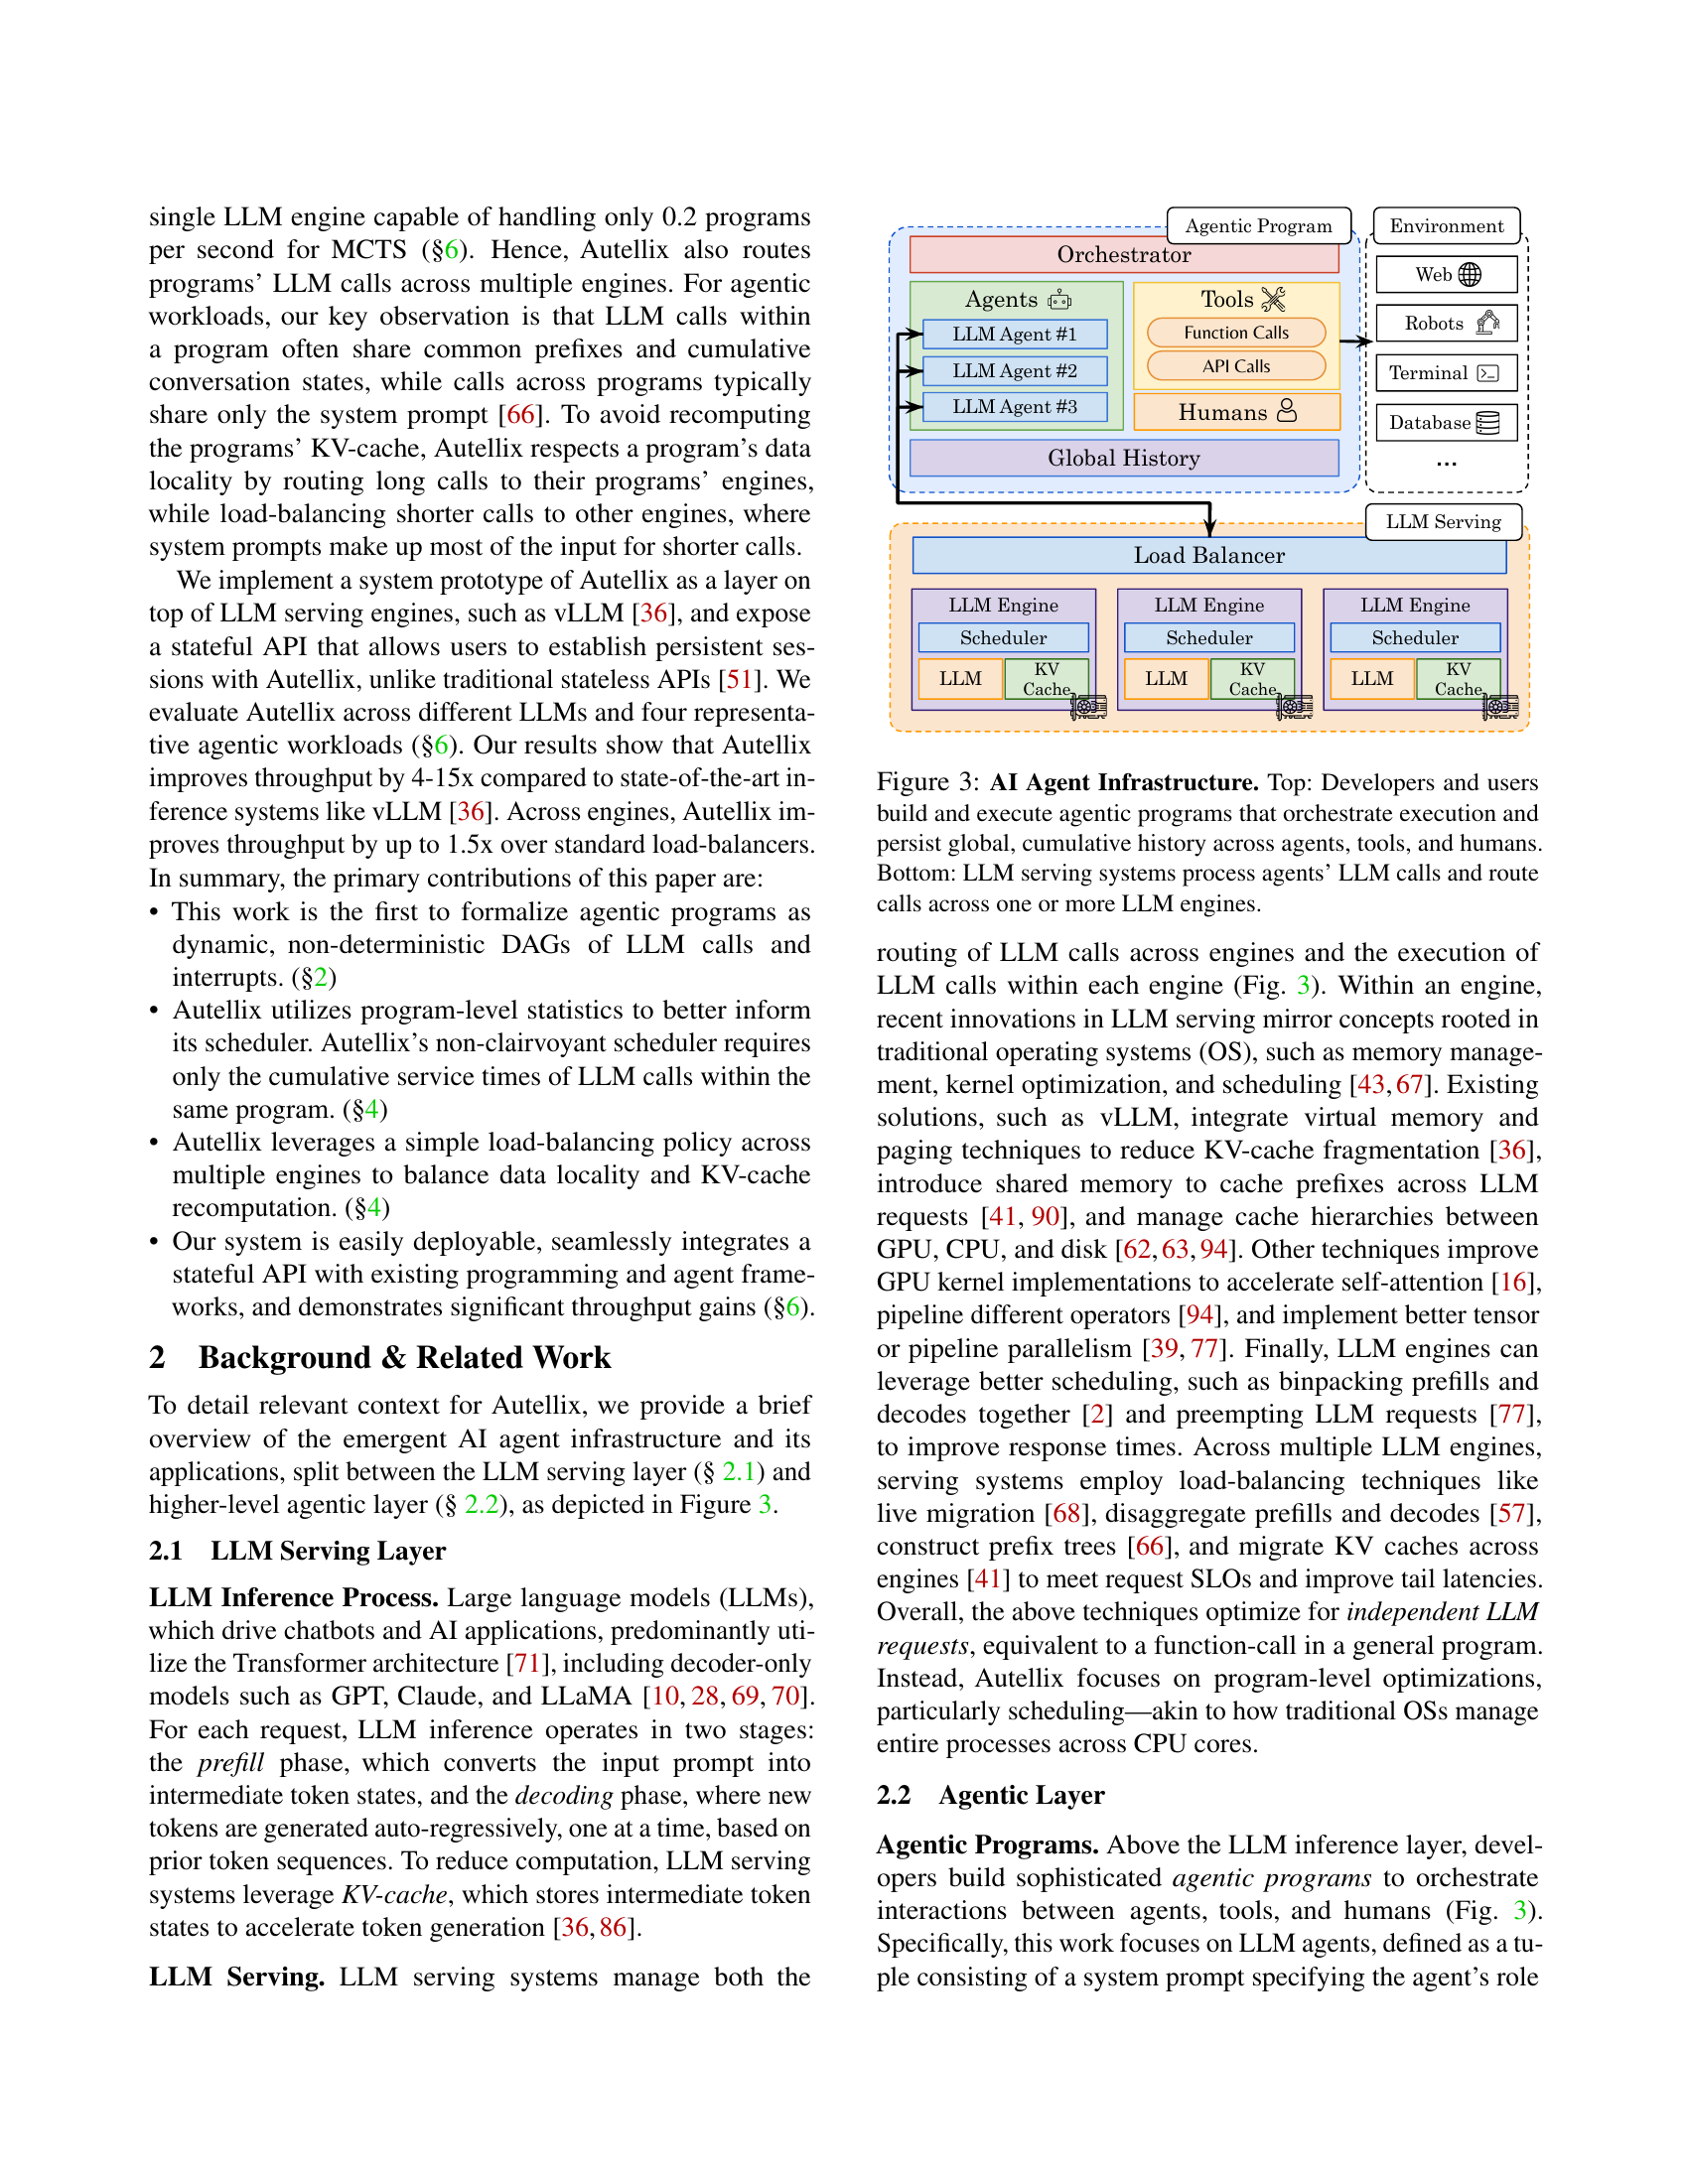
🔼 This figure illustrates the architecture of an AI agent infrastructure, showing how developers and users interact with the system. The top half depicts the high-level interaction, where users create agentic programs (dynamic workflows involving multiple agents, tools and human interaction). These programs orchestrate the execution of tasks, maintaining a global history of actions and outputs. The bottom half shows the LLM serving layer, responsible for processing the LLM calls generated by the agentic programs. This layer manages the calls, routing them across multiple LLM engines if needed for efficiency and scalability. This distribution of workload across engines handles the computational demands of the agentic programs, allowing for more concurrent task execution.
read the caption
Figure 3: AI Agent Infrastructure. Top: Developers and users build and execute agentic programs that orchestrate execution and persist global, cumulative history across agents, tools, and humans. Bottom: LLM serving systems process agents’ LLM calls and route calls across one or more LLM engines.

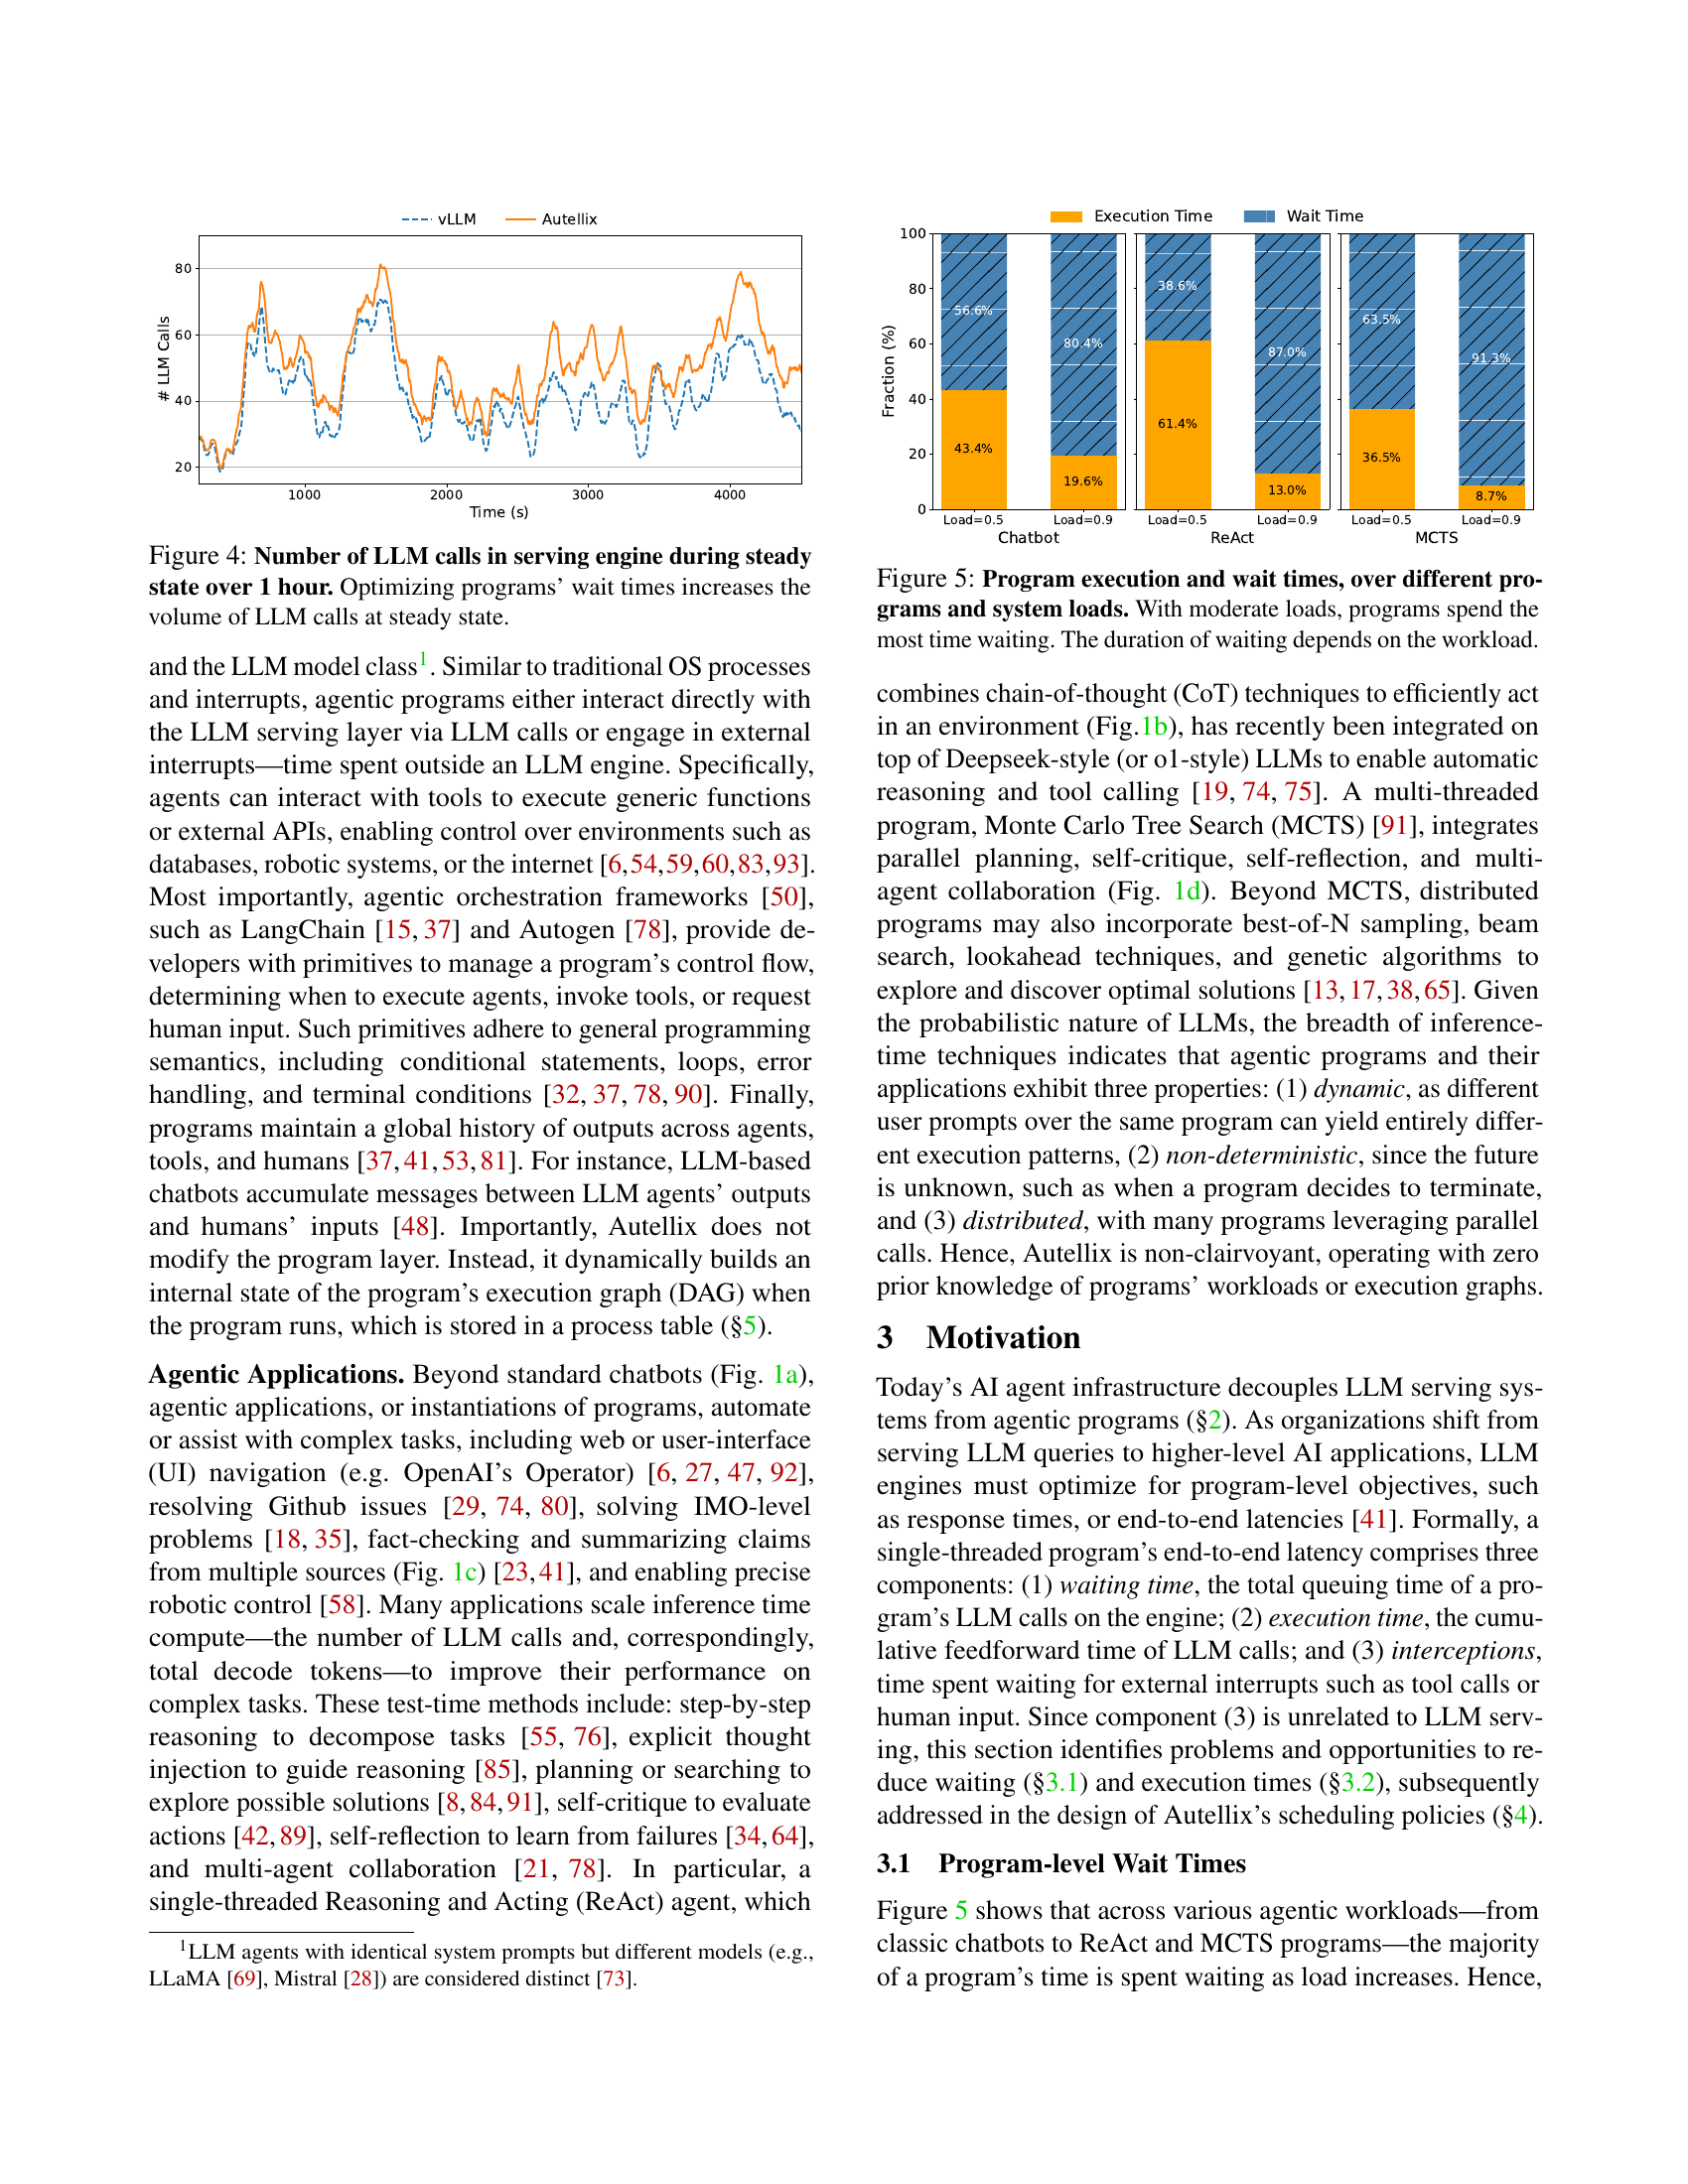
🔼 This figure shows the number of LLM calls processed by the LLM serving engine over an hour, comparing the performance of Autellix with that of the baseline system vLLM. The graph clearly indicates that by optimizing for program wait times, Autellix is able to process a significantly higher number of LLM calls within the same timeframe. This demonstrates that reducing wait times not only improves individual program performance but also boosts the overall throughput of the entire LLM serving system.
read the caption
Figure 4: Number of LLM calls in serving engine during steady state over 1 hour. Optimizing programs’ wait times increases the volume of LLM calls at steady state.

🔼 This figure displays a breakdown of the time spent by different agentic programs (Chatbot, ReAct, MCTS) on program execution versus waiting time, under various system loads. The key takeaway is that under moderate to high system loads, a significant portion of a program’s runtime is spent waiting instead of actively executing LLM calls or interacting with other program components. The specific duration of waiting time varies depending on the characteristics of the program itself.
read the caption
Figure 5: Program execution and wait times, over different programs and system loads. With moderate loads, programs spend the most time waiting. The duration of waiting depends on the workload.

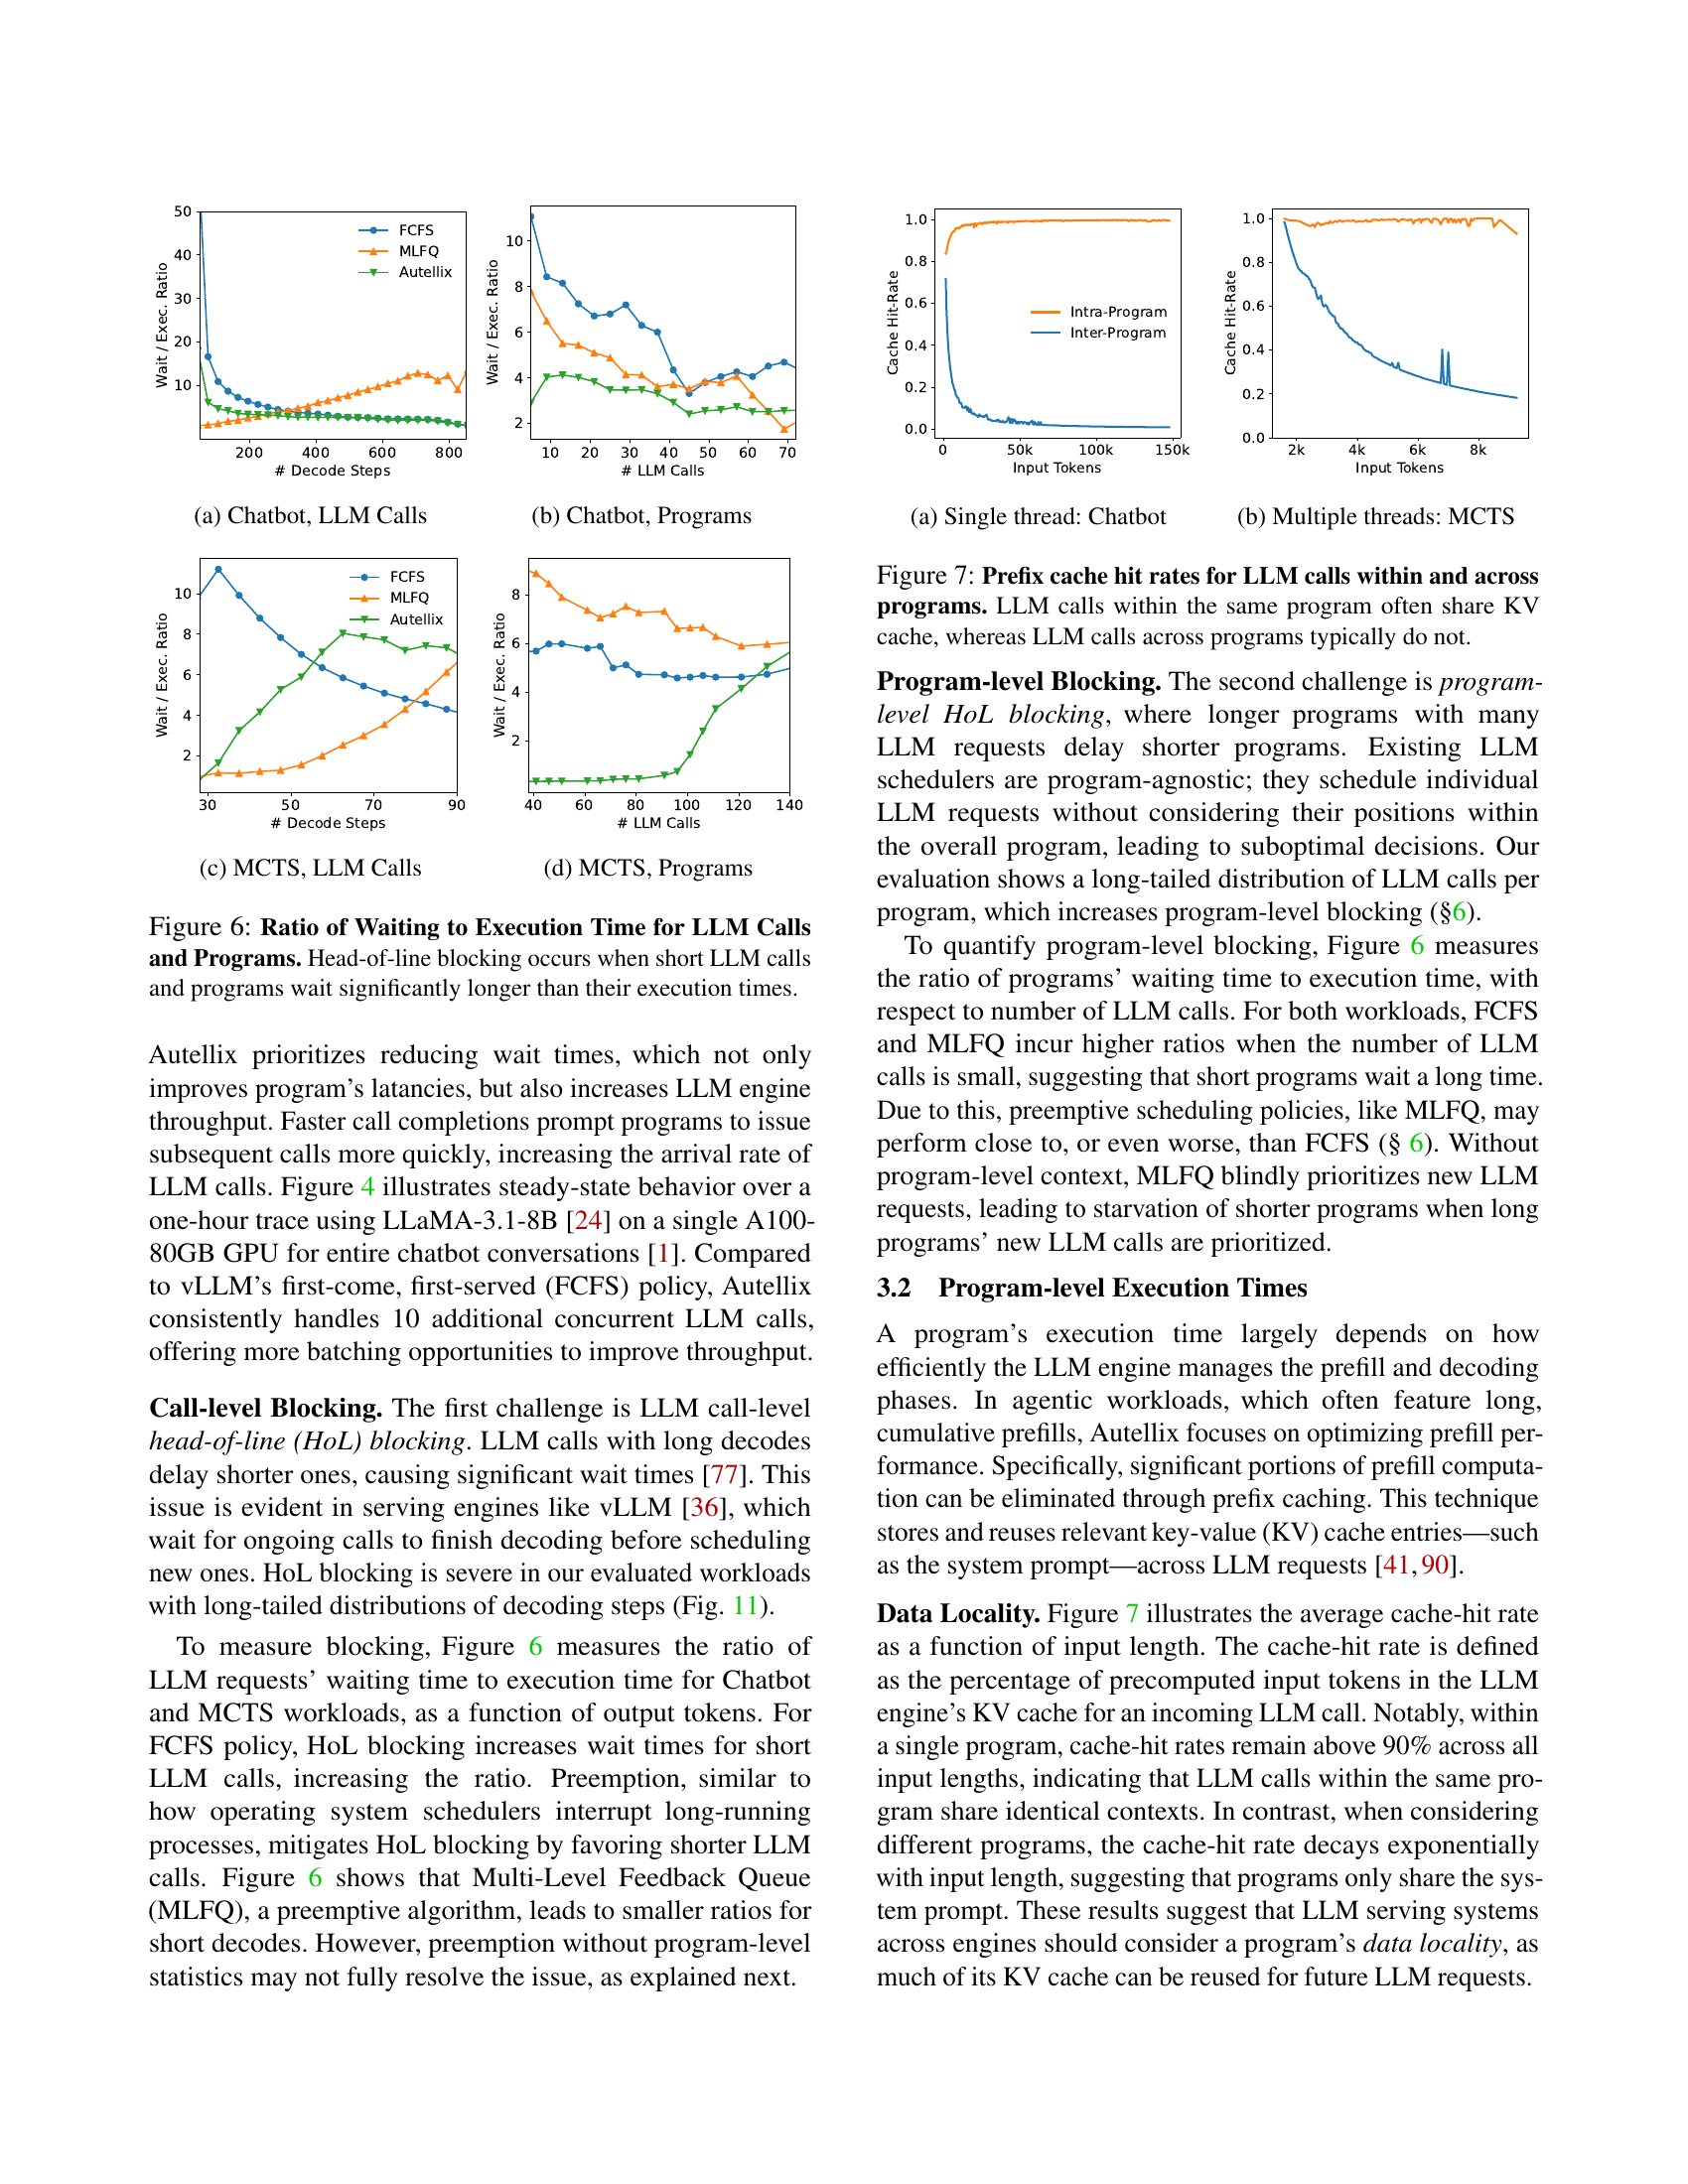
🔼 This figure shows the ratio of waiting time to execution time for LLM calls in a chatbot program as a function of the number of decoding steps. It compares three scheduling policies: First-Come First-Served (FCFS), Multi-Level Feedback Queue (MLFQ), and Autellix. The figure demonstrates that FCFS suffers from significant call-level head-of-line blocking, resulting in long wait times for short LLM calls. MLFQ mitigates this issue through preemption but still experiences significant wait times. Autellix achieves the lowest wait times by effectively reducing both call-level and program-level head-of-line blocking.
read the caption
(a) Chatbot, LLM Calls

🔼 This figure shows the ratio of waiting time to execution time for chatbot programs, plotted against the number of LLM calls. It demonstrates the impact of different scheduling algorithms (FCFS, MLFQ, Autellix) on program wait times. Autellix effectively reduces wait times, improving program latency and throughput.
read the caption
(b) Chatbot, Programs

🔼 This figure shows a Gantt chart illustrating the execution of LLM calls within a Monte Carlo Tree Search (MCTS) program. The chart specifically focuses on LLM calls, illustrating how call-level head-of-line (HoL) blocking and program-level HoL blocking impact the execution time and waiting time of different calls. The x-axis represents decoding steps, and the y-axis represents different LLM calls, grouped by program. The chart compares three scheduling algorithms: First-Come First-Served (FCFS), Multilevel Feedback Queue (MLFQ), and Autellix’s Program-Level Attained Service (PLAS), visualizing the effects of each scheduler on waiting times and execution order.
read the caption
(c) MCTS, LLM Calls

🔼 This figure shows a Gantt chart illustrating the execution of LLM calls in Monte Carlo Tree Search (MCTS) programs under different scheduling policies. It highlights how program-level head-of-line (HoL) blocking affects program execution time and latency. The chart compares the performance of the First-Come-First-Served (FCFS) policy, the Multilevel Feedback Queue (MLFQ) algorithm, and the proposed Program-Level Attained Service (PLAS) algorithm. The chart visualizes the waiting and execution times of various LLM calls within multiple MCTS programs, demonstrating how PLAS effectively prioritizes LLM calls to reduce wait times and enhance throughput.
read the caption
(d) MCTS, Programs

🔼 This figure displays the ratio of waiting time to execution time for both individual LLM calls and entire programs. It demonstrates the impact of head-of-line (HOL) blocking. HOL blocking occurs when longer calls or programs delay the execution of shorter ones, leading to disproportionately long wait times for the shorter tasks. The figure uses two workloads (Chatbot and MCTS) to illustrate how the ratio of waiting time to execution time changes with the number of LLM calls and the number of decoding steps. It compares the performance of three scheduling policies: First-Come, First-Served (FCFS), Multi-Level Feedback Queue (MLFQ), and Autellix (the proposed system). The results show that Autellix is significantly more effective at reducing HOL blocking and therefore improving wait times compared to the other two scheduling algorithms.
read the caption
Figure 6: Ratio of Waiting to Execution Time for LLM Calls and Programs. Head-of-line blocking occurs when short LLM calls and programs wait significantly longer than their execution times.

🔼 This figure shows the cache hit rates for LLM calls within and across programs in a single-threaded Chatbot program. It illustrates how LLM calls within the same program tend to share common prefixes and therefore benefit from cache hits (high cache hit rate), while LLM calls across different programs show significantly lower cache hit rates due to a lack of shared context.
read the caption
(a) Single thread: Chatbot

🔼 This figure shows the Gantt chart of a Monte Carlo Tree Search (MCTS) program with multiple threads. It illustrates how multiple threads concurrently execute LLM calls and interrupts. Each thread represents a separate sequence of LLM calls and tools calls, and the overall program progresses as these threads interact and merge. The figure demonstrates the dynamic, non-deterministic, and concurrent nature of multi-threaded agentic programs.
read the caption
(b) Multiple threads: MCTS

🔼 This figure illustrates the cache hit rates for prefix caching in Large Language Models (LLMs). Prefix caching is a technique to improve efficiency by storing and reusing previously computed results. The figure shows that LLM calls within the same program tend to share a lot of common prefixes, resulting in high cache hit rates. In contrast, LLM calls from different programs typically do not share many common prefixes, leading to lower cache hit rates. This demonstrates the importance of considering the program-level context for optimizing LLM serving systems.
read the caption
Figure 7: Prefix cache hit rates for LLM calls within and across programs. LLM calls within the same program often share KV cache, whereas LLM calls across programs typically do not.

🔼 Autellix’s system architecture consists of a frontend where users run their agentic programs locally. Each program initiates a stateful session with Autellix’s backend, which is responsible for managing the lifecycle of LLM calls. The backend uses a global process table to maintain a record of the status of all running programs. This table provides contextual information to Autellix’s custom load balancer, which distributes the LLM calls across available LLM engines based on various factors like data locality, and to the scheduler, which prioritizes LLM calls to reduce waiting times and improve throughput.
read the caption
Figure 8: Autellix’s system architecture. Users run their programs locally, which initiates a stateful session and submits LLM calls to Autellix’s backend. Autellix leverages a global process table to track sessions and better inform its custom load-balancer and scheduler.

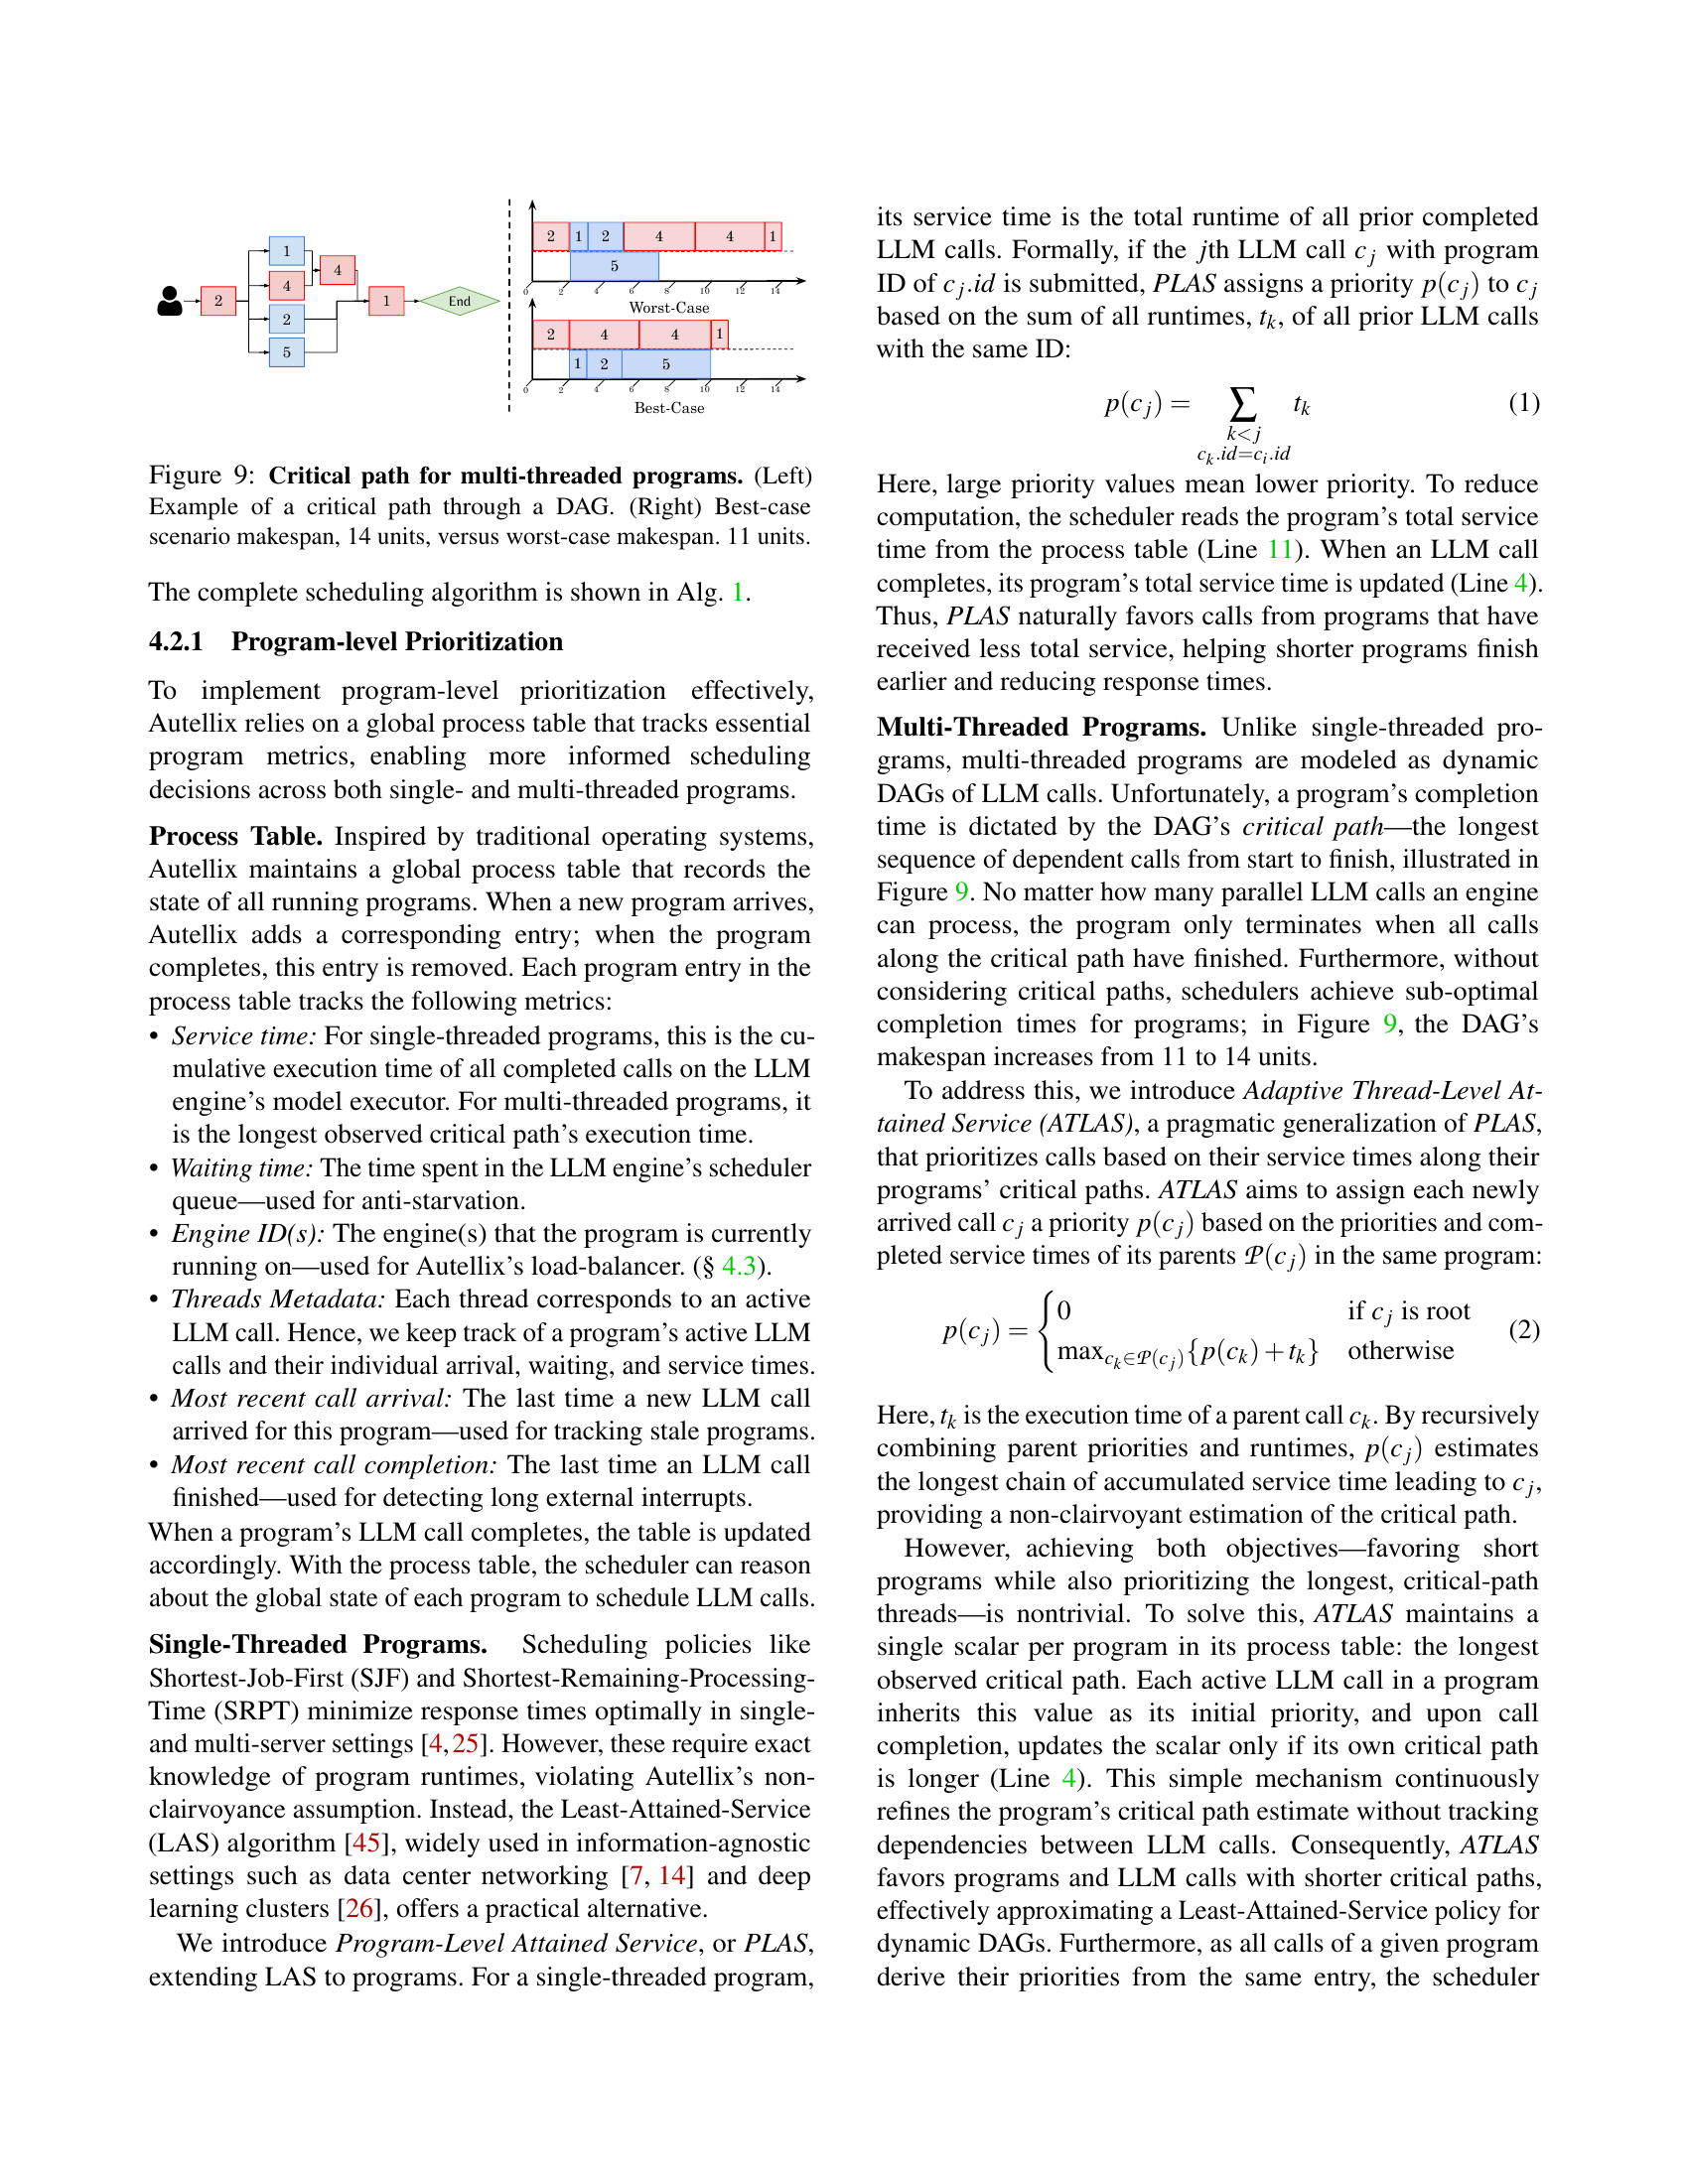
🔼 This figure illustrates the concept of a critical path in multi-threaded programs, which are represented as directed acyclic graphs (DAGs). The left panel shows an example DAG and highlights the critical path, which is the longest sequence of dependent tasks that determines the overall program execution time. The right panel compares the best-case and worst-case makespans (total execution times) for this particular example DAG. The best-case scenario shows a makespan of 14 units, while the worst-case scenario shows a makespan of 11 units. This difference highlights the impact of task scheduling and resource allocation on the overall efficiency of multi-threaded programs.
read the caption
Figure 9: Critical path for multi-threaded programs. (Left) Example of a critical path through a DAG. (Right) Best-case scenario makespan, 14 units, versus worst-case makespan. 11 units.

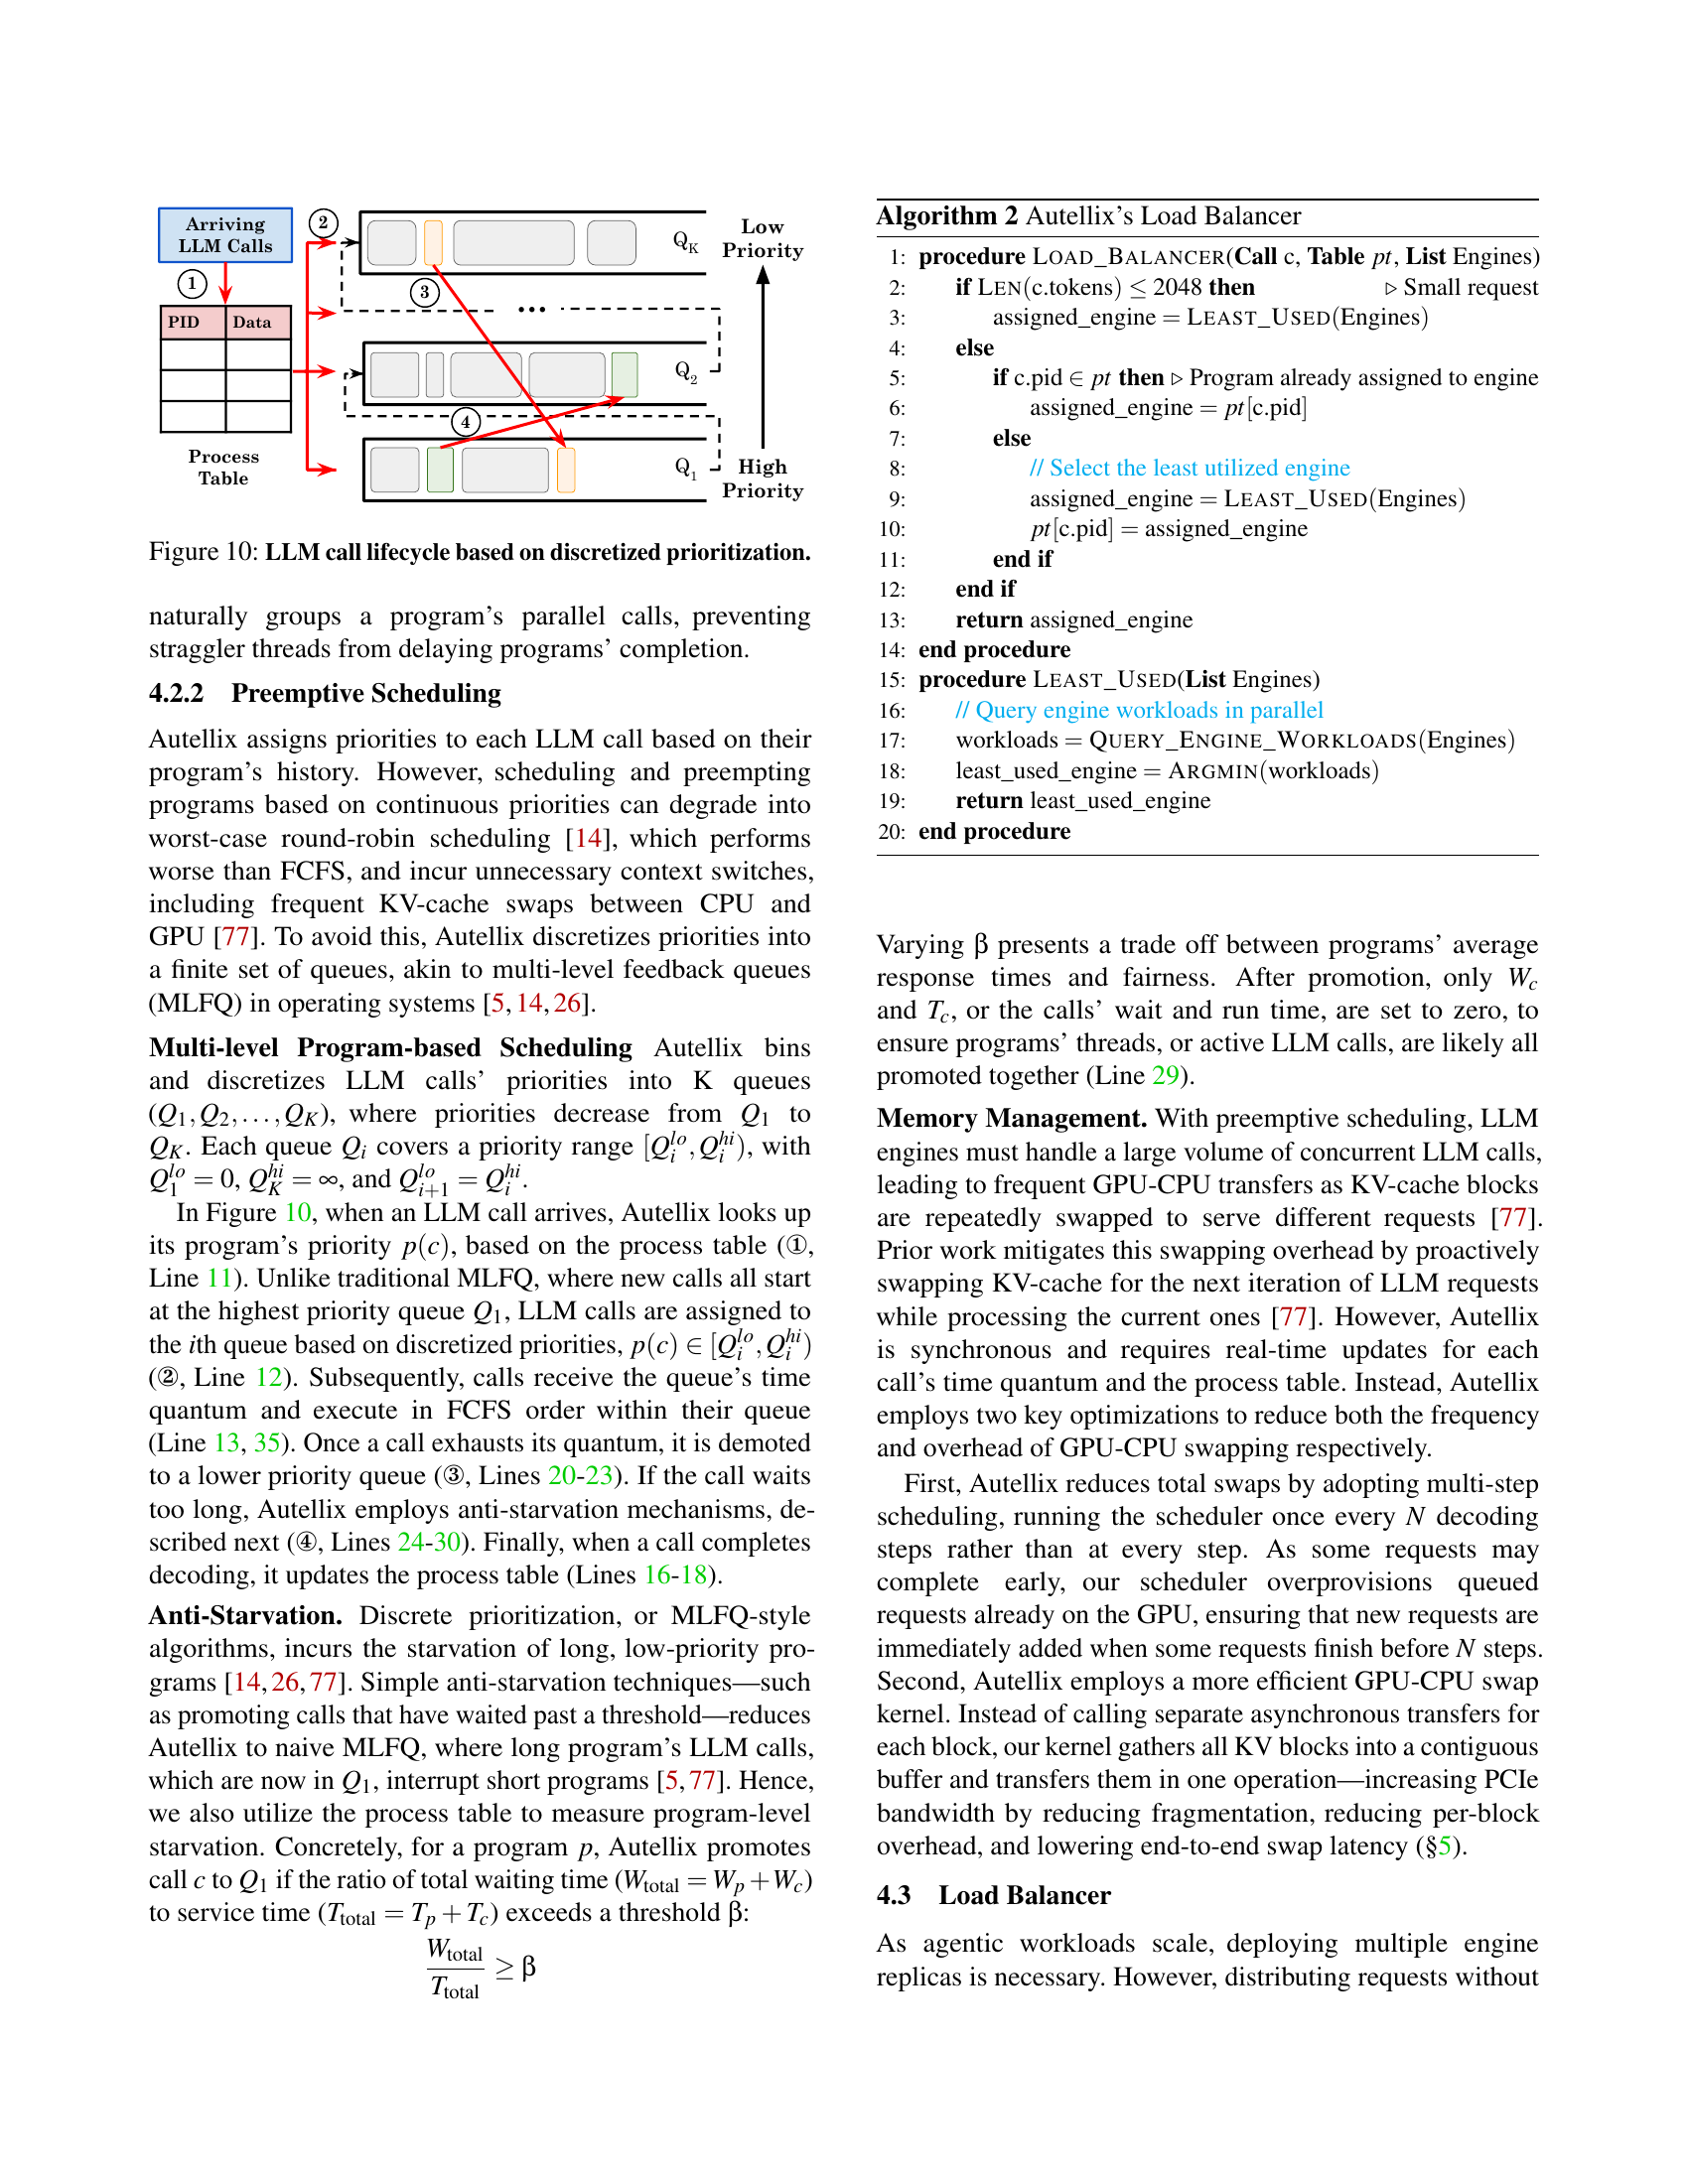
🔼 This figure illustrates the lifecycle of an LLM call within Autellix’s program-aware scheduler. The scheduler uses discretized priorities, assigning LLM calls to different queues (Q1, Q2,…QK) based on their program’s priority, rather than using continuous priority values. Calls within a queue are processed in FCFS (First-Come, First-Served) order. A call that exhausts its time quantum in a queue is demoted to a lower-priority queue, while calls waiting too long are promoted to the highest priority queue via anti-starvation mechanisms. This approach ensures efficient processing of calls while preventing starvation of low-priority programs.
read the caption
Figure 10: LLM call lifecycle based on discretized prioritization.

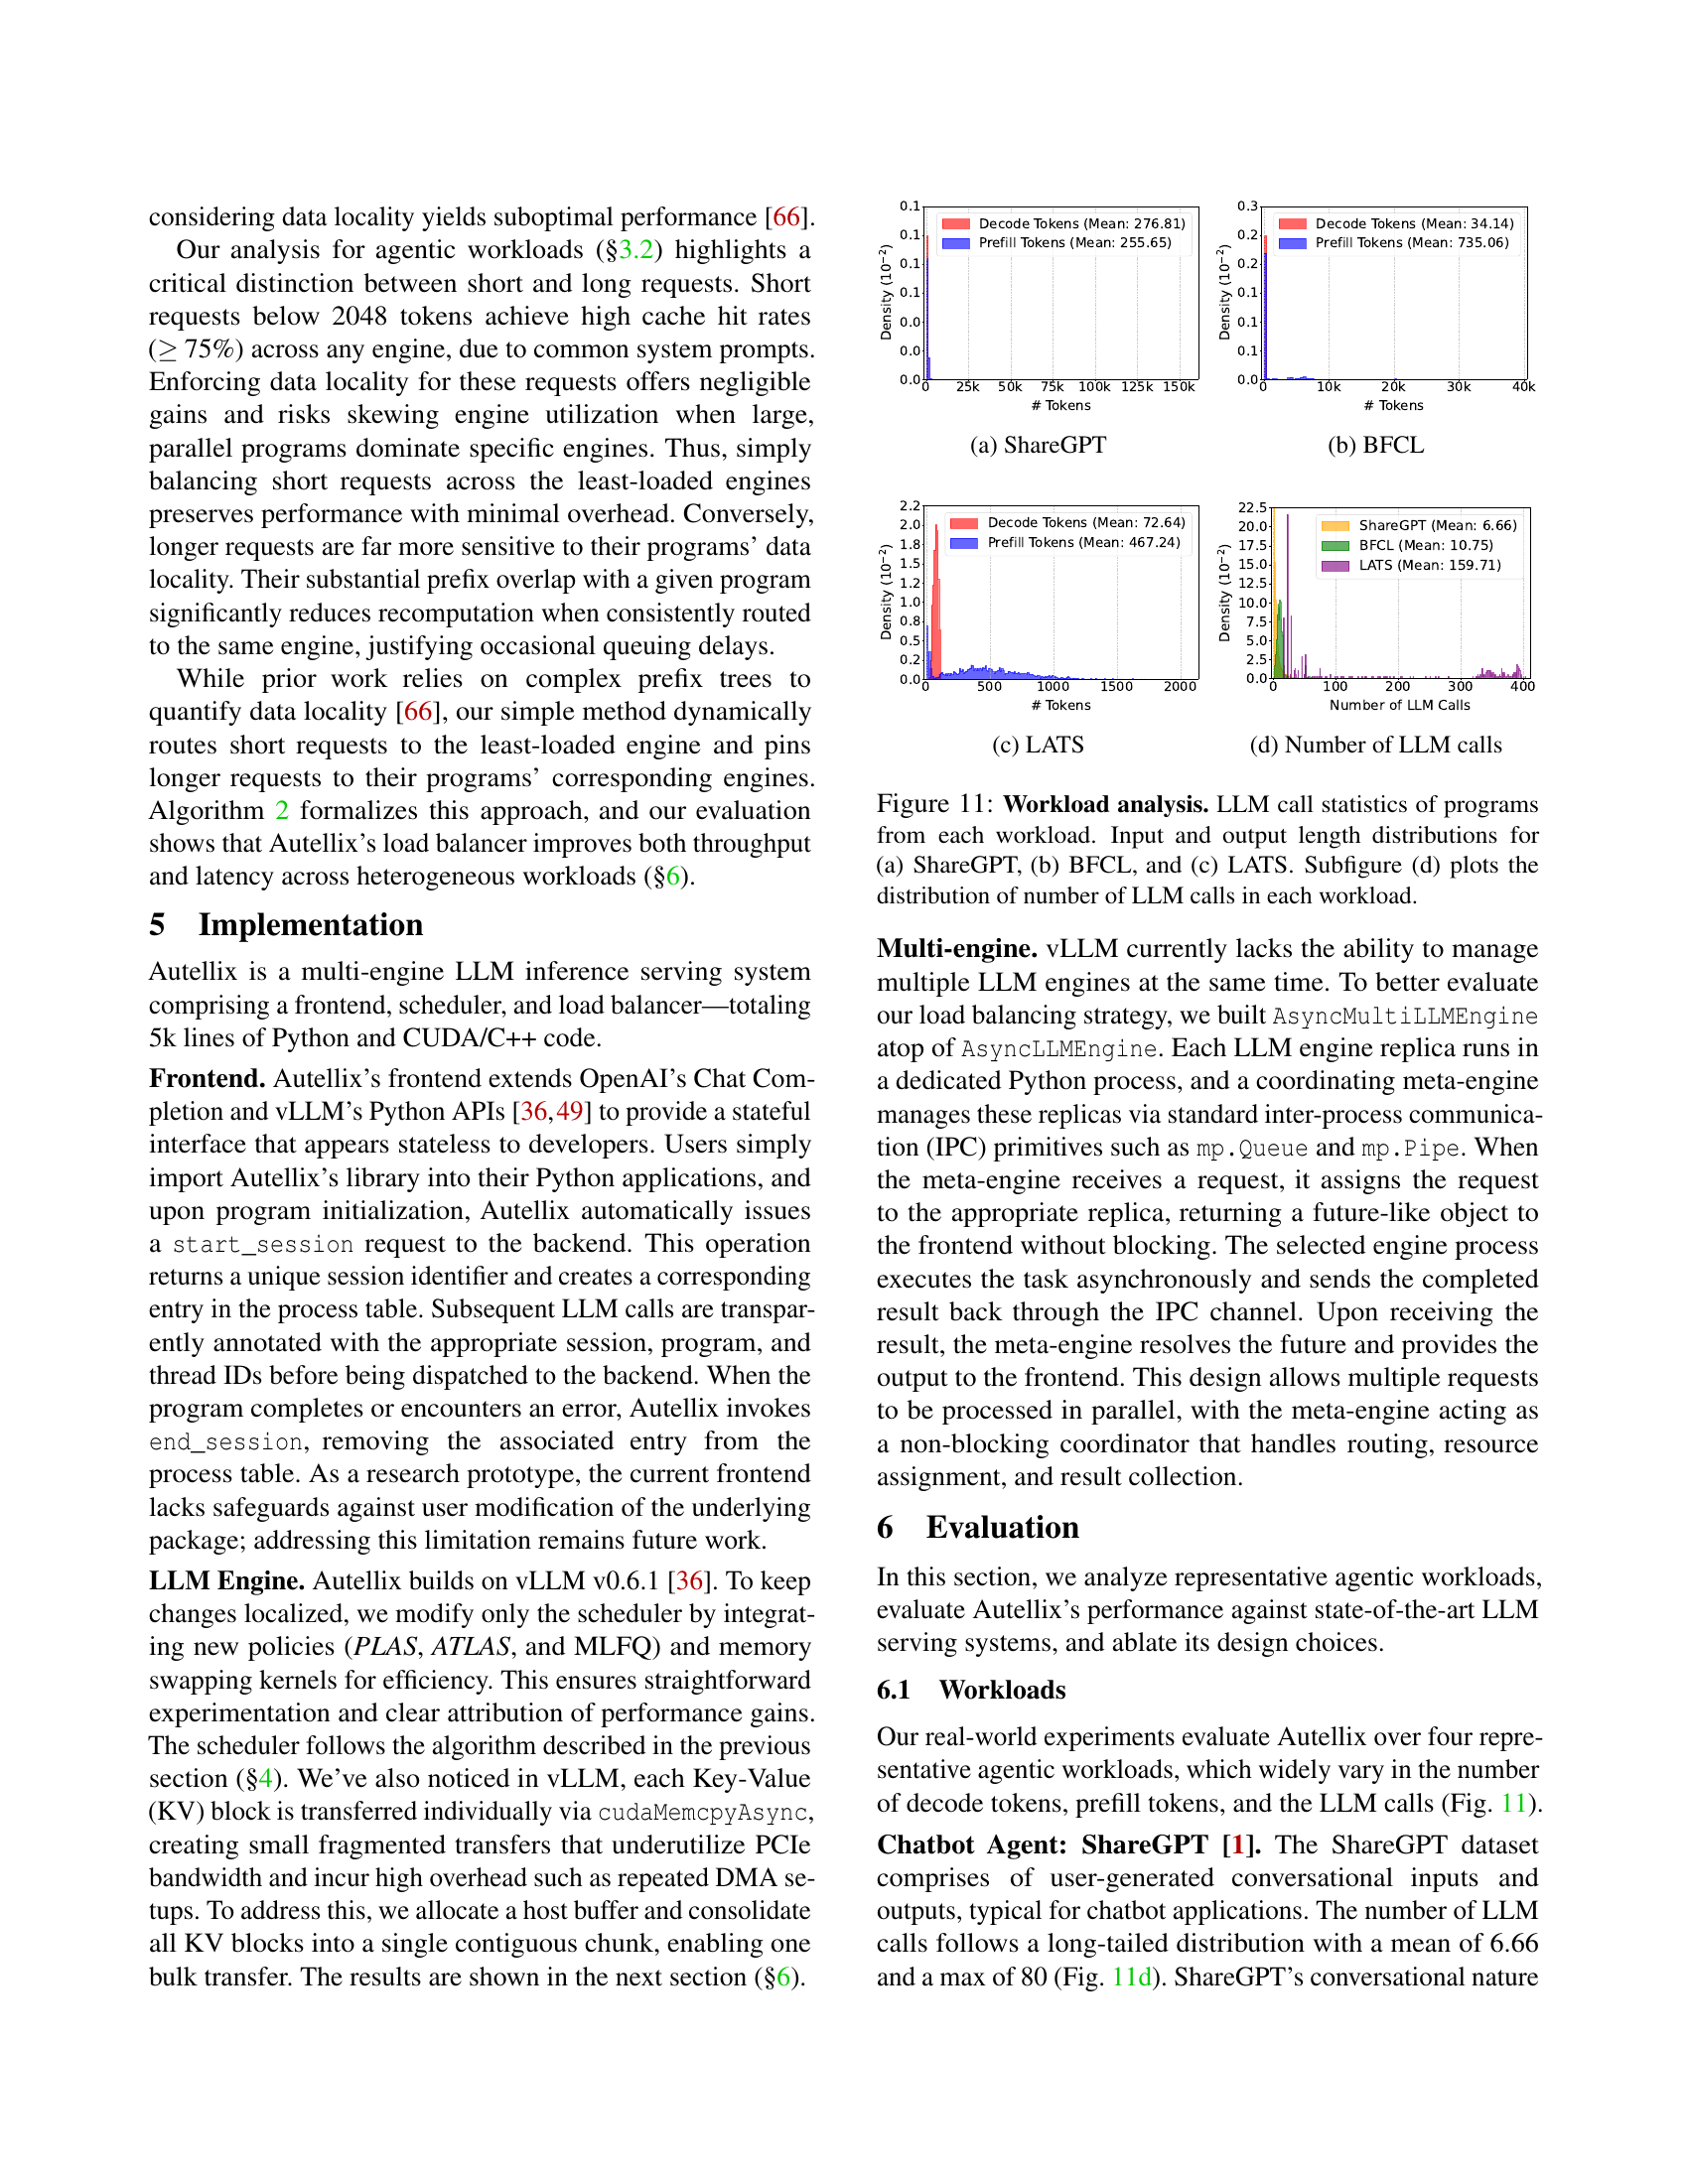
🔼 Figure 11(a) shows the distribution of the number of prefill and decode tokens used in the ShareGPT dataset. The x-axis represents the number of tokens, and the y-axis represents the density of the token counts. The figure helps to illustrate the characteristics of the ShareGPT dataset, showing a heavy-tailed distribution with a larger number of shorter conversations and a smaller number of very long conversations. This distribution is important because it impacts the performance of LLM serving systems, which must handle a wide range of request sizes efficiently.
read the caption
(a) ShareGPT

🔼 This figure (Figure 11(b) in the paper) shows the distribution of prefill and decode tokens for the BFCL (Berkeley Function Calling Leaderboard) workload. The BFCL workload involves multi-turn, multi-step tool usage tasks. The x-axis represents the number of tokens, while the y-axis represents the probability density. The figure demonstrates that BFCL tasks are characterized by long prefill sequences (mean of 735 tokens) compared to relatively short decode sequences (mean of 34 tokens). This is because the prefill phase involves detailed system prompts and tool signatures, while the decoding phase mainly focuses on the agent’s responses.
read the caption
(b) BFCL

🔼 This figure (c) shows the distribution of the number of LLM calls and the distribution of prefill and decode tokens for the LATS (Large Language Model Agents for Tree Search) workload. LATS involves multi-threaded programs with many parallel LLM calls, resulting in a significant number of LLM calls per program and a higher average number of tokens compared to other workloads (ShareGPT and BFCL). These distributions highlight the computationally intensive and iterative nature of MCTS (Monte Carlo Tree Search) which this workload is based on, presenting significant challenges for LLM serving systems.
read the caption
(c) LATS

🔼 This figure is a histogram showing the distribution of the number of LLM calls made by different agentic programs across four different workloads: ShareGPT, BFCL, LATS, and a mixed workload combining all three. The x-axis represents the number of LLM calls, and the y-axis represents the density or frequency of programs with that number of calls. It illustrates the variability in the number of LLM calls required by different agentic programs and the prevalence of long-tailed distributions, where some programs make many more calls than others.
read the caption
(d) Number of LLM calls

🔼 Figure 11 presents a detailed analysis of the characteristics of four different agentic program workloads: ShareGPT, BFCL, LATS, and a mixed workload combining all three. The figure is divided into four subfigures. (a), (b), and (c) show the distributions of input and output token lengths for ShareGPT, BFCL, and LATS, respectively. These distributions reveal the varying lengths of prompts and responses in each dataset. (d) displays the distribution of the total number of LLM calls used within each type of program, highlighting the differences in the complexity and scale of the tasks undertaken.
read the caption
Figure 11: Workload analysis. LLM call statistics of programs from each workload. Input and output length distributions for (a) ShareGPT, (b) BFCL, and (c) LATS. Subfigure (d) plots the distribution of number of LLM calls in each workload.

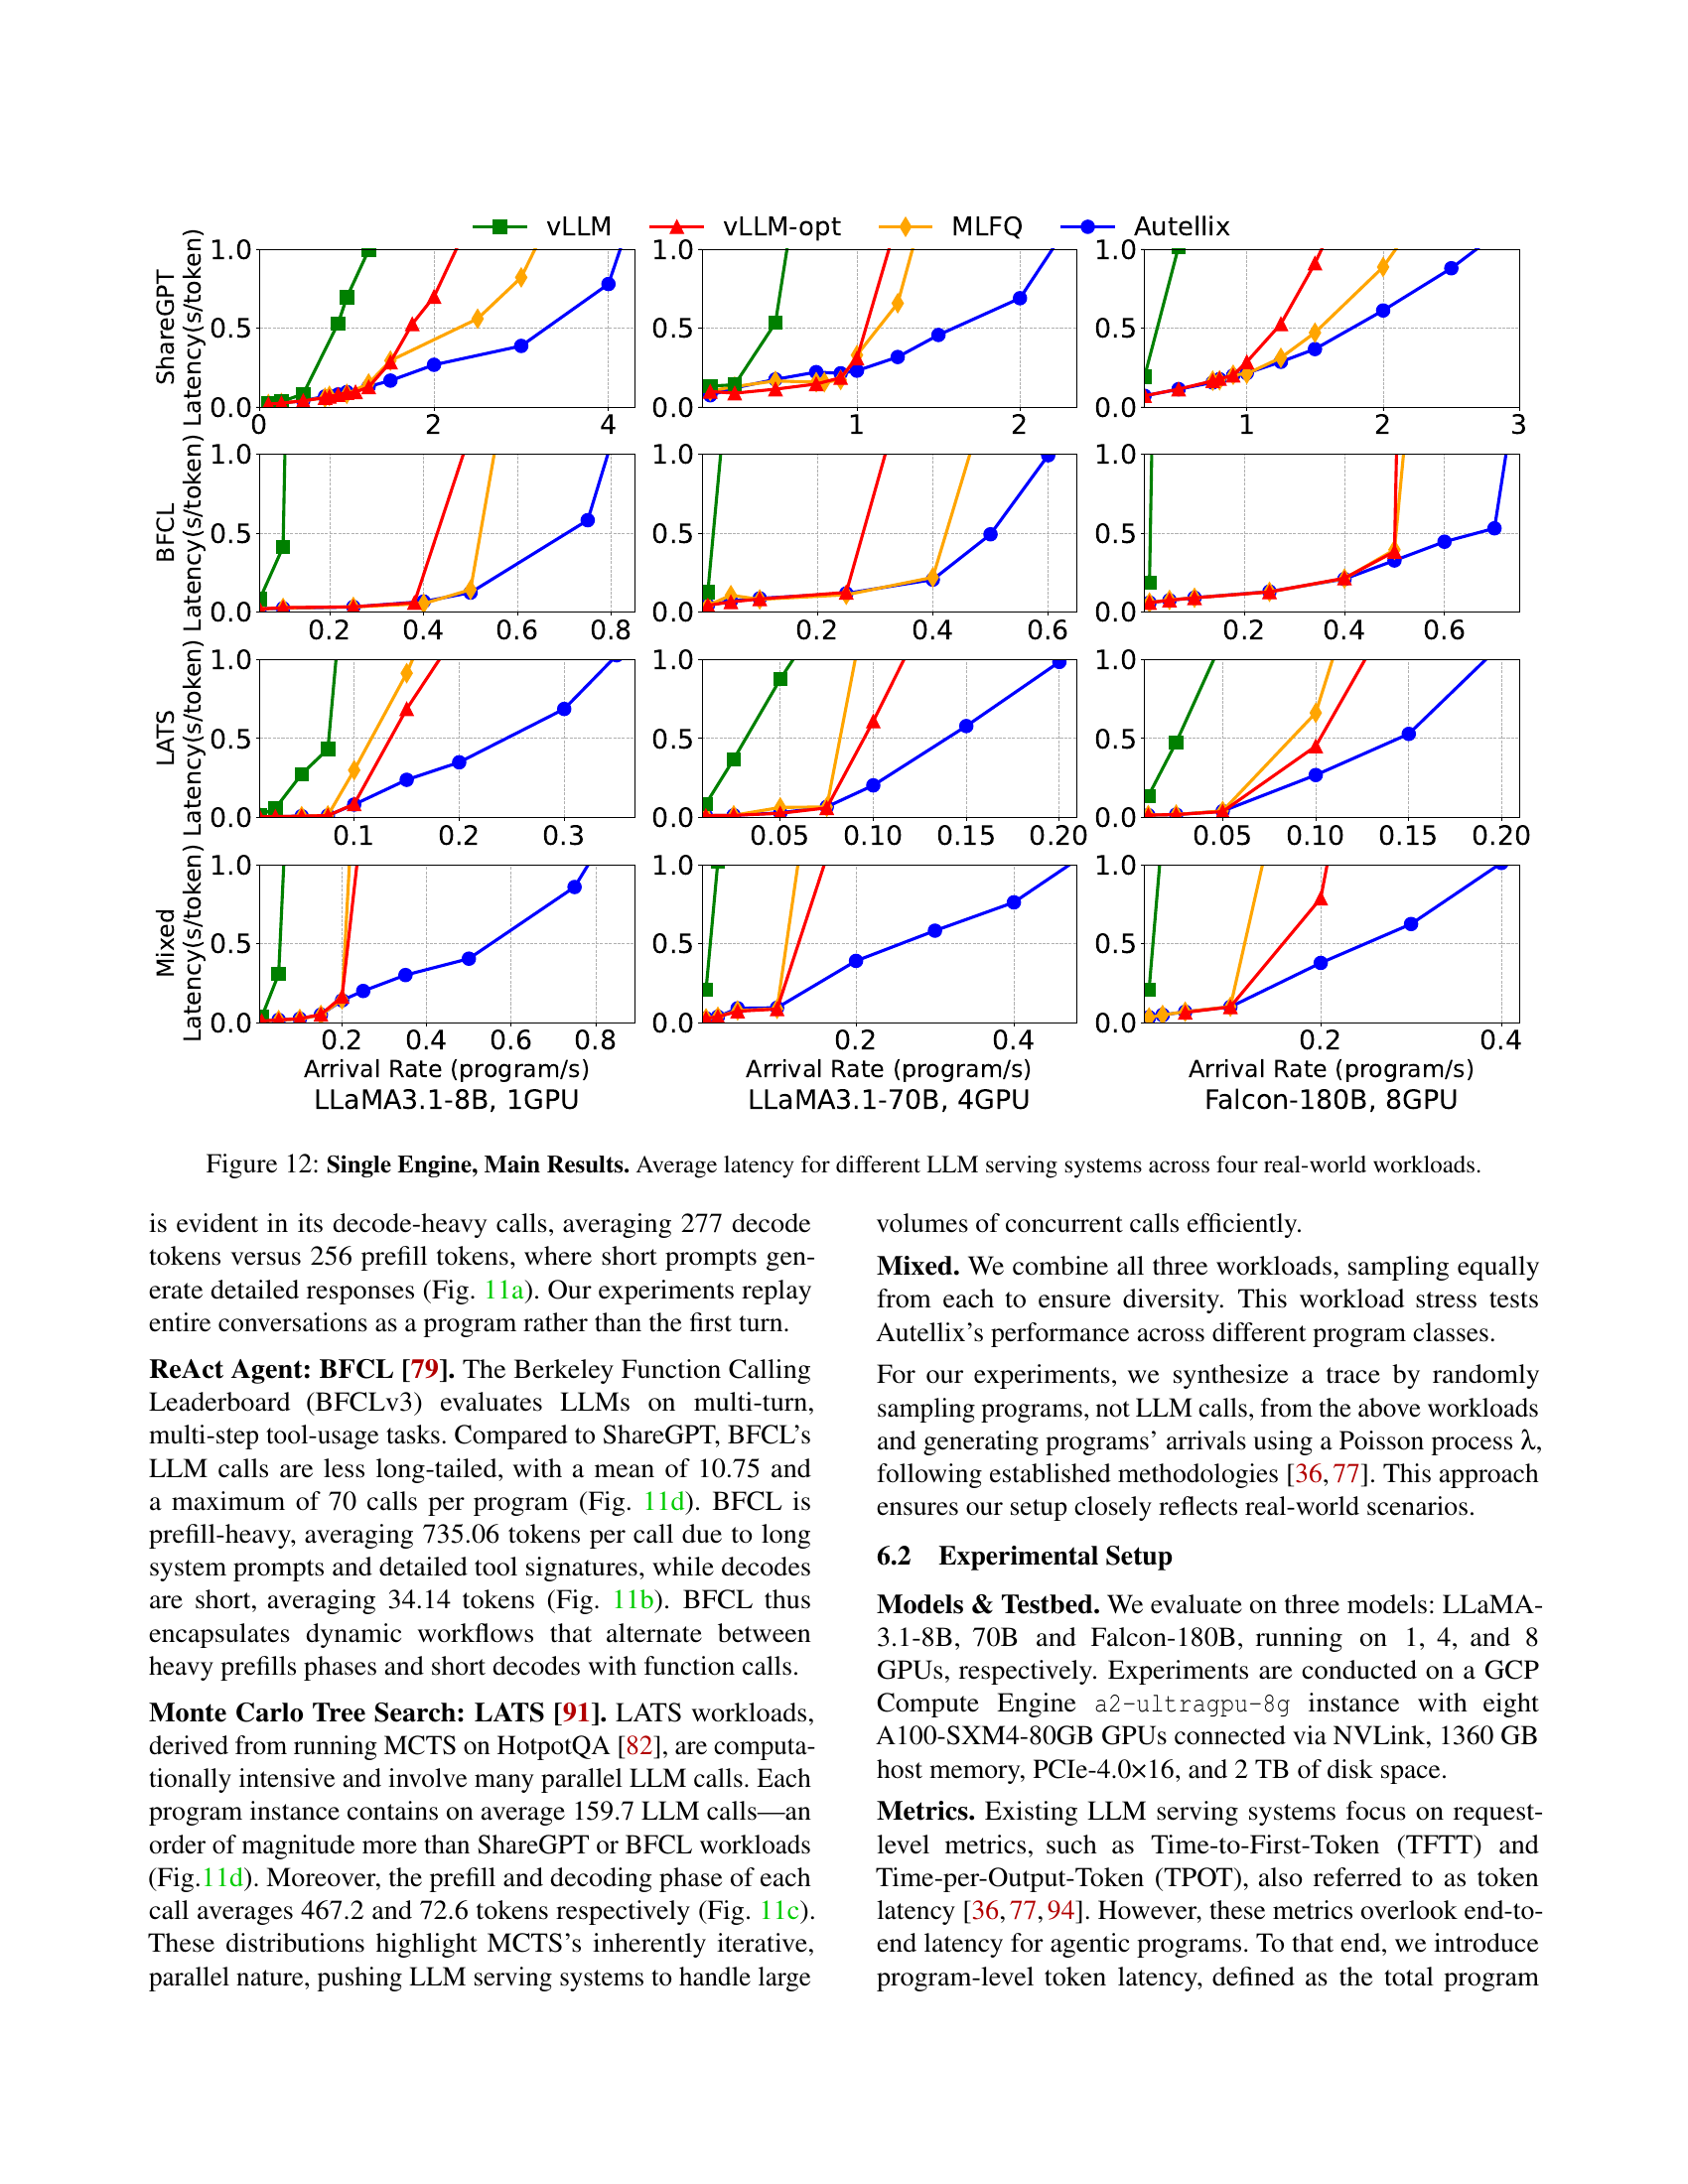
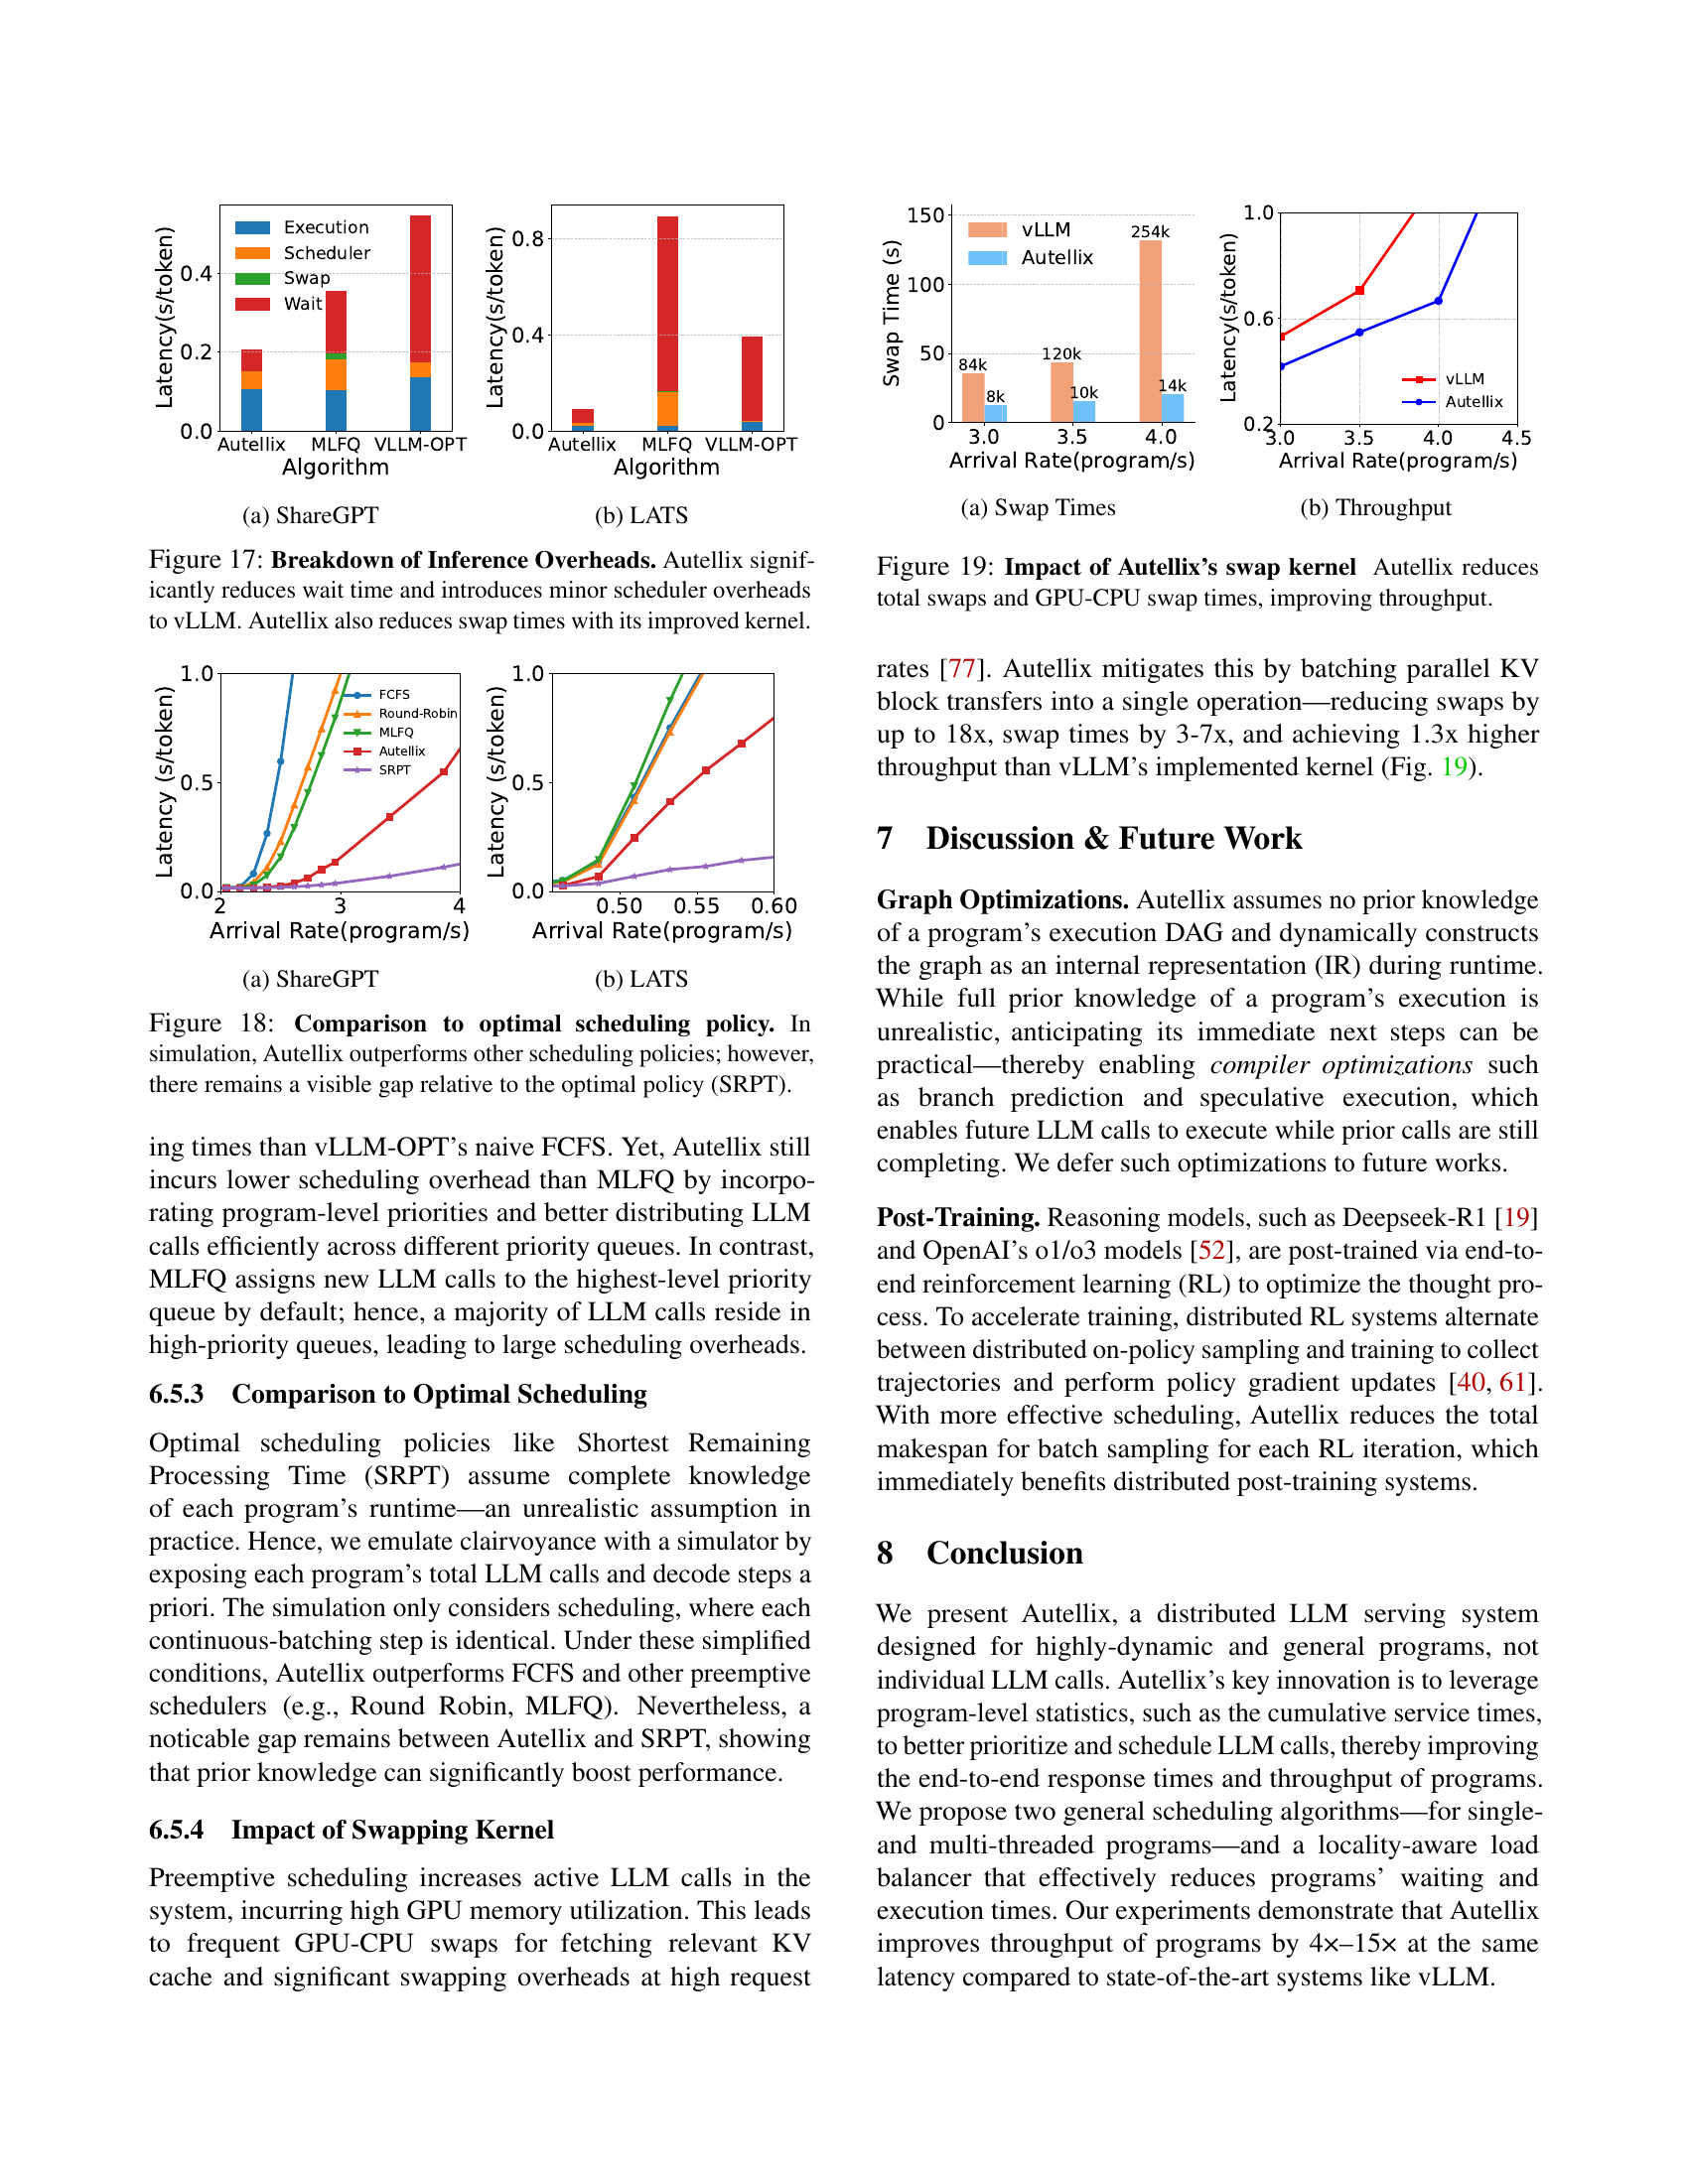
🔼 This figure displays the average latency (in seconds per token) of four different LLM serving systems (vLLM, vLLM-opt, MLFQ, and Autellix) across four distinct real-world workloads (ShareGPT, BFCL, LATS, and Mixed). The x-axis represents the arrival rate of programs (programs per second), and the y-axis represents the average latency. The figure helps to illustrate the performance gains achieved by Autellix compared to the baseline systems under various workload conditions and arrival rates. It shows that Autellix consistently provides lower latency at higher arrival rates.
read the caption
Figure 12: Single Engine, Main Results. Average latency for different LLM serving systems across four real-world workloads.

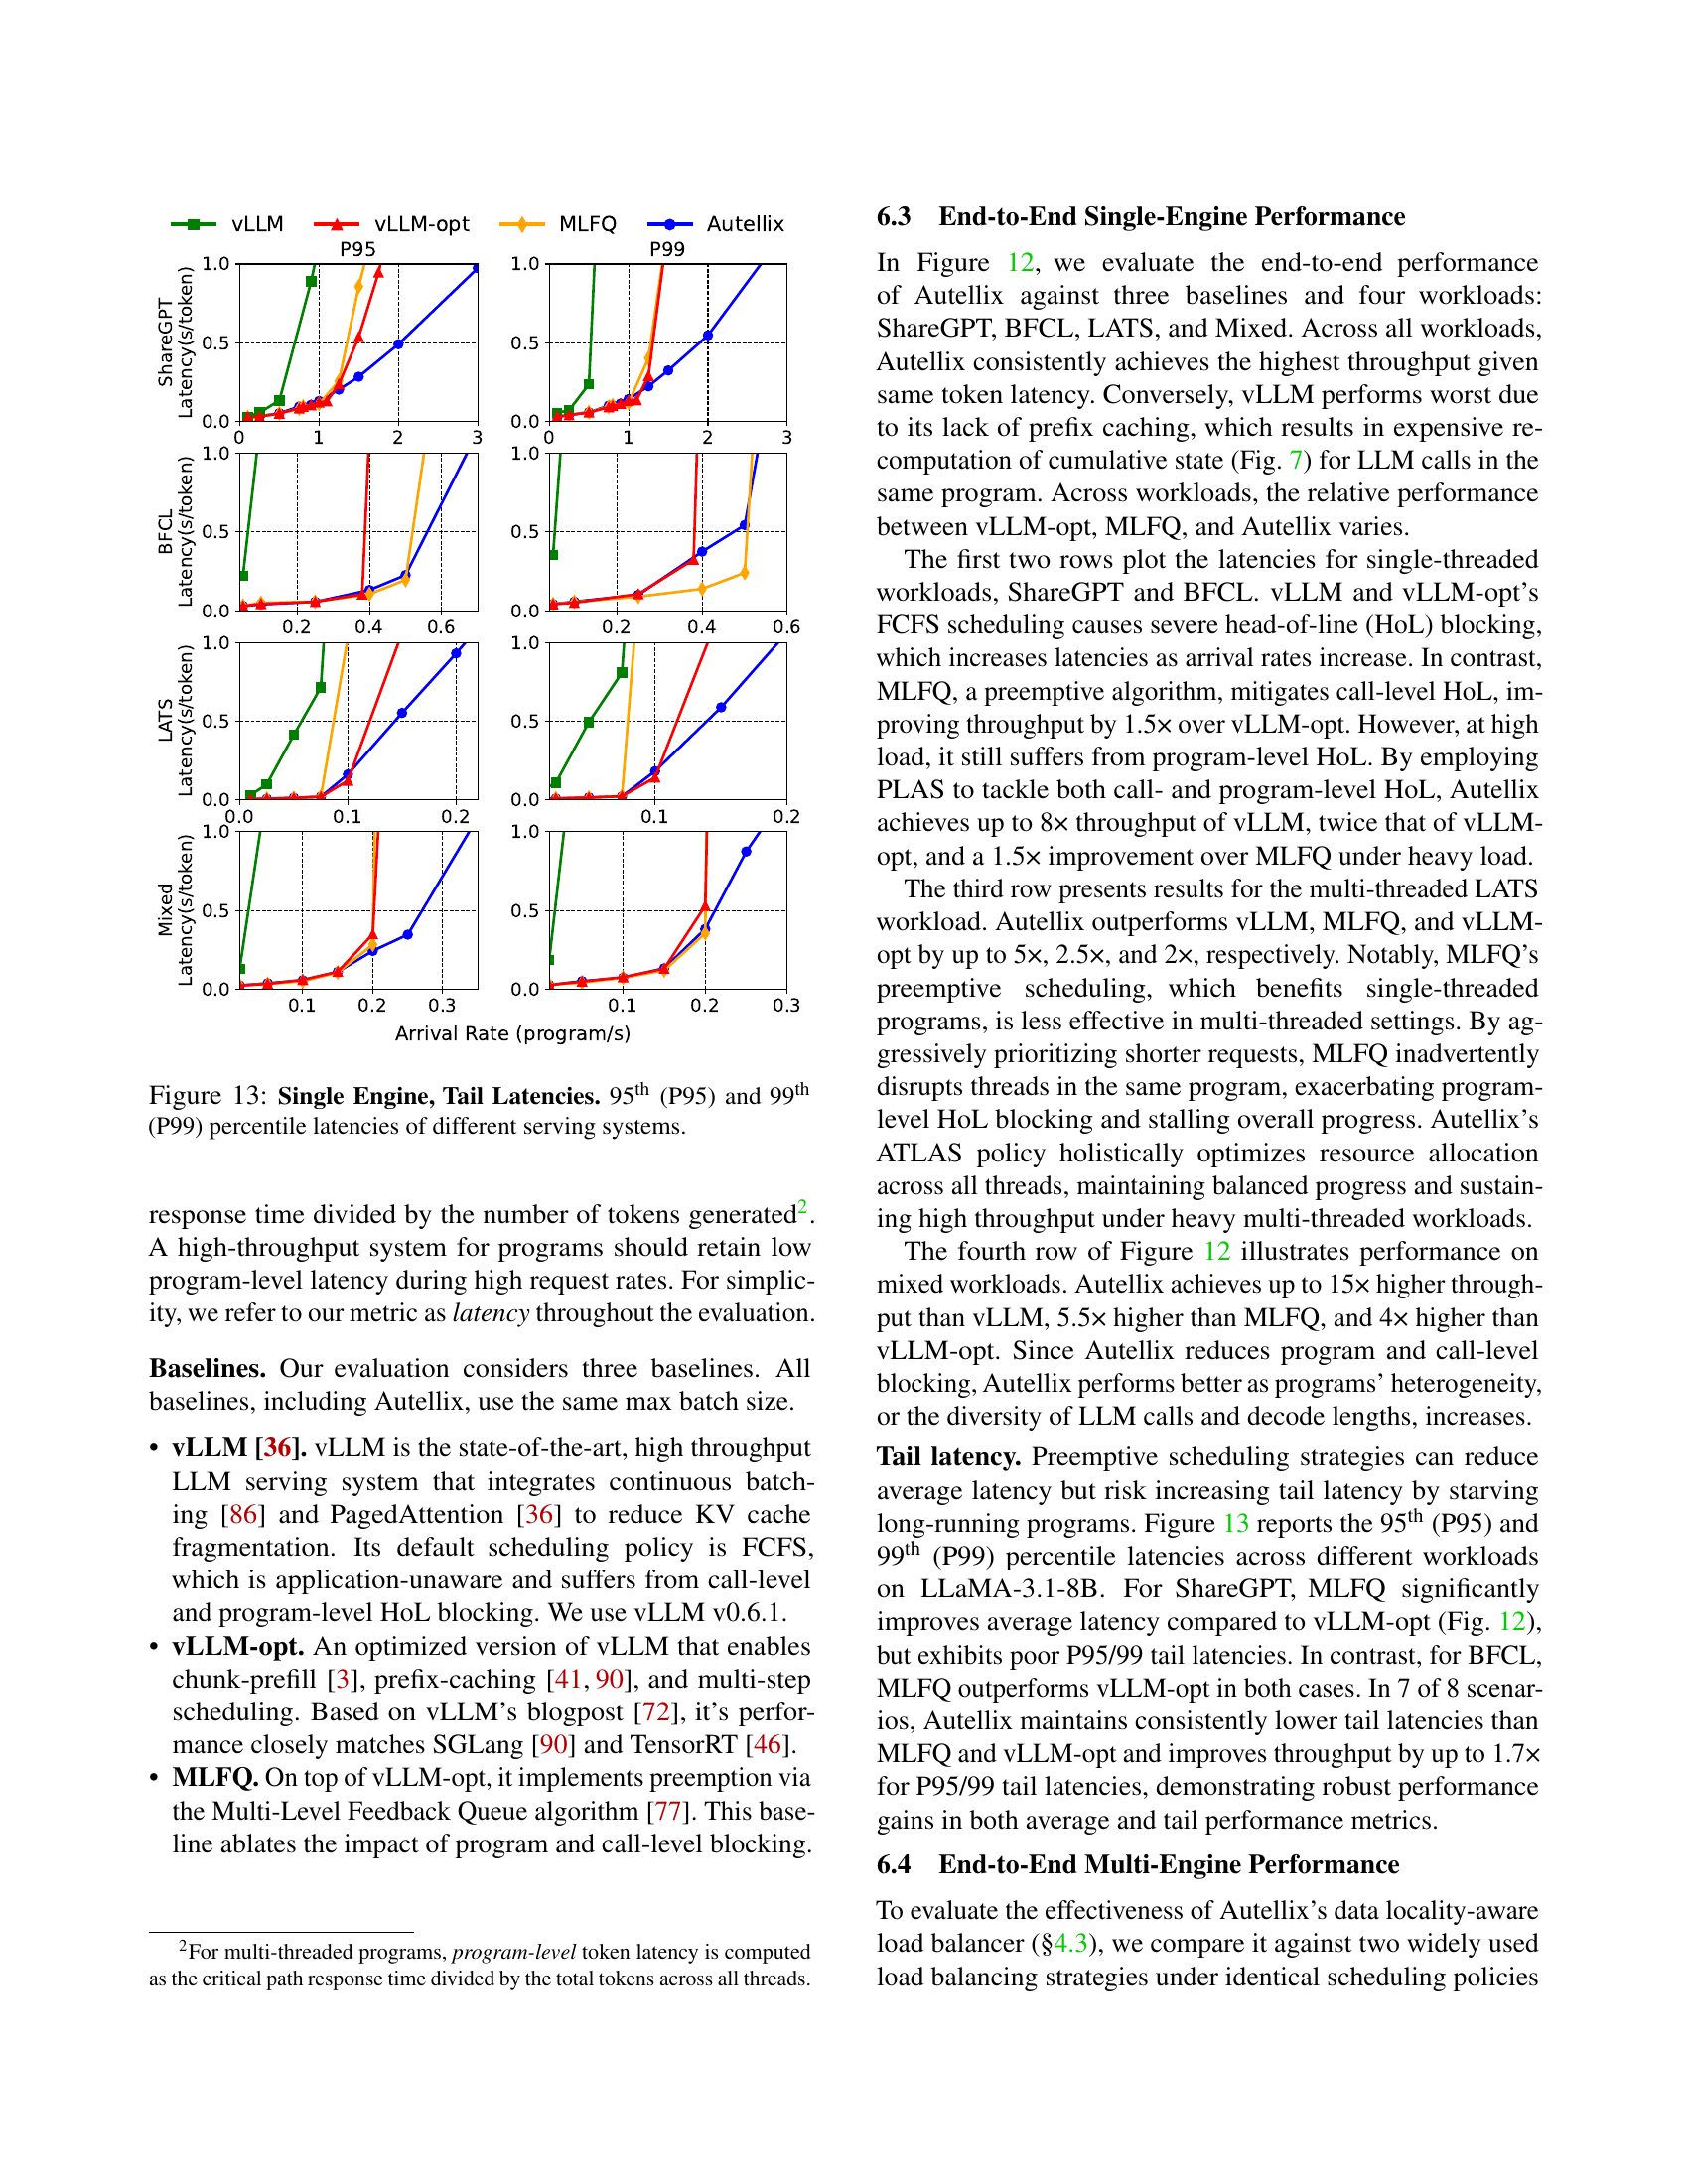
🔼 This figure compares the tail latencies (95th and 99th percentiles) of four different LLM serving systems (vLLM, vLLM-opt, MLFQ, and Autellix) across four real-world workloads (ShareGPT, BFCL, LATS, and Mixed). It shows how the different systems perform under varying arrival rates of programs and highlights the impact of different scheduling strategies on the latency distribution, particularly focusing on how well each system handles extreme latency outliers.
read the caption
Figure 13: Single Engine, Tail Latencies. 95th (P95) and 99th (P99) percentile latencies of different serving systems.

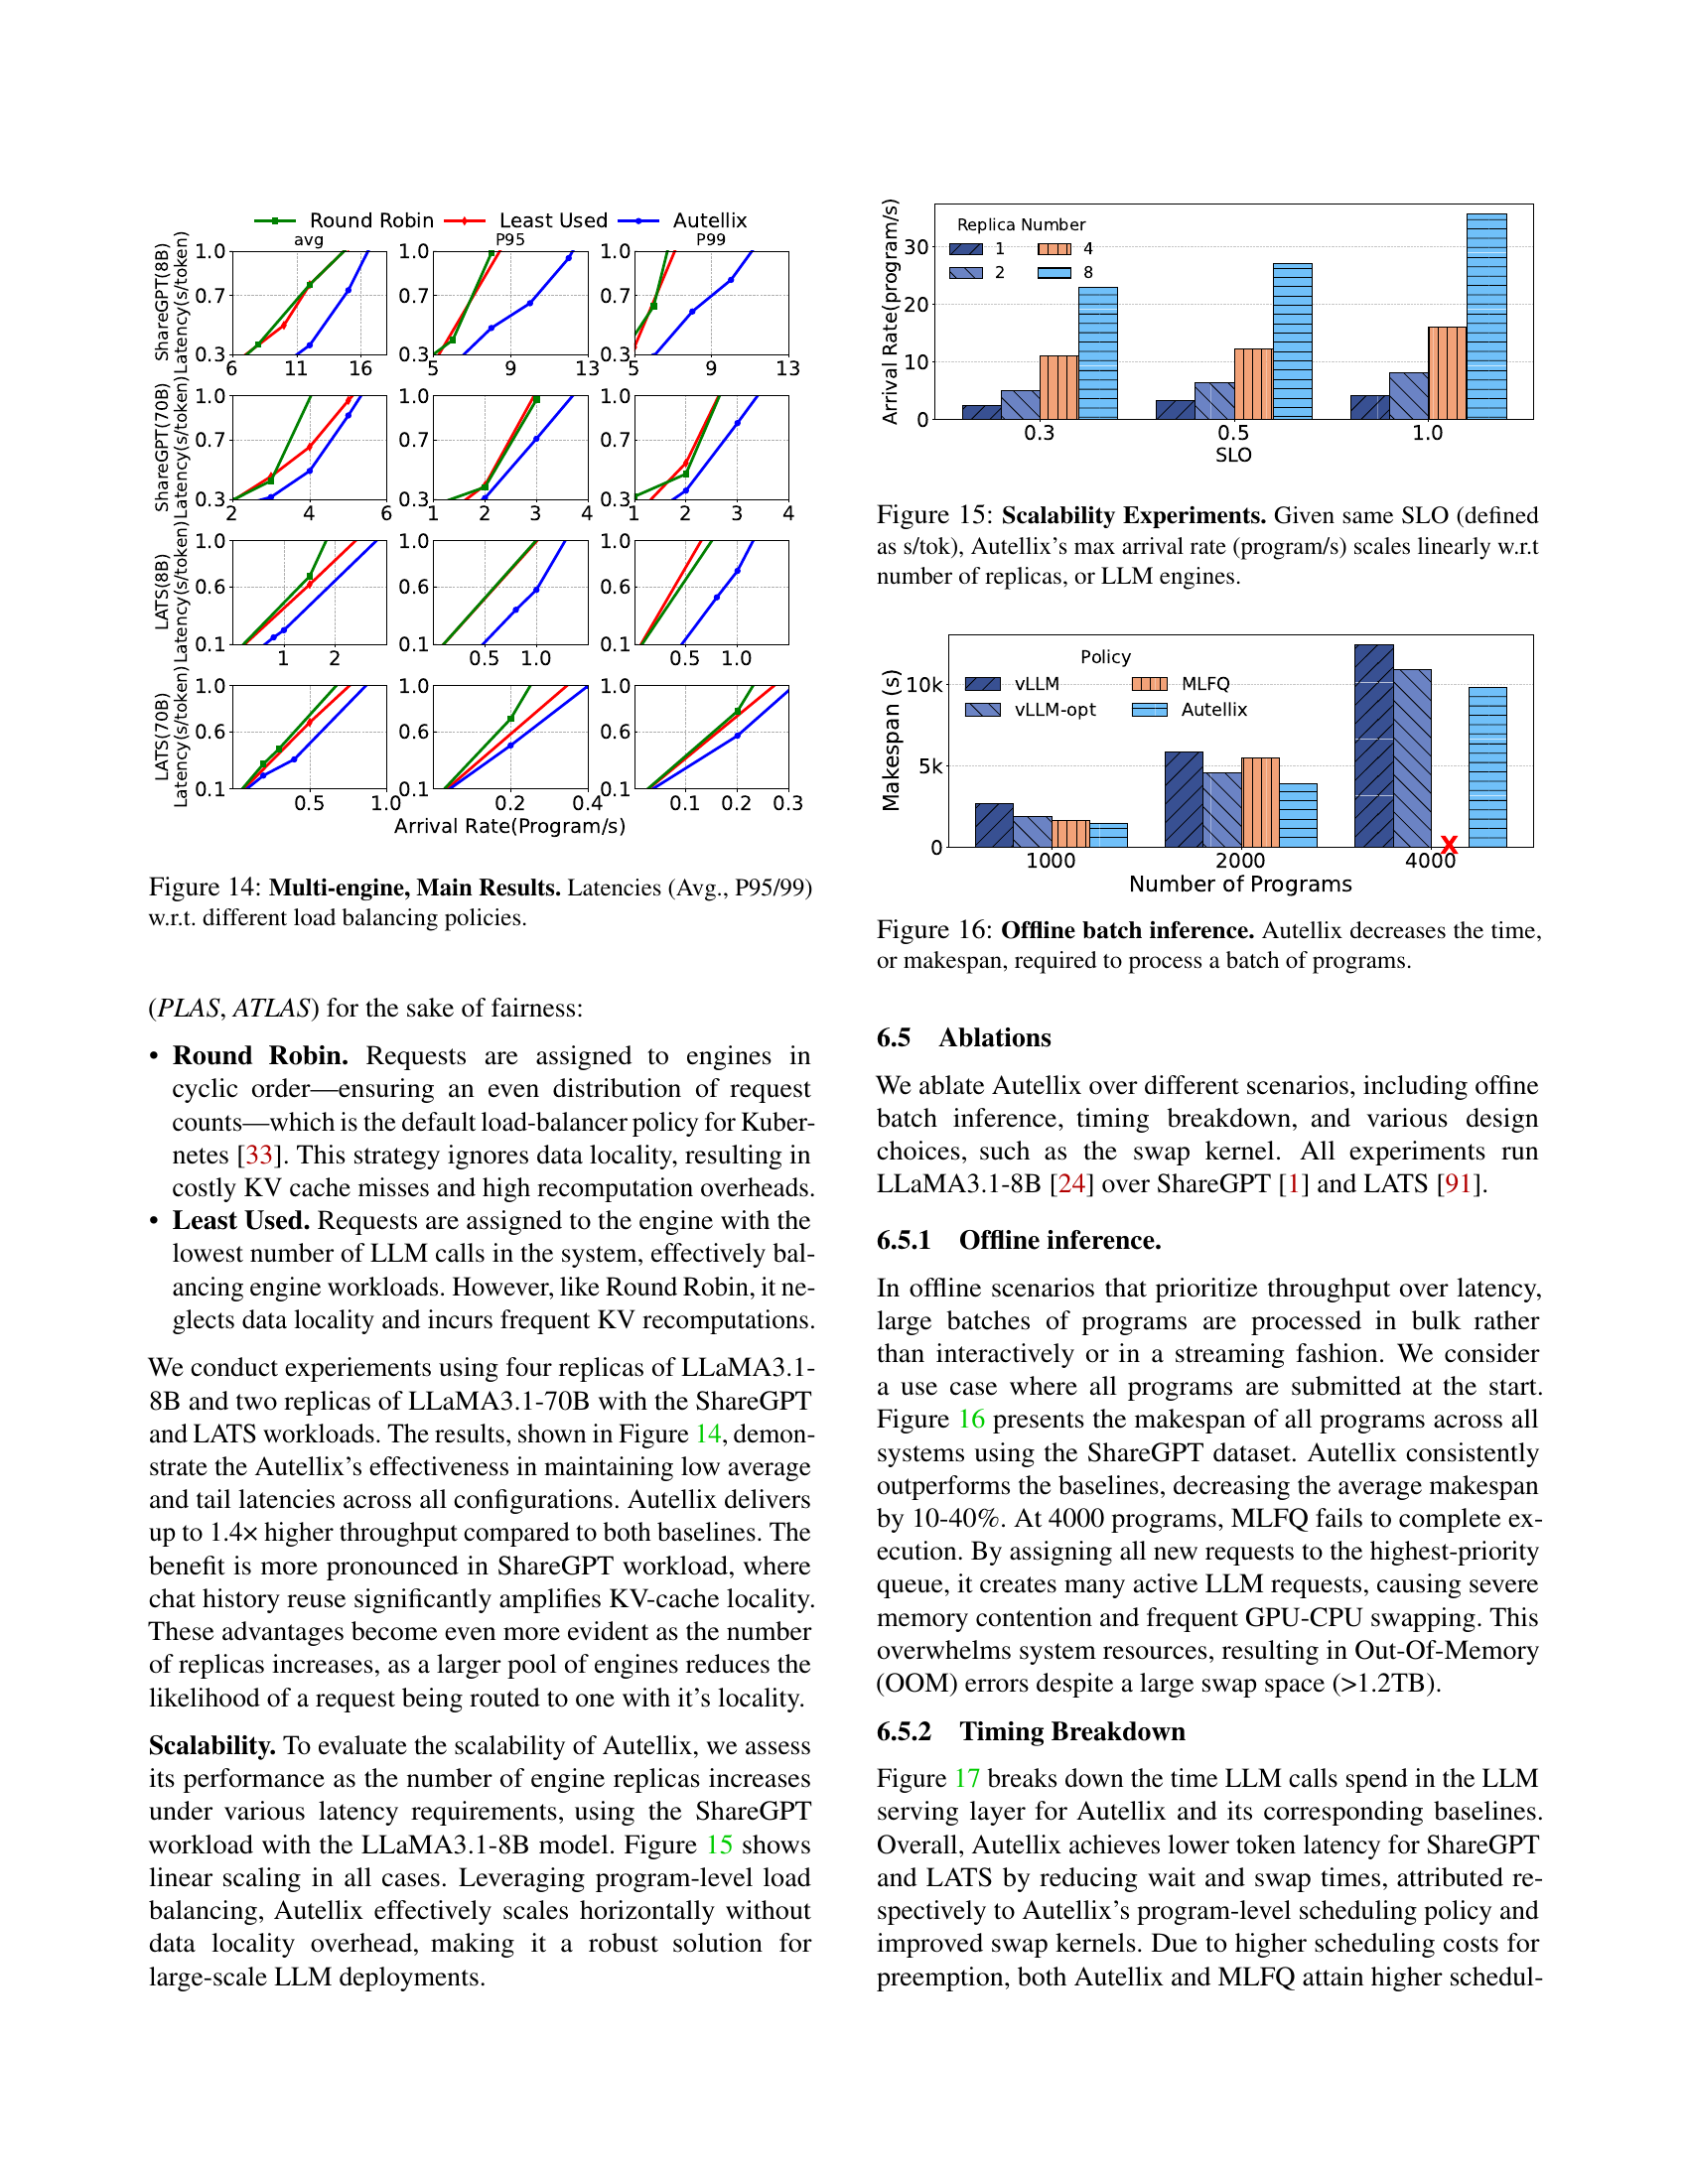
🔼 This figure compares the performance of different load balancing strategies (Round Robin, Least Used, and Autellix) across multiple LLM engines. It shows the average latency, 95th percentile latency (P95), and 99th percentile latency (P99) for two different workloads (ShareGPT and LATS) and two different model sizes (LLaMA 3.1-8B and LLaMA 3.1-70B). The results demonstrate the effectiveness of Autellix’s data locality-aware load balancing in maintaining low average and tail latencies across multiple engines, compared to round-robin and least-used strategies.
read the caption
Figure 14: Multi-engine, Main Results. Latencies (Avg., P95/99) w.r.t. different load balancing policies.

🔼 This figure demonstrates the scalability of Autellix by showing that as the number of LLM engines (replicas) increases, the maximum program arrival rate that Autellix can handle while maintaining the same service level objective (SLO, measured as seconds per token) also increases linearly. This highlights Autellix’s ability to efficiently distribute the workload across multiple engines, ensuring consistent performance even under high loads. The experiment uses the ShareGPT workload to evaluate the performance.
read the caption
Figure 15: Scalability Experiments. Given same SLO (defined as s/tok), Autellix’s max arrival rate (program/s) scales linearly w.r.t number of replicas, or LLM engines.

🔼 This figure shows the results of an experiment comparing the time taken to process a batch of programs offline (without interactive user input). The experiment compares Autellix to other systems (VLLM, vLLM-opt, MLFQ). The y-axis represents the total time (makespan) for the entire batch to complete, and the x-axis represents the number of programs in the batch. The graph demonstrates that Autellix completes the same batch of programs significantly faster than the other systems. This improvement is attributed to Autellix’s program-level scheduling and load balancing capabilities which prioritize program completion over processing individual LLM calls.
read the caption
Figure 16: Offline batch inference. Autellix decreases the time, or makespan, required to process a batch of programs.
Full paper#