TL;DR#
Large Language Models (LLMs) tendency to generate non-factual/unfaithful responses poses a risk to their global utility. The majority of research on detecting LLM hallucination are English-centric. They focus on machine translation/summarization, tasks that are less common compared to open information seeking. The study aims to quantify LLM hallucination across languages in knowledge-intensive question answering.
The study trains a multilingual hallucination detection model and conduct a large-scale study across 30 languages/6 LLM families. It uses MT to generate training data in other languages. Silver/gold test sets estimate hallucination rates, using a QA dataset with LLM-generated prompts and Wikipedia articles. It finds that, while LLMs generate longer responses, there is no correlation between length-normalized hallucination rates and digital representation. Smaller LLMs have larger hallucination rates.
Key Takeaways#
Why does it matter?#
This multilingual hallucination study is vital! It tackles the critical issue of LLM accuracy across languages, moving beyond English-centric approaches. The findings on model size and language support impacting hallucination rates open new research avenues for improving LLM reliability globally.
Visual Insights#

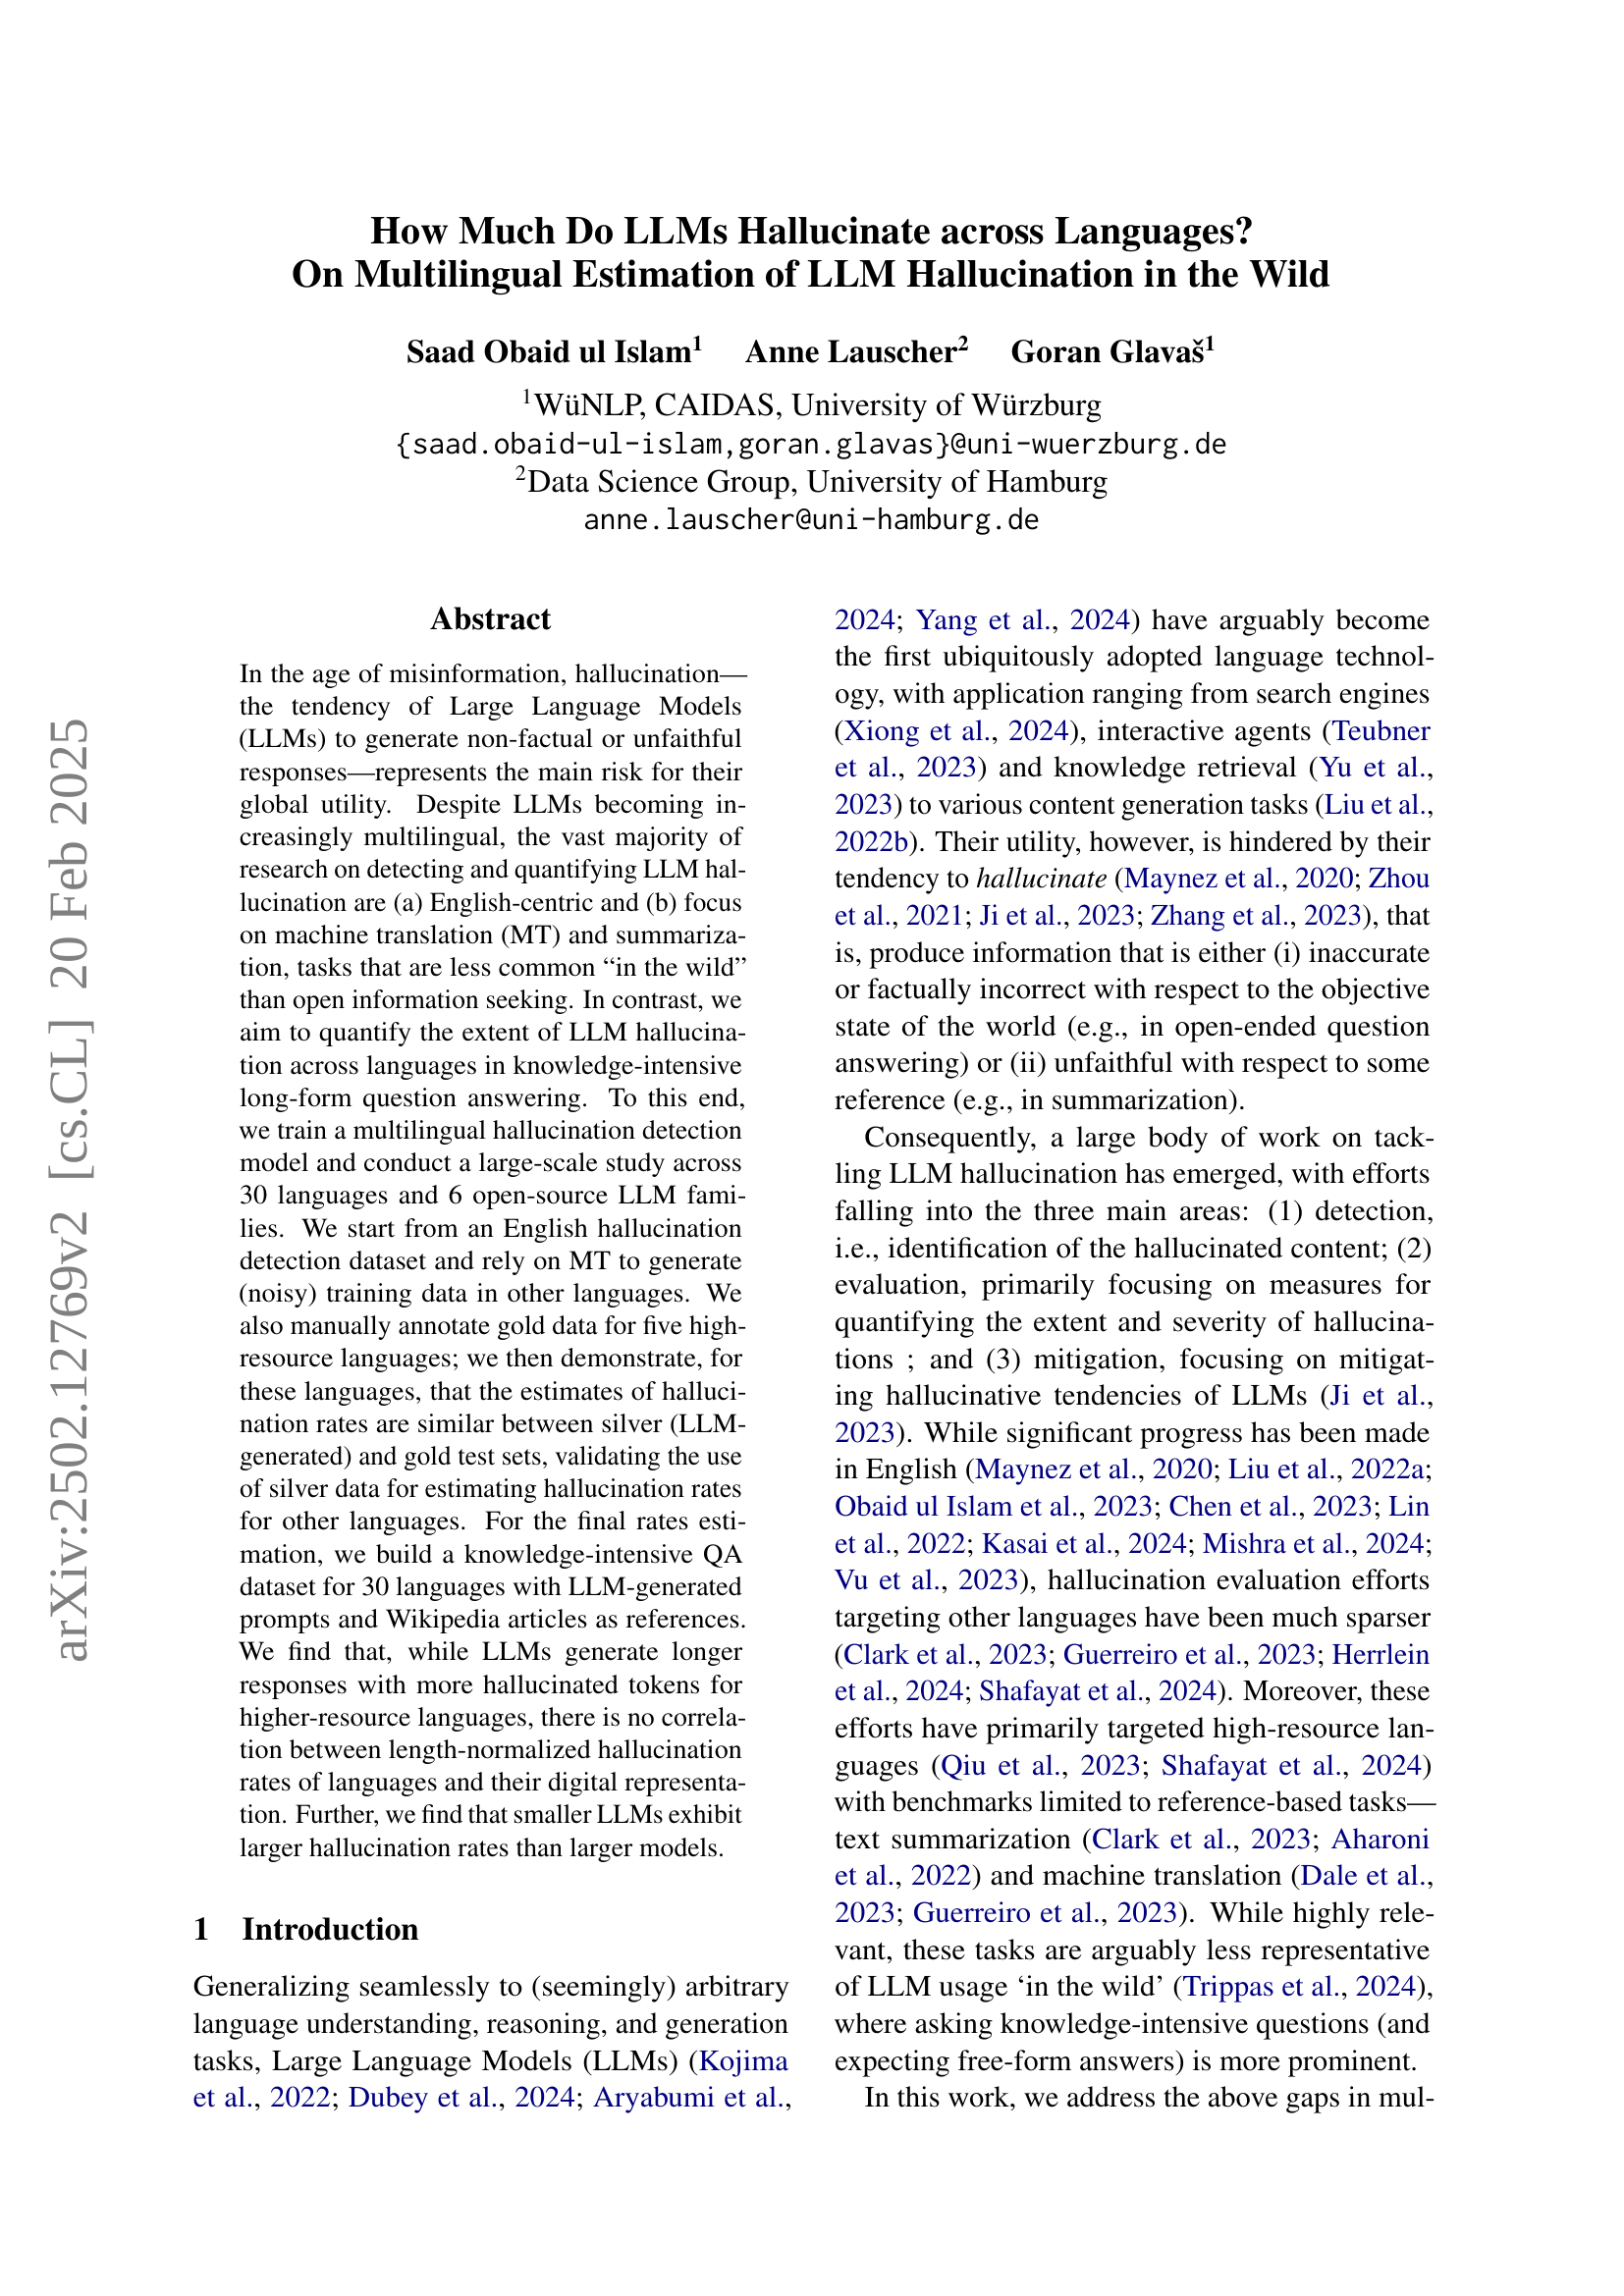
🔼 This figure illustrates the methodology used in the paper to estimate the hallucination rates of large language models (LLMs) across multiple languages. The process involves two main stages: (1) Hallucination detection model training and evaluation, and (2) Hallucination rate estimation. The left side depicts the development of a multilingual hallucination detection model trained on translated data, then evaluated using a newly created benchmark called mFAVA. mFAVA includes both machine-generated (silver) and human-annotated (gold) data for a subset of languages. The right side shows how hallucination rates are estimated for 30 languages and 6 LLM families using the trained detection model’s performance on a large-scale knowledge-intensive QA dataset.
read the caption
Figure 1: Illustration of our approach for estimating hallucination rates in the wild. Hallucination Detection and Model Evaluation (left side): (1) We automatically translate the English FAVA Mishra et al. (2024) dataset to 30 languages and train our multilingual hallucination detection (HD) model on this (noisy) multilingual training data; (2) We synthesize a silver multilingual hallucination evaluation dataset by prompting a state-of-the-art LLM (GPT-4) to introduce hallucinations in its answers to knowledge-seeking questions; for a subset of five high-resource languages, we additionally collect gold (i.e., human) hallucination annotations; we dub this 30-language evaluation benchmark mFAVA. We use mFAVA to estimate HD model’s per-language performances (precision and recall). Hallucination Rate Estimation in the Wild (right side): (3) We estimate the hallucination rates for all 30 languages and six different LLM families from the number of detections of the HD model and its performance.
| Very Unlikely | Unlikely | Neutral | Likely | Very Likely |
| 21.8% | 24.7% | 13.0% | 25.3% | 15.2% |
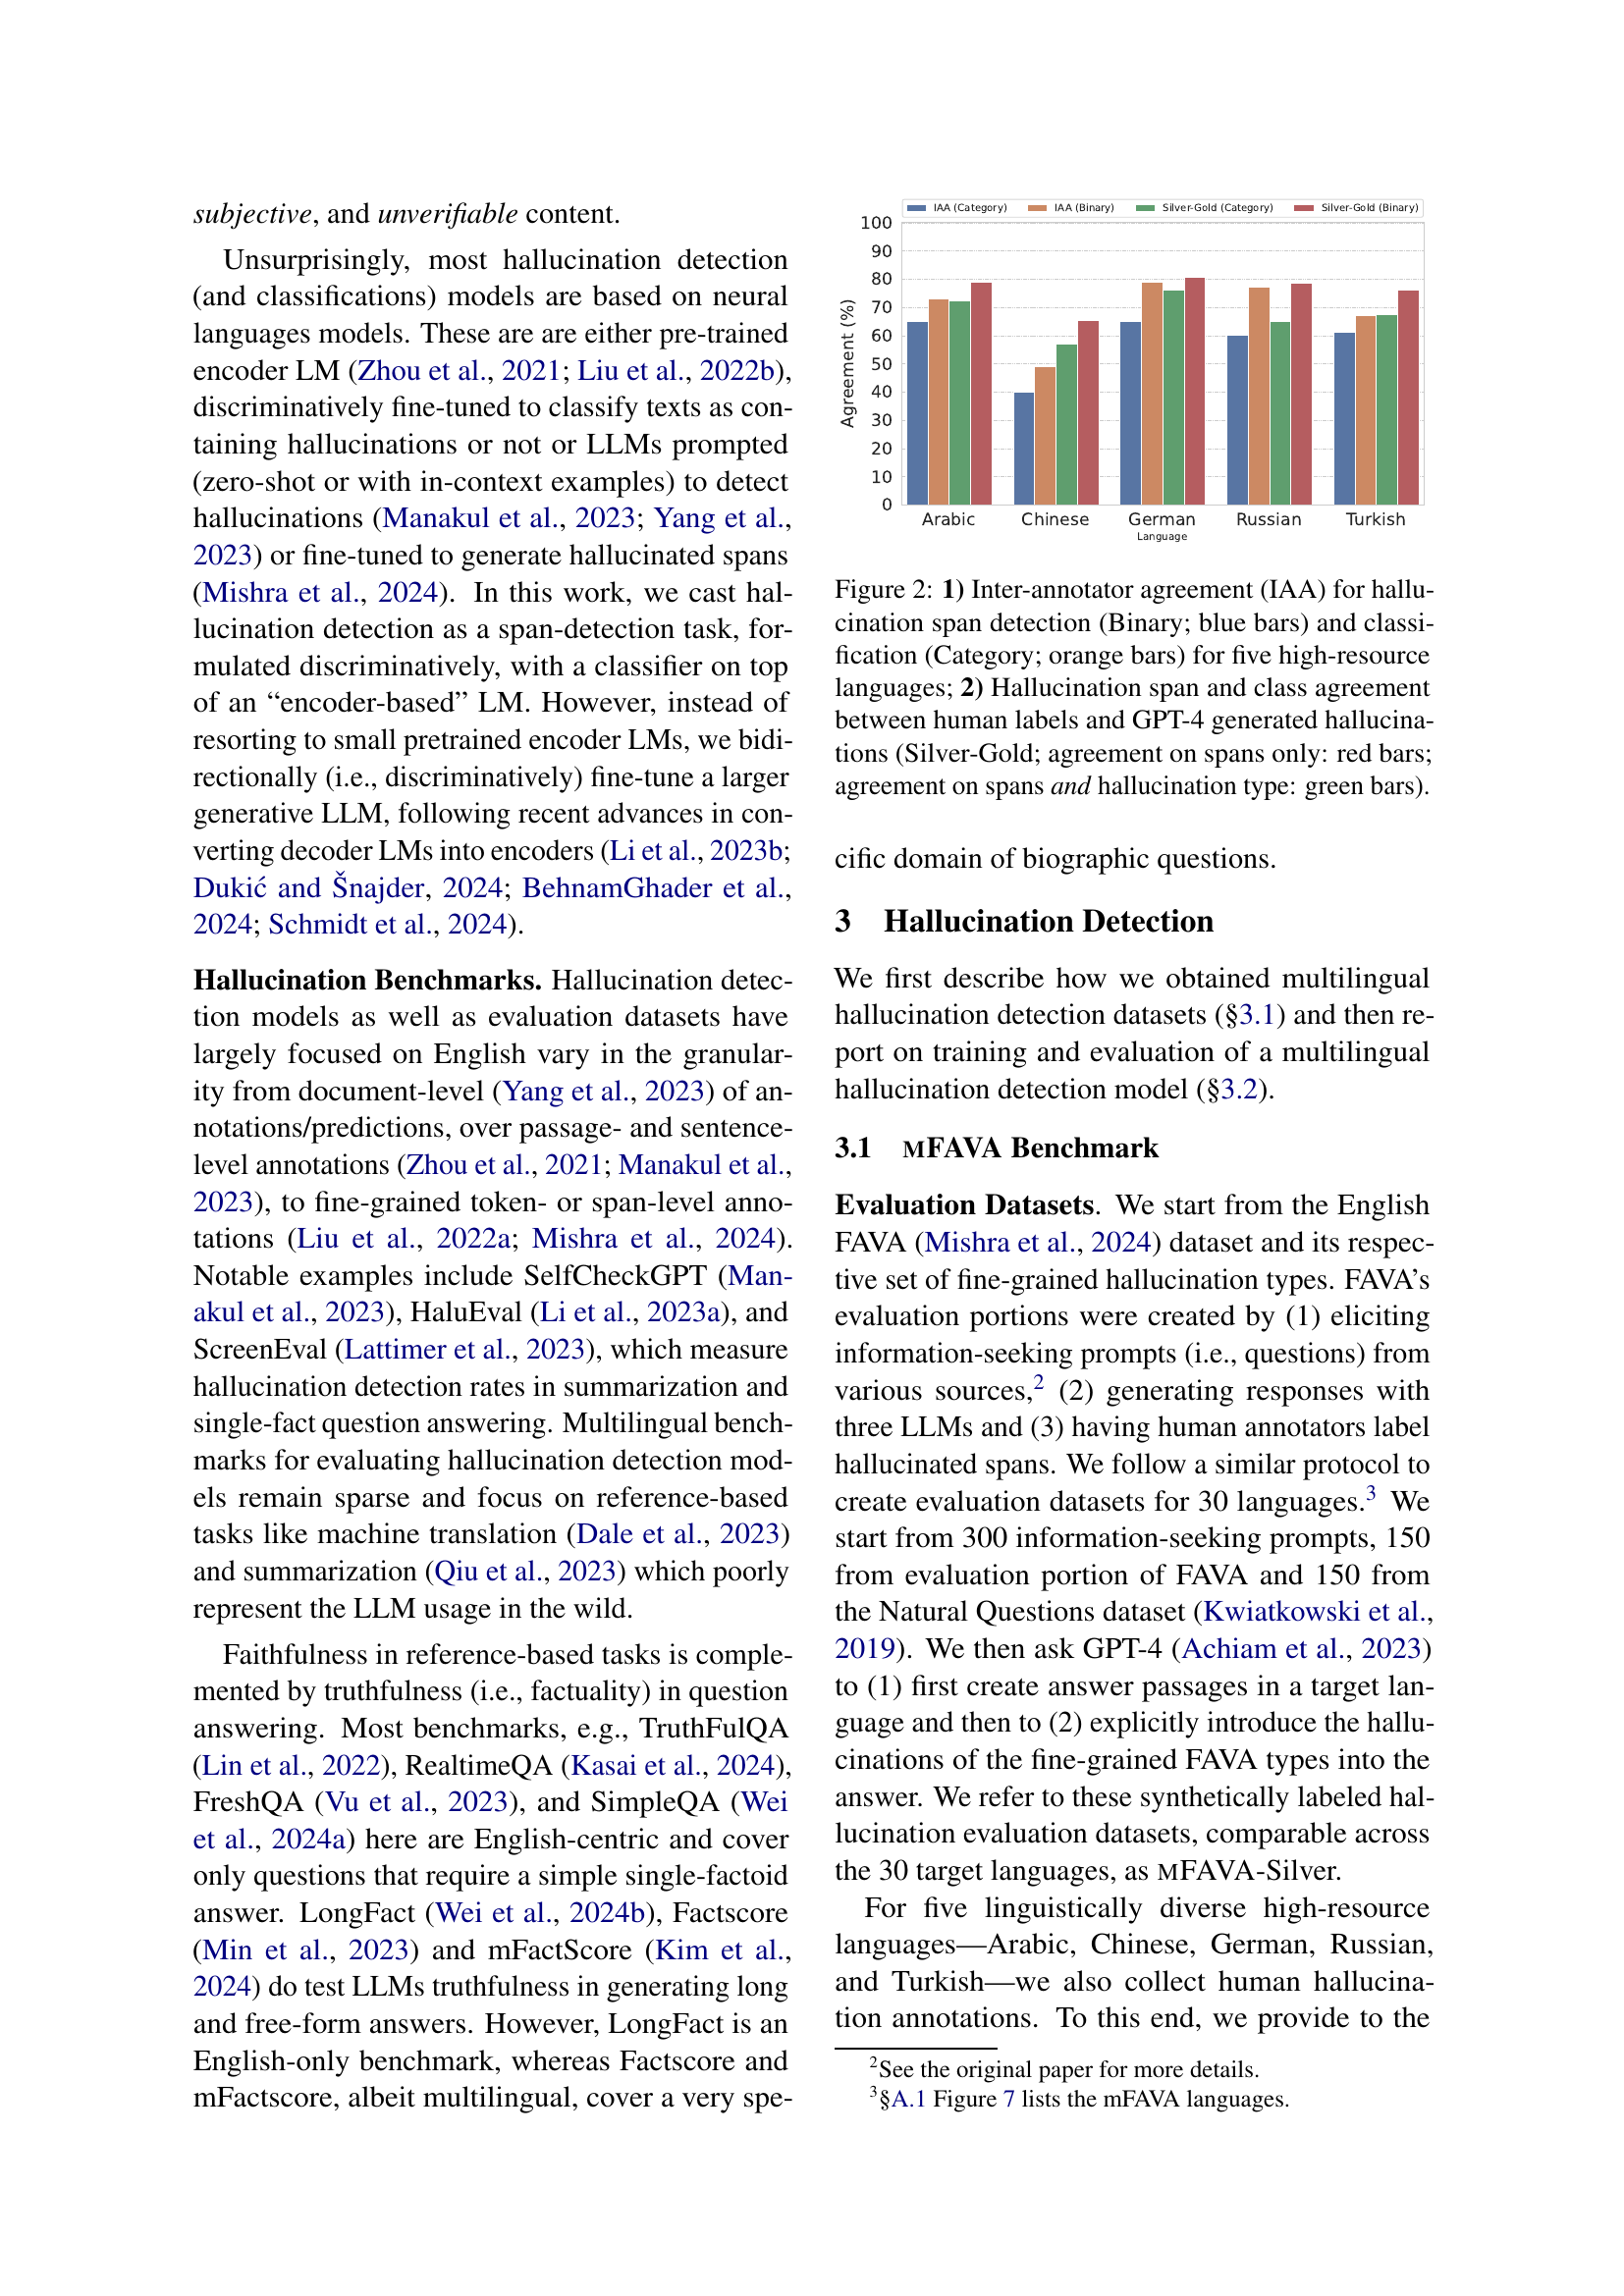
🔼 This table presents the inter-annotator agreement results on the likelihood of augmented text fooling human readers. The data is categorized into five levels of likelihood: Very Unlikely, Unlikely, Neutral, Likely, and Very Likely, representing the probability that a human would believe the augmented text without knowing it contains hallucinations. The results are shown separately for five high-resource languages: Arabic, Chinese, German, Russian, and Turkish, providing insights into cross-lingual differences in how easily LLMs’ hallucinations can deceive human readers.
read the caption
Table 1: Annotator ratings for probability of augmented text fooling the reader for the 5 gold languages.
In-depth insights#
LLM Hallucination#
LLM hallucination, a key challenge, involves models generating non-factual or unfaithful content. This impacts reliability, especially in open-ended tasks. Detection focuses on identifying hallucinated spans, while evaluation quantifies severity. Mitigation aims to reduce these tendencies. Current research is English-centric, often concentrated on tasks like translation. Future work needs to address hallucination in diverse languages and real-world use cases.
Multilingual MFAVA#
From the paper, the approach to create Multilingual MFAVA involves translating an English hallucination dataset (FAVA) into 30 languages to train a multilingual hallucination detection model. This tackles the English-centric bias and limited multilingual benchmarks, generating ‘silver’ (LLM-created) data for evaluation in more languages. The effort further includes manually annotating gold data for five high-resource languages. It then allows for the validation of using silver data for hallucination estimation in other languages. This tackles the multilingual gap in hallucination detection.
Silver vs. Gold#
In the context of LLM hallucination research, the “Silver vs. Gold” paradigm refers to using LLM-generated (silver) vs. human-annotated (gold) data for training or evaluating hallucination detection models. Gold data, while more reliable, is expensive to acquire, especially across many languages. The paper explores if silver data can reliably approximate gold data performance. This is validated by comparing hallucination rates with these two kind of datasets. This makes large-scale multilingual hallucination evaluation feasible, if proven reliable. If estimates from silver data can be relied upon, this opens doors for understanding hallucination behaviors in more languages and larger models.
Larger is Better?#
The notion of “Larger is Better?” in language models is nuanced. Larger models often exhibit improved capabilities due to increased parameter count and training data, leading to better generalization and reasoning. However, there are caveats. Larger models can be computationally expensive and may overfit if not regularized. The effectiveness of a model isn’t solely determined by size but also training data, architecture and efficient training techniques. Smaller, well-trained models can sometimes outperform larger models, highlighting the importance of optimization and data quality. Model size needs to be considered with other crucial factors.
Language-Agnostic#
Language-agnostic models aim to perform consistently across different languages, irrespective of their linguistic features. In the context of hallucinations in LLMs, this is crucial. A language-agnostic LLM should ideally maintain a uniform rate of factual accuracy across languages. Developing and evaluating such models require multilingual datasets and metrics capable of assessing performance beyond English. Overcoming biases inherent to specific languages is key. Evaluation datasets for language-agnostic models need meticulous consideration of how hallucinations manifest differently across languages. Developing language-agnostic models, which mitigate hallucinations universally, promises a more reliable and equitable AI.
More visual insights#
More on figures

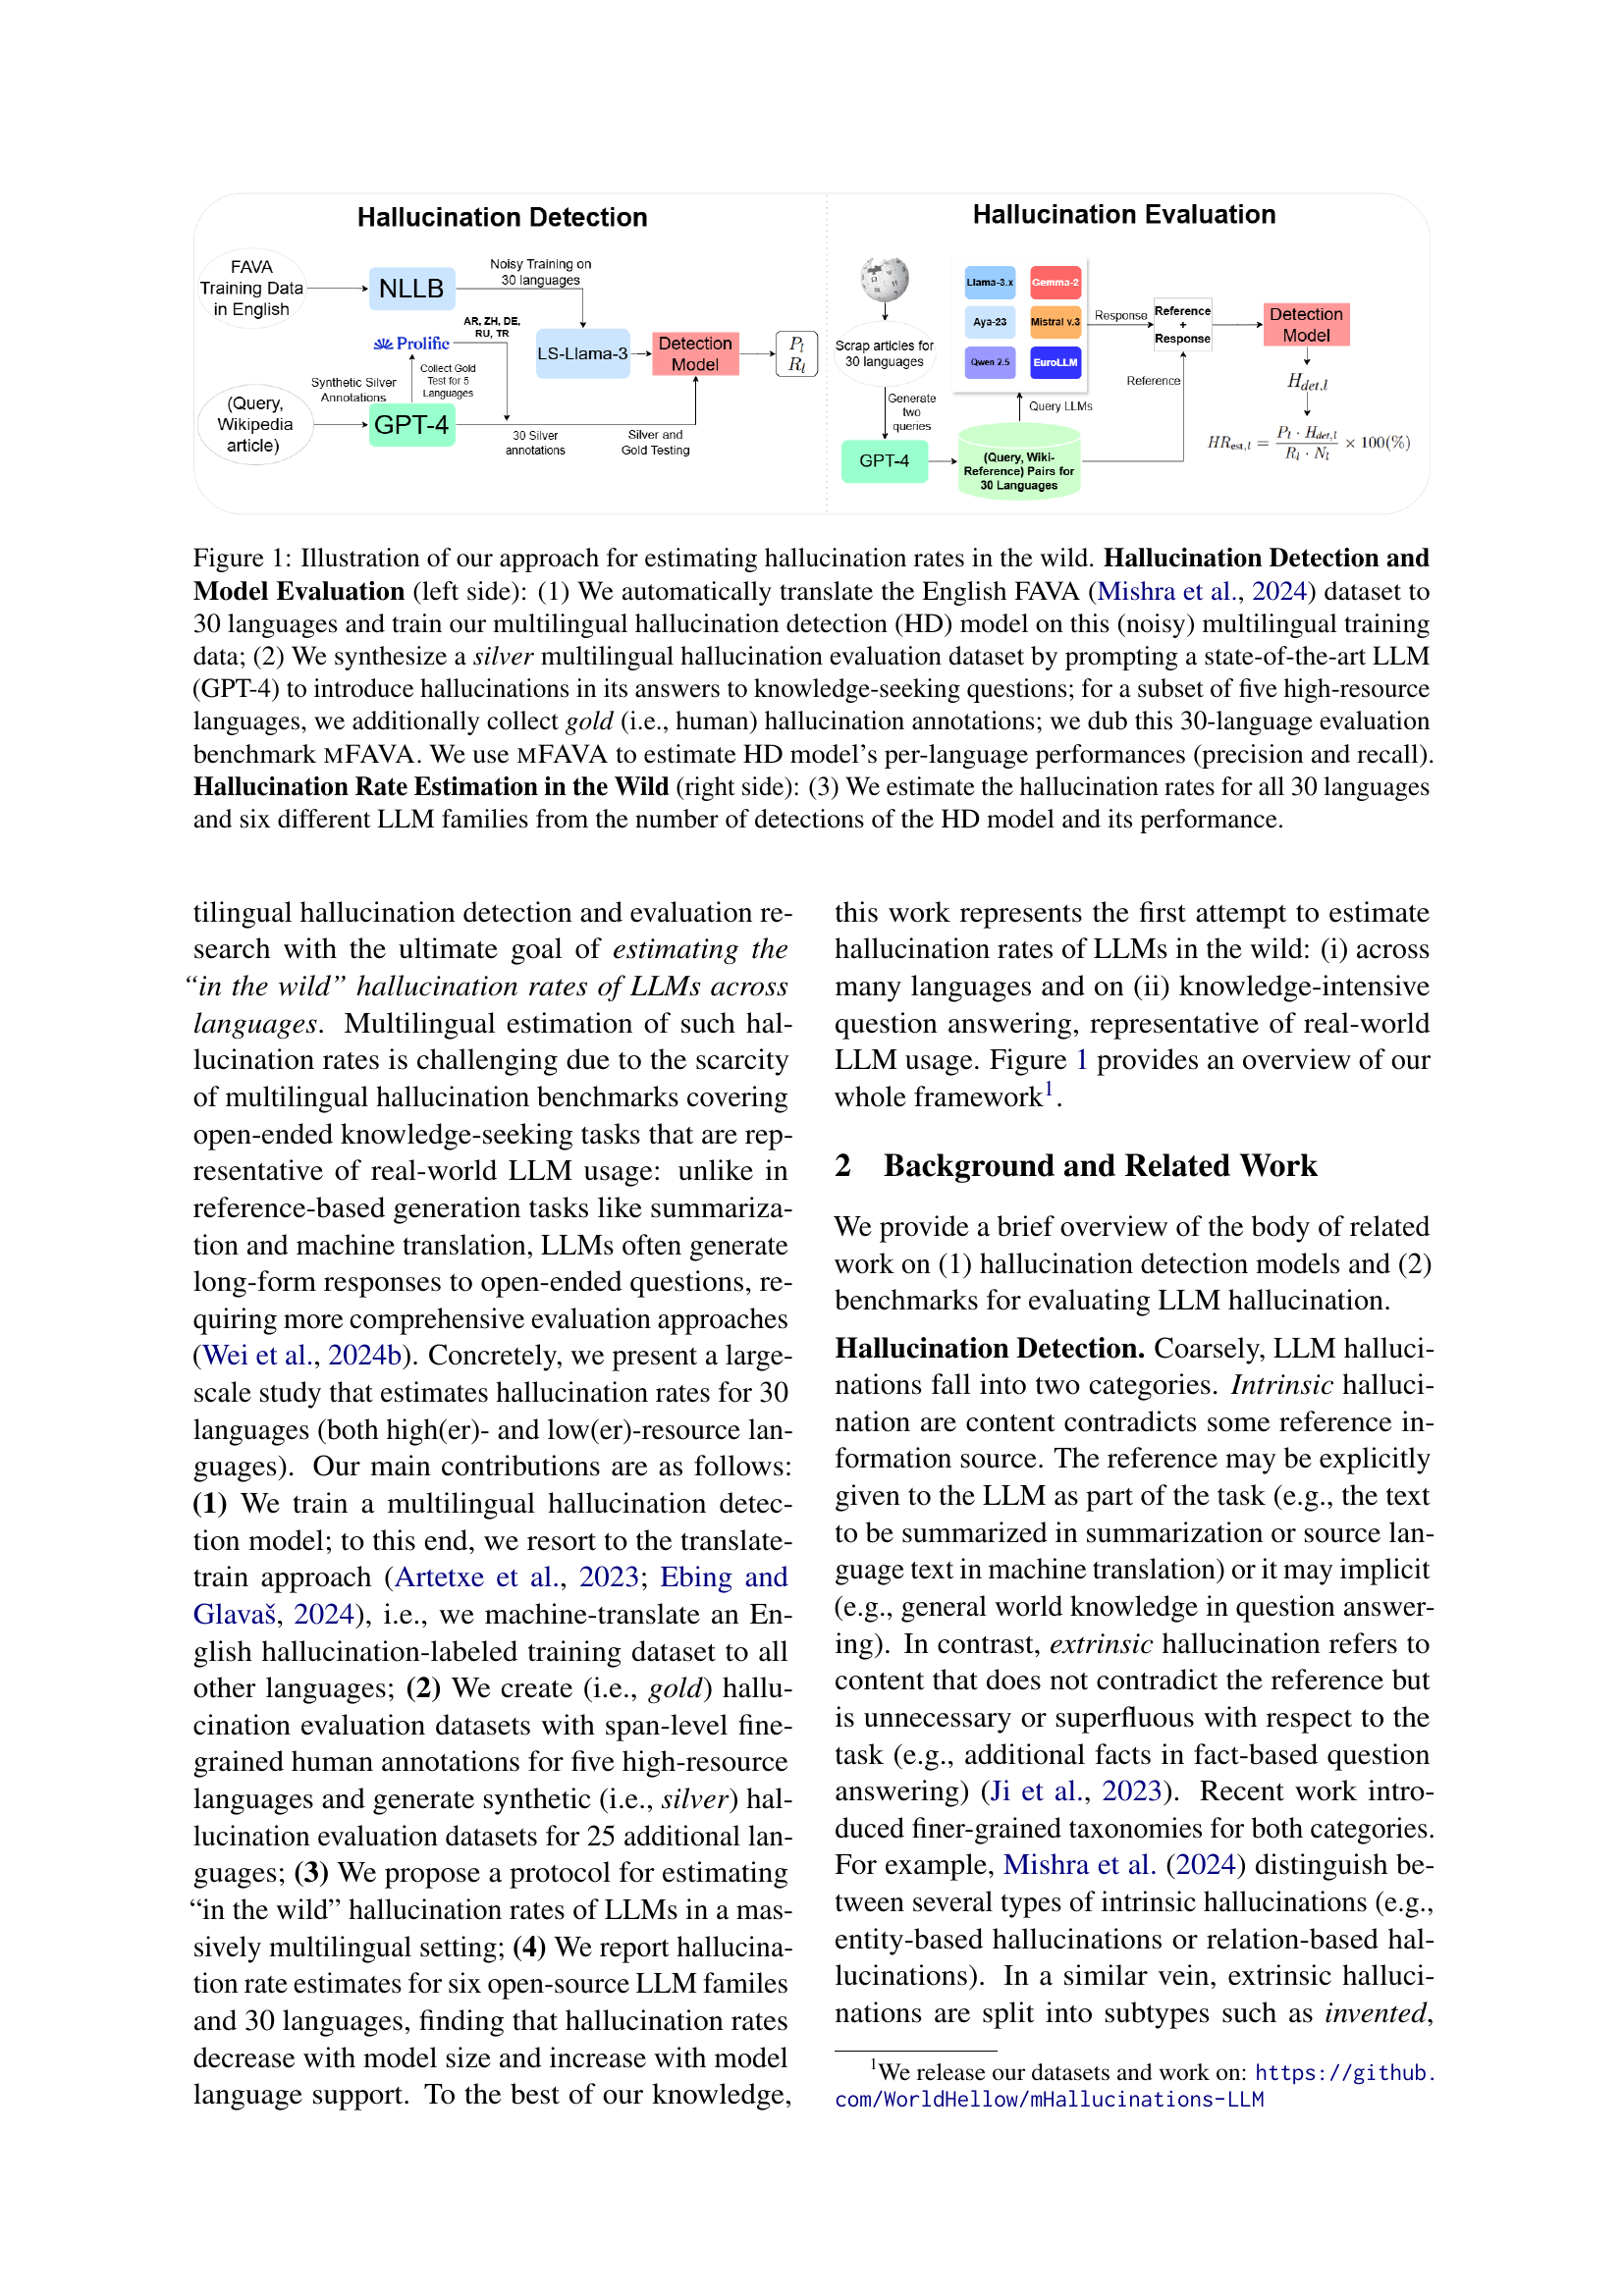
🔼 Figure 2 presents a comparison of inter-annotator agreement (IAA) and the agreement between human annotations and GPT-4 generated hallucinations for a task involving hallucination detection. The left part shows IAA scores for both binary (span detection) and categorical (hallucination type classification) annotation schemes across five high-resource languages. The right part displays the agreement between human annotators and GPT-4’s hallucination labels, showing separate scores for agreement on spans alone and for agreement on both spans and hallucination types.
read the caption
Figure 2: 1) Inter-annotator agreement (IAA) for hallucination span detection (Binary; blue bars) and classification (Category; orange bars) for five high-resource languages; 2) Hallucination span and class agreement between human labels and GPT-4 generated hallucinations (Silver-Gold; agreement on spans only: red bars; agreement on spans and hallucination type: green bars).

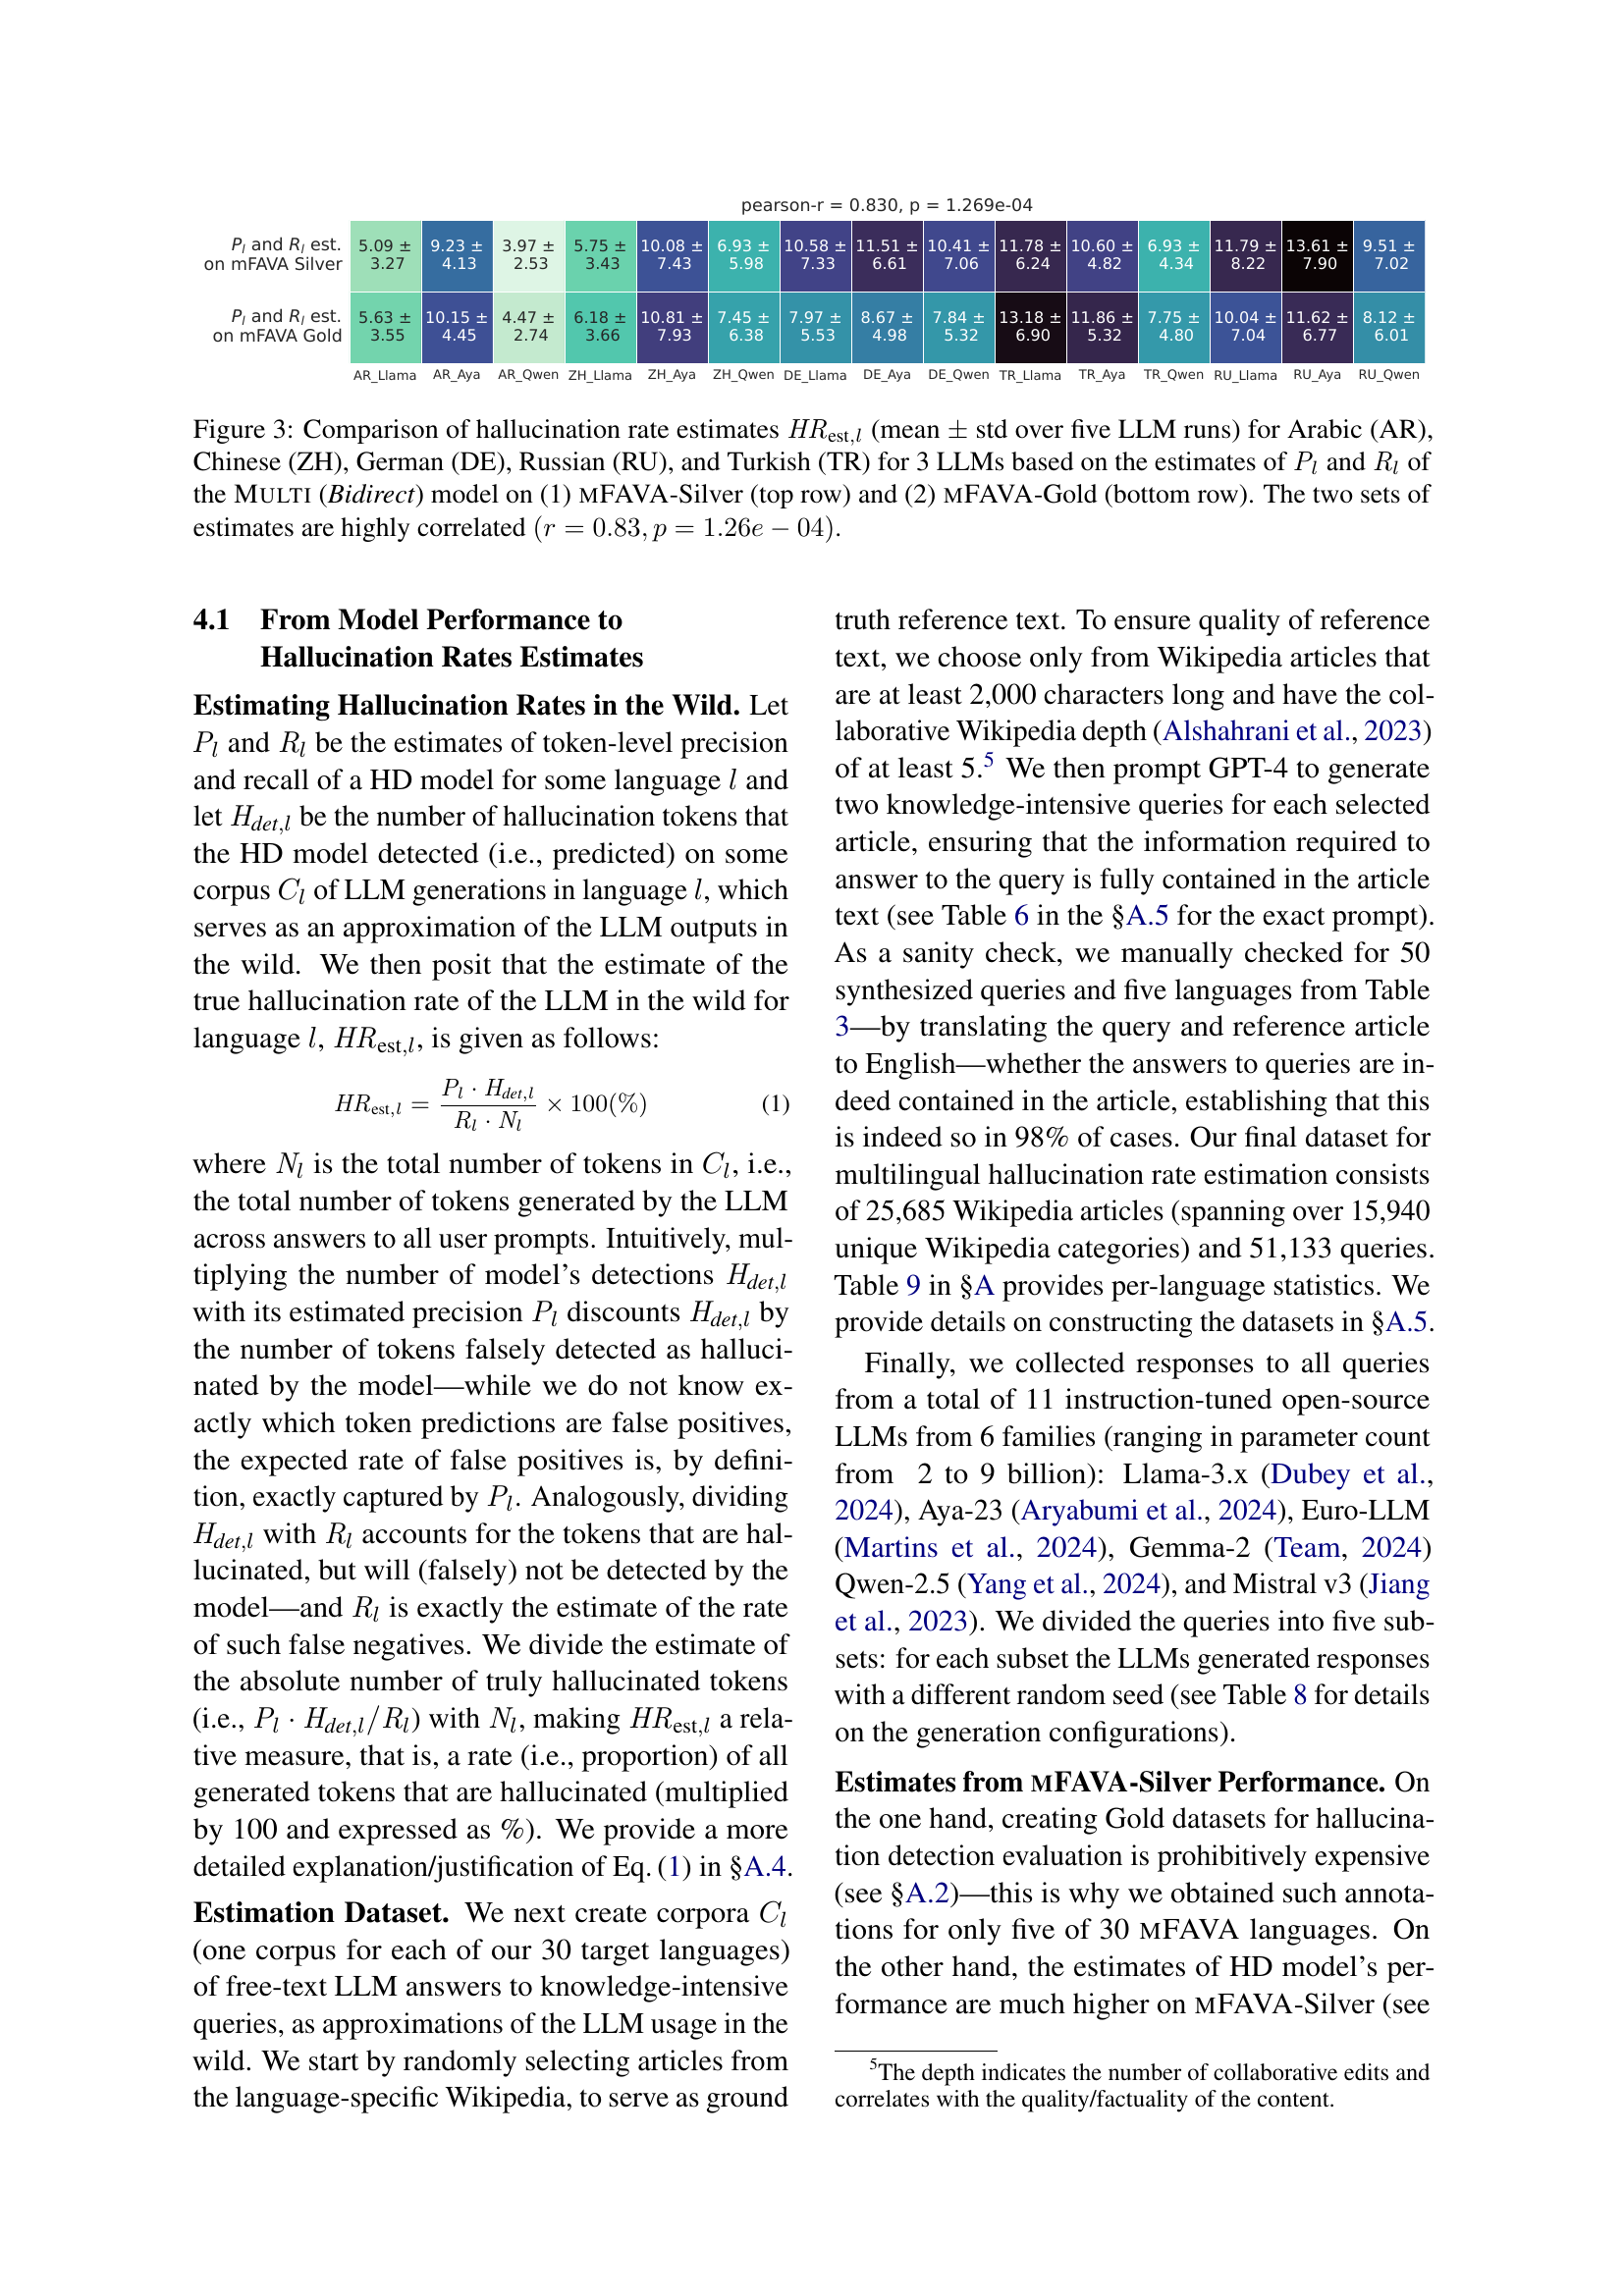
🔼 Figure 3 displays a comparison of hallucination rates across five languages (Arabic, Chinese, German, Russian, and Turkish) for three different Large Language Models (LLMs). Hallucination rates (𝐻𝑅est,l) are calculated using precision (Pl) and recall (Rl) estimates from a multilingual hallucination detection model. The figure presents two sets of results: one using a silver standard (mFAVA-Silver), created by automatically translating an English dataset and another using a gold standard (mFAVA-Gold) with human annotations for a subset of the languages. The top row shows results based on the mFAVA-Silver dataset, and the bottom row shows results based on the mFAVA-Gold dataset. A strong positive correlation (r = 0.83, p = 1.26e-04) is observed between the two sets of hallucination rate estimates, indicating that the silver standard provides a reasonable approximation of the gold standard.
read the caption
Figure 3: Comparison of hallucination rate estimates 𝐻𝑅est,lsubscript𝐻𝑅est𝑙\mathit{HR}_{\text{est},l}italic_HR start_POSTSUBSCRIPT est , italic_l end_POSTSUBSCRIPT (mean ±plus-or-minus\pm± std over five LLM runs) for Arabic (AR), Chinese (ZH), German (DE), Russian (RU), and Turkish (TR) for 3 LLMs based on the estimates of Plsubscript𝑃𝑙\mathit{P}_{l}italic_P start_POSTSUBSCRIPT italic_l end_POSTSUBSCRIPT and Rlsubscript𝑅𝑙\mathit{R}_{l}italic_R start_POSTSUBSCRIPT italic_l end_POSTSUBSCRIPT of the Multi (Bidirect) model on (1) mFAVA-Silver (top row) and (2) mFAVA-Gold (bottom row). The two sets of estimates are highly correlated (r=0.83,p=1.26e−04)formulae-sequence𝑟0.83𝑝1.26𝑒04(r=0.83,p=1.26e-04)( italic_r = 0.83 , italic_p = 1.26 italic_e - 04 ).

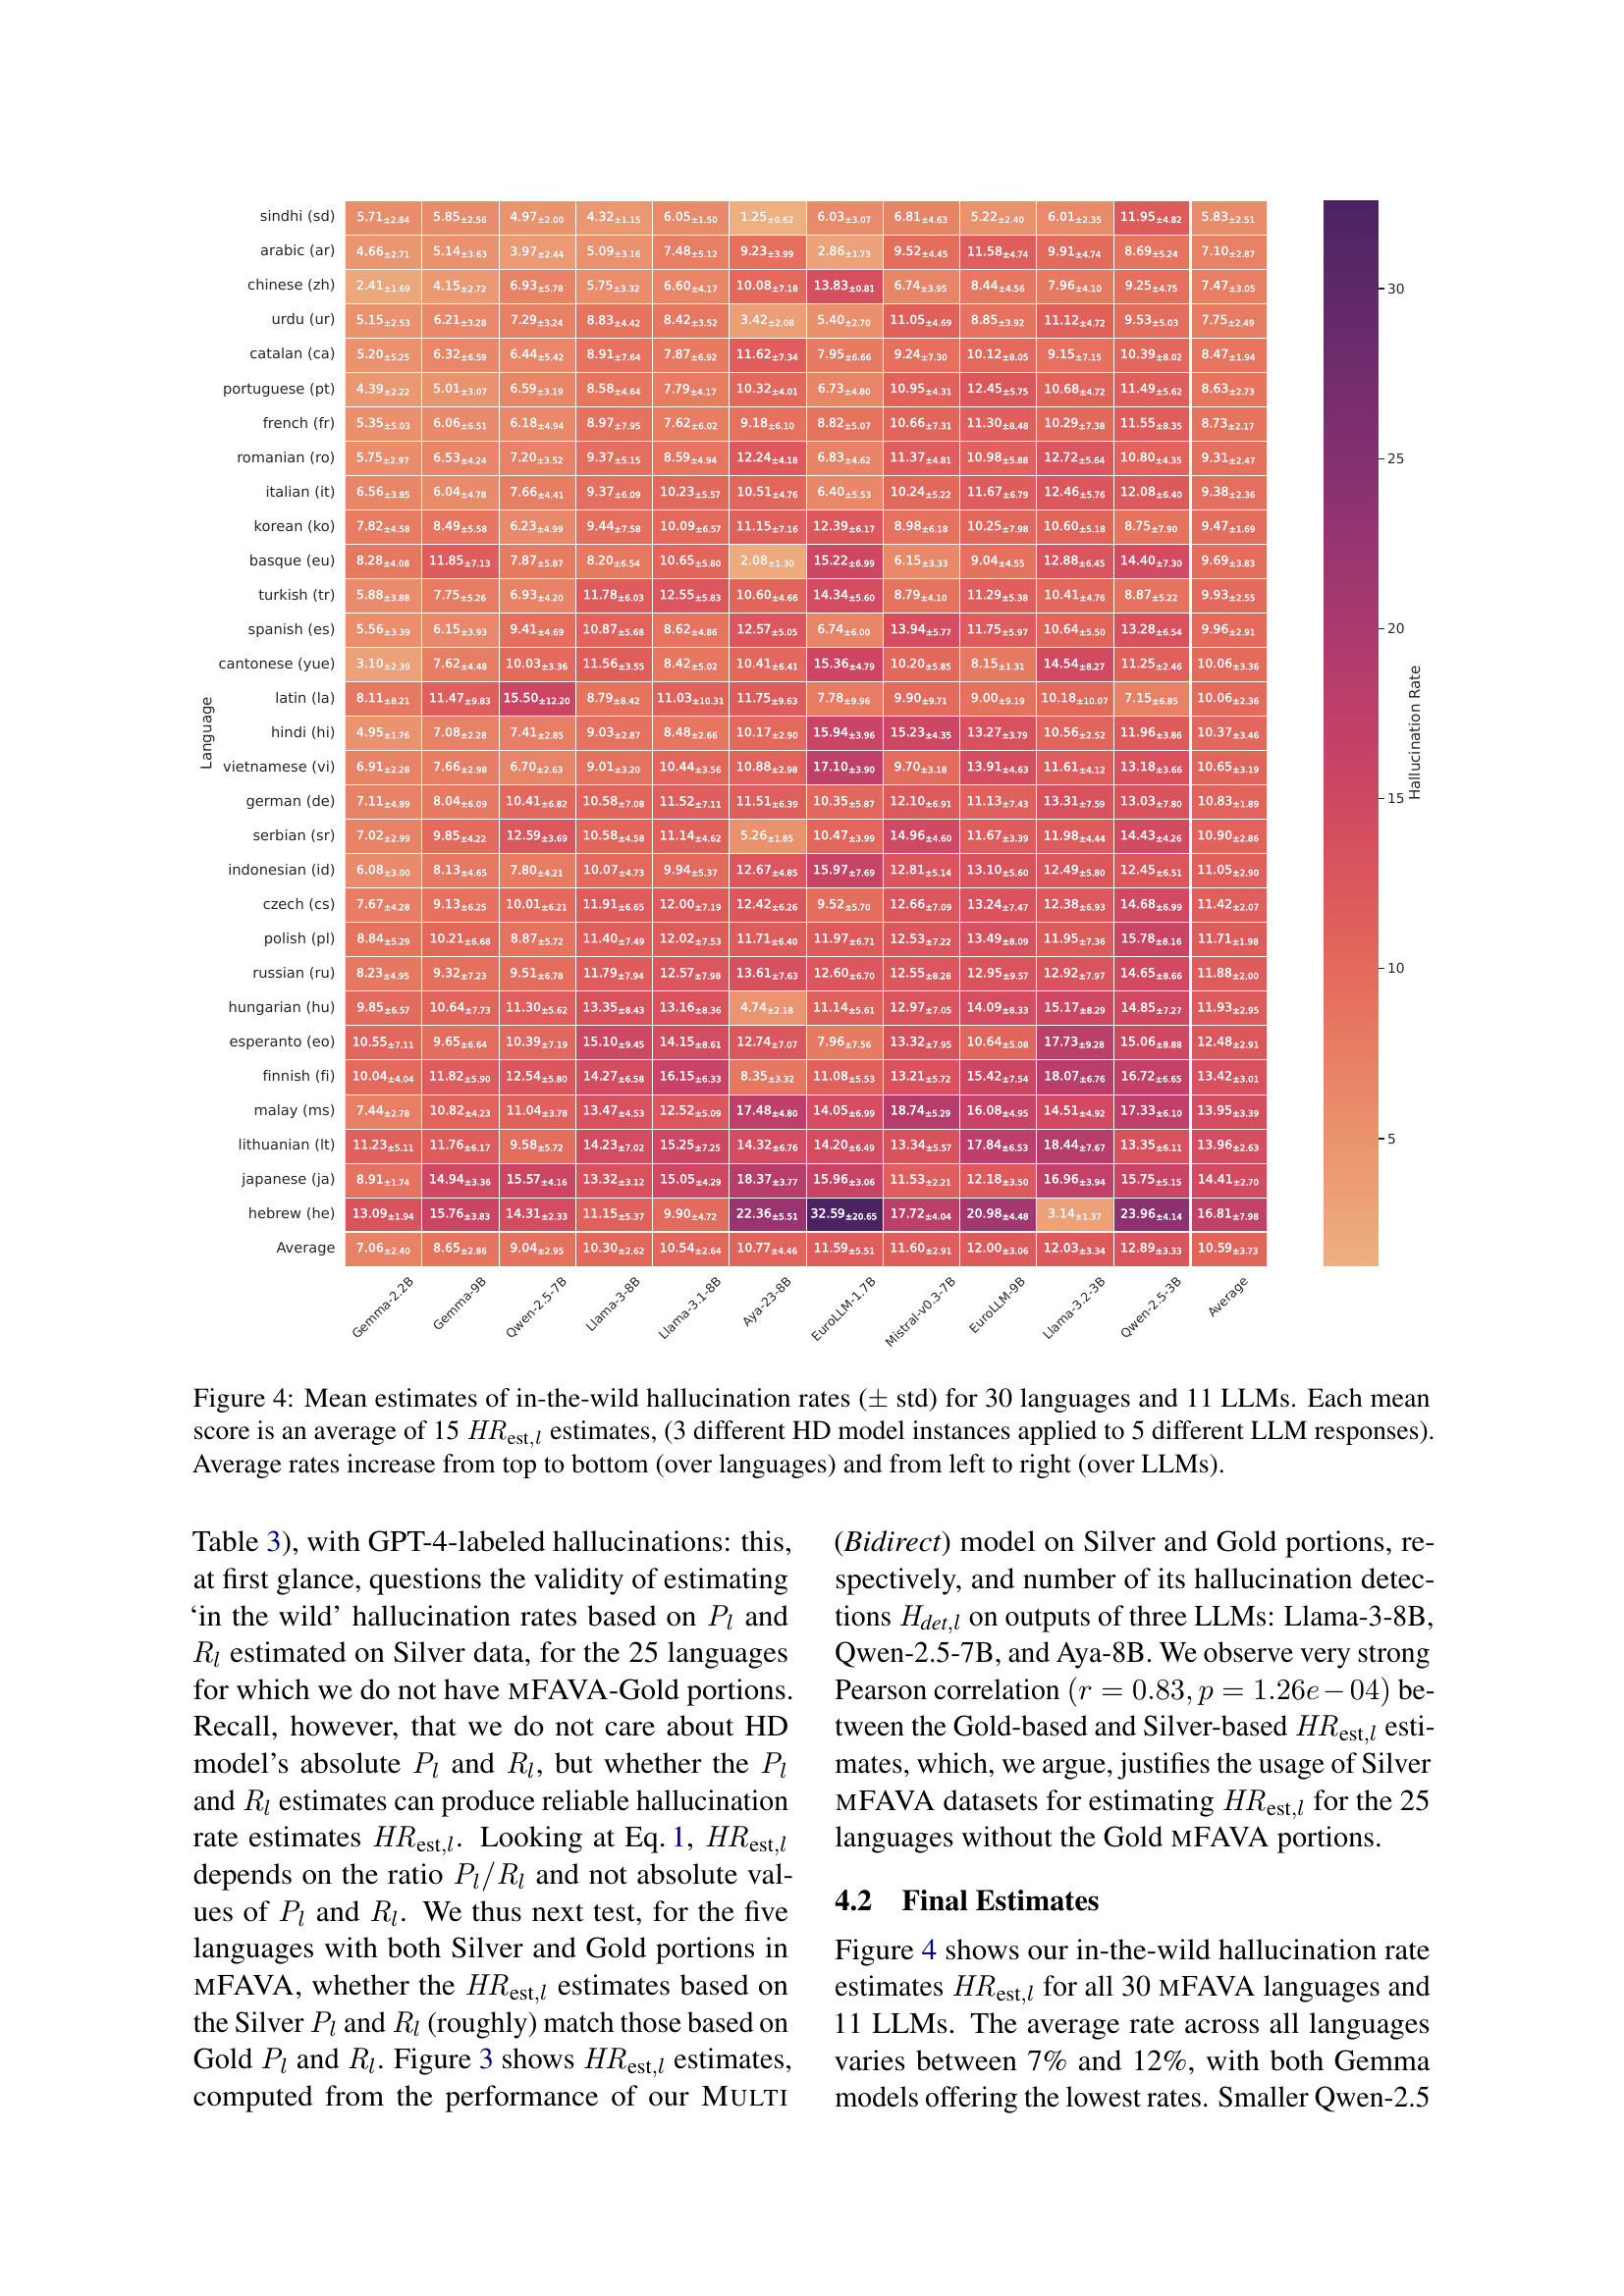
🔼 This figure displays the average hallucination rates for 30 different languages across 11 large language models (LLMs). Each data point represents the mean hallucination rate calculated from 15 individual estimates. These estimates were derived by applying three separate instances of a hallucination detection model to five different sets of responses generated by each LLM for each language. The figure visually represents how these hallucination rates vary across different languages (arranged vertically) and LLMs (arranged horizontally). Generally, the hallucination rates increase from the top to the bottom and from left to right.
read the caption
Figure 4: Mean estimates of in-the-wild hallucination rates (±plus-or-minus\pm± std) for 30 languages and 11 LLMs. Each mean score is an average of 15 𝐻𝑅est,lsubscript𝐻𝑅est𝑙\mathit{HR}_{\text{est},l}italic_HR start_POSTSUBSCRIPT est , italic_l end_POSTSUBSCRIPT estimates, (3 different HD model instances applied to 5 different LLM responses). Average rates increase from top to bottom (over languages) and from left to right (over LLMs).

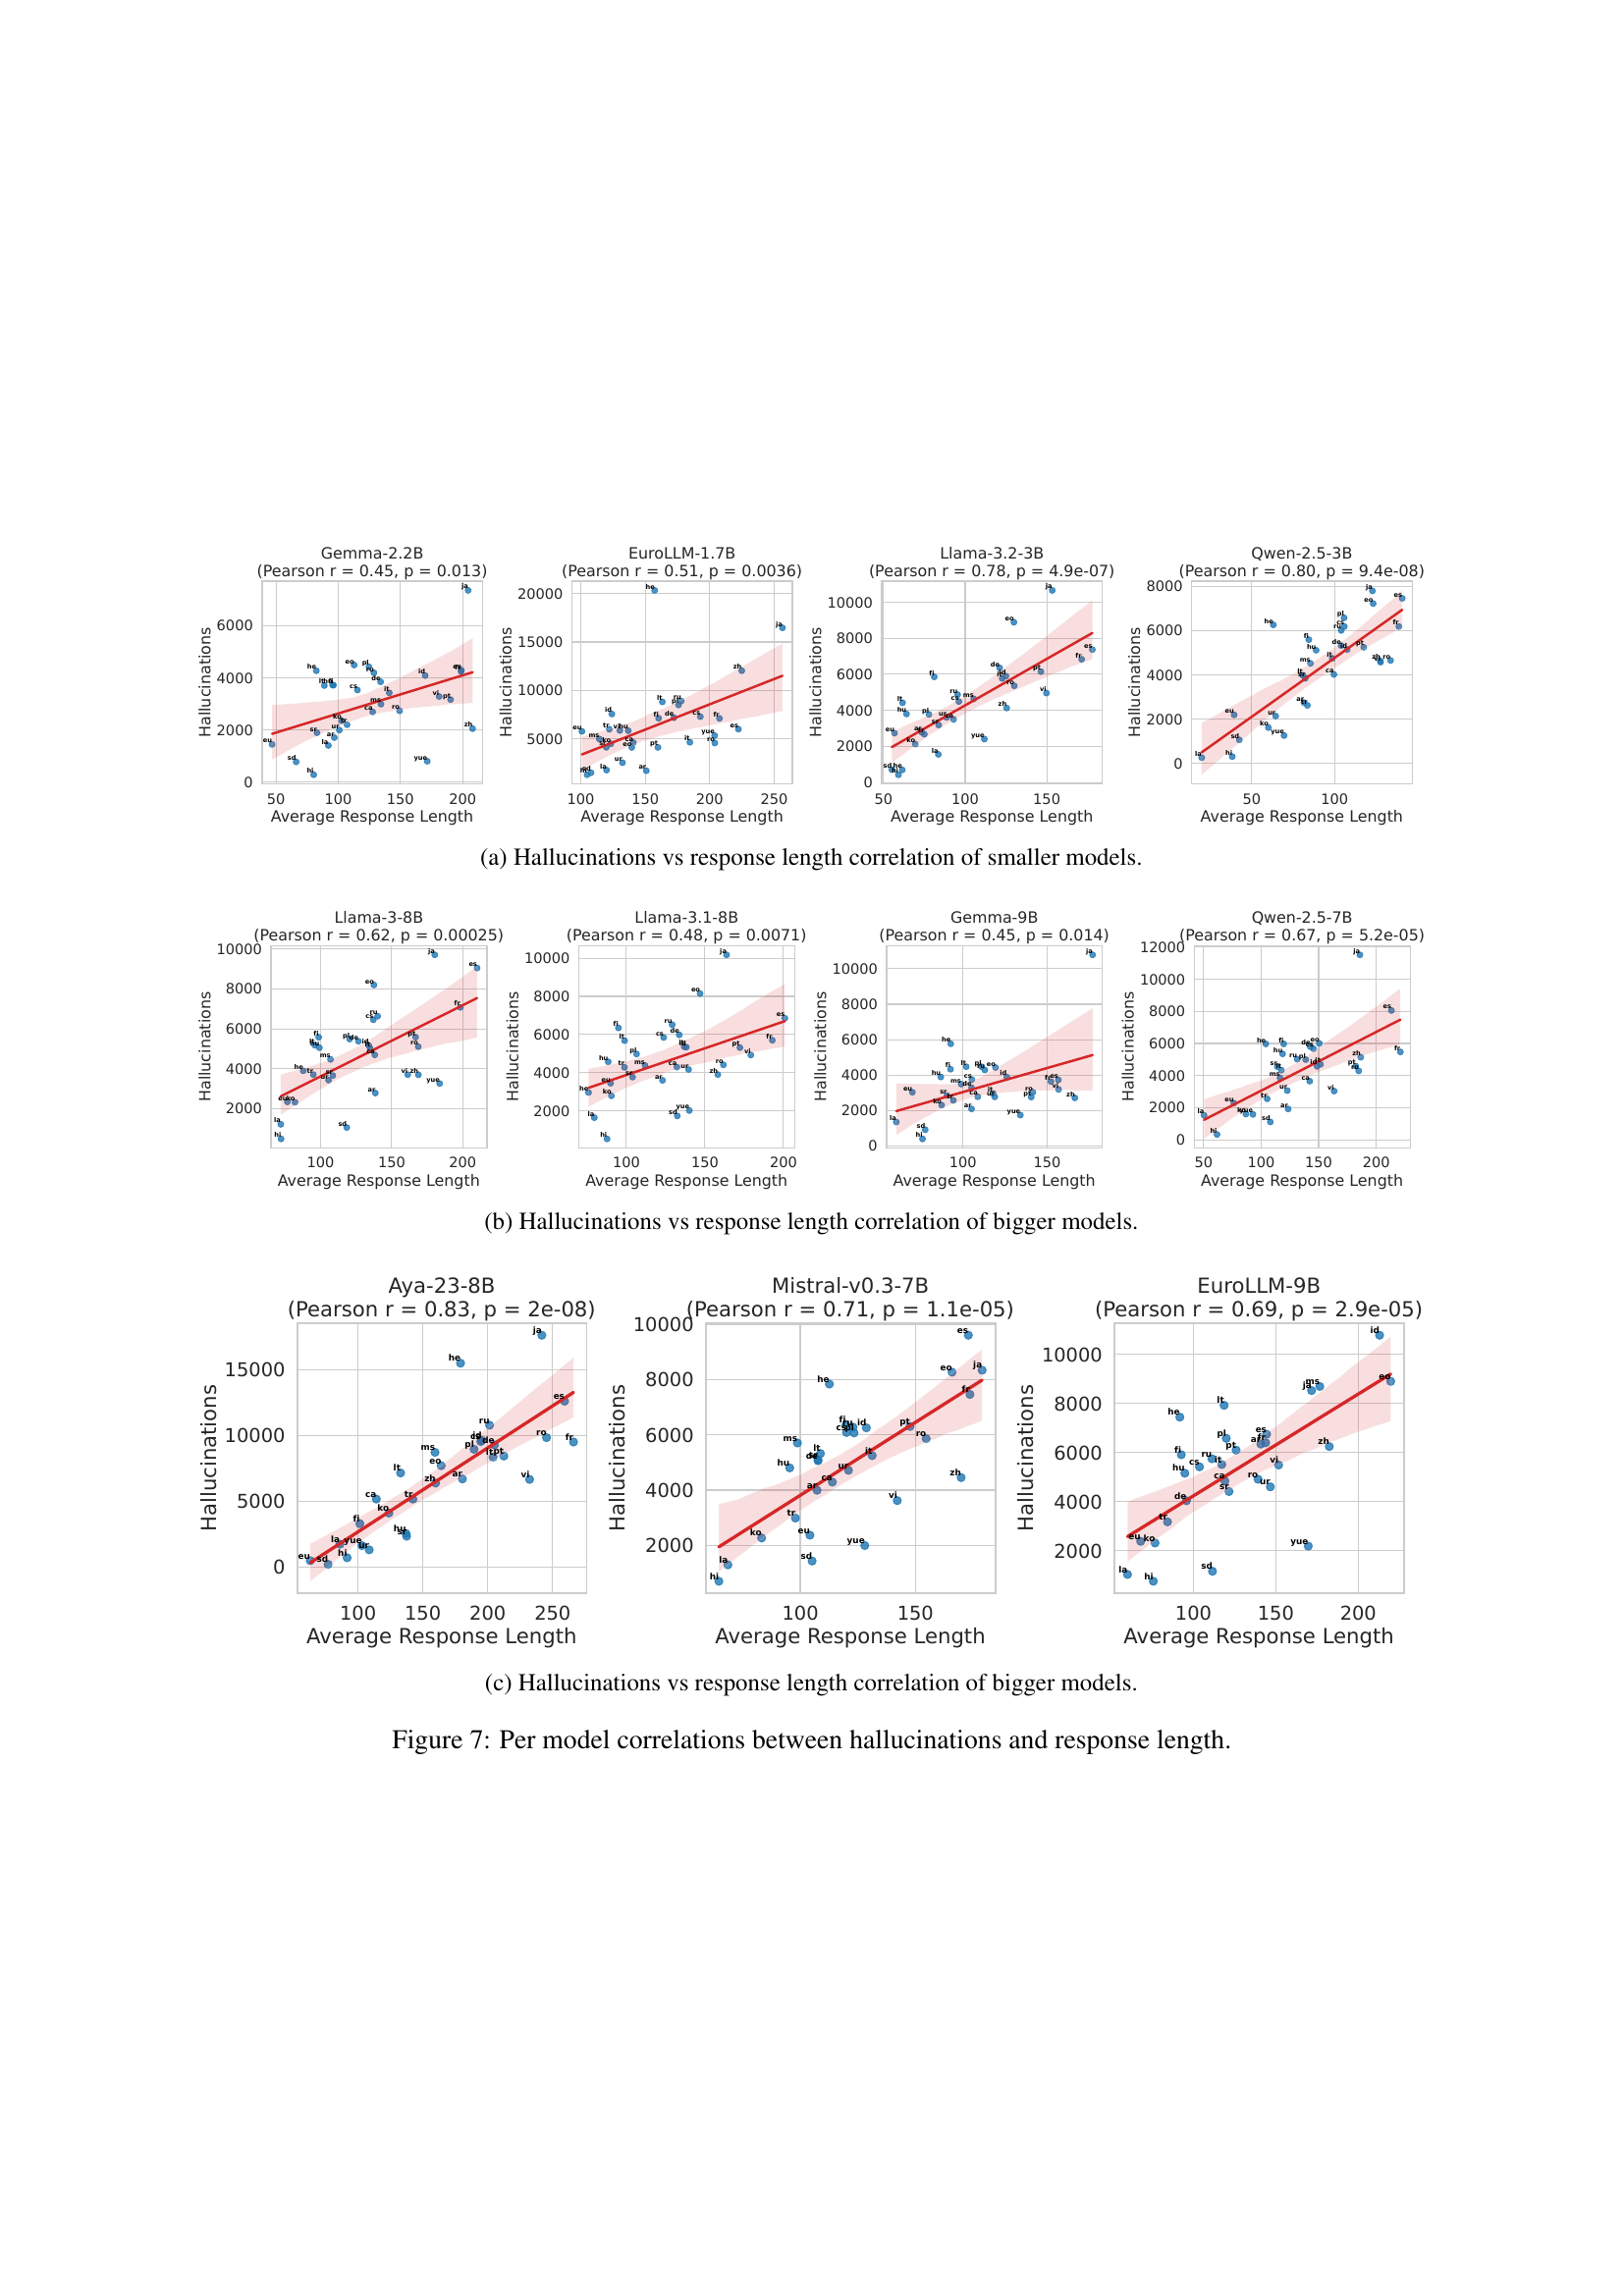
🔼 This figure displays the correlation between the number of hallucinations and the average response length for smaller language models. Each subplot represents a different language model, showing a scatter plot of average response length against the number of hallucinated tokens. A trend line is also included to visually represent the correlation.
read the caption
(a)
🔼 This figure displays the correlation between the average response length and the number of hallucinations detected by the model for larger language models. It shows scatter plots for each of several models, with the x-axis representing average response length and the y-axis representing the number of hallucinated tokens. The lines of best fit for each model are also shown to visualize the trend between response length and hallucination count. The Pearson correlation coefficient and p-value are provided for each model, indicating the statistical significance of the relationship.
read the caption
(b)

🔼 Figure 7c displays the correlation between the number of hallucinated tokens and the average response length for larger language models. It shows scatter plots and Pearson correlation coefficients for several different LLMs, revealing a strong positive correlation for most models. This suggests that longer responses tend to contain more hallucinated tokens, although the rate of hallucination (per token) may not necessarily increase.
read the caption
(c)

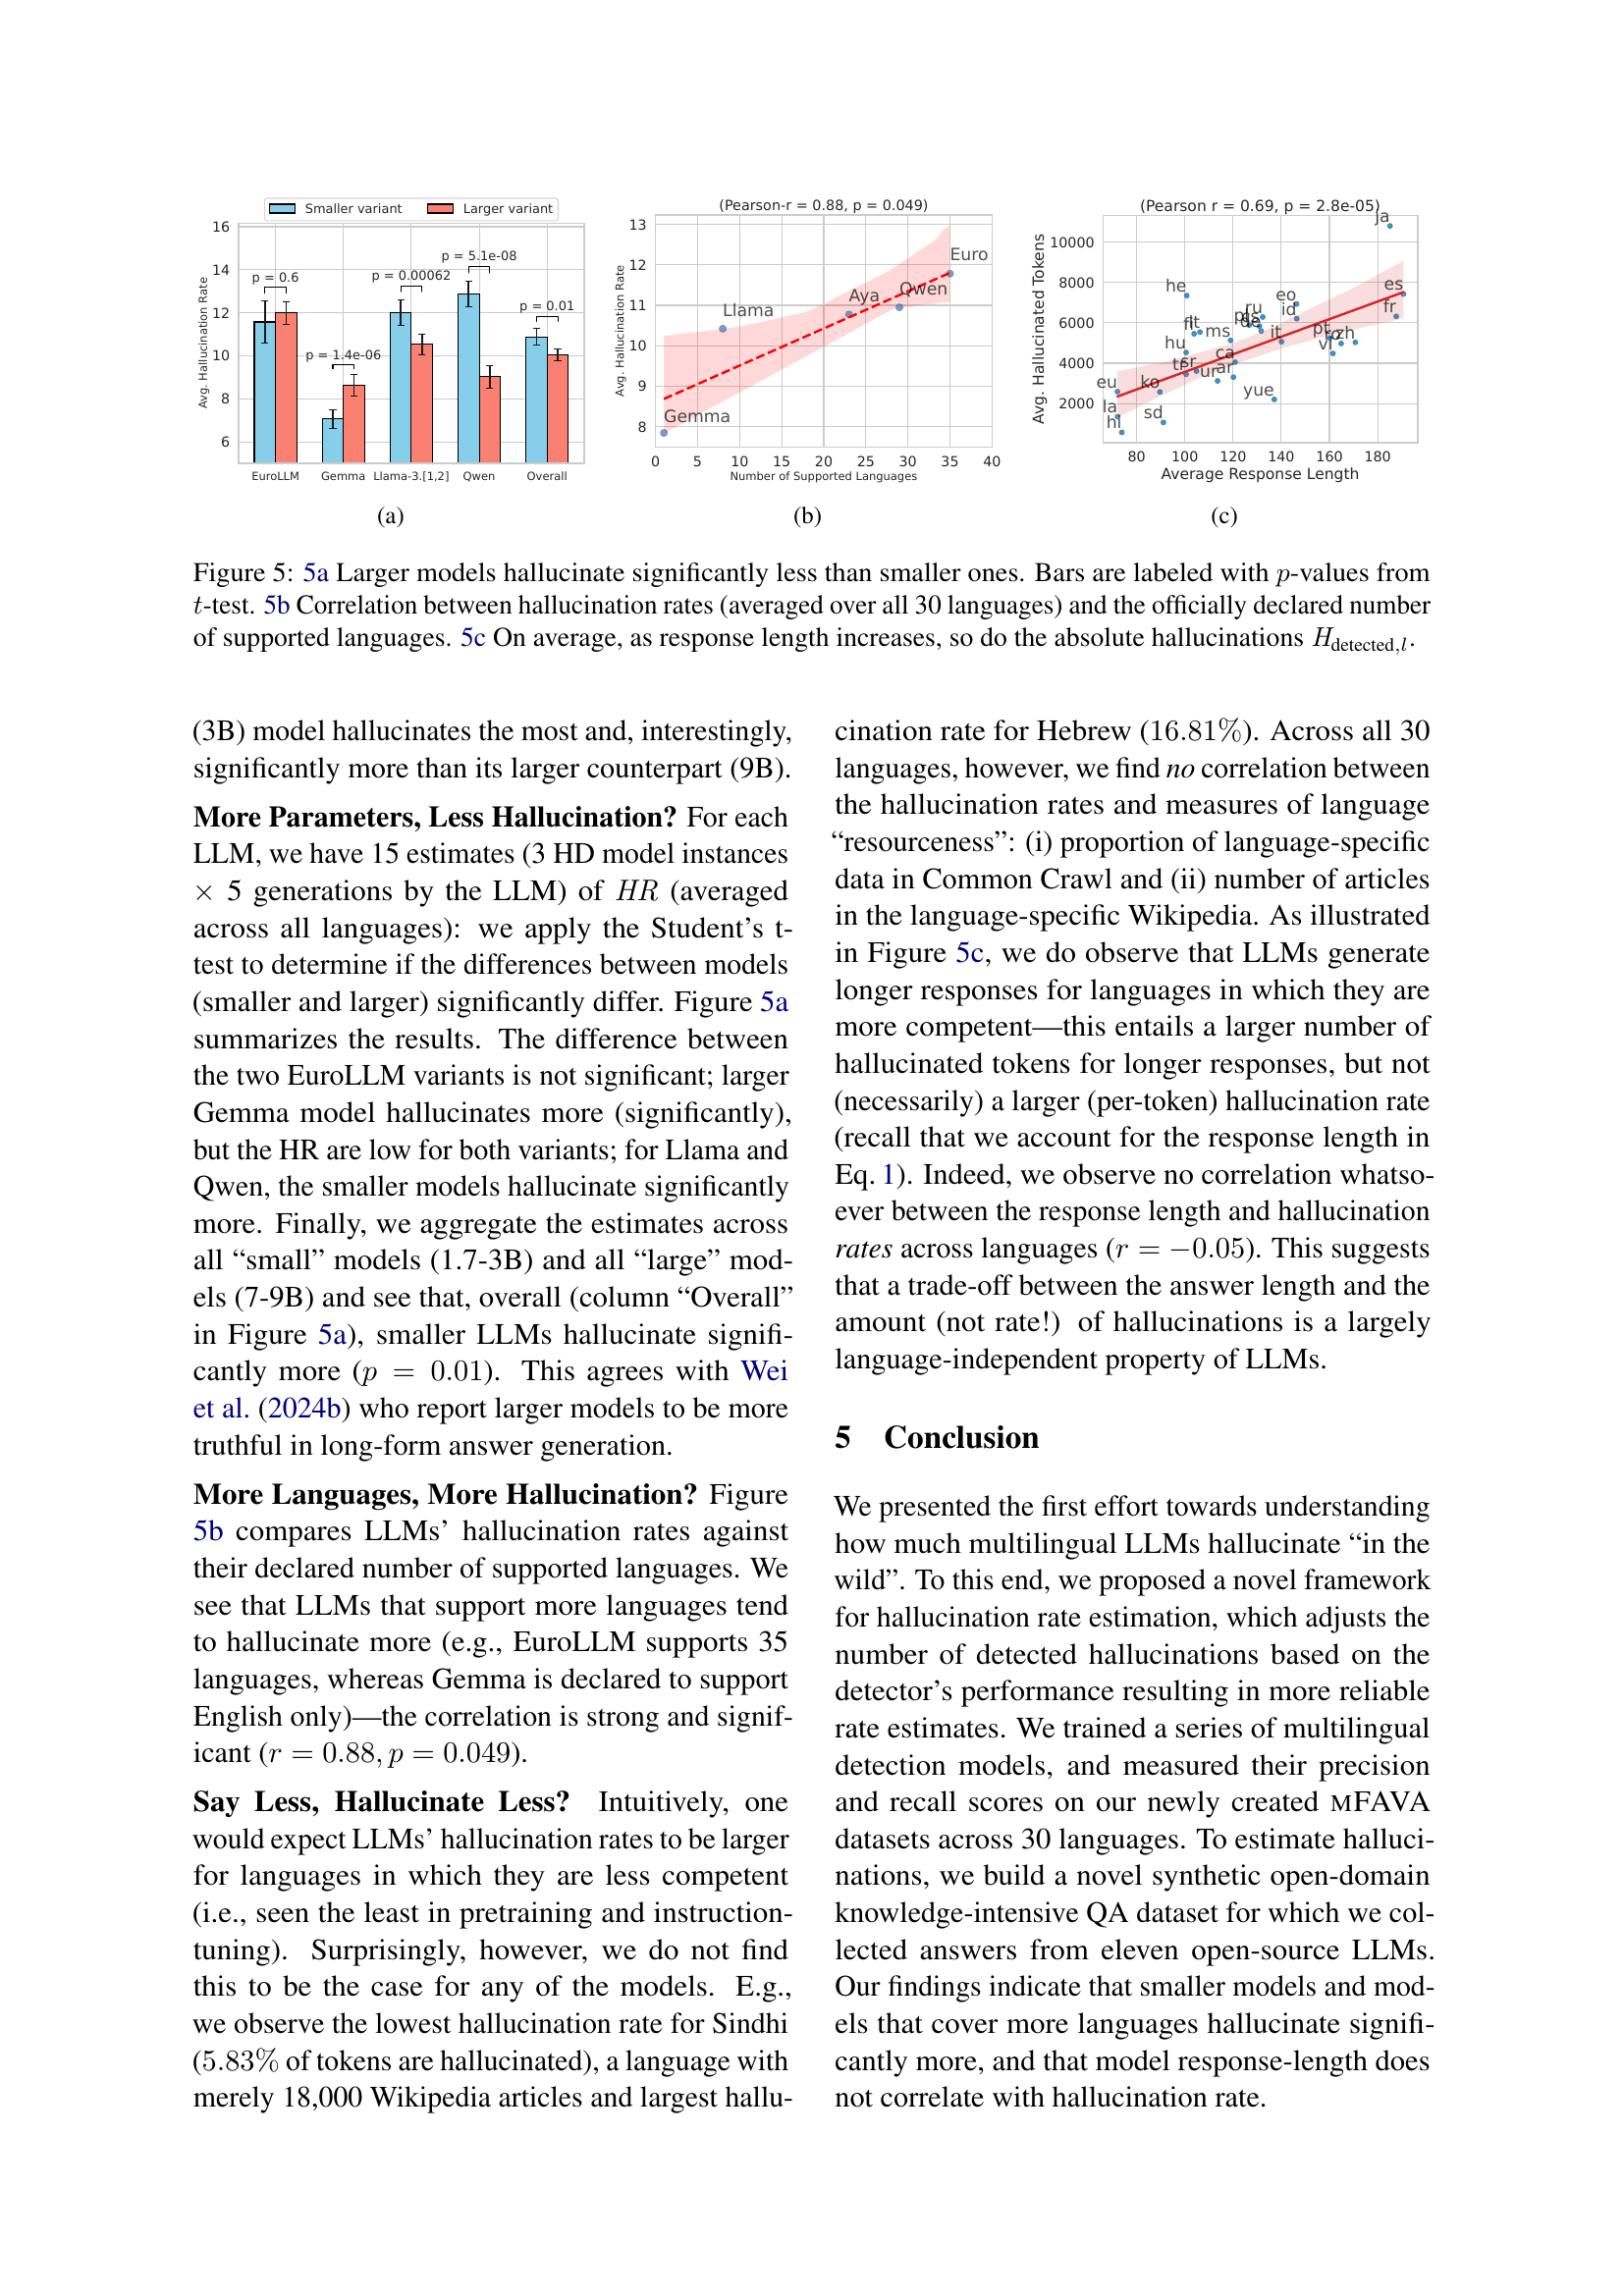
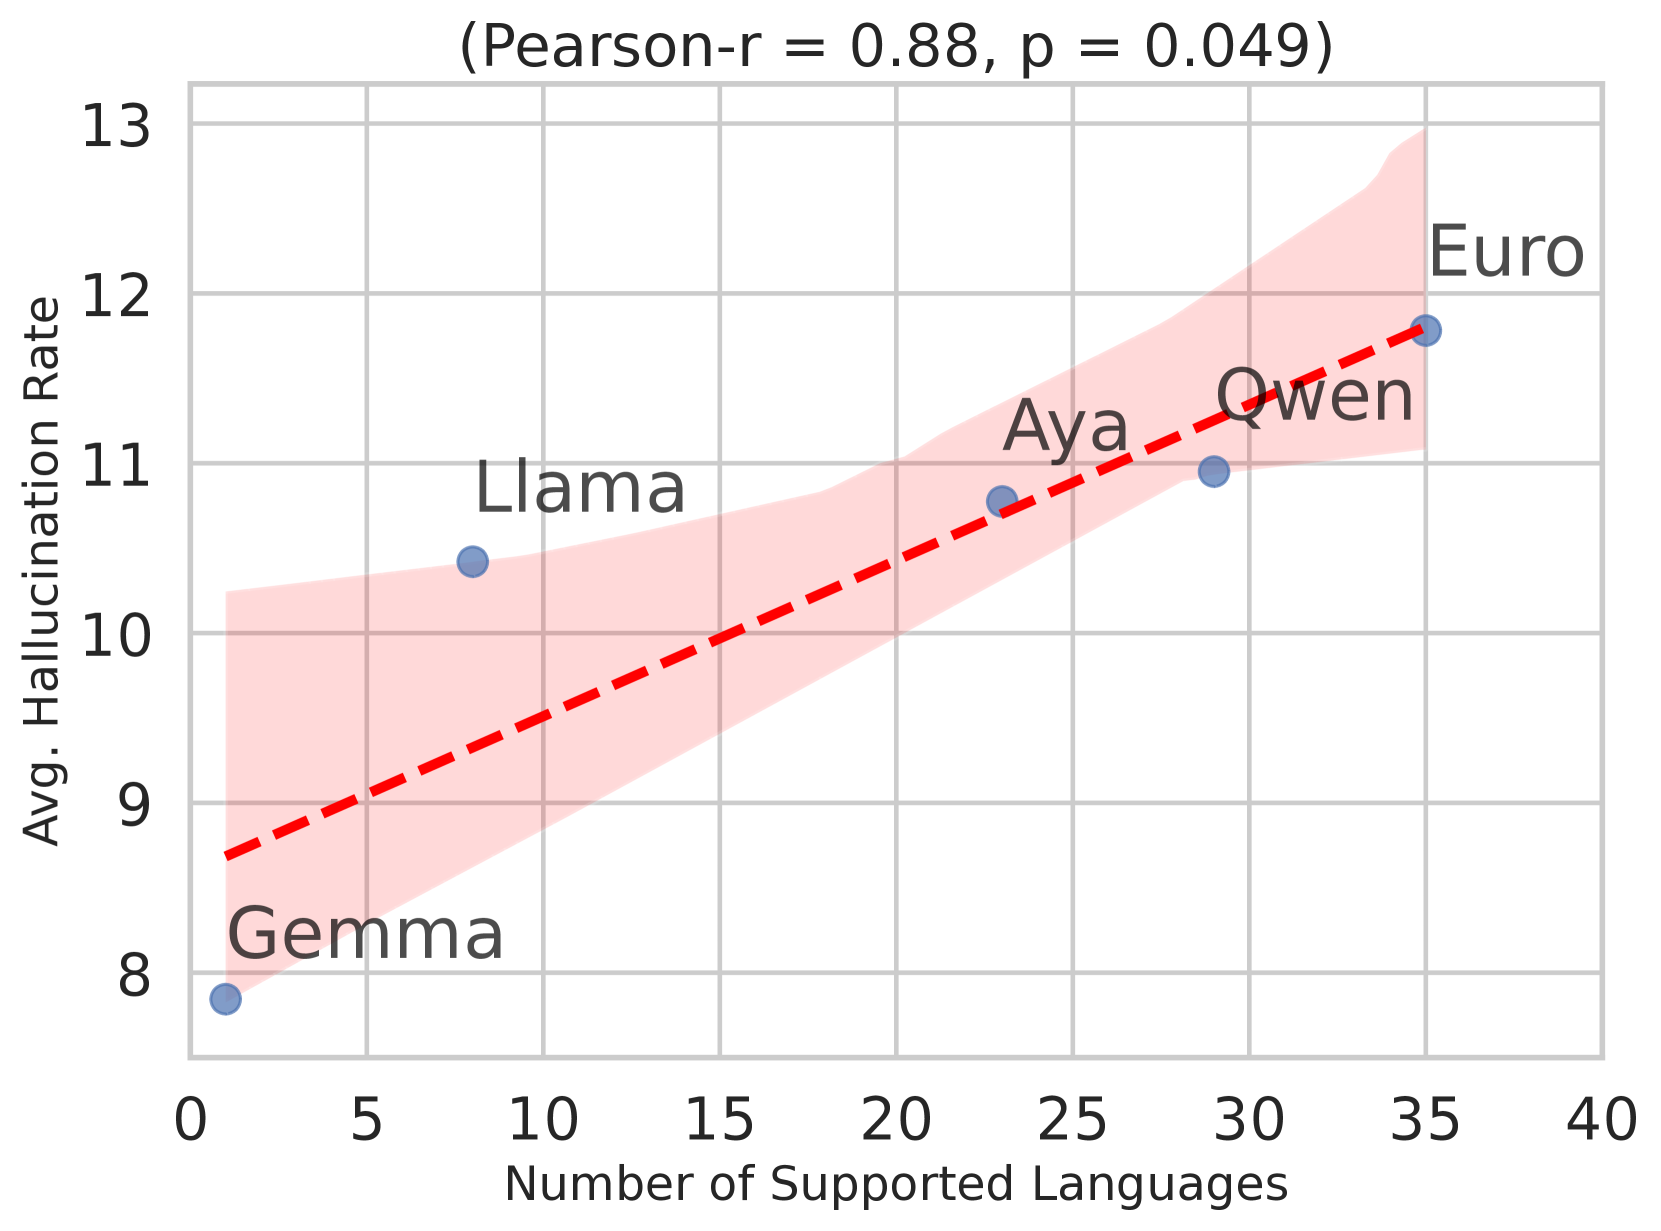
🔼 Figure 5 presents a threefold analysis of hallucination rates in large language models (LLMs). Panel (a) compares hallucination rates between smaller and larger versions of the same LLMs, showing that larger models exhibit significantly lower hallucination rates (as indicated by the p-values from t-tests displayed on the bars). Panel (b) illustrates a positive correlation between the number of languages supported by an LLM and its overall hallucination rate (averaged across all 30 languages examined). This suggests that models supporting more languages tend to hallucinate more often. Finally, panel (c) demonstrates that, on average, longer LLM responses contain more absolute hallucinated tokens (Hdetected,l), although the rate of hallucination per token might not show a significant trend.
read the caption
Figure 5: 5(a) Larger models hallucinate significantly less than smaller ones. Bars are labeled with p𝑝pitalic_p-values from t𝑡titalic_t-test. 5(b) Correlation between hallucination rates (averaged over all 30 languages) and the officially declared number of supported languages. 5(c) On average, as response length increases, so do the absolute hallucinations Hdetected,lsubscript𝐻detected𝑙\mathit{H}_{\text{detected},l}italic_H start_POSTSUBSCRIPT detected , italic_l end_POSTSUBSCRIPT.

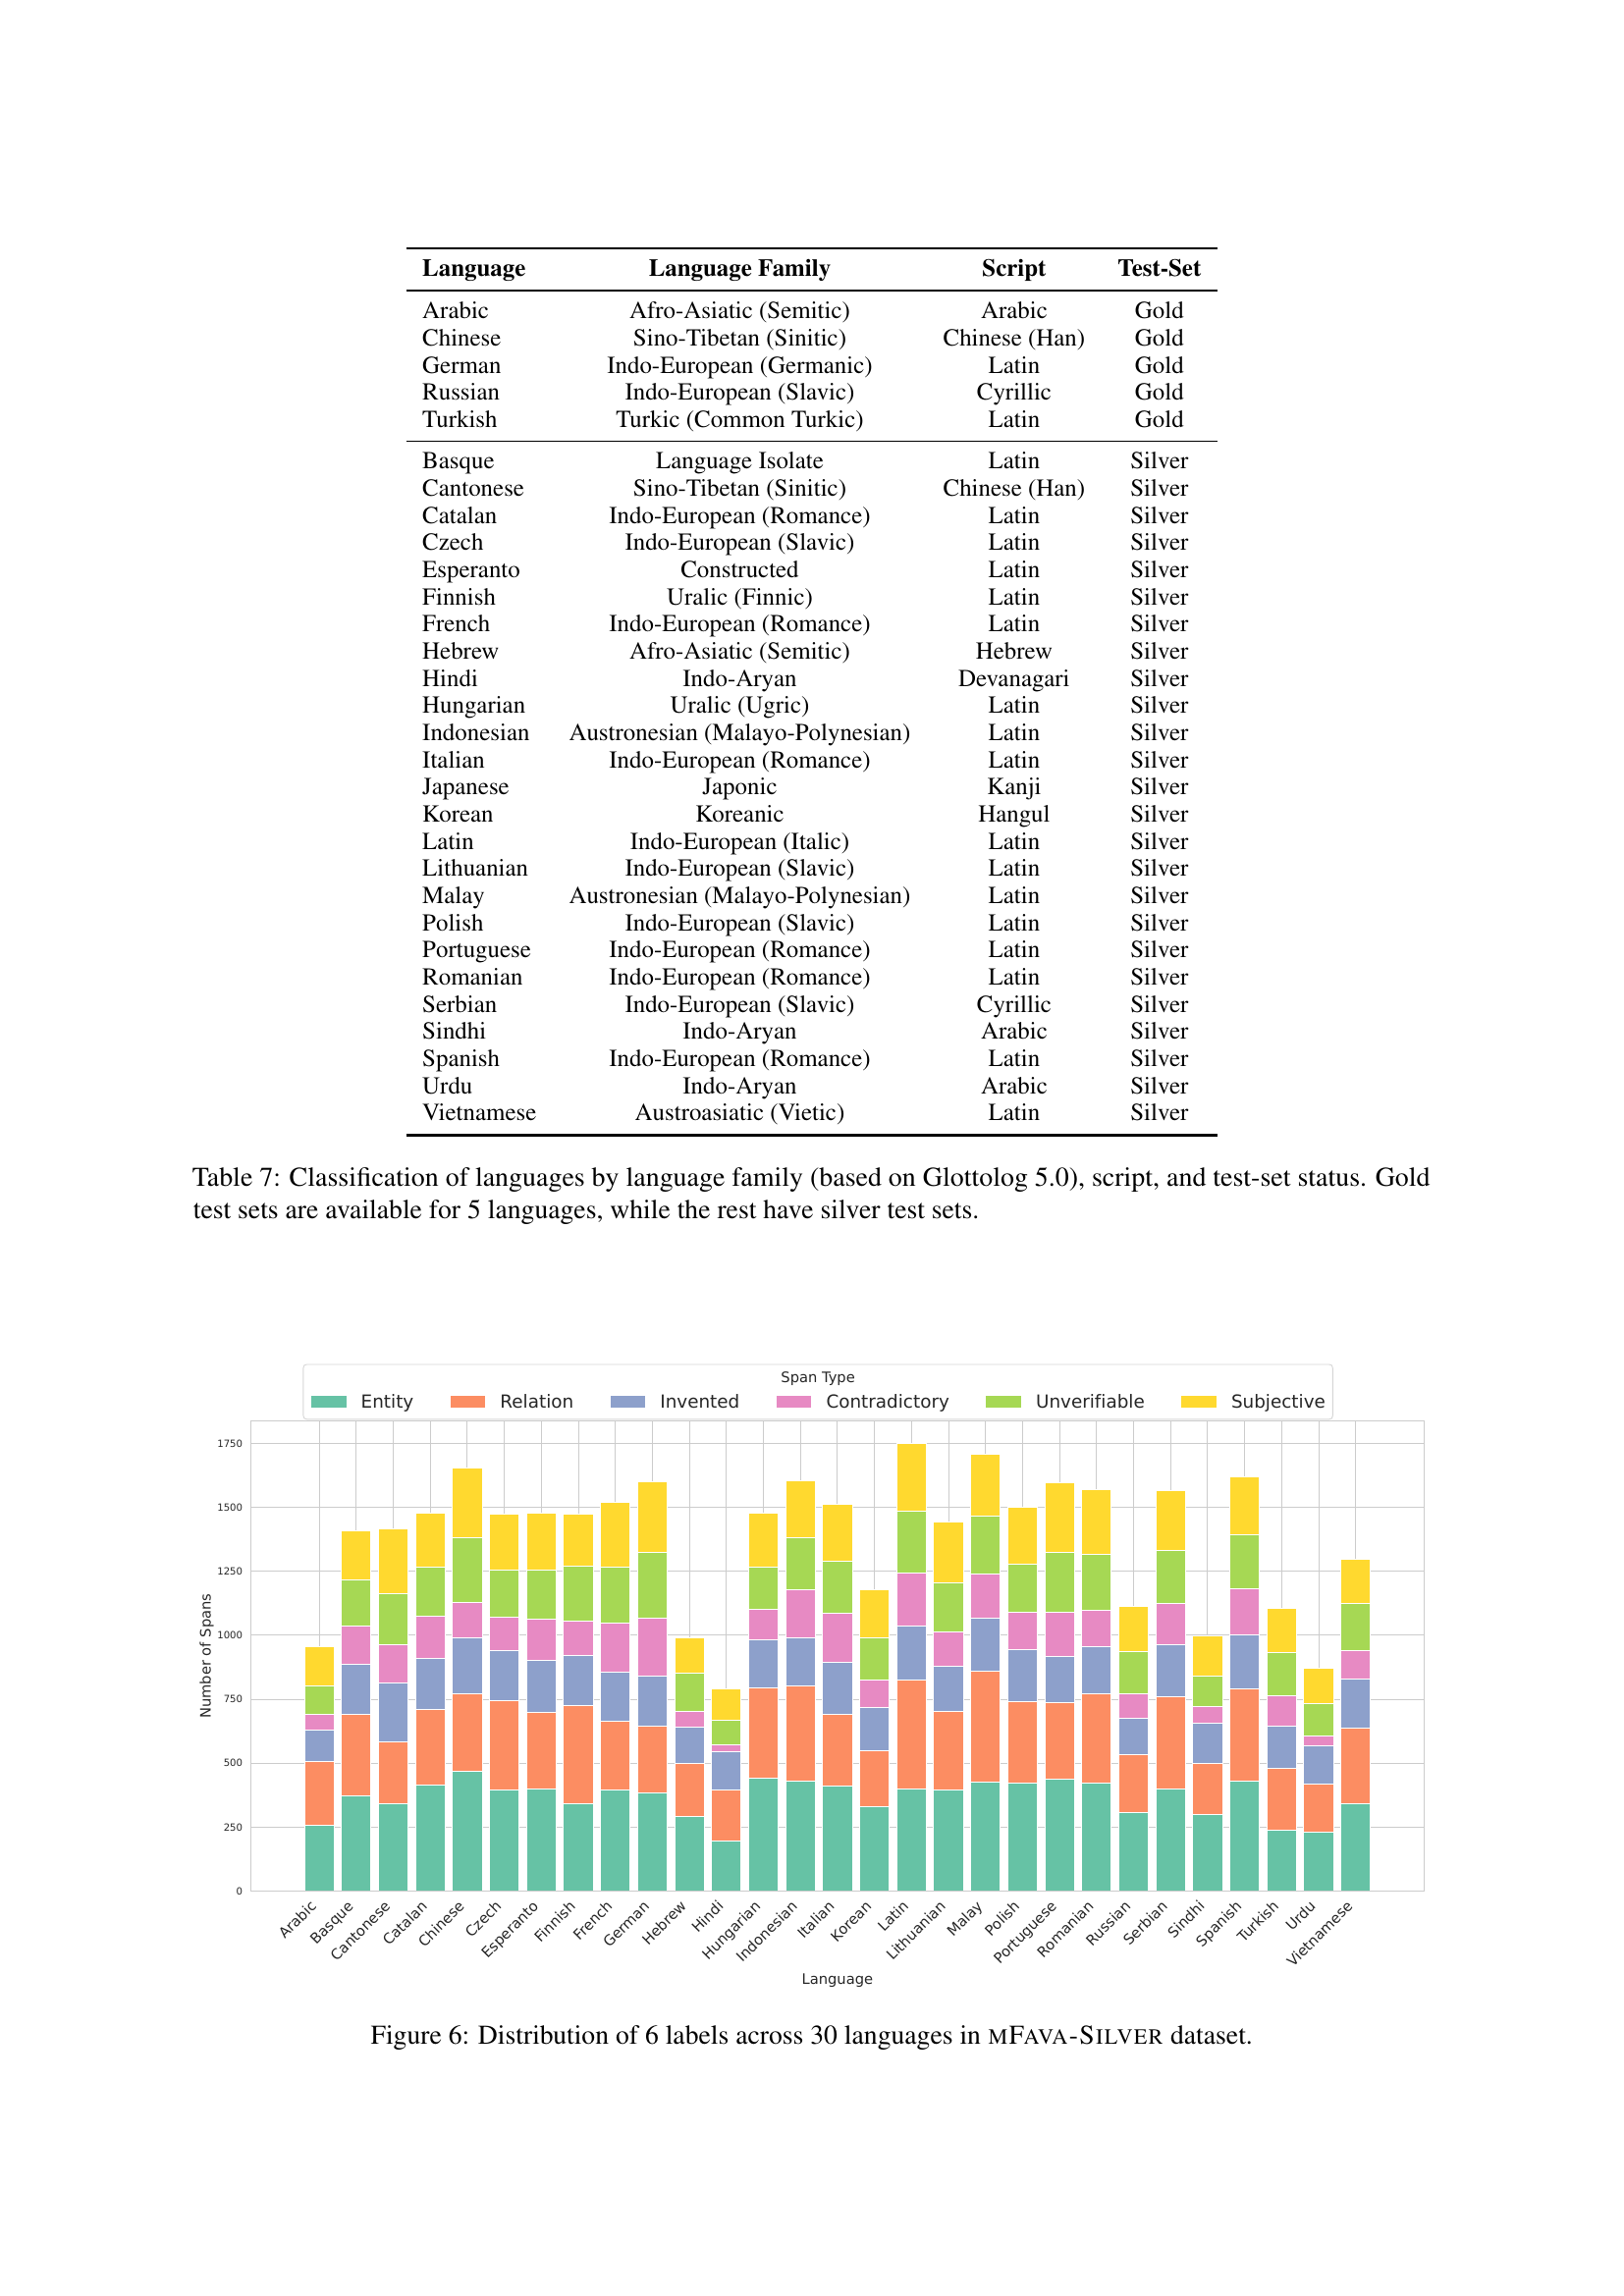
🔼 This figure shows a bar chart visualizing the distribution of six different types of hallucinations across 30 languages in the mFAVA-Silver dataset. Each bar represents a language, and the height of each colored segment within the bar corresponds to the proportion of hallucinations of a specific type (Entity, Relation, Invented, Contradictory, Unverifiable, Subjective) in that language. This provides a visual comparison of the prevalence of various hallucination categories across diverse languages within the synthetic dataset.
read the caption
Figure 6: Distribution of 6 labels across 30 languages in mFava-Silver dataset.

🔼 This figure displays the correlation between the number of hallucinations and the average response length generated by smaller language models. Each subplot represents a different language model, showing the relationship as a scatter plot with a regression line. The Pearson correlation coefficient and p-value are provided for each model, indicating the strength and statistical significance of the correlation.
read the caption
(a) Hallucinations vs response length correlation of smaller models.

🔼 This figure displays the correlation between the number of hallucinations and the average response length for larger language models. It visually represents how the length of a model’s response relates to the frequency of hallucinations within those responses. Each data point likely represents a specific language, or possibly an average across a group of languages, with larger language models used to generate the responses.
read the caption
(b) Hallucinations vs response length correlation of bigger models.

🔼 This figure shows the correlation between the number of hallucinations and the average response length for larger language models. It visually represents the relationship between the length of text generated by the models and how many factual errors or inconsistencies they contain. The results from several large language models are presented, allowing for a comparison of their performance in terms of both the length of their output and its accuracy.
read the caption
(c) Hallucinations vs response length correlation of bigger models.

🔼 This figure displays scatter plots illustrating the correlation between the average length of LLM responses and the number of hallucinations detected within those responses. The plots are separated by LLM model, allowing for a comparison of the relationship across different models (both smaller and larger models are included). Each plot shows the Pearson correlation coefficient (r) and p-value, indicating the strength and statistical significance of the correlation.
read the caption
Figure 7: Per model correlations between hallucinations and response length.
More on tables
| ENT | REL | INV | CON | UNV | SUB | Total | |
|---|---|---|---|---|---|---|---|
| RU | 184 | 65 | 188 | 287 | 211 | 153 | 1,088 |
| AR | 144 | 10 | 171 | 123 | 150 | 69 | 667 |
| ZH | 264 | 18 | 259 | 282 | 265 | 139 | 1,227 |
| DE | 546 | 25 | 311 | 324 | 333 | 238 | 1,777 |
| TR | 149 | 27 | 288 | 244 | 161 | 149 | 1,018 |
| Total | 1,287 | 145 | 1,217 | 1,260 | 1,120 | 748 | 5,777 |
🔼 This table presents a detailed breakdown of hallucination types found in a gold standard dataset across multiple languages. The dataset consists of human-annotated text examples where specific spans of text are identified as containing hallucinations. The types of hallucinations are categorized into six distinct classes: Entity, Relation, Invented, Contradictory, Unverifiable, and Subjective. The table shows the frequency count of each type of hallucination found in each of the languages within the dataset, providing a granular view of the types and prevalence of LLM hallucinations in different linguistic contexts.
read the caption
Table 2: Hallucinated span counts in the gold dataset across languages. ENT (Entity), REL (Relation), INV (Invented), CON (Contradictory), UNV (Unverifiable), SUB (Subjective).
| German | Chinese | Arabic | Russian | Turkish | ||||||||
|---|---|---|---|---|---|---|---|---|---|---|---|---|
| Task | Model | Context | Silver | Gold | Silver | Gold | Silver | Gold | Silver | Gold | Silver | Gold |
| Mono | Bidirect | 78.0 | 58.0 | 62.4 | 55.1 | 75.3 | 54.4 | 78.9 | 60.7 | 78.5 | 66.7 | |
| Binary | Multi | Bidirect | 89.5 | 65.0 | 69.7 | 58.7 | 82.5 | 61.6 | 89.1 | 65.5 | 86.4 | 72.5 |
| \cdashline2-13 | Multi | Causal | 81.8 | 59.6 | 76.3 | 62.2 | 75.3 | 60.0 | 75.8 | 55.6 | 75.7 | 67.3 |
| Mono | Bidirect | 53.4 | 38.3 | 35.2 | 22.6 | 14.6 | 7.3 | 63.3 | 36.2 | 49.1 | 30.3 | |
| Category | Multi | Bidirect | 73.2 | 45.0 | 46.5 | 30.1 | 66.1 | 37.2 | 72.3 | 41.5 | 72.9 | 51.8 |
| \cdashline2-13 | Multi | Causal | 68.7 | 43.4 | 56.5 | 34.1 | 51.8 | 29.4 | 62.6 | 37.9 | 58.6 | 42.4 |
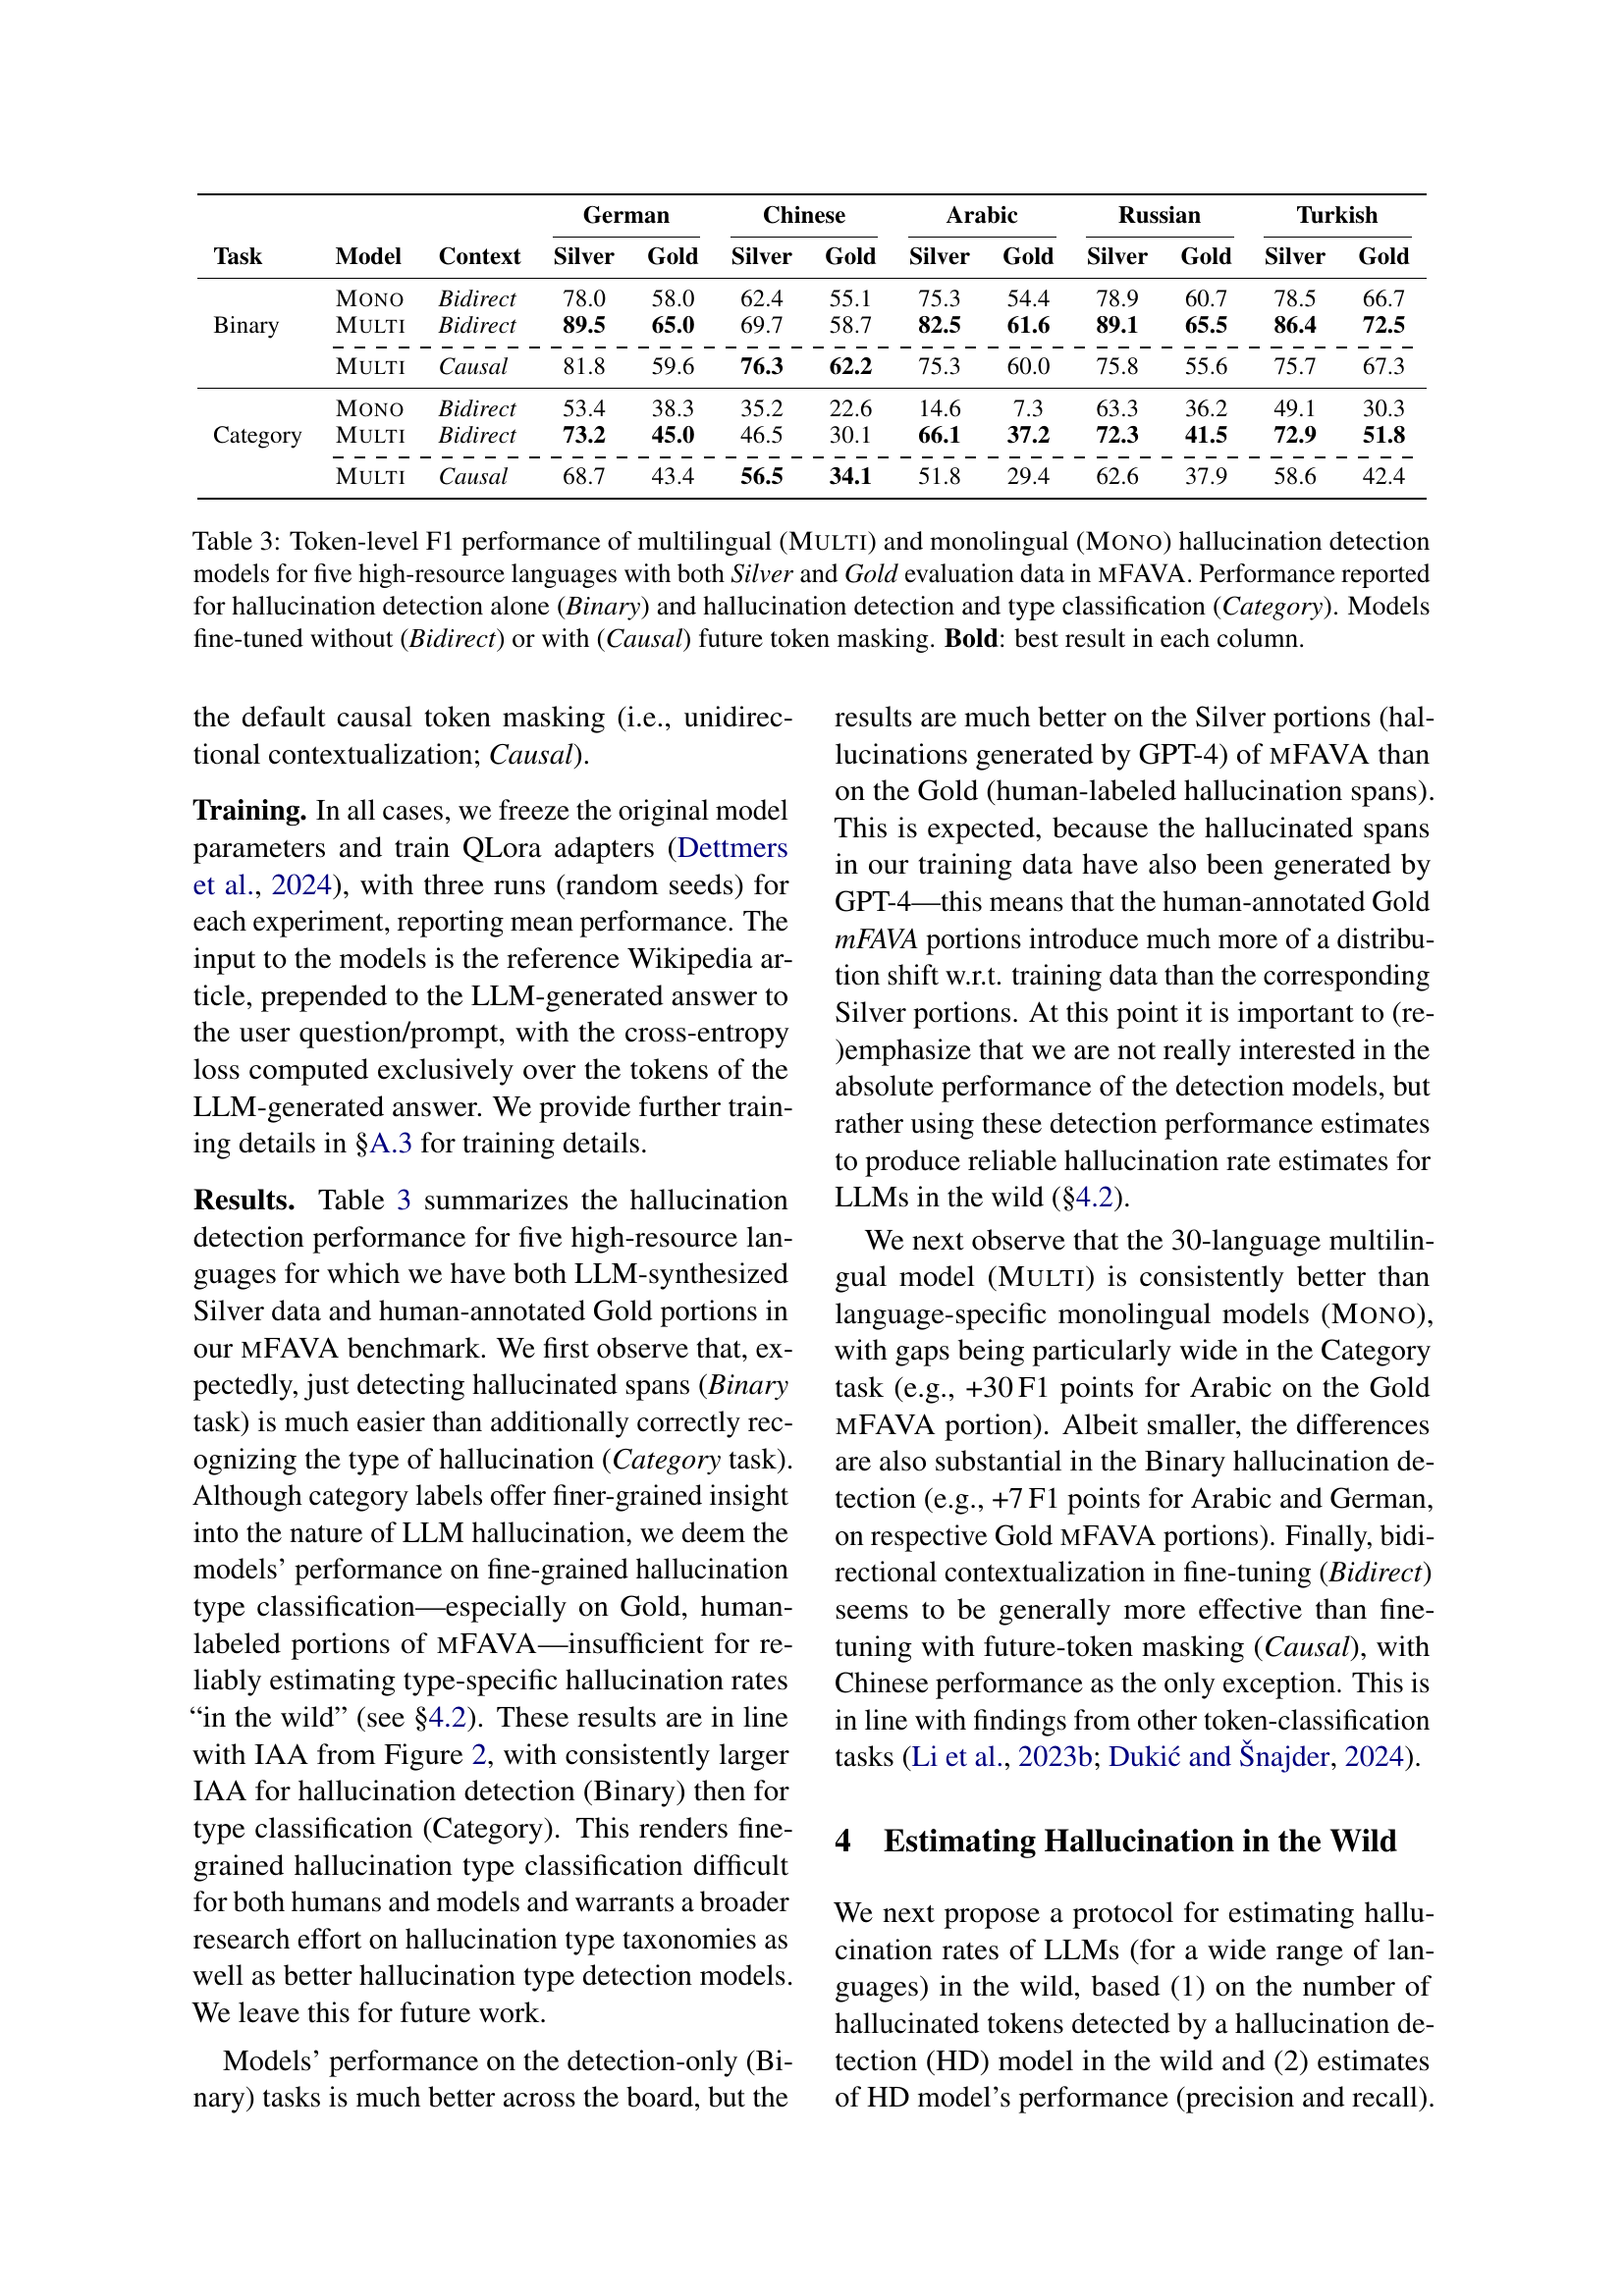
🔼 This table presents the token-level F1 scores achieved by both multilingual and monolingual hallucination detection models. The models were evaluated on the MFAVA benchmark, using both automatically generated (Silver) and human-annotated (Gold) datasets. Two tasks are considered: binary classification (hallucination detection only) and category classification (hallucination detection and type classification). The models were fine-tuned with and without future token masking. The best result in each column is bolded.
read the caption
Table 3: Token-level F1 performance of multilingual (Multi) and monolingual (Mono) hallucination detection models for five high-resource languages with both Silver and Gold evaluation data in mFAVA. Performance reported for hallucination detection alone (Binary) and hallucination detection and type classification (Category). Models fine-tuned without (Bidirect) or with (Causal) future token masking. Bold: best result in each column.
| ENT | REL | INV | CON | UNV | SUB | |
|---|---|---|---|---|---|---|
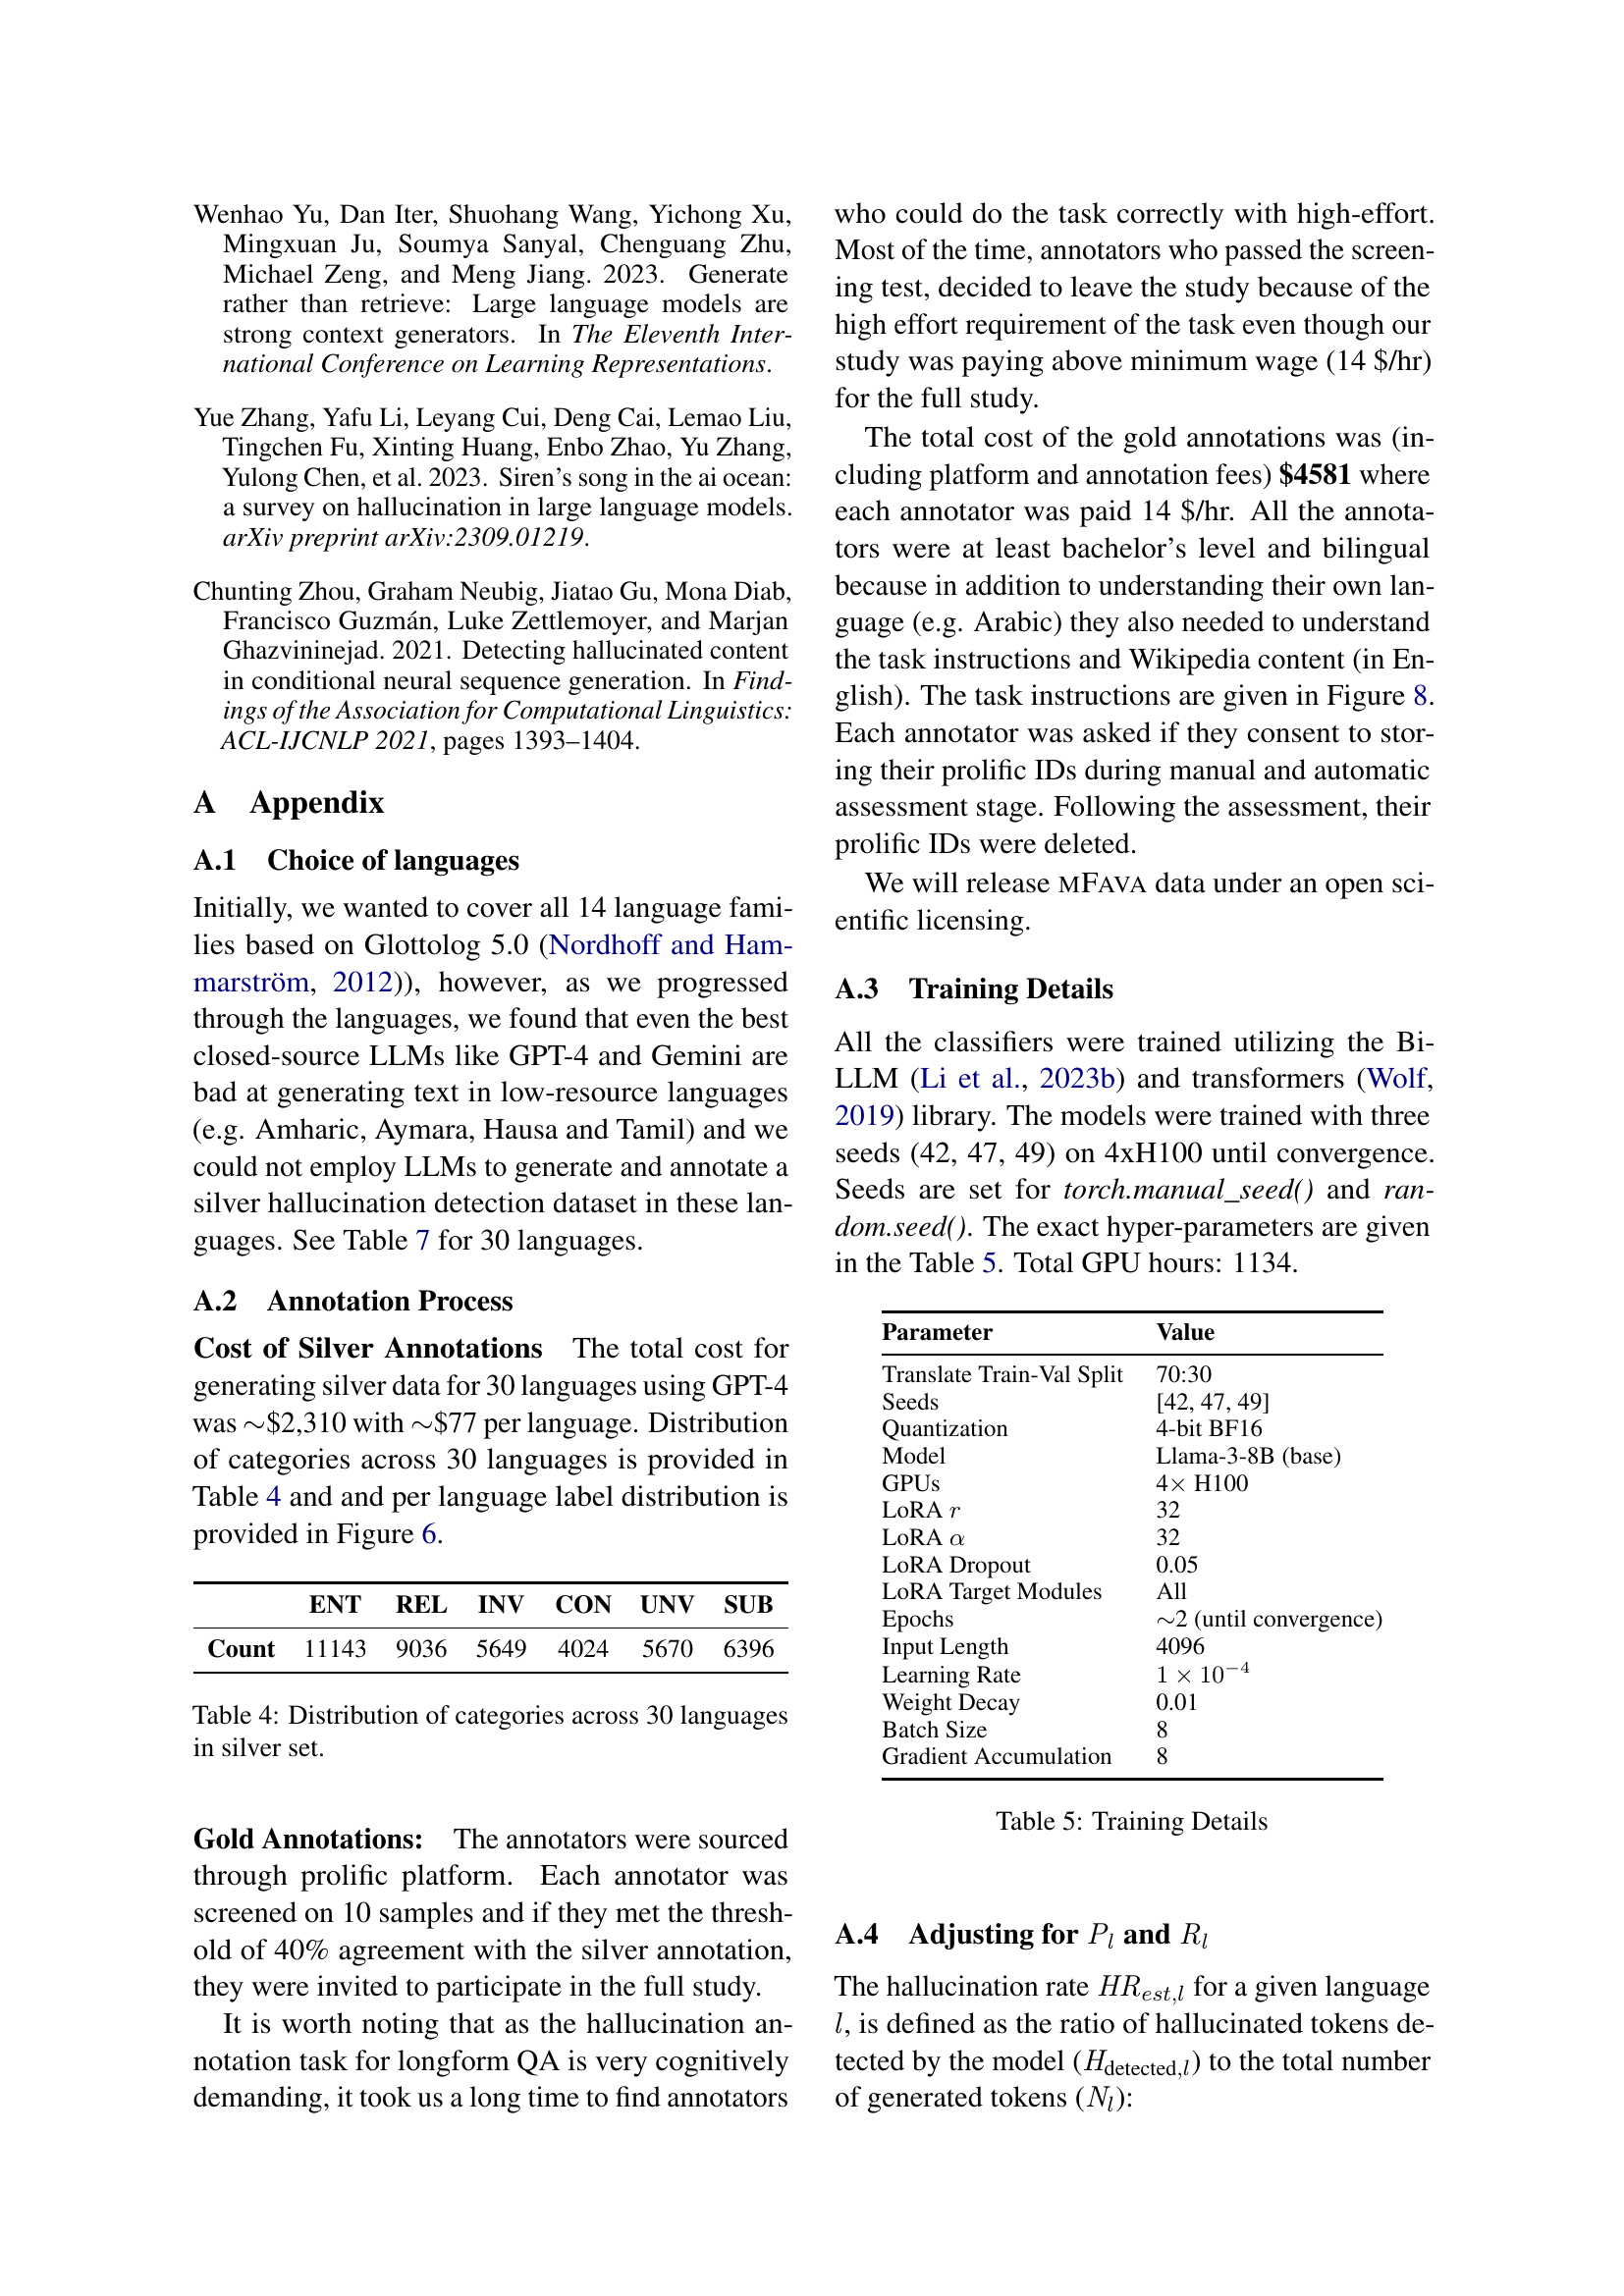
| Count | 11143 | 9036 | 5649 | 4024 | 5670 | 6396 |
🔼 This table presents the distribution of hallucination categories across 30 languages in the MFAVA-Silver dataset. The MFAVA-Silver dataset is a synthetically generated dataset used for evaluating the performance of a multilingual hallucination detection model. The categories of hallucinations include: Entity, Relation, Invented, Contradictory, Unverifiable, and Subjective. Each category represents a different type of factual error or inaccuracy generated by a large language model. The numbers presented in the table show the count of each hallucination type across the 30 languages, providing insight into the prevalence and distribution of different types of errors.
read the caption
Table 4: Distribution of categories across 30 languages in silver set.
| Parameter | Value |
|---|---|
| Translate Train-Val Split | 70:30 |
| Seeds | [42, 47, 49] |
| Quantization | 4-bit BF16 |
| Model | Llama-3-8B (base) |
| GPUs | 4 H100 |
| LoRA | 32 |
| LoRA | 32 |
| LoRA Dropout | 0.05 |
| LoRA Target Modules | All |
| Epochs | 2 (until convergence) |
| Input Length | 4096 |
| Learning Rate | |
| Weight Decay | 0.01 |
| Batch Size | 8 |
| Gradient Accumulation | 8 |
🔼 This table details the training settings used for the multilingual hallucination detection models. It specifies parameters such as the train-validation split, random seeds used for reproducibility, the quantization method employed, the model architecture (Llama-3-8B), the type of precision used (4-bit BF16), the hardware used for training (4x H100 GPUs), the LoRA (Low-Rank Adaptation) hyperparameters (r, alpha, dropout), the target layers for LoRA application, the number of training epochs (until convergence), the learning rate, weight decay, batch size, and gradient accumulation steps.
read the caption
Table 5: Training Details
| Language | Language Family | Script | Test-Set |
|---|---|---|---|
| Arabic | Afro-Asiatic (Semitic) | Arabic | Gold |
| Chinese | Sino-Tibetan (Sinitic) | Chinese (Han) | Gold |
| German | Indo-European (Germanic) | Latin | Gold |
| Russian | Indo-European (Slavic) | Cyrillic | Gold |
| Turkish | Turkic (Common Turkic) | Latin | Gold |
| Basque | Language Isolate | Latin | Silver |
| Cantonese | Sino-Tibetan (Sinitic) | Chinese (Han) | Silver |
| Catalan | Indo-European (Romance) | Latin | Silver |
| Czech | Indo-European (Slavic) | Latin | Silver |
| Esperanto | Constructed | Latin | Silver |
| Finnish | Uralic (Finnic) | Latin | Silver |
| French | Indo-European (Romance) | Latin | Silver |
| Hebrew | Afro-Asiatic (Semitic) | Hebrew | Silver |
| Hindi | Indo-Aryan | Devanagari | Silver |
| Hungarian | Uralic (Ugric) | Latin | Silver |
| Indonesian | Austronesian (Malayo-Polynesian) | Latin | Silver |
| Italian | Indo-European (Romance) | Latin | Silver |
| Japanese | Japonic | Kanji | Silver |
| Korean | Koreanic | Hangul | Silver |
| Latin | Indo-European (Italic) | Latin | Silver |
| Lithuanian | Indo-European (Slavic) | Latin | Silver |
| Malay | Austronesian (Malayo-Polynesian) | Latin | Silver |
| Polish | Indo-European (Slavic) | Latin | Silver |
| Portuguese | Indo-European (Romance) | Latin | Silver |
| Romanian | Indo-European (Romance) | Latin | Silver |
| Serbian | Indo-European (Slavic) | Cyrillic | Silver |
| Sindhi | Indo-Aryan | Arabic | Silver |
| Spanish | Indo-European (Romance) | Latin | Silver |
| Urdu | Indo-Aryan | Arabic | Silver |
| Vietnamese | Austroasiatic (Vietic) | Latin | Silver |
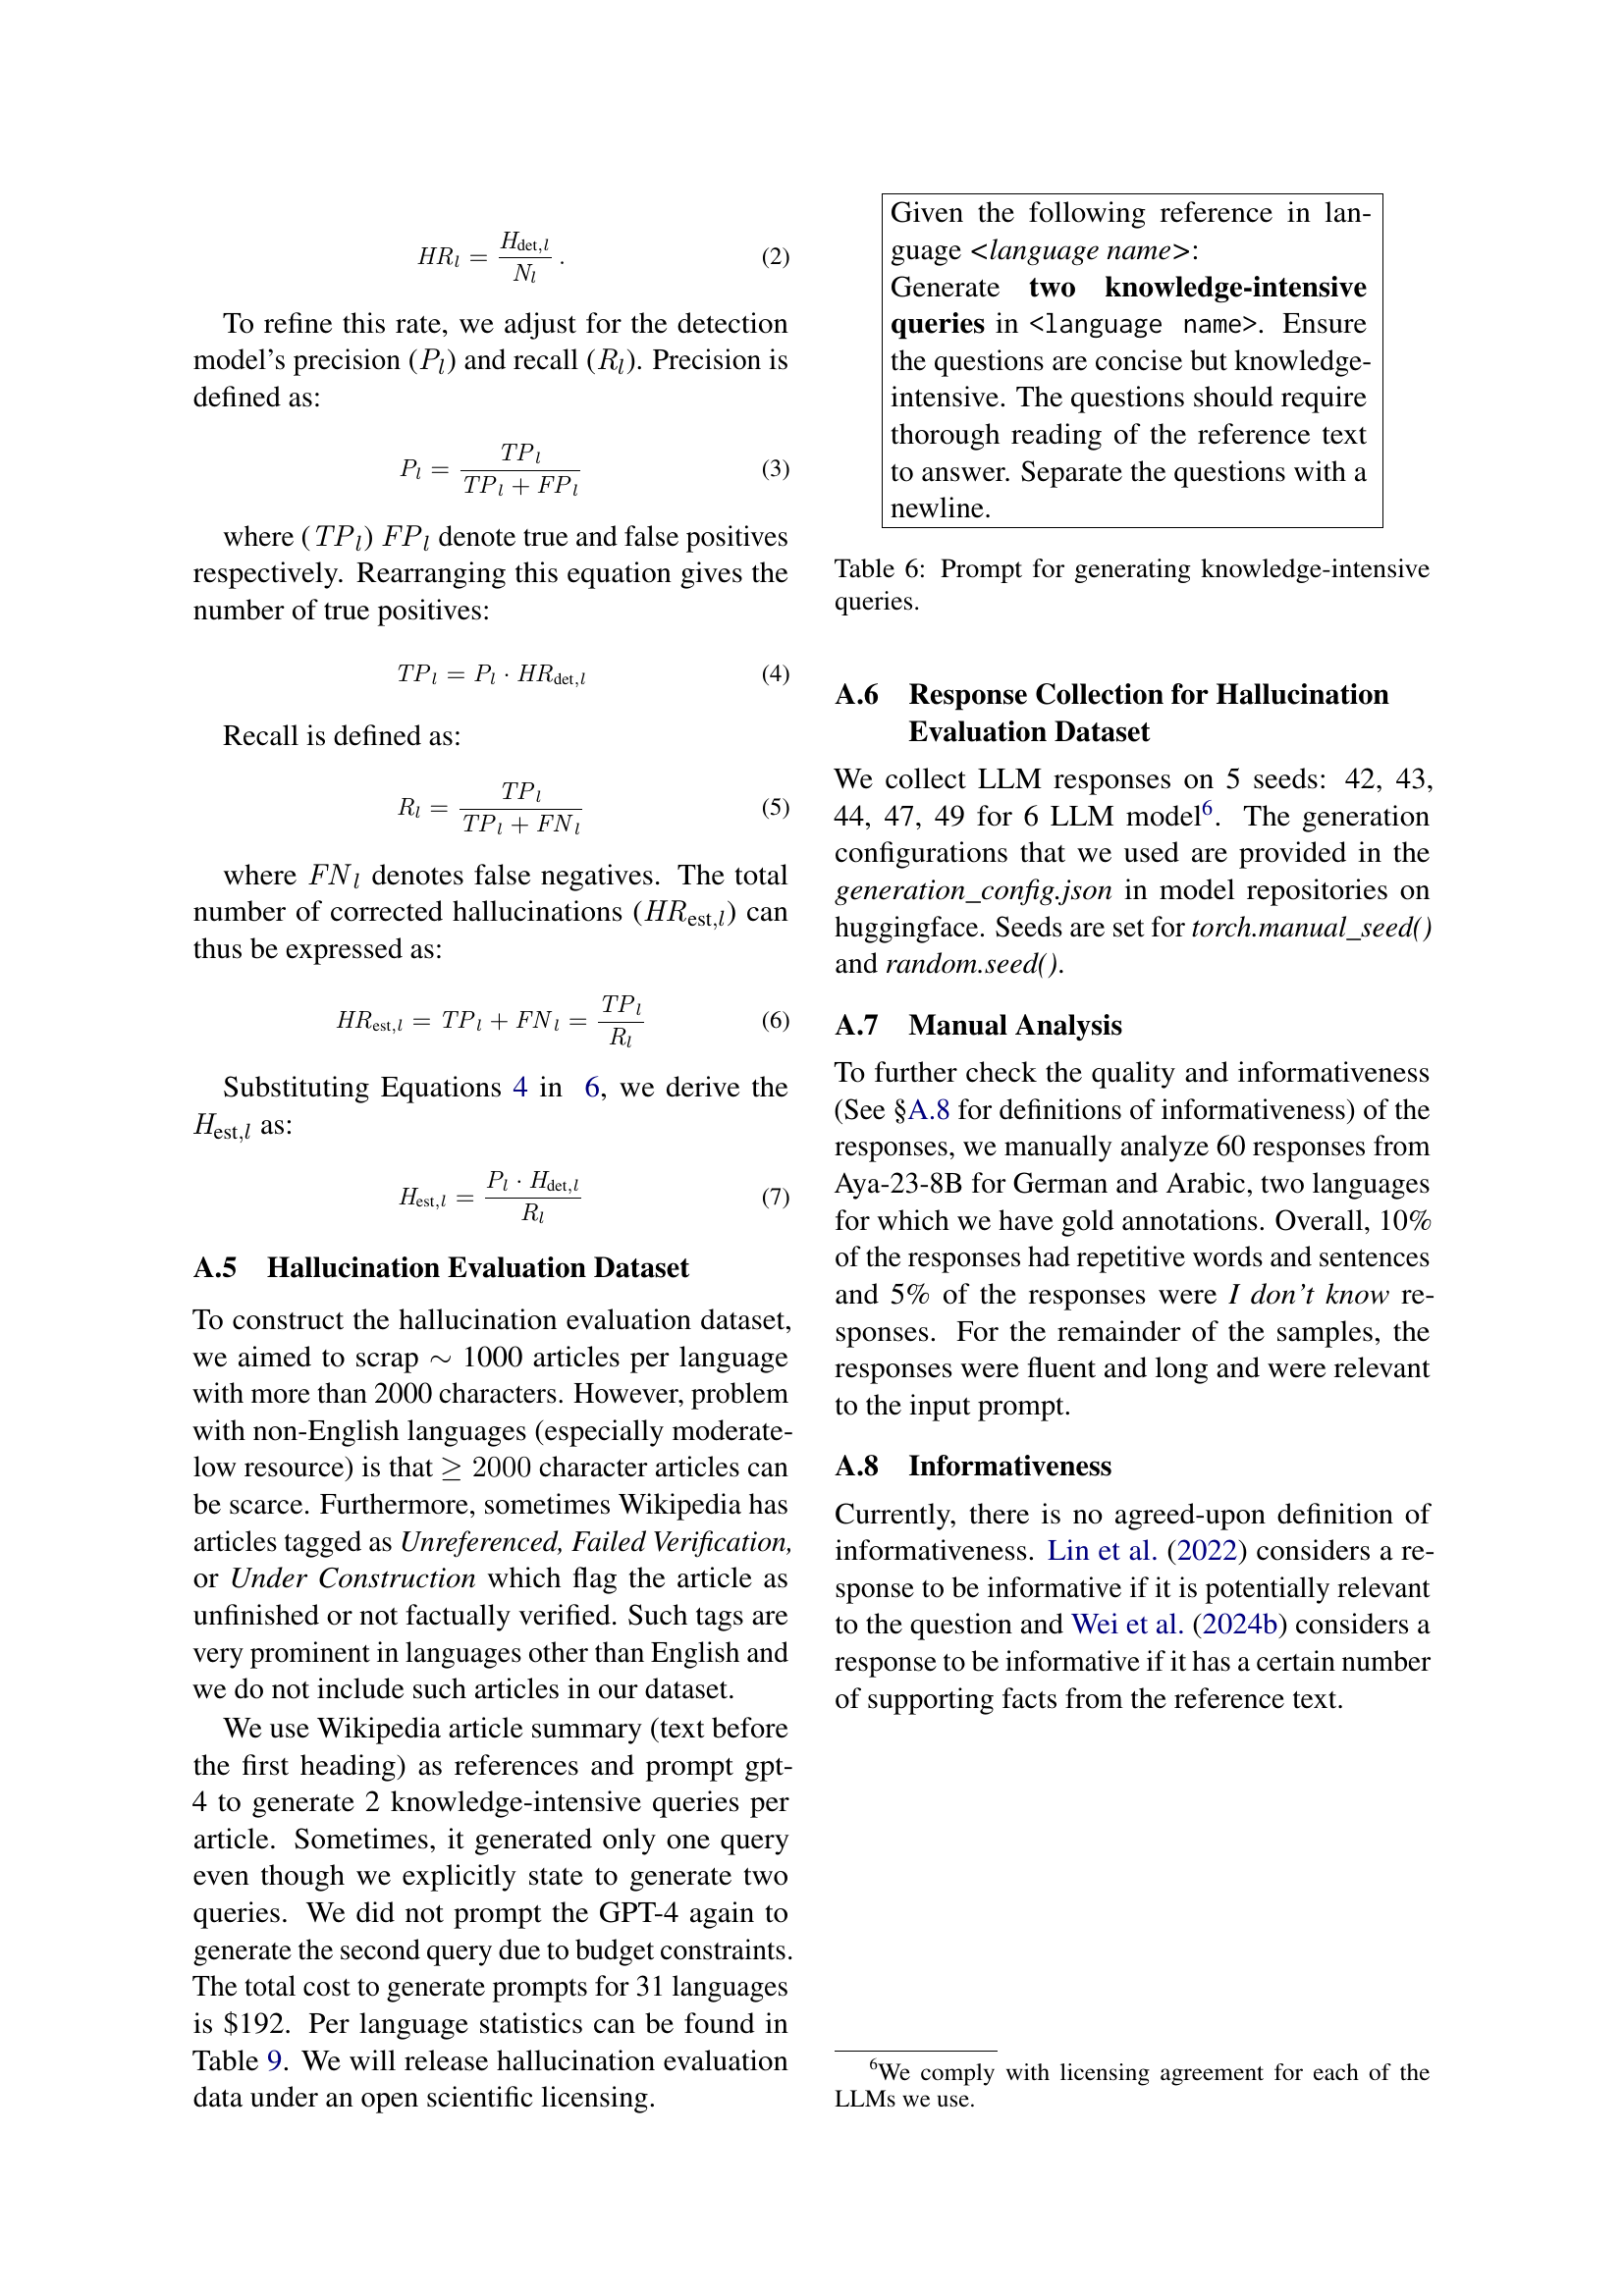
🔼 This table shows the prompt used to instruct GPT-4 to generate knowledge-intensive questions for the multilingual hallucination rate estimation task. The prompt provides instructions in a template format, specifying the language and instructing the model to create two concise, knowledge-intensive questions based on a given Wikipedia article. These questions should require thorough reading of the reference text to answer.
read the caption
Table 6: Prompt for generating knowledge-intensive queries.
| Model | max_new_tokens | temperature | top_p | top_k | repetition_penalty | do_sample |
|---|---|---|---|---|---|---|
| Llama-3.x | 1024 | 0.6 | 0.9 | – | – | True |
| Aya | 1024 | – | 0.3 | – | – | True |
| Qwen-2.5 | 1024 | 0.7 | 0.9 | 20 | 1.05 | True |
| Mistral | 1024 | – | – | 50 | – | True |
| Gemma-2 | 1024 | – | – | – | – | True |
| EuroLLM | 1024 | – | – | – | – | True |
🔼 This table details the characteristics of the 30 languages used in the study’s multilingual hallucination evaluation. For each language, it lists its language family (according to Glottolog 5.0), its writing system (script), and the type of test set used to evaluate the language models’ performance: either a gold standard test set (created with human annotations) or a silver standard test set (created using machine translation). The gold standard datasets were created for five high-resource languages, while the others used silver standard datasets.
read the caption
Table 7: Classification of languages by language family (based on Glottolog 5.0), script, and test-set status. Gold test sets are available for 5 languages, while the rest have silver test sets.
| Language | Unique Categories | Total Articles | Total Queries |
|---|---|---|---|
| Arabic | 537 | 959 | 1907 |
| Basque | 486 | 938 | 1872 |
| Cantonese | 261 | 401 | 793 |
| Catalan | 359 | 989 | 1976 |
| Chinese | 712 | 977 | 1939 |
| Czech | 720 | 988 | 1975 |
| Esperanto | 608 | 956 | 1912 |
| French | 332 | 987 | 1973 |
| Finnish | 549 | 995 | 1972 |
| German | 797 | 984 | 1967 |
| Hebrew | 660 | 999 | 1991 |
| Hindi | 153 | 186 | 367 |
| Hungarian | 745 | 992 | 1964 |
| Indonesian | 457 | 958 | 1913 |
| Italian | 678 | 988 | 1974 |
| Japanese | 667 | 999 | 1991 |
| Korean | 539 | 747 | 1488 |
| Latin | 334 | 465 | 916 |
| Lithuanian | 711 | 946 | 1888 |
| Malay | 442 | 778 | 1556 |
| Polish | 889 | 1000 | 1998 |
| Portuguese | 390 | 955 | 1909 |
| Romanian | 351 | 811 | 1618 |
| Russian | 462 | 999 | 1996 |
| Spanish | 938 | 977 | 1952 |
| Serbian | 386 | 798 | 1587 |
| Sindhi | 224 | 519 | 1029 |
| Turkish | 660 | 856 | 1650 |
| Urdu | 567 | 878 | 1749 |
| Vietnamese | 326 | 660 | 1311 |
| Total | 15,940 | 25,685 | 51,133 |
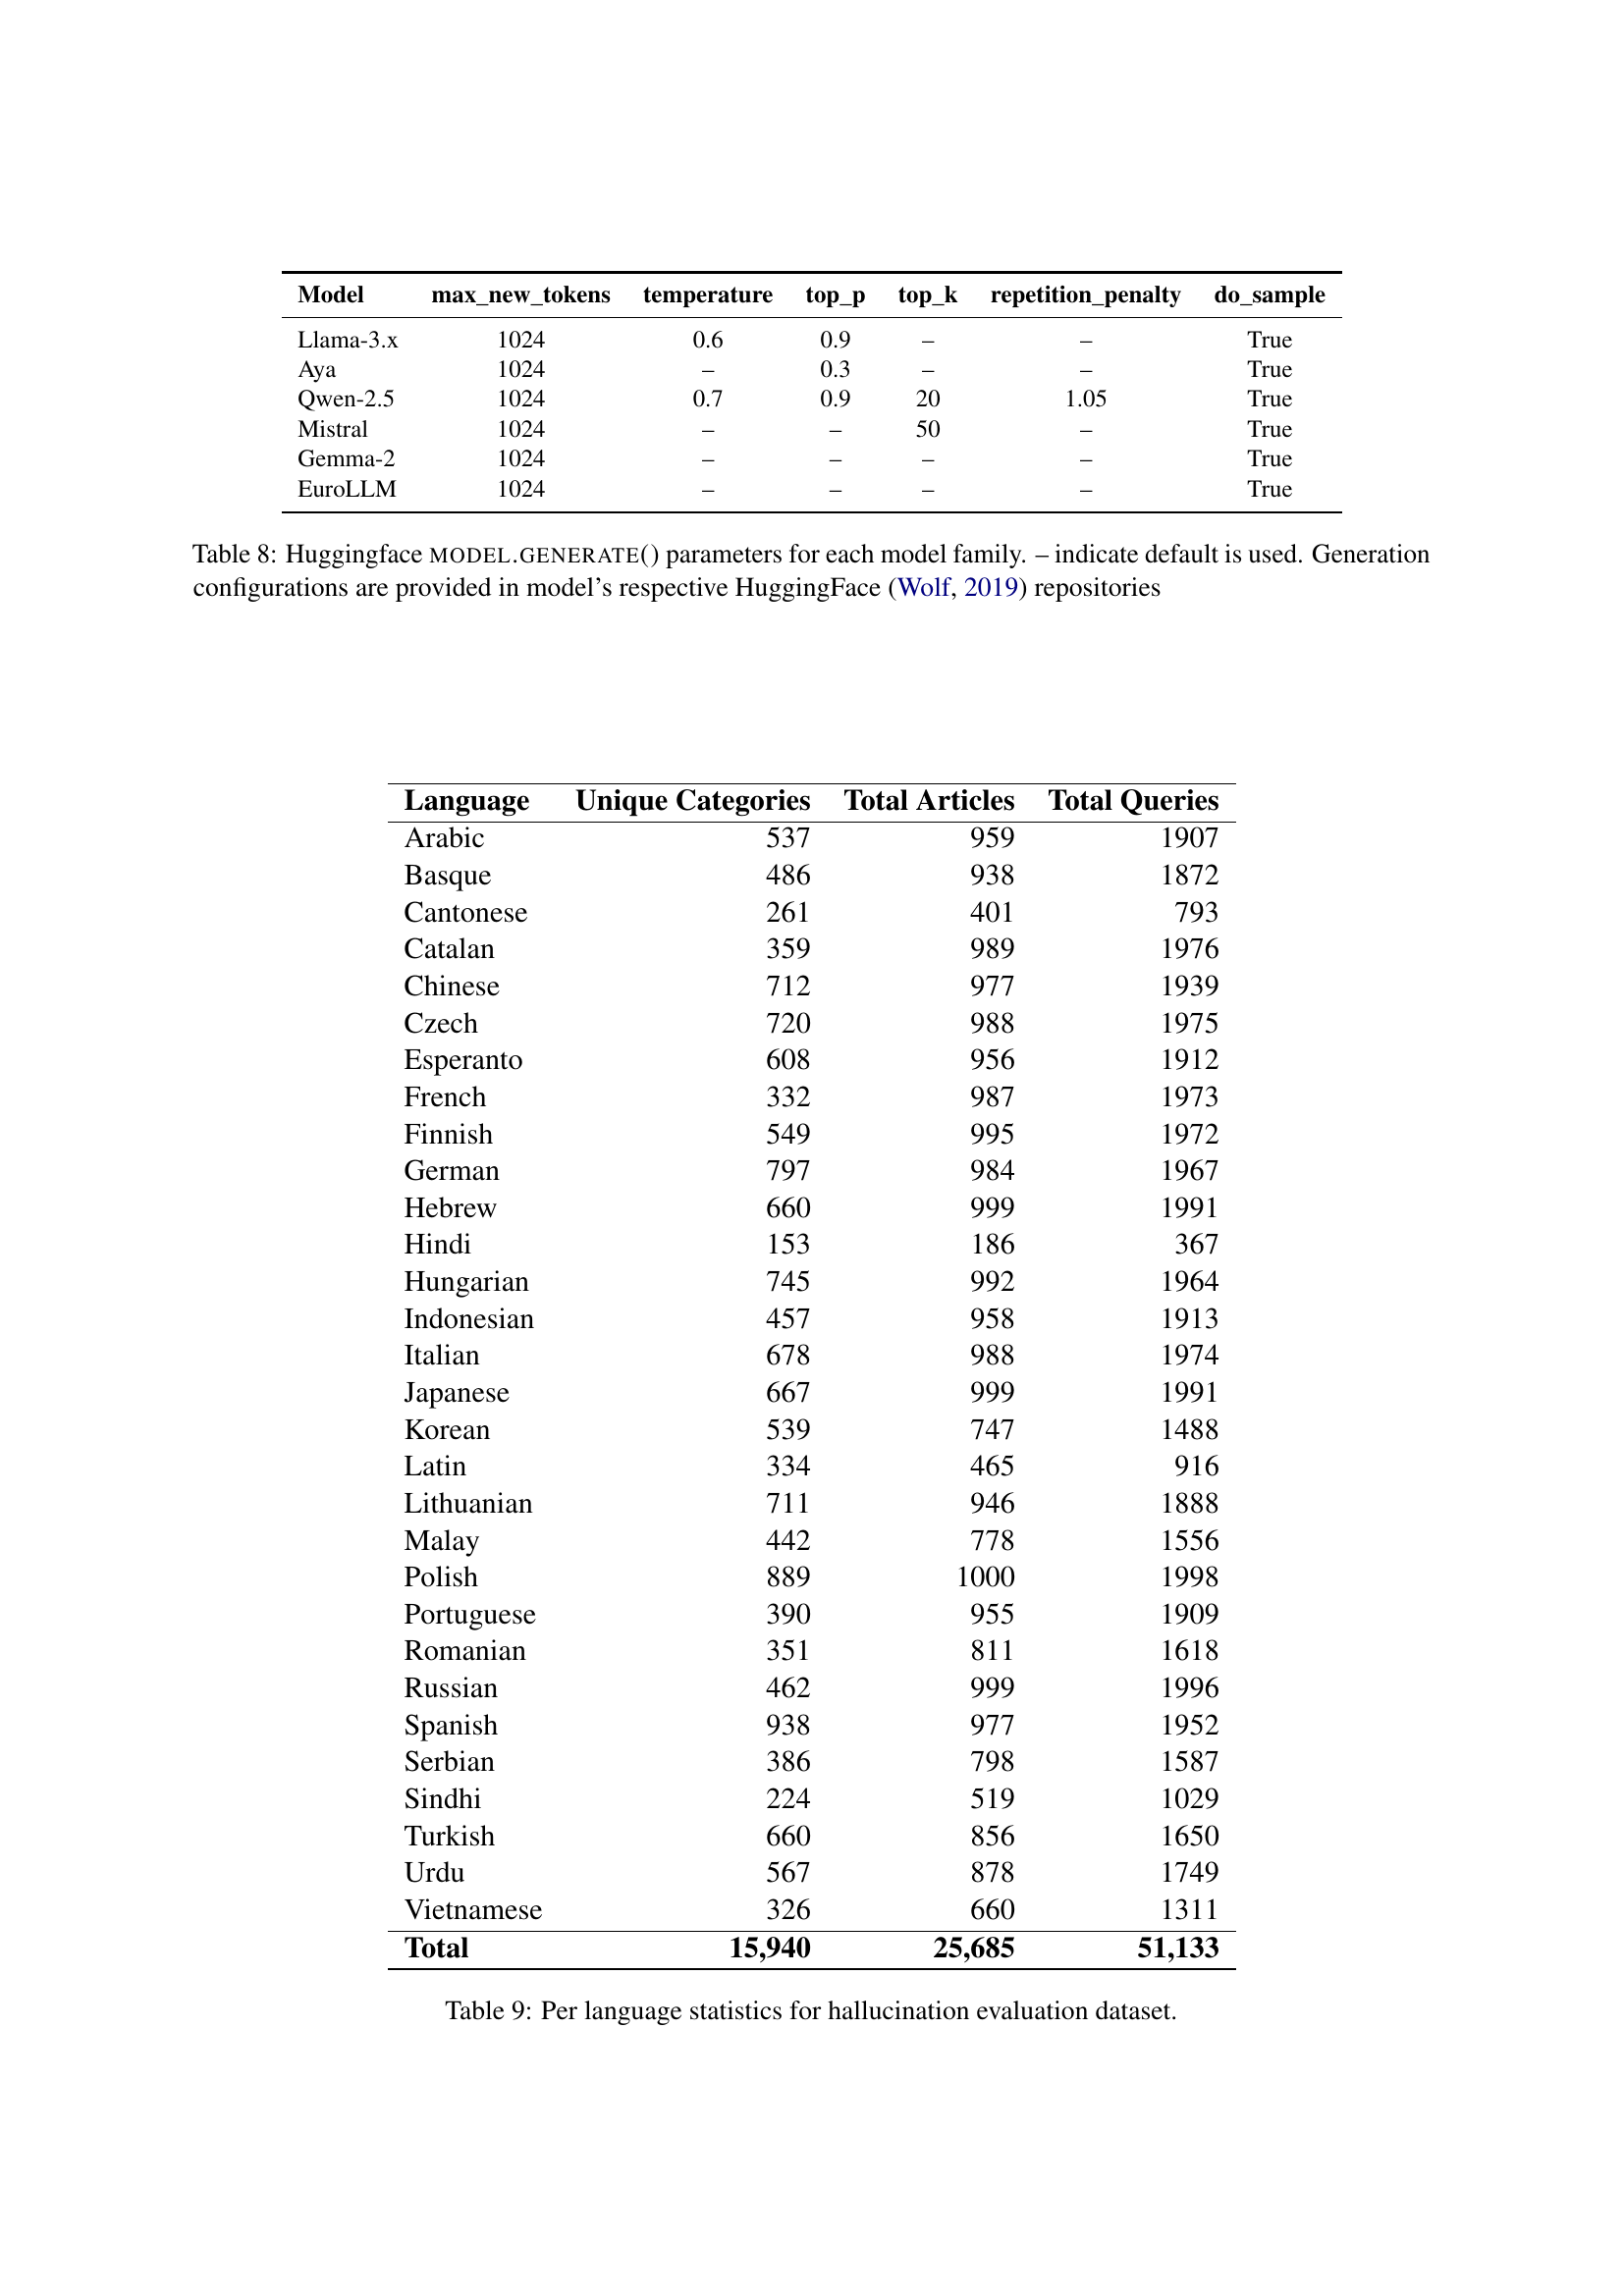
🔼 This table details the settings used for text generation within the HuggingFace library for six different large language models (LLMs). The parameters include
max_new_tokens(the maximum number of tokens to generate),temperature(controls randomness in text generation, higher values mean more randomness),top_p(nucleus sampling, considers tokens whose cumulative probability exceeds top_p),top_k(sampling from the top k most likely tokens),repetition_penalty(penalizes repeated sequences of tokens), anddo_sample(whether to sample from the probability distribution or use argmax for deterministic generation). The table shows the specific settings for each LLM, indicating where default values are used. These parameters directly impact the style and characteristics of the generated text, and the full configuration details for each model can be found in their respective HuggingFace repositories.read the caption
Table 8: Huggingface model.generate() parameters for each model family. – indicate default is used. Generation configurations are provided in model’s respective HuggingFace (Wolf, 2019) repositories
| Language | Precision (%) | Recall (%) | F1 Score (%) |
|---|---|---|---|
| GOLD | |||
| Arabic (Gold) | 73.98 | 53.40 | 61.63 |
| Chinese (Gold) | 70.73 | 53.93 | 58.79 |
| German (Gold) | 58.19 | 74.06 | 65.05 |
| Turkish (Gold) | 79.67 | 66.95 | 72.57 |
| Russian (Gold) | 63.18 | 68.46 | 65.53 |
| Average | 69.15 | 63.36 | 64.71 |
| SILVER | |||
| Arabic | 93.28 | 74.81 | 82.59 |
| Chinese | 80.33 | 66.28 | 69.77 |
| German | 91.64 | 87.77 | 89.50 |
| Turkish | 89.58 | 83.92 | 86.43 |
| Russian | 93.05 | 86.04 | 89.15 |
| Basque | 87.22 | 74.46 | 79.80 |
| Cantonese | 78.49 | 49.40 | 56.12 |
| Catalan | 94.70 | 87.46 | 90.85 |
| Czech | 93.99 | 84.75 | 89.00 |
| Esperanto | 94.28 | 86.53 | 90.05 |
| French | 91.58 | 89.37 | 90.31 |
| Finnish | 86.67 | 84.26 | 85.15 |
| Hebrew | 82.75 | 32.97 | 44.19 |
| Hindi | 68.01 | 68.48 | 66.77 |
| Hungarian | 92.35 | 74.29 | 81.93 |
| Indonesian | 92.12 | 85.75 | 88.72 |
| Italian | 93.76 | 87.26 | 90.28 |
| Korean | 86.39 | 79.11 | 82.31 |
| Japanese | 77.06 | 61.03 | 67.15 |
| Lithuanian | 90.48 | 75.39 | 81.81 |
| Malay | 86.15 | 68.96 | 75.73 |
| Portuguese | 95.80 | 86.77 | 90.94 |
| Serbian | 86.16 | 76.75 | 79.91 |
| Sindhi | 82.00 | 69.38 | 74.36 |
| Spanish | 95.86 | 85.34 | 90.14 |
| Vietnamese | 89.35 | 84.57 | 86.71 |
| Urdu | 88.82 | 72.32 | 79.39 |
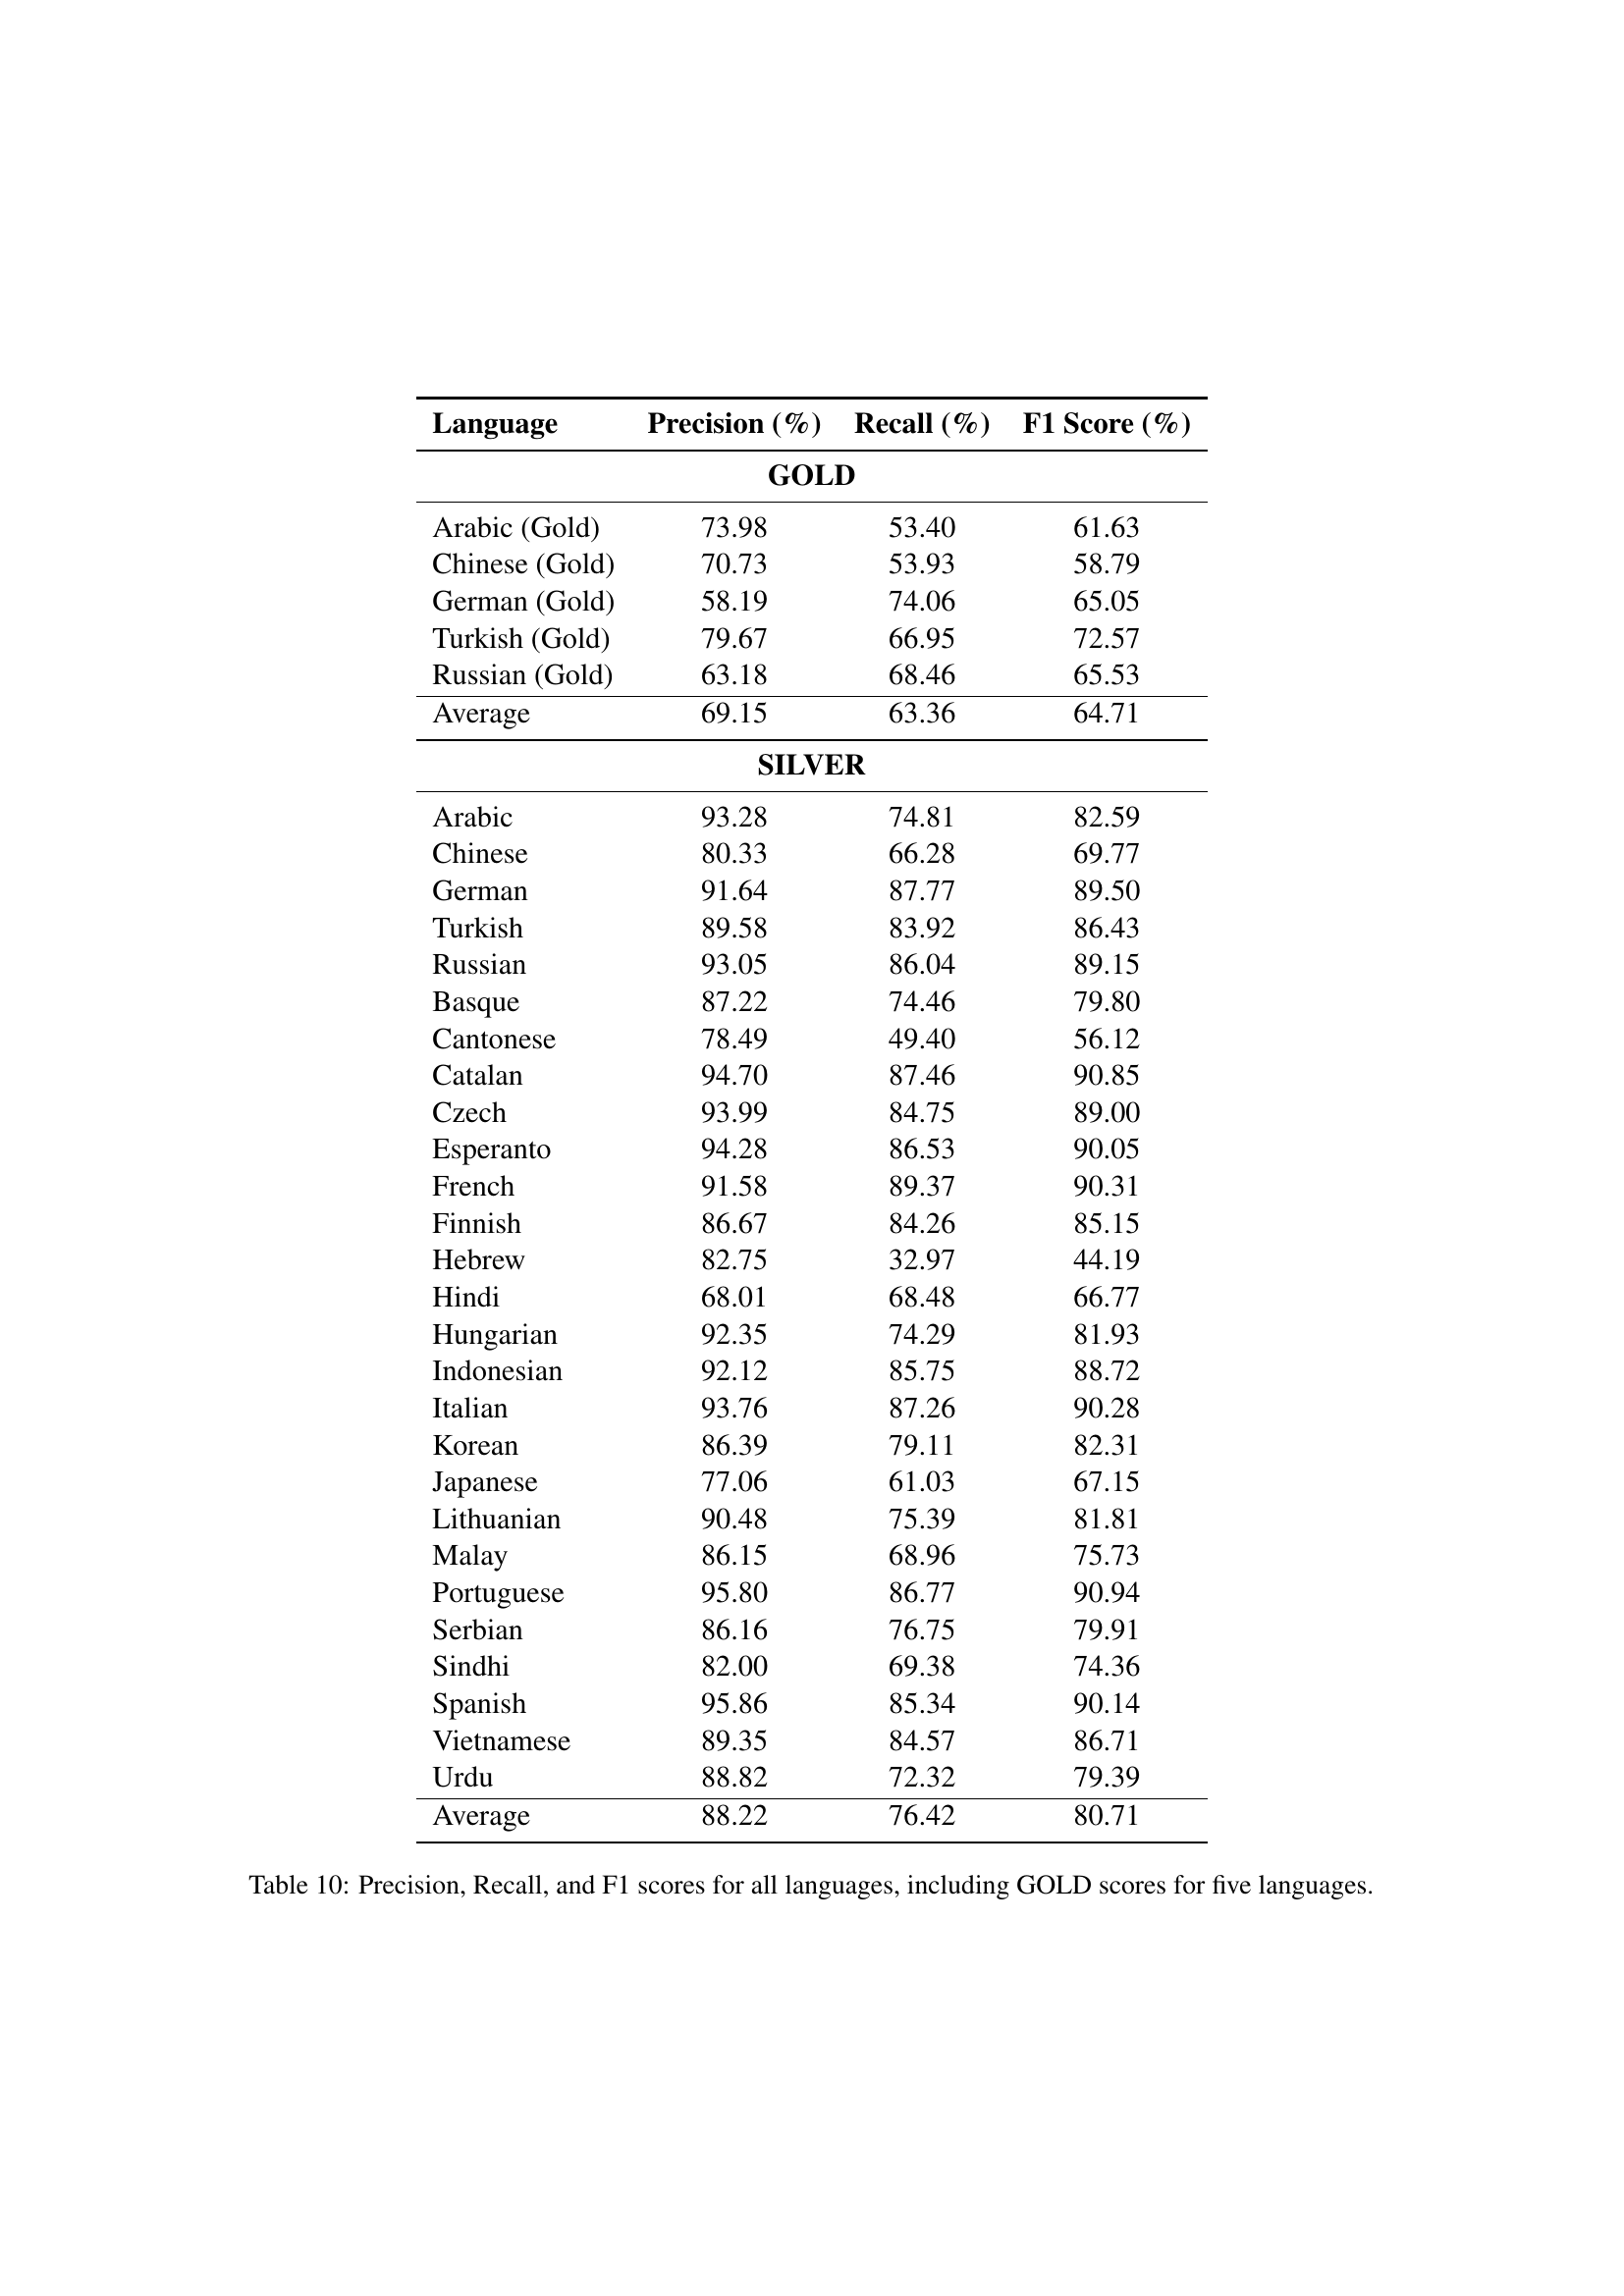
| Average | 88.22 | 76.42 | 80.71 |
🔼 This table presents a breakdown of the multilingual hallucination evaluation dataset used in the study. For each of the 30 languages included, it shows the number of unique categories of hallucinations observed, the total number of Wikipedia articles used as references, and the total number of questions (queries) generated for those articles. This data provides context for the scale and diversity of the dataset used to assess hallucination rates across multiple languages and LLM models.
read the caption
Table 9: Per language statistics for hallucination evaluation dataset.
Full paper#