TL;DR#
LLM test-time scaling is effective. Existing methods need big data or training. Less powerful base models’ thinking needs improvement. The paper introduces S2R, a framework enhancing LLM reasoning. It teaches models to self-verify/correct during inference. LLMs use iterative self-verification/correction via supervised fine-tuning. The self-verification/correction skills are strengthened via reinforcement learning.
S2R minimizes resources and lets the model refine its reasoning. With 3.1k samples, Qwen2.5-math-7B improves from 51.0% to 81.6%, outperforming models trained on equivalent long-CoT data. Results validate S2R’s effectiveness on three base models across in/out-of-domain benchmarks. It teaches LLMs to think deeply. LLMs reassess solutions, find mistakes, and refine solutions.
Key Takeaways#
Why does it matter?#
S2R offers an interpretable way for LLMs to self-verify and self-correct with minimal resources. It enhances reasoning and opens avenues for SFT/RL strategies, impacting long-CoT reasoning in research. The method is demonstrated by the experiments and analysis on the math datasets.
Visual Insights#

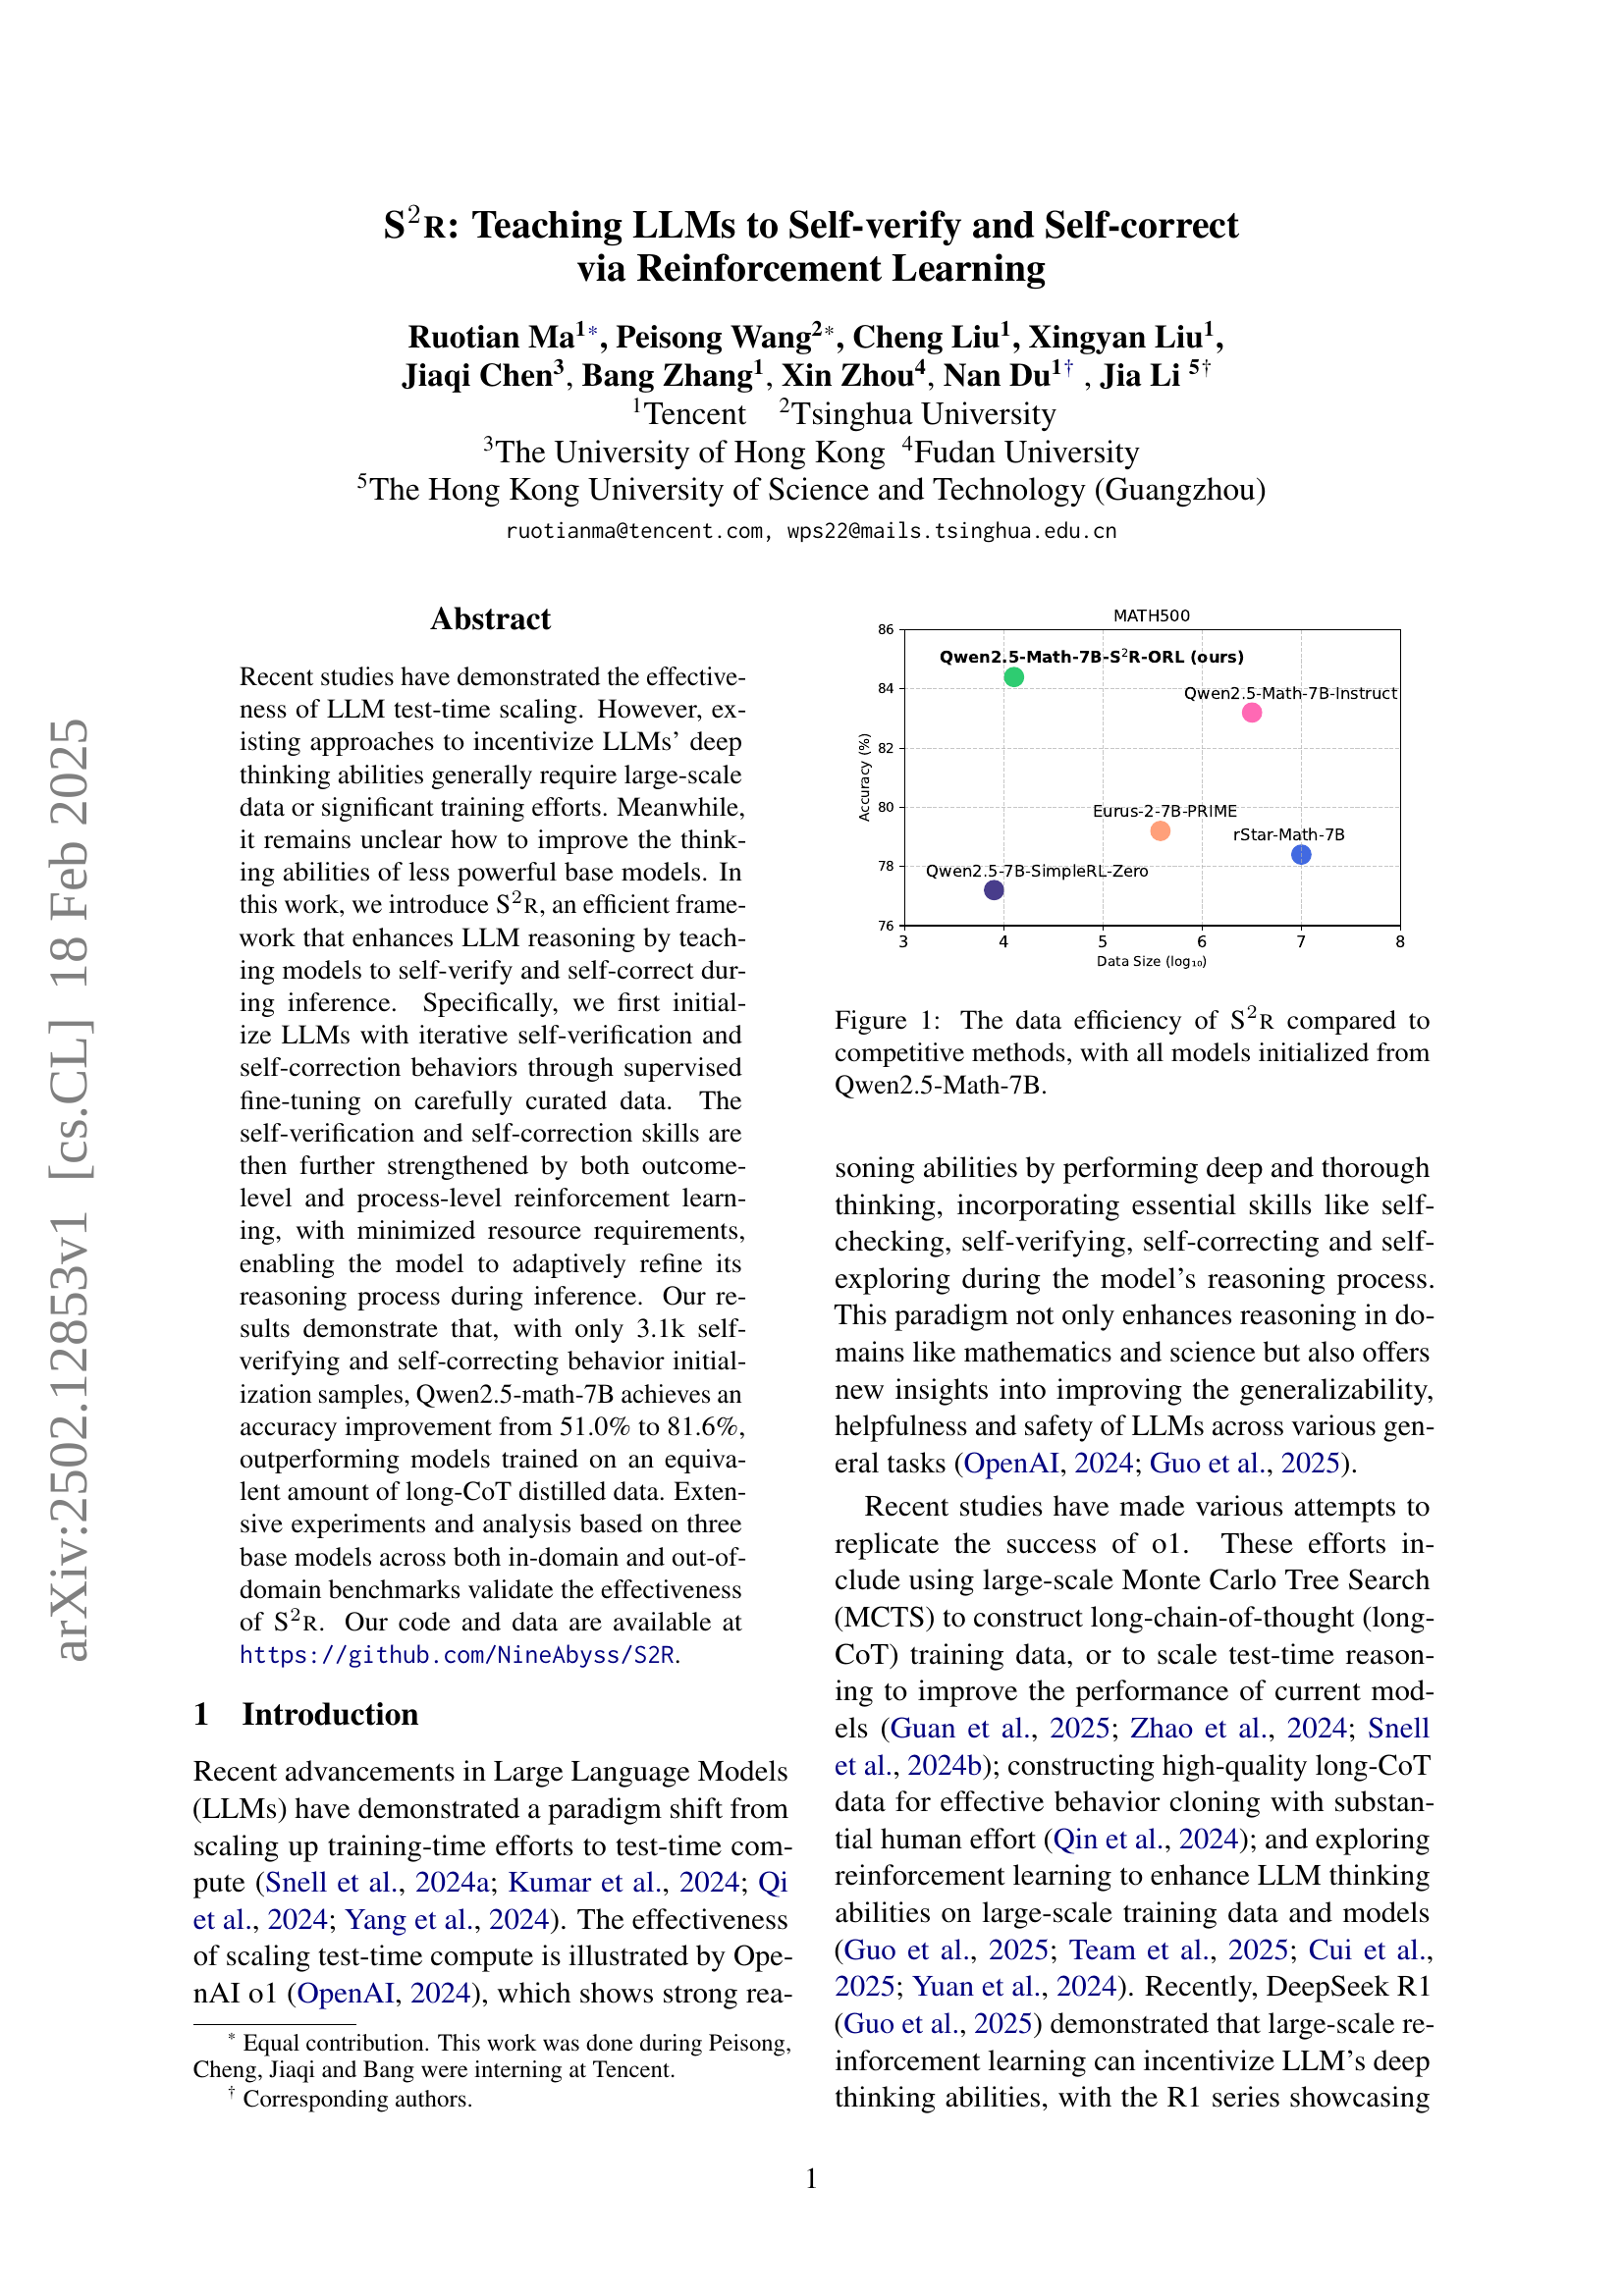
🔼 This figure illustrates the data efficiency of the S2R model compared to other existing methods. It shows that S2R achieves high accuracy with significantly less training data. All models in this comparison started with the same base model (Qwen2.5-Math-7B), highlighting the effectiveness of S2R in improving reasoning abilities with limited resources.
read the caption
Figure 1: The data efficiency of S2r compared to competitive methods, with all models initialized from Qwen2.5-Math-7B.
| Stage 1: Behavior Initialization | ||
| Base Model | Source | # Training Data |
| Llama-3.1-8B-Instruct | MATH | 4614 |
| Qwen2-7B-Instruct | MATH | 4366 |
| Qwen2.5-Math-7B | MATH | 3111 |
| Stage 2: Reinforcement Learning | ||
| Base Model | Source | # Training Data |
| Llama-3.1-8B-Instruct | MATH+GSM8K | 9601 |
| Qwen2-7B-Instruct | MATH+GSM8K | 9601 |
| Qwen2.5-Math-7B | MATH+OpenMath2.0 | 10000 |
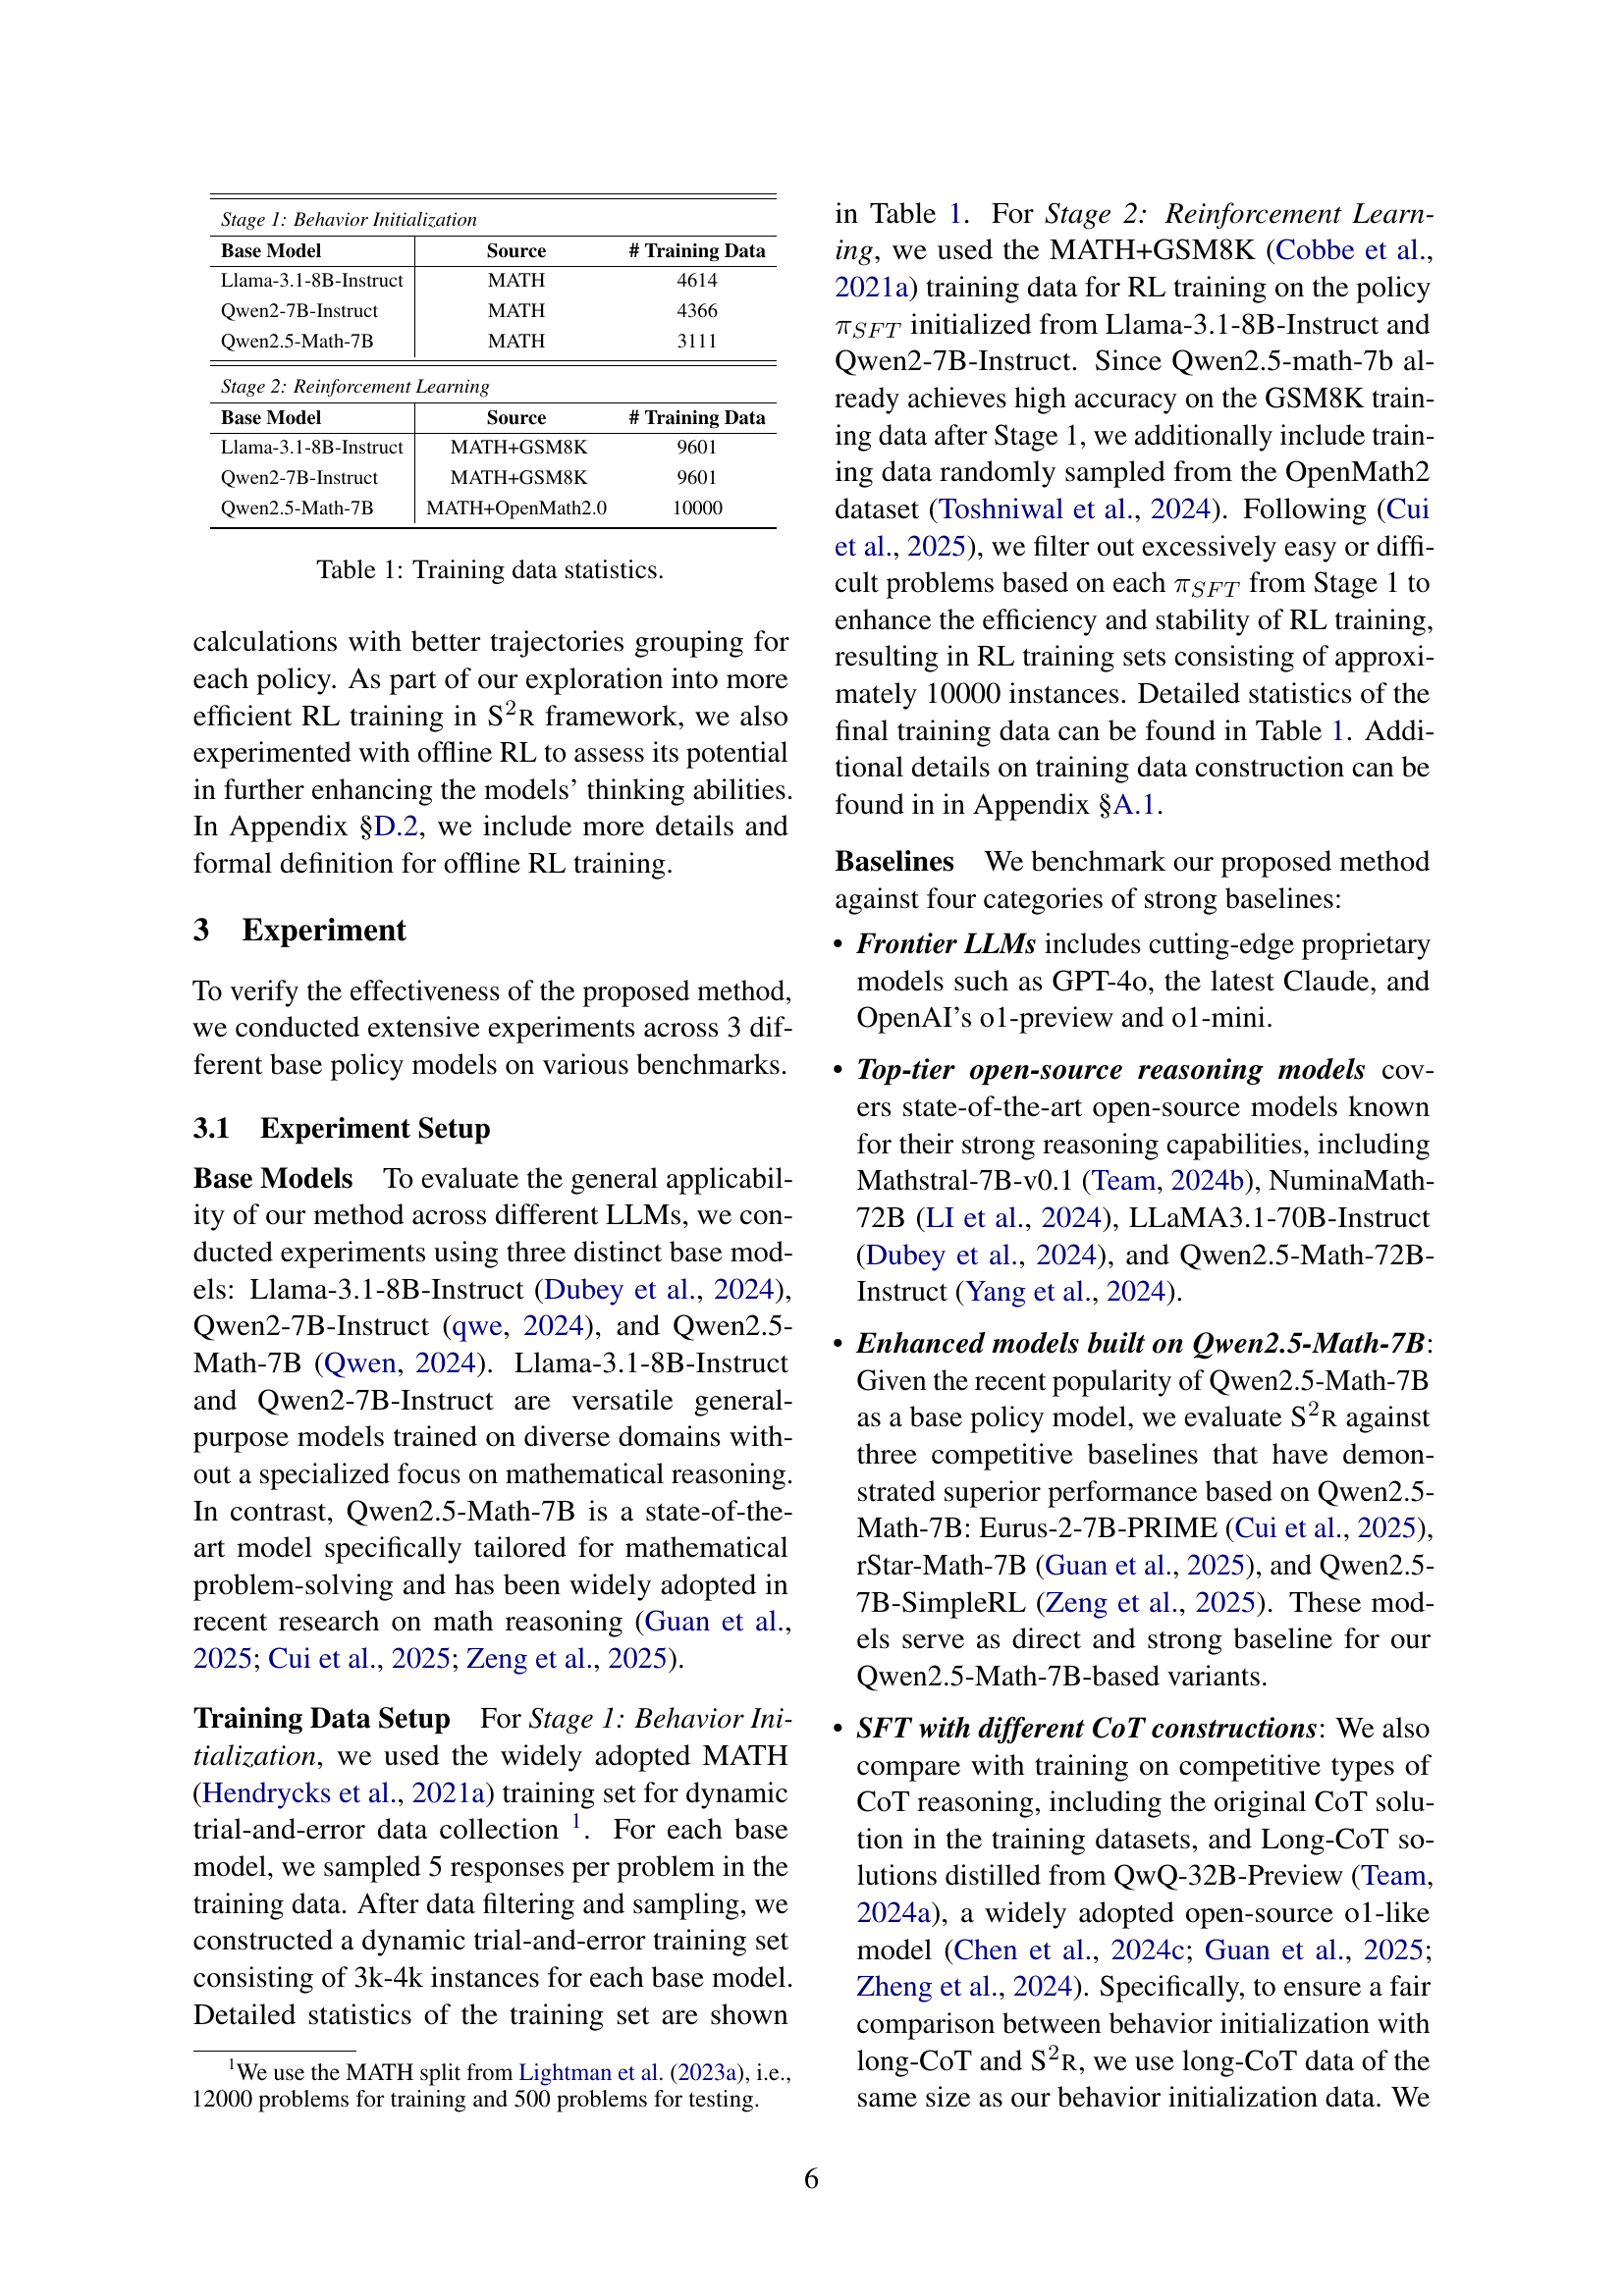
🔼 This table presents the statistics of the training data used in the paper’s experiments. It shows the base language model used, the source of the training data (the dataset used), and the number of training samples for each stage of the training process. There are two stages mentioned: Behavior Initialization (Stage 1) and Reinforcement Learning (Stage 2).
read the caption
Table 1: Training data statistics.
In-depth insights#
S2R: RL for LLMs#
S2R leverages Reinforcement Learning (RL) to enhance Large Language Models (LLMs). This is promising as RL can directly optimize for desired behaviors, like reasoning, by rewarding correct outputs. Traditional RL for LLMs is resource-intensive, so efficiency is critical. Potential research directions include exploring more sample-efficient RL algorithms, developing better reward functions that capture nuanced aspects of reasoning, and investigating how S2R can improve LLMs’ safety.
Self-Verify Tuning#
While “Self-Verify Tuning” isn’t explicitly mentioned in the paper, the core concept aligns with the work’s focus on enhancing LLMs’ reasoning through self-assessment and correction. This tuning approach likely involves training models to critically examine their own outputs, identifying potential errors or inconsistencies, and then iteratively refining their solutions. The key is equipping models with the ability to evaluate the validity and coherence of their reasoning chains, rather than blindly accepting their initial answers. This involves techniques to detect flawed logic, factual inaccuracies, or deviations from the problem’s constraints. This self-verification process is integral to improving the reliability and accuracy of LLMs, particularly in complex tasks where multi-step reasoning is required. Reinforcement learning plays an important role. By incentivizing models to flag their own mistakes and subsequently correct them,
RL for Reasoning#
Reinforcement Learning (RL) offers a compelling avenue for enhancing reasoning in AI systems, particularly for tasks demanding sequential decision-making. Unlike supervised methods, RL enables agents to learn through trial and error, optimizing policies based on reward signals. This approach is beneficial for complex reasoning scenarios where explicit training data is scarce or difficult to obtain. RL facilitates exploration and adaptation, allowing agents to discover novel strategies and refine their reasoning processes over time. The design of effective reward functions is critical, guiding the agent towards desired reasoning behaviors without over-constraining the learning process. Combining RL with other techniques, such as imitation learning or curriculum learning, can further improve its effectiveness in teaching reasoning skills.
Offline RL S2R#
Offline Reinforcement Learning (RL) offers a compelling alternative to online RL by leveraging pre-collected datasets, eliminating the need for real-time environment interaction, a perfect use case for this research. Integrating offline RL into the S2R framework allows the models to benefit from trial and error without an external environment. By training on previously gathered data of self-verification and self-correction behaviors, the model can better learn long-term dependencies and improve decision-making skills. Unlike online RL, offline RL requires careful consideration of data distribution and potential biases in the offline dataset. Addressing these challenges, possibly through techniques like conservative policy optimization or dataset augmentation, could unlock the full potential of offline S2R, enabling efficient and robust training of reasoning abilities with minimized data and compute requirements. It has the opportunity to achieve comparable or even superior performance with offline RL.
Correct-ability#
The ability of a model to correct itself is paramount in advanced AI systems, particularly in reasoning tasks. Correct-ability embodies a model’s capacity to identify and rectify errors in its own reasoning or output, indicating a deeper understanding of the problem space. This goes beyond mere accuracy; it reflects a meta-cognitive awareness where the model can assess its cognitive processes, pinpoint flaws, and adjust its strategy. Effective correct-ability can significantly enhance the reliability and trustworthiness of AI systems, as it demonstrates a capacity for continuous improvement and adaptation. Models exhibiting strong correct-ability are better equipped to handle complex, real-world scenarios where initial solutions may be imperfect but iterative refinement leads to optimal outcomes. Developing and evaluating correct-ability is crucial for building robust and dependable AI that can learn and evolve.
More visual insights#
More on figures

🔼 This figure presents a schematic overview of the S2R framework, detailing its two main stages. Stage 1 involves behavior initialization, where the model learns iterative self-verification and self-correction behaviors through supervised fine-tuning on curated data. This stage generates initial policy models exhibiting these behaviors. Stage 2 focuses on boosting these capabilities using reinforcement learning. Outcome-level and process-level reinforcement learning are both applied, further enhancing the model’s ability to adaptively refine its reasoning process during inference. The framework uses a sequential decision-making model to represent the problem-solving process and incorporates a reward function to guide the reinforcement learning.
read the caption
Figure 2: Overview of S2r.

🔼 This figure shows the data efficiency of the proposed S2R framework compared to several existing methods. The x-axis represents the logarithm of the amount of training data used (in number of samples), and the y-axis shows the accuracy achieved on a particular math reasoning benchmark (MATH500). The plot demonstrates that S2R achieves high accuracy with significantly less data compared to other approaches, highlighting its data efficiency.
read the caption
(a)

🔼 This figure shows the evaluation results of self-verification and self-correction, comparing the performance of the model trained only with supervised fine-tuning (SFT) against models further trained with process-level and outcome-level reinforcement learning (RL). The metrics displayed are verification accuracy, error recall, correct precision, and the rates of incorrect answers being corrected and correct answers being incorrectly altered. The figure helps illustrate the impact of different RL training methods on the model’s ability to effectively self-verify and self-correct during reasoning.
read the caption
(b)

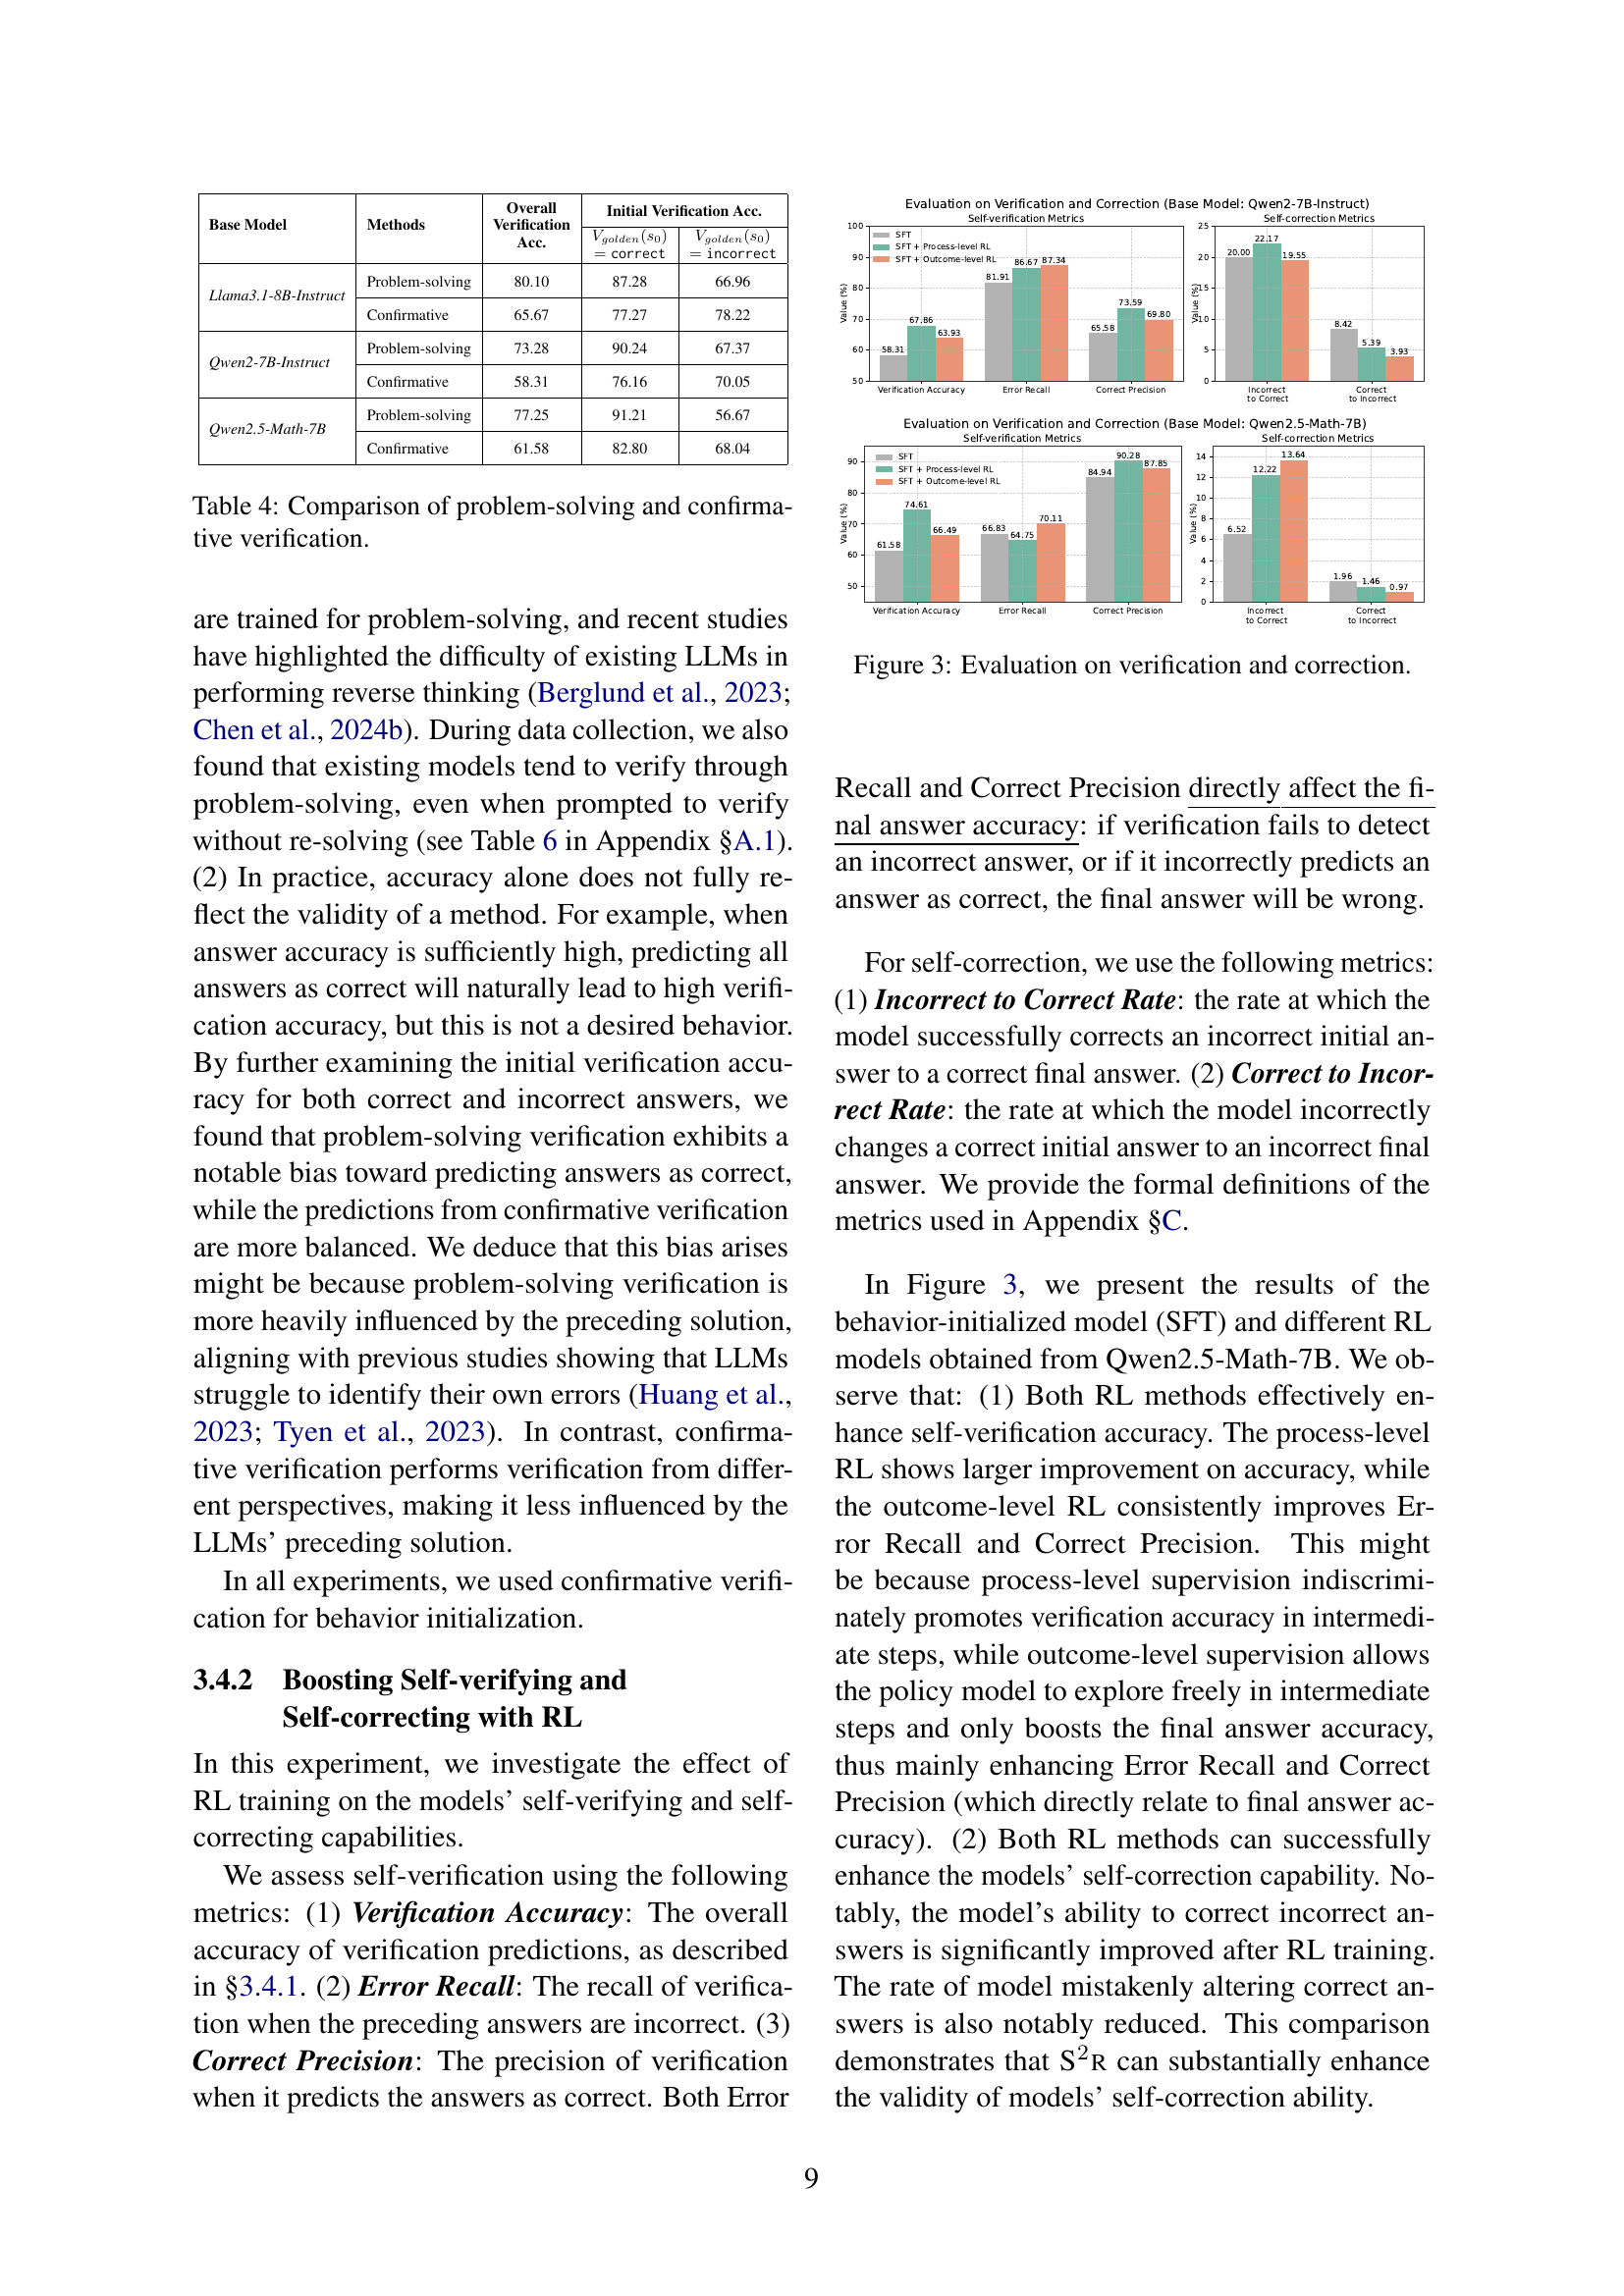
🔼 This figure visualizes the performance of self-verification and self-correction mechanisms in three different LLMs (Llama-3.1-8B-Instruct, Qwen2-7B-Instruct, and Qwen2.5-Math-7B) before and after applying reinforcement learning (RL). It shows how RL improves the overall verification accuracy, the ability to recall errors, and precision in correct predictions. The self-correction metrics demonstrate that RL training enhances the rate of correctly correcting mistakes and reduces the rate of mistakenly changing correct answers to incorrect ones.
read the caption
Figure 3: Evaluation on verification and correction.

🔼 This figure shows the data efficiency of the proposed S2R framework compared to other methods. All models were initialized from Qwen2.5-Math-7B. The x-axis represents the logarithm of the data size used for training (in samples or tokens), and the y-axis shows the accuracy achieved on a particular task (likely a math reasoning task). The graph illustrates that S2R achieves high accuracy with significantly less data compared to the other models, indicating improved data efficiency.
read the caption
(a)

🔼 This figure shows the evolution of verification and correction capabilities of the model during training. It presents the changes in verification accuracy, error recall, correct precision, the rate of correcting incorrect answers, and the rate of incorrectly changing correct answers, across different training stages (SFT, SFT + Process-level RL, and SFT + Outcome-level RL). The x-axis represents the training stage, while the y-axis represents the value of each metric. This allows for a visual comparison of the model’s performance in self-verification and self-correction before and after applying reinforcement learning at both the process and outcome levels.
read the caption
(b)

🔼 Figure 4 presents a comparative analysis of model performance across varying problem difficulty levels. It shows both the accuracy and the average number of reasoning steps (’trials’) required by different LLMs to solve problems within the MATH500 test set. The difficulty levels are categorized and color-coded, allowing for a visual comparison of how effectively each model handles varying levels of problem complexity. This provides insight into the models’ efficiency and reasoning abilities.
read the caption
Figure 4: The accuracy and average trial number of different models across difficulty levels. Evaluated on MATH500 test set.

🔼 This figure shows an example of a data sample used for supervised fine-tuning (SFT) in Stage 1 of the S2R framework. It illustrates how trial-and-error trajectories are constructed by combining problem-solving attempts, verifications (checking the correctness of the previous attempts), and finally the correct answer. The example showcases multiple solution attempts, including both correct and incorrect ones, with corresponding verifications to demonstrate the iterative self-verification and self-correction process. Each step in the trajectory includes an action (solve or verify) followed by the result of the action, and this shows how the system iteratively refines its reasoning towards the correct solution.
read the caption
Figure 5: SFT data example.
More on tables
| Datasets | Average | |||||||
| Model | MATH 500 | AIME 2024 | AMC 2023 | College Math | Olympiad Bench | GSM8K | GaokaoEn 2023 | |
| Frontier LLMs | ||||||||
| GPT-4o⋆ | 76.6 | 9.3 | 47.5 | 48.5 | 43.3 | 92.9 | 67.5 | 55.1 |
| Claude3.5-Sonnet⋆ | 78.3 | 16.0 | - | - | - | 96.4 | - | - |
| GPT-o1-preview⋆ | 85.5 | 44.6 | 90.0 | - | - | - | - | - |
| GPT-o1-mini⋆ | 90.0 | 56.7 | 95.0 | 57.8 | 65.3 | 94.8 | 78.4 | 76.9 |
| Top-tier Open-source Reasoning LLMs | ||||||||
| Mathstral-7B-v0.1⋆ | 57.8 | 0.0 | 37.5 | 33.7 | 21.5 | 84.9 | 46.0 | 40.2 |
| NuminaMath-72B-CoT⋆ | 64.0 | 3.3 | 70.0 | 39.7 | 32.6 | 90.8 | 58.4 | 51.3 |
| LLaMA3.1-70B-Instruct⋆ | 65.4 | 23.3 | 50.0 | 42.5 | 27.7 | 94.1 | 54.0 | 51.0 |
| Qwen2.5-Math-72B-Instruct⋆ | 85.6 | 30.0 | 70.0 | 49.5 | 49.0 | 95.9 | 71.9 | 64.6 |
| General Model: Llama-3.1-8B-Instruct | ||||||||
| Llama-3.1-8B-Instruct | 48.0 | 6.7 | 30.0 | 30.8 | 15.6 | 84.4 | 41.0 | 36.6 |
| Llama-3.1-8B-Instruct + Original Solution SFT | 31.0 | 3.3 | 7.5 | 22.0 | 8.0 | 58.7 | 28.3 | 22.7 |
| Llama-3.1-8B-Instruct + Long CoT SFT | 51.4 | 6.7 | 27.5 | 36.3 | 19.0 | 87.0 | 48.3 | 39.5 |
| Llama-3.1-8B-S2r-BI (ours) | 49.6 | 10.0 | 20.0 | 33.3 | 17.6 | 85.3 | 41.0 | 36.7 |
| Llama-3.1-8B-S2r-PRL (ours) | 53.6 | 6.7 | 25.0 | 33.7 | 18.5 | 86.7 | 43.1 | 38.2 |
| Llama-3.1-8B-S2r-ORL (ours) | 55.0 | 6.7 | 32.5 | 34.7 | 20.7 | 87.3 | 45.2 | 40.3 |
| General Model: Qwen2-7B-Instruct | ||||||||
| Qwen2-7B-Instruct | 51.2 | 3.3 | 30.0 | 18.2 | 19.1 | 86.4 | 39.0 | 35.3 |
| Qwen2-7B-Instruct + Original Solution SFT | 41.2 | 0.0 | 25.0 | 30.1 | 10.2 | 74.5 | 34.8 | 30.8 |
| Qwen2-7B-Instruct + Long CoT SFT | 60.4 | 6.7 | 32.5 | 36.3 | 23.4 | 81.2 | 53.5 | 42.0 |
| Qwen2-7B-S2r-BI (ours) | 61.2 | 3.3 | 27.5 | 41.1 | 27.1 | 87.4 | 49.1 | 42.4 |
| Qwen2-7B-S2r-PRL (ours) | 65.4 | 6.7 | 35.0 | 36.7 | 27.0 | 89.0 | 49.9 | 44.2 |
| Qwen2-7B-S2r-ORL (ours) | 64.8 | 3.3 | 42.5 | 34.7 | 26.2 | 86.4 | 50.9 | 44.1 |
| Math-Specialized Model: Qwen2.5-Math-7B | ||||||||
| Qwen2.5-Math-7B | 51.0 | 16.7 | 45.0 | 21.5 | 16.7 | 58.3 | 39.7 | 35.6 |
| Qwen2.5-Math-7B-Instruct | 83.2 | 13.3 | 72.5 | 47.0 | 40.4 | 95.6 | 67.5 | 59.9 |
| Eurus-2-7B-PRIME⋆Cui et al. (2025) | 79.2 | 26.7 | 57.8 | 45.0 | 42.1 | 88.0 | 57.1 | 56.6 |
| rStar-Math-7B⋆222To ensure a fair comparison, we report the Pass@1 (greedy) accuracy obtained without the process preference model of rStar, rather than the result obtained with increased test-time computation using 64 trajectories.Guan et al. (2025) | 78.4 | 26.7 | 47.5 | 52.5 | 47.1 | 89.7 | 65.7 | 58.2 |
| Qwen2.5-7B-SimpleRL⋆Zeng et al. (2025) | 82.4 | 26.7 | 62.5 | - | 43.3 | - | - | - |
| Qwen2.5-Math-7B + Original Solution SFT | 58.0 | 6.7 | 42.5 | 35.8 | 20.0 | 79.5 | 51.9 | 42.1 |
| Qwen2.5-Math-7B + Long CoT SFT | 80.2 | 16.7 | 60.0 | 49.6 | 42.1 | 91.4 | 69.1 | 58.4 |
| Qwen2.5-Math-7B-S2r-BI (ours) | 81.6 | 23.3 | 60.0 | 43.9 | 44.4 | 91.9 | 70.1 | 59.3 |
| Qwen2.5-Math-7B-S2r-PRL (ours) | 83.4 | 26.7 | 70.0 | 43.8 | 46.4 | 93.2 | 70.4 | 62.0 |
| Qwen2.5-Math-7B-S2r-ORL (ours) | 84.4 | 23.3 | 77.5 | 43.8 | 44.9 | 92.9 | 70.1 | 62.4 |
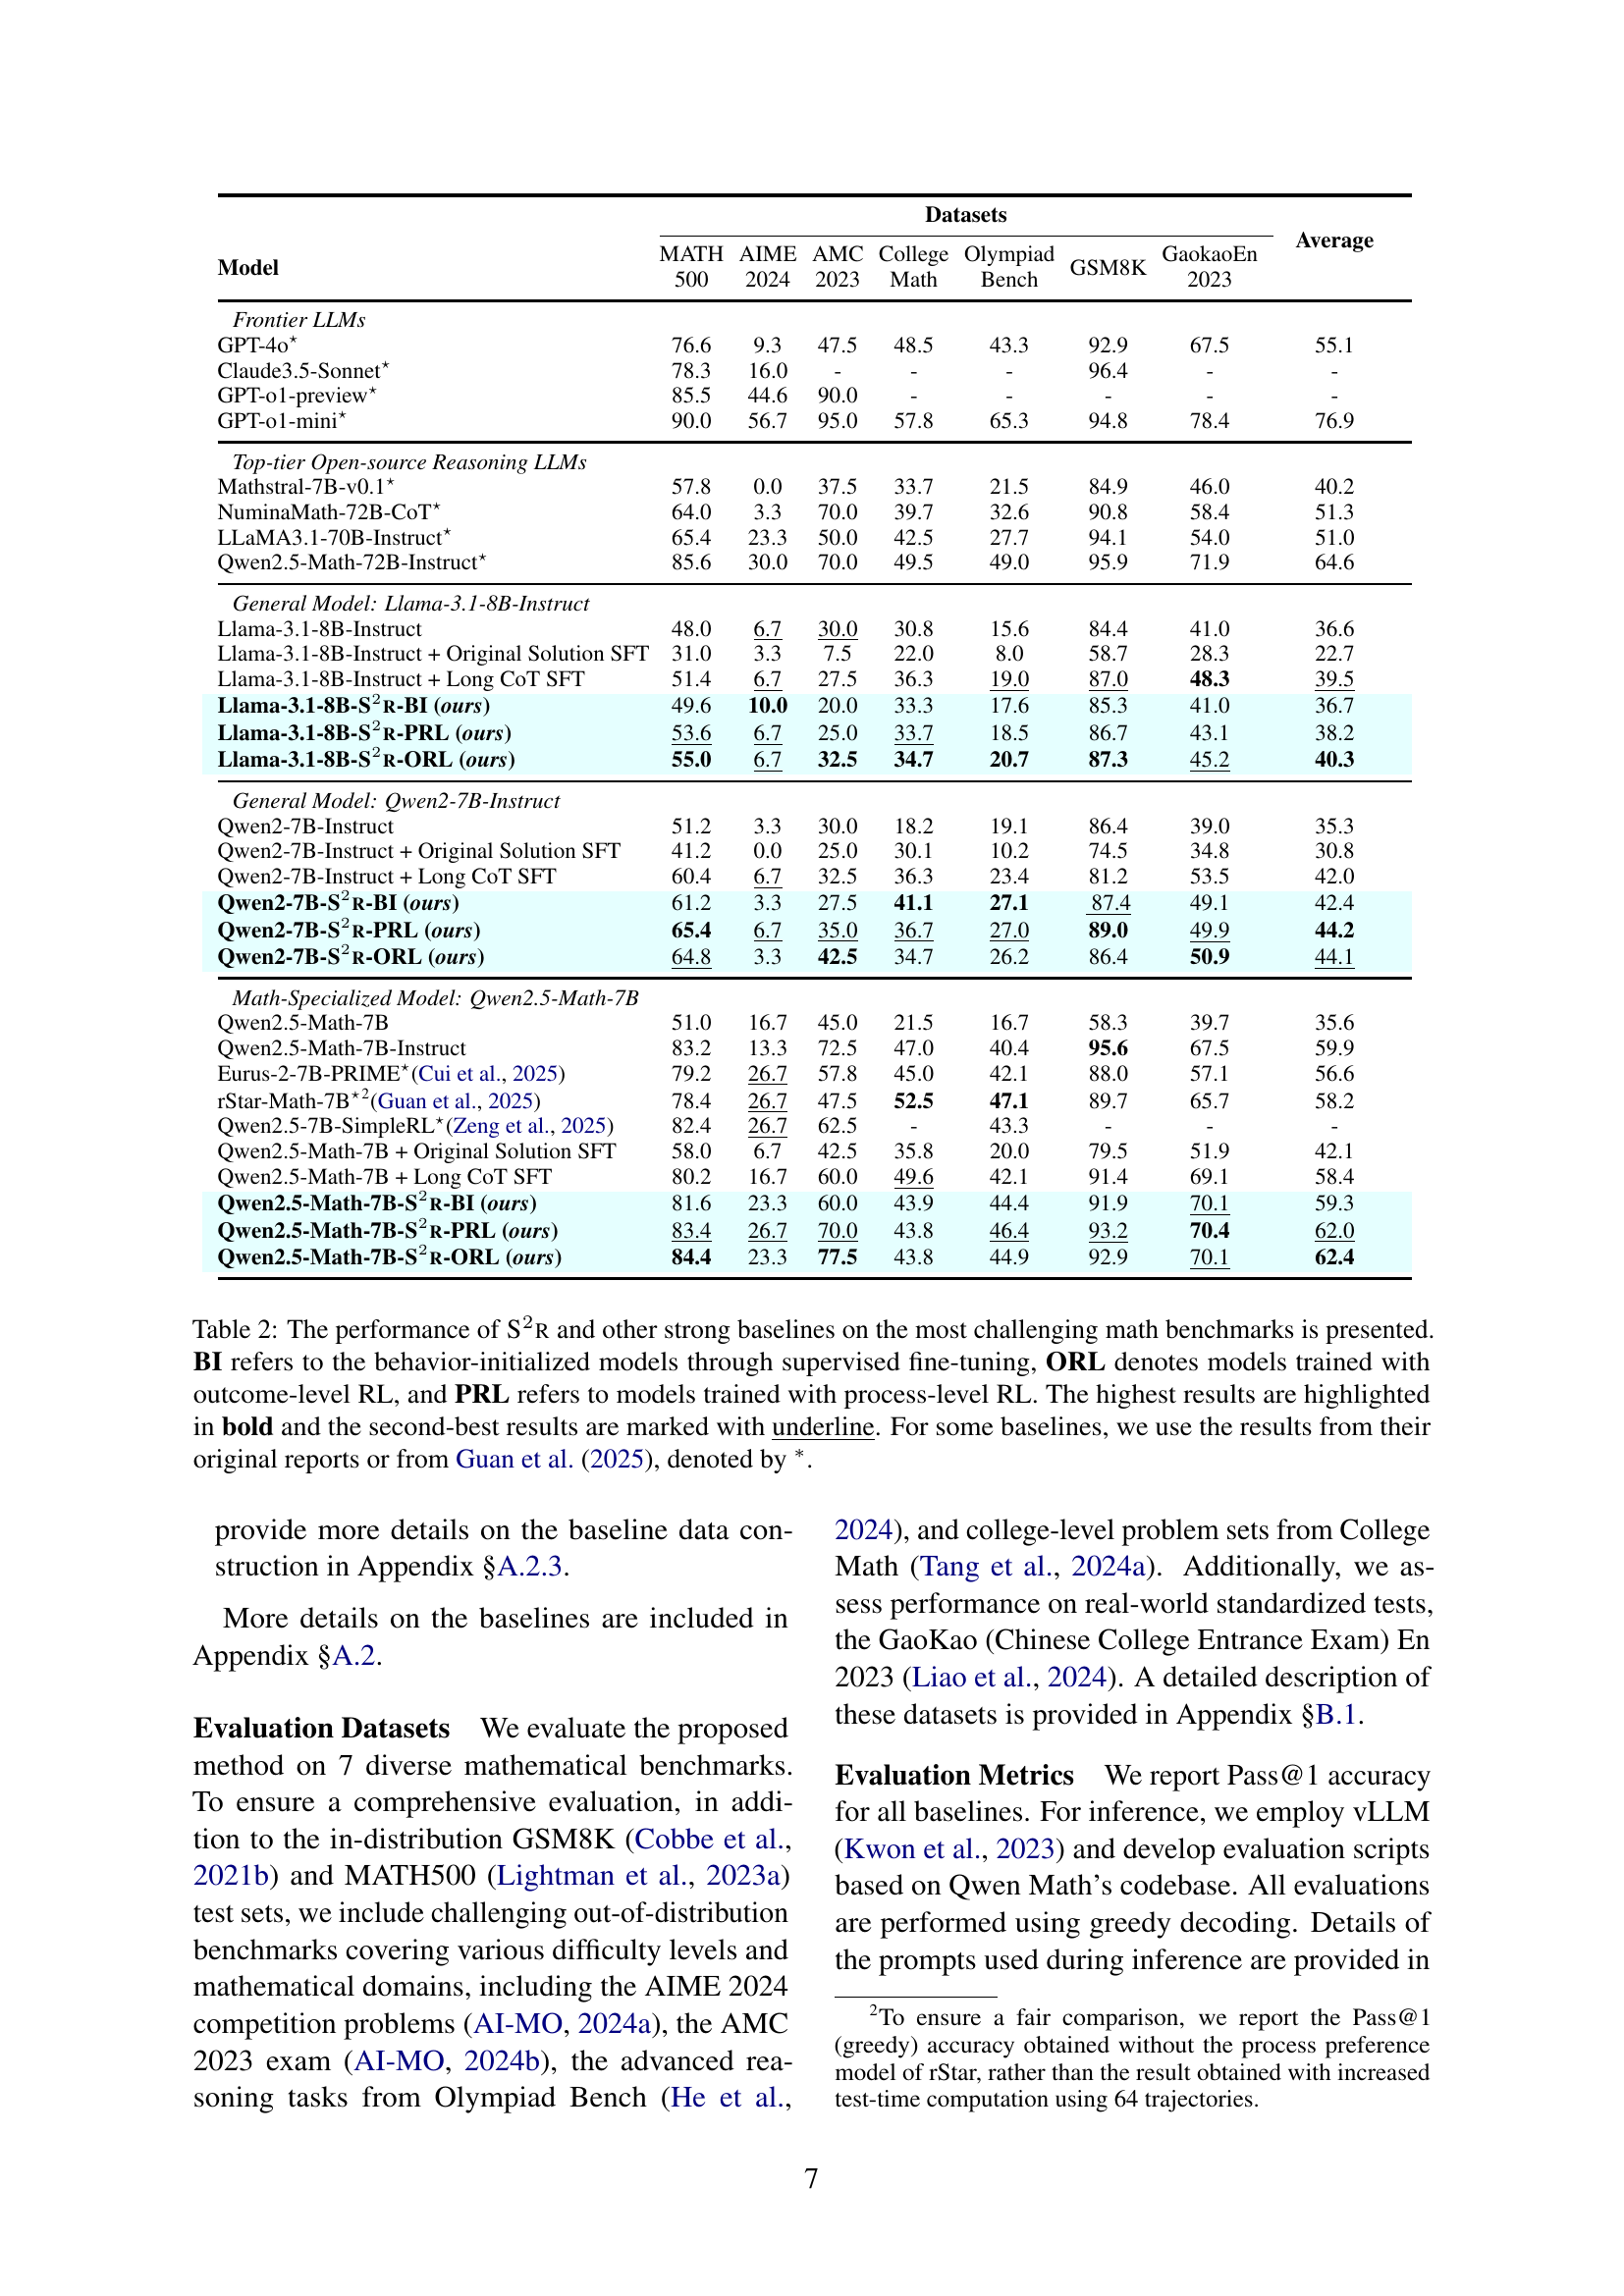
🔼 Table 2 presents the performance comparison of different Large Language Models (LLMs) on various challenging math reasoning benchmarks. The models are categorized into several groups: frontier LLMs (state-of-the-art commercial models), top-tier open-source reasoning LLMs, general models, and math-specialized models. Results are shown for the base models, and models enhanced by the proposed S2R method (using supervised fine-tuning for behavior initialization (BI) and reinforcement learning with outcome-level (ORL) and process-level (PRL) rewards). The table also includes results for models trained with long-chain-of-thought (long-CoT) data. The highest accuracy for each benchmark is shown in bold, and the second highest is underlined. Results from external sources are marked with an asterisk (*).
read the caption
Table 2: The performance of S2r and other strong baselines on the most challenging math benchmarks is presented. BI refers to the behavior-initialized models through supervised fine-tuning, ORL denotes models trained with outcome-level RL, and PRL refers to models trained with process-level RL. The highest results are highlighted in bold and the second-best results are marked with underline. For some baselines, we use the results from their original reports or from Guan et al. (2025), denoted by ∗.
| Model | FOLIO | CRUX- Eval | Strategy- QA | MMLUPro- STEM |
| Qwen2.5-Math-72B-Instruct | 69.5 | 68.6 | 94.3 | 66.0 |
| Llama-3.1-70B-Instruct∗ | 65.0 | 59.6 | 88.8 | 61.7 |
| OpenMath2-Llama3.1-70B∗ | 68.5 | 35.1 | 95.6 | 55.0 |
| QwQ-32B-Preview∗ | 84.2 | 65.2 | 88.2 | 71.9 |
| Eurus-2-7B-PRIME | 56.7 | 50.0 | 79.0 | 53.7 |
| Qwen2.5-Math-7B-Instruct | 61.6 | 28.0 | 81.2 | 44.7 |
| Qwen2.5-Math-7B | 37.9 | 40.8 | 61.1 | 46.0 |
| Qwen2.5-Math-7B-S2r-BI (ours) | 58.1 | 48.0 | 88.7 | 49.8 |
| Qwen2.5-Math-7B-S2r-ORL (ours) | 61.6 | 50.9 | 90.8 | 50.0 |
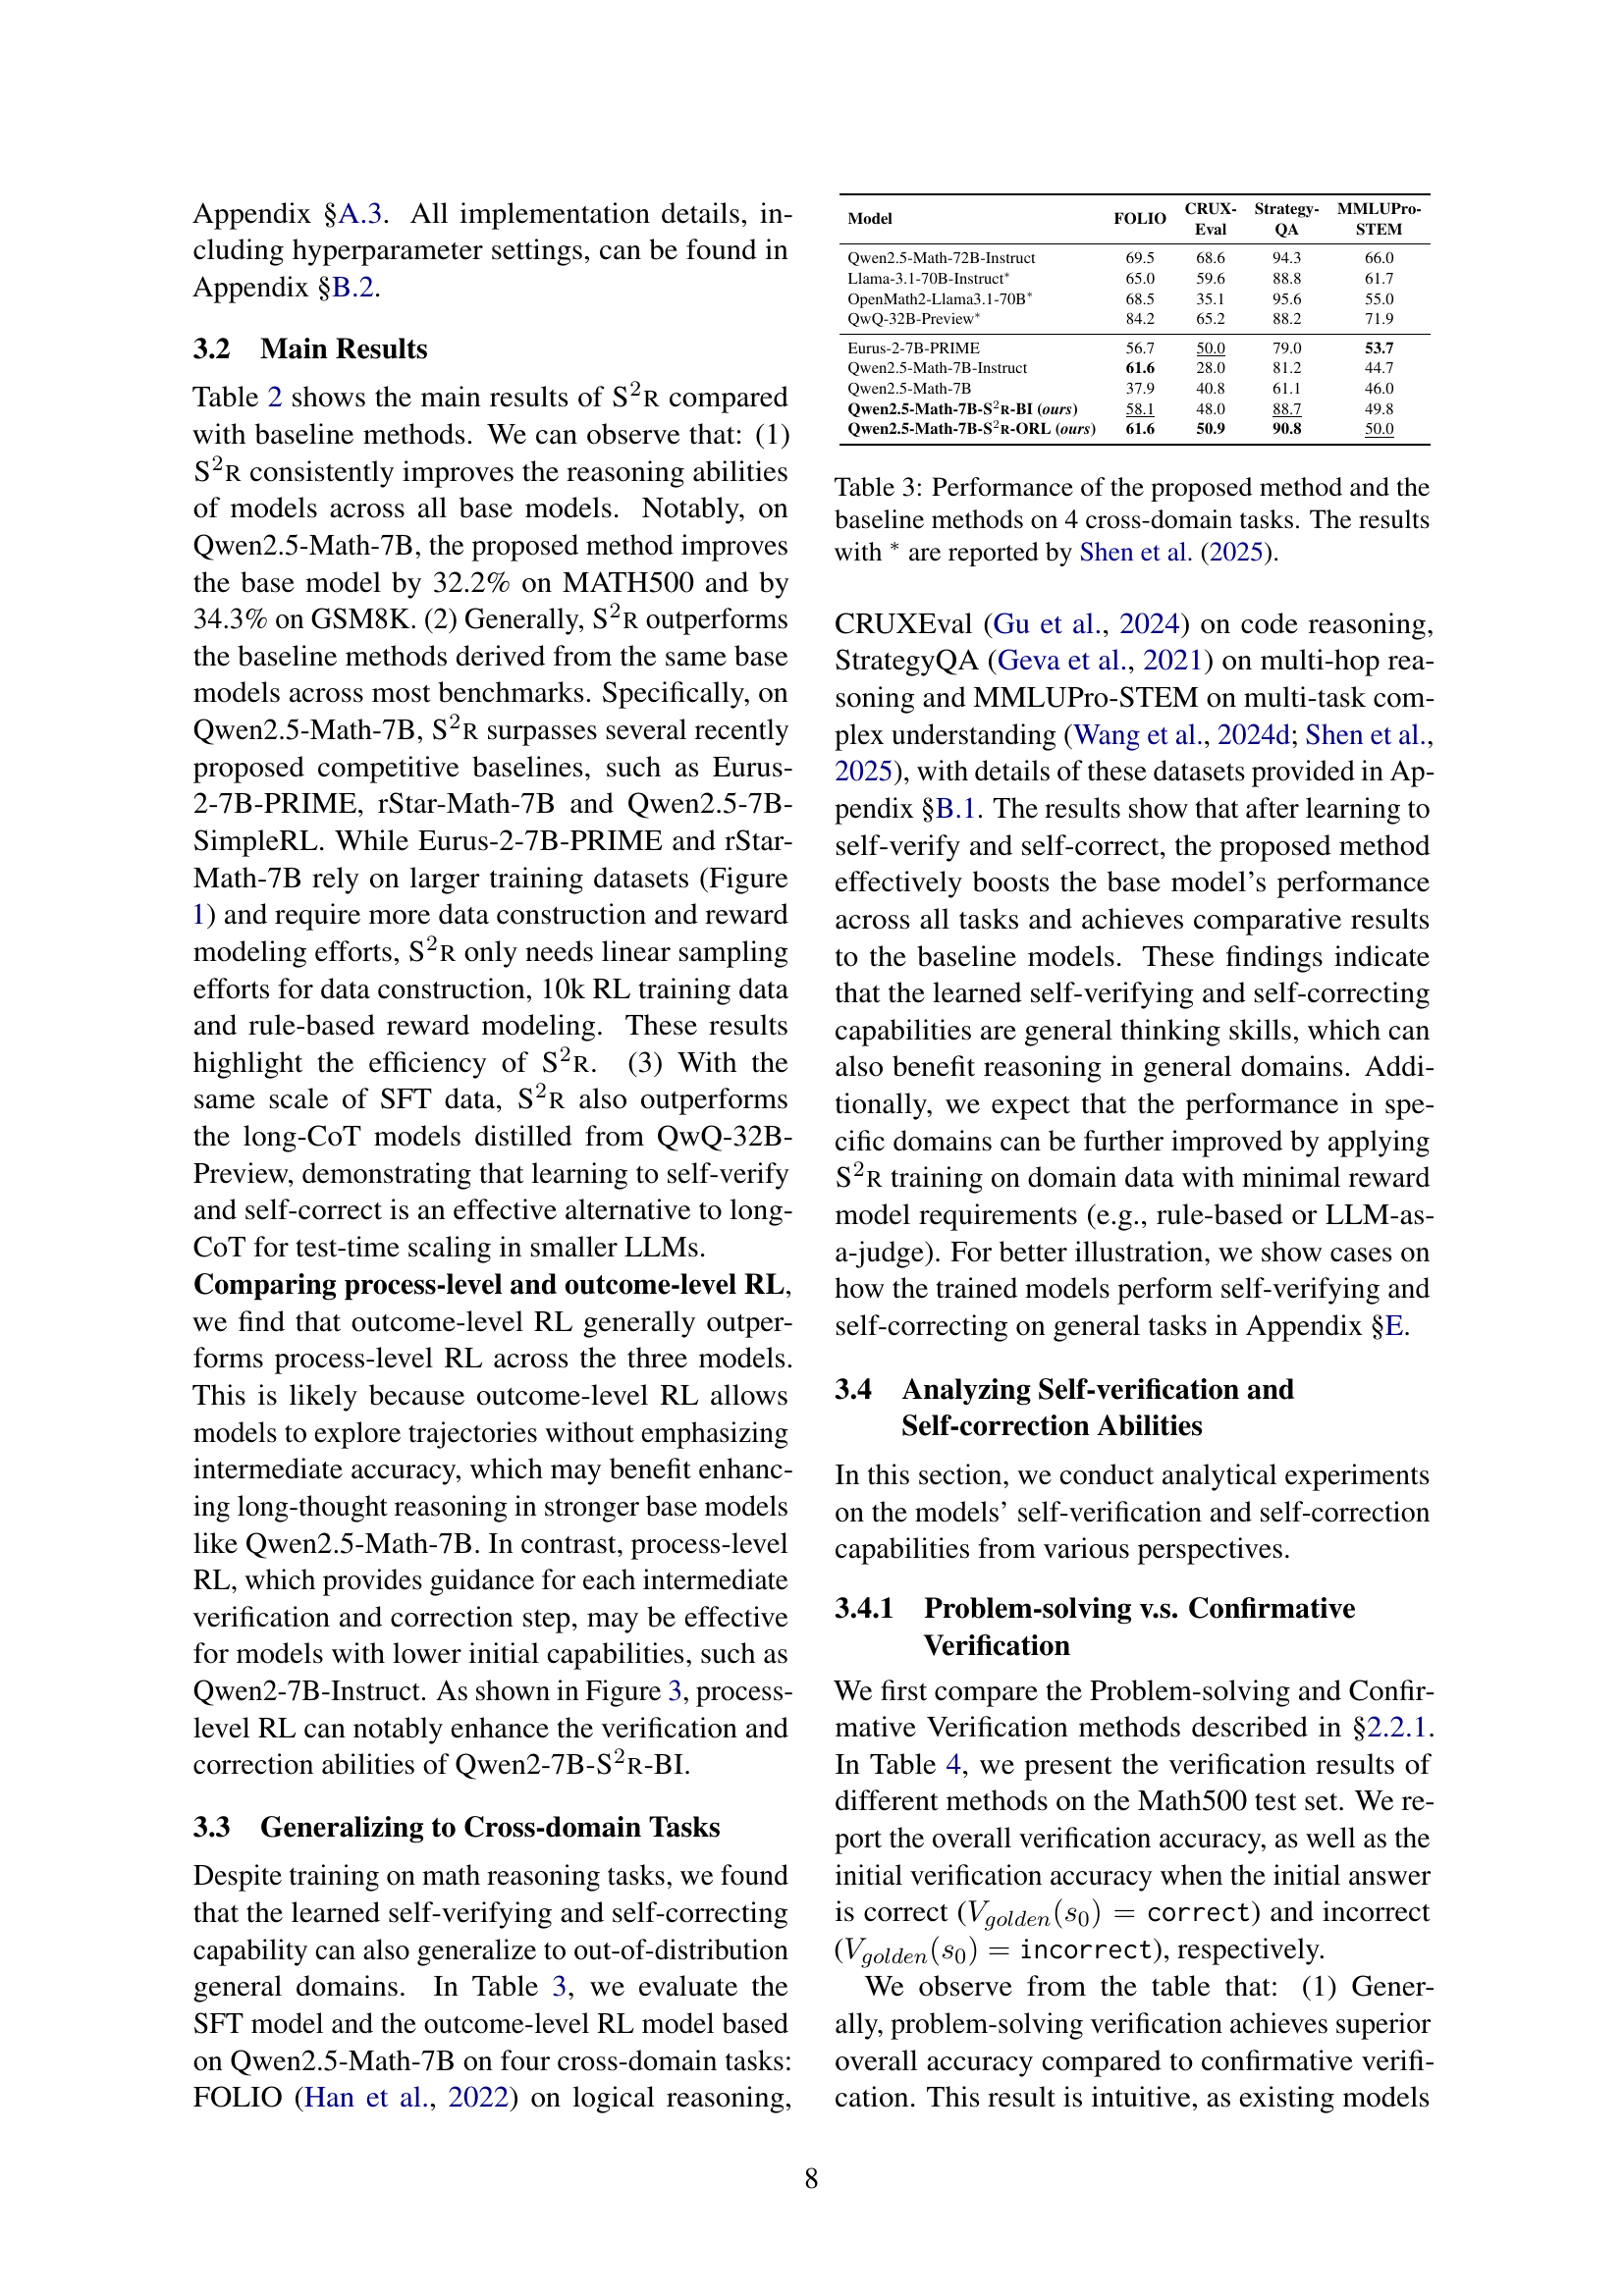
🔼 This table compares the performance of the proposed S2R method against several baseline models across four different cross-domain tasks: FOLIO (logical reasoning), CRUXEval (code reasoning), StrategyQA (multi-hop reasoning), and MMLUPro-STEM (multi-task complex understanding). The results highlight the generalizability of S2R’s learned self-verification and self-correction abilities beyond the in-domain mathematical tasks it was trained on. Results marked with an asterisk (*) were reported in a separate study by Shen et al. (2025) and are included for comparative purposes.
read the caption
Table 3: Performance of the proposed method and the baseline methods on 4 cross-domain tasks. The results with ∗ are reported by Shen et al. (2025).
| Base Model | Methods | Overall Verification Acc. | Initial Verification Acc. | |
| Llama3.1-8B-Instruct | Problem-solving | 80.10 | 87.28 | 66.96 |
| Confirmative | 65.67 | 77.27 | 78.22 | |
| Qwen2-7B-Instruct | Problem-solving | 73.28 | 90.24 | 67.37 |
| Confirmative | 58.31 | 76.16 | 70.05 | |
| Qwen2.5-Math-7B | Problem-solving | 77.25 | 91.21 | 56.67 |
| Confirmative | 61.58 | 82.80 | 68.04 | |
🔼 This table presents a comparison of two different verification methods used in the S2R framework: problem-solving verification and confirmative verification. For each method, the overall verification accuracy is reported, as well as the accuracy when the initial answer is correct and when it is incorrect. This comparison helps to evaluate the effectiveness of the two methods in identifying errors and assessing the validity of the model’s responses.
read the caption
Table 4: Comparison of problem-solving and confirmative verification.
| Datasets | Average | |||||||
| Model | MATH 500 | AIME 2024 | AMC 2023 | College Math | Olympiad Bench | GSM8K | GaokaoEn 2023 | |
| General Model: Qwen2-7B-Instruct | ||||||||
| Qwen2-7B-Instruct | 51.2 | 3.3 | 30.0 | 18.2 | 19.1 | 86.4 | 39.0 | 35.3 |
| Qwen2-7B-S2r-BI (ours) | 61.2 | 3.3 | 27.5 | 41.1 | 27.1 | 87.4 | 49.1 | 42.4 |
| Qwen2-7B-S2r-PRL (ours) | 65.4 | 6.7 | 35.0 | 36.7 | 27.0 | 89.0 | 49.9 | 44.2 |
| Qwen2-7B-S2r-ORL (ours) | 64.8 | 3.3 | 42.5 | 34.7 | 26.2 | 86.4 | 50.9 | 44.1 |
| Qwen2-7B–Instruct-S2r-PRL-offline (ours) | 61.6 | 10.0 | 32.5 | 40.2 | 26.5 | 87.6 | 50.4 | 44.1 |
| Qwen2-7B-Instruct-S2r-ORL-offline (ours) | 61.0 | 6.7 | 37.5 | 40.5 | 27.3 | 87.4 | 49.6 | 44.3 |
| Math-Specialized Model: Qwen2.5-Math-7B | ||||||||
| Qwen2.5-Math-7B | 51.0 | 16.7 | 45.0 | 21.5 | 16.7 | 58.3 | 39.7 | 35.6 |
| Qwen2.5-Math-7B-S2r-BI (ours) | 81.6 | 23.3 | 60.0 | 43.9 | 44.4 | 91.9 | 70.1 | 59.3 |
| Qwen2.5-Math-7B-S2r-PRL (ours) | 83.4 | 26.7 | 70.0 | 43.8 | 46.4 | 93.2 | 70.4 | 62.0 |
| Qwen2.5-Math-7B-S2r-ORL (ours) | 84.4 | 23.3 | 77.5 | 43.8 | 44.9 | 92.9 | 70.1 | 62.4 |
| Qwen2.5-Math-7B-S2r-PRL-offline (ours) | 83.4 | 23.3 | 62.5 | 50.0 | 46.7 | 92.9 | 72.2 | 61.6 |
| Qwen2.5-Math-7B-S2r-ORL-offline (ours) | 82.0 | 20.0 | 67.5 | 49.8 | 45.8 | 92.6 | 70.4 | 61.2 |
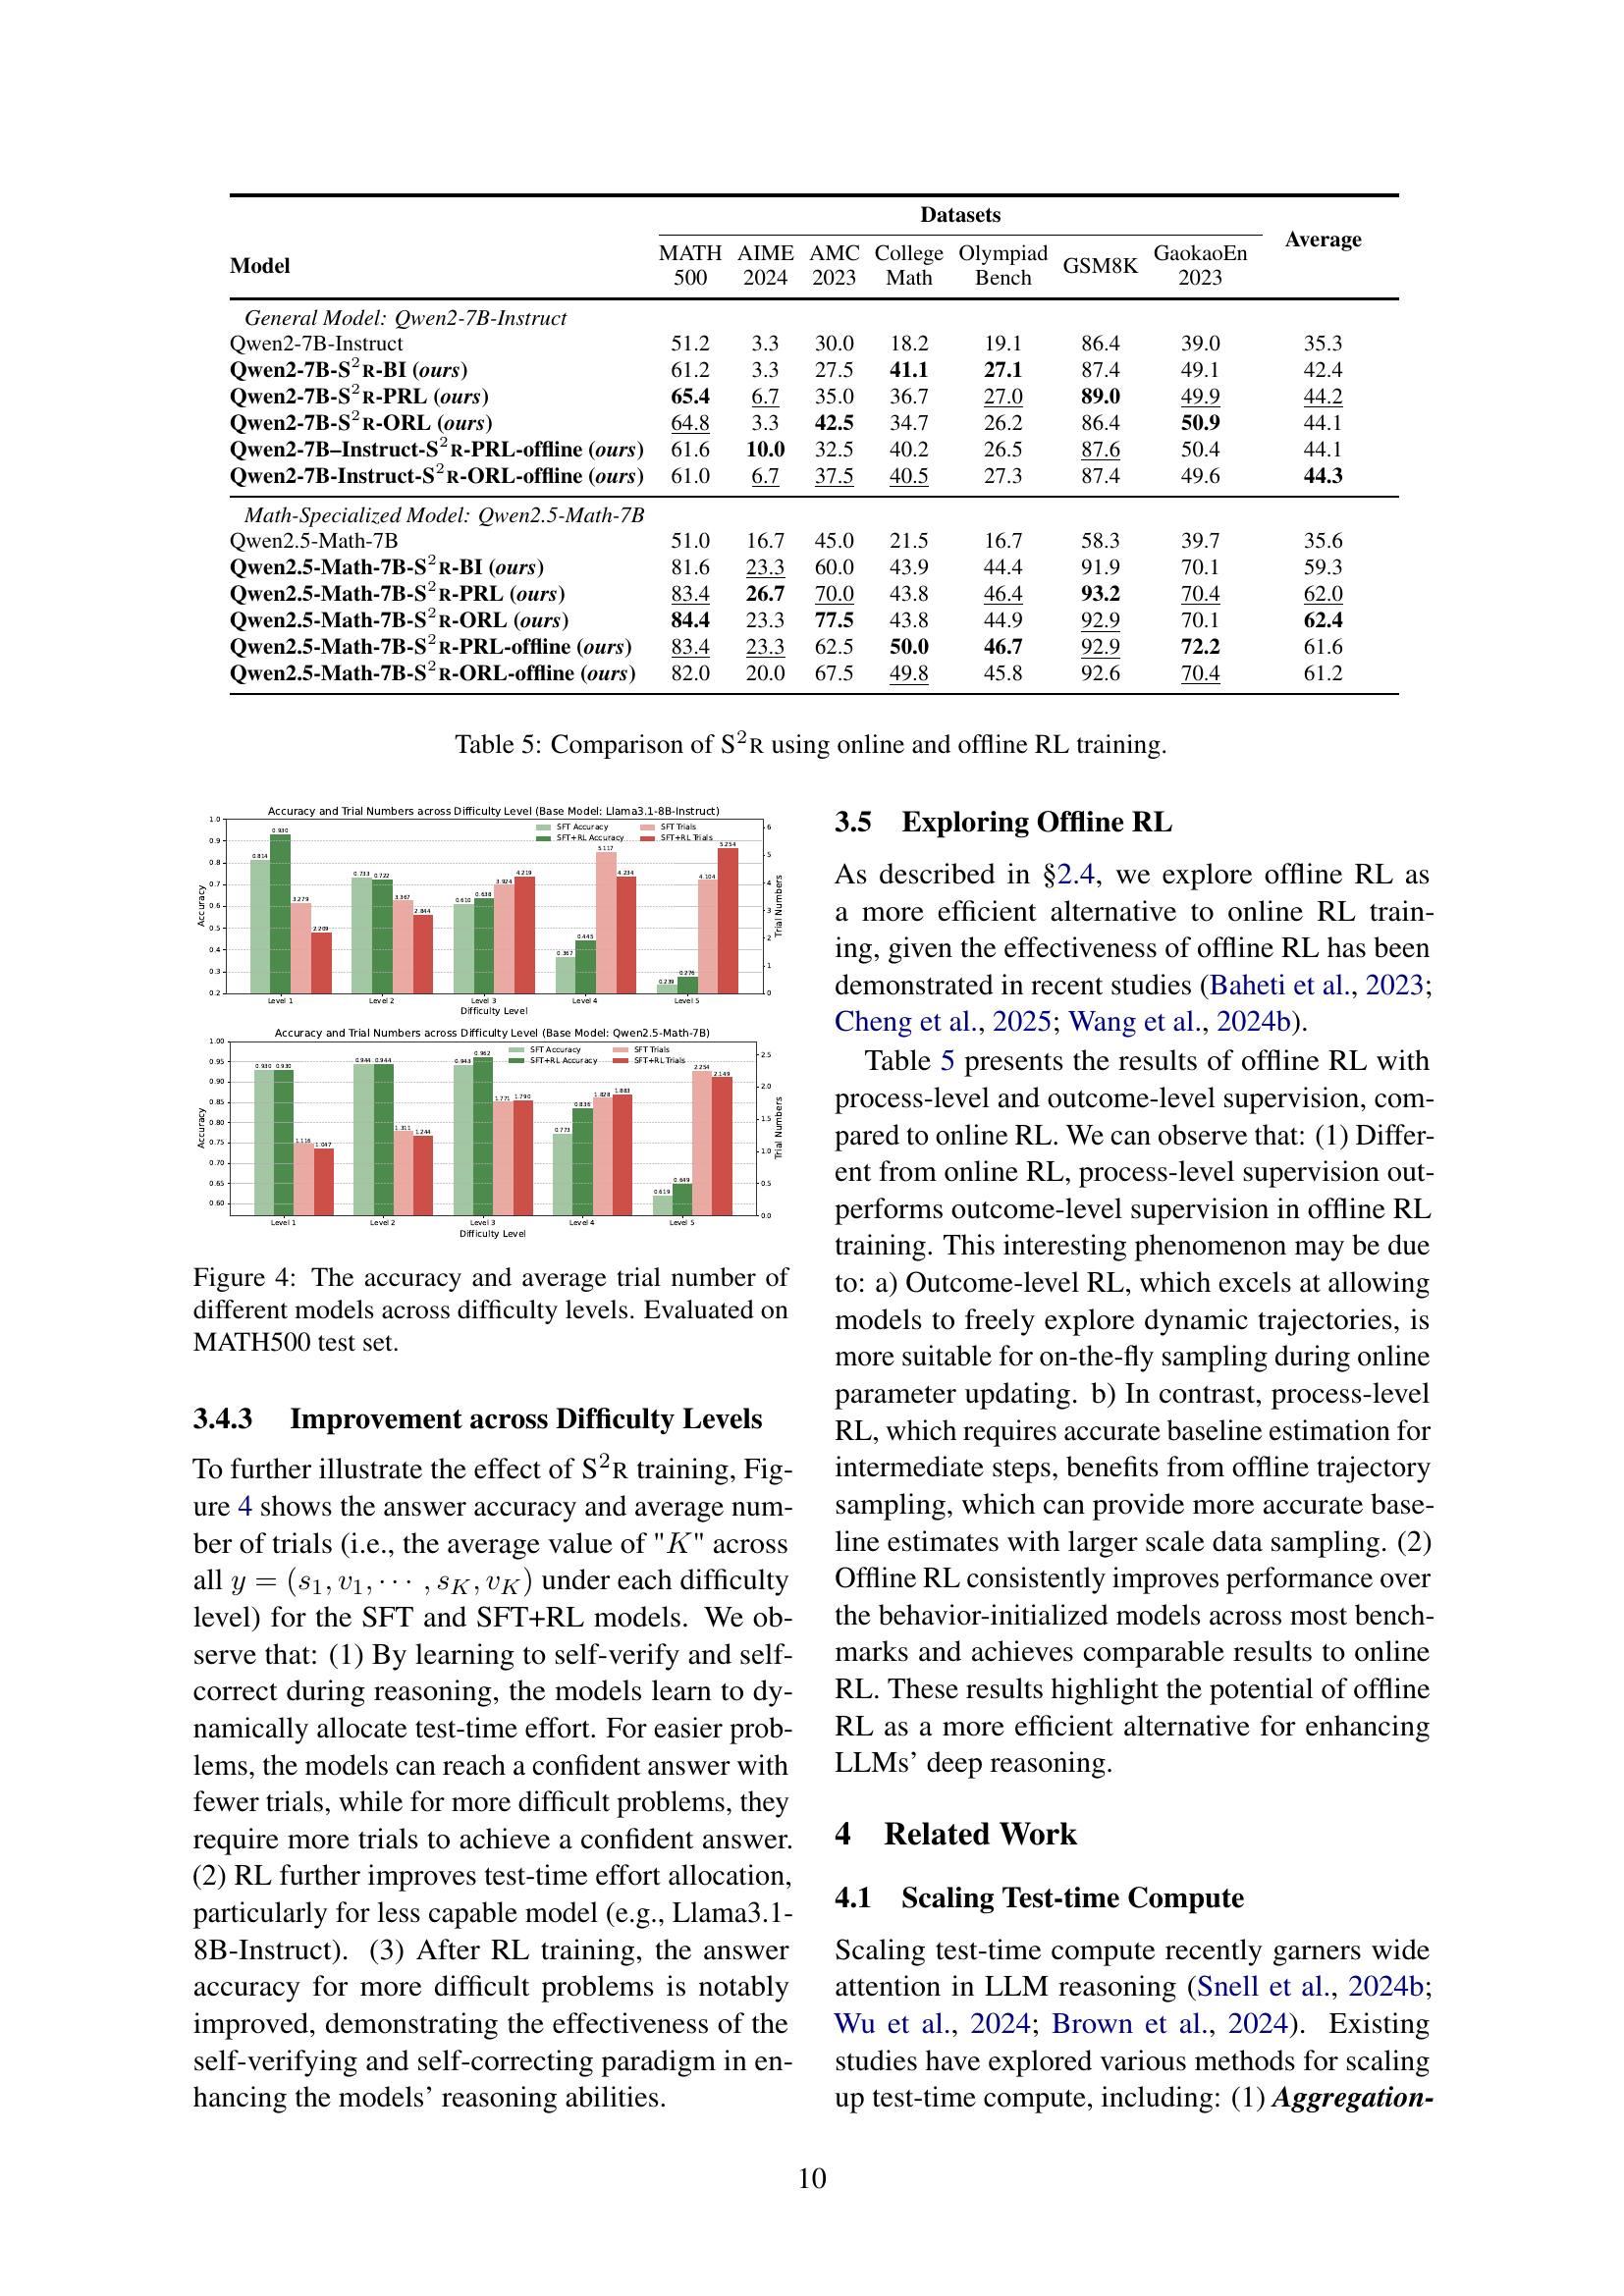
🔼 This table compares the performance of the S2R model trained using online and offline reinforcement learning (RL). It shows the accuracy achieved by the model on various math reasoning benchmarks, including MATH500, AIME 2024, AMC 2023, College Math, Olympiad, GSM8K, and GaokaoEn 2023. The results are broken down by the type of RL training used (process-level, outcome-level) and whether the training was done online or offline. This allows for a comparison of the effectiveness and efficiency of different training approaches.
read the caption
Table 5: Comparison of S2r using online and offline RL training.
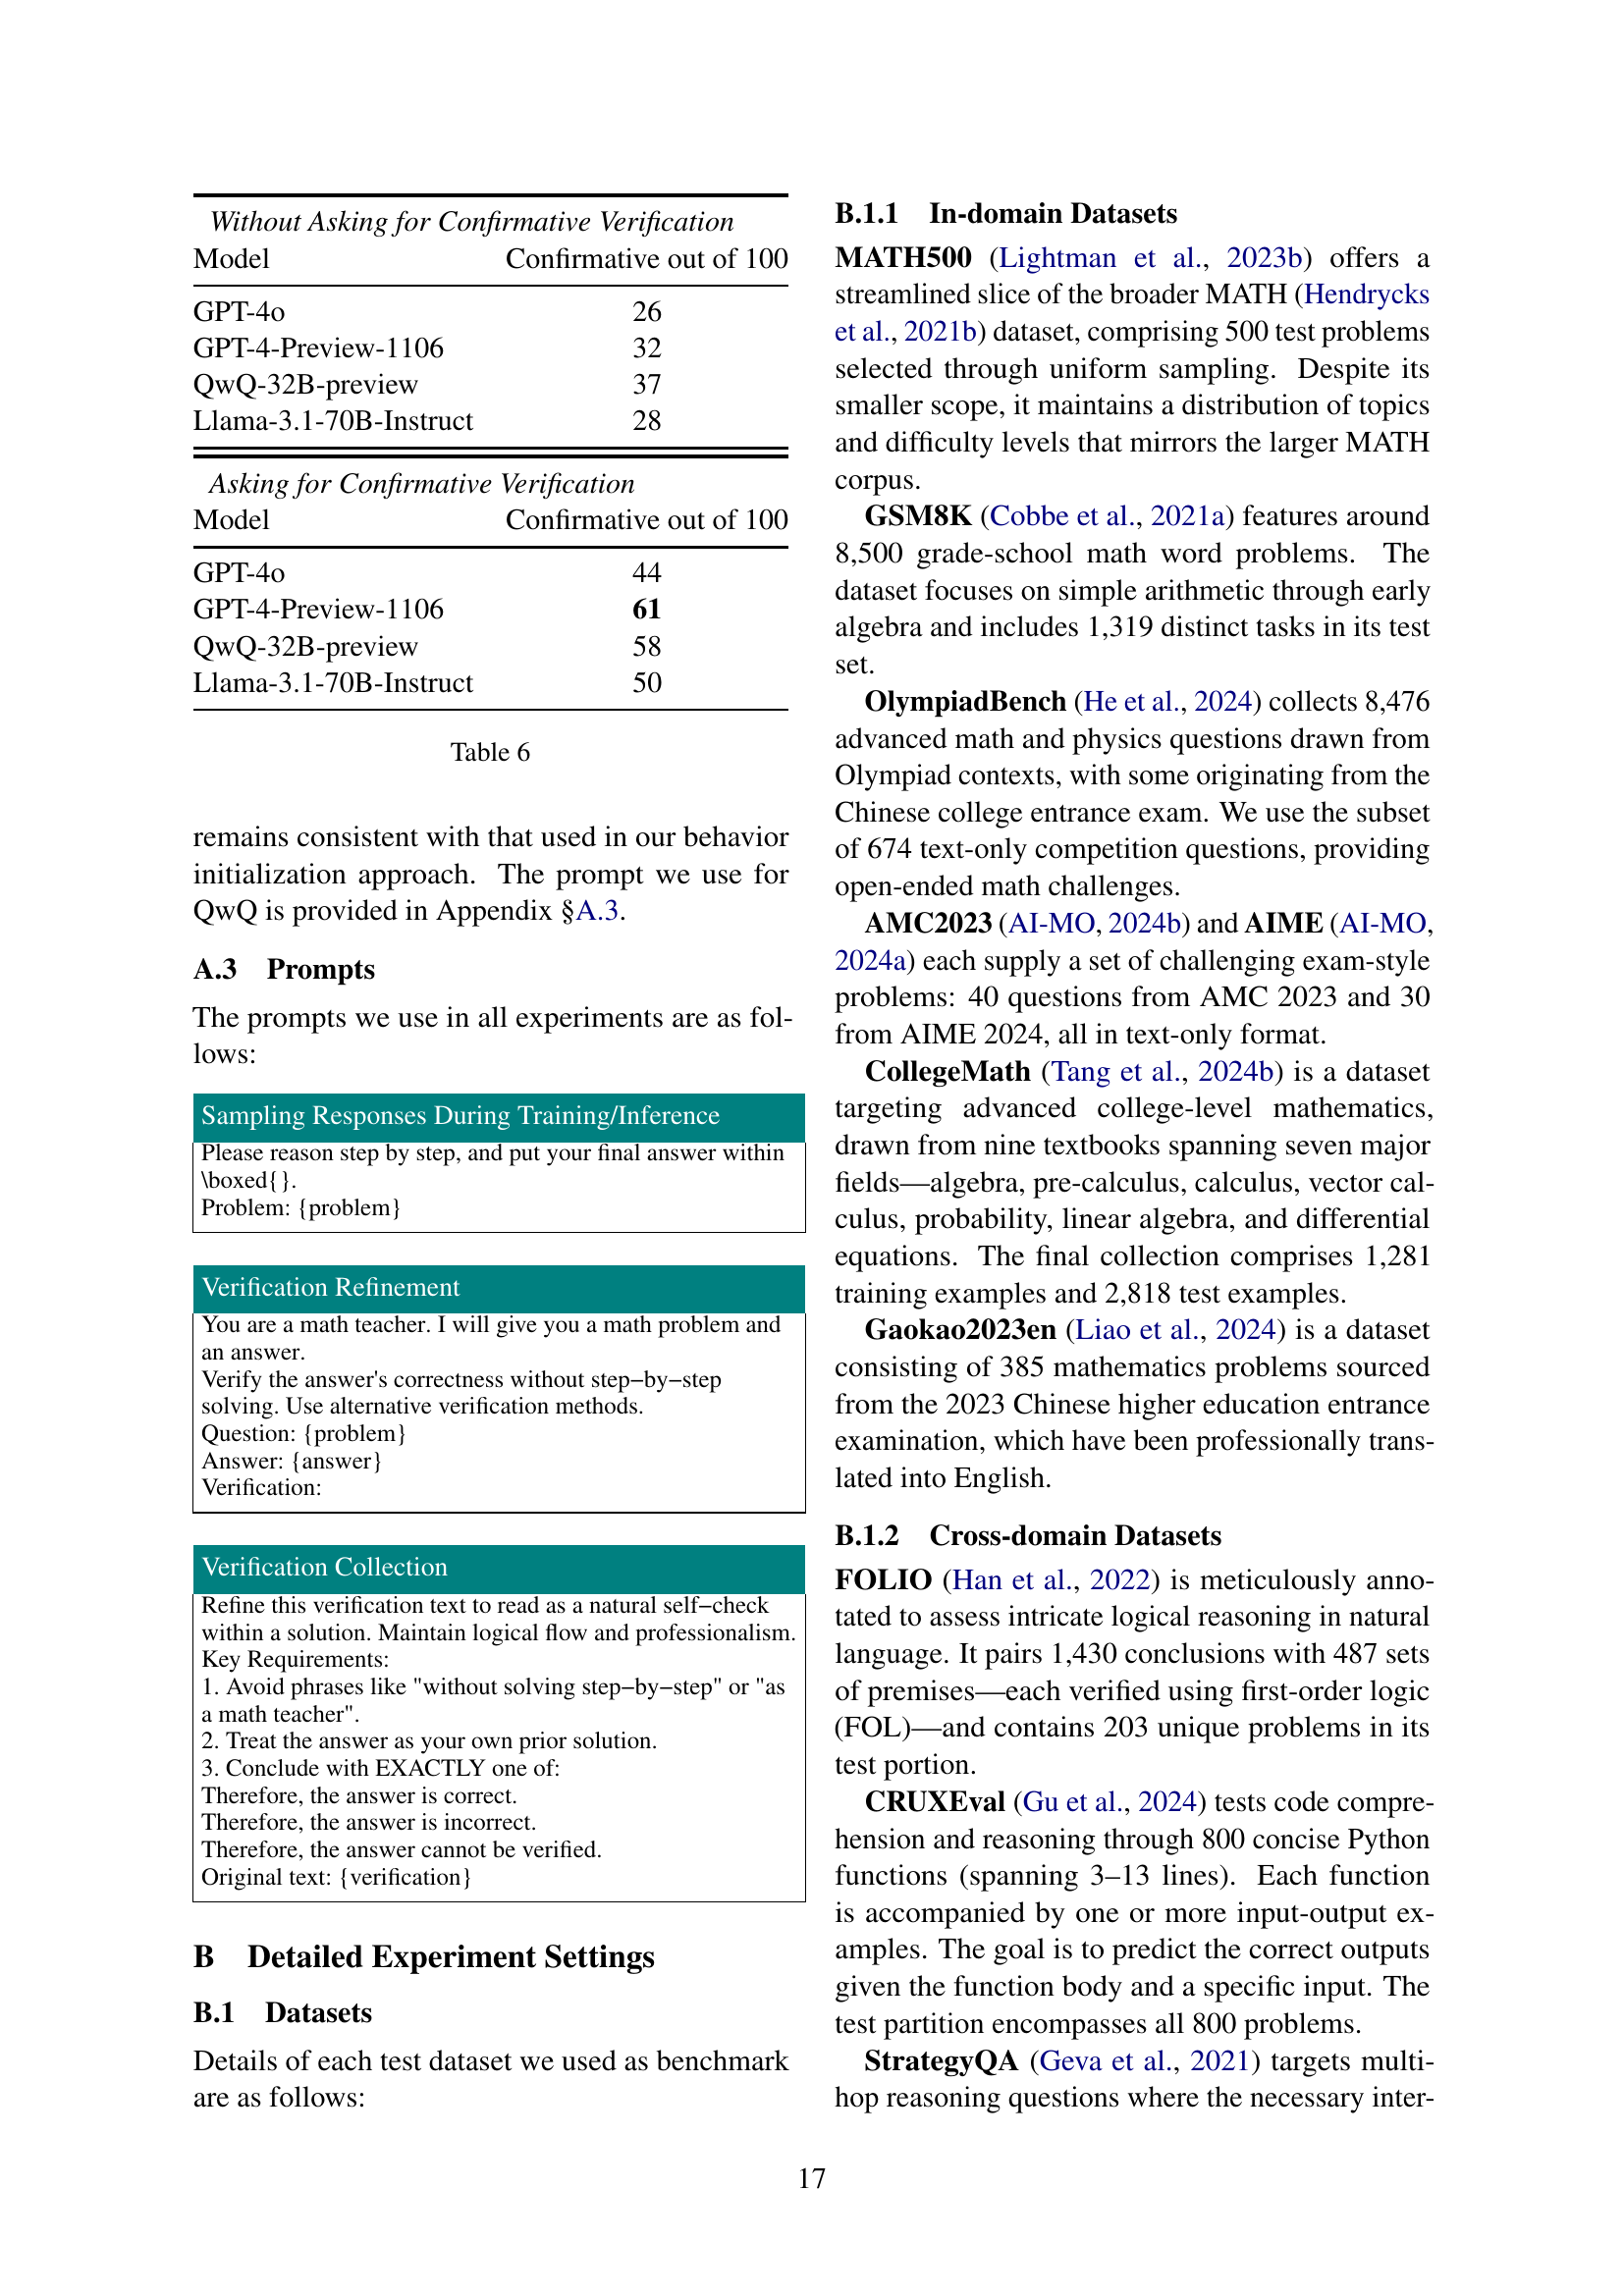
| Without Asking for Confirmative Verification | |
| Model | Confirmative out of 100 |
| GPT-4o | 26 |
| GPT-4-Preview-1106 | 32 |
| QwQ-32B-preview | 37 |
| Llama-3.1-70B-Instruct | 28 |
| Asking for Confirmative Verification | |
| Model | Confirmative out of 100 |
| GPT-4o | 44 |
| GPT-4-Preview-1106 | 61 |
| QwQ-32B-preview | 58 |
| Llama-3.1-70B-Instruct | 50 |
🔼 This table presents the results of an experiment to evaluate the effectiveness of two different verification methods (Problem-solving and Confirmative) in a self-verification task. It shows, for each of four different LLMs (GPT-40, GPT-4-preview-1106, QwQ-32B-preview, and Llama-3.1-70B-Instruct), the percentage of times that each verification method produced a ‘Confirmative’ result out of 100 trials. The experiment was conducted both with and without explicitly instructing the models to perform ‘Confirmative’ verification. This allows for a comparison of the models’ inherent tendencies versus their performance when explicitly guided toward a particular verification method.
read the caption
Table 6:
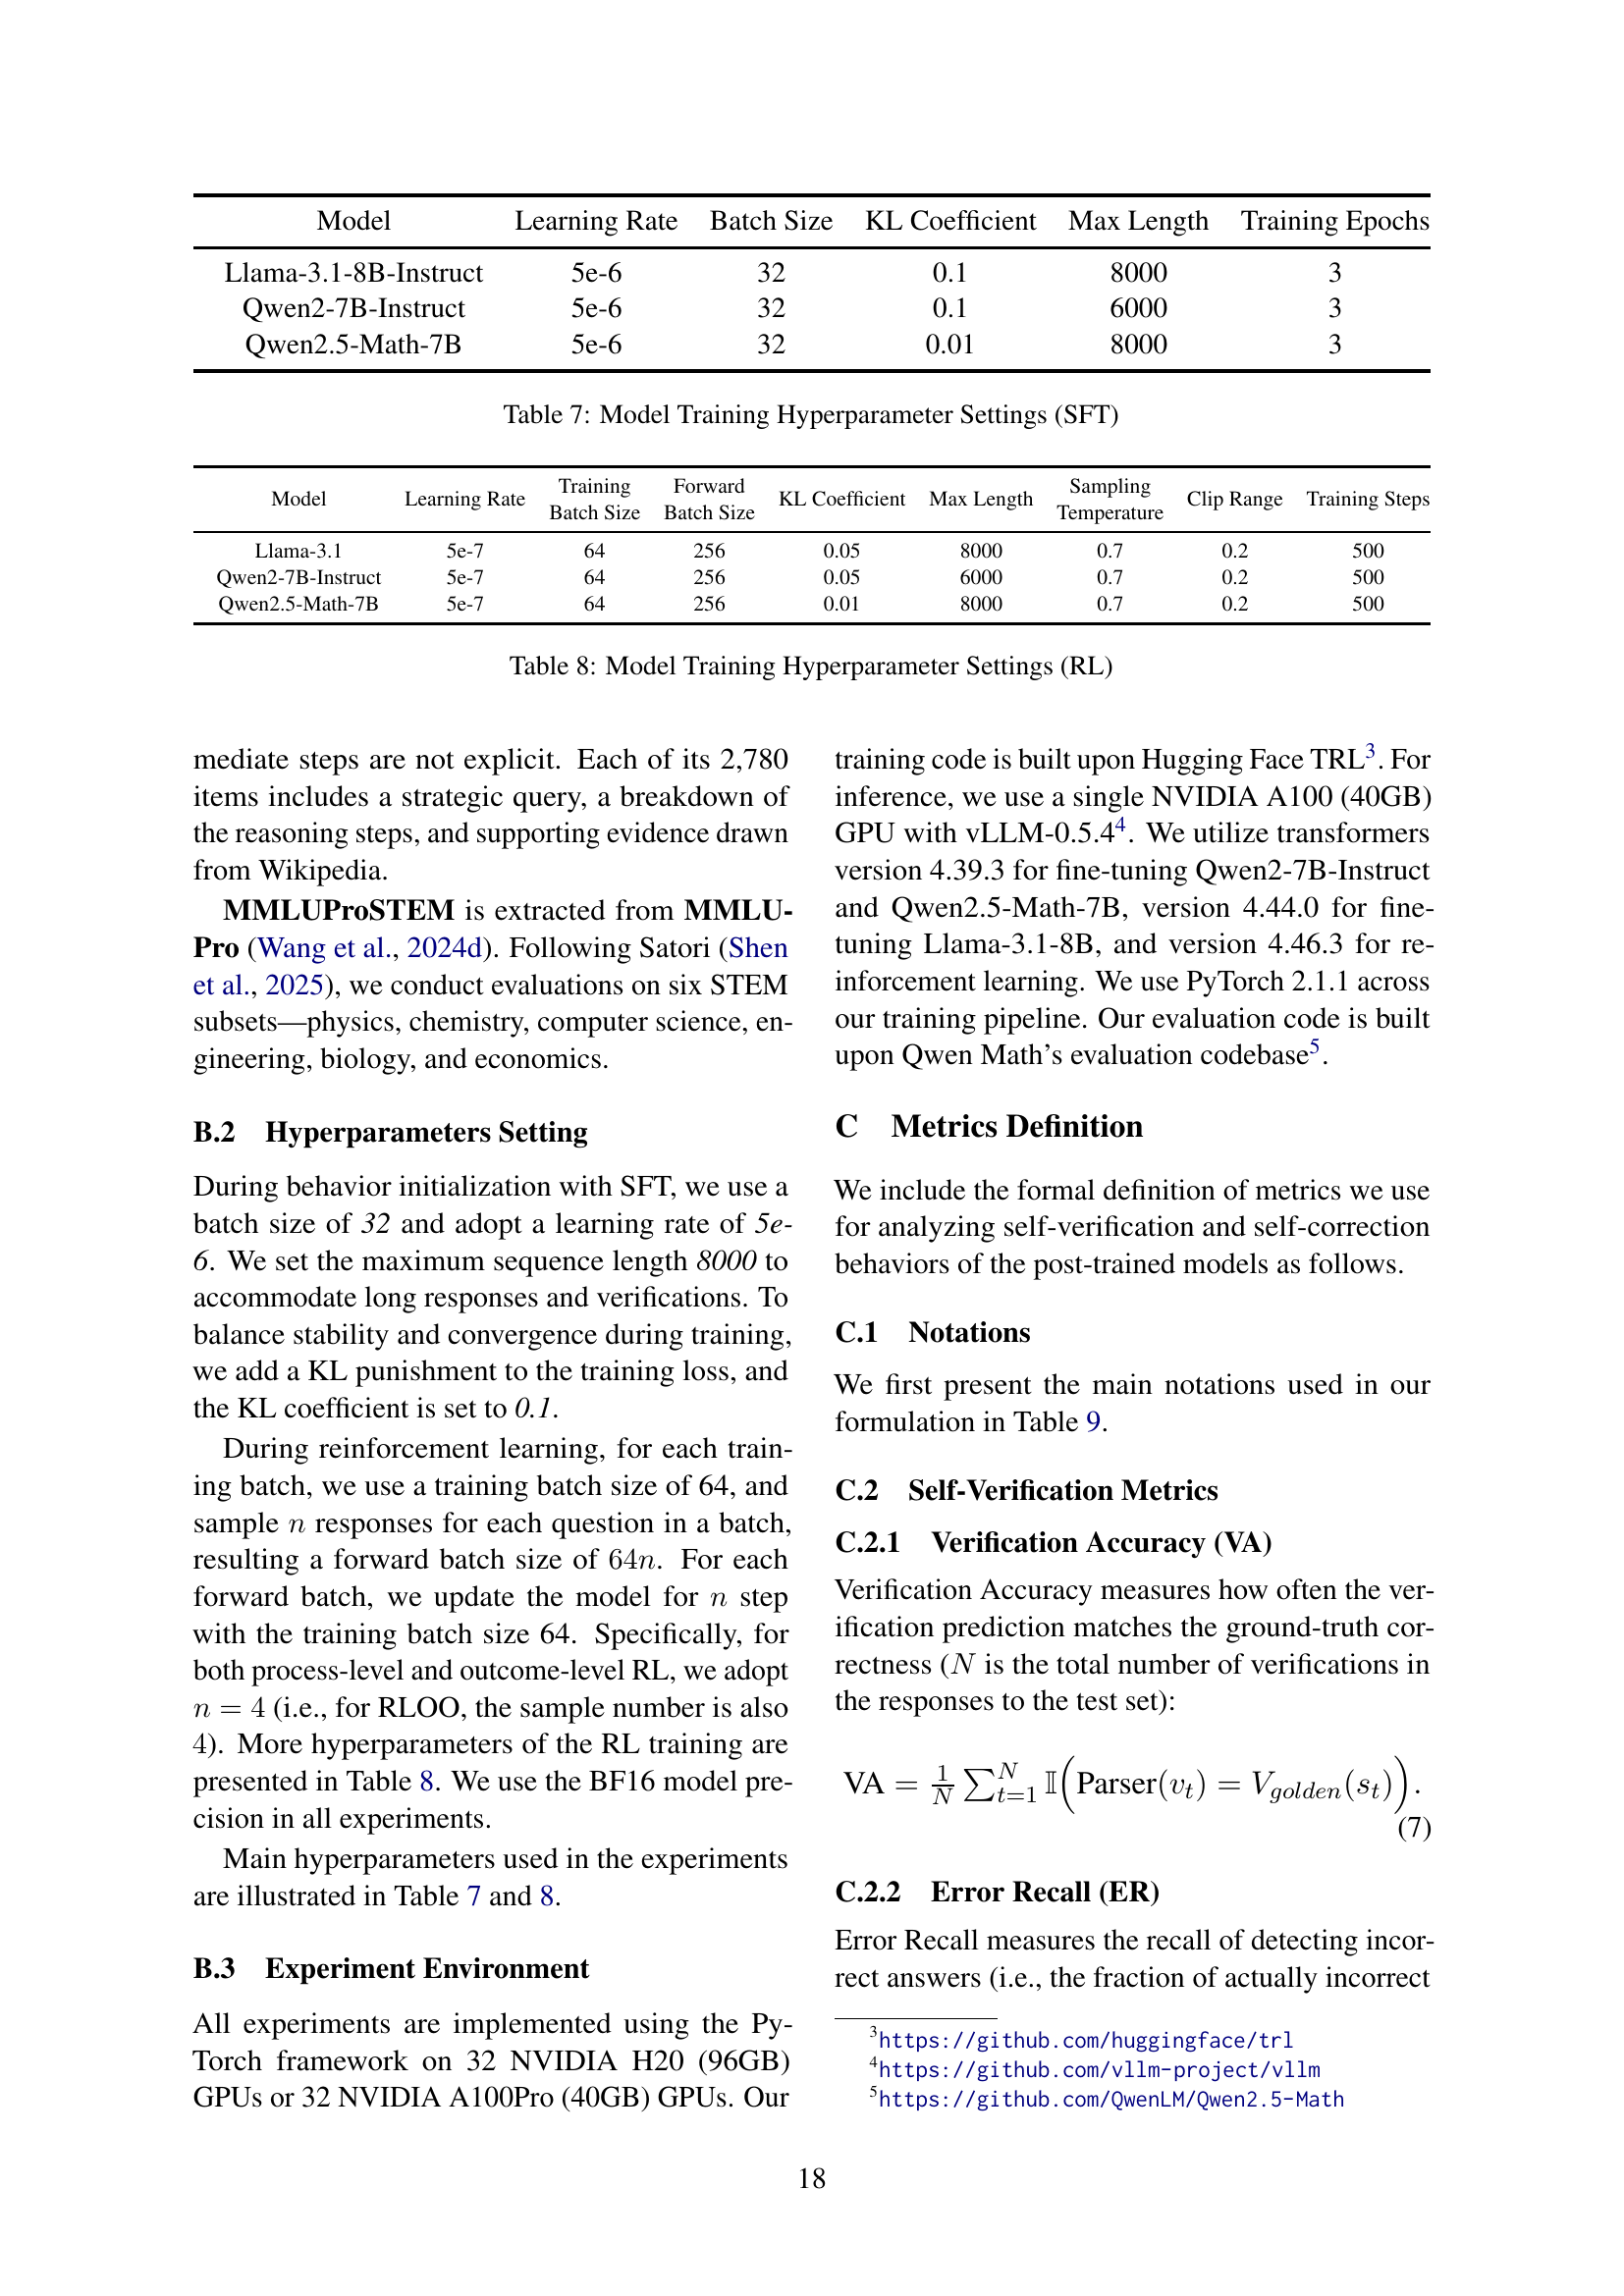
| Model | Learning Rate | Batch Size | KL Coefficient | Max Length | Training Epochs |
| Llama-3.1-8B-Instruct | 5e-6 | 32 | 0.1 | 8000 | 3 |
| Qwen2-7B-Instruct | 5e-6 | 32 | 0.1 | 6000 | 3 |
| Qwen2.5-Math-7B | 5e-6 | 32 | 0.01 | 8000 | 3 |
🔼 This table shows the hyperparameter settings used for supervised fine-tuning (SFT) during the behavior initialization stage of the S2R framework. It lists the learning rate, batch size, KL coefficient, maximum sequence length, and number of training epochs used for three different base language models: Llama-3.1-8B-Instruct, Qwen2-7B-Instruct, and Qwen2.5-Math-7B. These settings were employed to initialize the models with self-verification and self-correction behaviors.
read the caption
Table 7: Model Training Hyperparameter Settings (SFT)
| Model | Learning Rate | Training Batch Size | Forward Batch Size | KL Coefficient | Max Length | Sampling Temperature | Clip Range | Training Steps |
| Llama-3.1 | 5e-7 | 64 | 256 | 0.05 | 8000 | 0.7 | 0.2 | 500 |
| Qwen2-7B-Instruct | 5e-7 | 64 | 256 | 0.05 | 6000 | 0.7 | 0.2 | 500 |
| Qwen2.5-Math-7B | 5e-7 | 64 | 256 | 0.01 | 8000 | 0.7 | 0.2 | 500 |
🔼 This table details the hyperparameters used during the reinforcement learning (RL) phase of training the language models. It shows the settings for three different models: Llama-3.1, Qwen2-7B-Instruct, and Qwen2.5-Math-7B. For each model, the table specifies the learning rate, batch size (both forward and during sampling), KL coefficient for regularization, maximum sequence length, sampling temperature used for action selection, and the clip range used for clipping the advantage for stability during training. The last column shows the total number of training steps.
read the caption
Table 8: Model Training Hyperparameter Settings (RL)
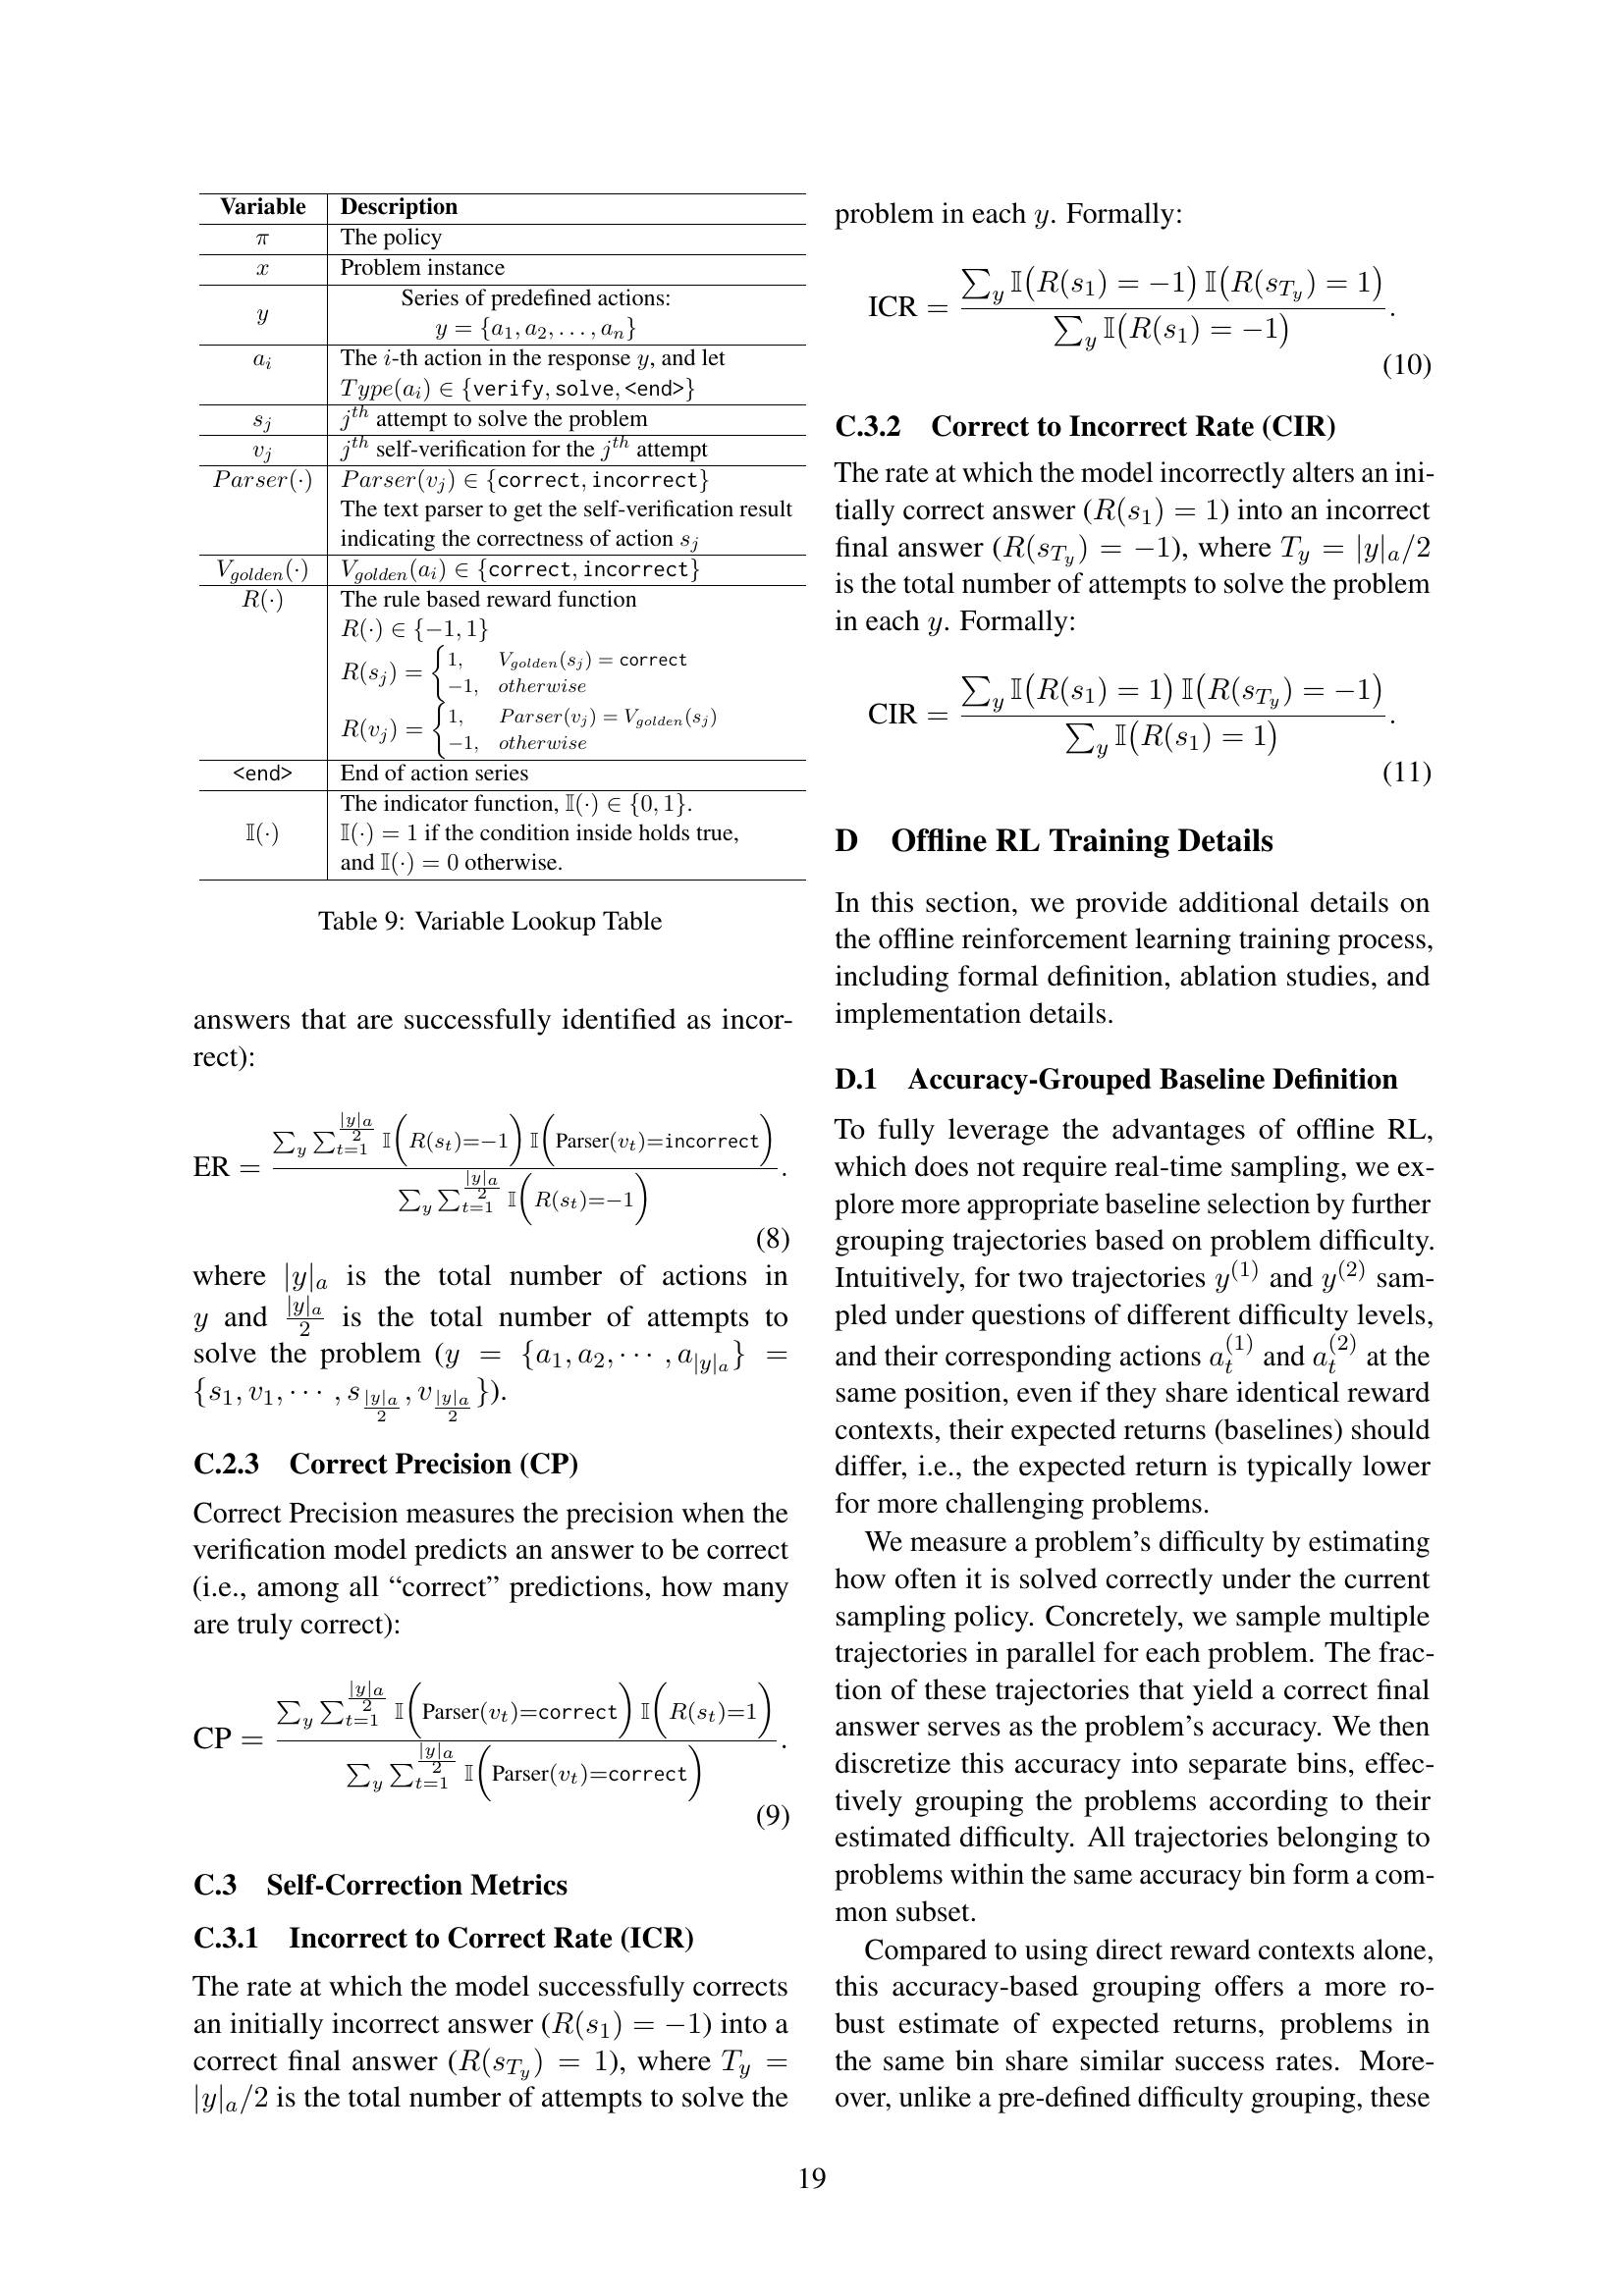
| Variable | Description |
| The policy | |
| Problem instance | |
| Series of predefined actions: | |
| The -th action in the response , and let | |
| attempt to solve the problem | |
| self-verification for the attempt | |
| The text parser to get the self-verification result | |
| indicating the correctness of action | |
| The rule based reward function | |
| <end> | End of action series |
| The indicator function, . if the condition inside holds true, and otherwise. |
🔼 This table lists and describes the variables used in the mathematical formulation and metrics calculations within the paper. It provides a concise reference for understanding the symbols and their meanings, enhancing readability of the equations and results presented.
read the caption
Table 9: Variable Lookup Table
| Accuracy Range | Retained Questions | MATH500 | AIME2024 | AMC2023 | College Math | Olympiad Bench | GSM8K | GaokaoEn2023 | Average |
| 1805 | 83.4 | 23.3 | 62.5 | 50.0 | 46.7 | 92.9 | 72.2 | 61.6 | |
| 2516 | 82.6 | 23.3 | 70.0 | 49.8 | 45.3 | 92.4 | 70.1 | 61.9 | |
| 4448 | 81.6 | 23.3 | 70.0 | 49.4 | 44.7 | 92.0 | 68.1 | 61.3 | |
| Full | 80.6 | 26.7 | 67.5 | 50.0 | 43.0 | 91.4 | 67.0 | 60.9 |
🔼 This table presents the results of an ablation study evaluating different question filtering strategies based on accuracy. It shows how the model’s performance on various mathematical reasoning benchmarks (MATH500, AIME 2024, AMC 2023, College Math, Olympiad Bench, GSM8K, GaokaoEn2023) changes when training data is filtered based on different accuracy ranges. The goal is to determine the optimal accuracy range for filtering questions in the reinforcement learning phase, balancing model performance and data efficiency.
read the caption
Table 10: Comparison of question filtering accuracy selection.
| Datasets | Average | |||||||
| Baseline Method | MATH500 | AIME2024 | AMC2023 | College Math | Olympiad Bench | GSM8K | GaokaoEn2023 | |
| Based on reward context | 82.4 | 26.7 | 65.0 | 50.1 | 46.1 | 92.9 | 71.2 | 62.1 |
| Based on accuracy group with position | 83.4 | 23.3 | 62.5 | 50.0 | 46.7 | 92.9 | 72.2 | 61.6 |
| Based on accuracy group with reward context | 82.4 | 23.3 | 67.5 | 49.3 | 45.8 | 93.3 | 71.2 | 61.8 |
🔼 This table compares the performance of three different baseline methods for offline reinforcement learning (RL) in enhancing Large Language Model (LLM) reasoning. The baselines differ in how they estimate the baseline reward during the RL training process: one uses a reward context grouping, another uses accuracy-grouped baselines with position information, and the last one combines accuracy-based grouping with reward context. The table shows the accuracy achieved on various mathematical reasoning benchmarks (MATH500, AIME2024, AMC2023, College Math, Olympiad Bench, GSM8K, GaokaoEn2023) for each baseline method, allowing for a comparison of their effectiveness.
read the caption
Table 11: The performance of different baselines
Full paper#