TL;DR#
Geolocation, critical for navigation and monitoring, suffers from datasets that are small, noisy, and inconsistent. Current methods often produce coarse, imprecise, and non-interpretable results, hindering advancements in the field. To solve these issues, this paper introduces GeoComp, a large-scale dataset collected from a geolocation game platform with 740K users, 25M metadata entries, and 3M geo-tagged locations.
Leveraging GeoComp, they propose GeoCoT, a reasoning method enhancing Large Vision Model capabilities in geolocation tasks and GeoEval, an evaluation metric. GeoCoT integrates contextual and spatial cues, mimicking human reasoning. Experiments show that GeoCoT significantly boosts geolocation accuracy by up to 25% while enhancing interpretability, providing a comprehensive solution to critical challenges.
Key Takeaways#
Why does it matter?#
This paper introduces a large-scale, human-annotated geolocation dataset (GeoComp) and a reasoning framework (GeoCoT), addressing critical challenges in geolocation research and opening new avenues for developing more accurate and interpretable models. This is achieved with a novel evaluation metric. These contributions provide a valuable resource and methodology for advancing the field.
Visual Insights#

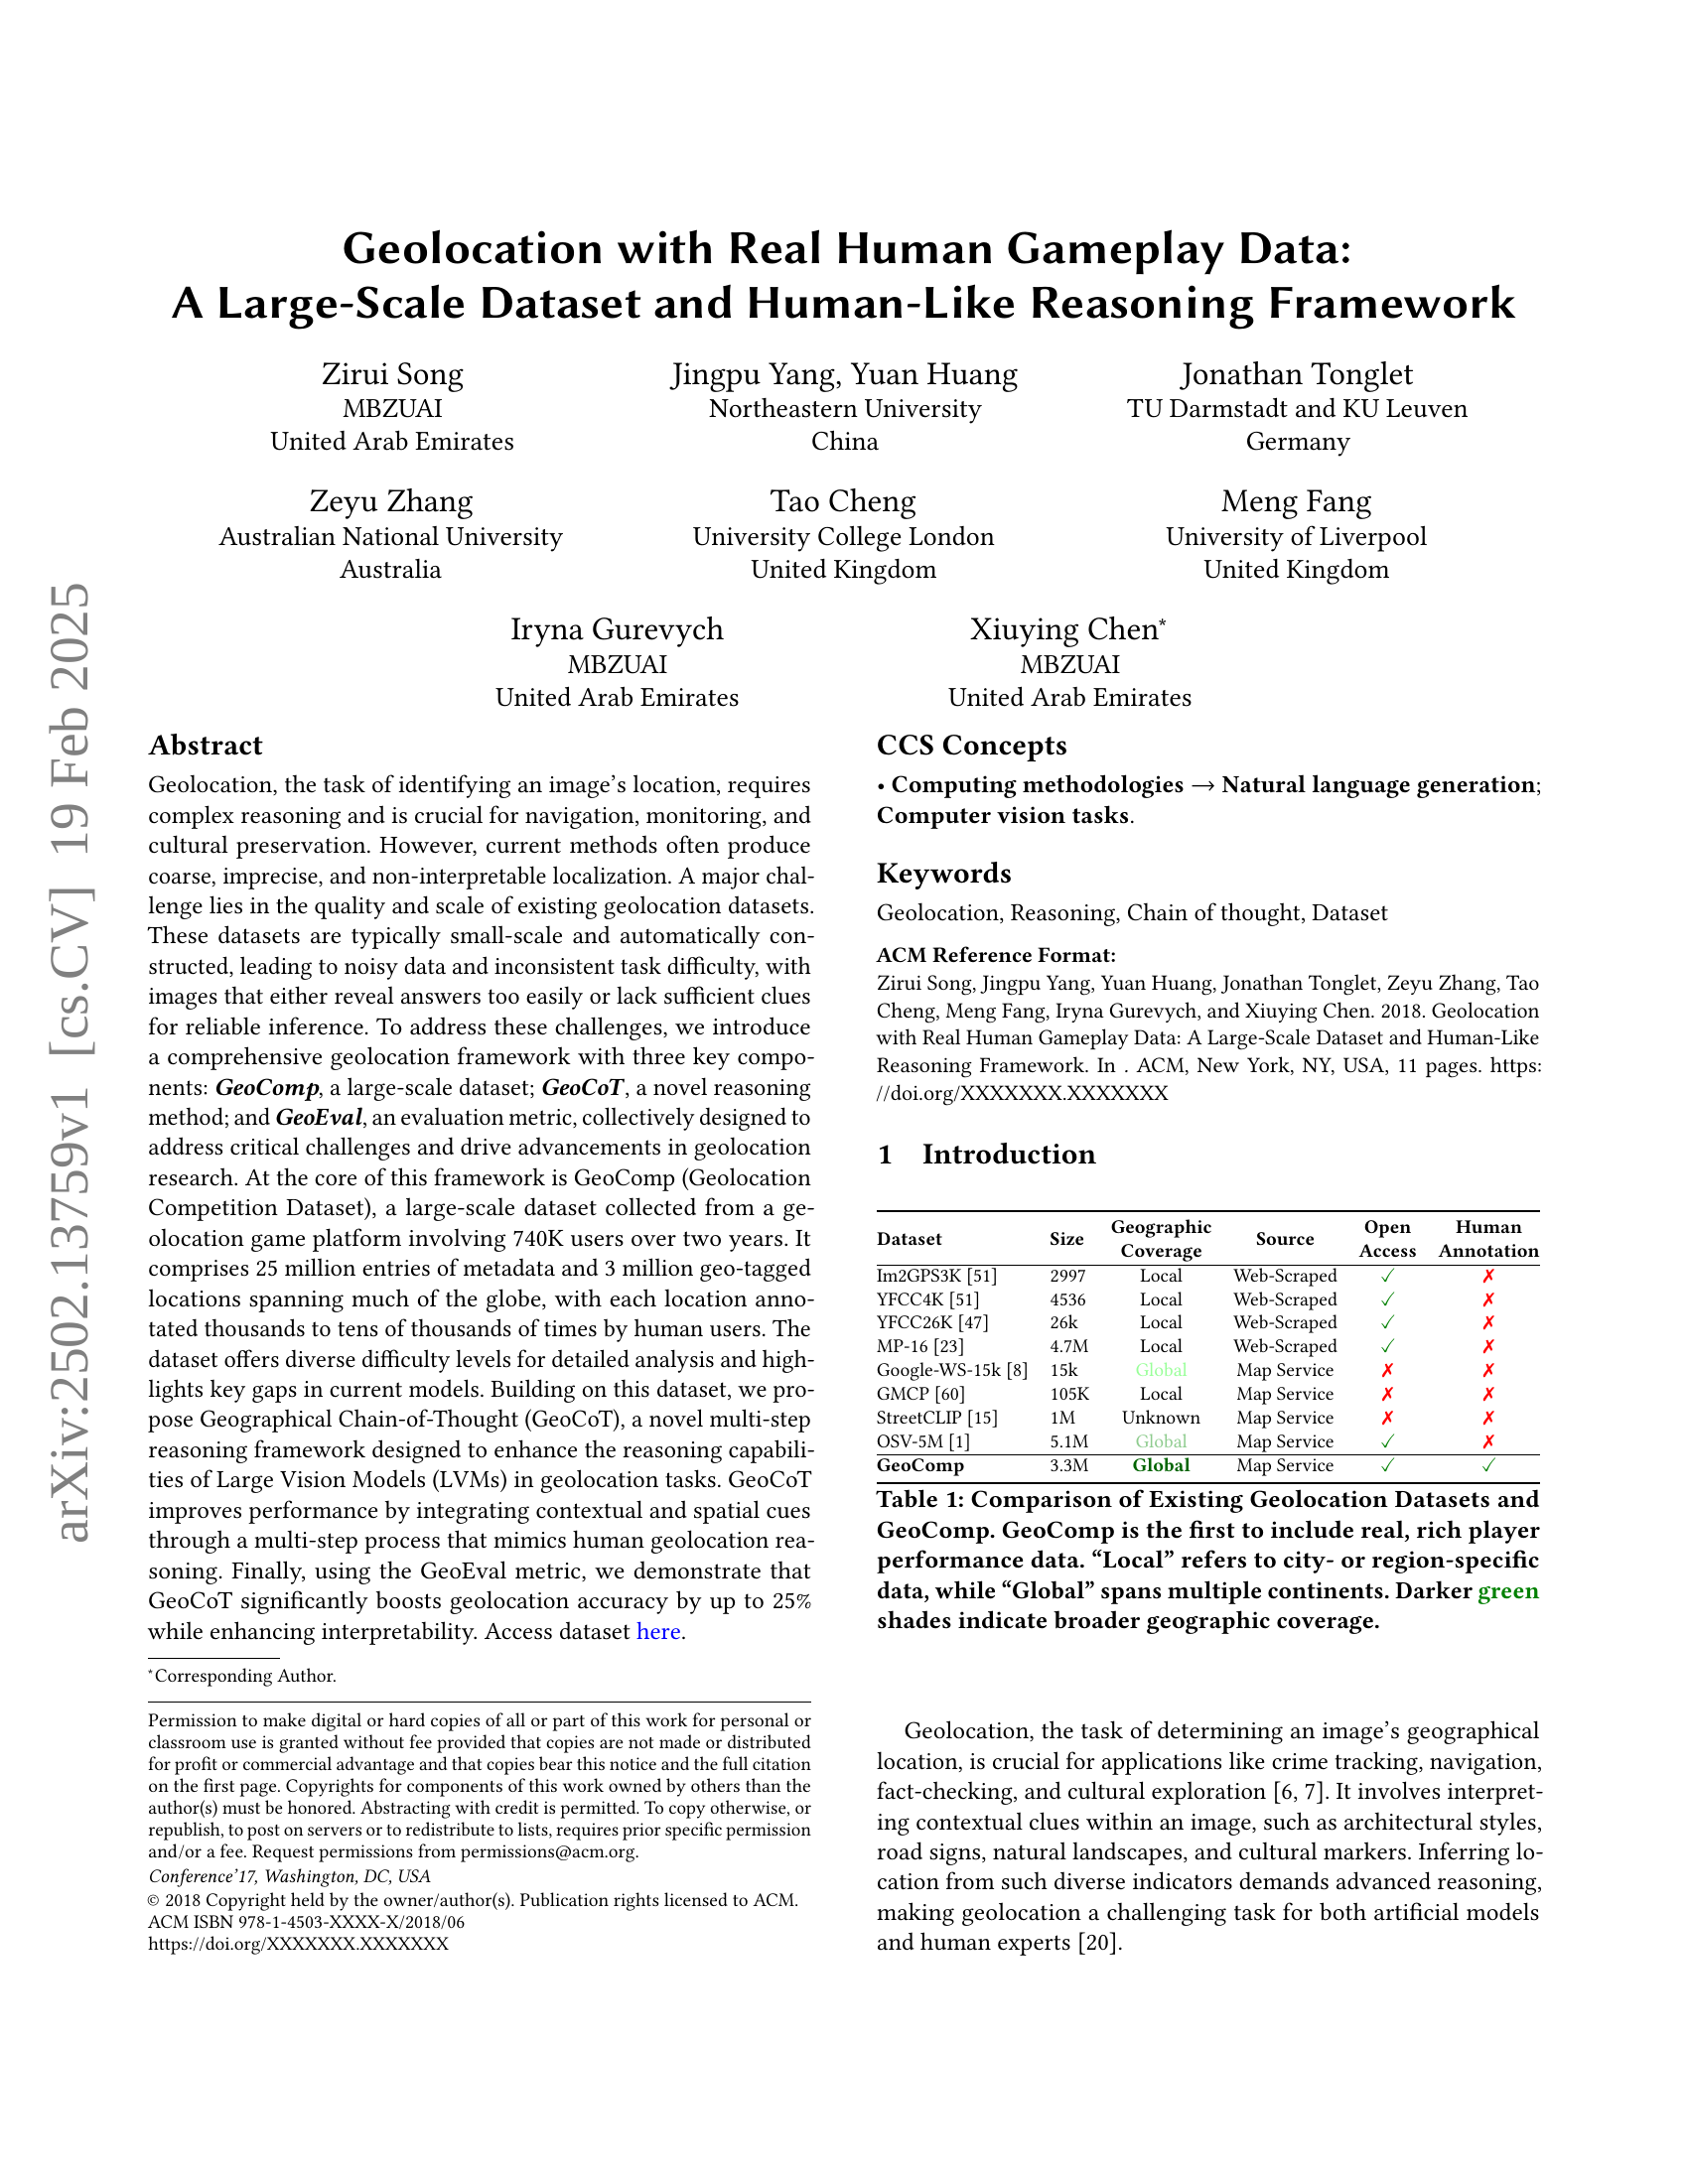
🔼 The figure illustrates the gameplay of a geolocation game. Two players simultaneously view the same image and attempt to guess its location. The game awards points based on the accuracy of each player’s guess, with higher scores given to those who pinpoint the location more precisely. This competitive element motivates users to carefully analyze the image for visual cues such as geographical features, landmarks, architectural styles, signage, and natural elements that can help determine the correct location.
read the caption
Figure 1. The gaming logic of our platform: Two players independently guess the location based on the same image and their own hints, with scores determined by the distance between their predictions and the ground truth location.
| Dataset | Size | Geographic | Source | Open | Human |
|---|---|---|---|---|---|
| Coverage | Access | Annotation | |||
| Im2GPS3K (Vo et al., 2017b) | 2997 | Local | Web-Scraped | ✓ | ✗ |
| YFCC4K (Vo et al., 2017b) | 4536 | Local | Web-Scraped | ✓ | ✗ |
| YFCC26K (Theiner et al., 2022a) | 26k | Local | Web-Scraped | ✓ | ✗ |
| MP-16 (Larson et al., 2017) | 4.7M | Local | Web-Scraped | ✓ | ✗ |
| Google-WS-15k (Clark et al., 2023a) | 15k | Global | Map Service | ✗ | ✗ |
| GMCP (Zamir and Shah, 2014) | 105K | Local | Map Service | ✗ | ✗ |
| StreetCLIP (Haas et al., 2023) | 1M | Unknown | Map Service | ✗ | ✗ |
| OSV-5M (Astruc et al., 2024) | 5.1M | Global | Map Service | ✓ | ✗ |
| GeoComp | 3.3M | Global | Map Service | ✓ | ✓ |
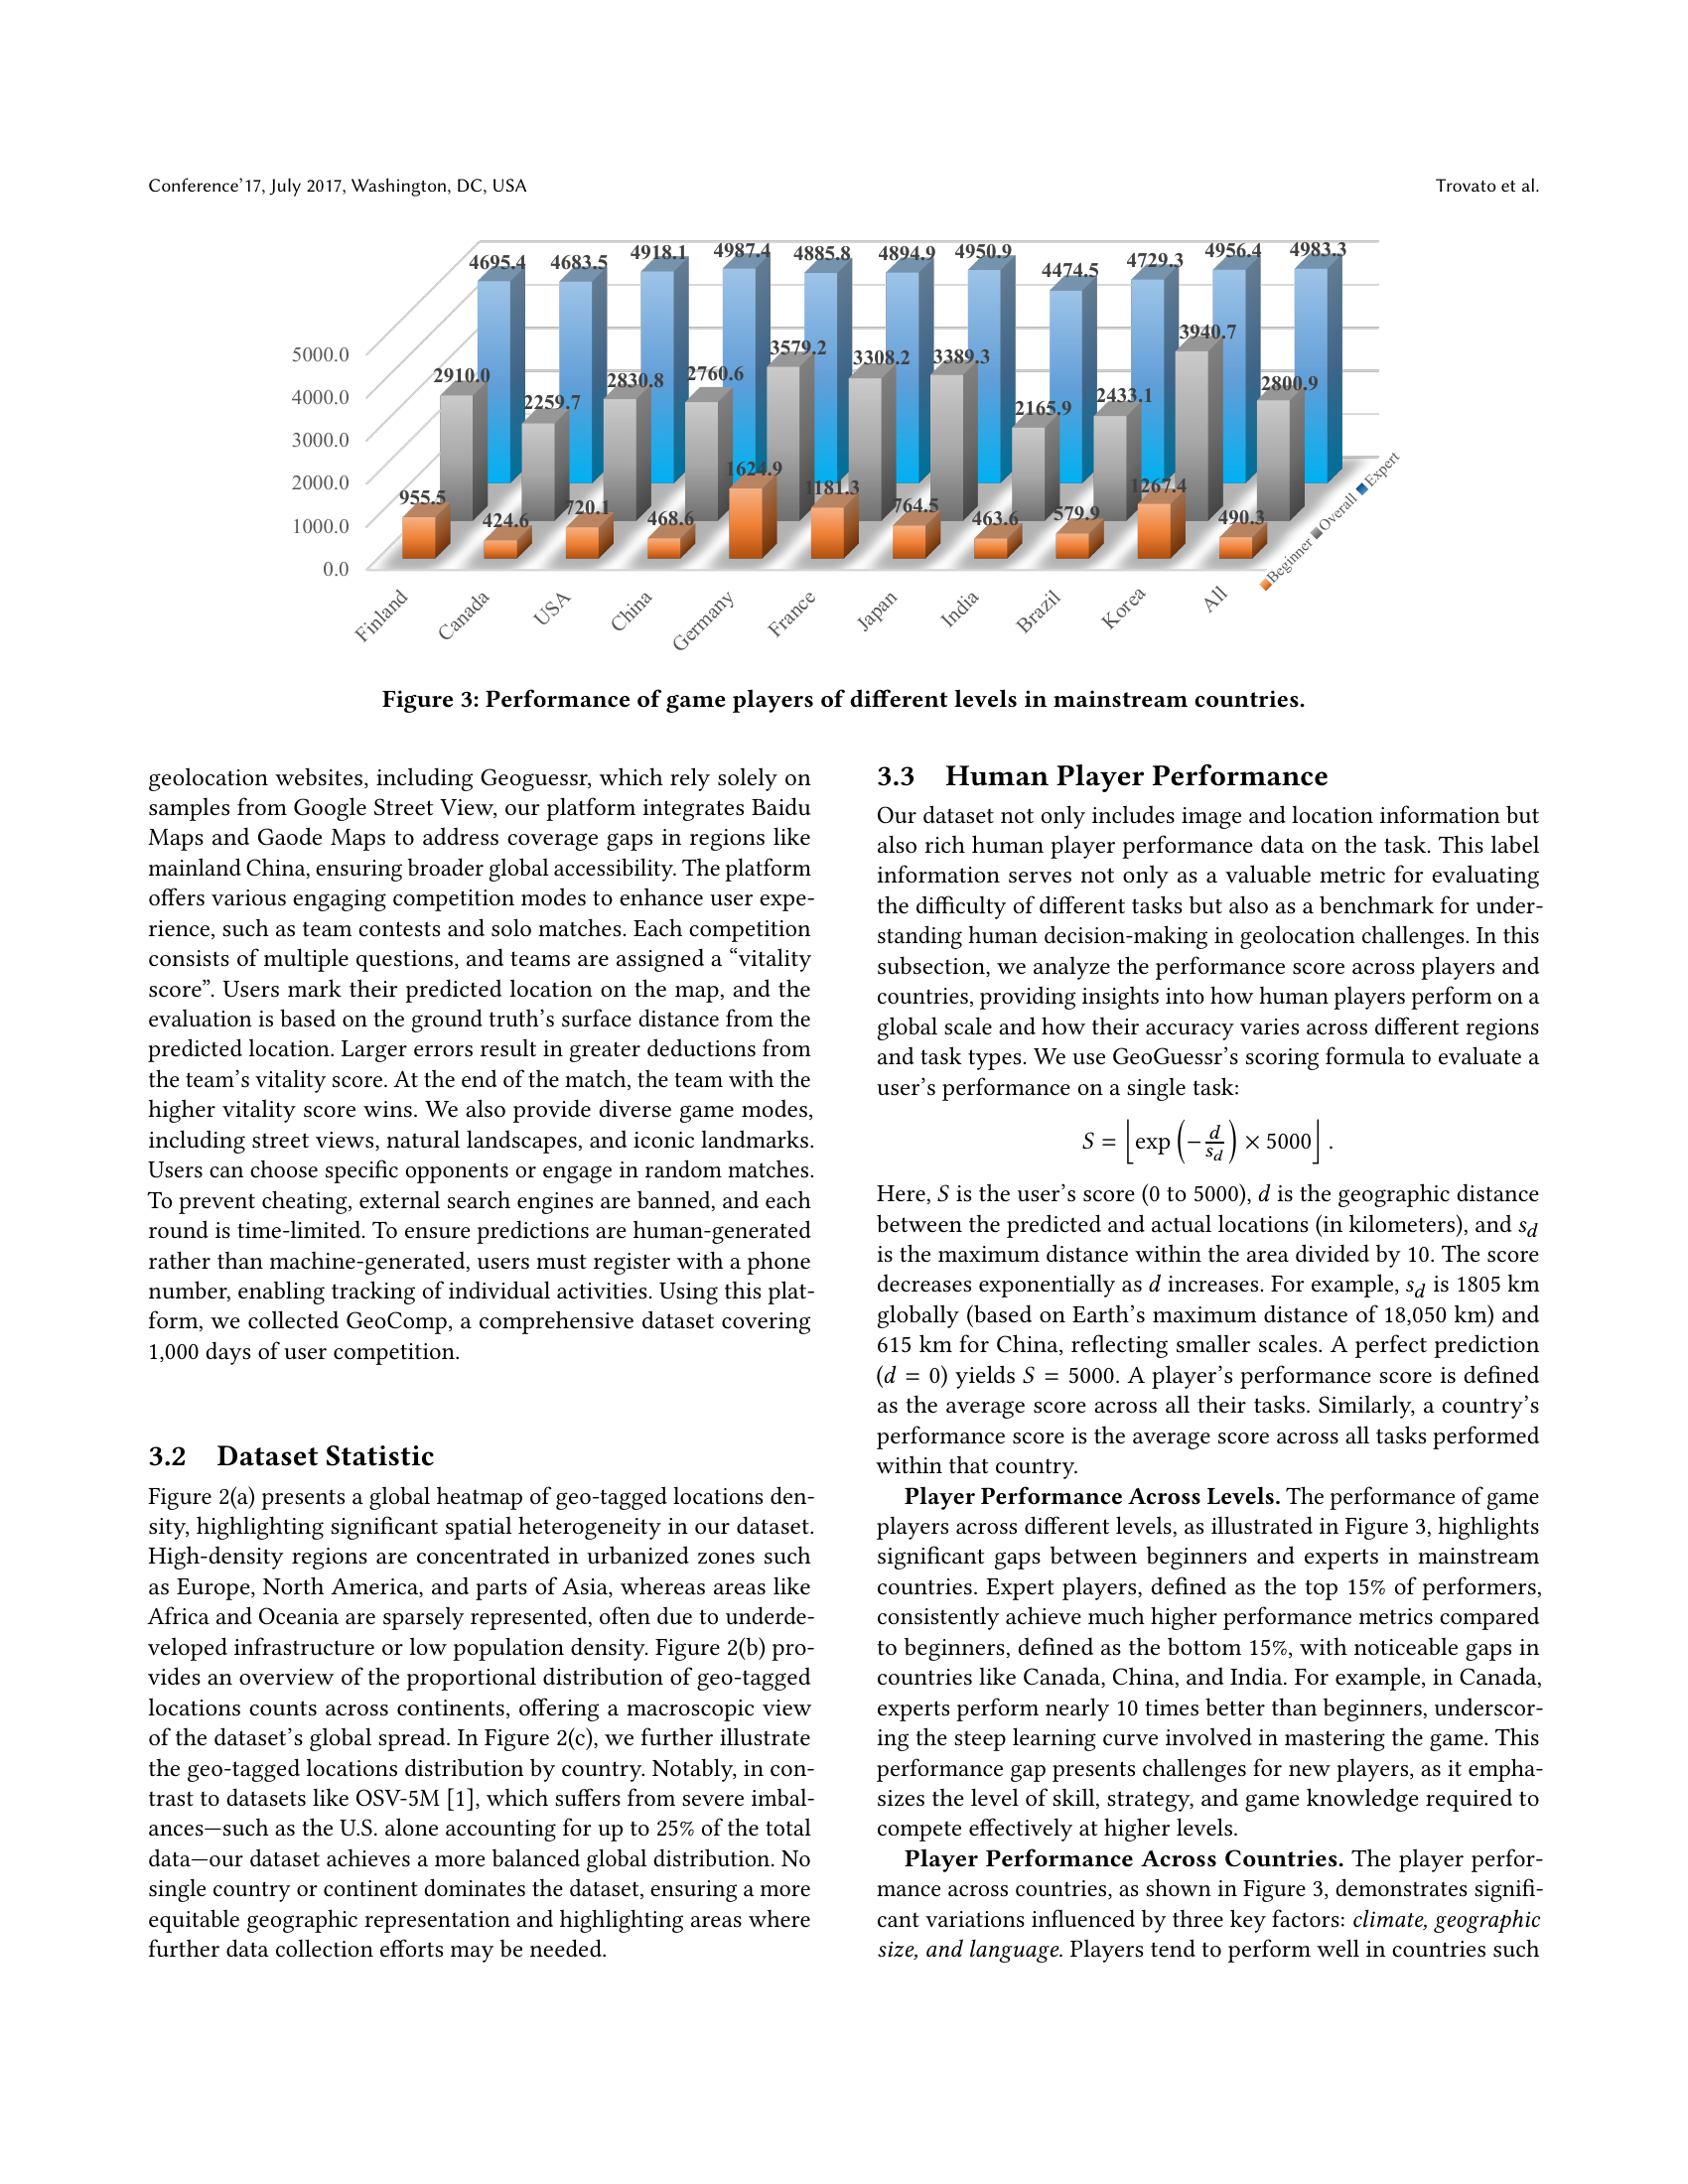
🔼 This table compares GeoComp with other existing geolocation datasets. It highlights key differences in dataset size, geographic coverage (local versus global), data source (web-scraped versus map services), and the availability of open access and human annotations. A key advantage of GeoComp is that it is the first dataset to include real gameplay data from human players, providing rich performance information that other datasets lack. The shading of green cells visually represents the geographic coverage, with darker shades denoting wider geographical representation.
read the caption
Table 1. Comparison of Existing Geolocation Datasets and GeoComp. GeoComp is the first to include real, rich player performance data. “Local” refers to city- or region-specific data, while “Global” spans multiple continents. Darker green shades indicate broader geographic coverage.
In-depth insights#
GeoComp Dataset#
GeoComp is introduced as a large-scale geolocation dataset. It was collected from a geolocation game platform with 740K users over two years, offering 25 million metadata entries and 3 million geotagged locations. The dataset stands out due to its real human gameplay data, providing diverse difficulty levels and highlighting gaps in current models. Unlike existing datasets, GeoComp features rich player performance data, contributing to a more nuanced evaluation of geolocation models. It enables the evaluation of task difficulty and helps in filtering unreasonable cases. The dataset’s spatial distribution is also analyzed, showing dense clusters in urbanized regions and sparse coverage in areas like Africa and Siberia, with a balanced distribution across countries, addressing biases found in other datasets like OSV-5M.
Human Geo Accuracy#
While the provided document does not explicitly contain a section titled ‘Human Geo Accuracy’, several aspects relate to how humans perform geolocation tasks and the dataset’s characteristics. The authors emphasize the creation of a large-scale geolocation dataset (GeoComp) sourced from real human gameplay data. This inherently captures human-level geolocation accuracy, as the dataset is populated with users’ attempts to identify locations from images. The paper analyzes performance scores across different player skill levels and countries, revealing how expertise, geographic knowledge, and cultural awareness influence accuracy. Experts consistently outperform beginners, and performance varies significantly across countries due to language familiarity and climatic similarities. The authors uses the users’ performance data to measure the difficulty and quality of the collected data. These measures shows insights to what factors the game players are relying on for accurate prediction.
GeoCoT Reasoning#
The paper introduces GeoCoT, a novel reasoning framework. GeoCoT emulates human geolocation reasoning, progressing from broad geographic features to granular details, enabling precise localization. It surpasses traditional methods by generating natural language reasoning, guiding the model step-by-step to predict the location more accurately. The framework doesn’t require explicit knowledge about location-specific features; instead, it’s designed to help LVMs identify relevant geographic cues leveraging existing knowledge. GeoCoT’s design is inspired by human’s way to analyze and narrow down locations through a step-by-step reasoning process. It also avoids coarse classification and exhaustive image databases, providing a scalable, interpretable, and accurate location prediction.
Multi-Level Eval#
Multi-Level Evaluation is crucial for comprehensively assessing geolocation models. It moves beyond simple accuracy, examining performance across different granularities (city, country, continent) to reveal specific strengths and weaknesses. This approach allows for a nuanced understanding of how well a model generalizes and adapts to varying levels of detail. Models might excel at continent-level predictions but struggle with pinpointing precise locations within a city, highlighting the importance of multi-faceted assessment. The evaluation considers varying geographic scales (street, city, country) to simulate real-world scenarios where different levels of precision are required. Furthermore, evaluating models on both existing benchmarks and novel datasets ensures robustness and prevents overfitting to specific training data. Finally, this approach could incorporate metrics that measure the uncertainty or confidence levels associated with predictions, offering valuable insights into the reliability of the model’s output.
Generalizable LVM#
While the document focuses on geolocation using Large Vision Models (LVMs), the concept of a “Generalizable LVM” isn’t explicitly discussed. However, we can infer its relevance. A generalizable LVM in this context would be one capable of accurately geolocating images across diverse environments, datasets, and conditions. It would avoid overfitting to specific training data, a common pitfall highlighted in the paper where models like GeoCLIP, while performing well on traditional benchmarks, falter on the author’s new dataset and finer-grained location tasks. The core of generalizability hinges on robust feature extraction and reasoning capabilities, allowing the LVM to interpret varied visual cues regardless of geographical context. Techniques like data augmentation, multi-modal training (incorporating text and other data), and architectural choices promoting invariant feature learning would be critical for building such a model. Furthermore, the success of GeoCoT, which guides the LVM through a step-by-step reasoning process, suggests that imparting structured reasoning abilities is key to enhancing the generalizability of LVMs in geolocation.
More visual insights#
More on figures

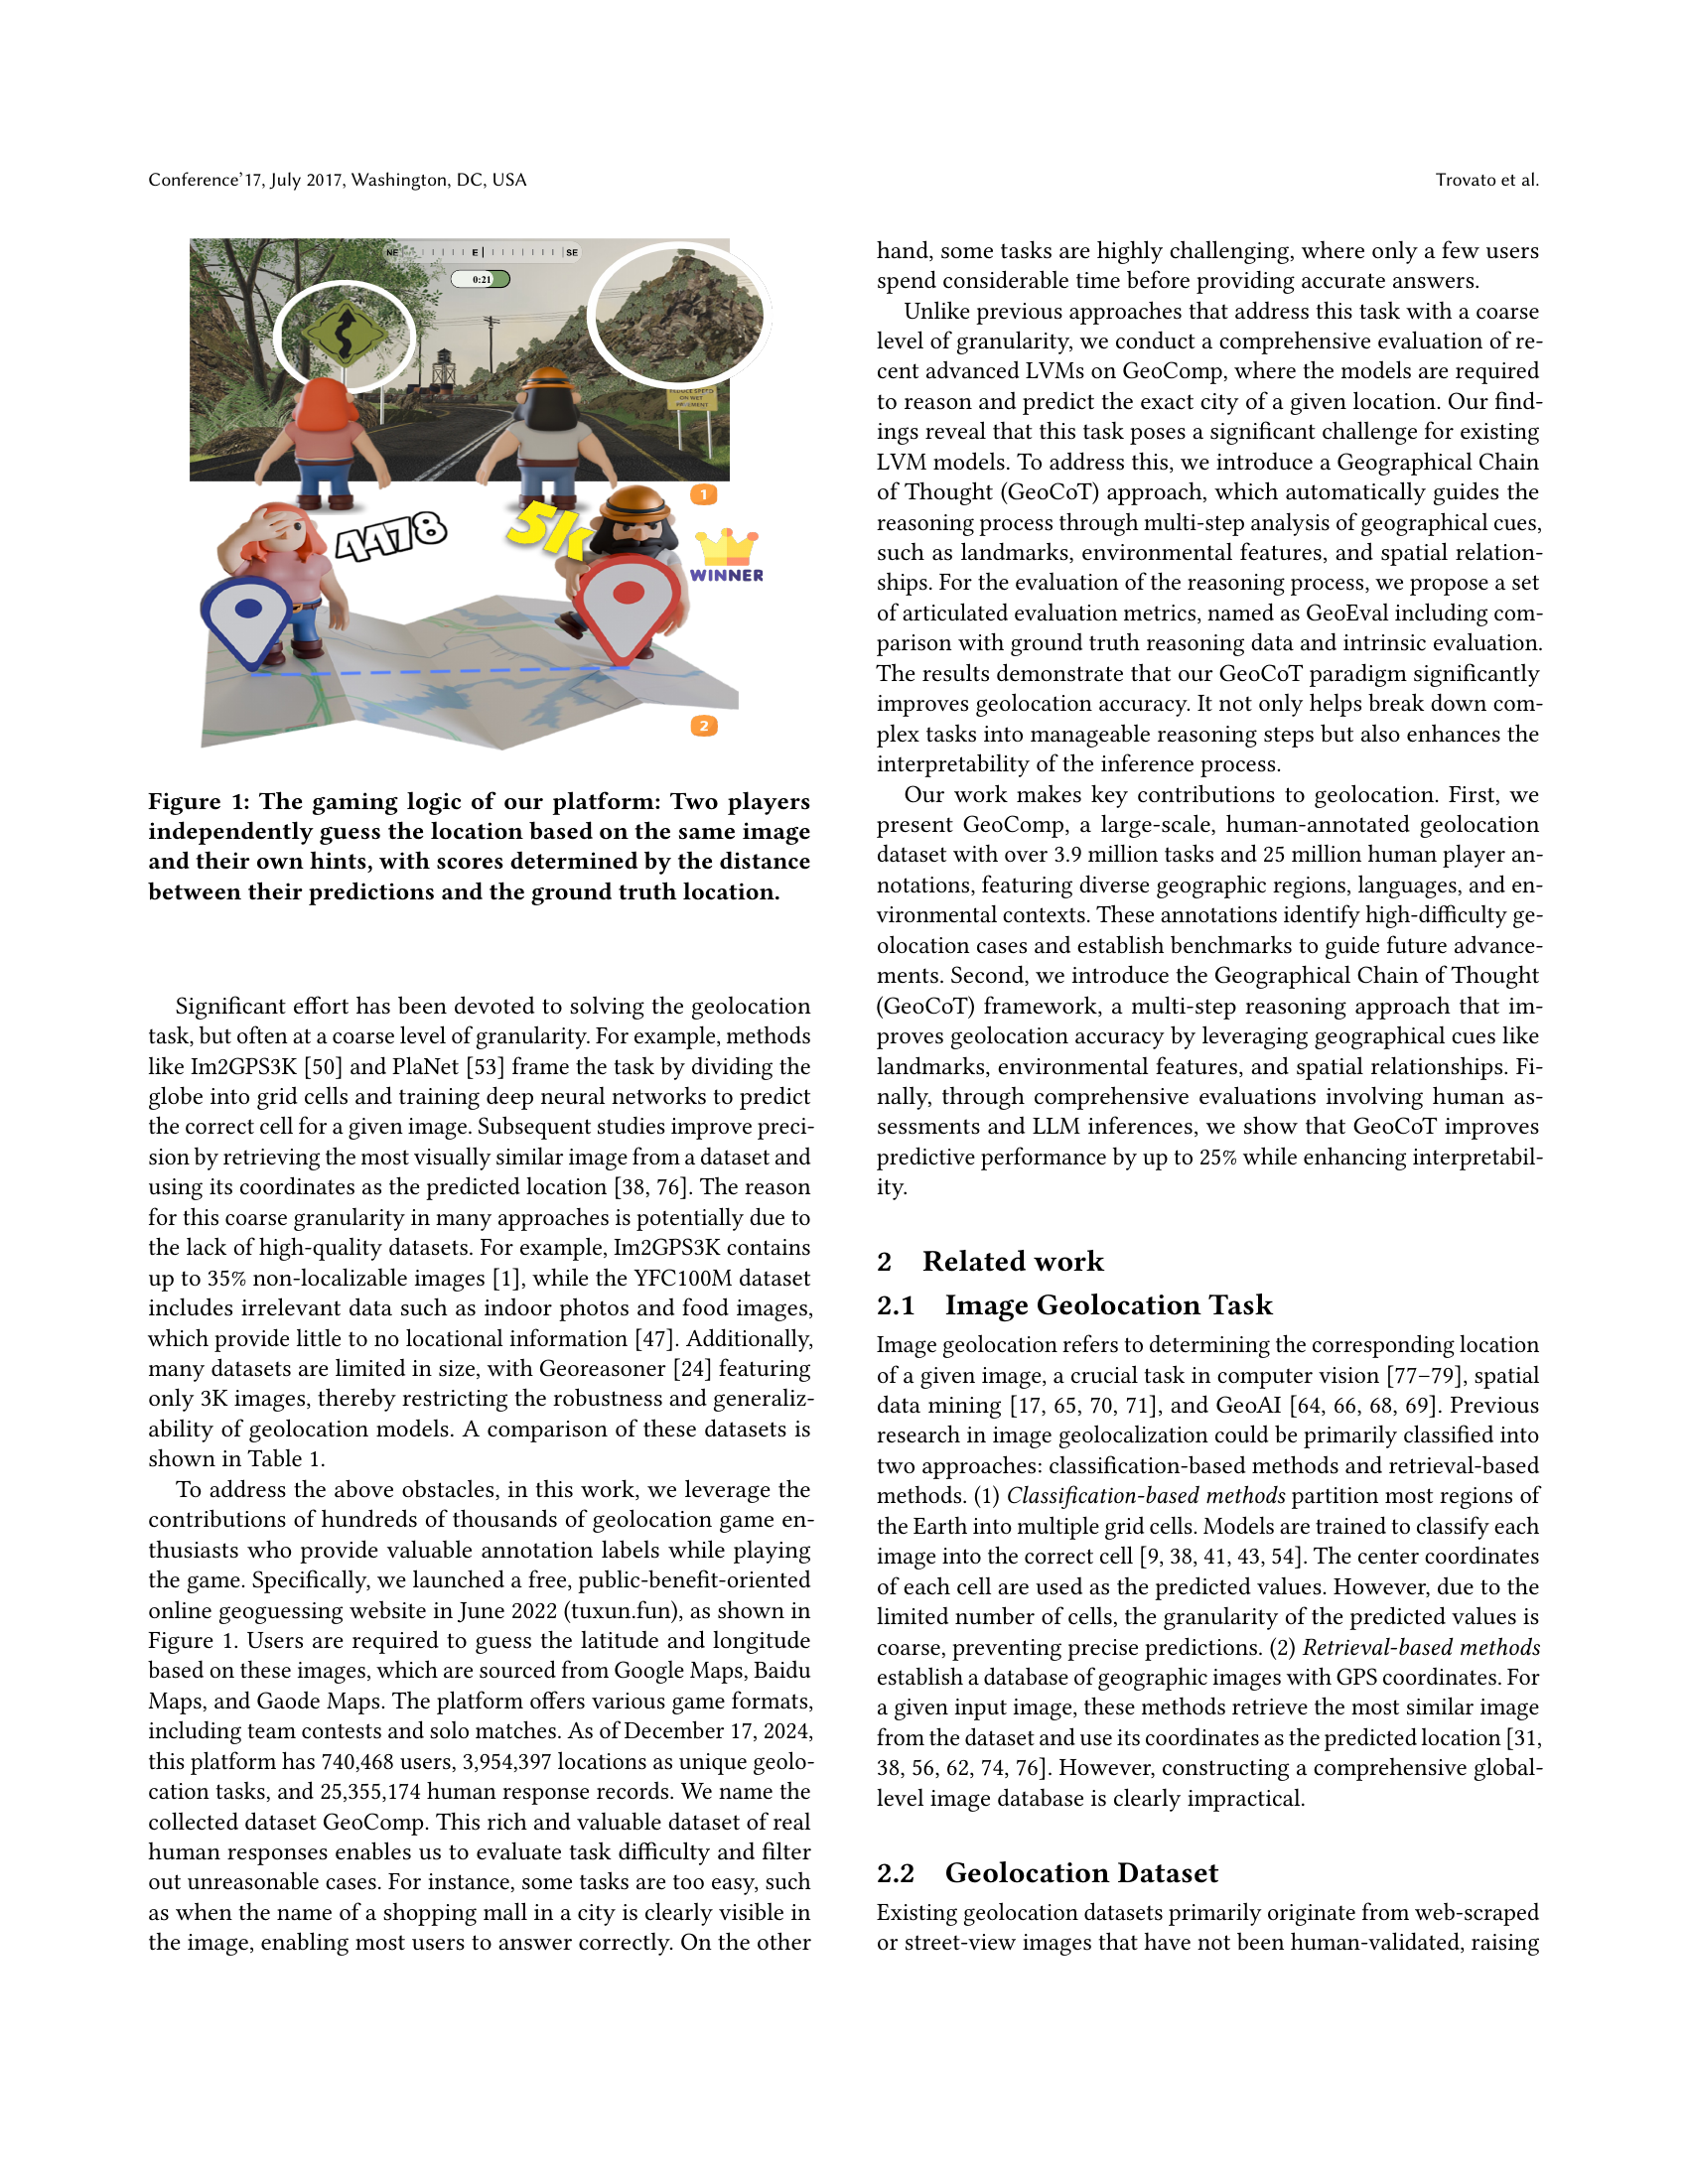
🔼 Figure 2 illustrates the spatial distribution of 3,238,919 geo-tagged locations within the GeoComp dataset. Panel (a) presents a world map visualizing the density of these locations, revealing a clear spatial heterogeneity. Dense clusters are observed in highly urbanized regions of Europe and Asia, while significantly sparser coverage is noted in areas such as Africa and Siberia. Panel (b) provides a pie chart showing the proportional distribution of geo-tagged locations across continents, with North America and Asia exhibiting the highest proportions. Finally, panel (c) uses a bar chart to compare the dataset’s country-level distribution with that of a previous dataset (OSV-5M). This comparison highlights a key difference: OSV-5M is heavily skewed, with a single country accounting for 25% of its data, whereas GeoComp demonstrates a more balanced representation across countries.
read the caption
Figure 2. Spatial distribution of 3,238,919 geo-tagged locations in GeoComp: (a) The global map shows spatial heterogeneity, with dense clusters in more urbanized regions like Europe and Asia, and sparse coverage in areas like Africa and Siberia. (b) The pie chart highlights the proportional geo-tagged locations distribution, led by North America and Asia. (c) Unlike previous datasets like OSV-5M, where a single country (e.g., America) dominates 25% of the data, our dataset is balanced at country level.

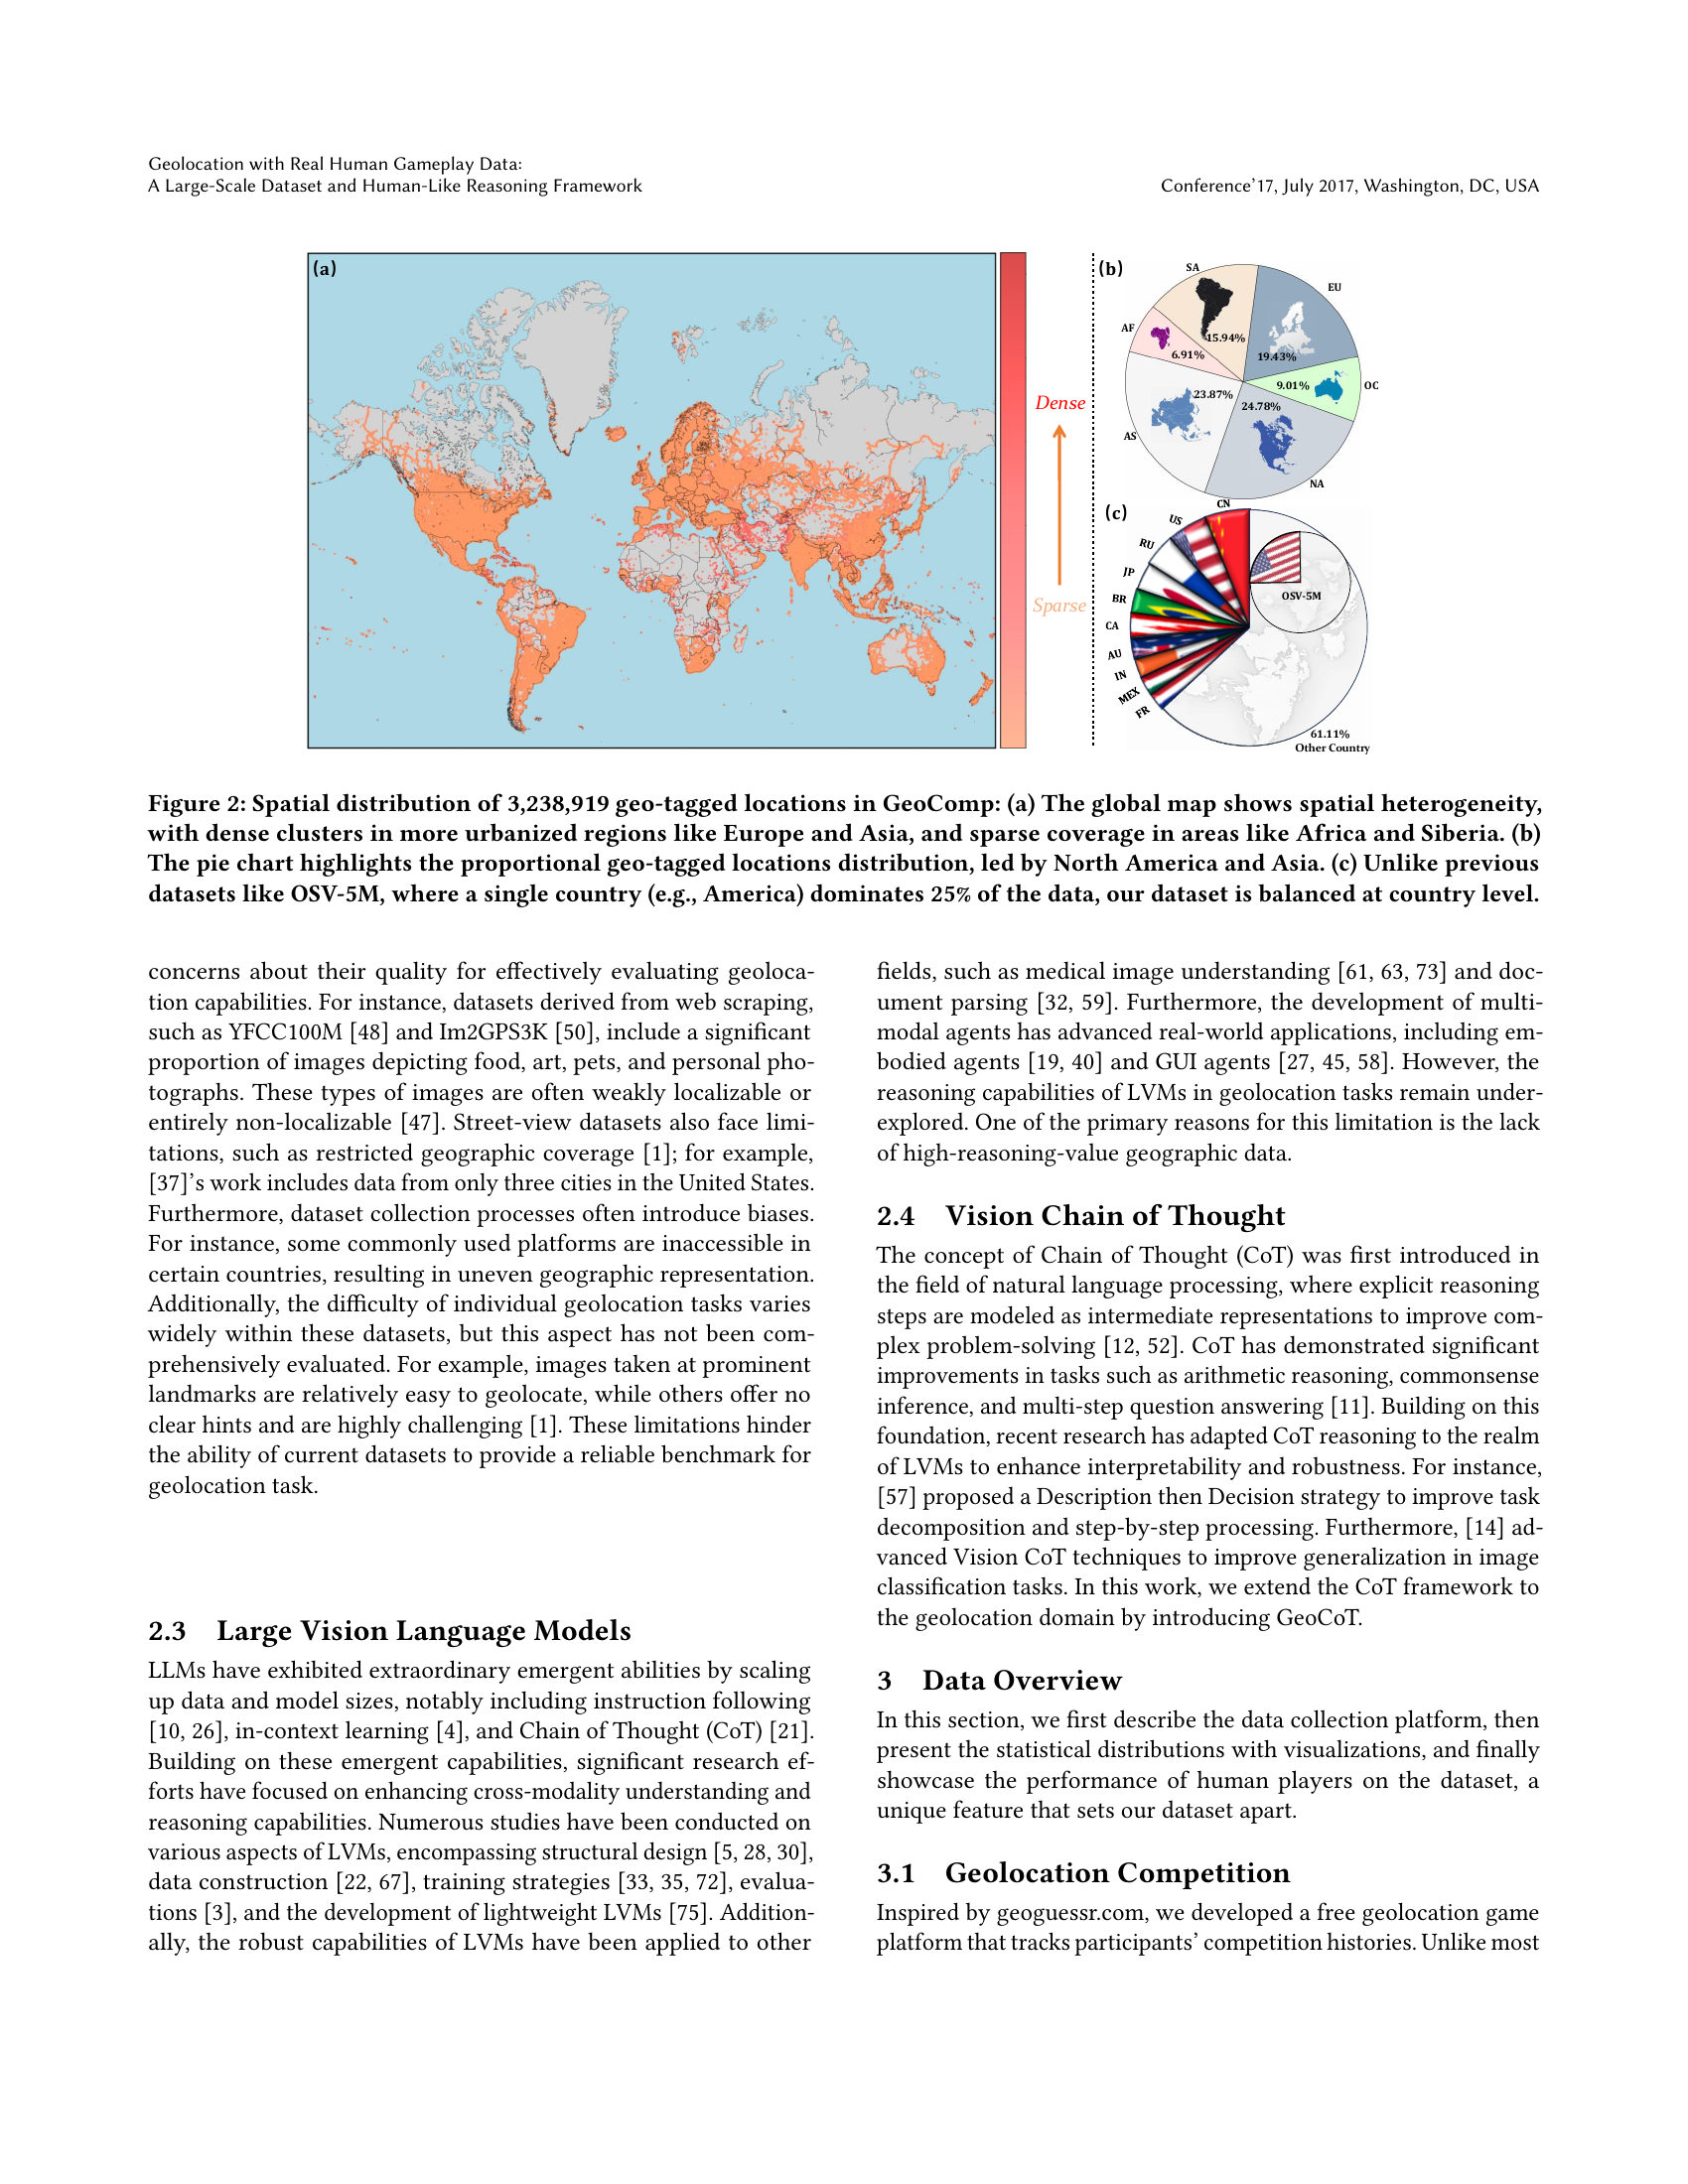
🔼 This bar chart displays the average performance scores of game players categorized by skill level (Beginner, Overall, Expert) across various mainstream countries. The scores reflect the accuracy of players in identifying locations within a geolocation game. Higher scores indicate better accuracy. The chart highlights the performance disparity between beginner and expert players, and also showcases variations in performance across different countries, potentially due to factors such as geographic familiarity, language, and cultural knowledge.
read the caption
Figure 3. Performance of game players of different levels in mainstream countries.

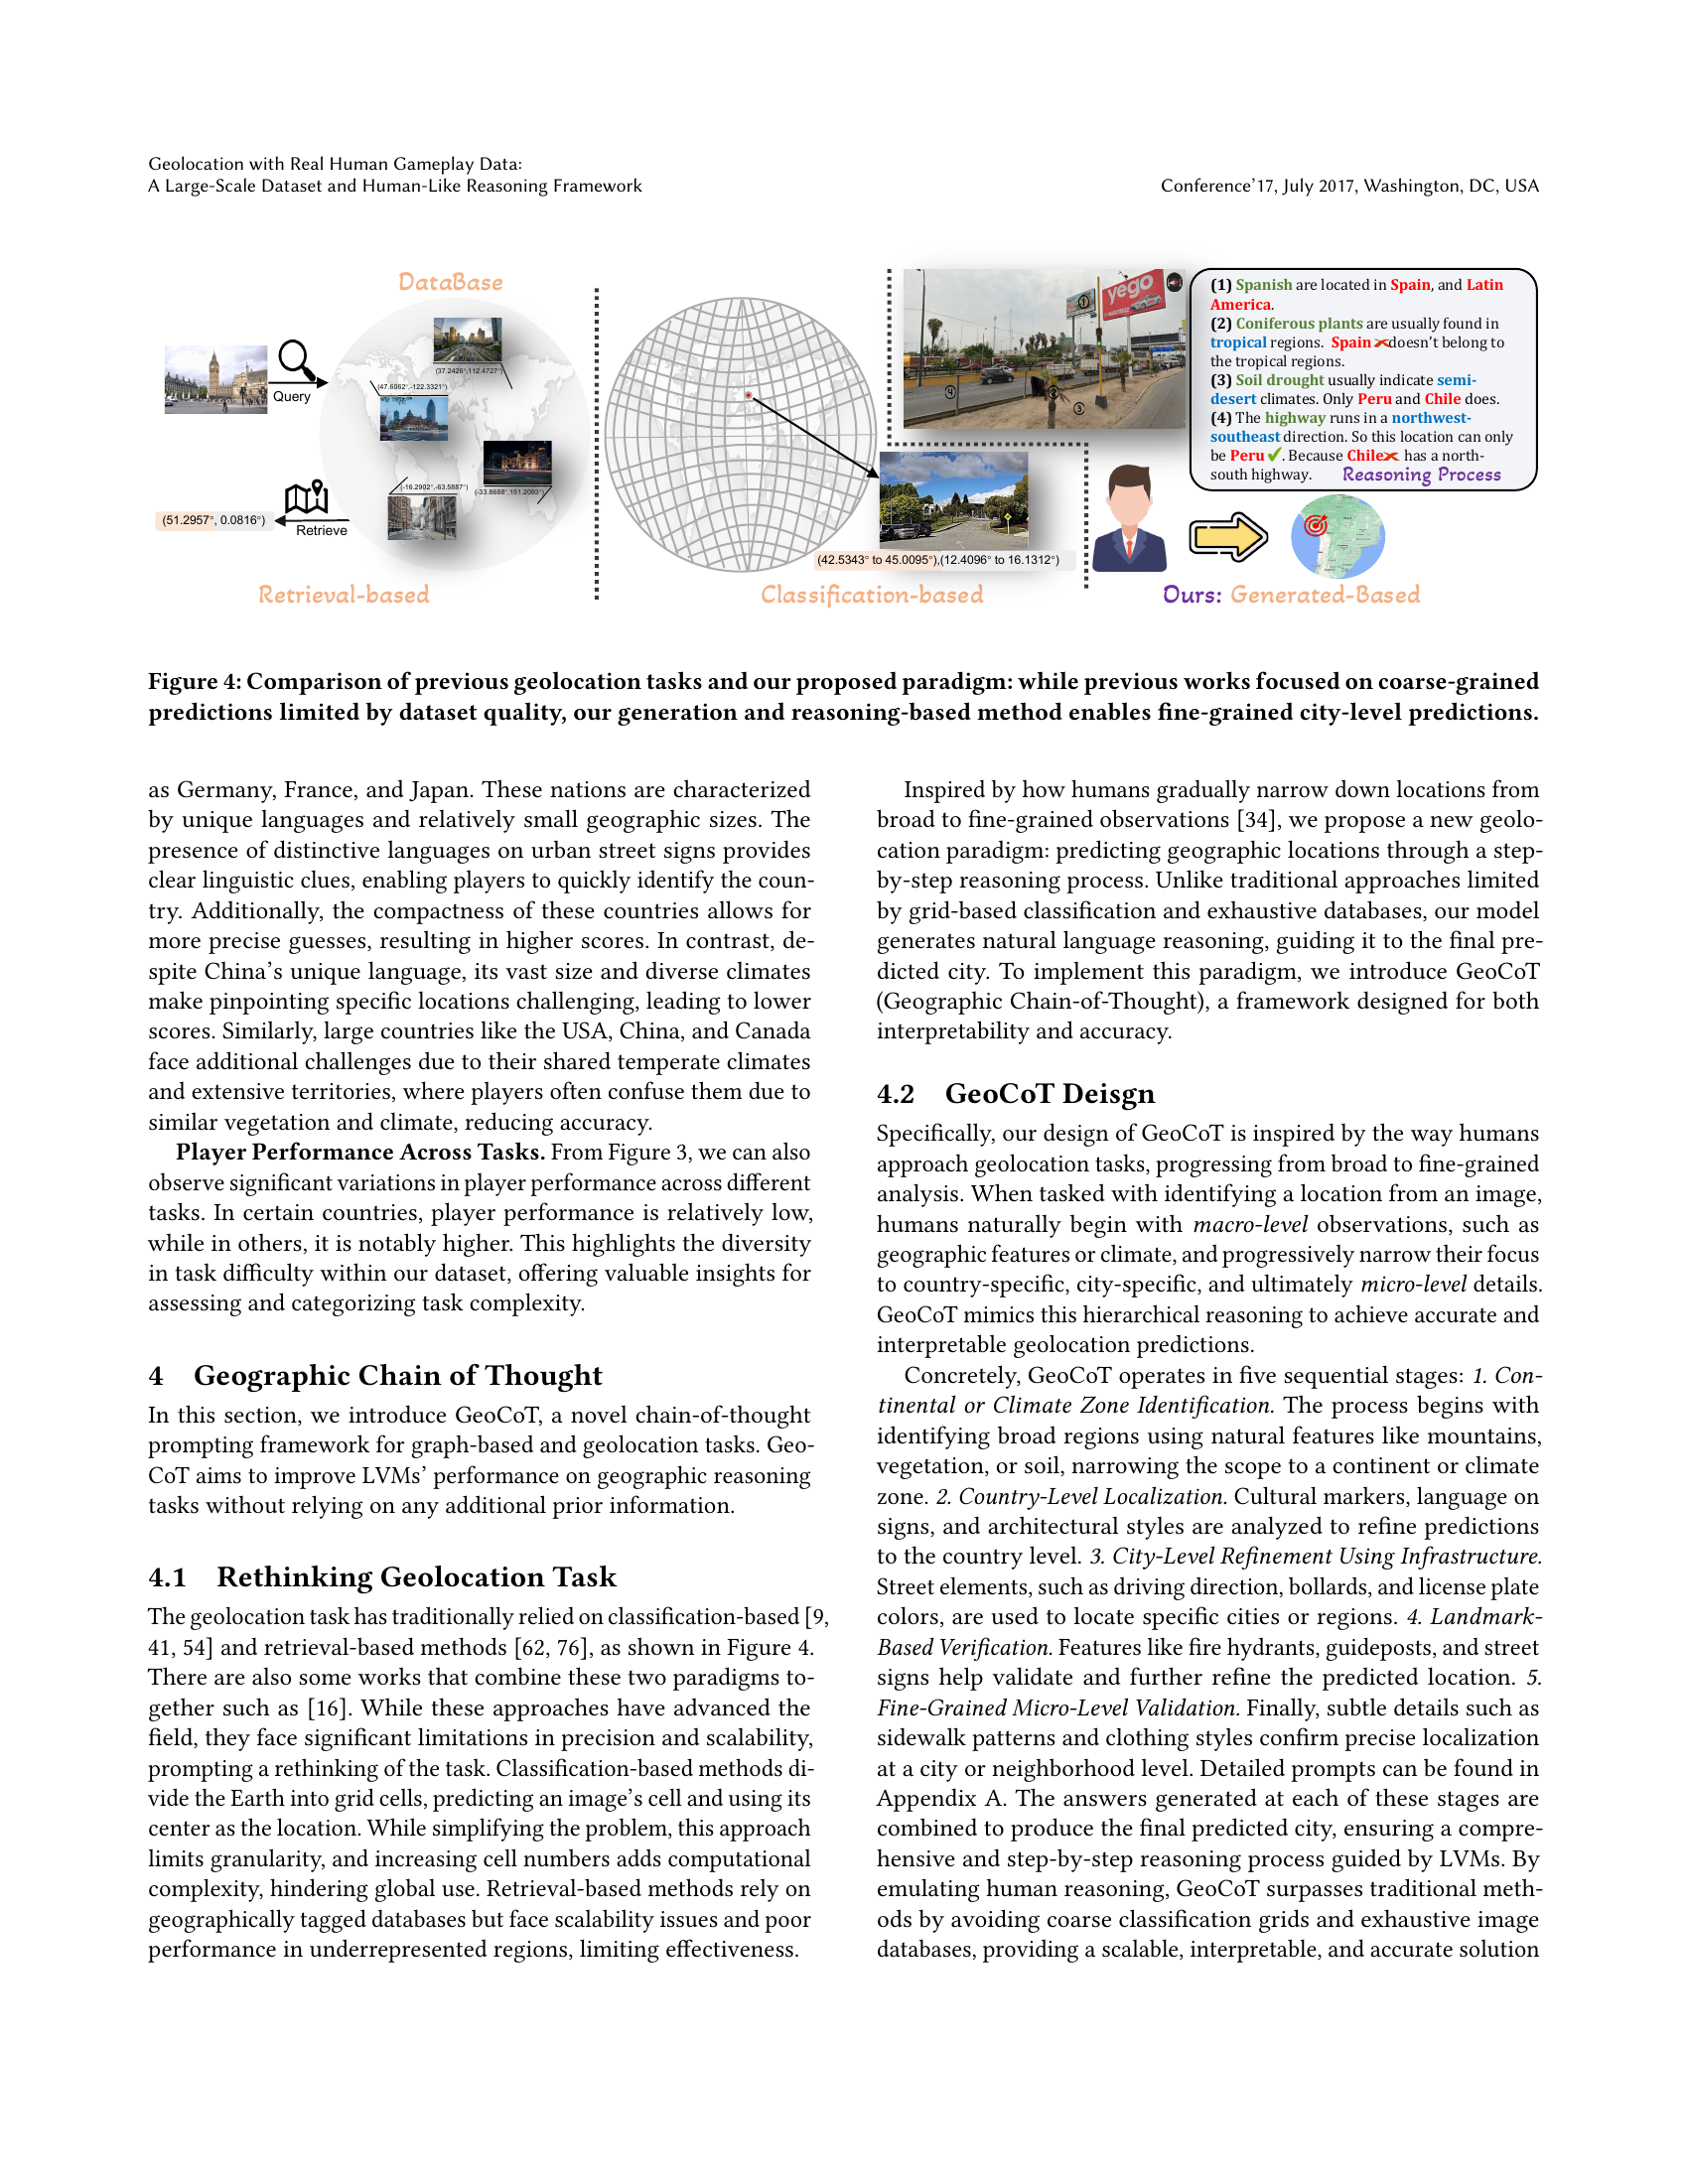
🔼 The figure illustrates the difference between traditional geolocation methods and the novel approach proposed in the paper. Traditional methods, such as retrieval-based and classification-based approaches, are limited by the quality and scale of existing datasets, resulting in coarse-grained predictions. In contrast, the authors’ generation and reasoning-based method leverages a new large-scale dataset and a chain-of-thought reasoning framework to achieve fine-grained, city-level predictions. The diagram visually compares these approaches, highlighting the limitations of older techniques and the advantages of the novel method.
read the caption
Figure 4. Comparison of previous geolocation tasks and our proposed paradigm: while previous works focused on coarse-grained predictions limited by dataset quality, our generation and reasoning-based method enables fine-grained city-level predictions.

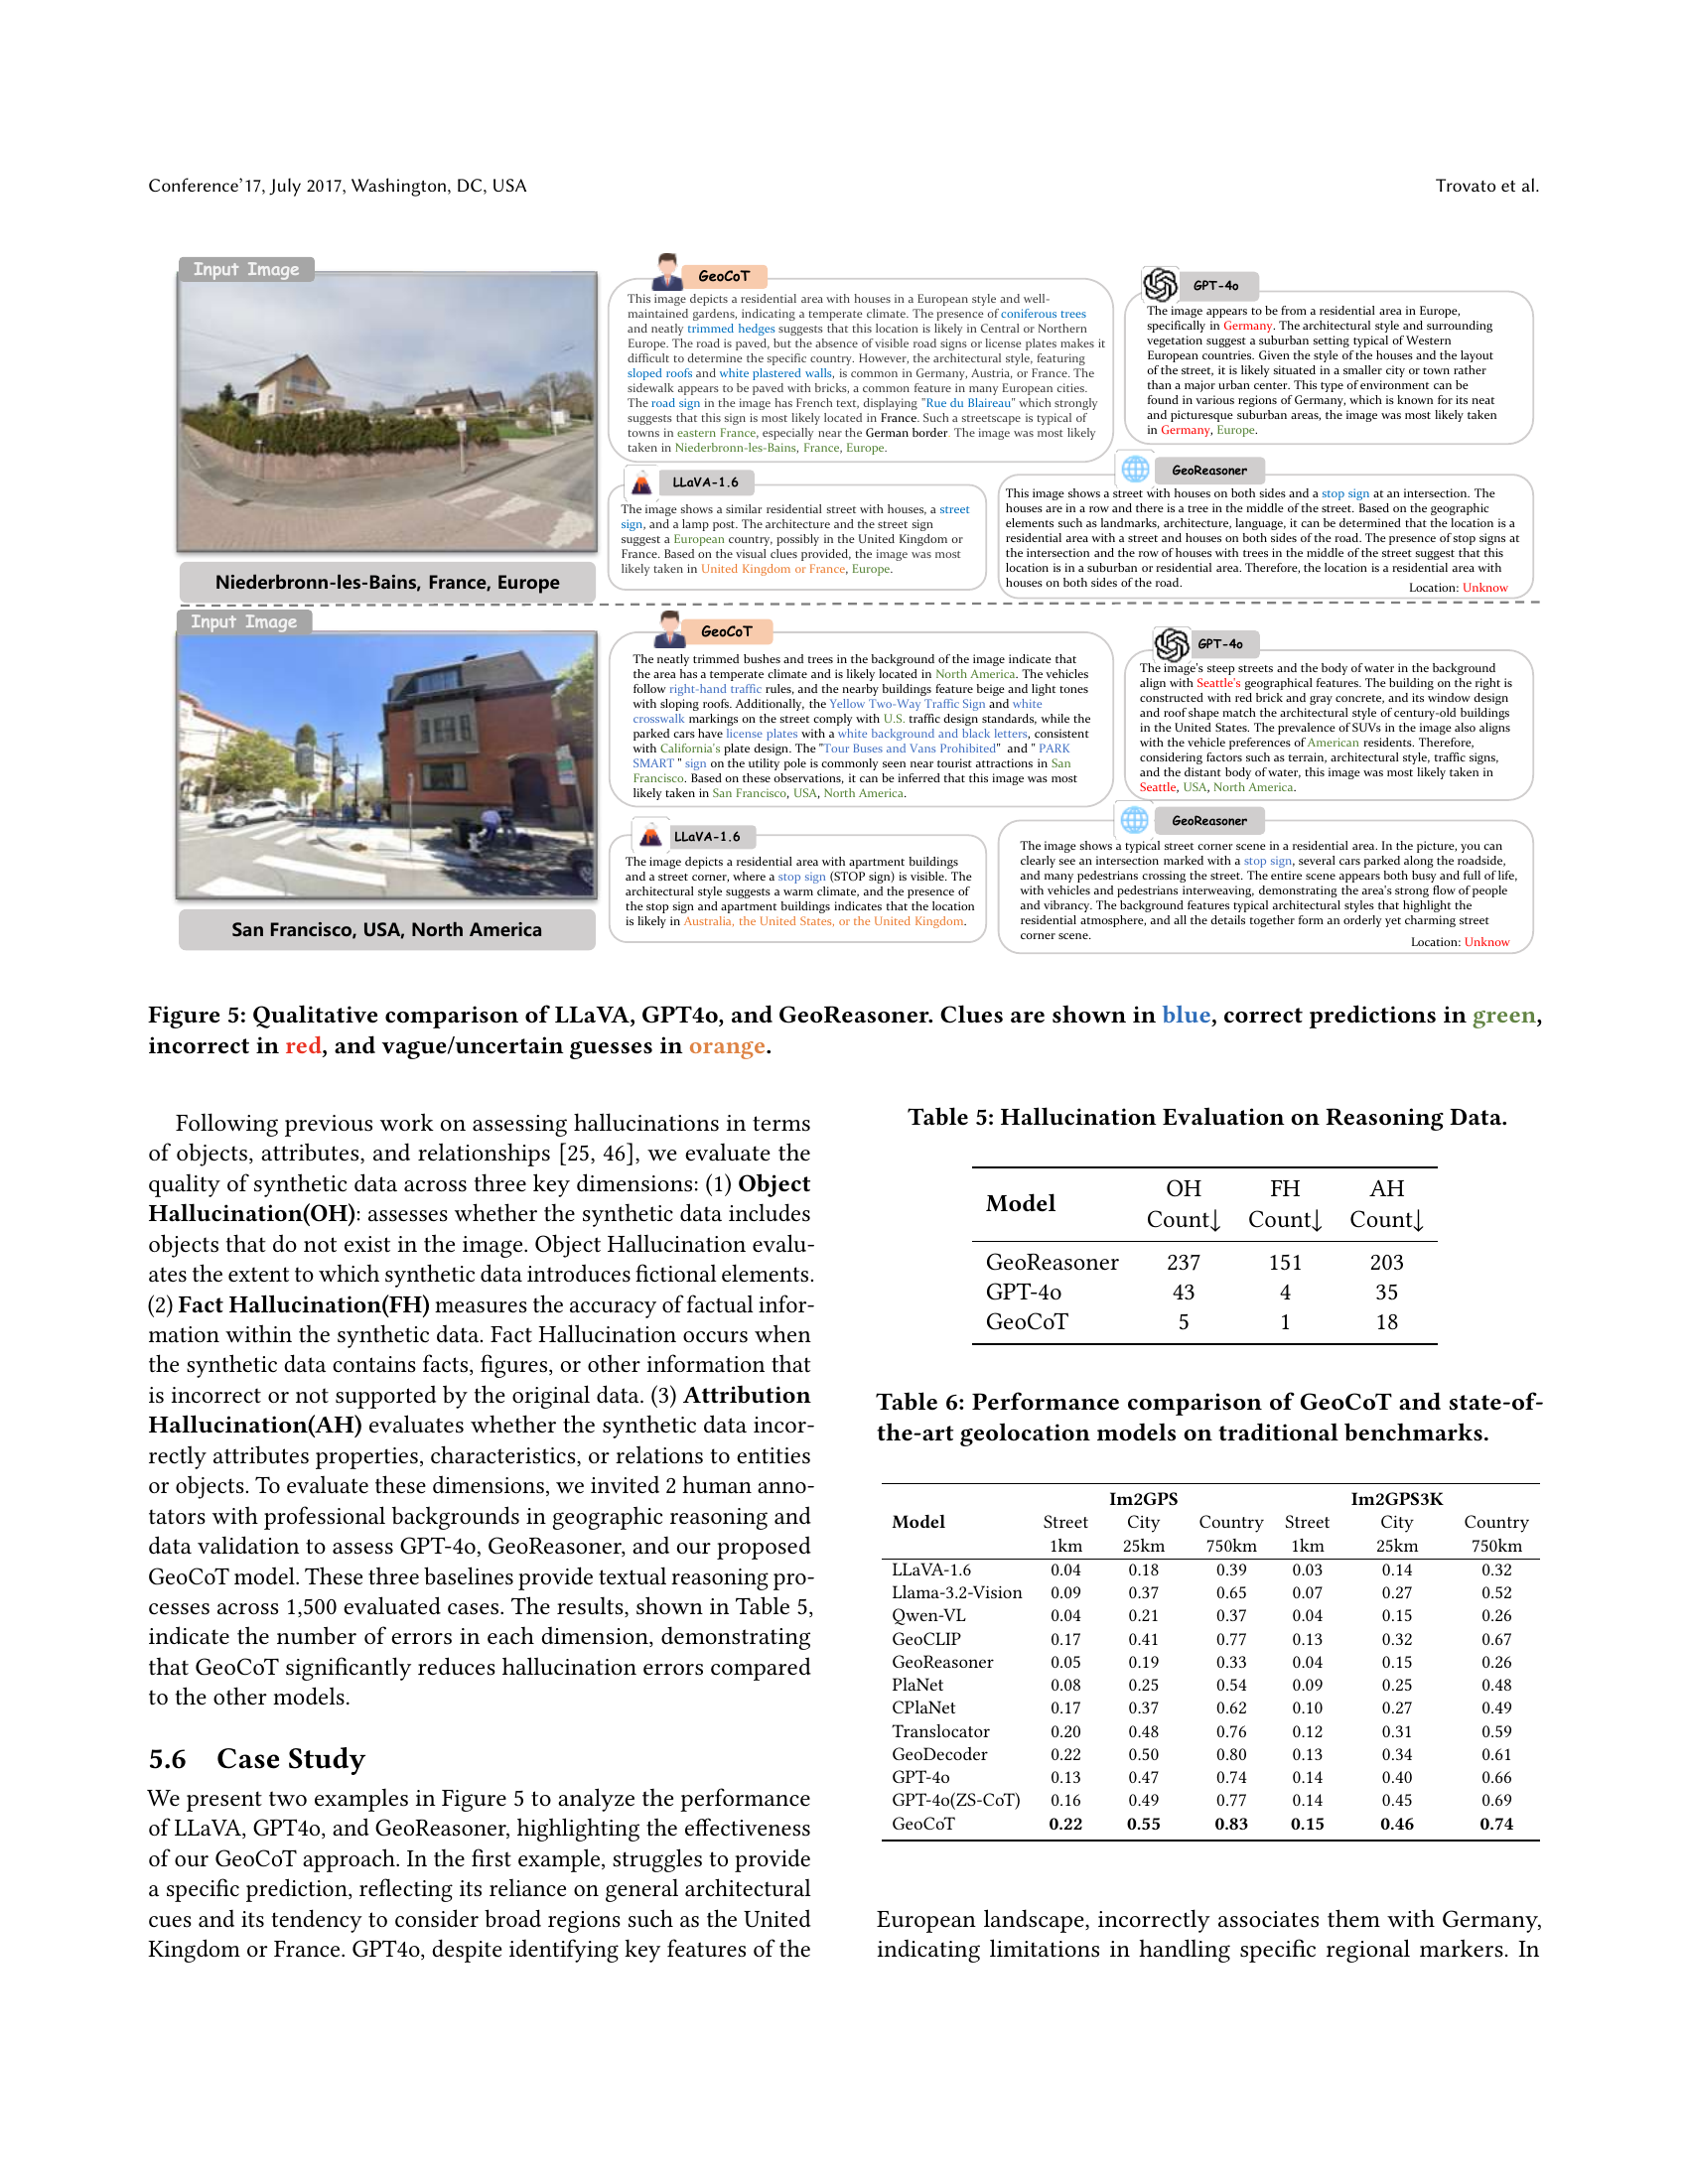
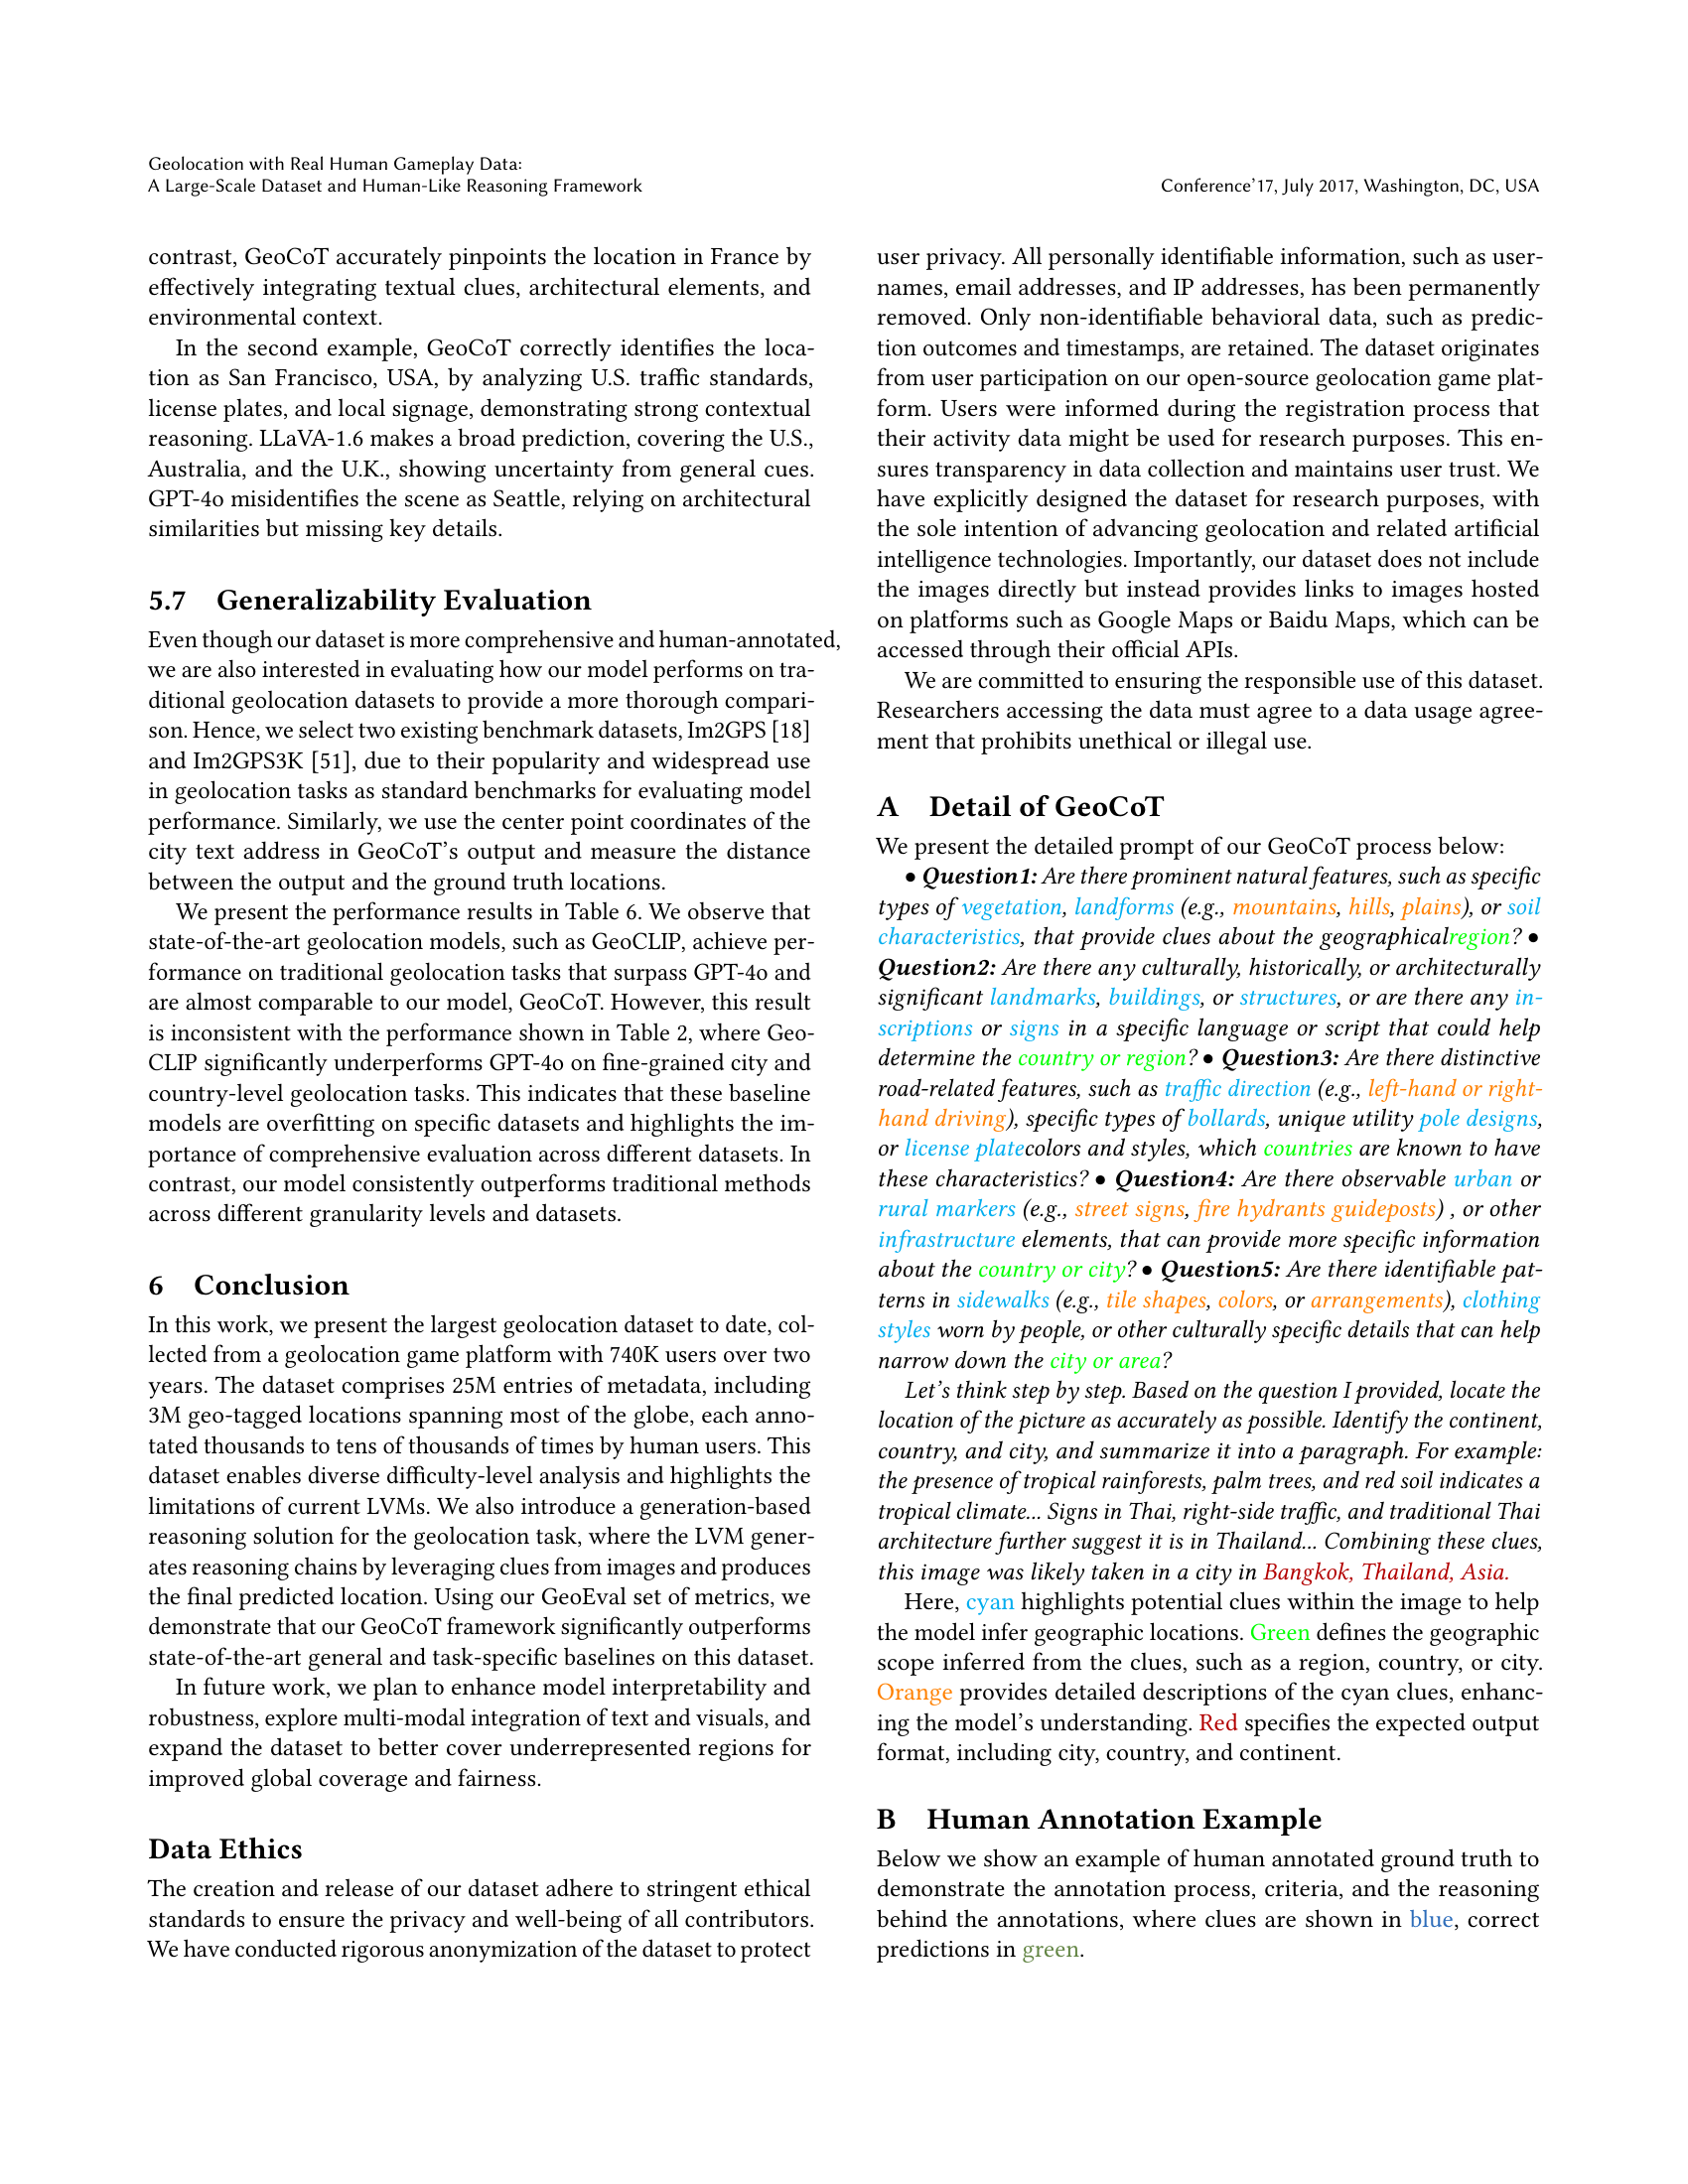
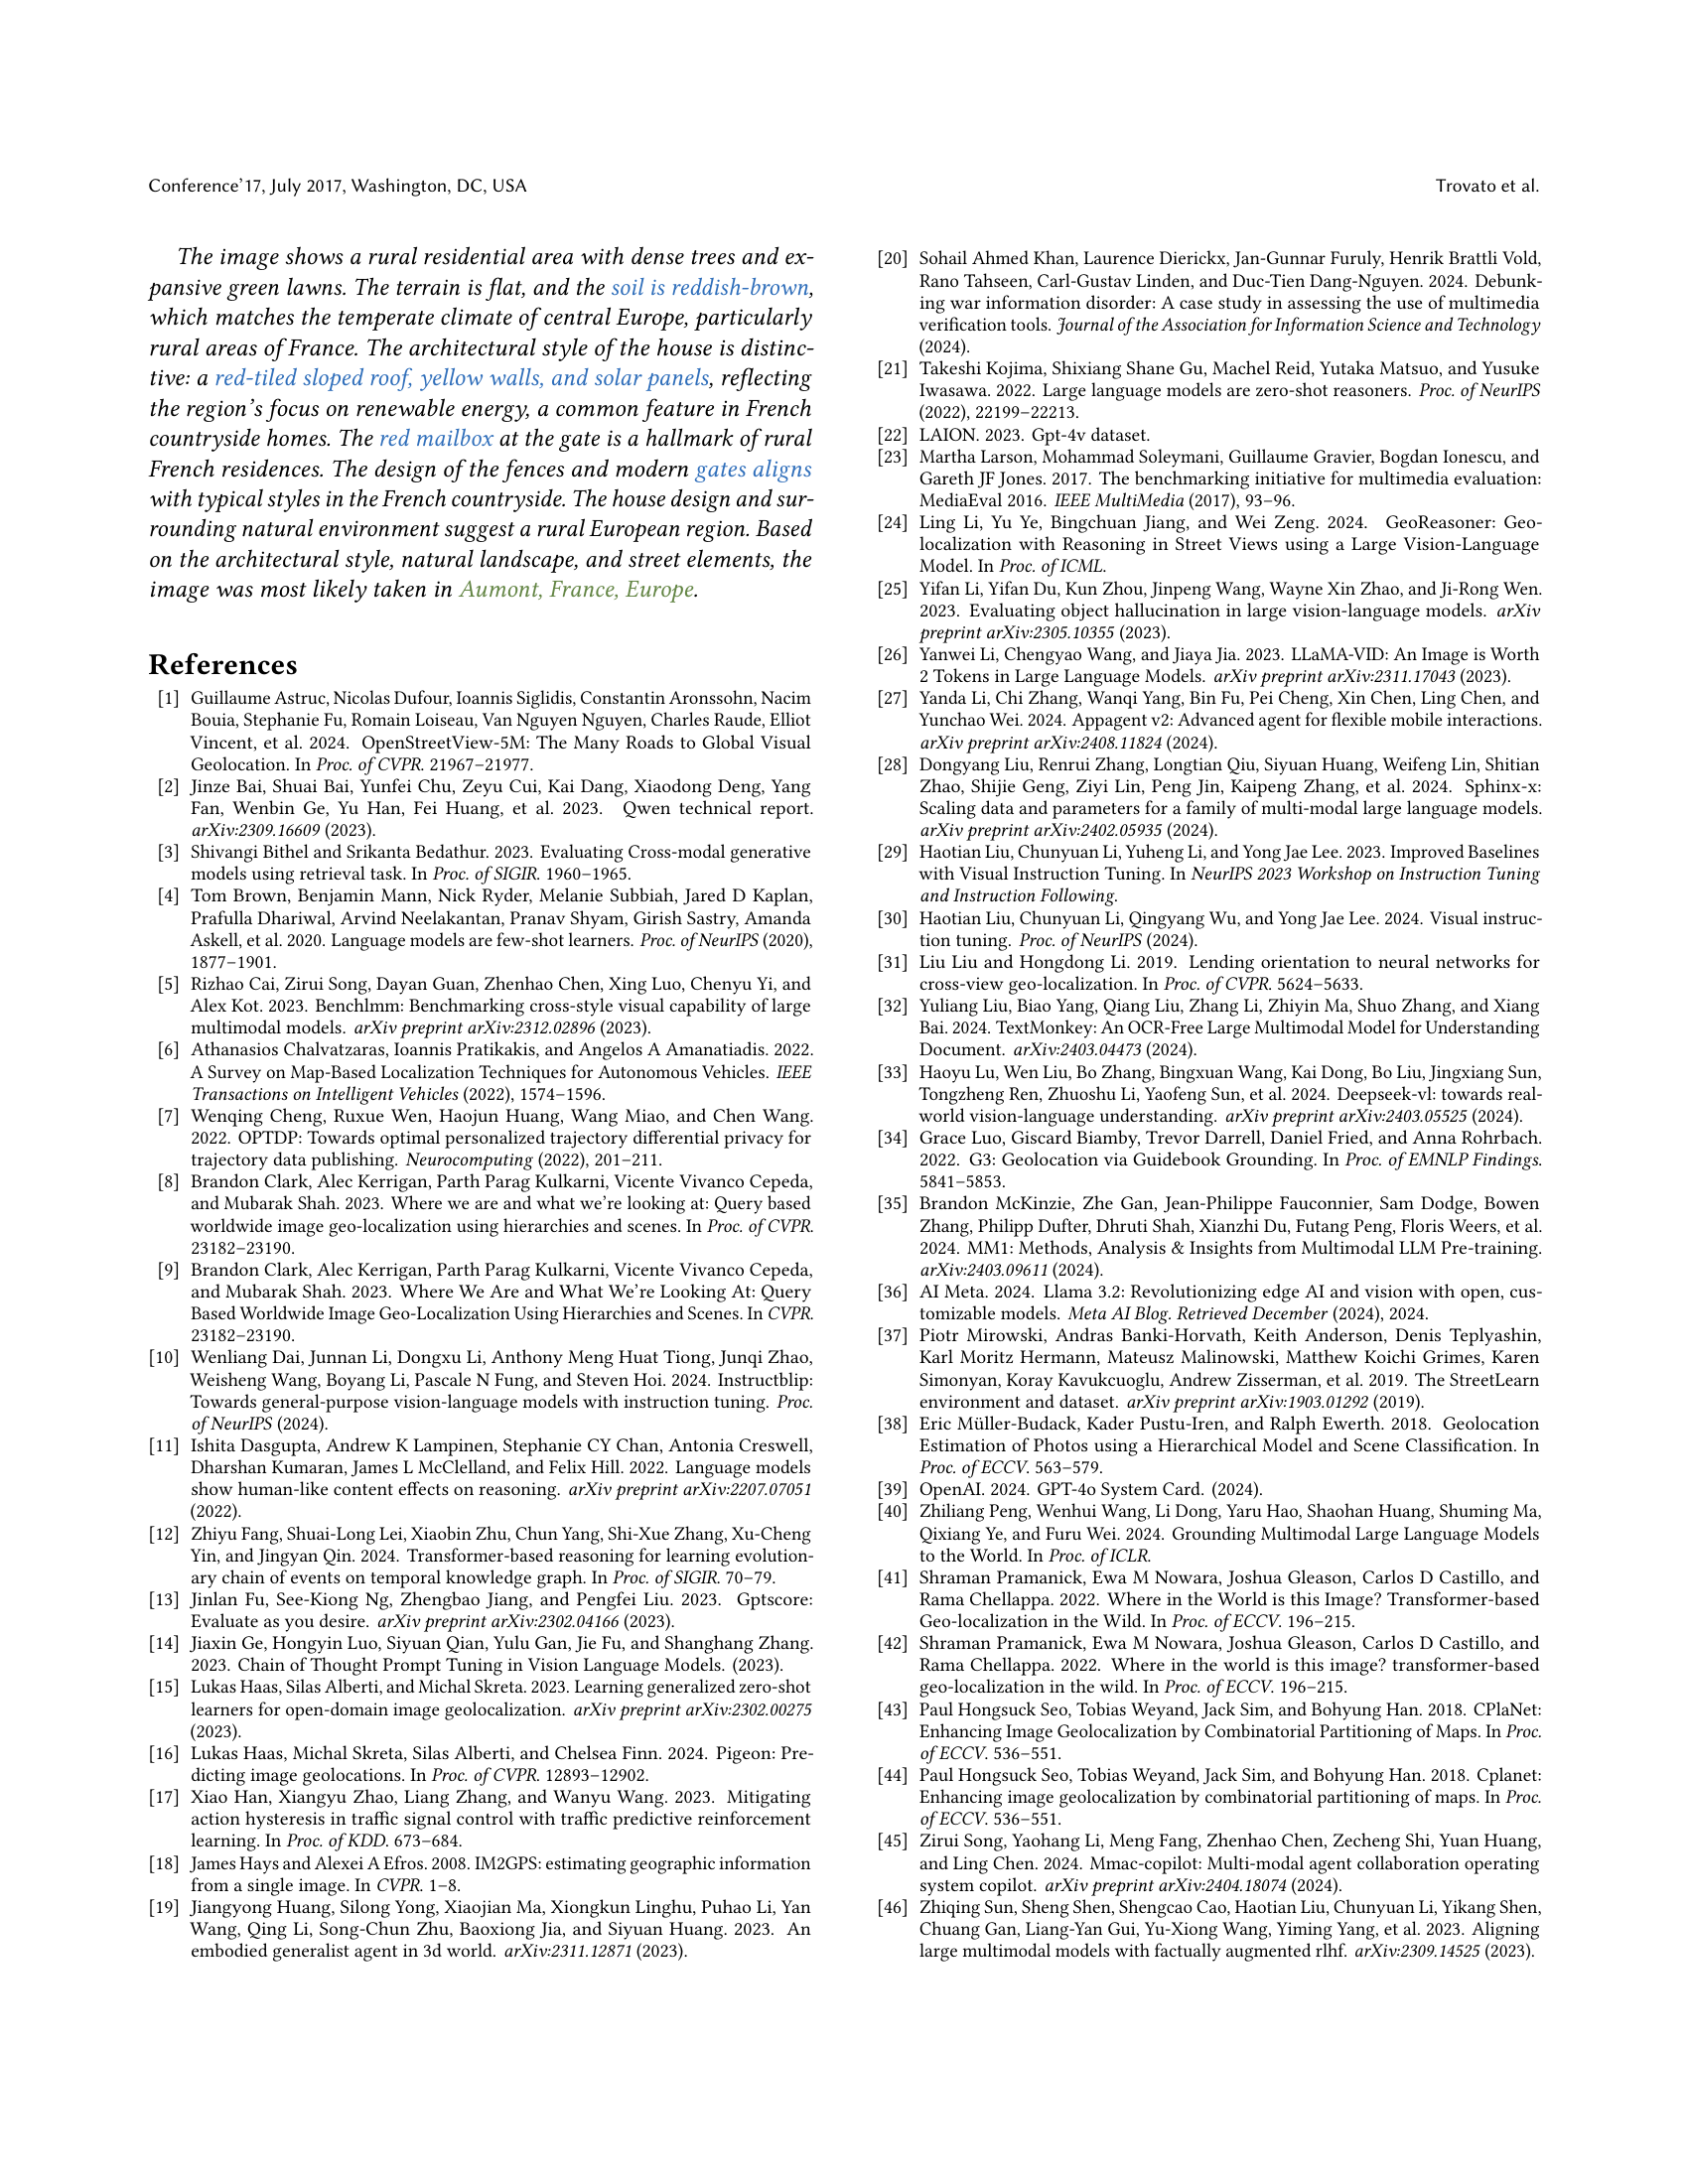
🔼 Figure 5 presents a qualitative comparison of three different large vision language models (LLaVAs, GPT-40, and GeoReasoner) on the task of image geolocation. The figure shows example images and the reasoning process used by each model. Clues identified by each model are highlighted in blue, correct predictions in green, incorrect predictions in red, and uncertain or vague predictions in orange. This allows for a visual analysis of the strengths and weaknesses of each model’s reasoning process and ability to identify relevant contextual information within images.
read the caption
Figure 5. Qualitative comparison of LLaVA, GPT4o, and GeoReasoner. Clues are shown in blue, correct predictions in green, incorrect in red, and vague/uncertain guesses in orange.
More on tables
| Model | City | Country | Continent | ||||||
|---|---|---|---|---|---|---|---|---|---|
| Accuracy | Recall | F1 | Accuracy | Recall | F1 | Accuracy | Recall | F1 | |
| LLaVA-1.6 | 0.002 | 0.001 | 0.002 | 0.041 | 0.019 | 0.028 | 0.175 | 0.067 | 0.056 |
| LLama-3.2-Vision | 0.081 | 0.037 | 0.030 | 0.630 | 0.199 | 0.217 | 0.866 | 0.643 | 0.639 |
| Qwen-VL | 0.016 | 0.013 | 0.014 | 0.069 | 0.042 | 0.070 | 0.130 | 0.115 | 0.077 |
| GeoCLIP | 0.018 | 0.007 | 0.008 | 0.550 | 0.197 | 0.204 | 0.872 | 0.746 | 0.731 |
| GeoReasoner | 0.018 | 0.014 | 0.012 | 0.092 | 0.053 | 0.085 | 0.208 | 0.161 | 0.144 |
| GPT-4o | 0.092 | 0.048 | 0.044 | 0.615 | 0.188 | 0.208 | 0.807 | 0.468 | 0.487 |
| GPT-4o(CoT) | 0.094 | 0.052 | 0.042 | 0.623 | 0.194 | 0.212 | 0.819 | 0.430 | 0.449 |
| GeoCoT | 0.118 | 0.089 | 0.086 | 0.640 | 0.260 | 0.291 | 0.862 | 0.638 | 0.646 |
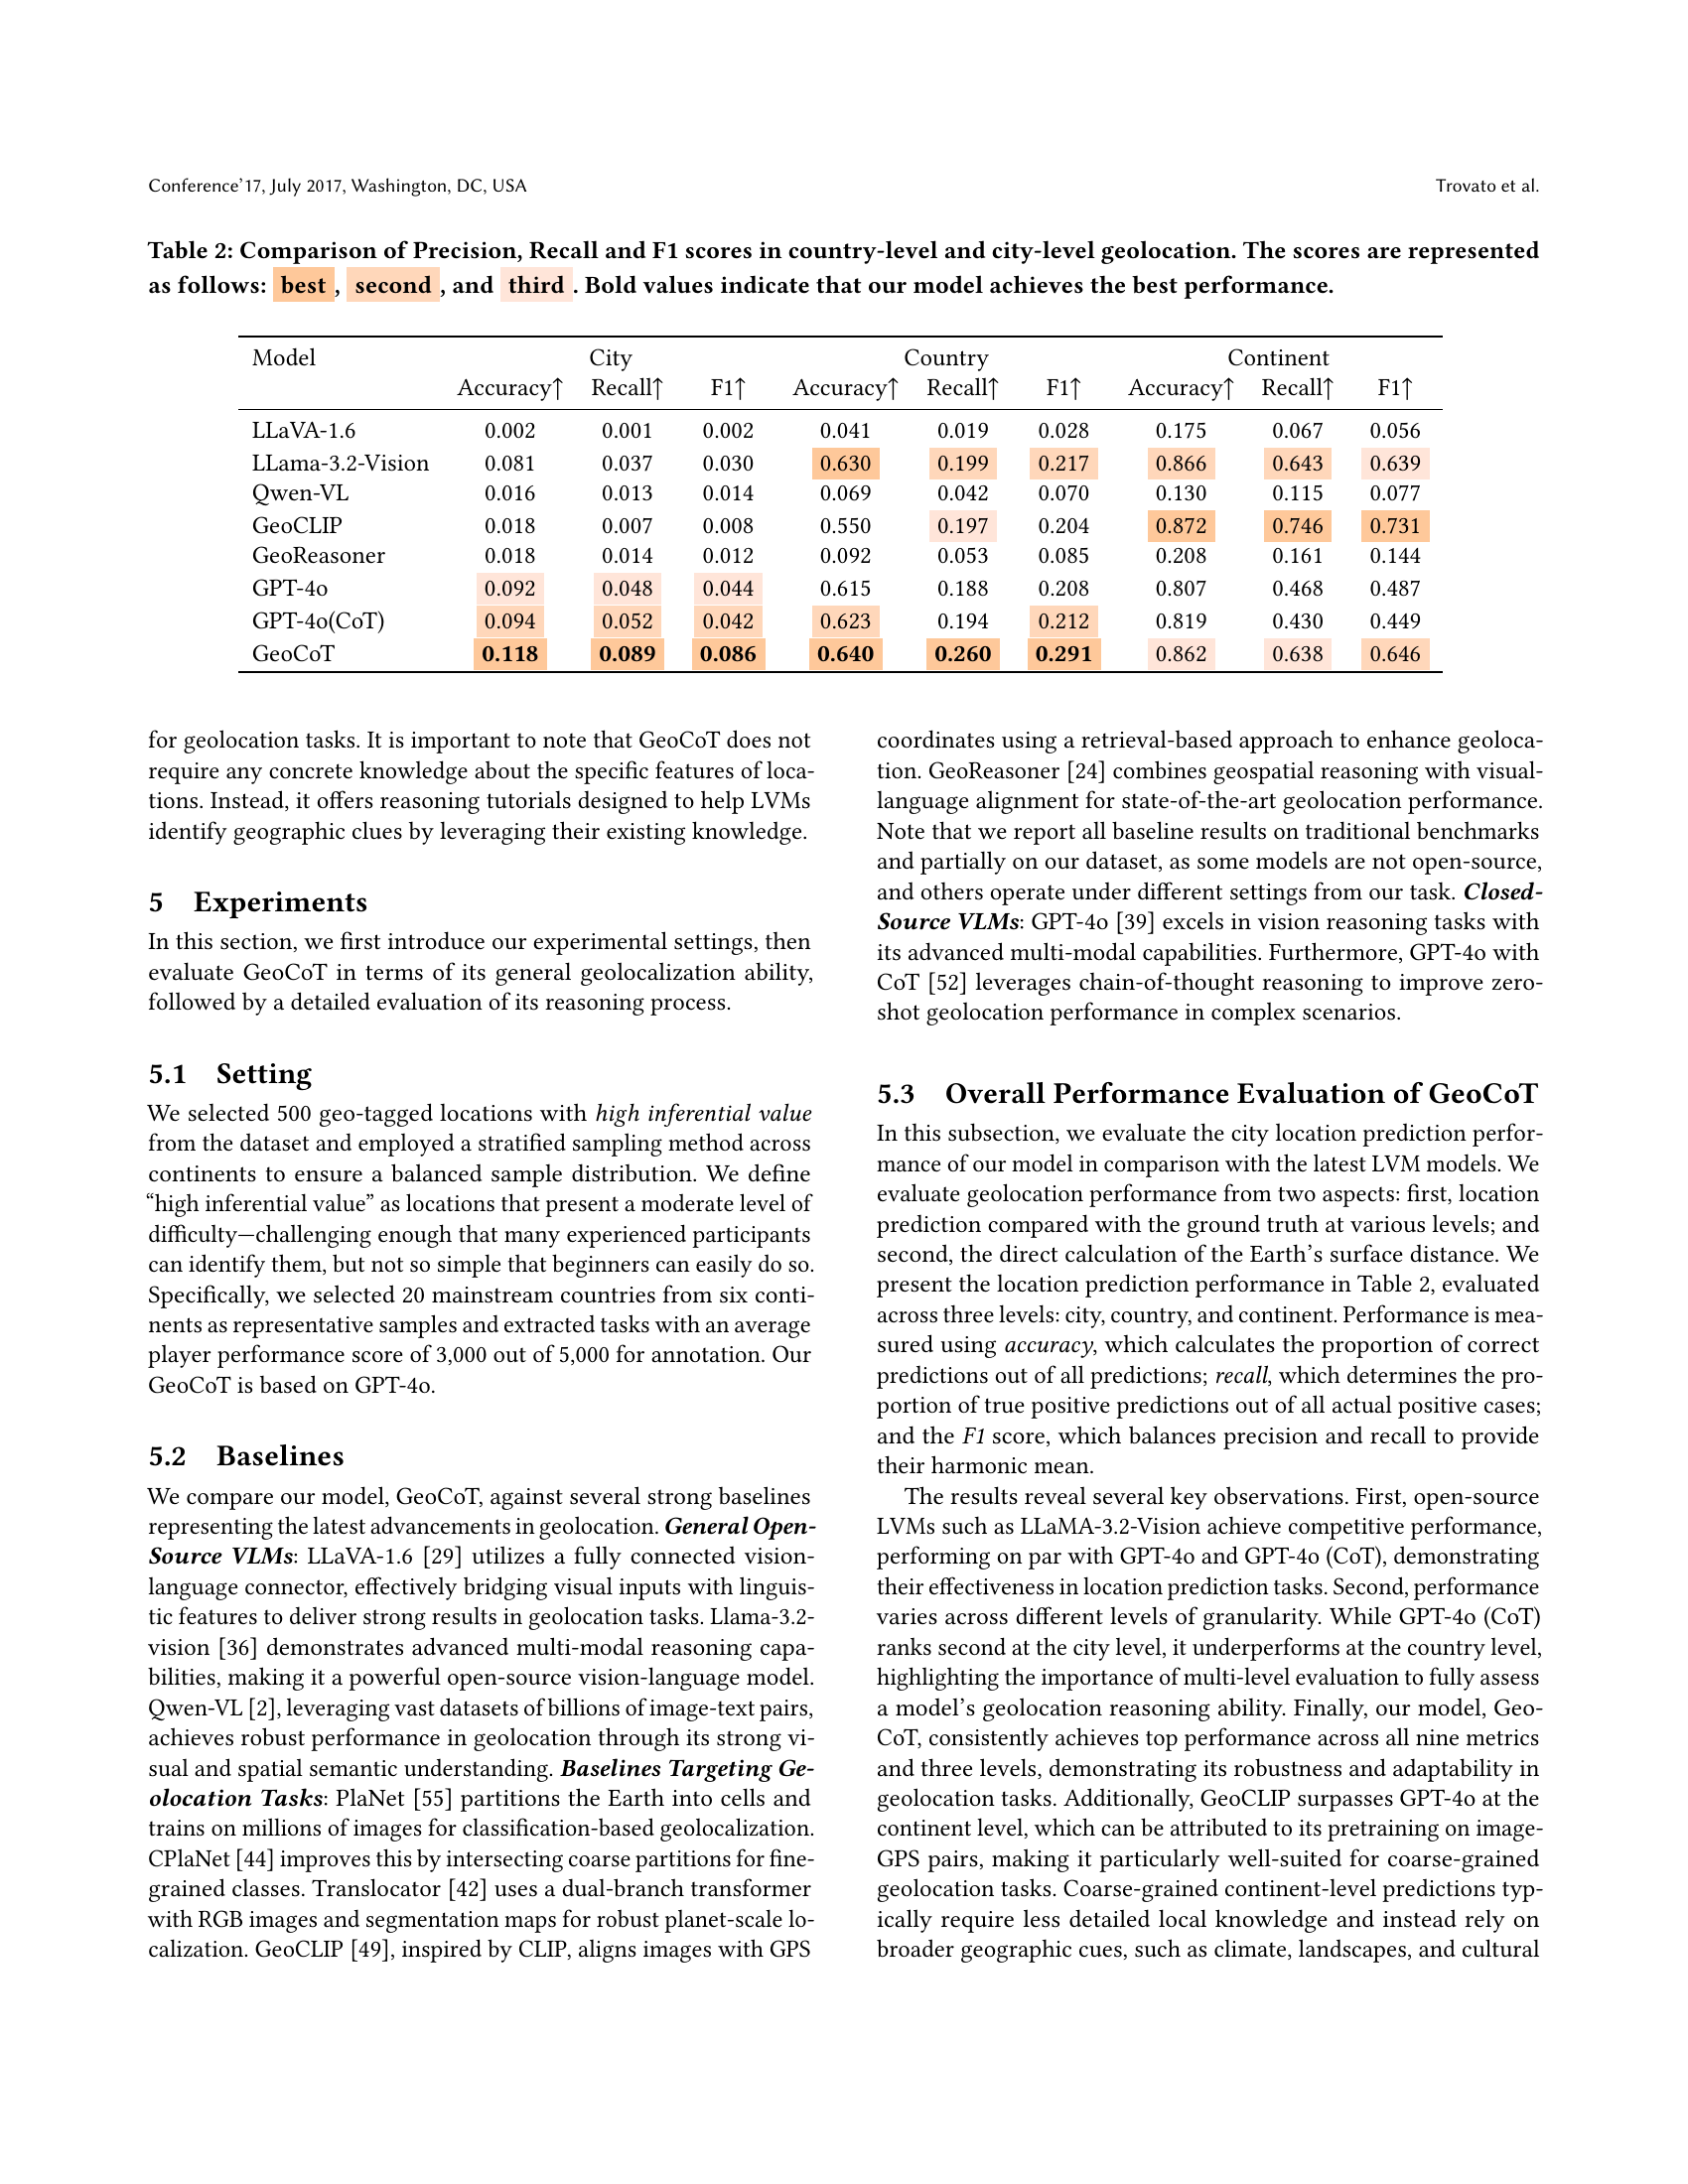
🔼 This table presents a comparative analysis of various models’ performance in country-level and city-level geolocation tasks. The metrics used are Precision, Recall, and F1-score, which are standard measures for evaluating the accuracy and effectiveness of classification models. The models compared include several state-of-the-art Large Vision Language Models (LLVMs) and other dedicated geolocation models. The results are presented showing the best, second best, and third-best performing model for each metric and task. Bold values highlight the instances where the proposed GeoCoT model outperforms all others.
read the caption
Table 2. Comparison of Precision, Recall and F1 scores in country-level and city-level geolocation. The scores are represented as follows: best, second, and third. Bold values indicate that our model achieves the best performance.
| Model | Street | City | Country |
|---|---|---|---|
| 1km | 25km | 750km | |
| LLaVA-1.6 | 0.006 | 0.020 | 0.082 |
| Llama-3.2-Vision | 0.018 | 0.104 | 0.638 |
| Qwen-VL | 0.004 | 0.014 | 0.090 |
| GeoCLIP | 0.035 | 0.077 | 0.625 |
| GeoReasoner | 0.010 | 0.020 | 0.128 |
| GPT-4o | 0.045 | 0.147 | 0.678 |
| GPT-4o(CoT) | 0.047 | 0.151 | 0.701 |
| GeoCoT | 0.073 | 0.157 | 0.711 |
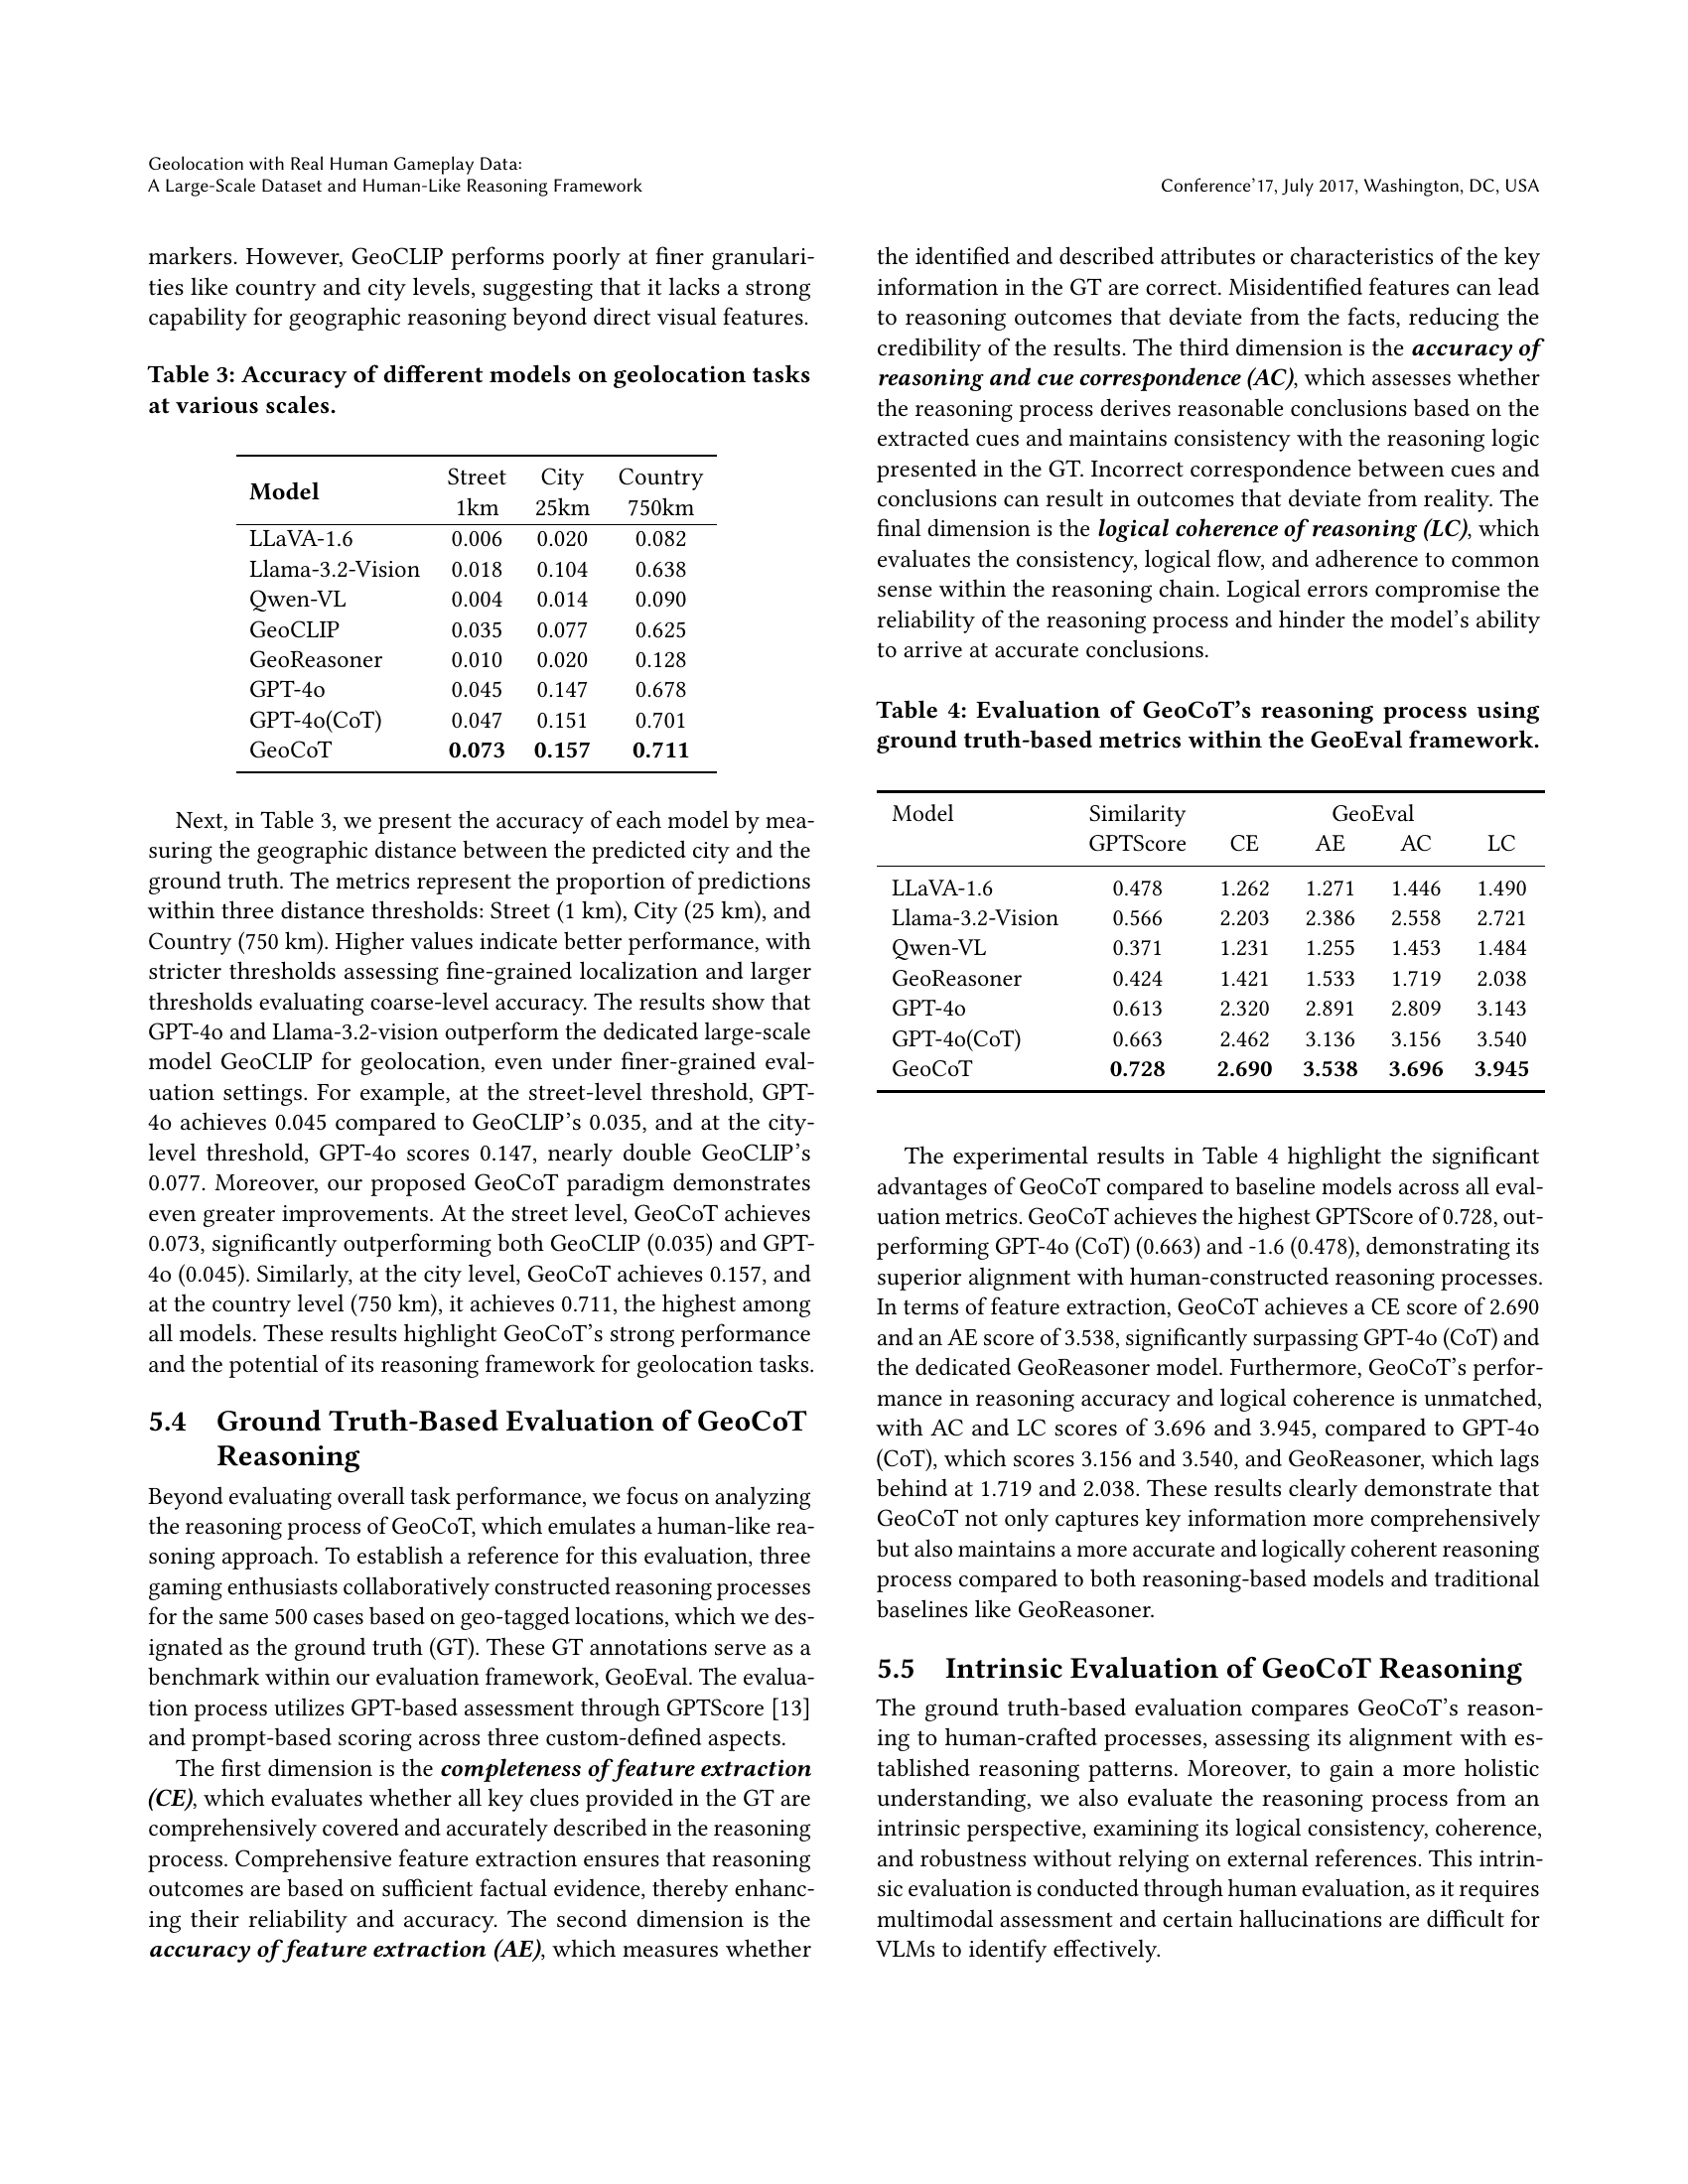
🔼 Table 3 presents a comprehensive evaluation of various geolocation models’ accuracy across different spatial scales. It assesses the models’ ability to pinpoint locations with varying degrees of precision. The accuracy is measured at three levels of granularity: street level (within 1 kilometer), city level (within 25 kilometers), and country level (within 750 kilometers). This allows for a nuanced understanding of each model’s performance in terms of its ability to perform both fine-grained and coarse-grained geolocation tasks. By presenting accuracy at these various scales, the table provides valuable insights into the strengths and limitations of each model in different geographical contexts and application scenarios.
read the caption
Table 3. Accuracy of different models on geolocation tasks at various scales.
| Model | Similarity | GeoEval | |||
|---|---|---|---|---|---|
| GPTScore | CE | AE | AC | LC | |
| LLaVA-1.6 | 0.478 | 1.262 | 1.271 | 1.446 | 1.490 |
| Llama-3.2-Vision | 0.566 | 2.203 | 2.386 | 2.558 | 2.721 |
| Qwen-VL | 0.371 | 1.231 | 1.255 | 1.453 | 1.484 |
| GeoReasoner | 0.424 | 1.421 | 1.533 | 1.719 | 2.038 |
| GPT-4o | 0.613 | 2.320 | 2.891 | 2.809 | 3.143 |
| GPT-4o(CoT) | 0.663 | 2.462 | 3.136 | 3.156 | 3.540 |
| GeoCoT | 0.728 | 2.690 | 3.538 | 3.696 | 3.945 |
🔼 Table 4 presents a detailed evaluation of the GeoCoT model’s reasoning process. It uses ground truth data as a benchmark for comparison, evaluating GeoCoT’s performance along four key aspects of its reasoning capabilities: Completeness (CE), Accuracy (AE), Correspondence (AC), and Logical Coherence (LC) of feature extraction and reasoning. The evaluation metrics provide a comprehensive assessment of GeoCoT’s ability to mimic human-like reasoning in geolocation tasks.
read the caption
Table 4. Evaluation of GeoCoT’s reasoning process using ground truth-based metrics within the GeoEval framework.
| Model | OH | FH | AH |
|---|---|---|---|
| Count | Count | Count | |
| GeoReasoner | 237 | 151 | 203 |
| GPT-4o | 43 | 4 | 35 |
| GeoCoT | 5 | 1 | 18 |
🔼 This table presents a quantitative evaluation of hallucination in the reasoning data generated by different large vision language models (LVMs). Hallucination refers to the generation of inaccurate or fabricated information. The evaluation focuses on three types of hallucinations: Object Hallucination (OH), which assesses whether the generated data includes objects not present in the original image; Fact Hallucination (FH), which measures the accuracy of factual information within the generated data; and Attribution Hallucination (AH), which assesses whether the data incorrectly attributes properties or relationships to entities or objects. The table shows the count of errors for each hallucination type for three models: GeoReasoner, GPT-40, and GeoCoT. Lower counts indicate better performance and fewer hallucinations.
read the caption
Table 5. Hallucination Evaluation on Reasoning Data.
| Model | Im2GPS | Im2GPS3K | ||||
|---|---|---|---|---|---|---|
| Street | City | Country | Street | City | Country | |
| 1km | 25km | 750km | 1km | 25km | 750km | |
| LLaVA-1.6 | 0.04 | 0.18 | 0.39 | 0.03 | 0.14 | 0.32 |
| Llama-3.2-Vision | 0.09 | 0.37 | 0.65 | 0.07 | 0.27 | 0.52 |
| Qwen-VL | 0.04 | 0.21 | 0.37 | 0.04 | 0.15 | 0.26 |
| GeoCLIP | 0.17 | 0.41 | 0.77 | 0.13 | 0.32 | 0.67 |
| GeoReasoner | 0.05 | 0.19 | 0.33 | 0.04 | 0.15 | 0.26 |
| PlaNet | 0.08 | 0.25 | 0.54 | 0.09 | 0.25 | 0.48 |
| CPlaNet | 0.17 | 0.37 | 0.62 | 0.10 | 0.27 | 0.49 |
| Translocator | 0.20 | 0.48 | 0.76 | 0.12 | 0.31 | 0.59 |
| GeoDecoder | 0.22 | 0.50 | 0.80 | 0.13 | 0.34 | 0.61 |
| GPT-4o | 0.13 | 0.47 | 0.74 | 0.14 | 0.40 | 0.66 |
| GPT-4o(ZS-CoT) | 0.16 | 0.49 | 0.77 | 0.14 | 0.45 | 0.69 |
| GeoCoT | 0.22 | 0.55 | 0.83 | 0.15 | 0.46 | 0.74 |
🔼 This table compares the performance of GeoCoT against other state-of-the-art geolocation models on two widely used benchmark datasets: Im2GPS and Im2GPS3K. The comparison is made across three levels of granularity: street (1km radius), city (25km radius), and country (750km radius). Performance is measured by accuracy, showing the percentage of correctly localized predictions at each level for each model.
read the caption
Table 6. Performance comparison of GeoCoT and state-of-the-art geolocation models on traditional benchmarks.
Full paper#