TL;DR#
Vision-Language Models (VLMs) struggle with text-rich images due to limited data. They tend to over-rely on language priors. The paper tackles this by introducing CoSyn, a framework that uses code-guided generation to create synthetic data for vision-language instruction tuning. It leverages the coding capabilities of text-only LLMs to automatically create synthetic text-rich multimodal data. Given input text describing a target domain, it prompts an LLM to generate code for rendering synthetic images.
Using CoSyn, the authors constructed a large-scale dataset of 400K images and 2.7M rows of instruction-tuning data. Experiments on seven benchmarks show that models trained on this data achieve state-of-the-art performance. CoSyn also enables sample-efficient learning and improves performance on tasks requiring multi-hop reasoning. It can synthesize pointing data, enabling VLMs to ground information within input images. This showcases the potential for developing multimodal agents capable of acting in real-world environments.
Key Takeaways#
Why does it matter?#
CoSyn offers a promising approach to boost VLM performance by generating synthetic data, which helps address the lack of diverse text-rich data. This research opens new avenues for developing multimodal agents and improving VLM capabilities in real-world applications.
Visual Insights#
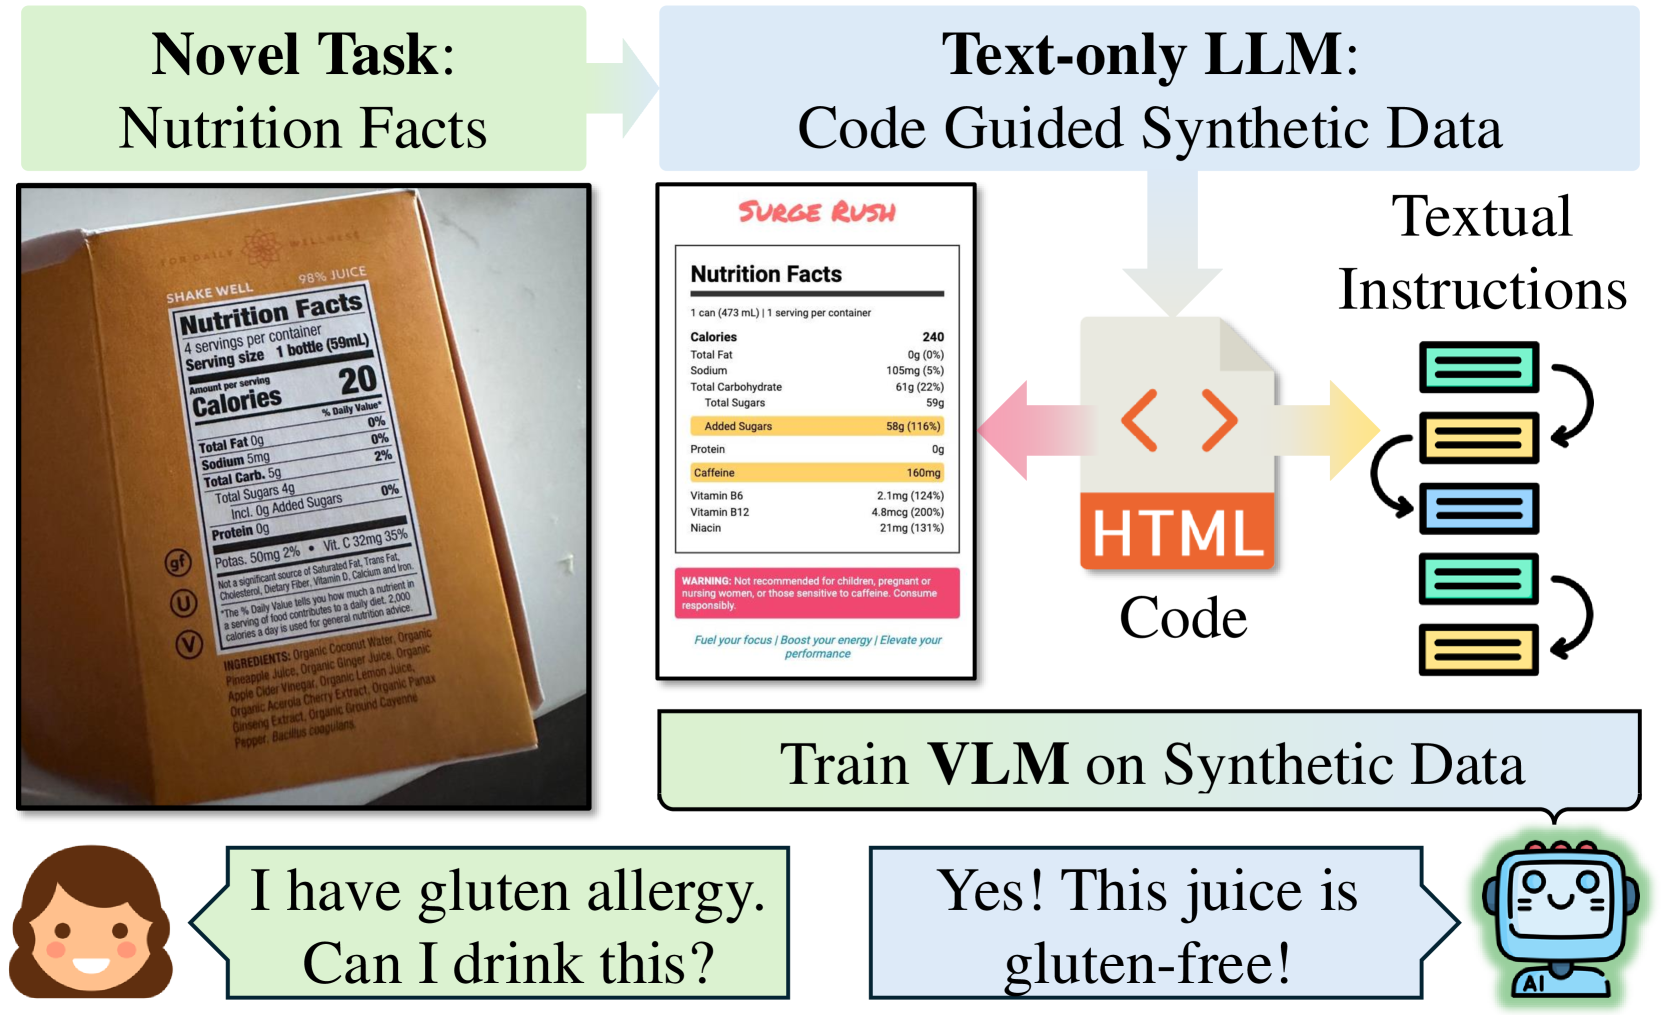
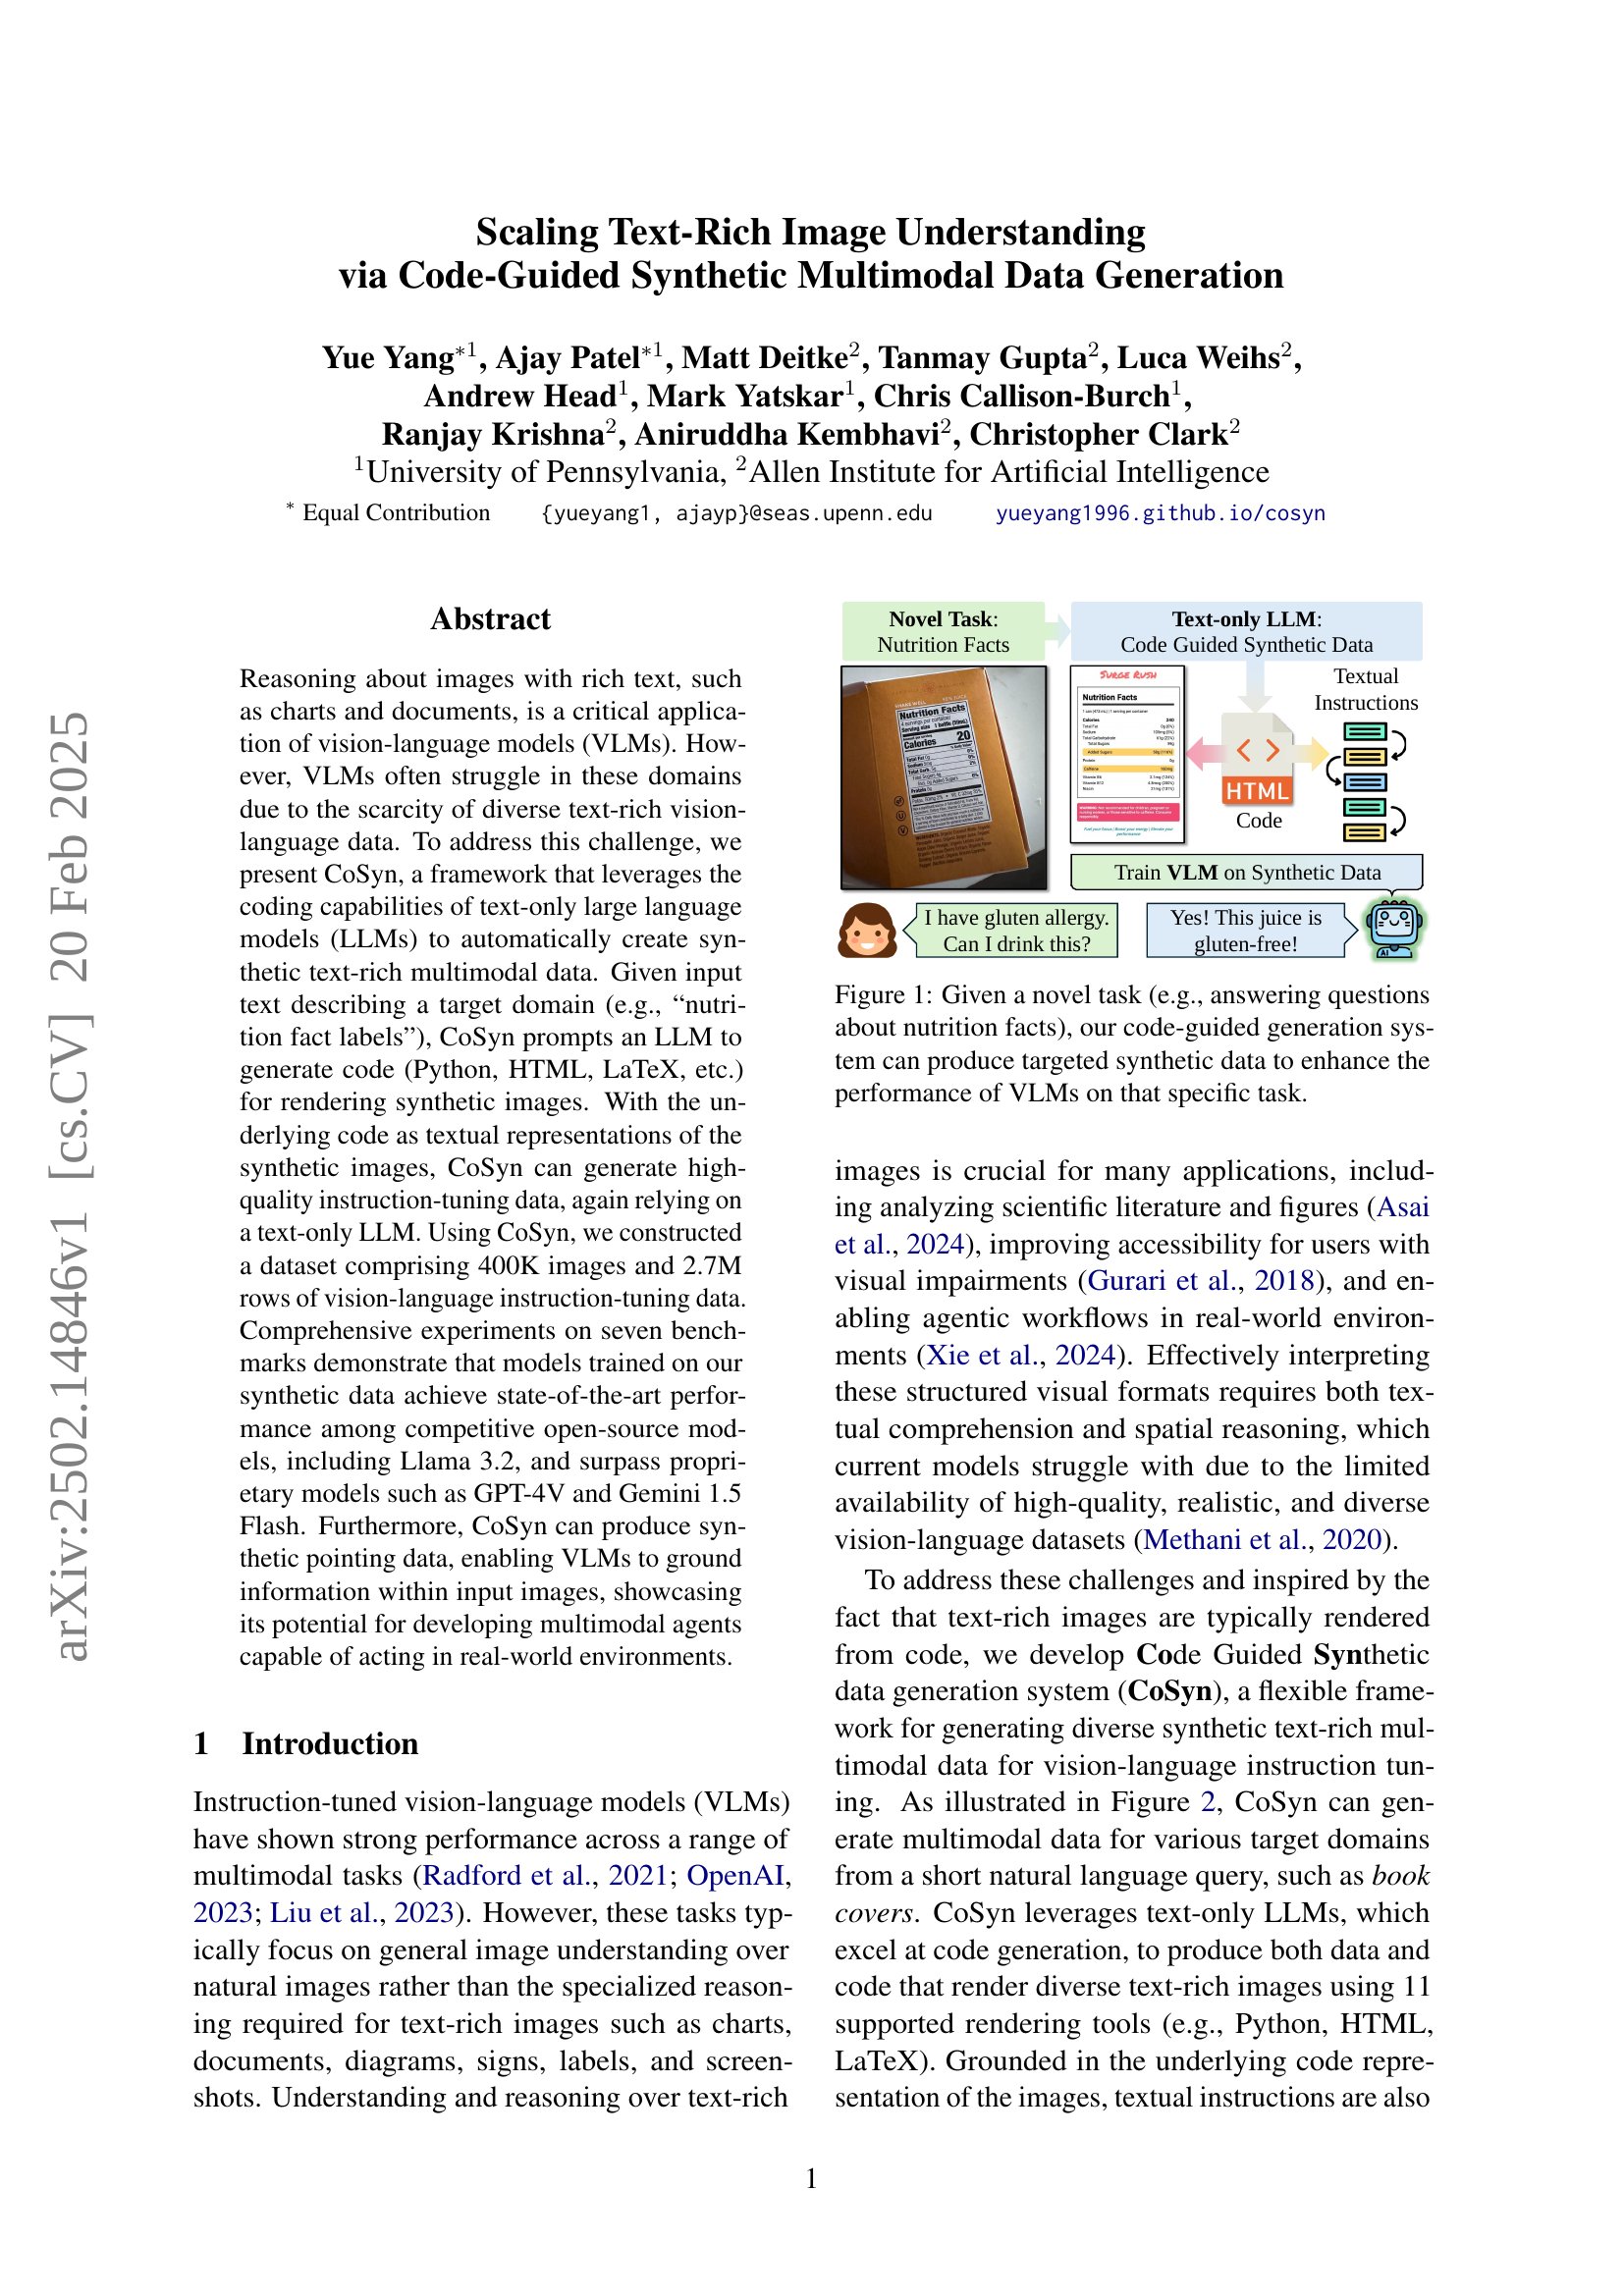
🔼 This figure illustrates the Code-Guided Synthetic Multimodal Data Generation system. Given a new task (such as answering questions about nutrition labels), the system uses a large language model (LLM) to generate code (e.g., in Python, HTML, or LaTeX) that renders a synthetic image related to that task. The generated code acts as a textual representation of the image, allowing the LLM to produce high-quality instruction-tuning data, which can be used to train a vision-language model (VLM). This synthetic data helps address the scarcity of real-world text-rich image data for training VLMs, ultimately improving their performance on complex reasoning tasks involving text and images.
read the caption
Figure 1: Given a novel task (e.g., answering questions about nutrition facts), our code-guided generation system can produce targeted synthetic data to enhance the performance of VLMs on that specific task.
| Model | ChartQA | DocVQA | InfoVQA | TableVQA | AI2D | TextVQA | ScreenQA | Average |
| GPT-4V | 78.1 | 87.2 | 75.1 | 60.5 | 89.4 | 78.0 | 41.6 | 72.8 |
| Gemini 1.5 Flash | 85.4 | 89.9 | 75.3 | 72.6 | 91.7 | 78.7 | 40.1 | 76.2 |
| Claude-3 Opus | 80.8 | 89.3 | 55.6 | 70.0 | 88.1 | 67.5 | 39.8 | 70.2 |
| PaliGemma-3B† | 71.4 | 84.8 | 47.8 | 46.4 | 73.3 | 76.5 | 32.2 | 61.8 |
| BLIP-3-4B† | 60.0 | 61.4 | 31.5 | 24.3 | 74.2 | 71.0 | 26.2 | 49.8 |
| Cambrian-7B† | 73.3 | 77.8 | 41.6 | 40.6 | 73.0 | 71.7 | 44.4 | 64.2 |
| LLaVA-1.5-7B†∗ | 17.8 | 28.1 | 25.8 | 33.1 | 55.5 | 58.2 | 17.6 | 33.7 |
| LLaVA-Next-8B† | 69.5 | 78.2 | 43.8 | 43.9 | 71.6 | 65.3 | 34.2 | 58.1 |
| LLaVA-OneVision-7B† | 80.0 | 87.5 | 68.8 | 64.6 | 81.4 | 78.3 | 46.3 | 72.4 |
| Pixtral-12B | 81.8 | 90.7 | 50.8 | 67.0 | 79.0 | 75.7 | 39.4 | 69.2 |
| Llama 3.2 11B | 83.4 | 88.4 | 63.6 | 51.1 | 91.9 | 73.1 | 87.7 | 77.0 |
| Ours (7B)† | 86.3 | 90.0 | 70.5 | 65.8 | 91.9 | 82.0 | 80.1 | 80.9 |
| Ours (7B-zero-shot)†∗ | 80.8 | 82.9 | 59.8 | 64.9 | 83.9 | 72.7 | 78.1 | 74.7 |
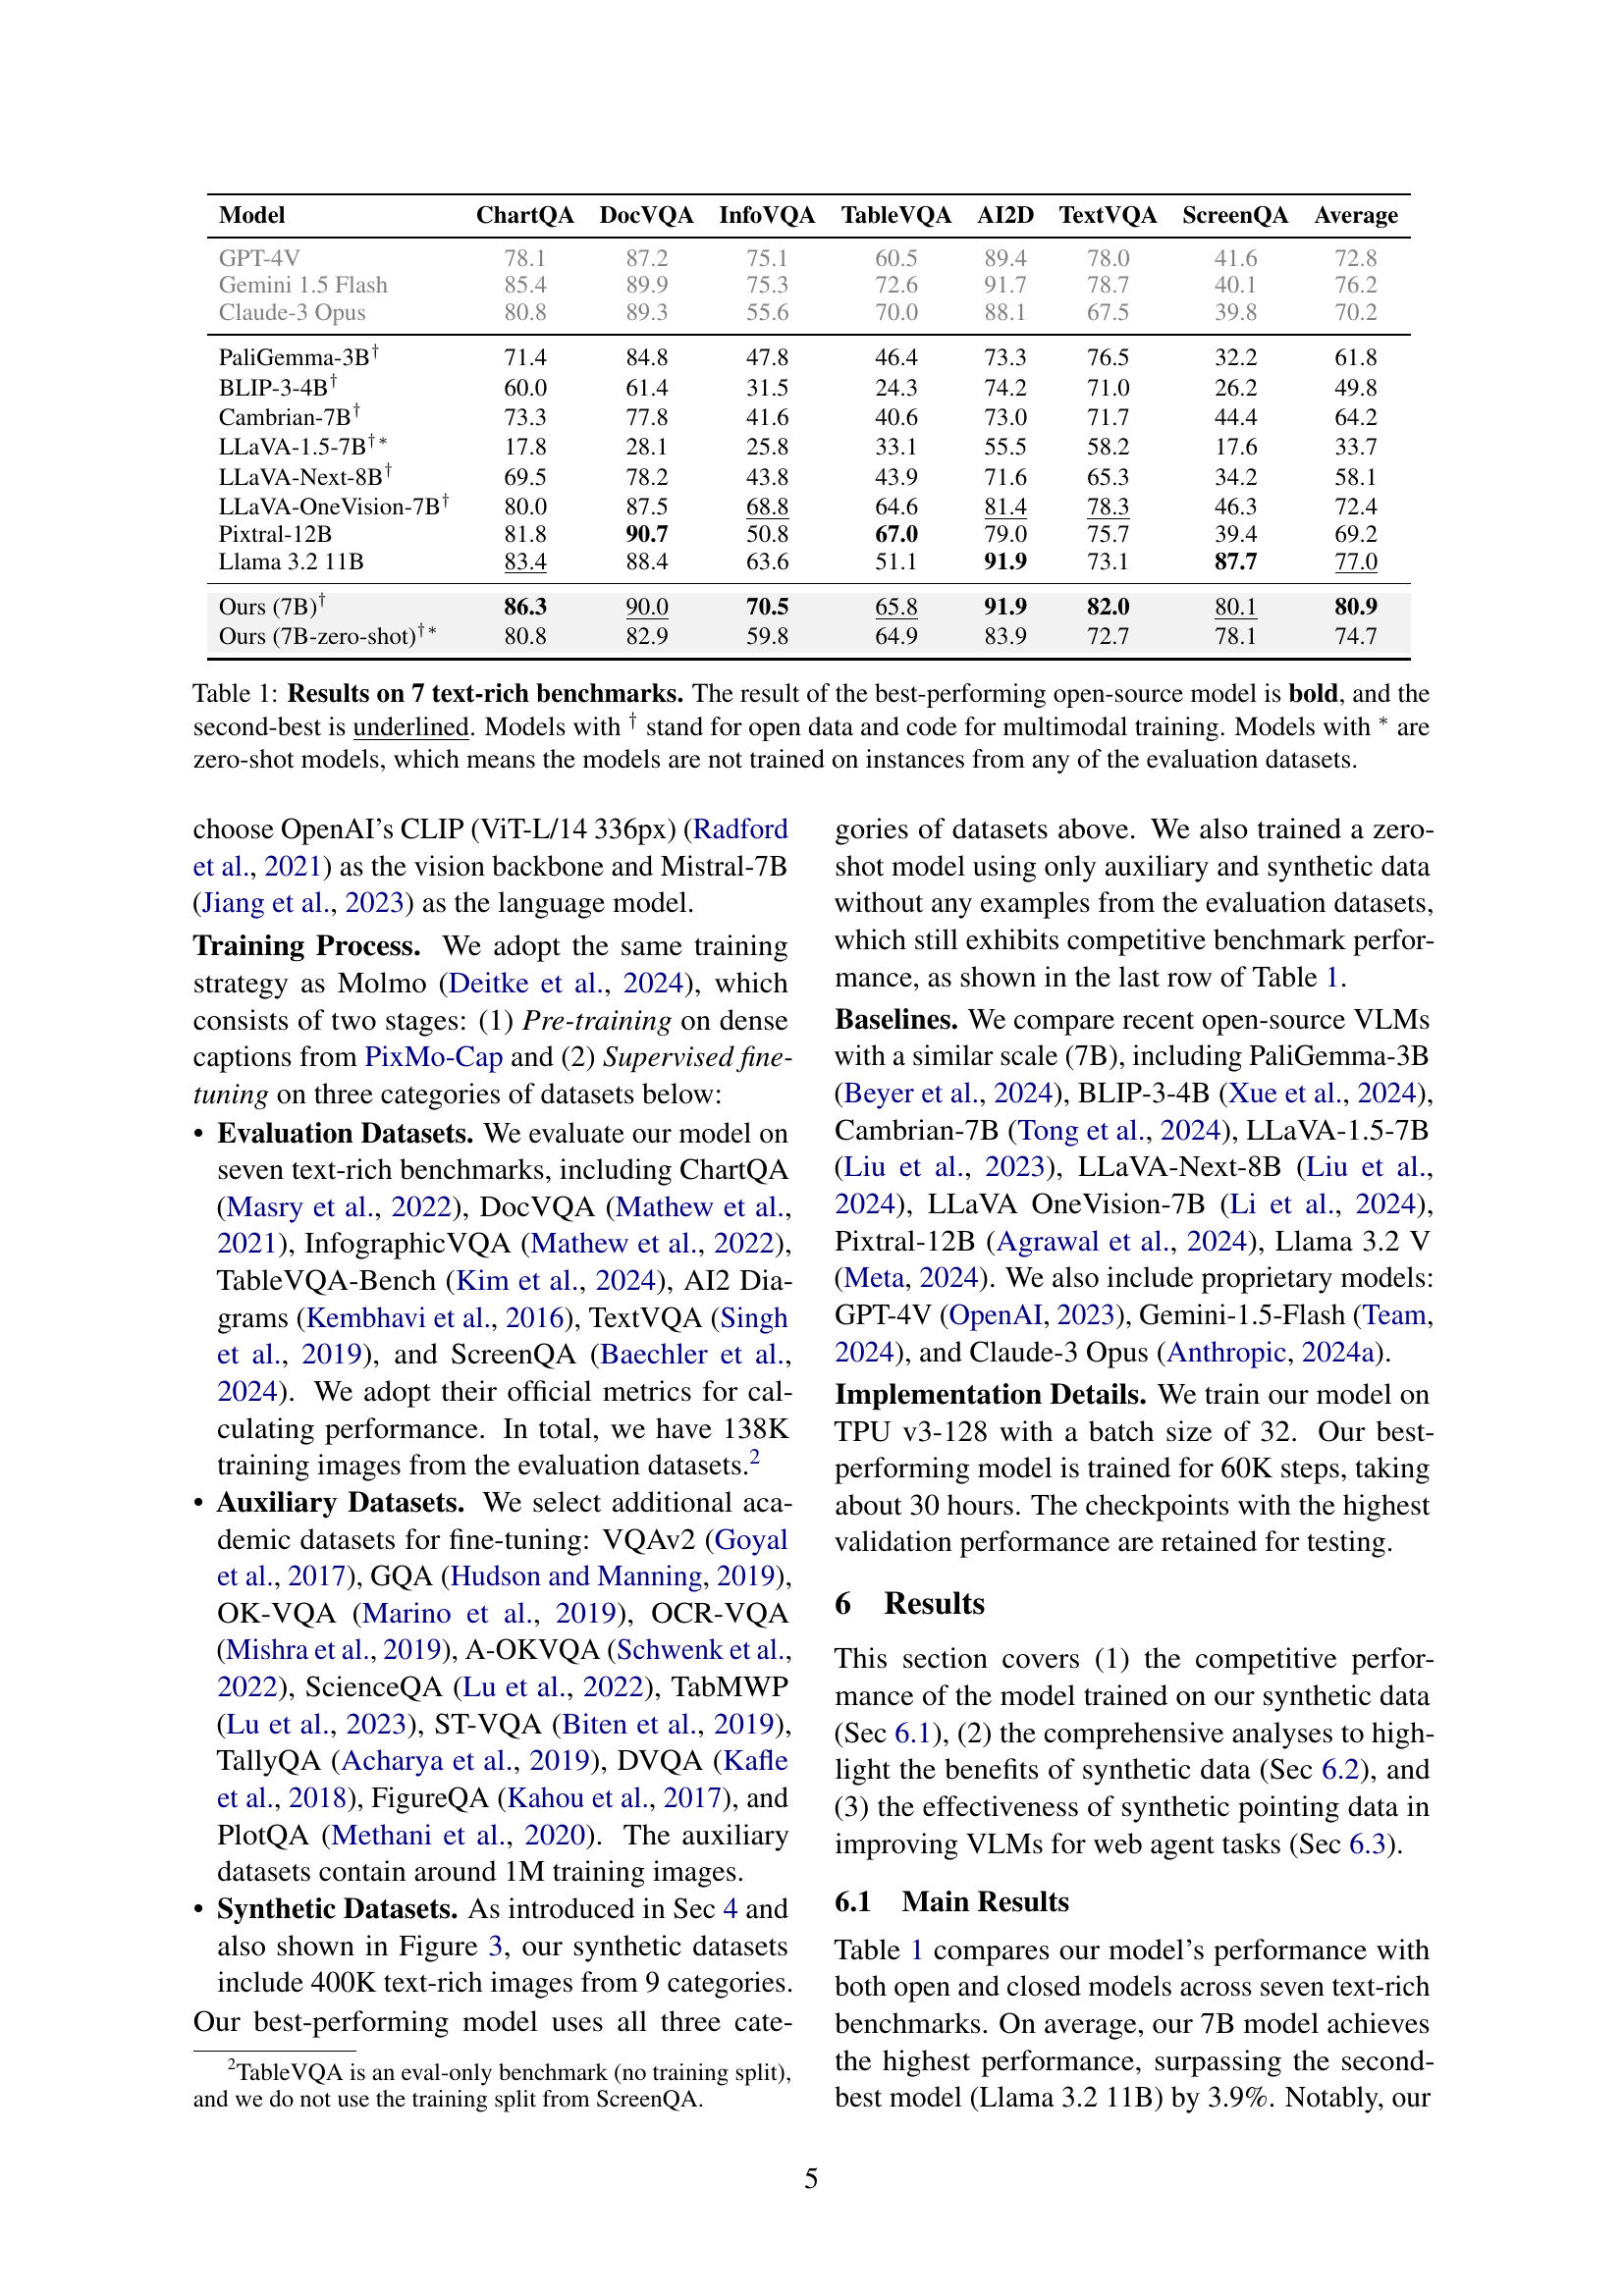
🔼 This table presents the performance comparison of various vision-language models (VLMs) on seven established text-rich image understanding benchmarks. The models are evaluated based on their ability to answer questions about images containing text, such as charts, documents, and diagrams. The table highlights the state-of-the-art performance of models trained on synthetic data generated by the CoSyn system, showcasing both supervised and zero-shot results. The presence of open data and code, as well as the zero-shot capabilities of certain models, is explicitly indicated. This allows readers to compare proprietary models (GPT-4V, Gemini) with open-source alternatives.
read the caption
Table 1: Results on 7 text-rich benchmarks. The result of the best-performing open-source model is bold, and the second-best is underlined. Models with † stand for open data and code for multimodal training. Models with ∗ are zero-shot models, which means the models are not trained on instances from any of the evaluation datasets.
In-depth insights#
Code-Guided Gen#
The work focuses on code-guided generation (CoSyn) of synthetic multimodal data. The core idea is to utilize code as an intermediate representation to bridge images and text, where text-only LLMs, known for code generation, are prompted to produce code (Python, HTML, LaTeX, etc.) that renders synthetic images. This code then serves as context for LLMs to generate corresponding textual instructions, enabling the creation of high-quality instruction-tuning data for VLMs. This is especially useful in text-rich domains, since such images are typically rendered from code and this approach provides grounded instructions.
Text-Rich Scaling#
Scaling text-rich image understanding is crucial for advancing VLMs. The scarcity of diverse data in this domain hinders progress. CoSyn addresses this by leveraging text-only LLMs to generate synthetic multimodal data. The approach involves coding images, enabling high-quality instruction tuning. The goal is to improve VLMs’ ability to interpret and reason about text-rich images, unlocking their potential for real-world applications. This scaling enhances VLMs in understanding text-rich images and unlocks their potential for broader applications. Synthetic data generation offers a path to overcome data limitations.
CoSyn Framework#
CoSyn, the code-guided synthetic data generation framework, addresses the scarcity of diverse text-rich vision-language data, a critical bottleneck for VLMs. It leverages the coding capabilities of text-only LLMs to create synthetic multimodal data automatically. The framework, driven by short natural language queries, prompts an LLM to generate code in languages like Python or HTML. This code is used to render synthetic images. The underlying code becomes a textual representation of the images. The system generates high-quality instruction-tuning data by again relying on a text-only LLM, with the code serving as context. CoSyn’s architecture enables the creation of a targeted dataset, enhancing the VLM performance.
Synthetic VLMs#
The concept of “Synthetic VLMs,” while not explicitly a heading in this document, can be interpreted as the core idea of using synthetically generated data to train Vision-Language Models (VLMs). The research leverages the coding capabilities of LLMs to create diverse text-rich multimodal data. This addresses the limitation of high-quality, realistic, and diverse vision-language datasets which often hinders VLM performance, particularly in tasks requiring text and spatial reasoning. By generating data and code, the system offers high-quality instruction-tuning data, enabling VLMs to learn effectively in domains where real data is scarce. Ultimately, this approach unlocks the potential of VLMs for real-world applications, where understanding text-rich images is crucial.
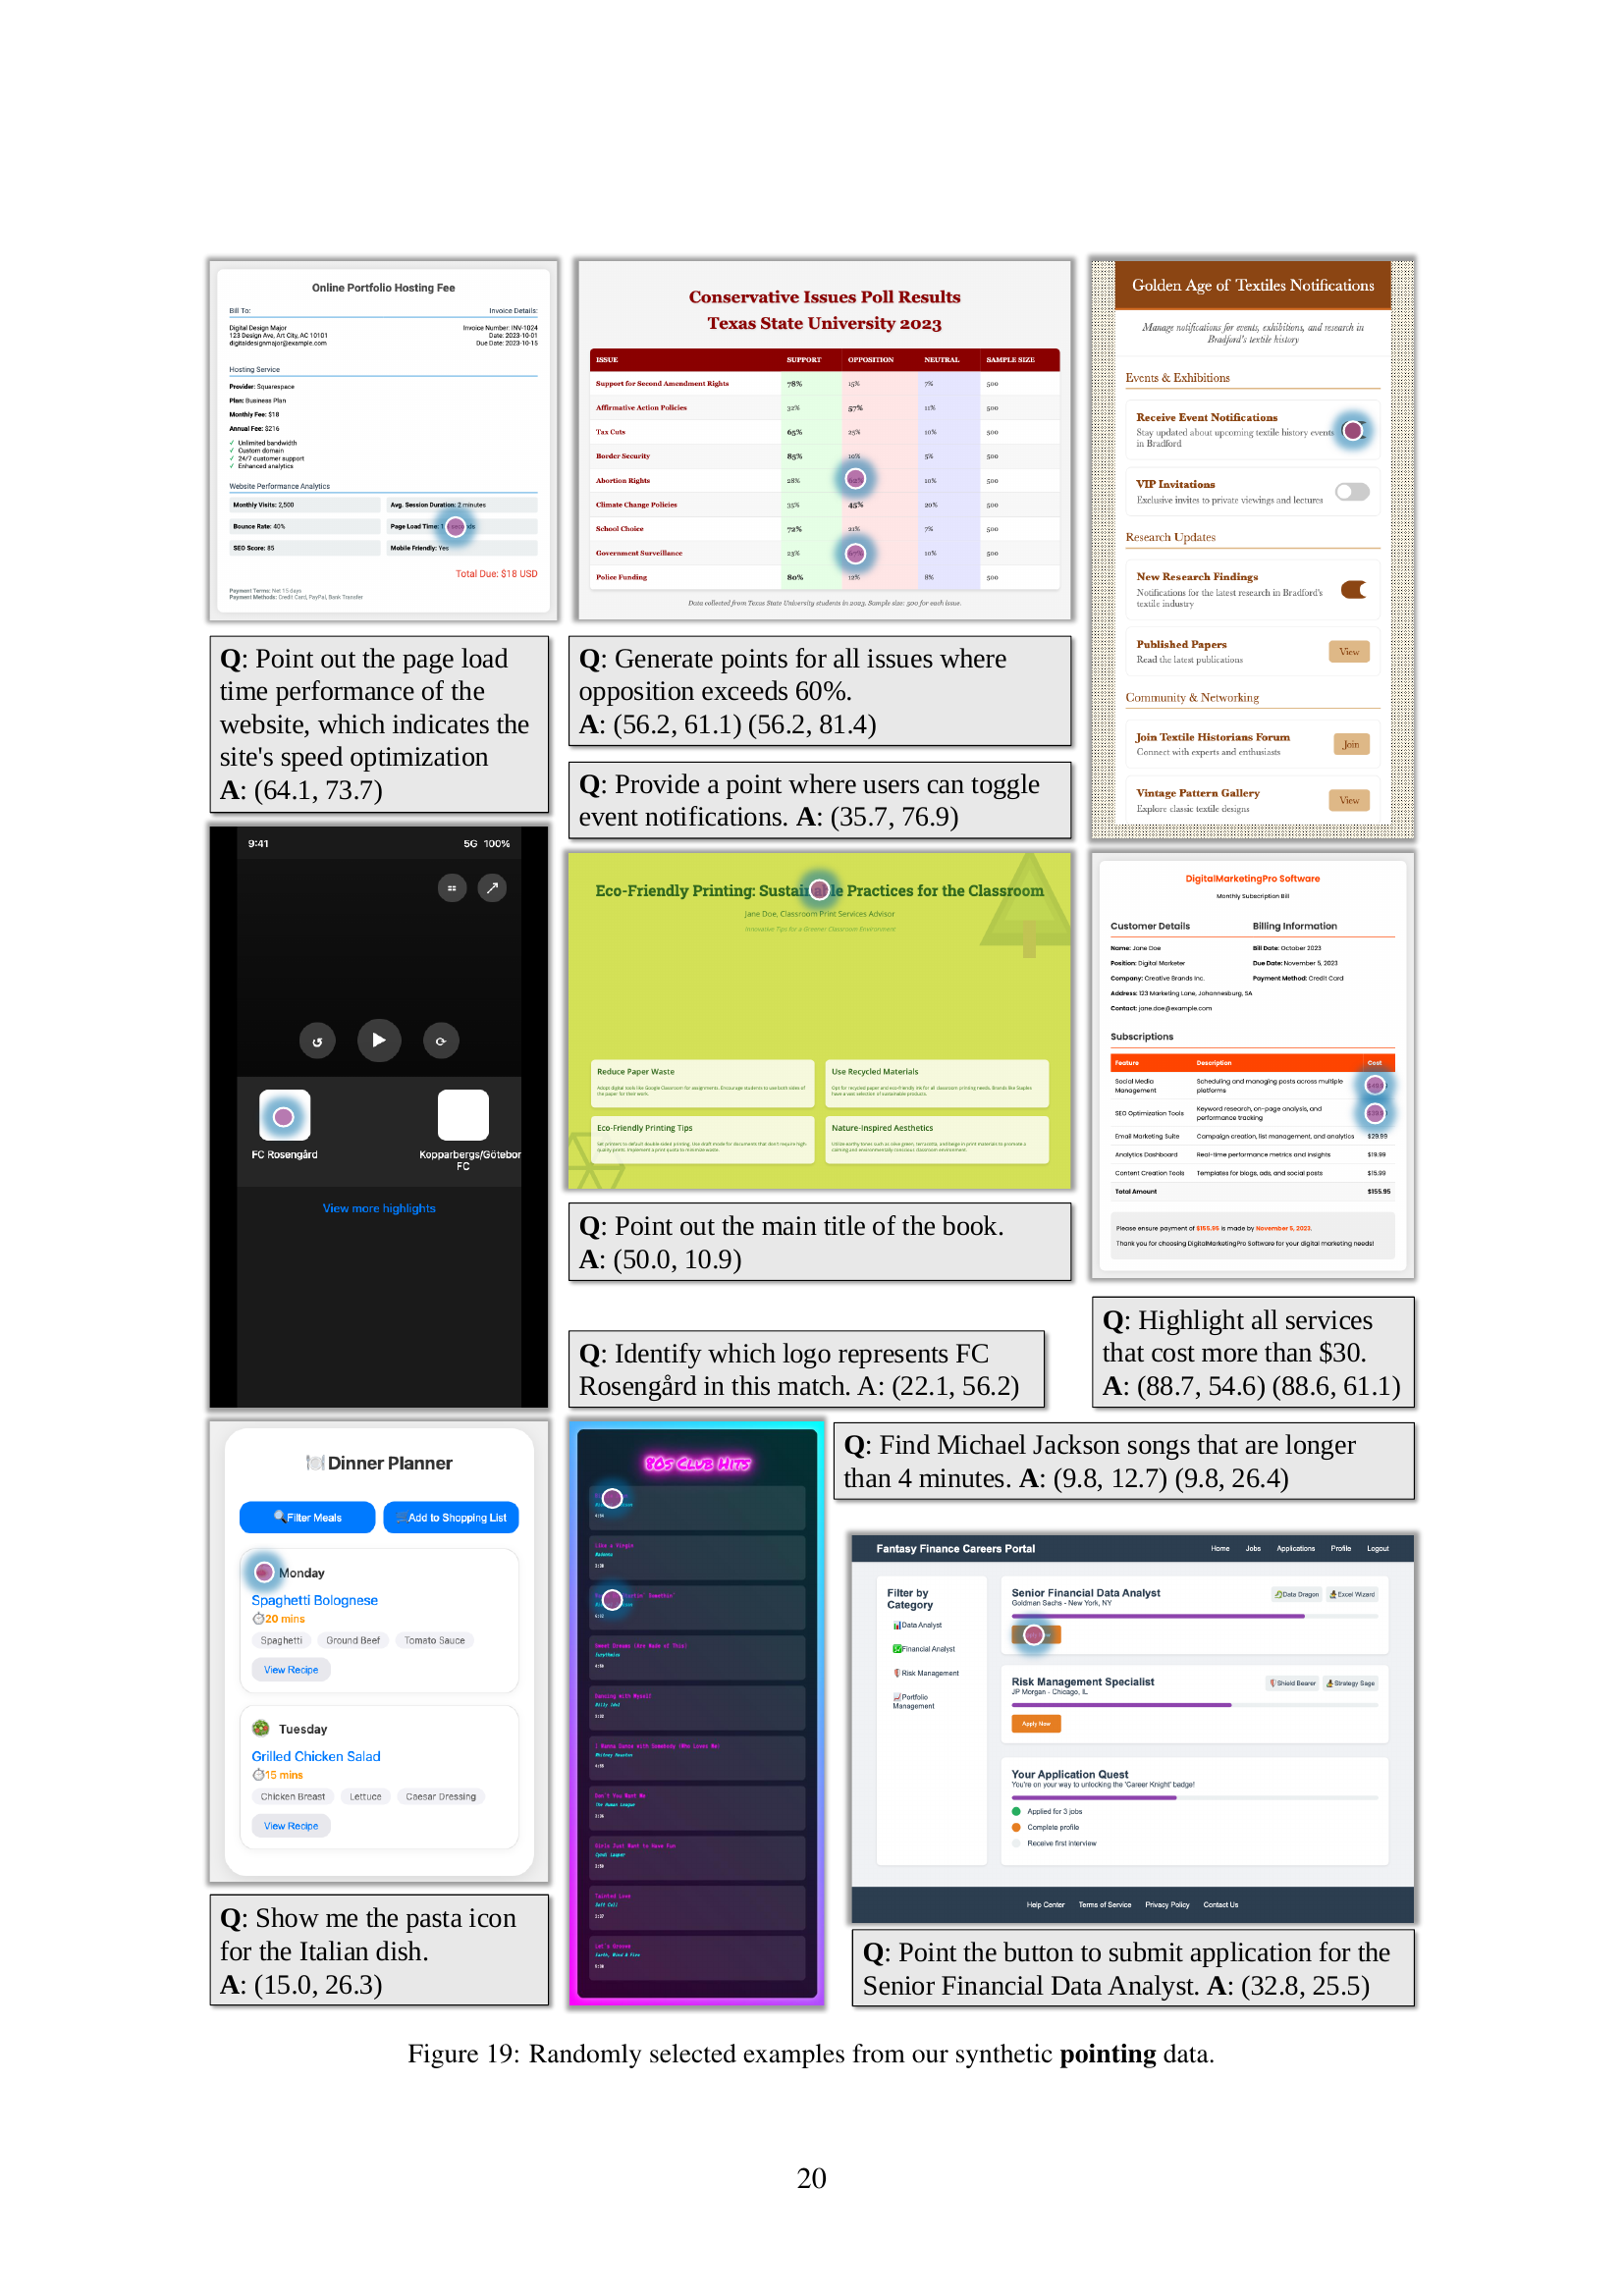
Pointing Agents#
While not explicitly discussed, the paper implicitly touches on pointing agents through its exploration of multimodal understanding and code-guided synthetic data generation. CoSyn’s ability to create synthetic pointing data, as seen in the ScreenSpot experiments, suggests its potential for training agents that can interact with and ground themselves in visual environments. This highlights the framework’s value in developing agents capable of performing tasks such as object recognition, navigation, and decision-making based on visual cues, opening avenues for real-world applications like robotics and autonomous systems.
More visual insights#
More on figures

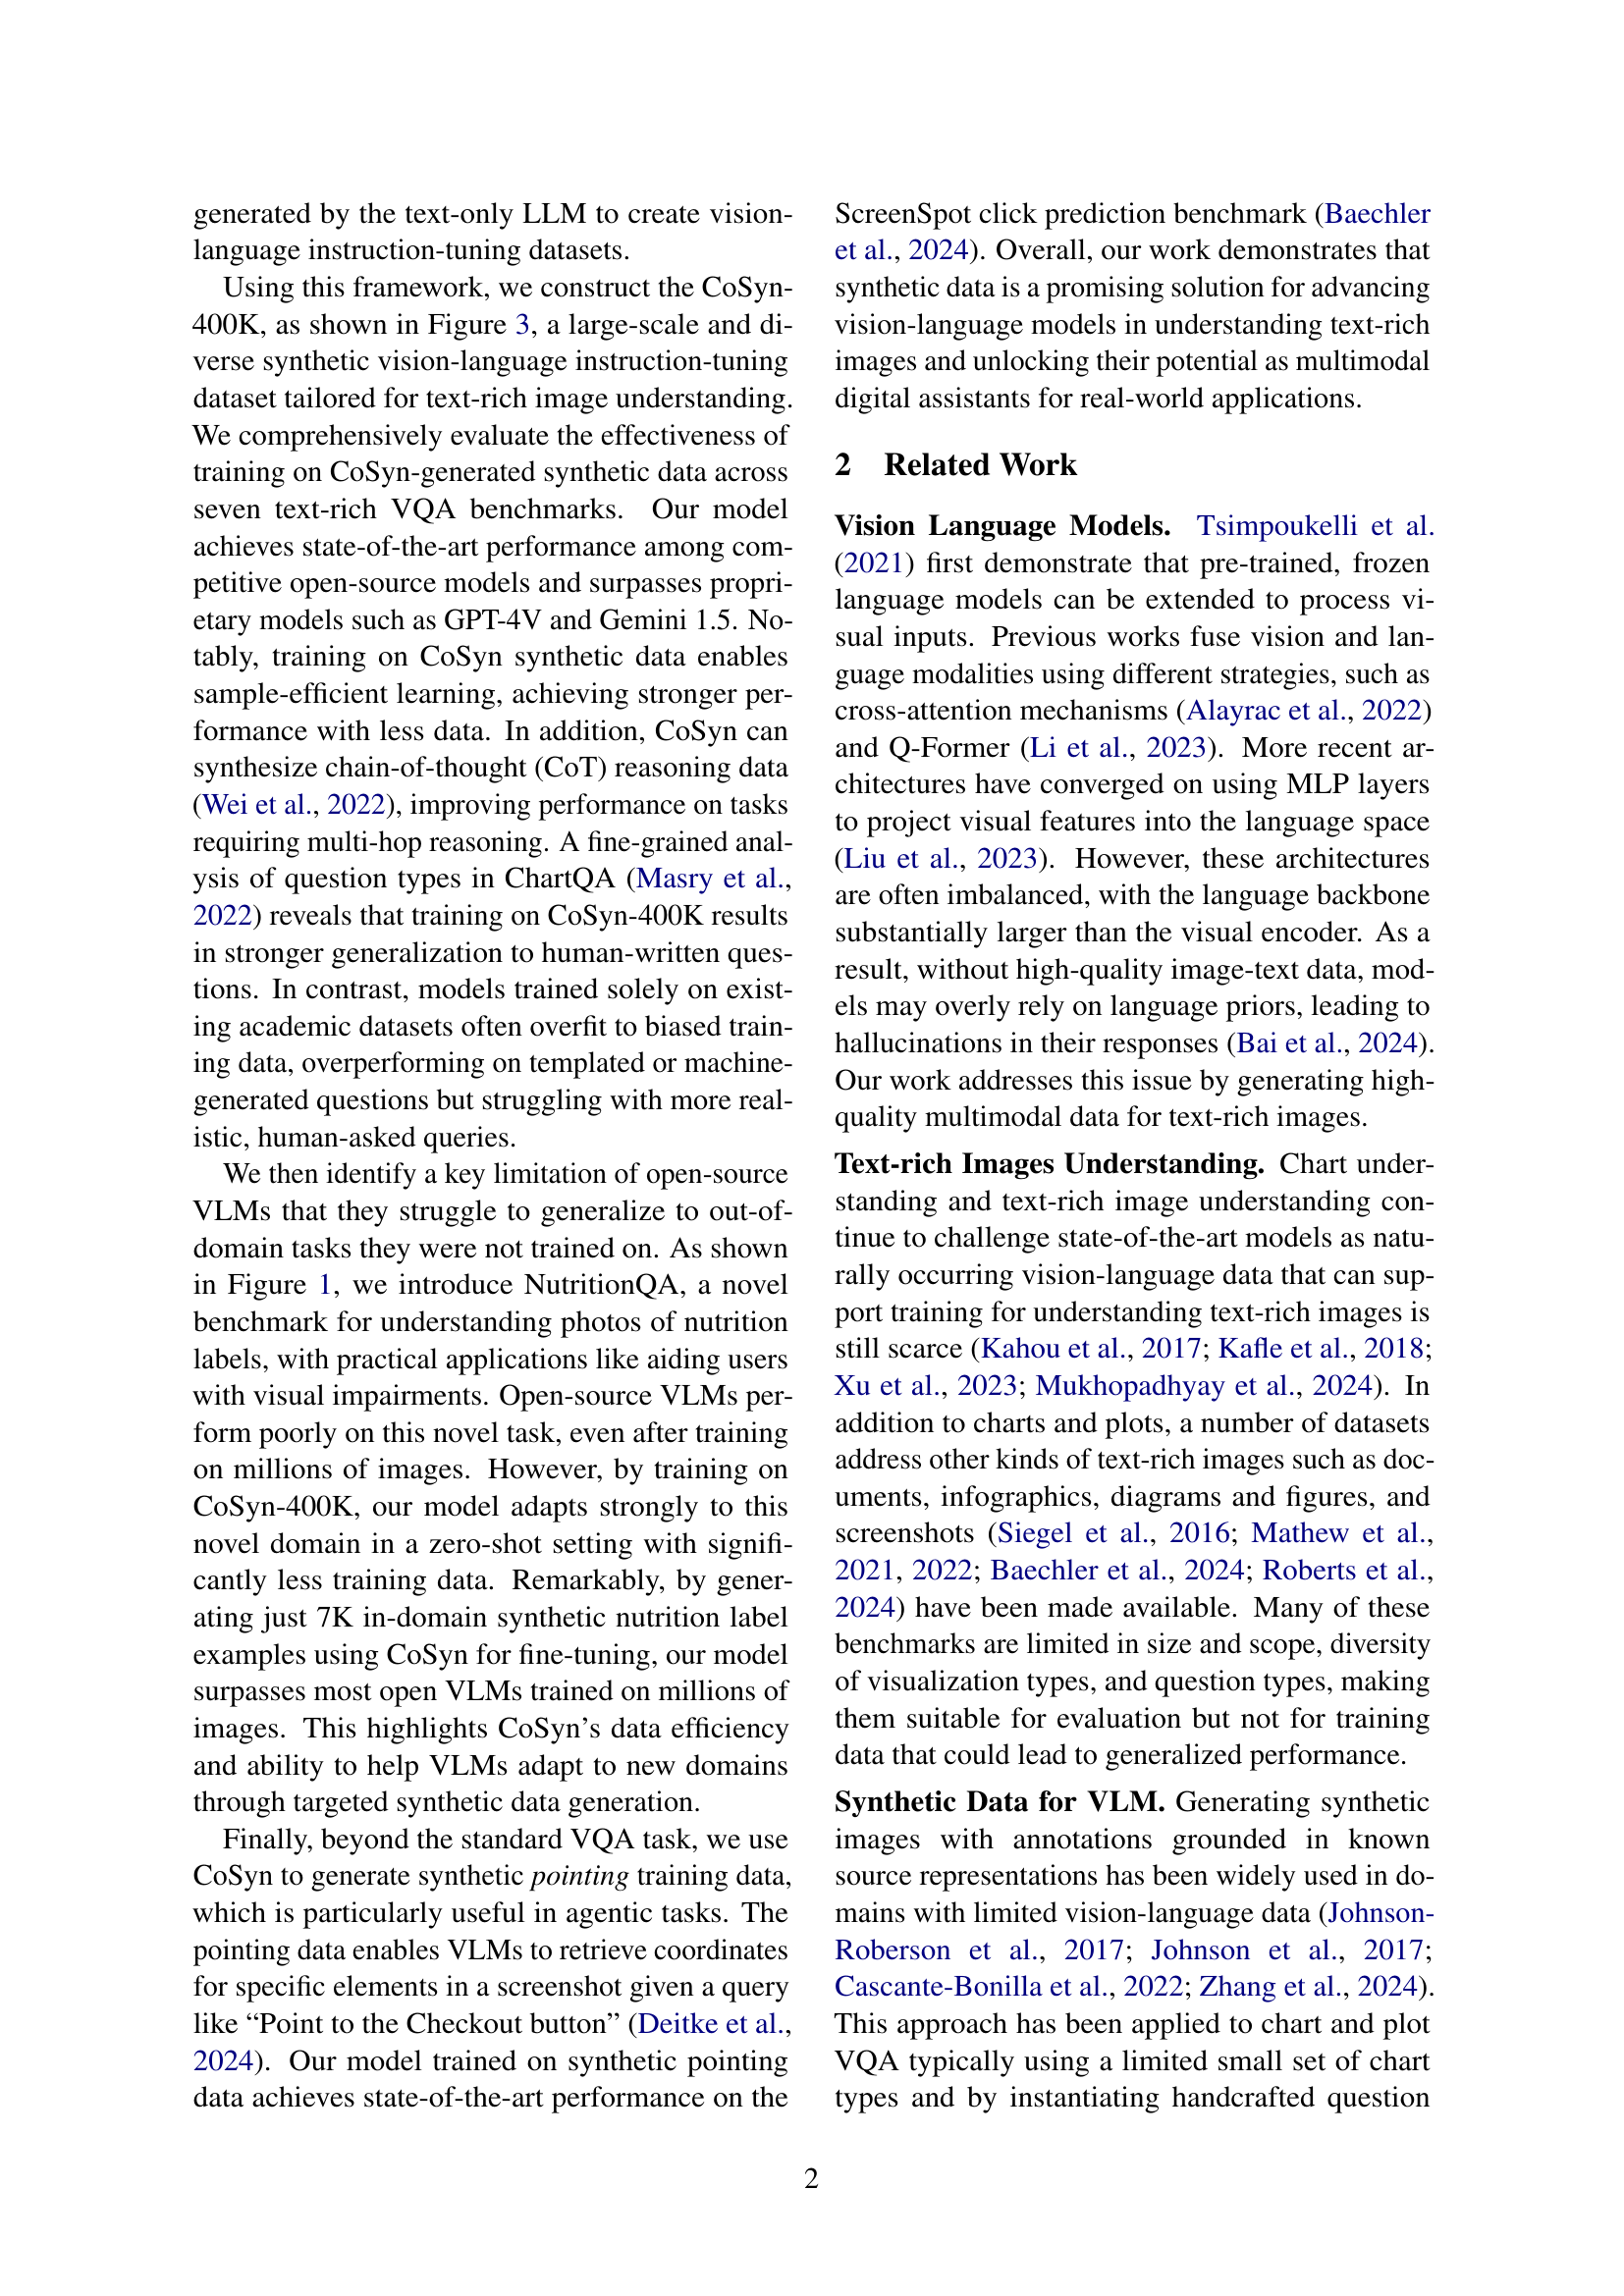
🔼 This figure illustrates the CoSyn system, a code-guided synthetic data generation system. CoSyn uses a user query (e.g., ‘book cover’) to trigger a series of steps. First, it selects relevant pipelines from a total of 20 available, each using one of 11 different rendering tools (like Python, HTML, or LaTeX). Then, it generates diverse topics tailored to the query and conditioned on various personas. Next, detailed data is created, which is then converted into code. This code is executed to generate synthetic text-rich images, and this code itself is used as input for a large language model (LLM) to generate the corresponding textual instruction-tuning data. Thus, CoSyn produces synthetic multimodal data (images and textual instructions) for training vision-language models (VLMs).
read the caption
Figure 2: The overview of our Code Guided Synthetic data generation system (CoSyn), which has 20 generation pipelines based on 11 render tools. Given a user query, e.g., “book cover,” CoSyn selects the appropriate pipelines and starts with generating diverse topics conditioned on personas, then synthesizes detailed data for code generation. The code renders the image and is also fed as context for an LLM to construct instruction-tuning data.

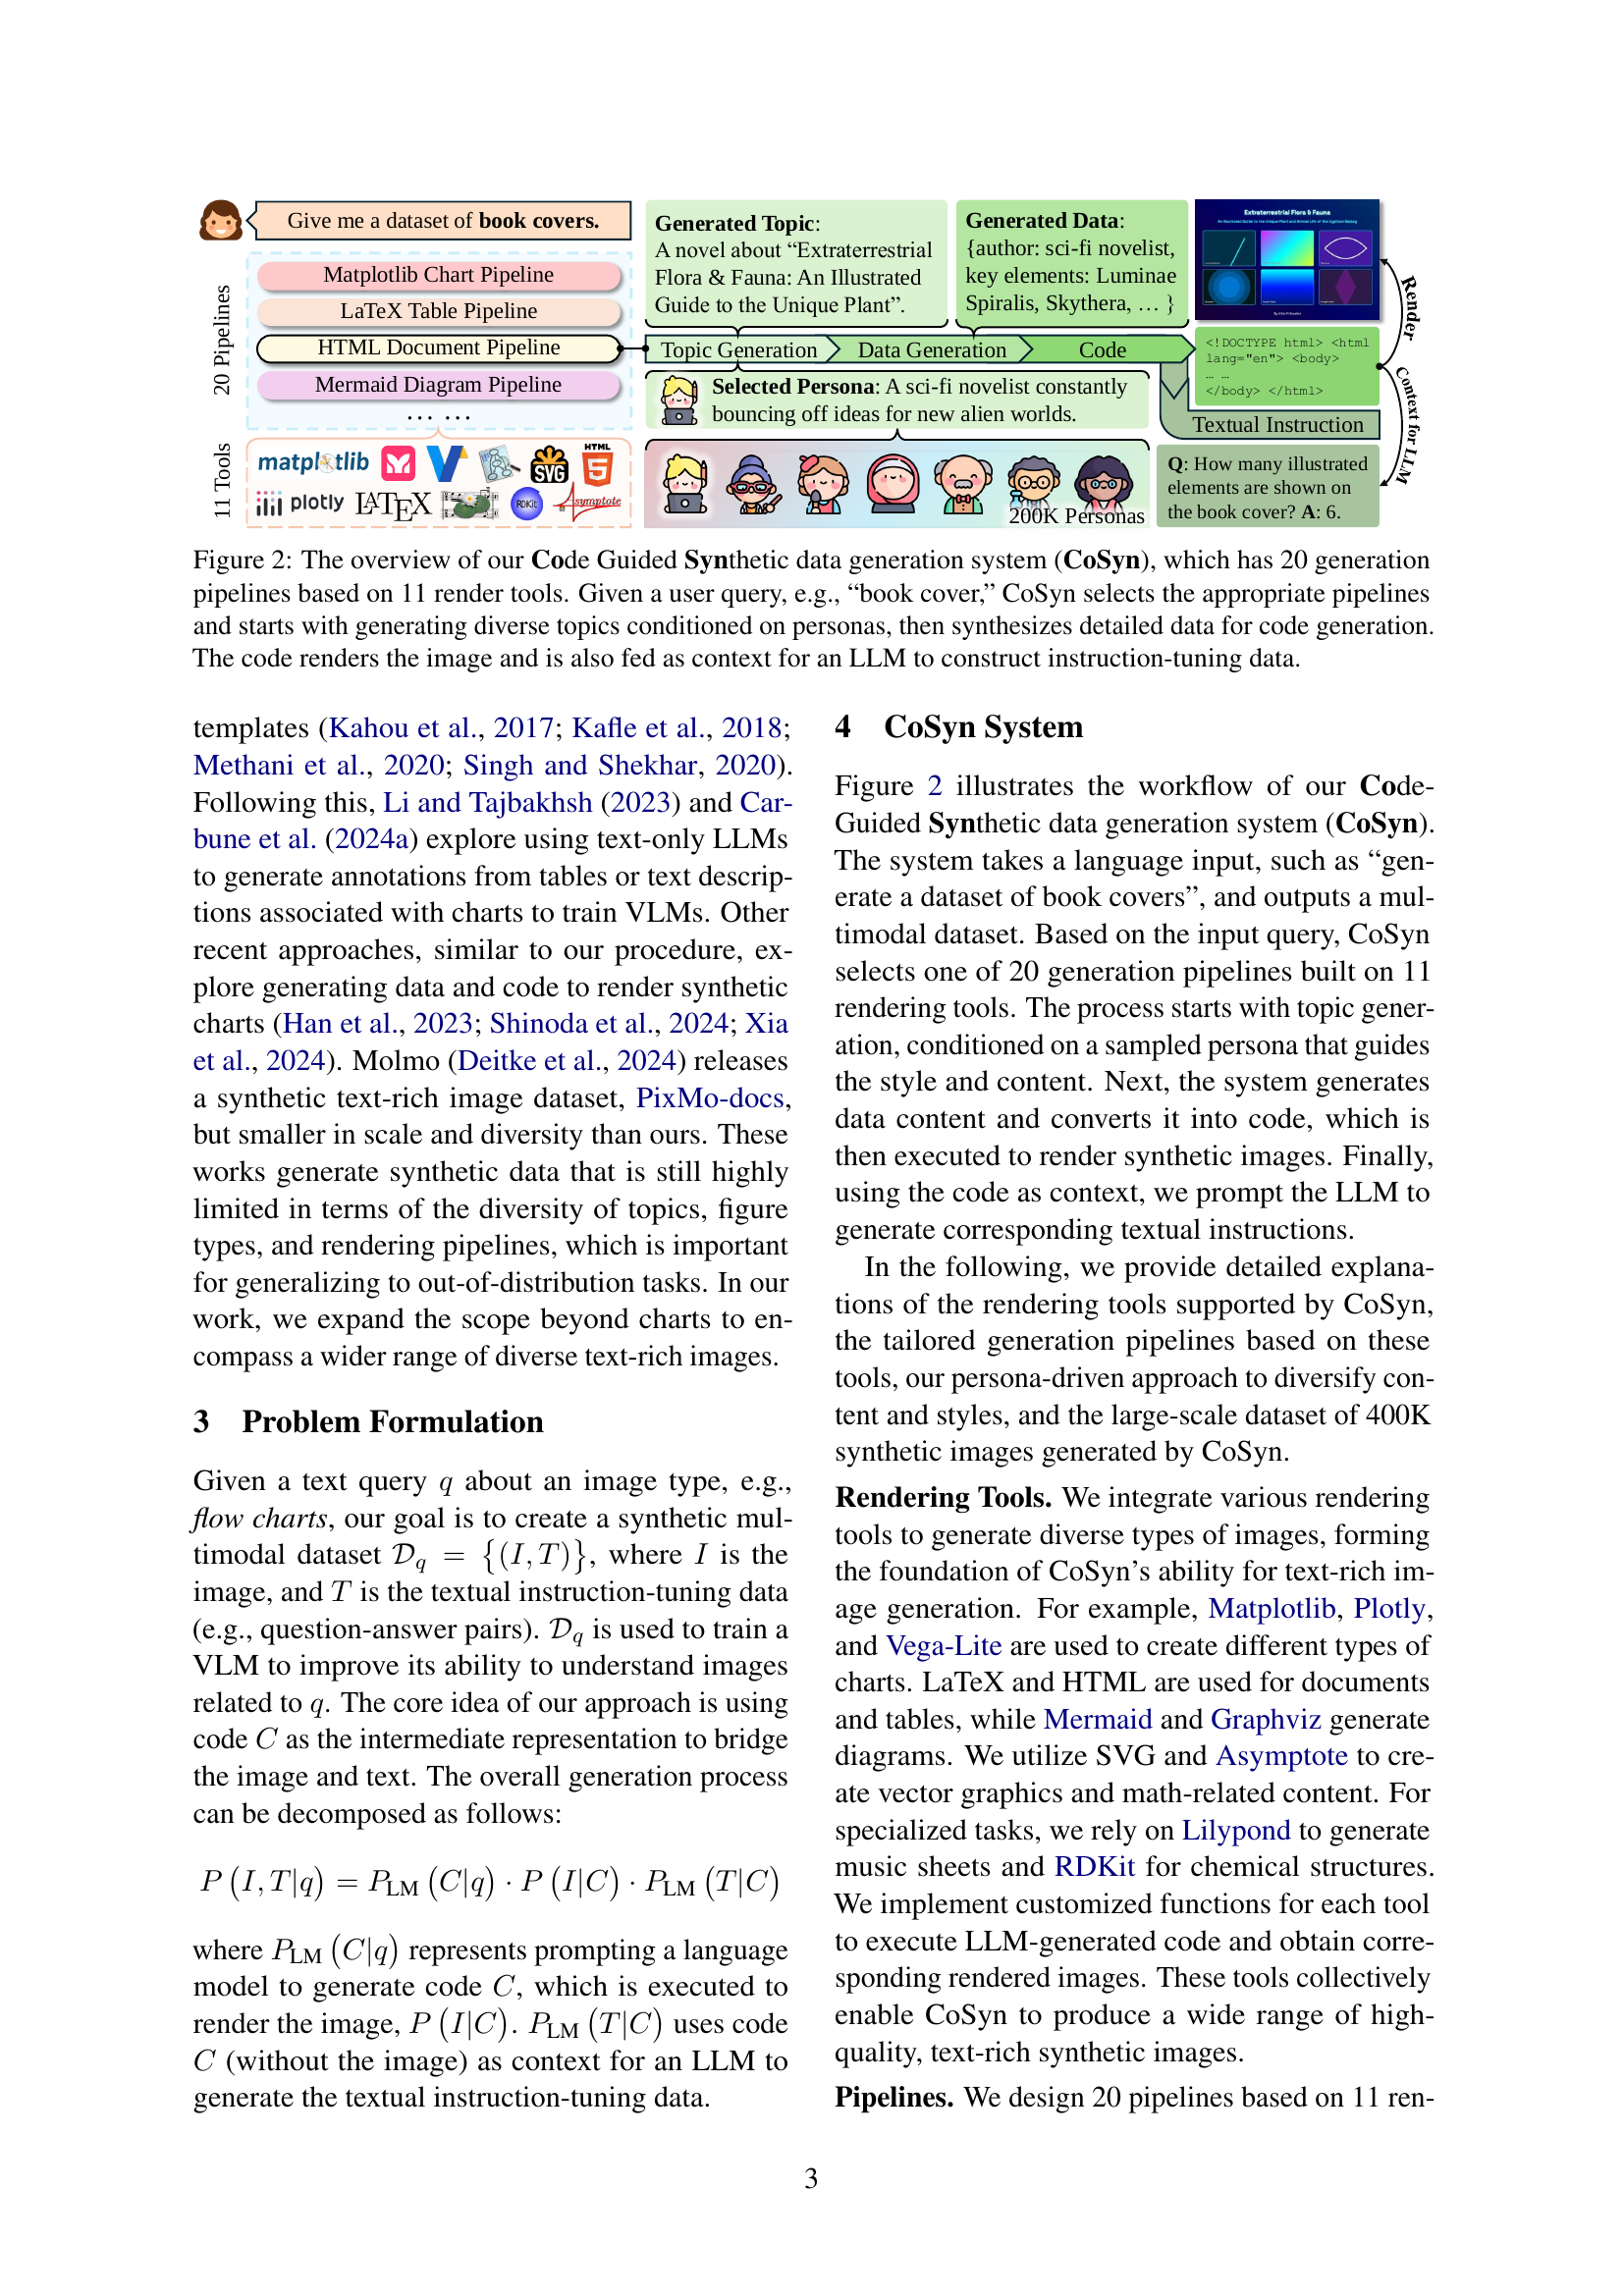
🔼 The figure shows a breakdown of the CoSyn-400K dataset, a large-scale synthetic dataset created using the CoSyn framework. It highlights the dataset’s composition of 9 distinct categories of text-rich images, each including a substantial number of image-text pairs suitable for instruction tuning. The figure visually represents the categories and their respective image counts, emphasizing the dataset’s diversity and scale (400,000 images and 2.7 million instruction-tuning data points). It also notes that further qualitative examples with question-answer annotations are provided in Appendix C (Figures 12-18).
read the caption
Figure 3: Our CoSyn-400K dataset consists of 9 categories of text-rich images with 2.7M instruction-tuning data. More qualitative examples, along with question-answer annotations, are available in Figure 12 -18 in Appendix C.

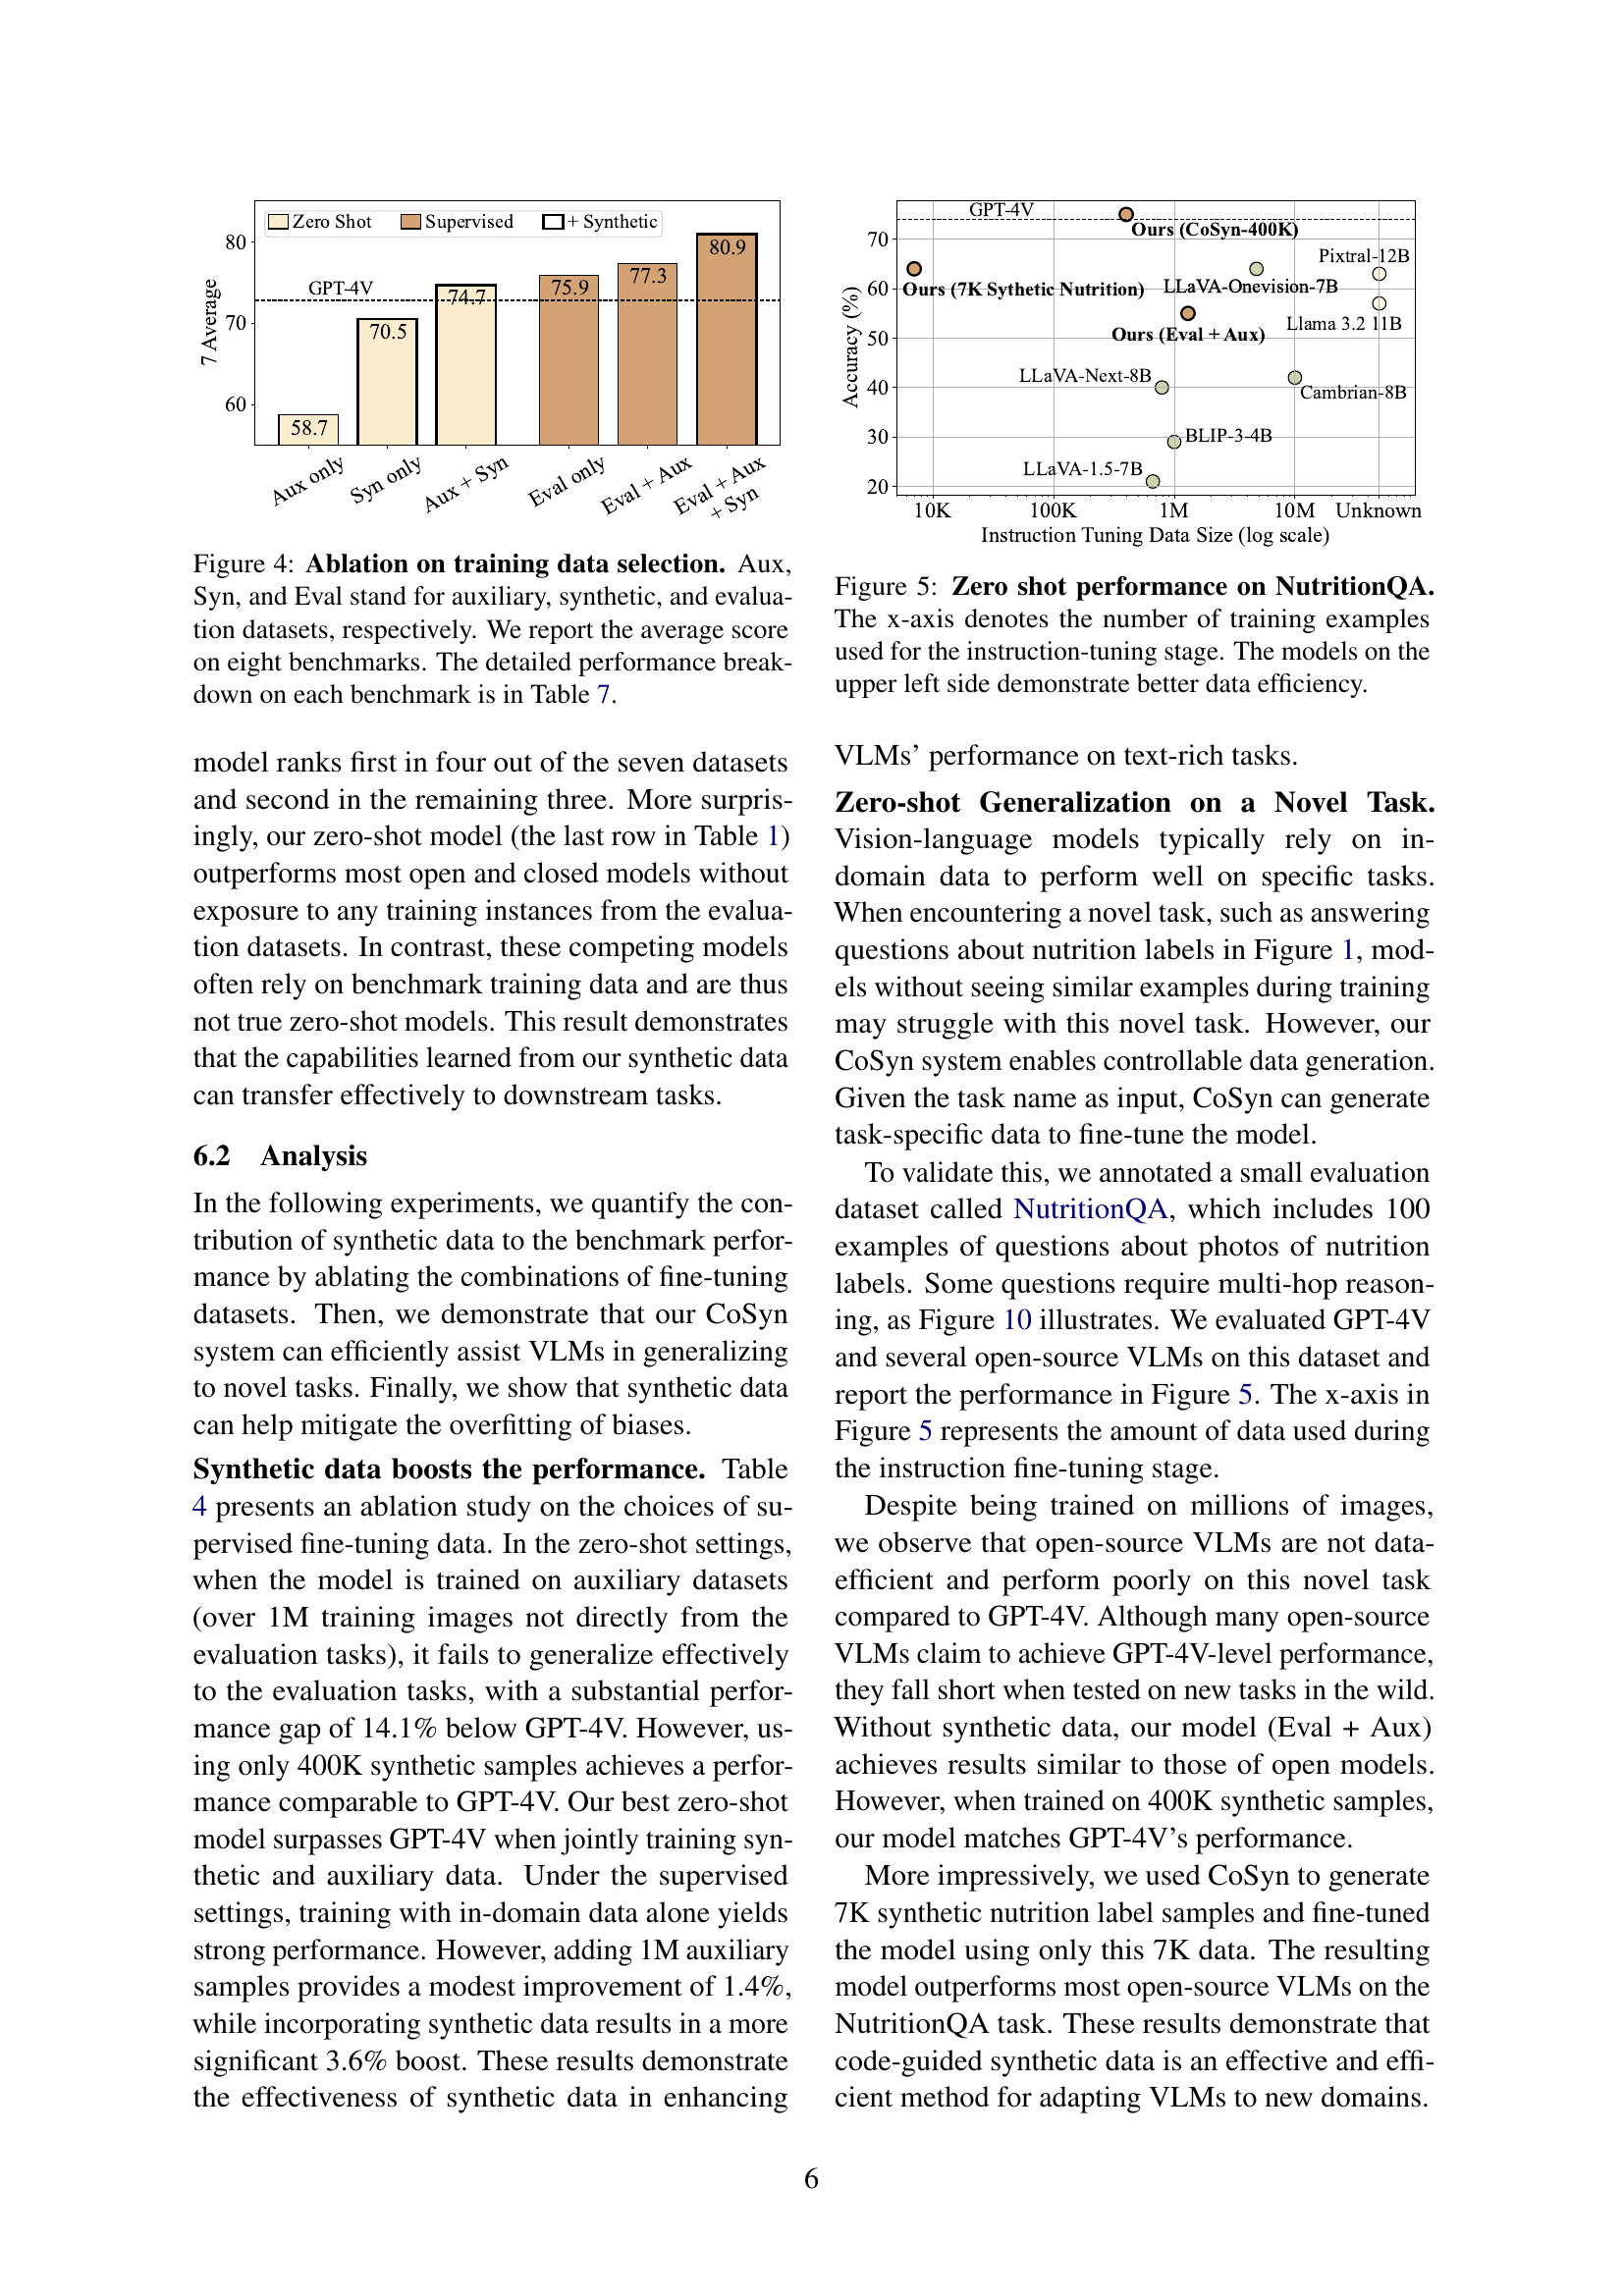
🔼 This ablation study investigates the impact of different training data combinations on model performance. The model was trained using three types of datasets: auxiliary datasets (large, general-purpose multimodal data), synthetic datasets generated by the CoSyn method (text-rich images), and evaluation datasets (smaller, benchmark datasets). The figure displays the average performance across eight different benchmarks, comparing models trained with various combinations of these three data types. This allows assessment of the individual contribution and interactions of each type of dataset on the model’s final accuracy. More detailed results for individual benchmarks are provided in Table 7.
read the caption
Figure 4: Ablation on training data selection. Aux, Syn, and Eval stand for auxiliary, synthetic, and evaluation datasets, respectively. We report the average score on eight benchmarks. The detailed performance breakdown on each benchmark is in Table 7.

🔼 This figure demonstrates the zero-shot performance of various vision-language models (VLMs) on the NutritionQA benchmark. The x-axis shows the amount of instruction-tuning data (number of training examples) used to fine-tune each model. The y-axis represents the accuracy achieved on NutritionQA. The models in the upper left corner show superior data efficiency, achieving high accuracy with significantly less training data compared to the other models.
read the caption
Figure 5: Zero shot performance on NutritionQA. The x-axis denotes the number of training examples used for the instruction-tuning stage. The models on the upper left side demonstrate better data efficiency.

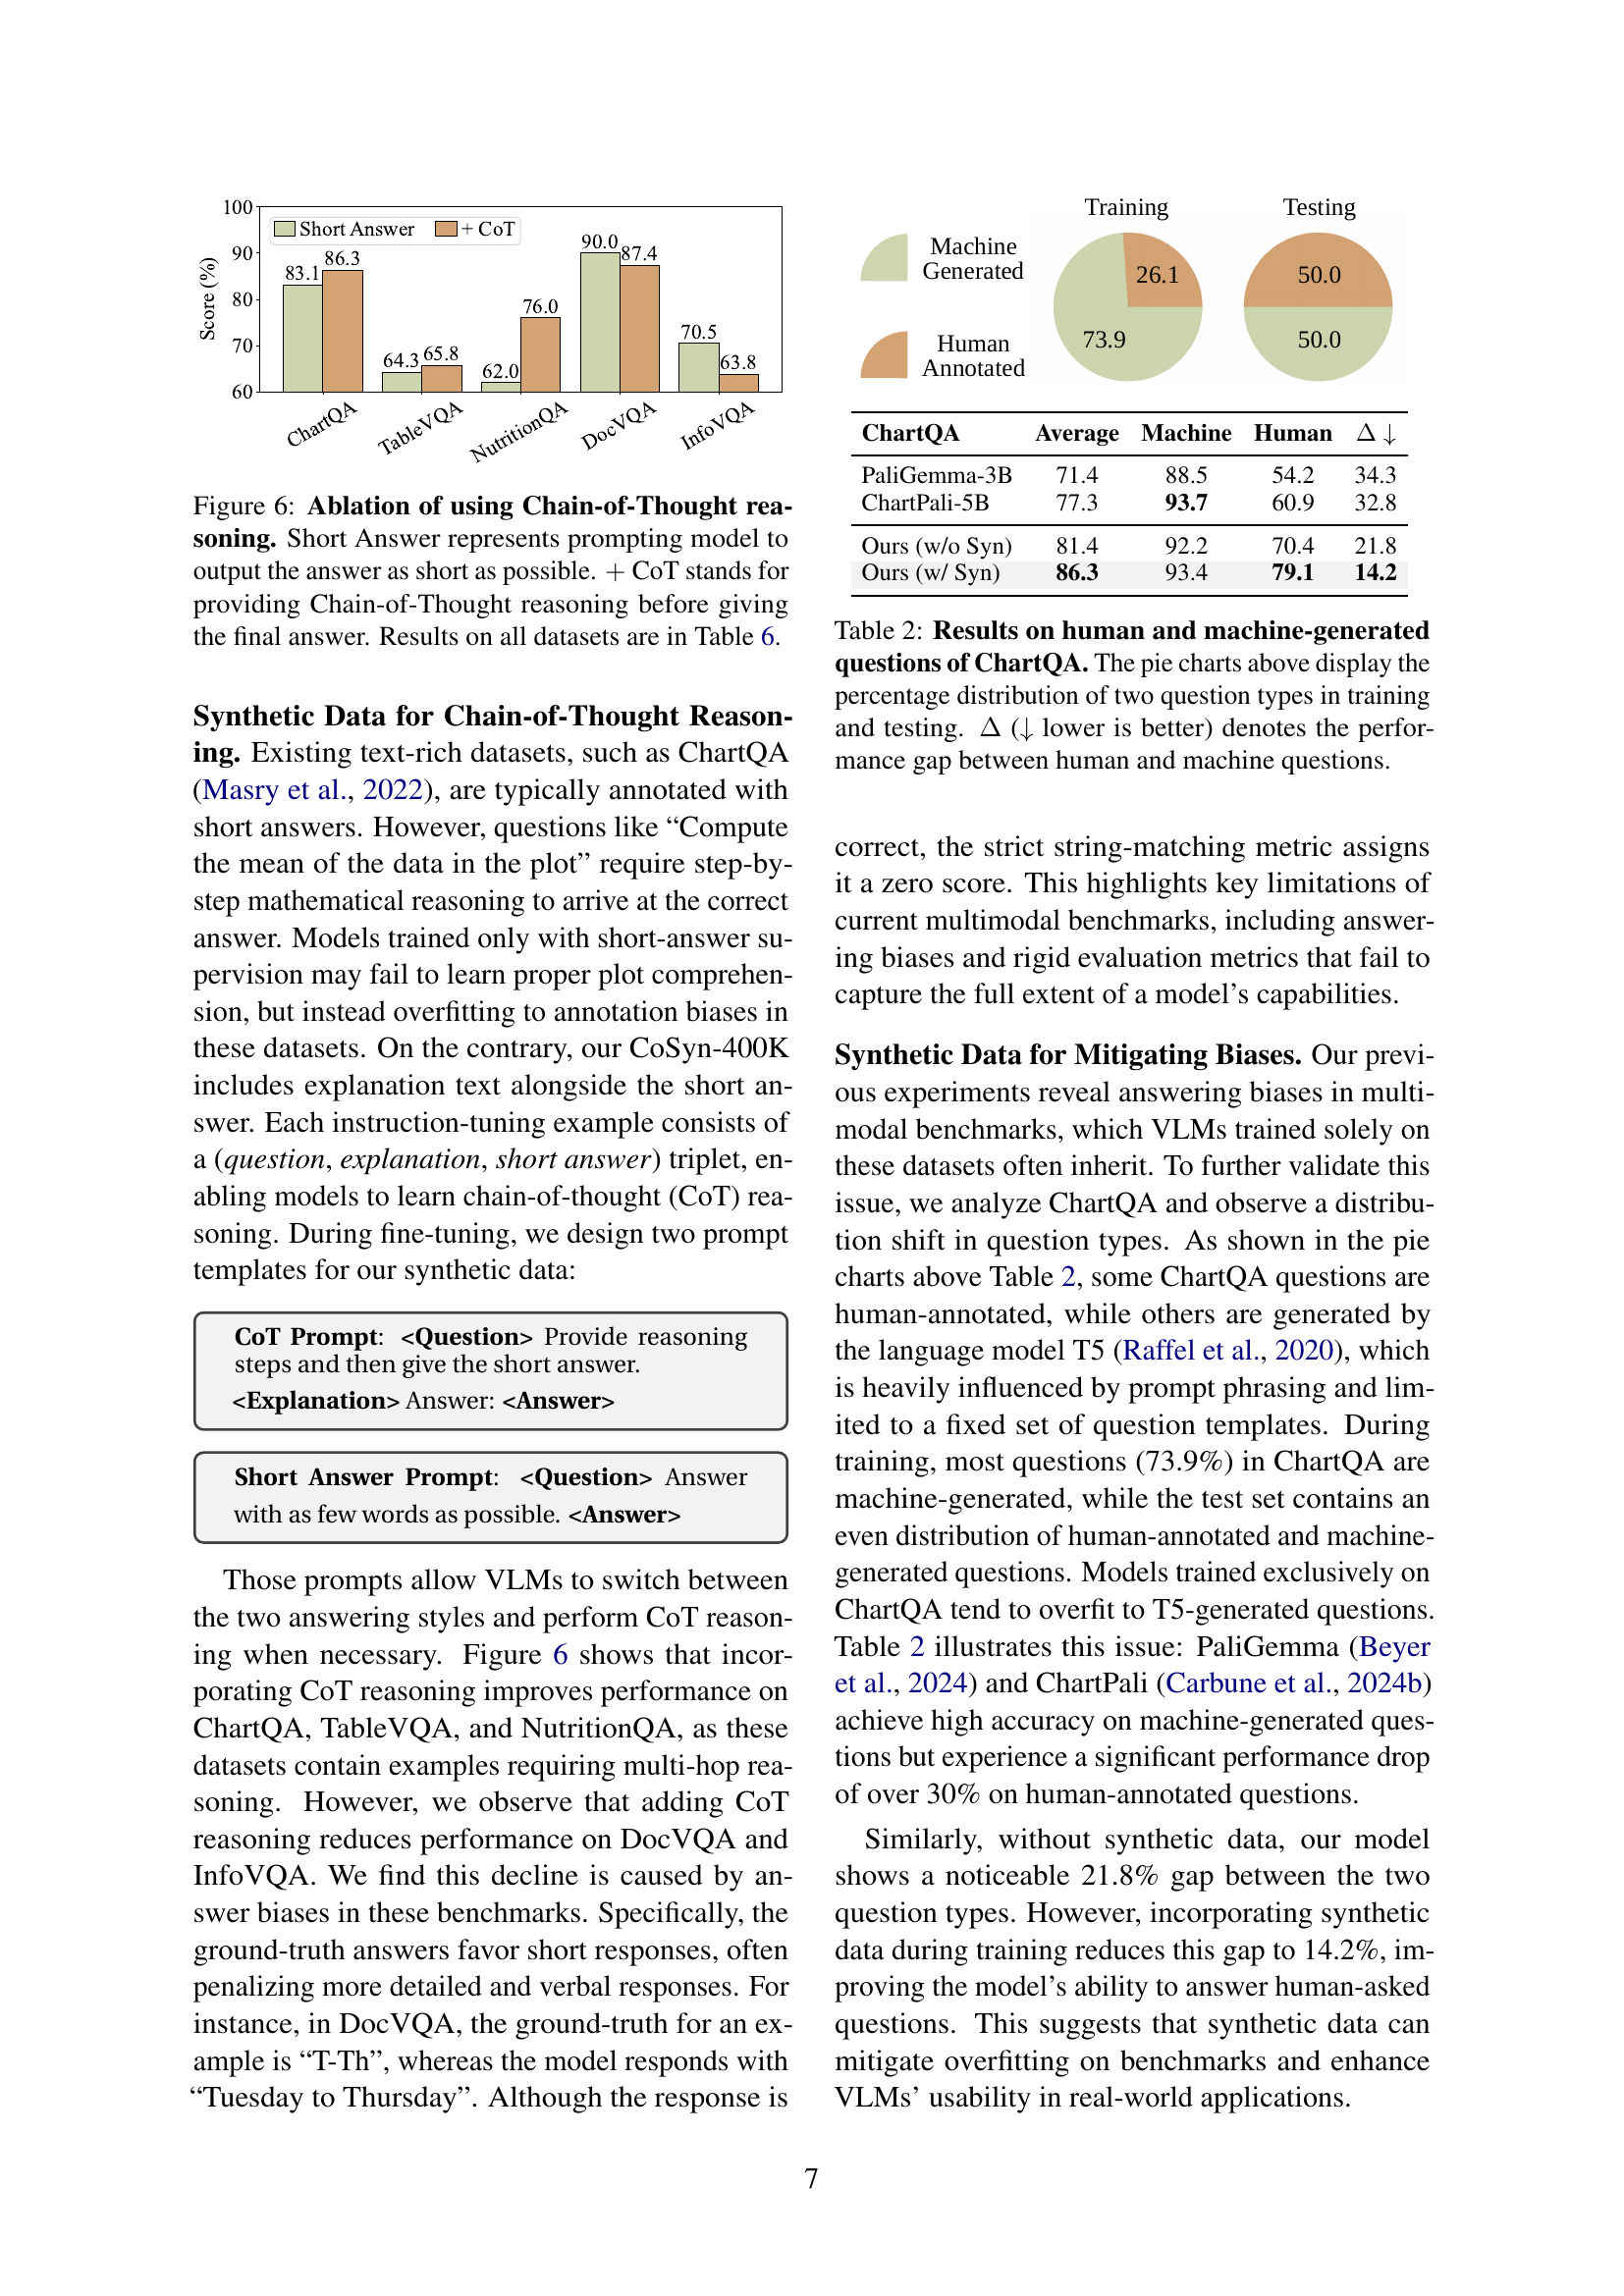
🔼 This figure displays the results of an ablation study comparing the performance of a vision-language model (VLM) using two different prompting methods: ‘Short Answer’ and ‘Chain-of-Thought (CoT)’. The ‘Short Answer’ prompt instructs the model to provide concise answers, while the ‘CoT’ prompt encourages the model to articulate its reasoning process step-by-step before providing the final answer. The bar chart visually represents the performance differences across multiple datasets (ChartQA, DocVQA, InfoVQA, TableVQA, NutritionQA) for each prompting method. The goal is to demonstrate the impact of incorporating chain-of-thought reasoning on the VLM’s accuracy and ability to perform complex reasoning tasks.
read the caption
Figure 6: Ablation of using Chain-of-Thought reasoning. Short Answer represents prompting model to output the answer as short as possible. +++ CoT stands for providing Chain-of-Thought reasoning before giving the final answer. Results on all datasets are in Table 6.

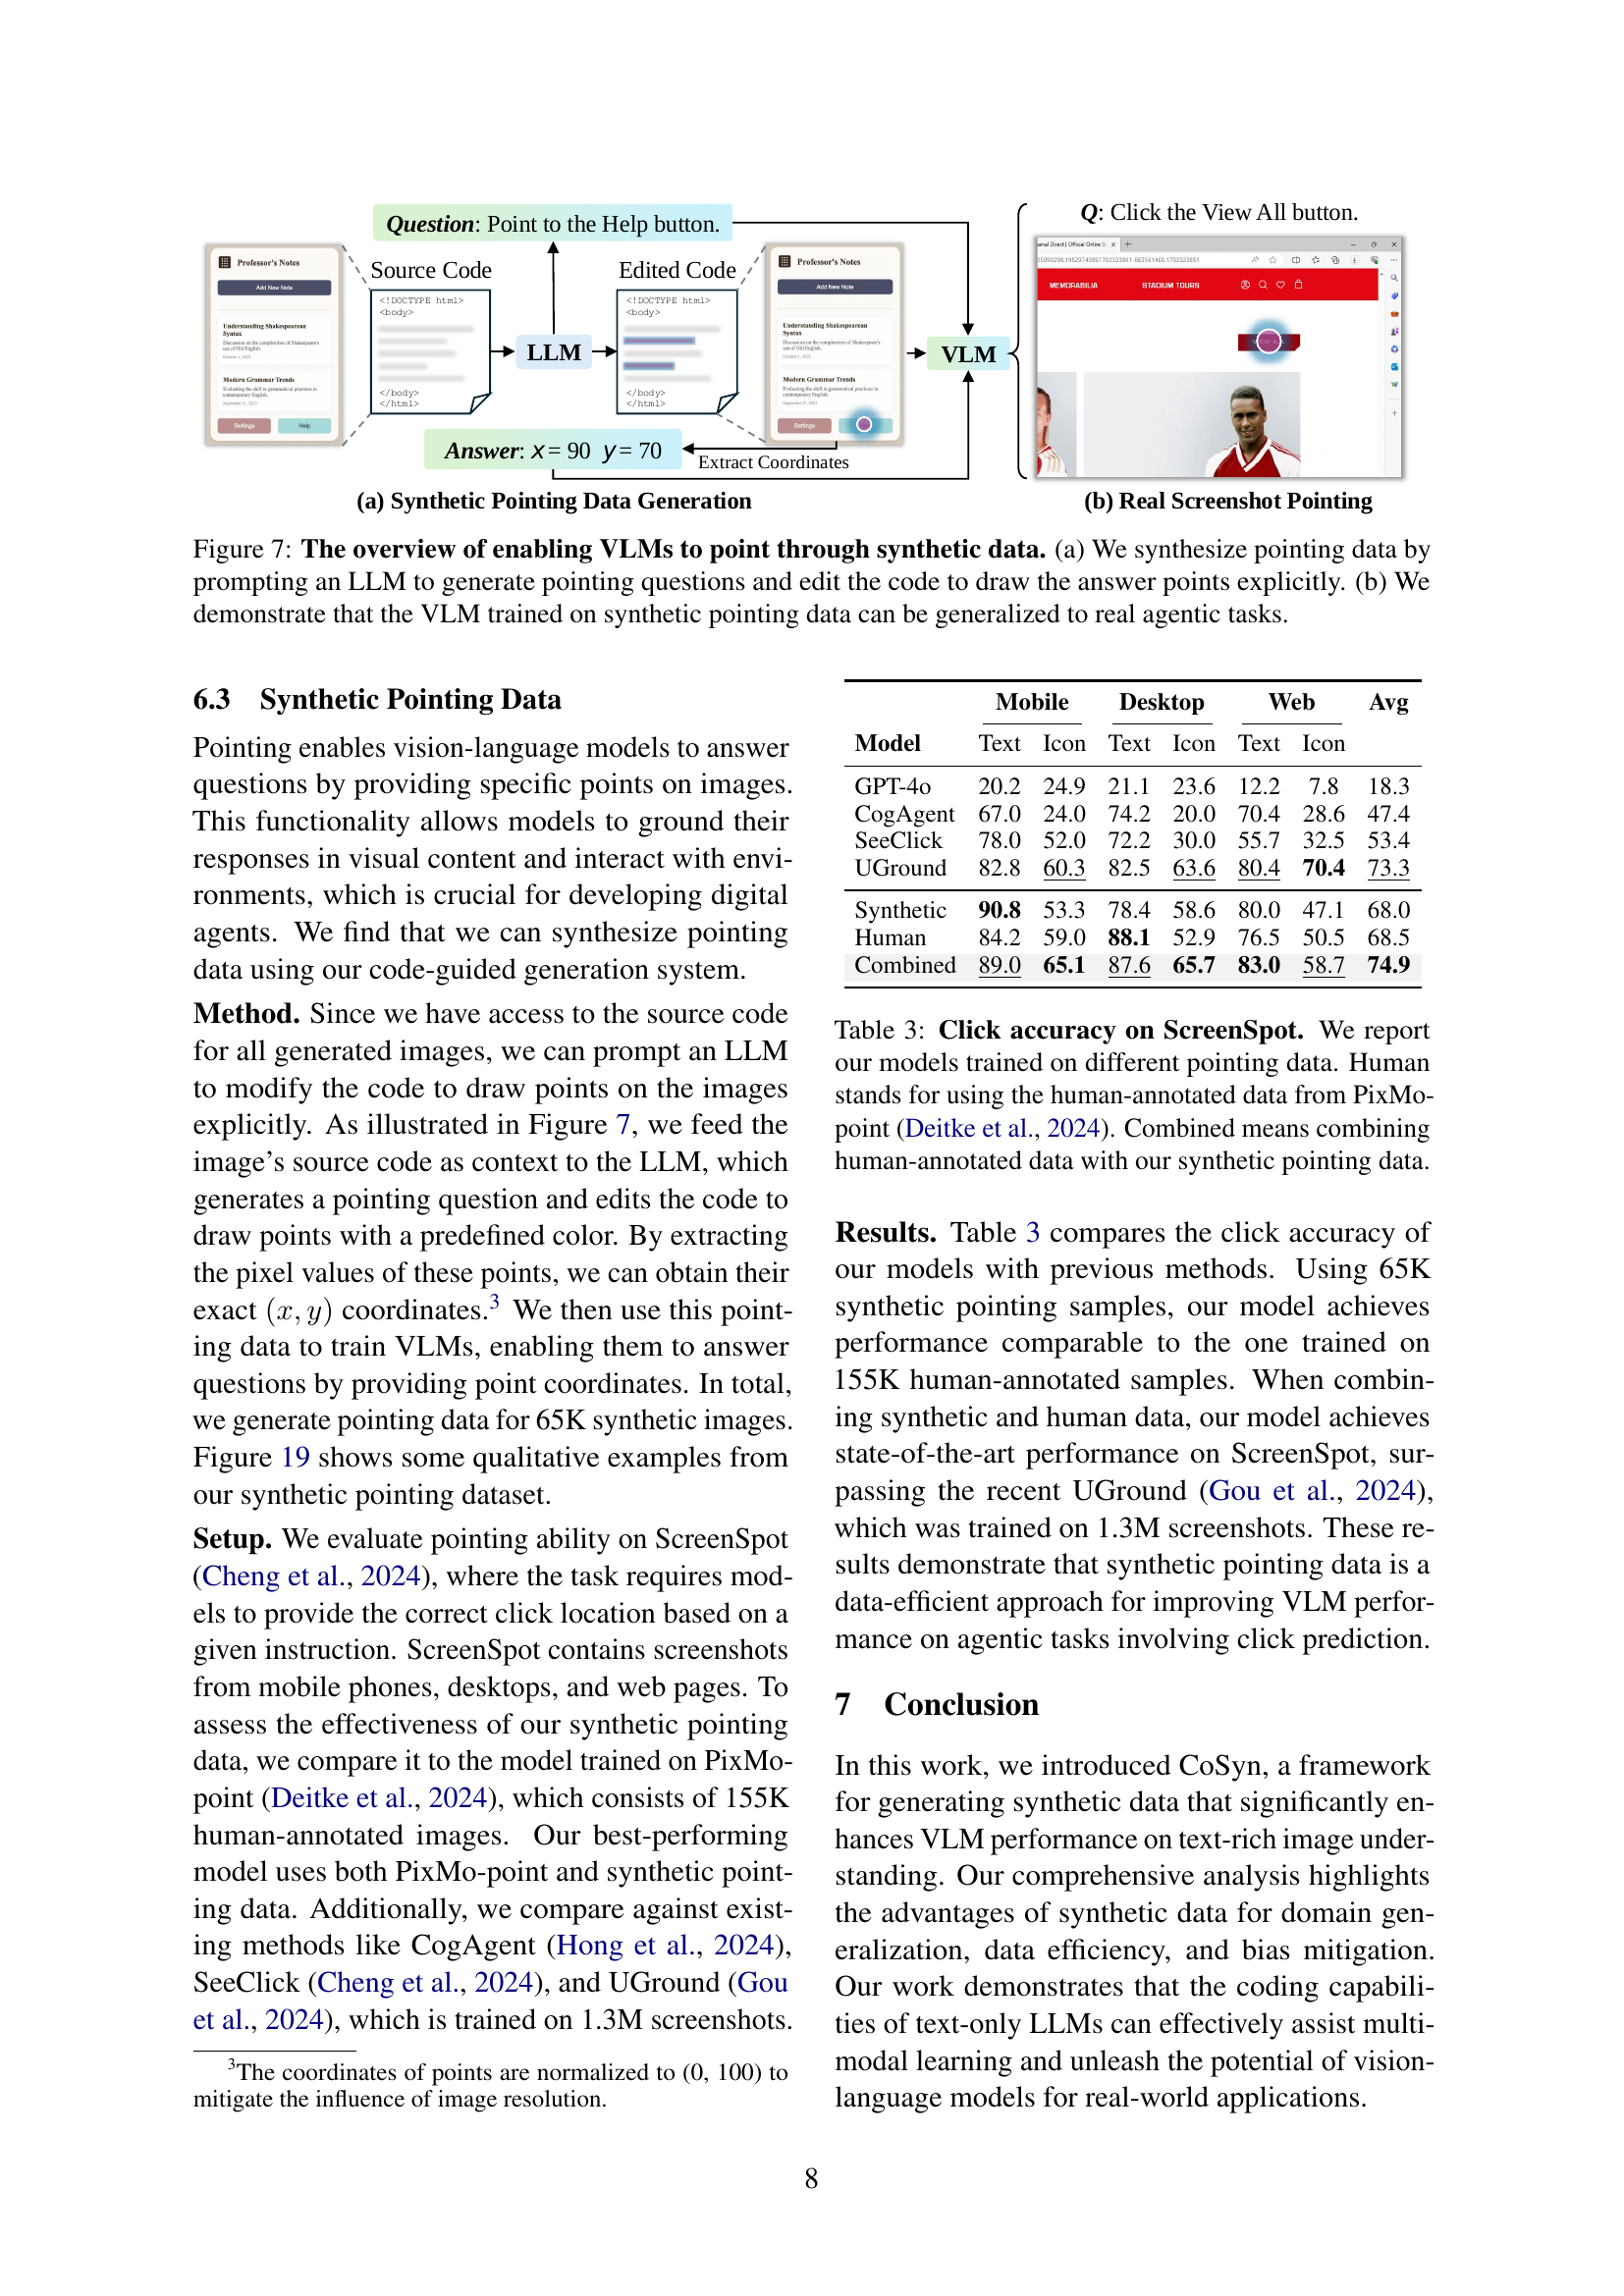
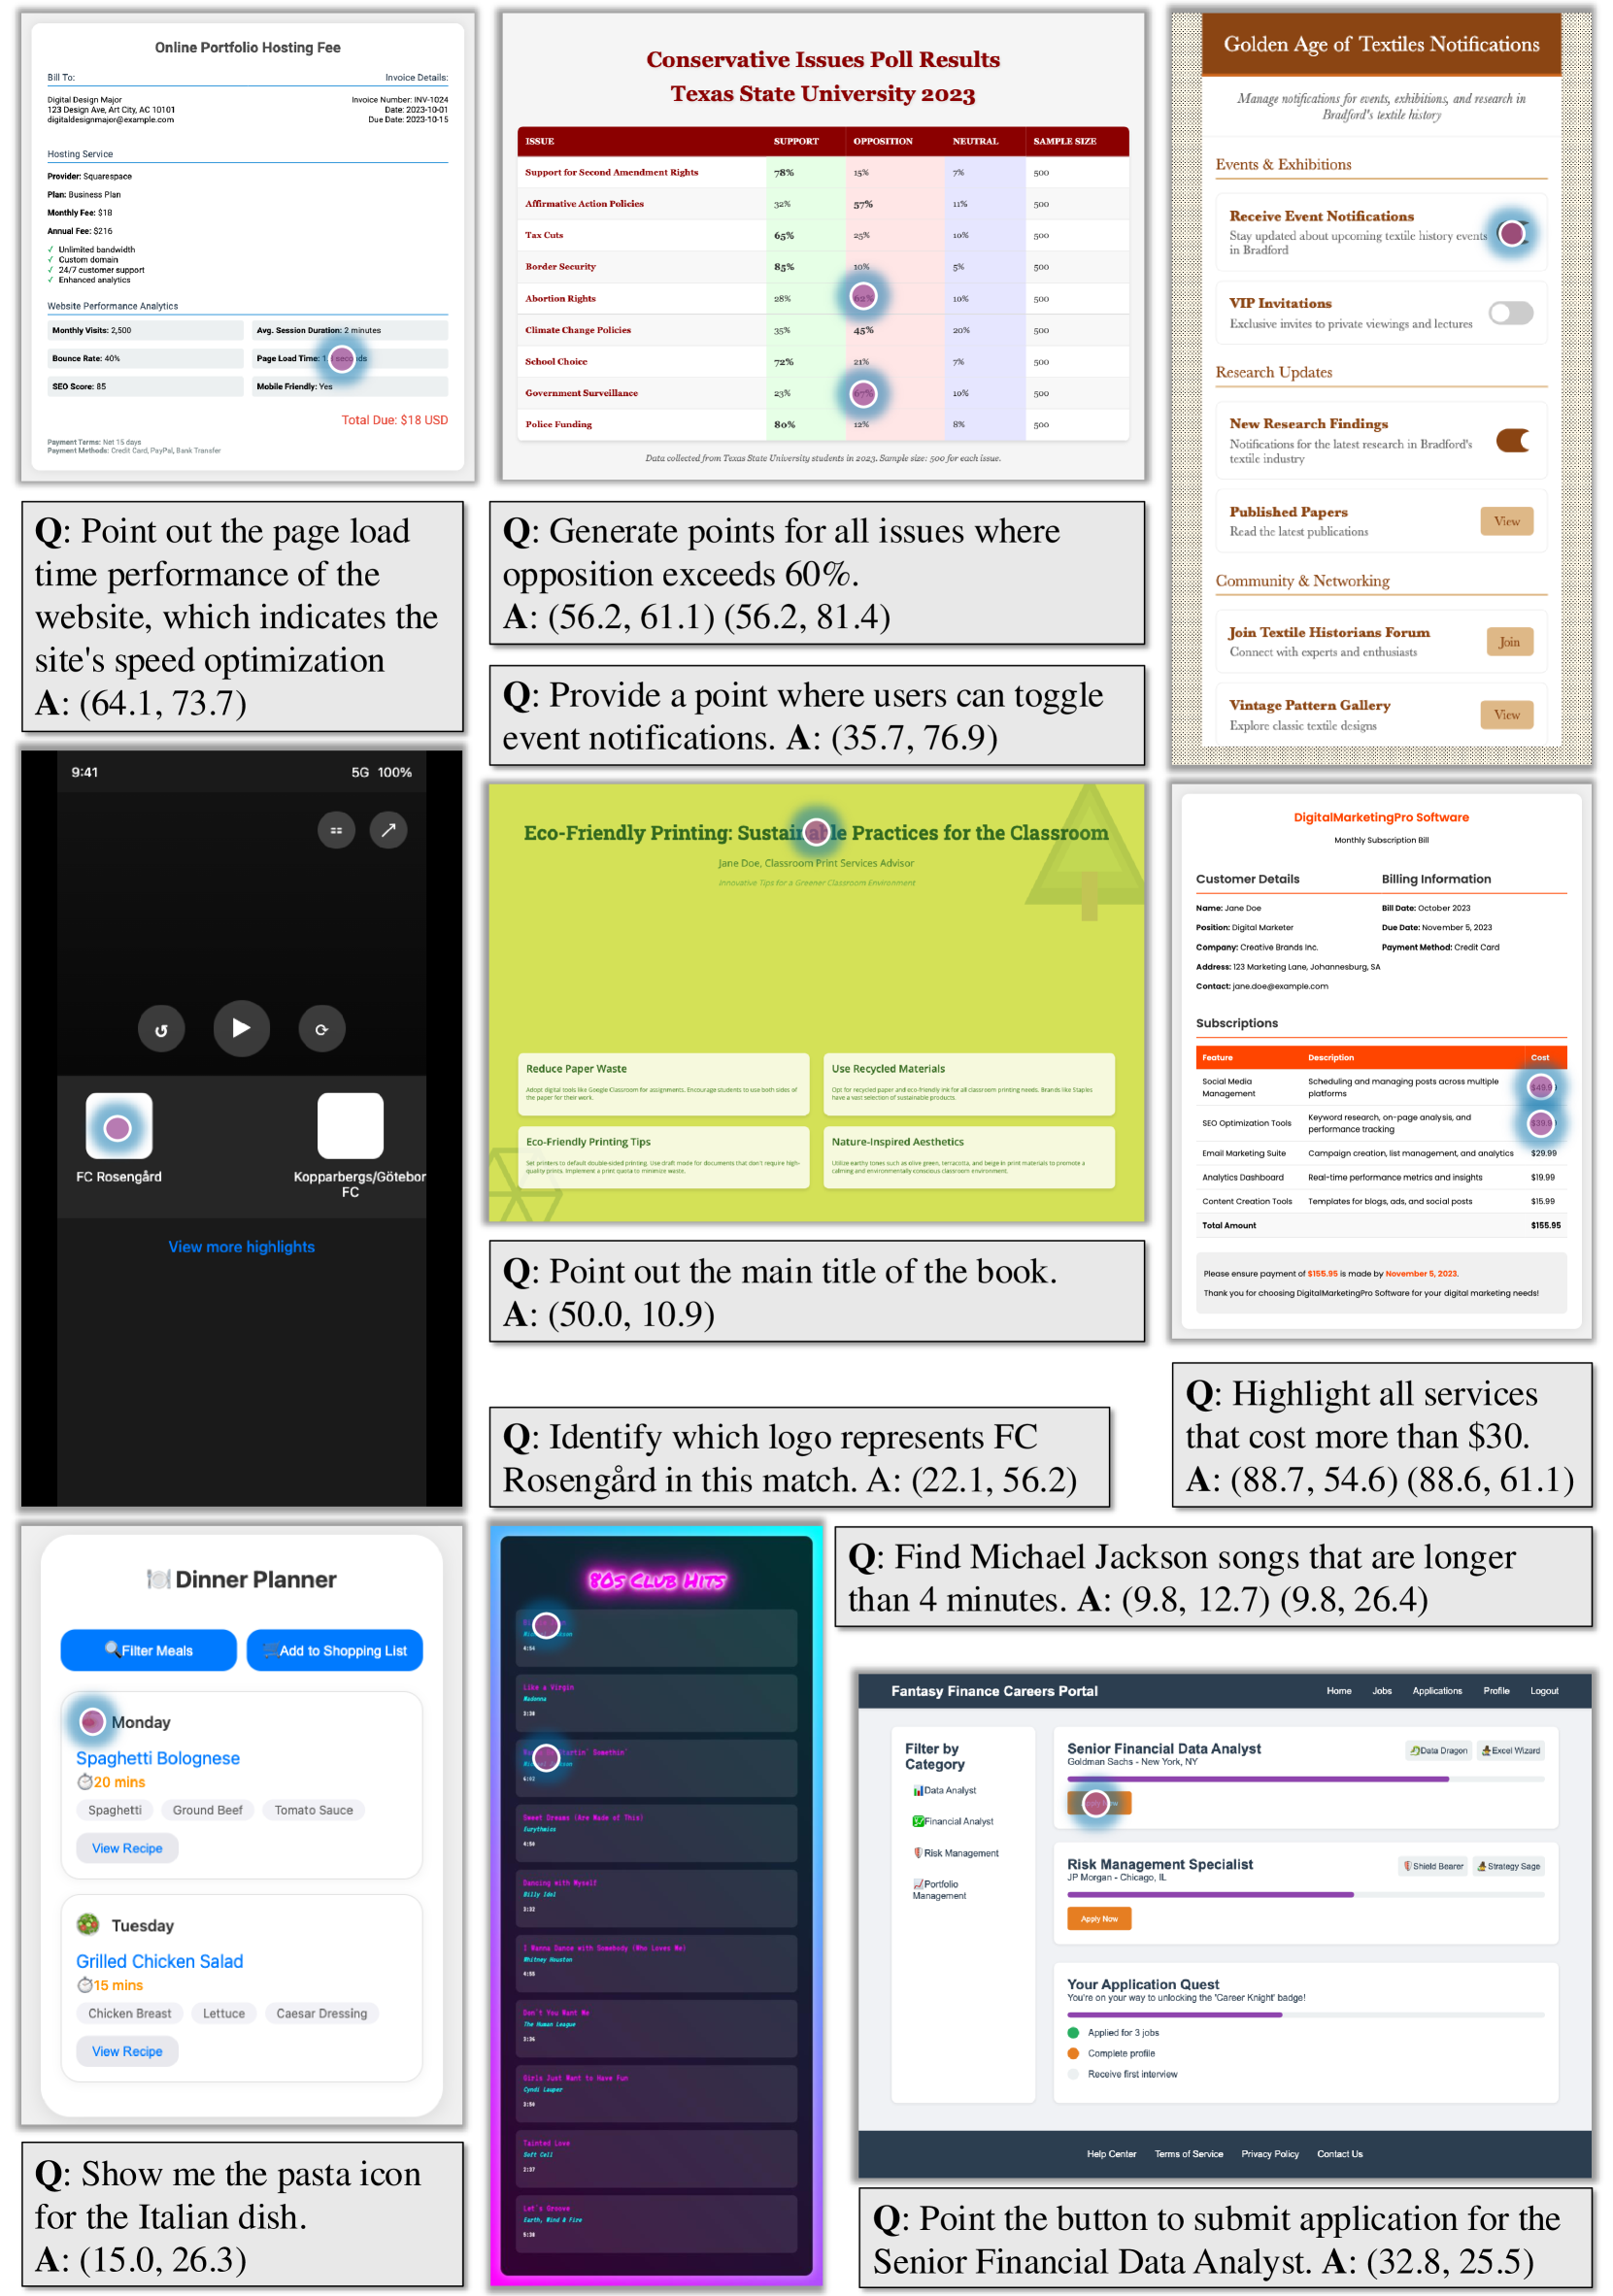
🔼 Figure 7 demonstrates how synthetic pointing data is generated and used to improve Vision-Language Models (VLMs). Panel (a) details the process: an LLM generates a question requiring a pointer to a specific object within an image; then the code generating the image is modified to explicitly include the correct coordinates. Panel (b) shows that a VLM trained using this synthetic data can successfully perform pointing tasks on real-world screenshots, proving the method’s generalizability.
read the caption
Figure 7: The overview of enabling VLMs to point through synthetic data. (a) We synthesize pointing data by prompting an LLM to generate pointing questions and edit the code to draw the answer points explicitly. (b) We demonstrate that the VLM trained on synthetic pointing data can be generalized to real agentic tasks.

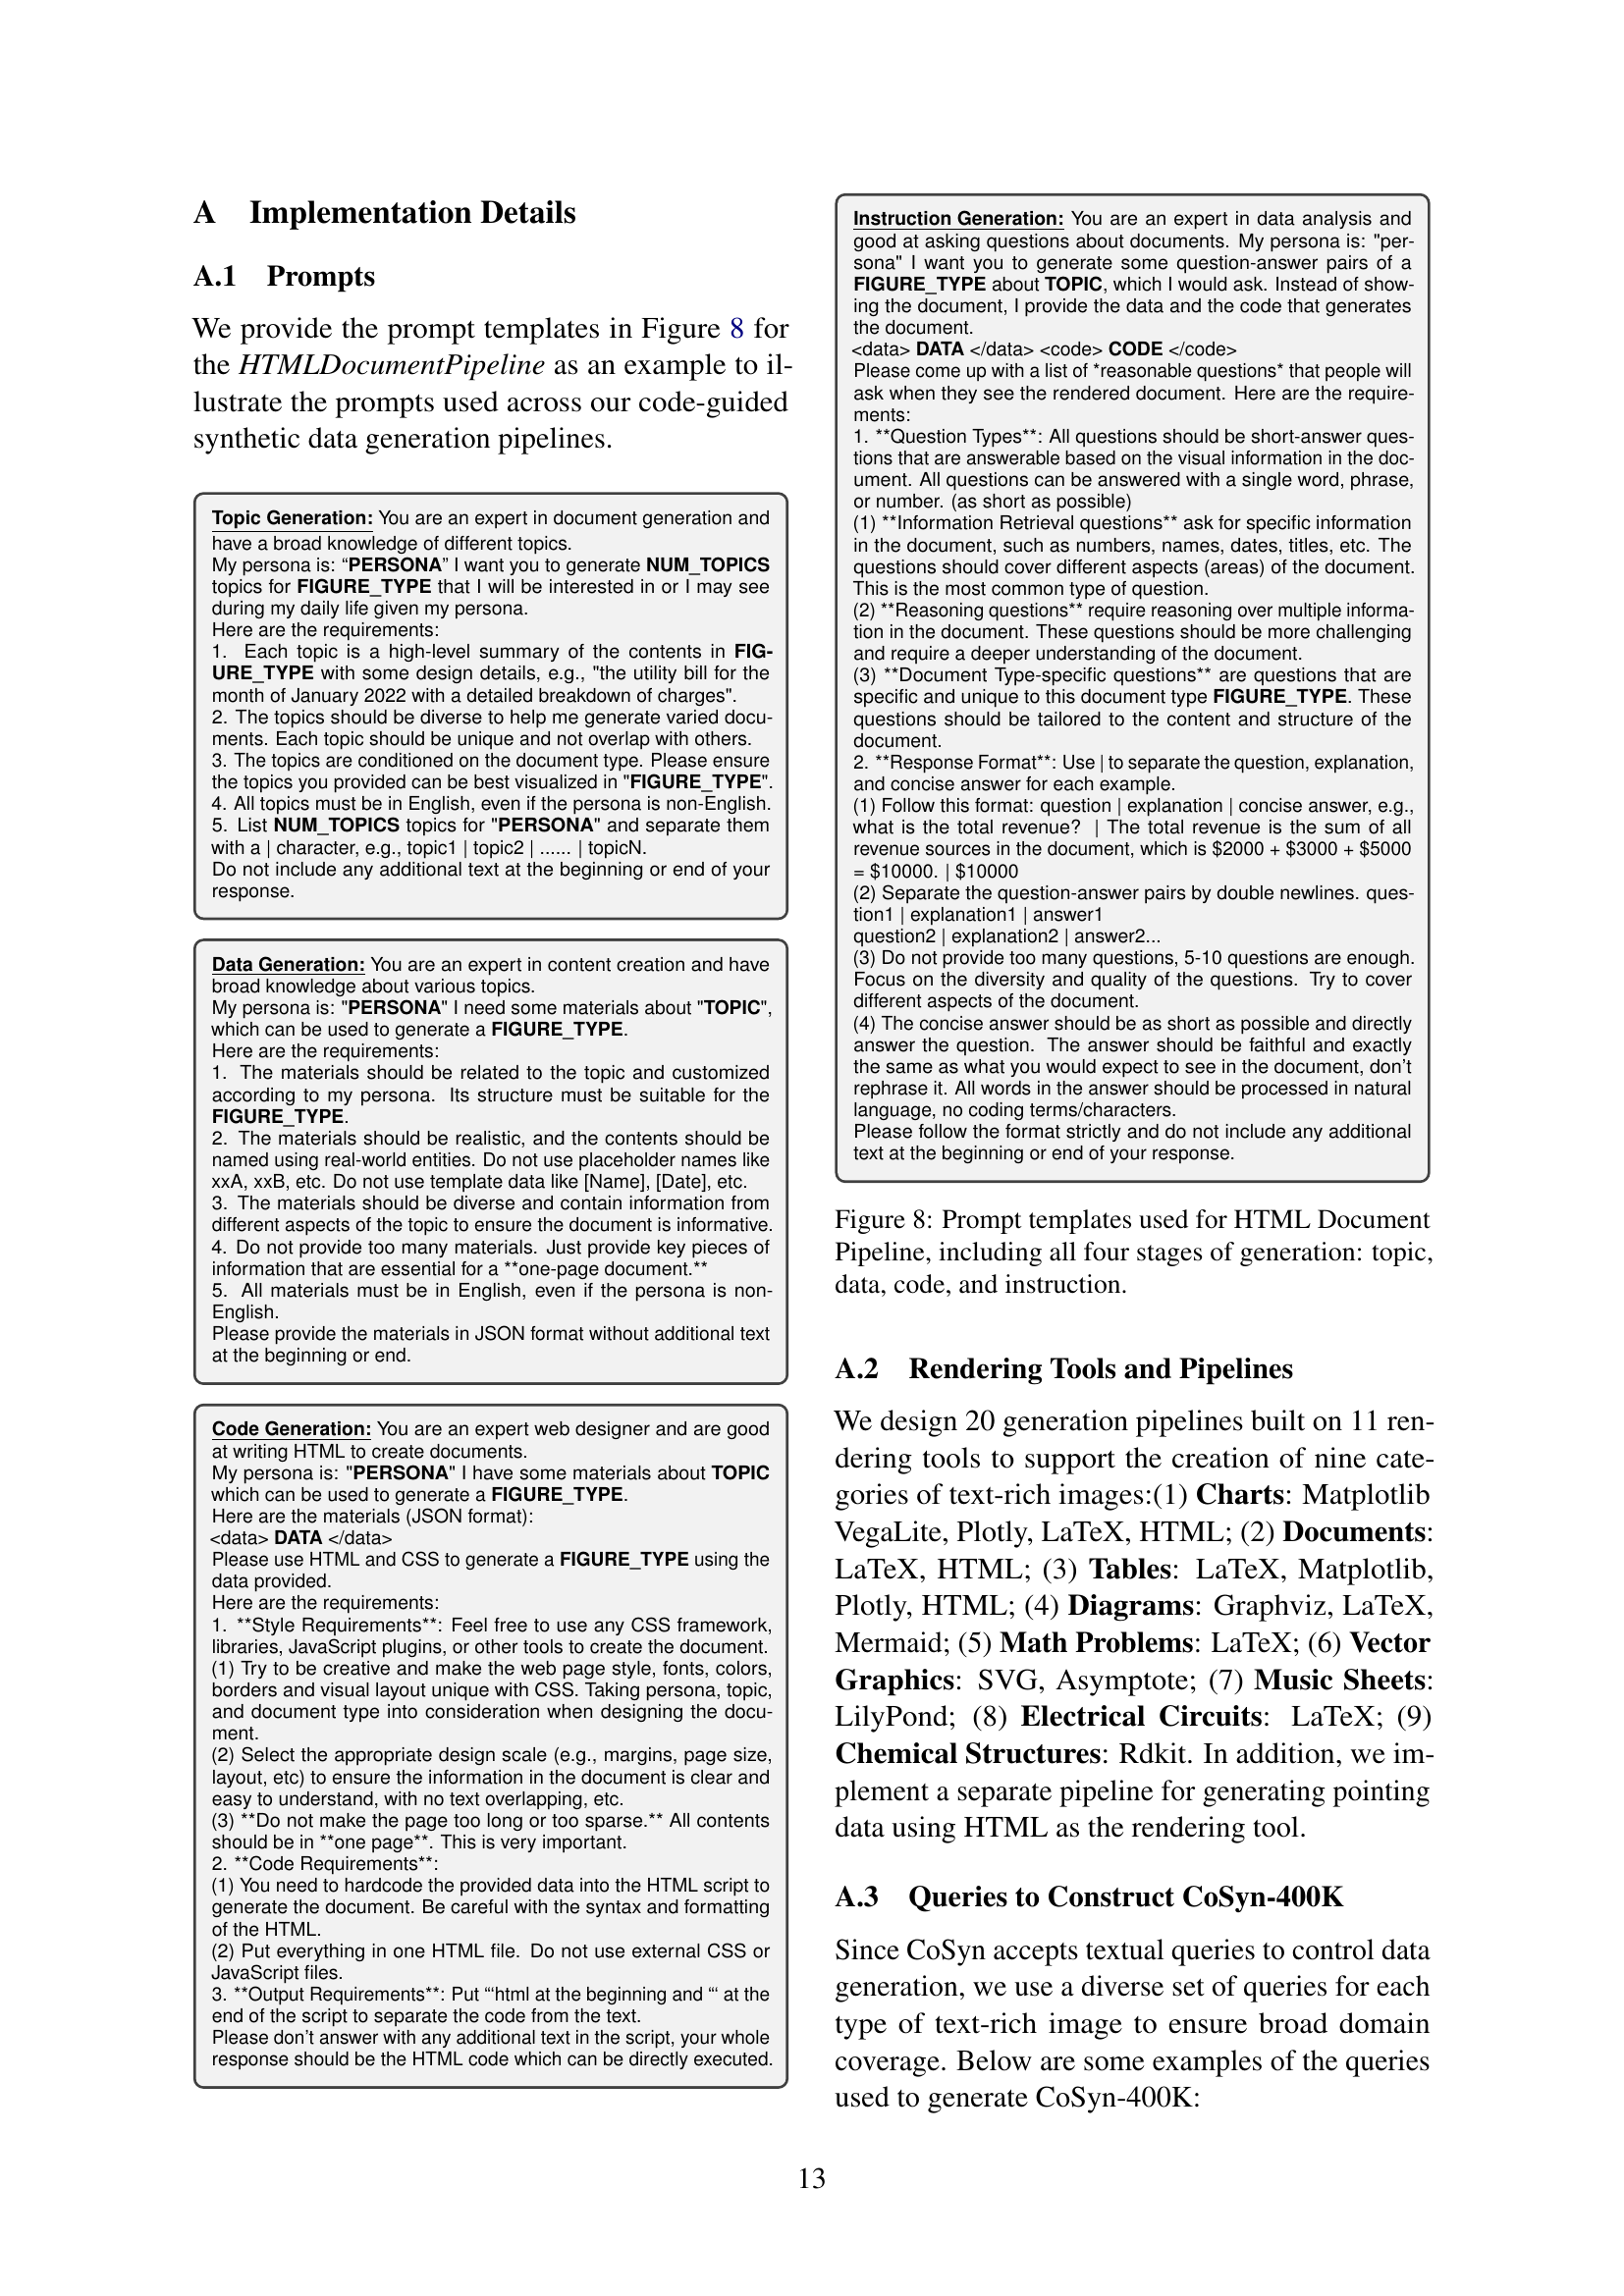
🔼 Figure 8 presents the prompt templates utilized in the HTML Document Pipeline of the CoSyn system. It details the four stages of the generation process: topic generation (creating diverse topics based on specified personas), data generation (producing realistic data suitable for the chosen topic and persona), code generation (producing executable HTML code to render an image based on the data), and instruction generation (generating question-answer pairs for instruction tuning, using the code and data as context). This figure provides a detailed look at how CoSyn prompts a large language model at each stage to create varied and realistic synthetic data for training vision-language models.
read the caption
Figure 8: Prompt templates used for HTML Document Pipeline, including all four stages of generation: topic, data, code, and instruction.

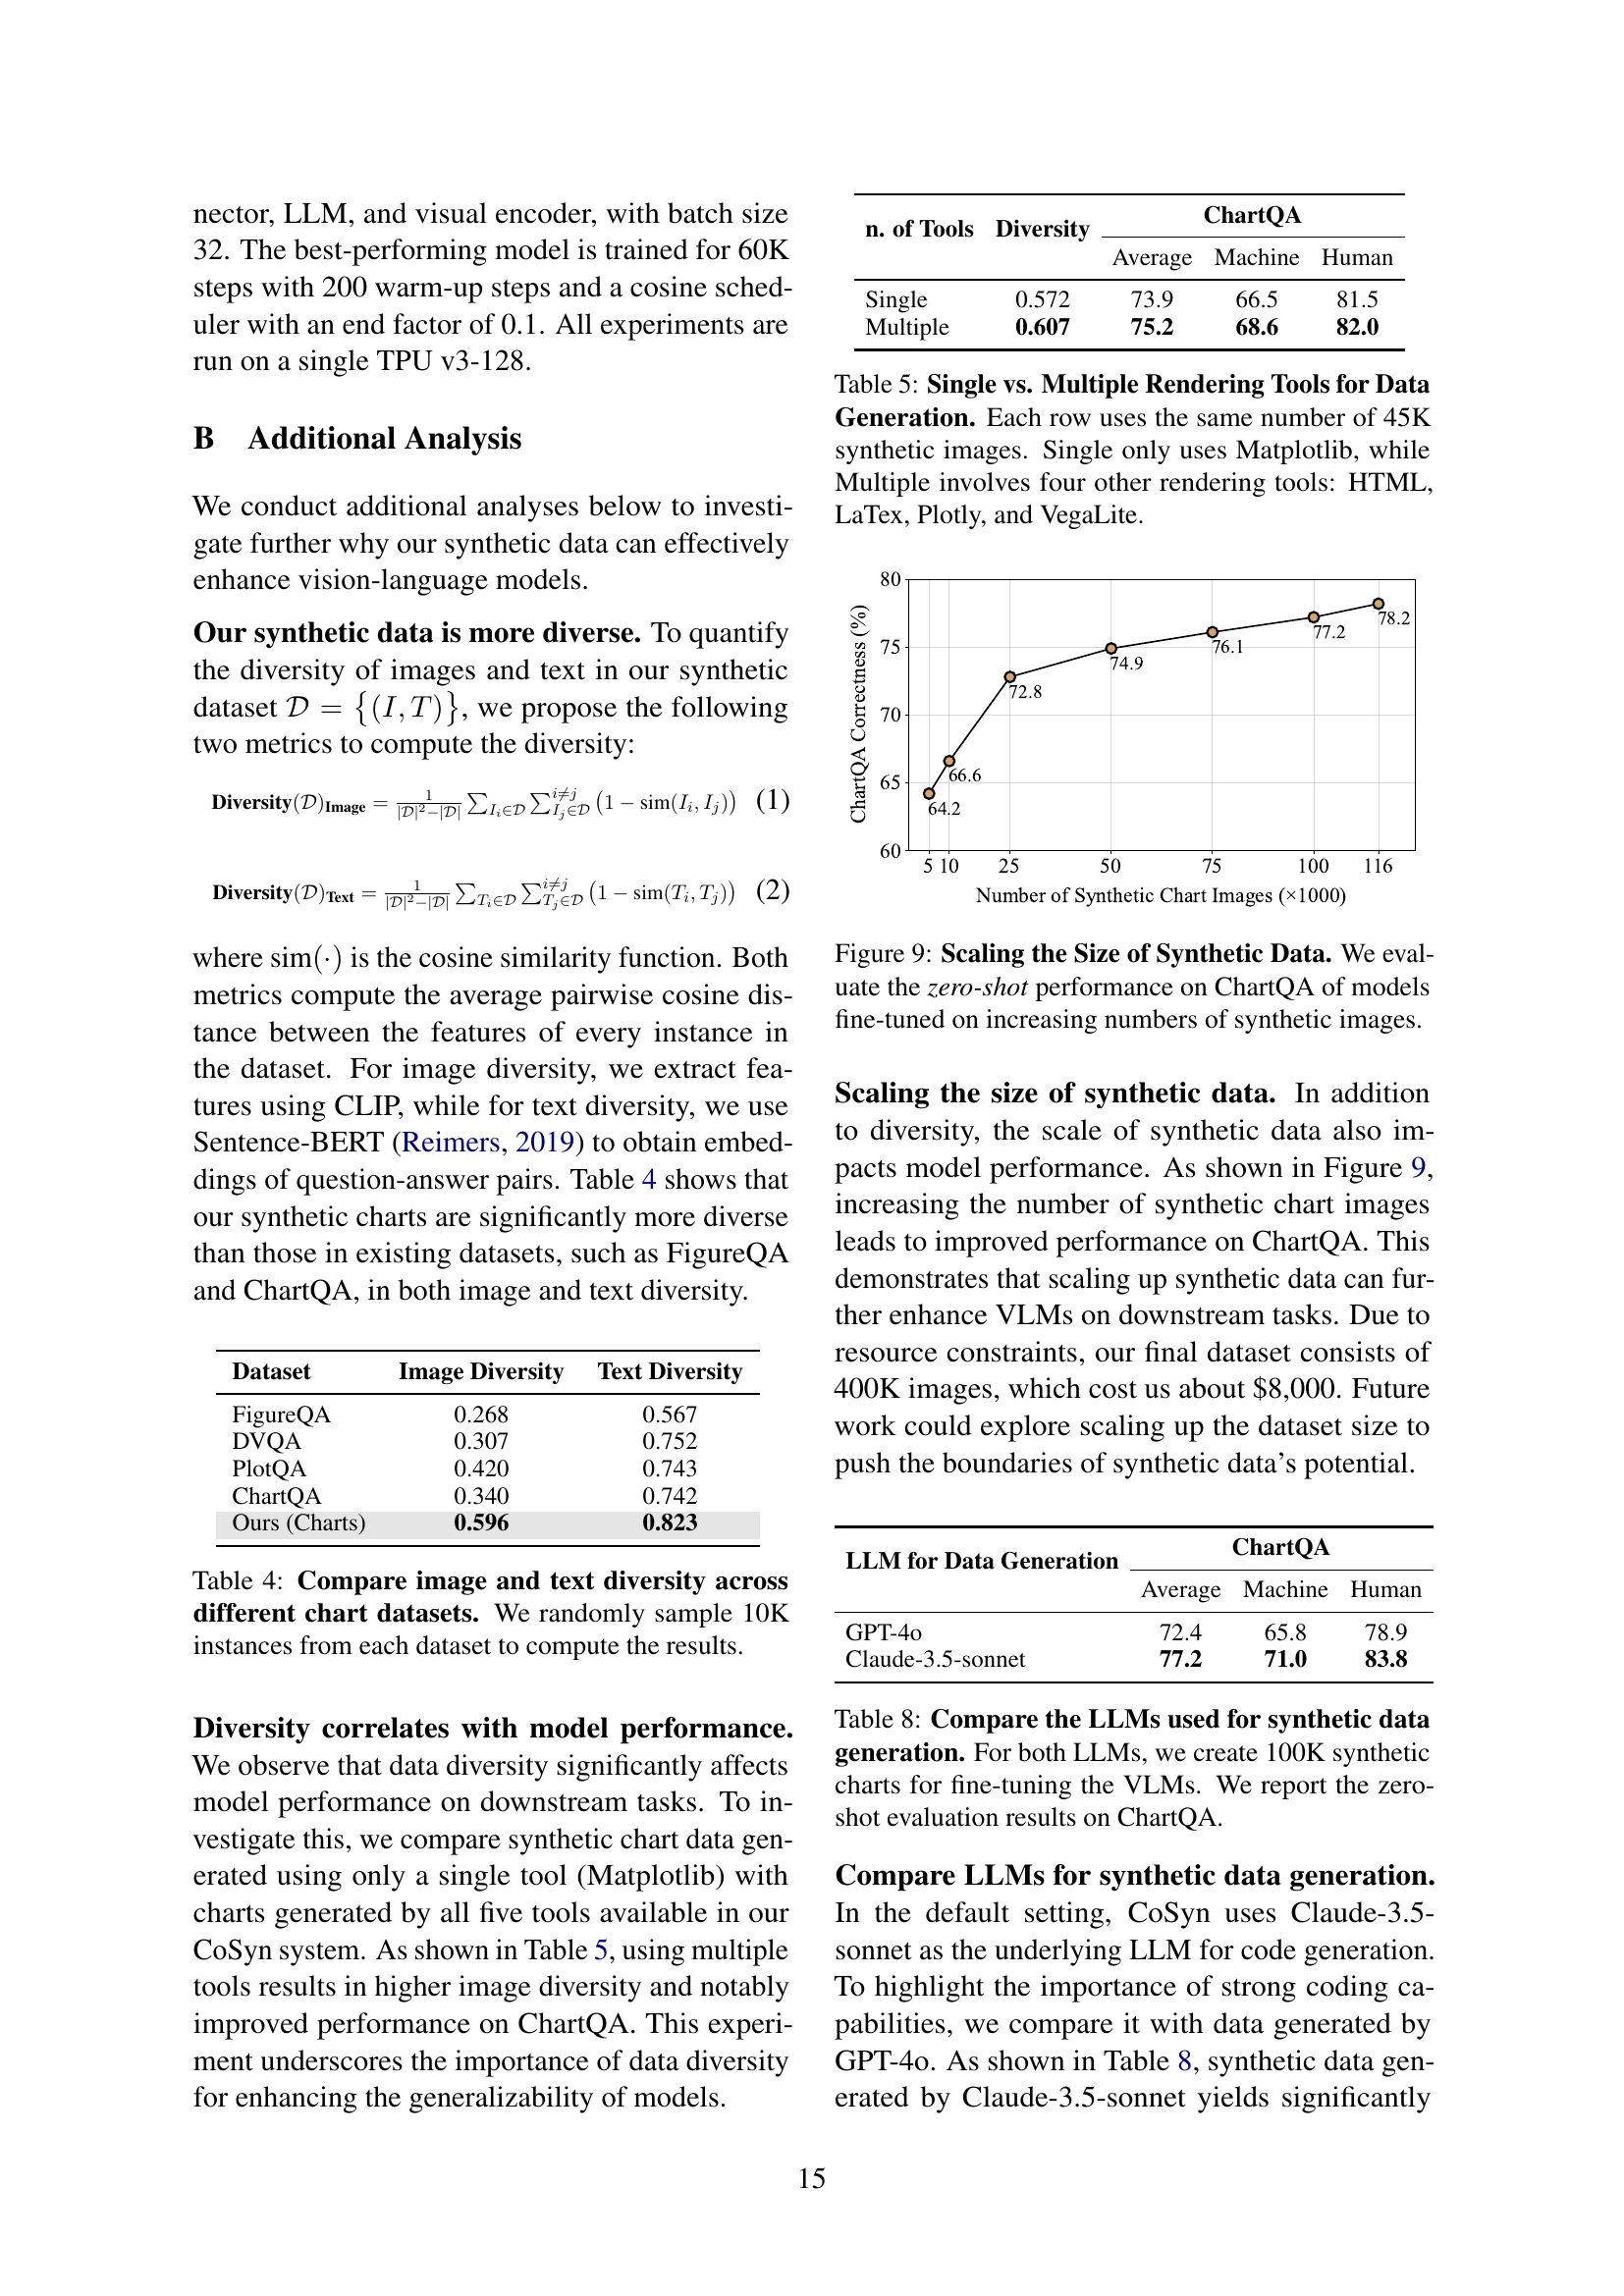
🔼 This figure shows how model performance on the ChartQA benchmark is affected by the quantity of synthetic training data. Specifically, it illustrates a zero-shot learning scenario where models are not pre-trained on any ChartQA data. The x-axis represents the increasing amount of synthetic data used for fine-tuning, and the y-axis represents the accuracy achieved on the ChartQA benchmark. The figure demonstrates that increased amounts of synthetic data correlate with improved model performance on this text-rich image understanding task, highlighting the effectiveness of synthetic data augmentation for vision-language models.
read the caption
Figure 9: Scaling the Size of Synthetic Data. We evaluate the zero-shot performance on ChartQA of models fine-tuned on increasing numbers of synthetic images.
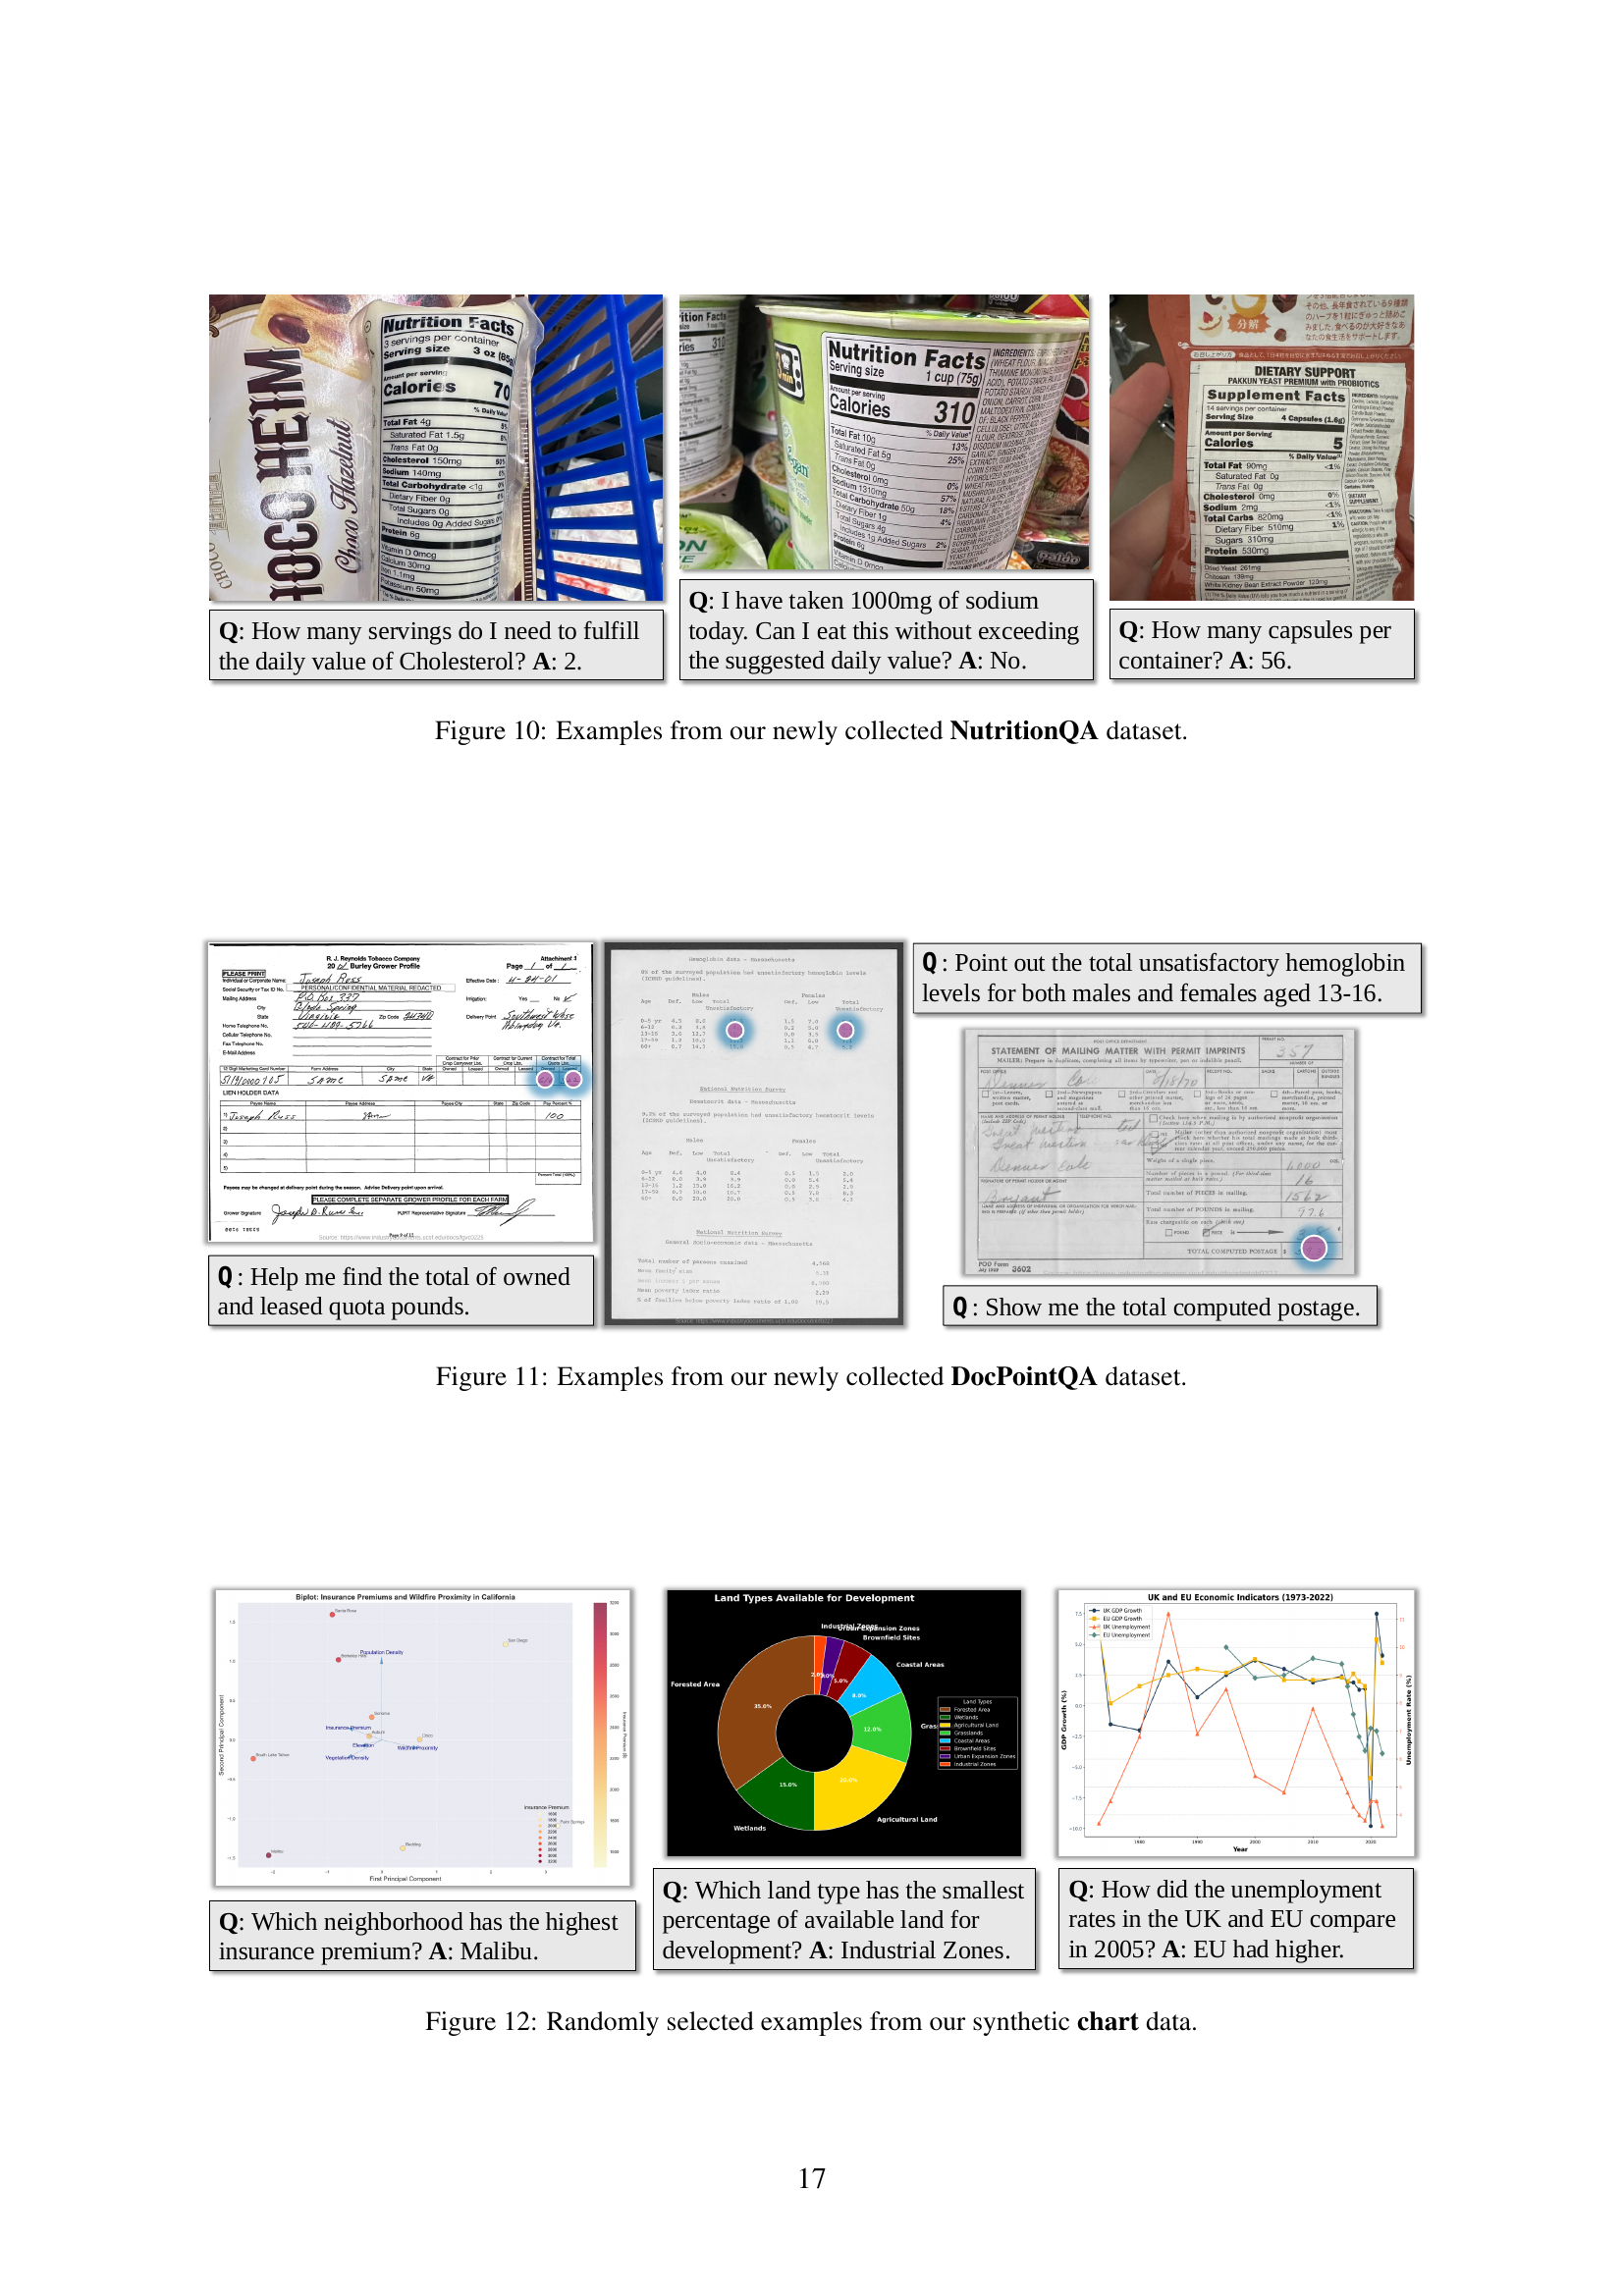
🔼 Figure 10 presents examples from the NutritionQA dataset, a newly created benchmark dataset for evaluating Vision-Language Models (VLMs) on the task of understanding and answering questions about nutrition fact labels. The figure showcases several images of nutrition fact labels from different products, each paired with one or more example questions that a VLM should be able to answer. This dataset is intended to test the ability of VLMs to handle real-world scenarios where multimodal reasoning (text and image) is required.
read the caption
Figure 10: Examples from our newly collected NutritionQA dataset.

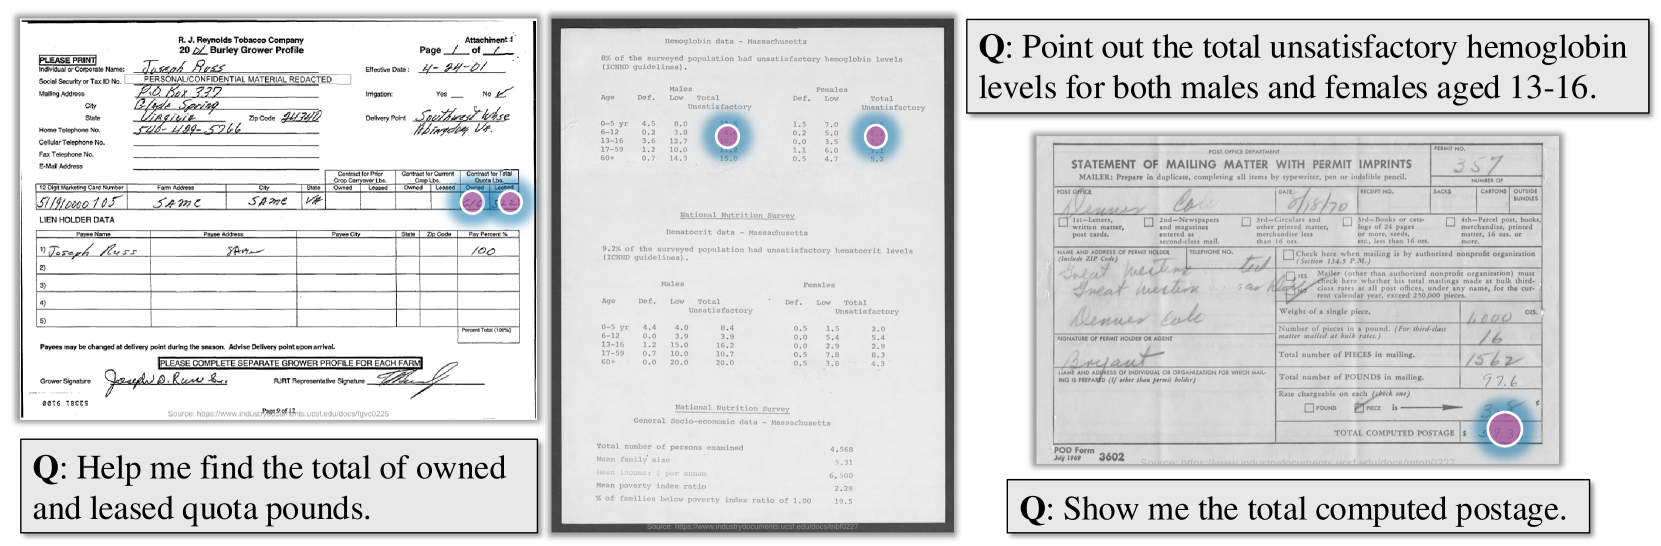
🔼 Figure 11 showcases examples from the newly created DocPointQA dataset. This dataset focuses on visual question answering tasks applied to document images. The figure displays several examples of document images, accompanied by questions requiring users to identify specific elements within the documents. This highlights the dataset’s focus on tasks involving locating and extracting information from complex visual layouts.
read the caption
Figure 11: Examples from our newly collected DocPointQA dataset.

🔼 This figure showcases a small subset of the diverse chart types generated by the CoSyN system. It visually demonstrates the variety in chart styles, complexity, and data representation achieved through the use of multiple rendering tools and diverse prompts. The examples highlight the system’s ability to generate charts for various applications and analytical needs.
read the caption
Figure 12: Randomly selected examples from our synthetic chart data.

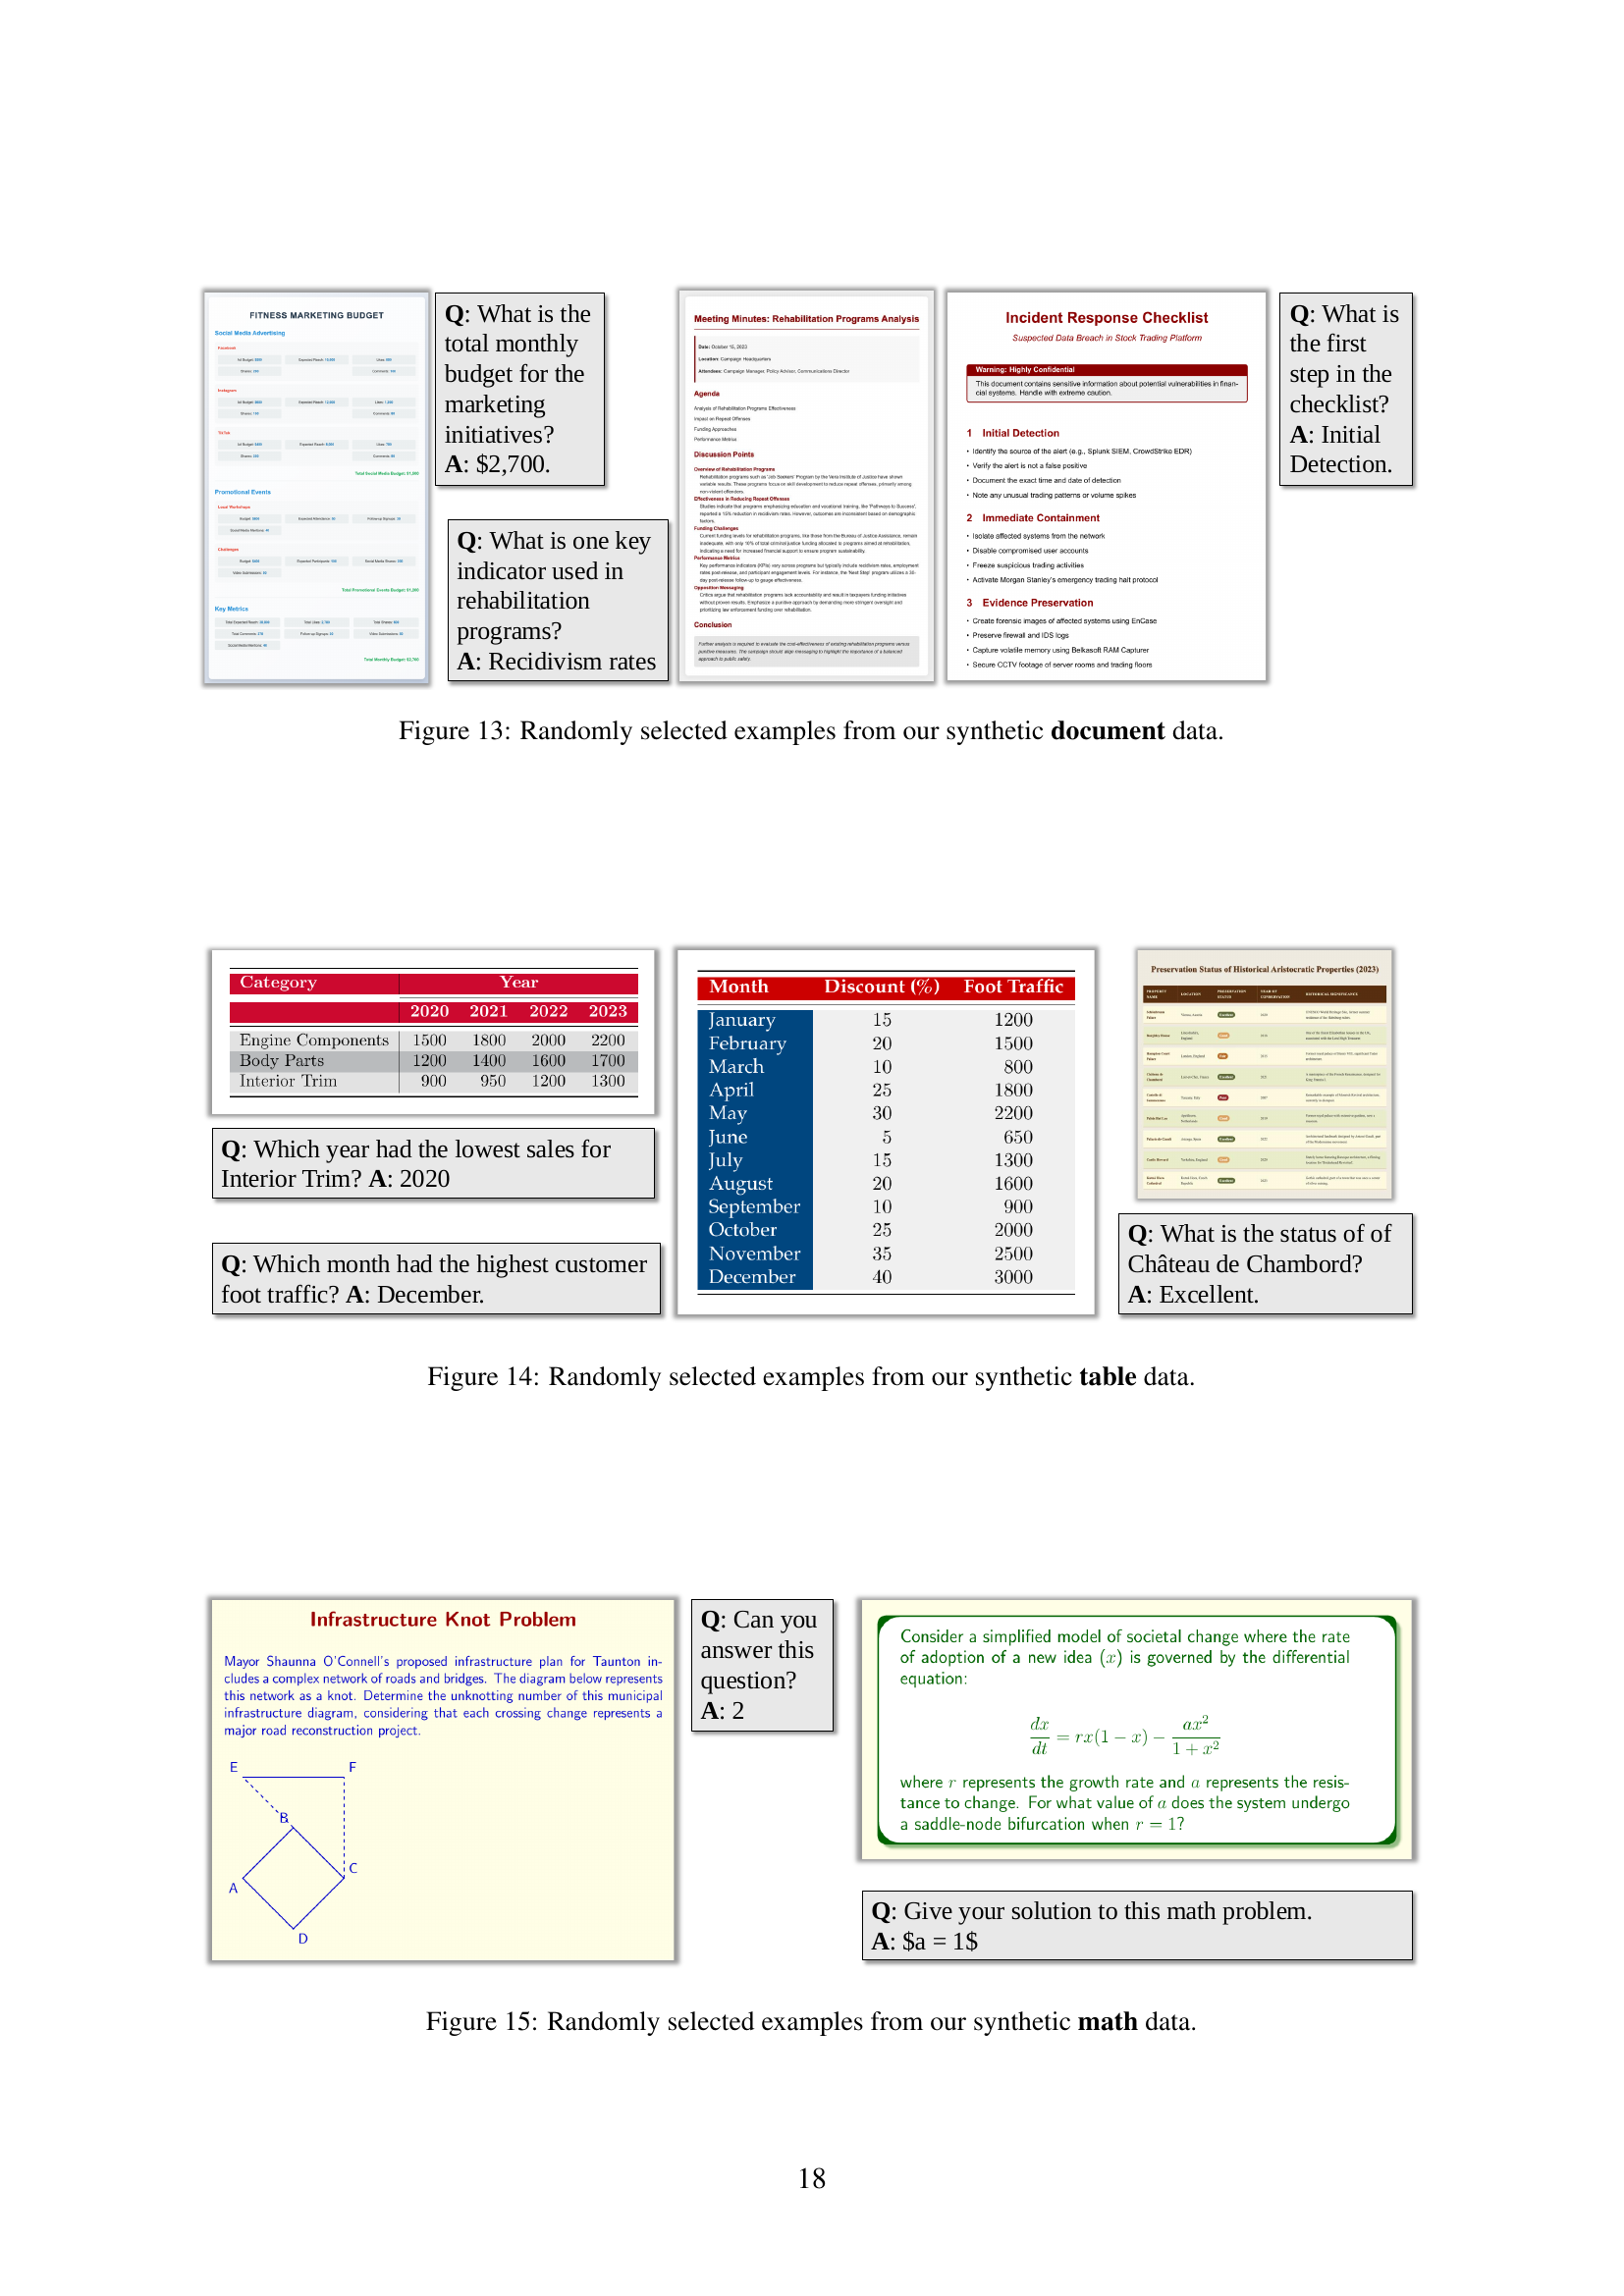
🔼 This figure showcases a variety of synthetically generated documents created using the CoSyn framework. The documents exemplify the system’s ability to produce diverse and realistic-looking text-rich content, ranging in style and format. These samples illustrate the system’s capacity to generate different document types such as meeting minutes, marketing materials, and incident reports, each complete with relevant text and layout.
read the caption
Figure 13: Randomly selected examples from our synthetic document data.

🔼 Figure 14 presents a small subset of the synthetic table data generated by the CoSyN system. The figure showcases the diversity of table styles, layouts, and content achieved through the system’s ability to render tables from diverse data using various rendering tools (including LaTeX, Matplotlib, Plotly, and HTML). Each example includes a sample question and answer highlighting the visual question answering capability trained on this synthetic data. This demonstrates the variety of tabular data types that CoSyN is able to generate, illustrating its effectiveness in creating a diverse and representative training dataset for VLMs (Vision-Language Models).
read the caption
Figure 14: Randomly selected examples from our synthetic table data.

🔼 Figure 15 presents a small subset of the synthetic mathematical problems generated by the CoSyn system. These problems showcase the diversity of mathematical concepts covered in the synthetic dataset, ranging from basic algebra and geometry to more complex calculus problems. The image shows several examples, each with a corresponding question and answer, illustrating the variety of question types and difficulty levels found within the synthetic data. This variety is crucial for training robust and versatile vision-language models capable of solving diverse math problems presented visually.
read the caption
Figure 15: Randomly selected examples from our synthetic math data.

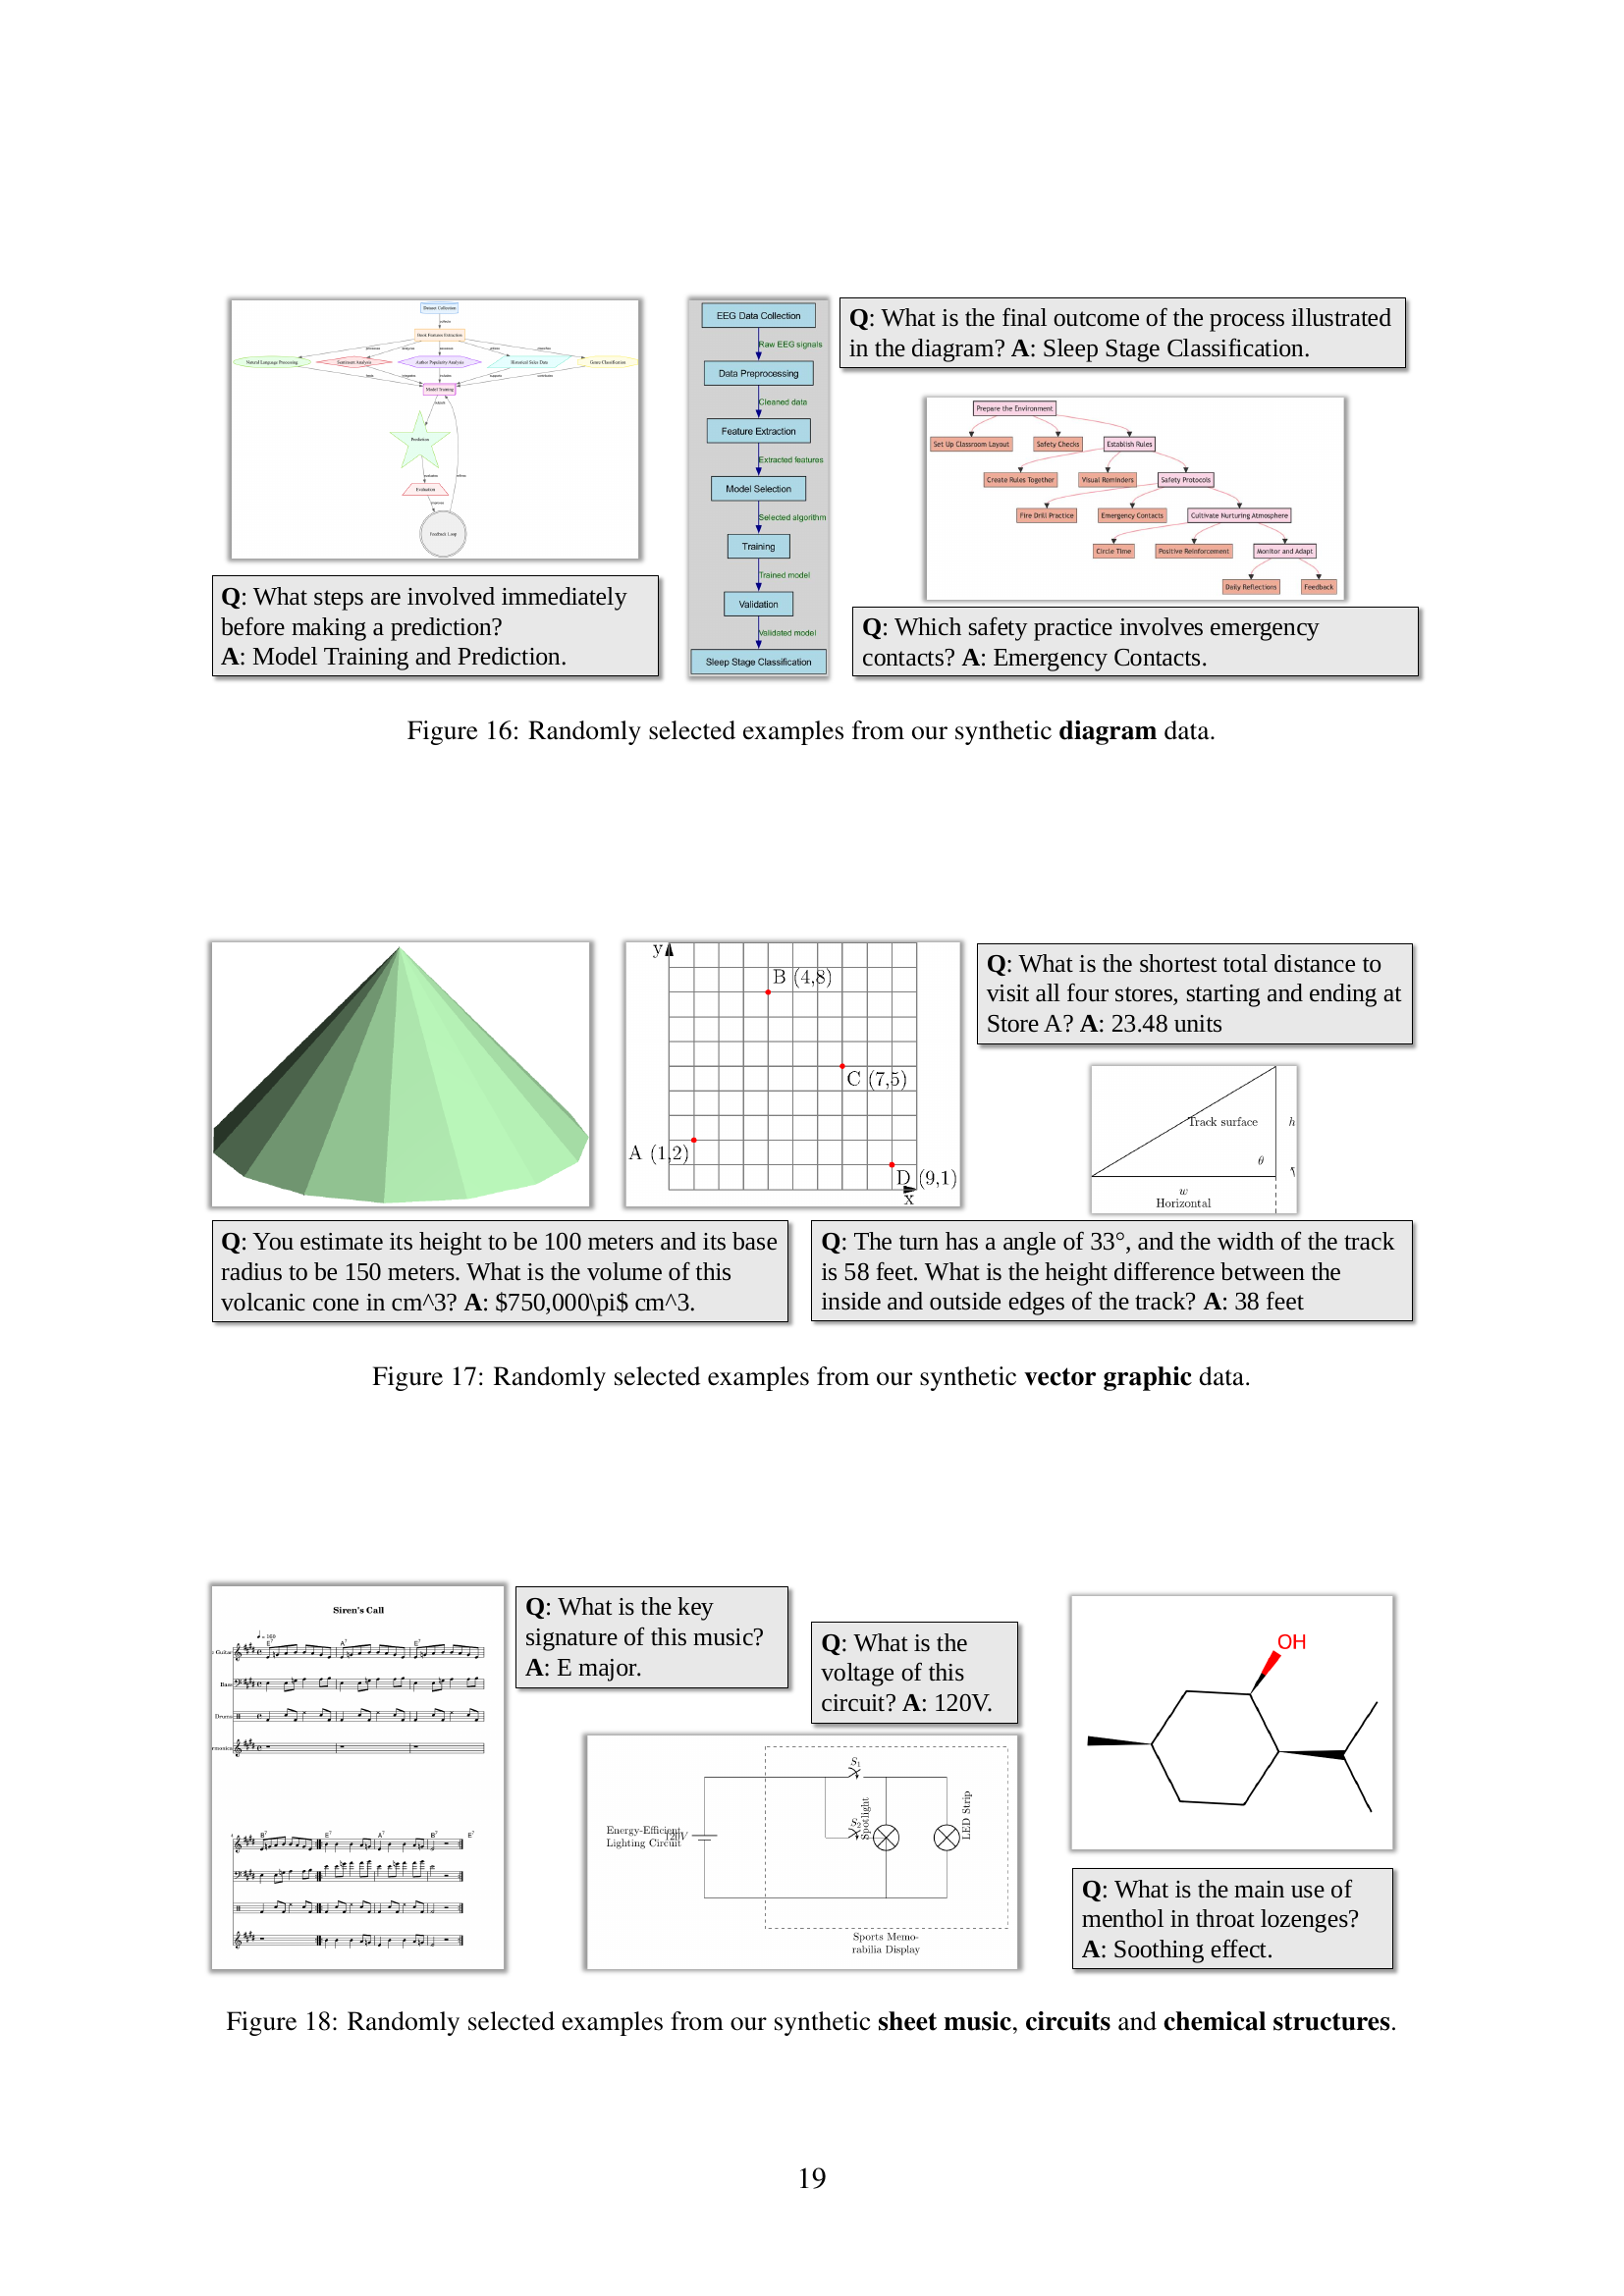
🔼 Figure 16 showcases a small subset of the synthetic diagram data generated by the CoSyn system. The diagrams illustrate the diversity of visual structures and complexities achievable through the CoSyn pipeline. These examples are representative of the larger dataset used to train and evaluate the vision-language models described in the paper. The accompanying questions highlight the model’s capability in comprehending and reasoning about information presented in diagrammatic form.
read the caption
Figure 16: Randomly selected examples from our synthetic diagram data.

🔼 This figure showcases a small sample of the diverse vector graphics generated using CoSyn. The images illustrate various types of vector graphics, such as charts, diagrams, and geometric shapes, demonstrating the system’s ability to generate a wide range of visual styles and complexities. Each image is accompanied by a question-answer pair, highlighting the suitability of CoSyn for instruction-tuning vision-language models (VLMs).
read the caption
Figure 17: Randomly selected examples from our synthetic vector graphic data.
🔼 Figure 18 presents a small subset of the synthetic data generated by CoSyn for sheet music, circuits, and chemical structures. It showcases CoSyn’s ability to generate diverse and realistic images across a range of data modalities, including those containing highly structured visual elements. The examples illustrate the variety of visual styles and information density achievable through CoSyn’s multi-modal generation process.
read the caption
Figure 18: Randomly selected examples from our synthetic sheet music, circuits and chemical structures.
More on tables
| ChartQA | Average | Machine | Human | |
| PaliGemma-3B | 71.4 | 88.5 | 54.2 | 34.3 |
| ChartPali-5B | 77.3 | 93.7 | 60.9 | 32.8 |
| Ours (w/o Syn) | 81.4 | 92.2 | 70.4 | 21.8 |
| Ours (w/ Syn) | 86.3 | 93.4 | 79.1 | 14.2 |
🔼 This table presents a comparison of the performance of various models on ChartQA, a question answering benchmark for charts. It breaks down the results based on whether the questions were written by humans or generated by a machine. The pie charts illustrate the proportion of human-written vs. machine-generated questions in both the training and testing sets of ChartQA. The ‘Δ’ column shows the performance difference between the model’s accuracy on human-written vs. machine-generated questions, highlighting any potential bias or overfitting to specific question types. A lower Δ value is preferable, indicating less of a performance gap between the two question types.
read the caption
Table 2: Results on human and machine-generated questions of ChartQA. The pie charts above display the percentage distribution of two question types in training and testing. ΔΔ\Deltaroman_Δ (↓↓\downarrow↓ lower is better) denotes the performance gap between human and machine questions.
| Mobile | Desktop | Web | Avg | ||||
| Model | Text | Icon | Text | Icon | Text | Icon | |
| GPT-4o | 20.2 | 24.9 | 21.1 | 23.6 | 12.2 | 7.8 | 18.3 |
| CogAgent | 67.0 | 24.0 | 74.2 | 20.0 | 70.4 | 28.6 | 47.4 |
| SeeClick | 78.0 | 52.0 | 72.2 | 30.0 | 55.7 | 32.5 | 53.4 |
| UGround | 82.8 | 60.3 | 82.5 | 63.6 | 80.4 | 70.4 | 73.3 |
| Synthetic | 90.8 | 53.3 | 78.4 | 58.6 | 80.0 | 47.1 | 68.0 |
| Human | 84.2 | 59.0 | 88.1 | 52.9 | 76.5 | 50.5 | 68.5 |
| Combined | 89.0 | 65.1 | 87.6 | 65.7 | 83.0 | 58.7 | 74.9 |
🔼 Table 3 presents a comparison of click accuracy results on the ScreenSpot benchmark across various vision-language models (VLMs). The models were trained using different types of pointing data: human-annotated data from the PixMo-point dataset (Deitke et al., 2024), synthetically generated pointing data created by the authors’ method, and a combination of both human and synthetic data. The table shows the performance of each model across different interfaces (Mobile, Desktop, and Web), providing a comprehensive evaluation of VLM performance on pointing tasks using different data sources and modalities.
read the caption
Table 3: Click accuracy on ScreenSpot. We report our models trained on different pointing data. Human stands for using the human-annotated data from PixMo-point Deitke et al. (2024). Combined means combining human-annotated data with our synthetic pointing data.
| Dataset | Image Diversity | Text Diversity |
| FigureQA | 0.268 | 0.567 |
| DVQA | 0.307 | 0.752 |
| PlotQA | 0.420 | 0.743 |
| ChartQA | 0.340 | 0.742 |
| Ours (Charts) | 0.596 | 0.823 |
🔼 This table presents a quantitative comparison of image and text diversity across various chart datasets. It utilizes two metrics: image diversity and text diversity, calculated using cosine similarity to measure the pairwise distance between image and text embeddings, respectively. The results show the relative diversity of images and text within each dataset, highlighting the differences in data composition and variability between datasets used in vision-language model training. The 10,000 samples randomly chosen from each dataset allow for a fair comparison while controlling for the impact of dataset size.
read the caption
Table 4: Compare image and text diversity across different chart datasets. We randomly sample 10K instances from each dataset to compute the results.
| n. of Tools | Diversity | ChartQA | ||
| Average | Machine | Human | ||
| Single | 0.572 | 73.9 | 66.5 | 81.5 |
| Multiple | 0.607 | 75.2 | 68.6 | 82.0 |
🔼 This table compares the performance of models trained on synthetic chart data generated using either a single rendering tool (Matplotlib) or multiple tools (Matplotlib, HTML, LaTeX, Plotly, and VegaLite). Each experimental condition used 45,000 synthetic images. The results demonstrate the impact of tool diversity on model performance, highlighting the benefit of using multiple rendering tools for generating more diverse and realistic synthetic data.
read the caption
Table 5: Single vs. Multiple Rendering Tools for Data Generation. Each row uses the same number of 45K synthetic images. Single only uses Matplotlib, while Multiple involves four other rendering tools: HTML, LaTex, Plotly, and VegaLite.
| Prompt Type | ChartQA | DocVQA | InfoVQA | TableVQA | AI2D | TextVQA | ScreenQA | NutritionQA |
| CoT | 86.3 | 87.4 | 63.8 | 65.8 | 86.0 | 70.9 | 79.0 | 76.0 |
| Short Answer | 83.1 | 90.0 | 70.5 | 64.3 | 91.9 | 82.0 | 80.1 | 62.0 |
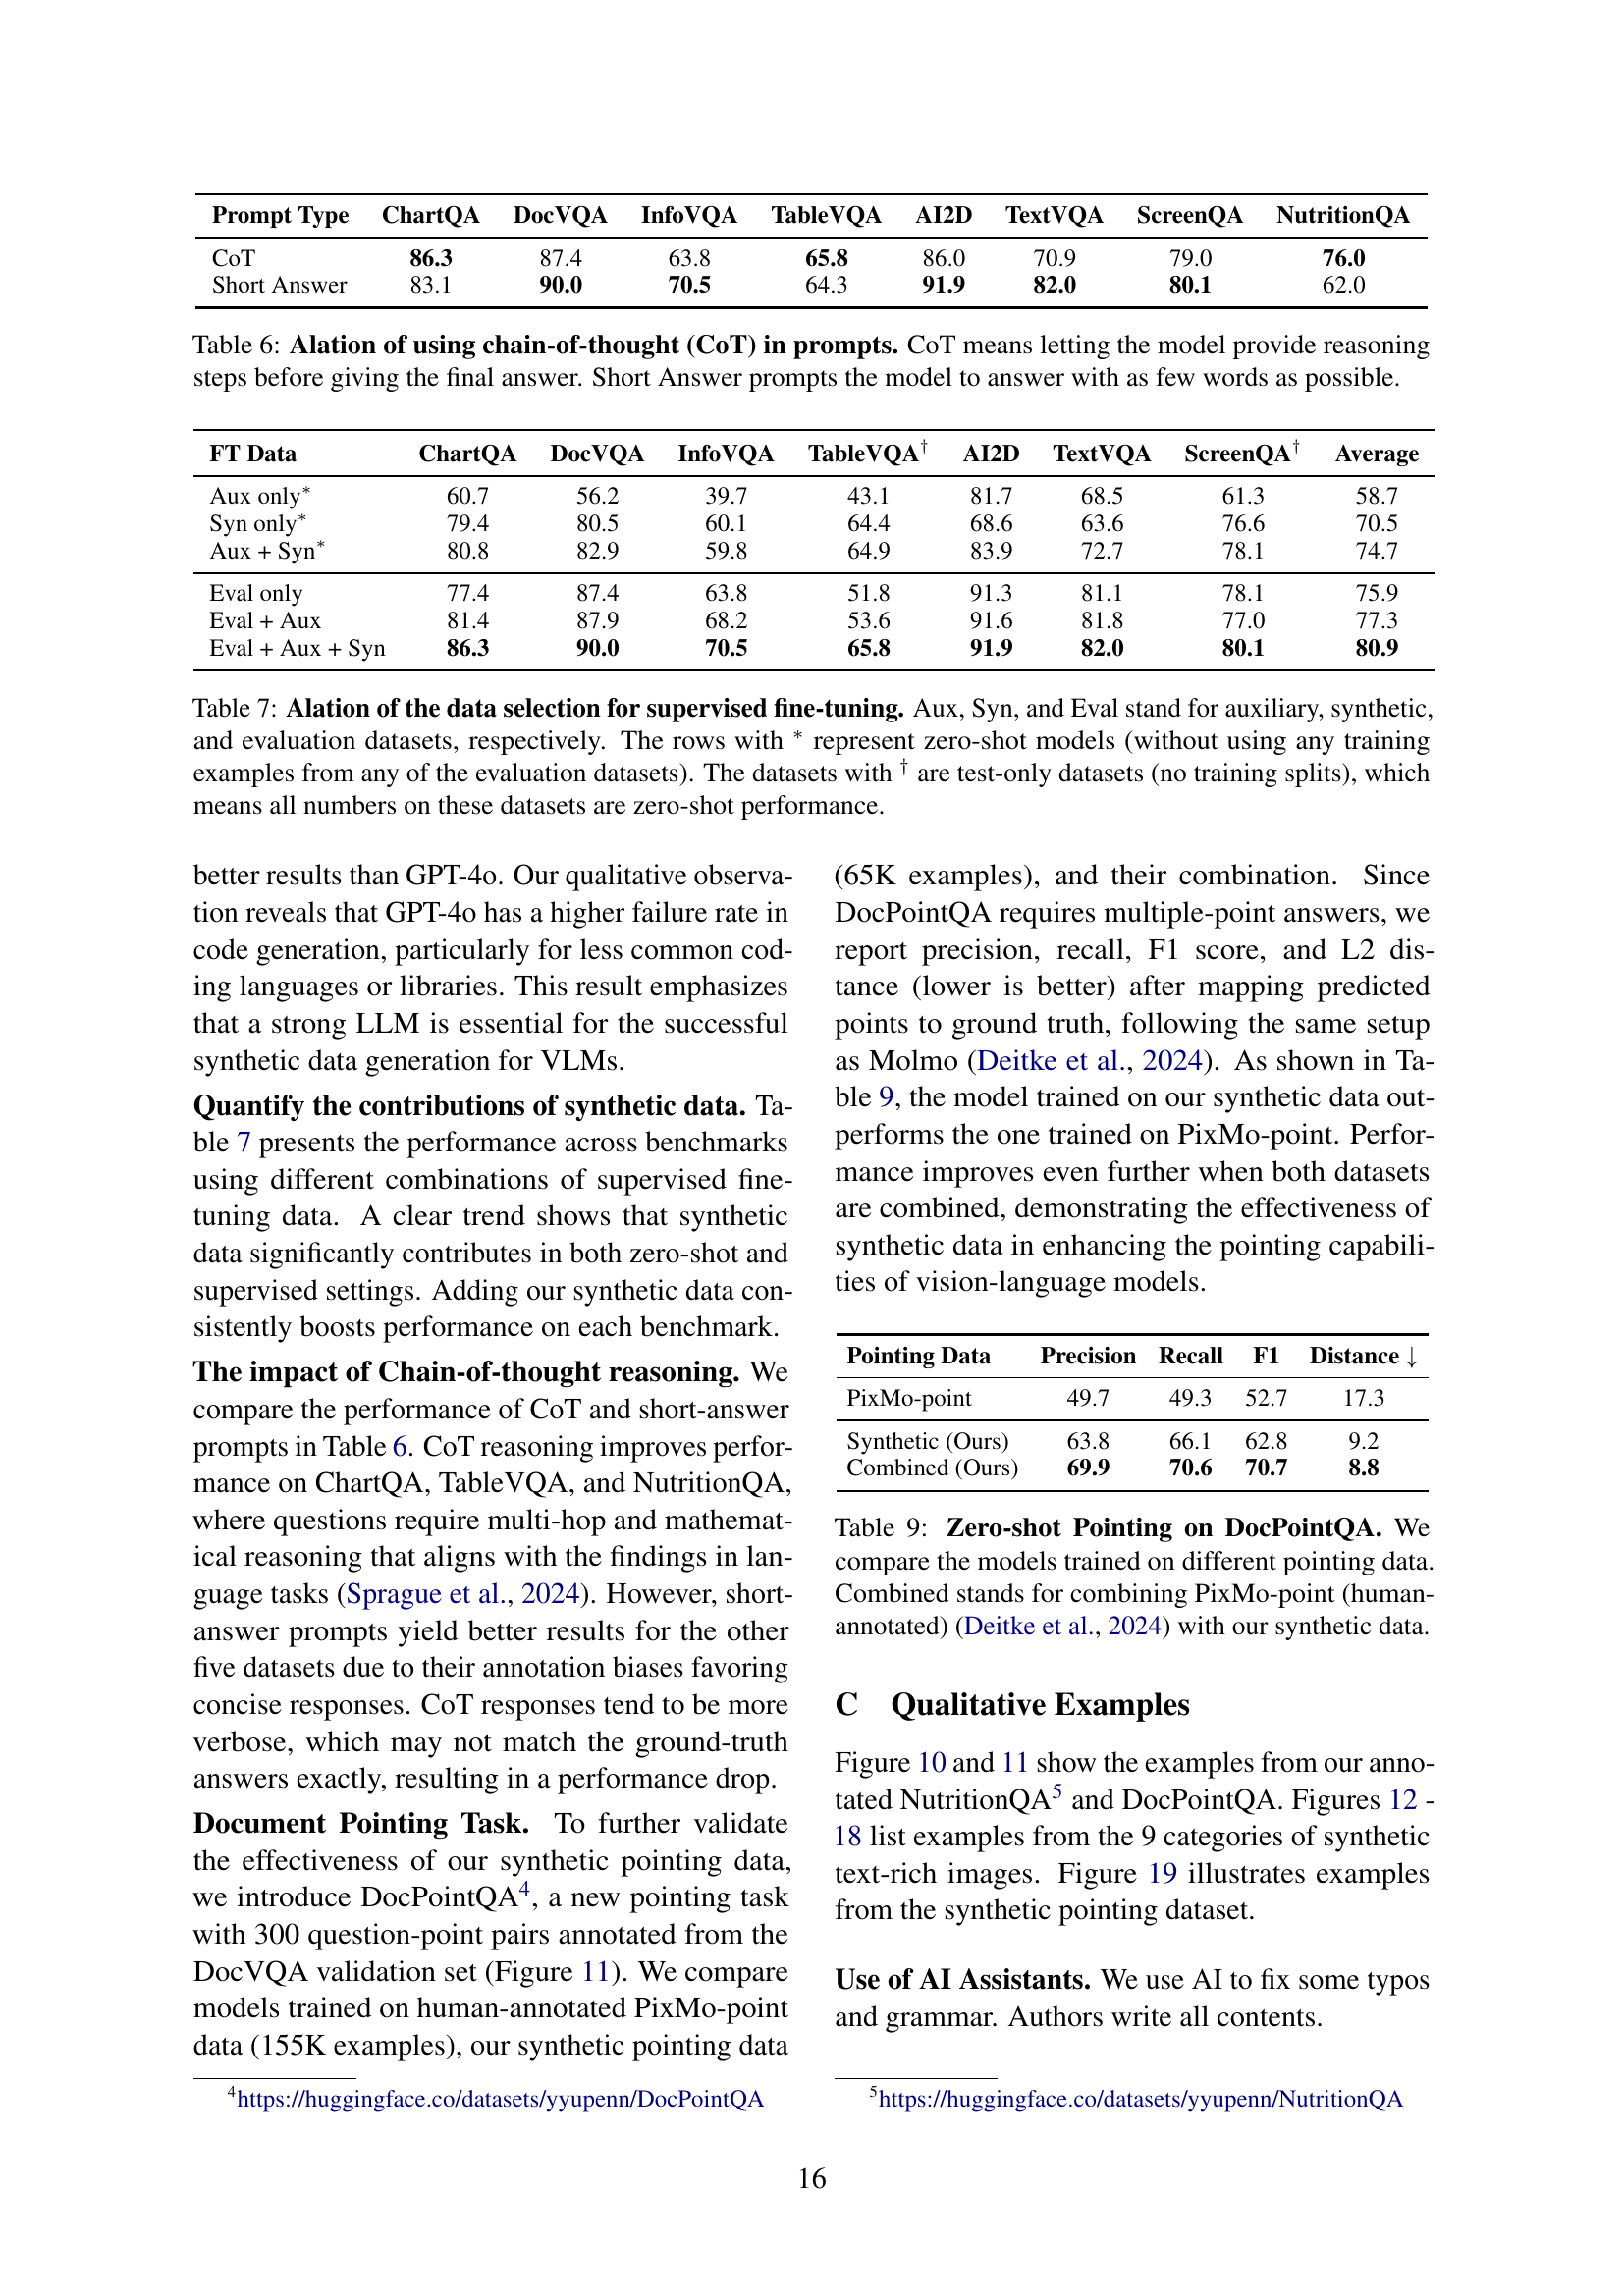
🔼 This table presents an ablation study comparing the performance of a vision-language model when prompted using two different reasoning styles: Chain-of-Thought (CoT) and Short Answer. The CoT prompting style guides the model to provide a step-by-step reasoning process before giving the final answer, while the Short Answer style prompts the model for a concise, direct answer. The table shows the performance of the model on seven different benchmark datasets (ChartQA, DocVQA, InfoVQA, TableVQA, AI2D, TextVQA, ScreenQA, and NutritionQA), highlighting how each prompting method impacts its ability to answer different types of questions.
read the caption
Table 6: Alation of using chain-of-thought (CoT) in prompts. CoT means letting the model provide reasoning steps before giving the final answer. Short Answer prompts the model to answer with as few words as possible.
| FT Data | ChartQA | DocVQA | InfoVQA | TableVQA† | AI2D | TextVQA | ScreenQA† | Average |
| Aux only∗ | 60.7 | 56.2 | 39.7 | 43.1 | 81.7 | 68.5 | 61.3 | 58.7 |
| Syn only∗ | 79.4 | 80.5 | 60.1 | 64.4 | 68.6 | 63.6 | 76.6 | 70.5 |
| Aux + Syn∗ | 80.8 | 82.9 | 59.8 | 64.9 | 83.9 | 72.7 | 78.1 | 74.7 |
| Eval only | 77.4 | 87.4 | 63.8 | 51.8 | 91.3 | 81.1 | 78.1 | 75.9 |
| Eval + Aux | 81.4 | 87.9 | 68.2 | 53.6 | 91.6 | 81.8 | 77.0 | 77.3 |
| Eval + Aux + Syn | 86.3 | 90.0 | 70.5 | 65.8 | 91.9 | 82.0 | 80.1 | 80.9 |
🔼 This table presents an ablation study on the selection of training datasets for supervised fine-tuning of vision-language models. It compares the performance of models trained using different combinations of three types of datasets: auxiliary datasets (general multimodal data), synthetic datasets generated using CoSyn, and evaluation datasets (text-rich image datasets used for benchmarking). The results show the impact of each data type on the model’s performance across several text-rich benchmarks. Zero-shot results are also included, representing performance without using any training examples from the evaluation datasets. Some evaluation datasets have only test splits, meaning performance there is inherently zero-shot.
read the caption
Table 7: Alation of the data selection for supervised fine-tuning. Aux, Syn, and Eval stand for auxiliary, synthetic, and evaluation datasets, respectively. The rows with ∗ represent zero-shot models (without using any training examples from any of the evaluation datasets). The datasets with † are test-only datasets (no training splits), which means all numbers on these datasets are zero-shot performance.
| LLM for Data Generation | ChartQA | ||
| Average | Machine | Human | |
| GPT-4o | 72.4 | 65.8 | 78.9 |
| Claude-3.5-sonnet | 77.2 | 71.0 | 83.8 |
🔼 This table compares the performance of two different large language models (LLMs), GPT-40 and Claude-3.5-sonnet, in generating synthetic chart data for training vision-language models (VLMs). For each LLM, 100,000 synthetic charts were created and used for zero-shot fine-tuning of VLMs. The table shows the resulting zero-shot performance on the ChartQA benchmark, allowing for a direct comparison of the quality of synthetic data produced by each LLM.
read the caption
Table 8: Compare the LLMs used for synthetic data generation. For both LLMs, we create 100K synthetic charts for fine-tuning the VLMs. We report the zero-shot evaluation results on ChartQA.
| Pointing Data | Precision | Recall | F1 | Distance |
| PixMo-point | 49.7 | 49.3 | 52.7 | 17.3 |
| Synthetic (Ours) | 63.8 | 66.1 | 62.8 | 9.2 |
| Combined (Ours) | 69.9 | 70.6 | 70.7 | 8.8 |
🔼 This table presents a comparison of zero-shot performance on the DocPointQA benchmark across different models trained on various pointing datasets. Specifically, it shows the precision, recall, F1-score, and L2 distance (a lower value indicates better performance) achieved by models trained solely on the PixMo-point dataset (human-annotated data), solely on the synthetic pointing data generated by the authors’ method, and on a combination of both datasets. This analysis helps demonstrate the effectiveness of the synthetic data in enhancing the performance of vision-language models on pointing tasks.
read the caption
Table 9: Zero-shot Pointing on DocPointQA. We compare the models trained on different pointing data. Combined stands for combining PixMo-point (human-annotated) Deitke et al. (2024) with our synthetic data.
Full paper#