TL;DR#
LLMs excel as autonomous agents, but benchmarks lack multi-agent dynamics. Existing benchmarks either focus on single-agent tasks or are confined to narrow domains, failing to capture the dynamics of multi-agent coordination and competition. Thus, there is a need to evaluate LLM-based multi-agent systems across diverse, interactive scenarios. Current evaluation paradigms remain insufficient for multi-agent scenarios. Traditional single-agent benchmarks primarily focus on isolated reasoning and generation, overlooking the dynamics intrinsic to multi-agent interactions.
The study introduces MultiAgentBench, a benchmark to evaluate LLM-based multi-agent systems across task-solving and simulation scenarios. The MARBLE framework supports communication topologies. Experiments evaluated coordination protocols such as star, chain, and graph topologies, alongside strategies such as group discussion and cognitive planning. Notably, gpt-4o-mini reached the highest task score, while graph structure performed best in research, and cognitive planning improved milestone achievement rates.
Key Takeaways#
Why does it matter?#
MultiAgentBench offers diverse scenarios for LLM-based agents, advancing AGI-level collaboration insights. It aids complex task-solving and simulation, offering a structured evaluation, fostering future research and applications.
Visual Insights#

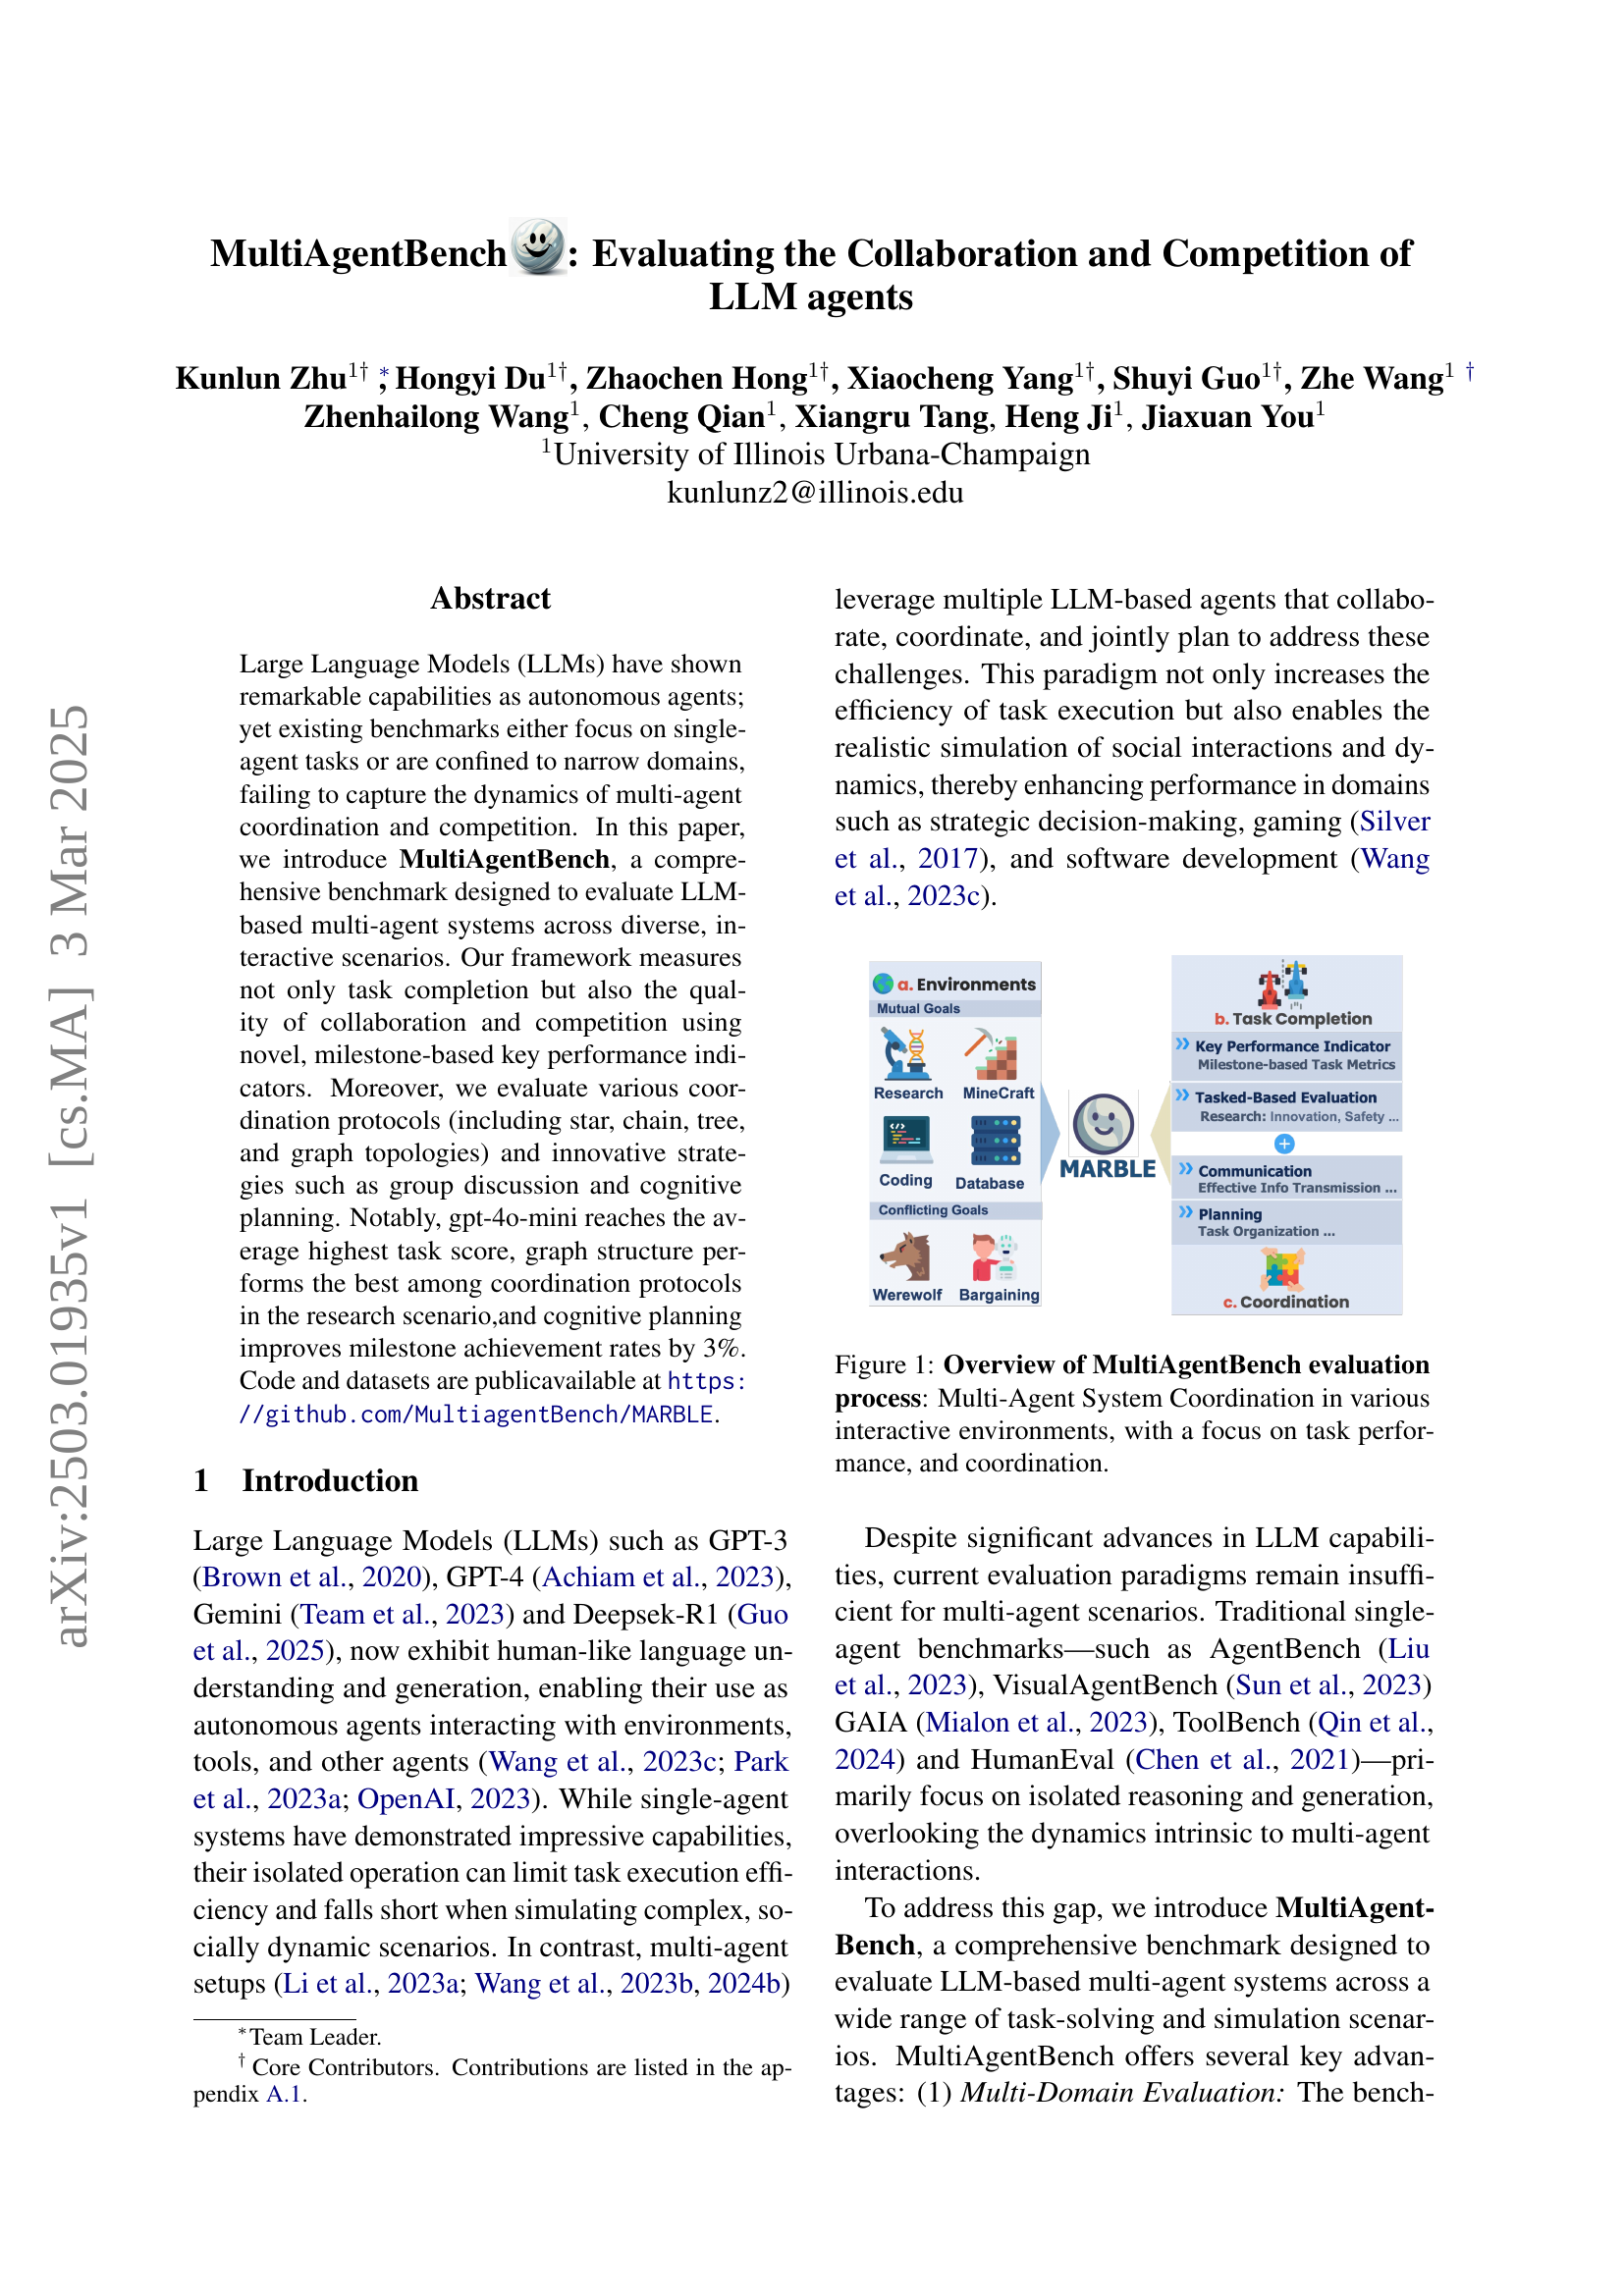
🔼 This figure illustrates the MultiAgentBench evaluation process, focusing on multi-agent system coordination within diverse interactive scenarios. It highlights three key aspects of the evaluation: the different environments used (with examples shown), the key performance indicators (KPIs) used to measure task completion, and the various coordination protocols being evaluated.
read the caption
Figure 1: Overview of MultiAgentBench evaluation process: Multi-Agent System Coordination in various interactive environments, with a focus on task performance, and coordination.
| Model | Research | Minecraft | Database | Coding | Bargaining | WereWolf | ||||||
|---|---|---|---|---|---|---|---|---|---|---|---|---|
| TS | CS | TS | CS | TS | CS | TS | CS | TS | CS | TS | CS | |
| Meta-Llama-3.1-8B | 80.87 | 52.40 | 6.12 | 54.40 | 34.00 | 40.00 | 59.90 | 67.24 | 72.81 | 73.36 | 12.64 | 60.00 |
| Meta-Llama-3.1-70B | 80.80 | 49.50 | 0.21 | 75.00 | 53.00 | 37.70 | 62.10 | 67.18 | 72.13 | 71.46 | 19.82 | 60.60 |
| Meta-Llama-3.3-70B | 80.00 | 72.00 | 9.15 | 69.00 | 28.50 | 40.00 | 56.60 | 74.40 | 73.15 | 69.56 | 36.33 | 76.30 |
| gpt3.5-turbo | 70.20 | 55.90 | 5.05 | 63.60 | 45.00 | 60.89 | 55.50 | 76.20 | 71.67 | 72.00 | 15.69 | 75.90 |
| gpt-4o-mini | 84.13 | 52.00 | 33.60 | 61.50 | 45.00 | 43.22 | 65.10 | 66.30 | 74.47 | 74.20 | 14.06 | 60.10 |
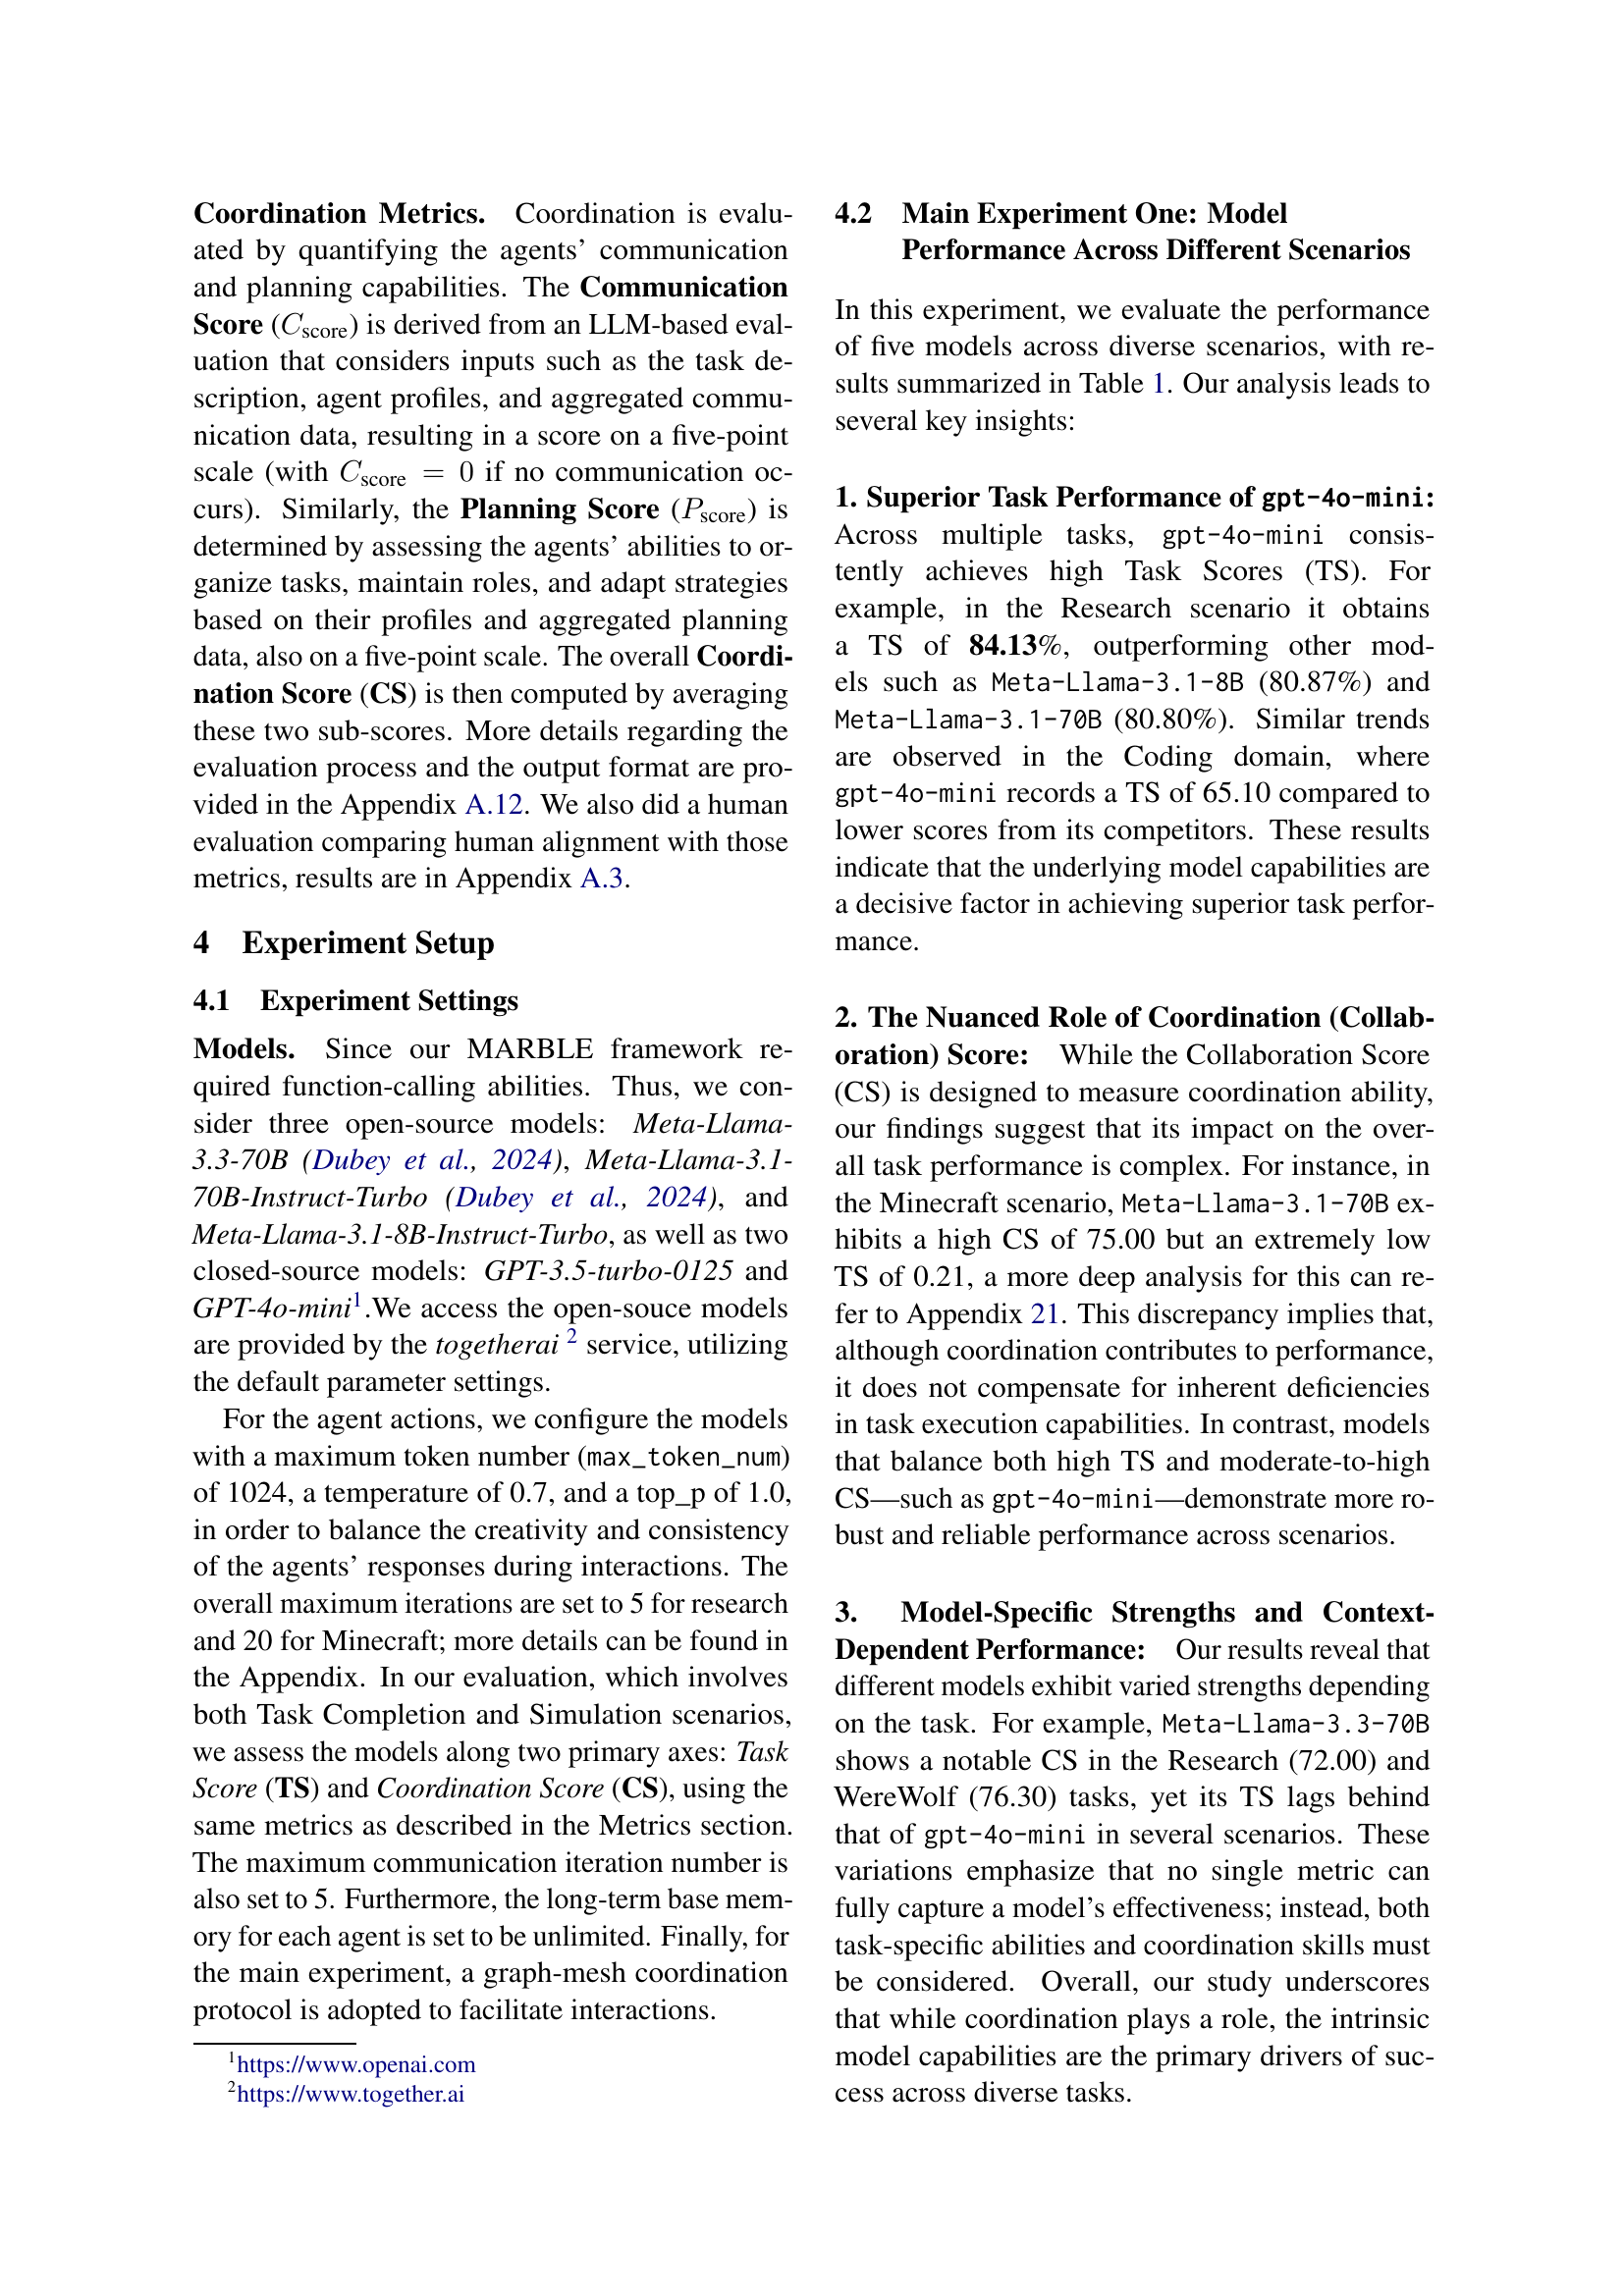
🔼 This table presents the performance of five different large language models (LLMs) across five diverse multi-agent tasks: Minecraft, Database, Coding, Bargaining, and Werewolf. The performance is measured using two key metrics: Task Score (TS), representing the overall success rate of the model in completing the task, and Coordination Score (CS), indicating the quality of collaboration between the agents within the model. The TS values are displayed as percentages and multiplied by 20 for better readability. Notably, the table highlights that the inherent capabilities of the LLM itself are the primary driver of performance, however the Coordination Score is still a good indicator of Task Score. Specifically, in three pairs of tasks, the model achieving the highest Task Score also achieves the highest Coordination Score, illustrating a clear correlation between these two metrics in those specific cases.
read the caption
Table 1: Average Task Score (TS) (%) and the Coordination Score (CS) for Minecraft, Database, Coding, Bargaining, and WereWolf, scores are multiplied by 20. We can see that model abilities are still the key factor for task completion. CS is a good indicator for TS given three pairs of scenarios having the one model having the highest TS and CS at the same time.
In-depth insights#
MARBLE: Eval Tool#
MultiAgentBench introduces MARBLE (Multi-agent coordination Backbone with LLM Engine), offering diverse communication topologies like star, chain, tree, and graphs to evaluate LLM-based multi-agent systems. It enhances the evaluation process by supporting varying coordination protocols and reasoning strategies, improving the realism and depth of multi-agent interaction analysis. MARBLE contributes significantly to assessing how LLMs coordinate in complex, interactive settings by integrating varied task metrics and flexible coordination topologies.
Multi-Agent Dynamics#
Multi-agent dynamics refers to the complex interactions between autonomous agents in a shared environment, involving collaboration, competition, and emergent behaviors. Understanding these dynamics is crucial for designing effective multi-agent systems, especially as LLMs are increasingly used as agents. Key challenges involve coordinating agents with diverse goals and capabilities, managing communication and trust, and adapting to changing environments. Analyzing these dynamics requires novel evaluation metrics that go beyond task completion, considering factors like coordination quality and fairness. Studying multi-agent dynamics offers insights into designing robust systems capable of complex problem-solving.
Key Performance#
Key Performance Indicators (KPIs) are essential for objectively evaluating multi-agent system performance, moving beyond simple task completion. These metrics must capture not only successful outcomes but also the quality of collaboration and competition inherent in complex scenarios. A robust KPI framework could incorporate milestone-based achievements, reflecting progress toward sub-goals and individual agent contributions. Furthermore, these KPI metrics must objectively quantify aspects such as communication efficiency, measured by information exchange and task execution; and also strategic coordination, measured by adaptability in goal management and role assignments. Well-defined KPIs would offer valuable insights into how LLM agents perform.
Coordination Types#
Coordination in multi-agent systems is a complex process. Centralized approaches like star and tree offer strong oversight but can limit scalability. In contrast, decentralized coordination via graph-mesh networks promotes concurrency. The choice hinges on balancing control and agility. Adaptive mechanisms and self-organizing strategies are critical. Further investigation on hybrid approaches could lead to more effective solutions. These choices significantly impact the overall system’s performance. The ultimate goal is finding an optimal balance.
Emergent Social AI#
Emergent Social AI signifies a critical frontier where artificial intelligence transcends individual capabilities to exhibit collective intelligence and social behaviors within multi-agent systems. This area explores how LLMs, when interacting, coordinate, compete, and collaborate, mirroring human social dynamics. Key aspects include the emergence of cooperation, the development of negotiation strategies, and the ability to resolve conflicts effectively. Evaluating these systems requires metrics beyond task completion, focusing on communication quality, trust-building, and strategic adaptation. Studying real-world social behaviors provides insights into complex social interactions and dynamics for designing AI systems. Emergent behaviors in multi-agent systems are pivotal to team coordination. By understanding these ‘aha moments’, we can catalyze spontaneous multi-agent dynamics and uncover novel coordination strategies that may lead to more advanced AI.
More visual insights#
More on figures

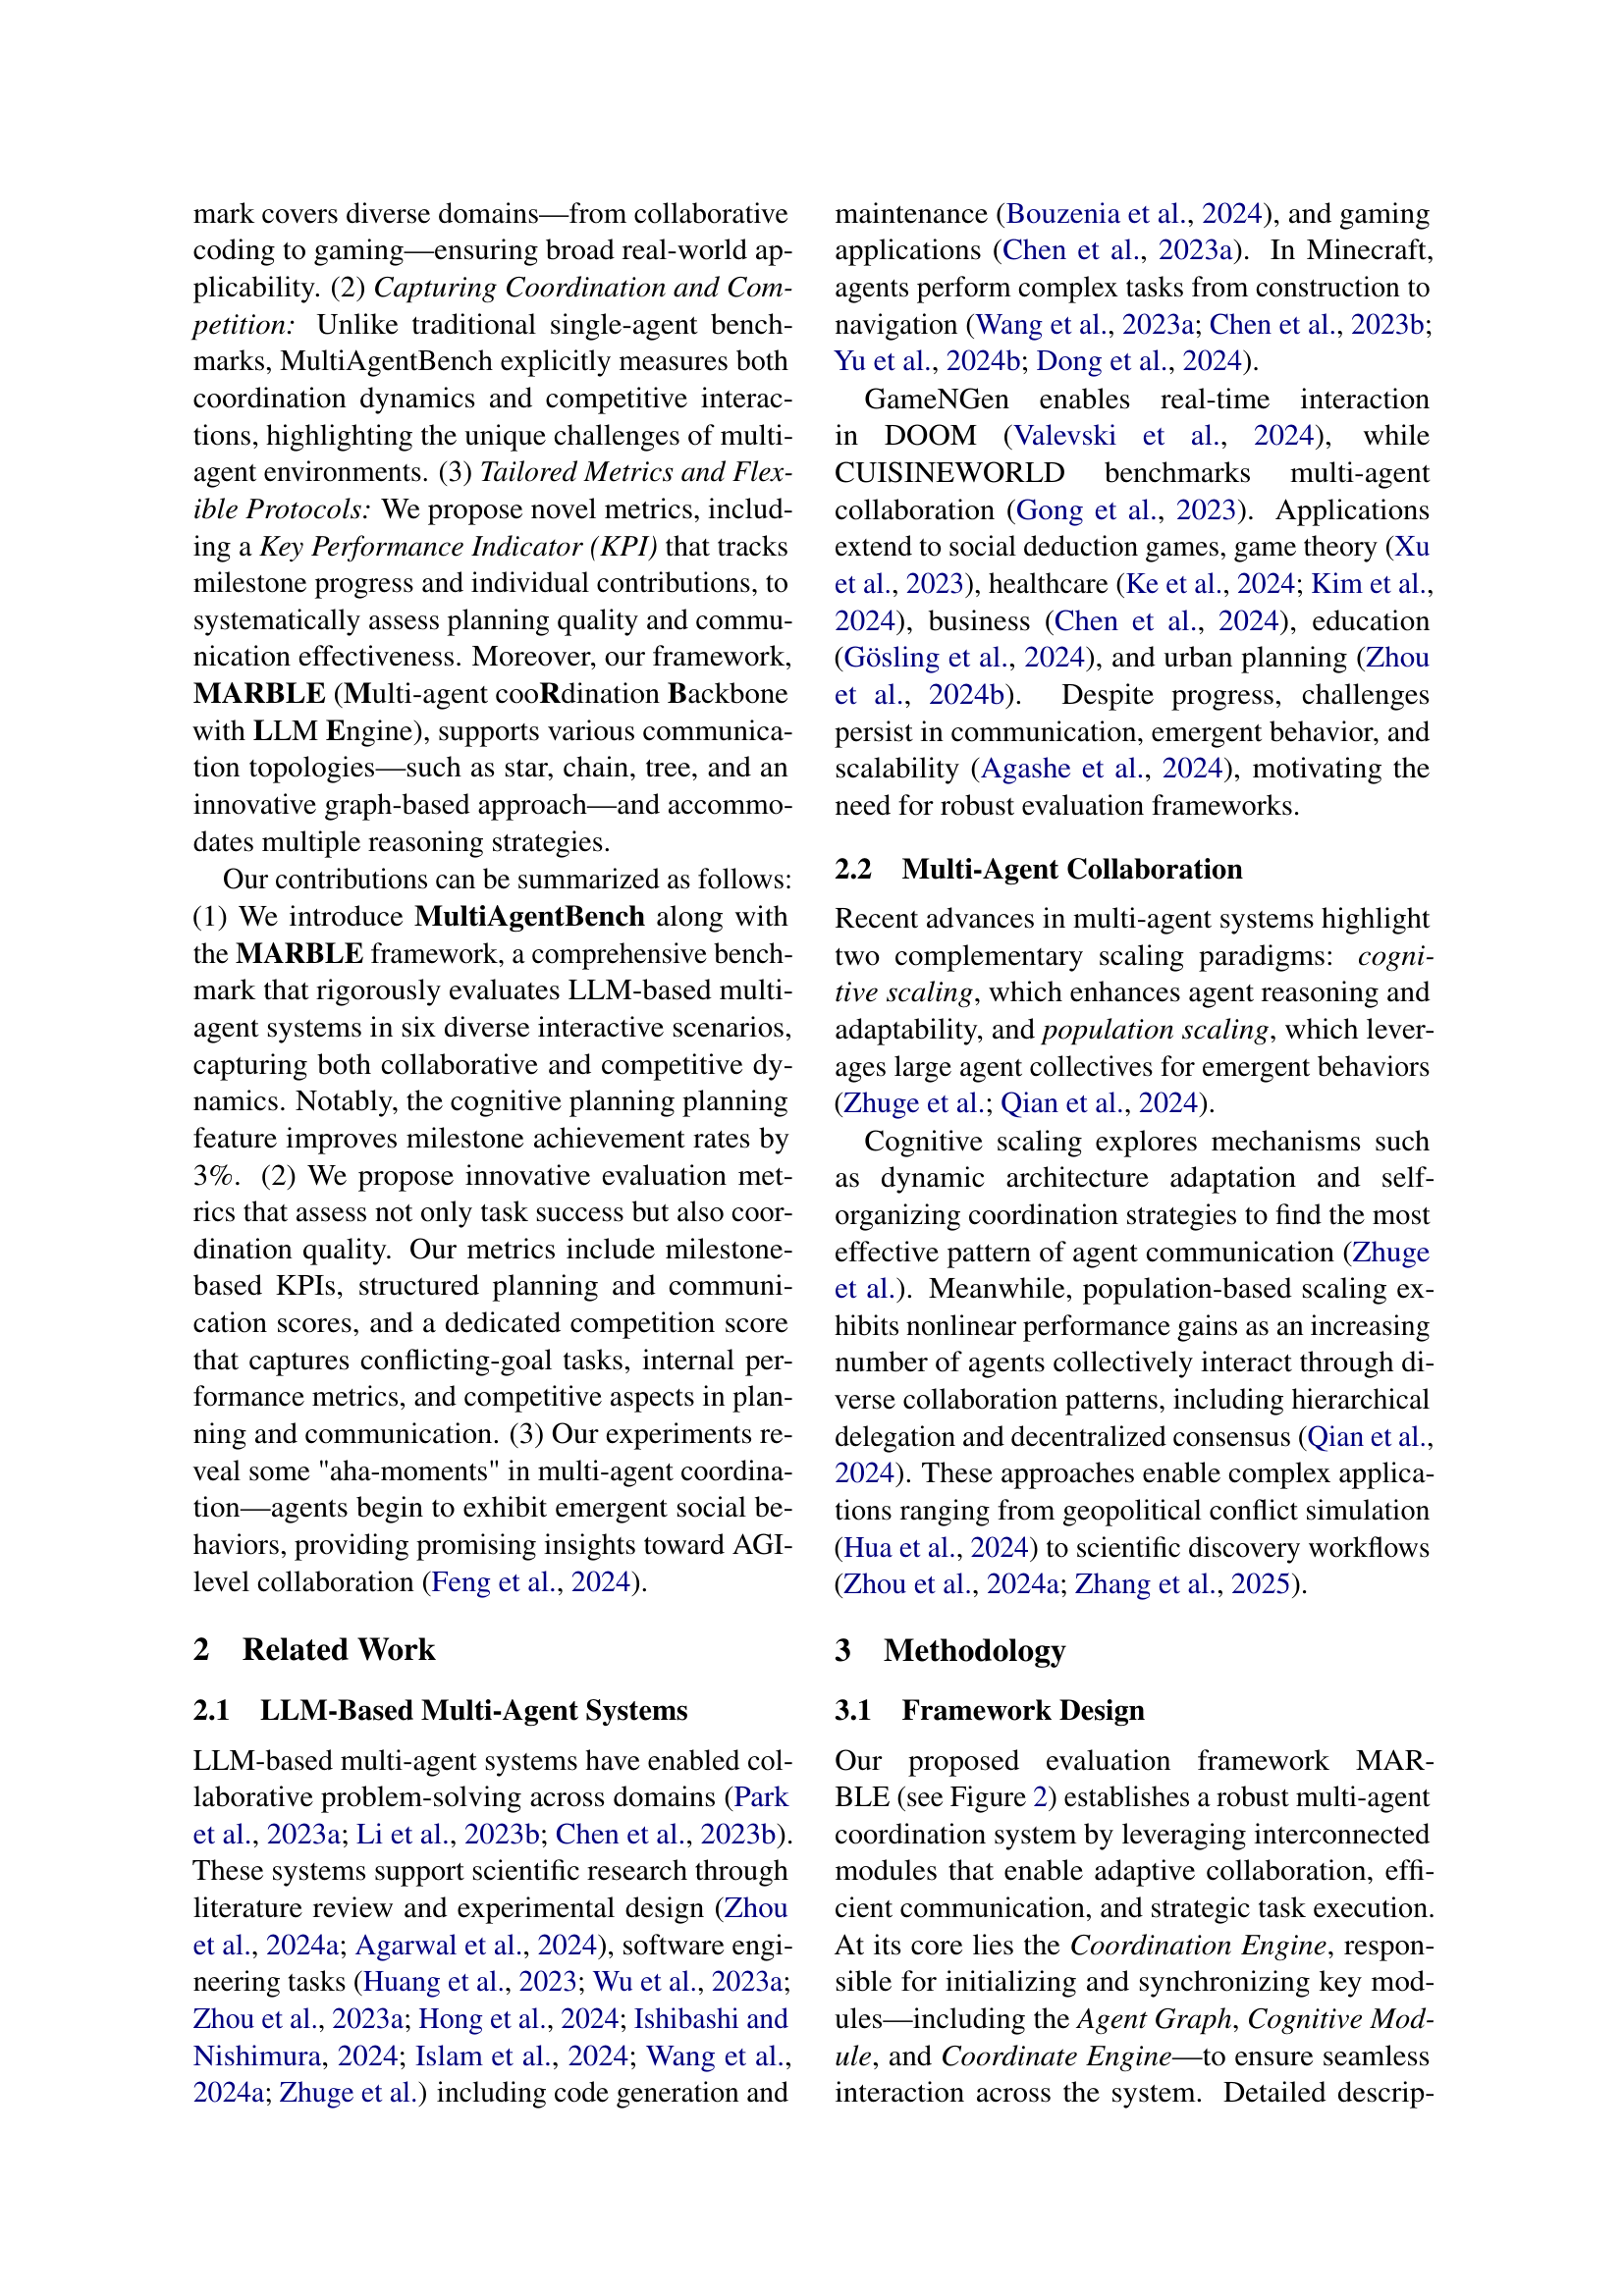
🔼 The MARBLE framework is a multi-agent coordination system that uses interconnected modules to enable effective collaboration and efficient task execution. This figure illustrates how task information, persona data (agent profiles), and domain-specific databases are integrated with memory modules (short-term and long-term) via the Coordinate Engine and the Cognitive Module. The Coordinate Engine manages the overall workflow and inter-agent relationships, while the Cognitive Module handles agent reasoning and strategy adaptation. The interactions between these modules and the environment are shown, highlighting the dynamic flow of information and actions within the MARBLE framework.
read the caption
Figure 2: MARBLE : showcasing interactions between task information, persona data, domain databases, memory modules, and the environment through the coordinate engine and cognitive module.

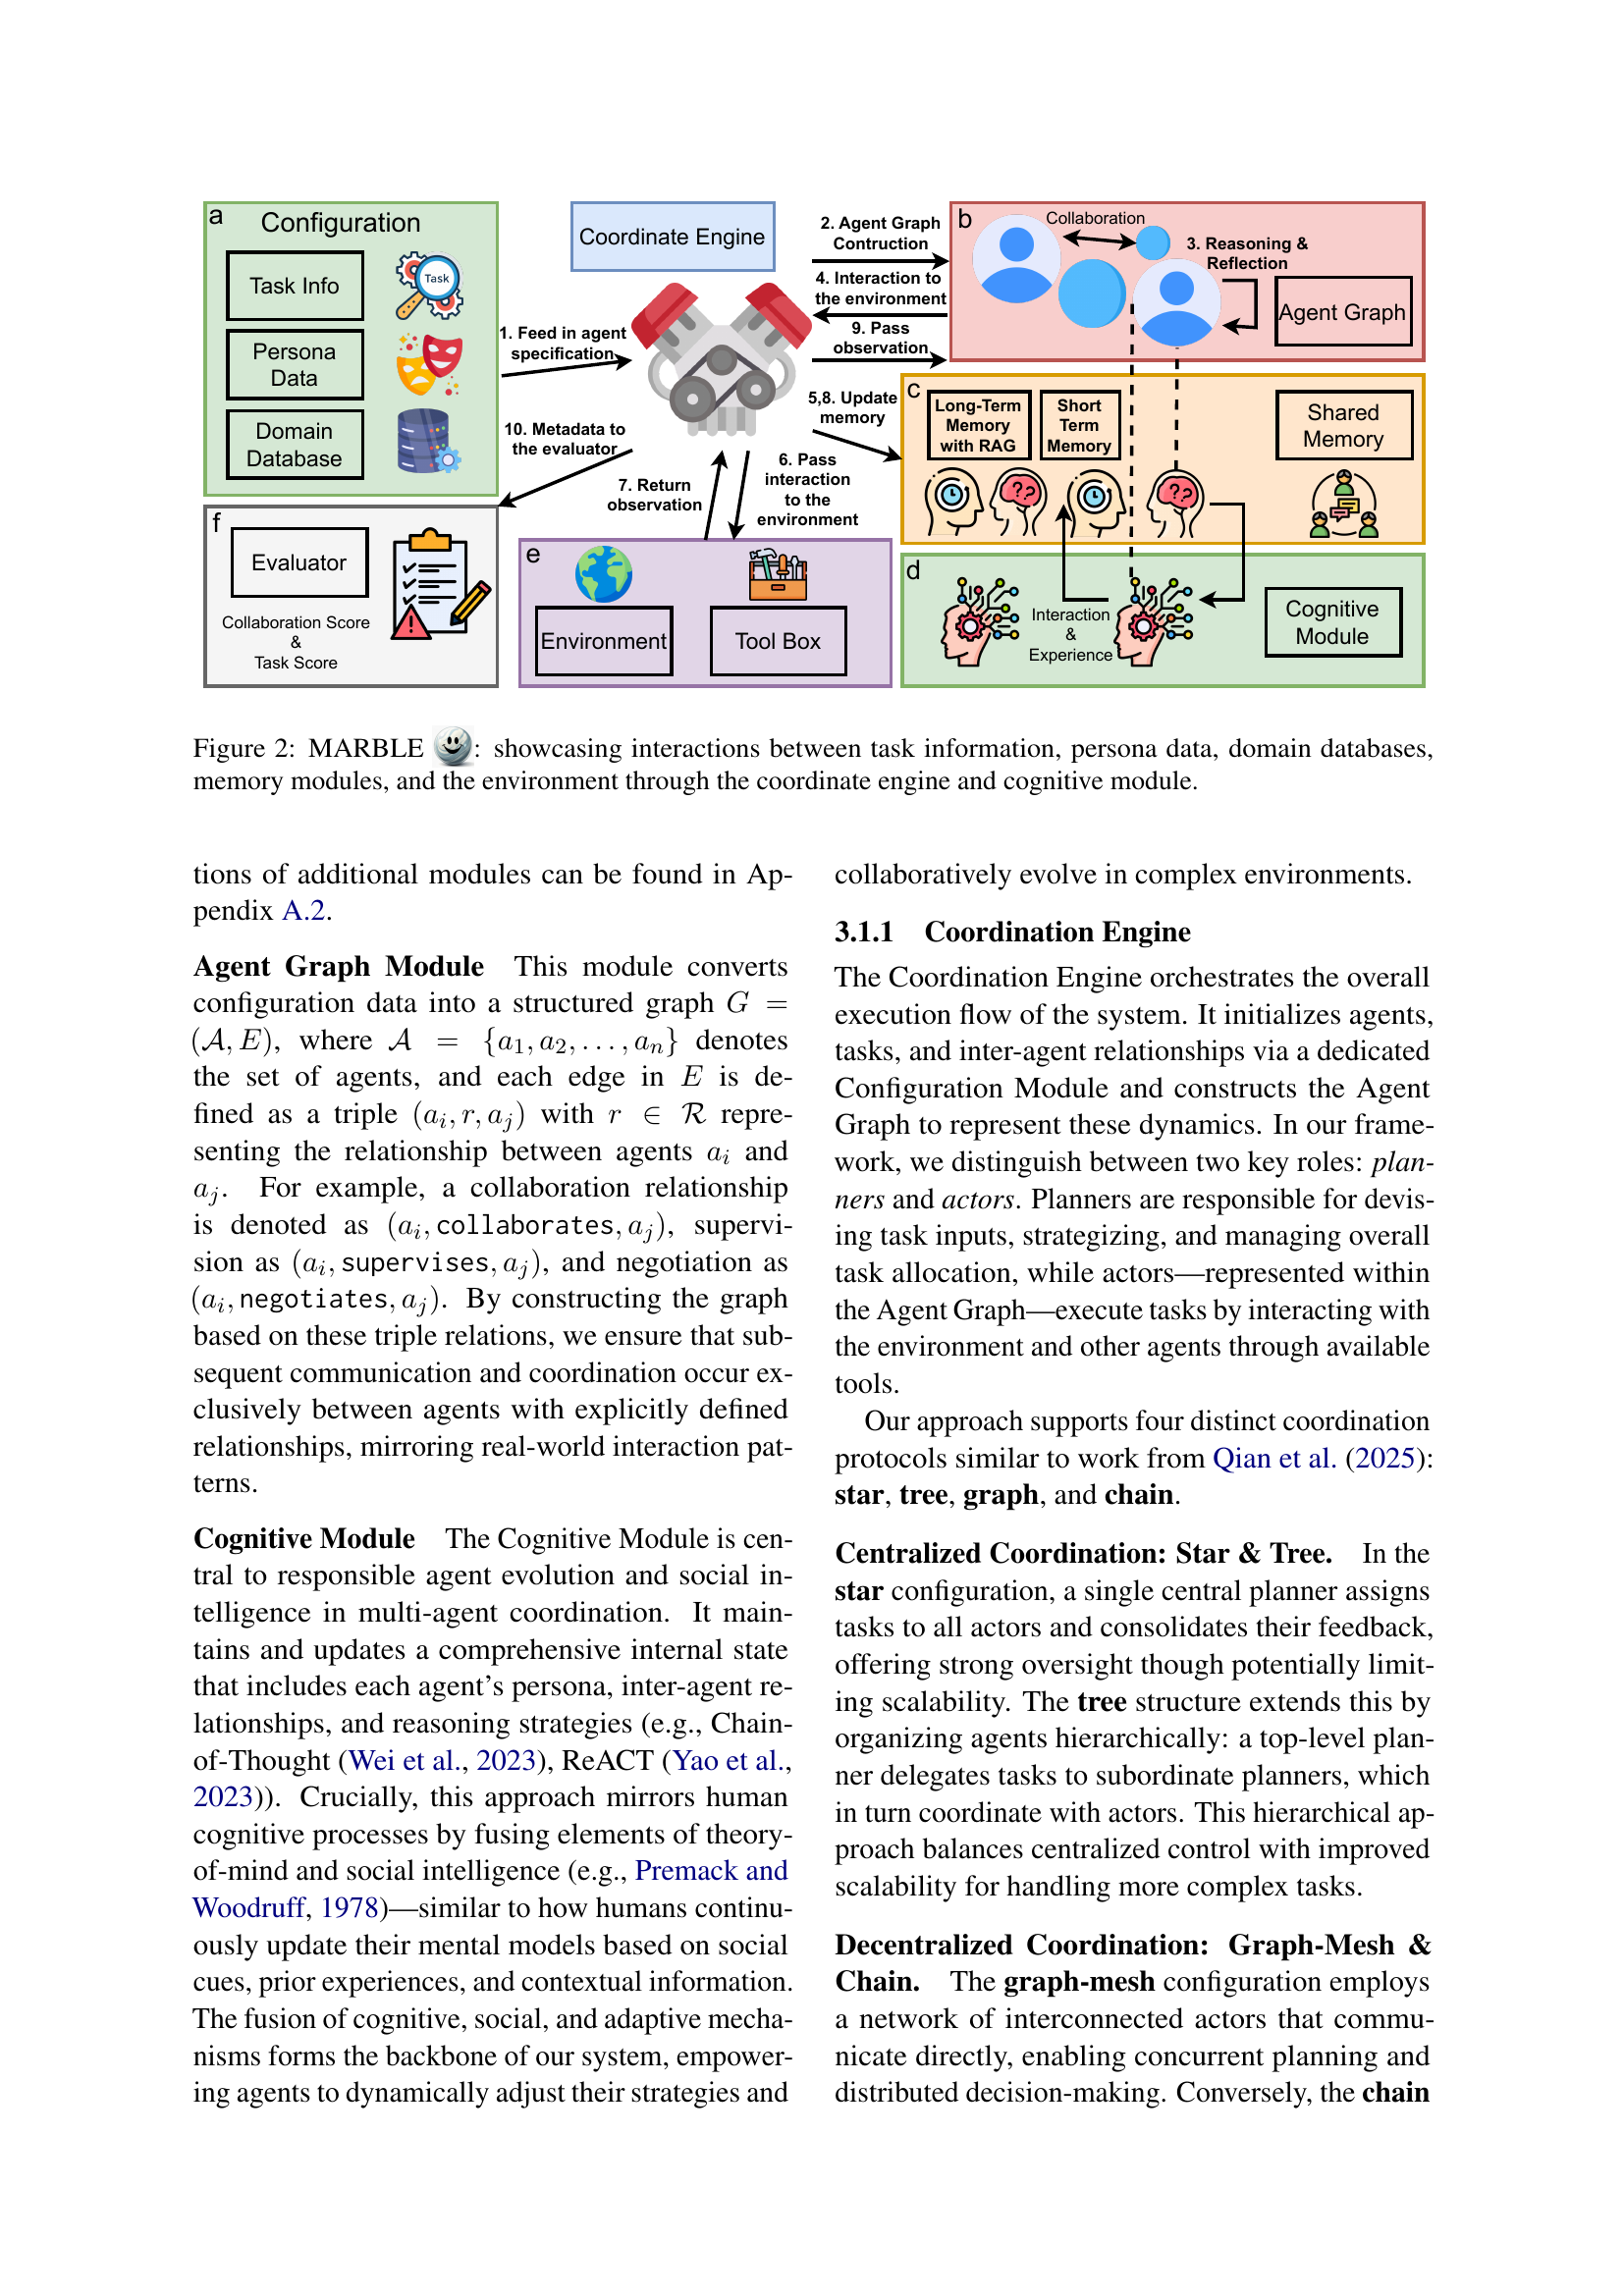
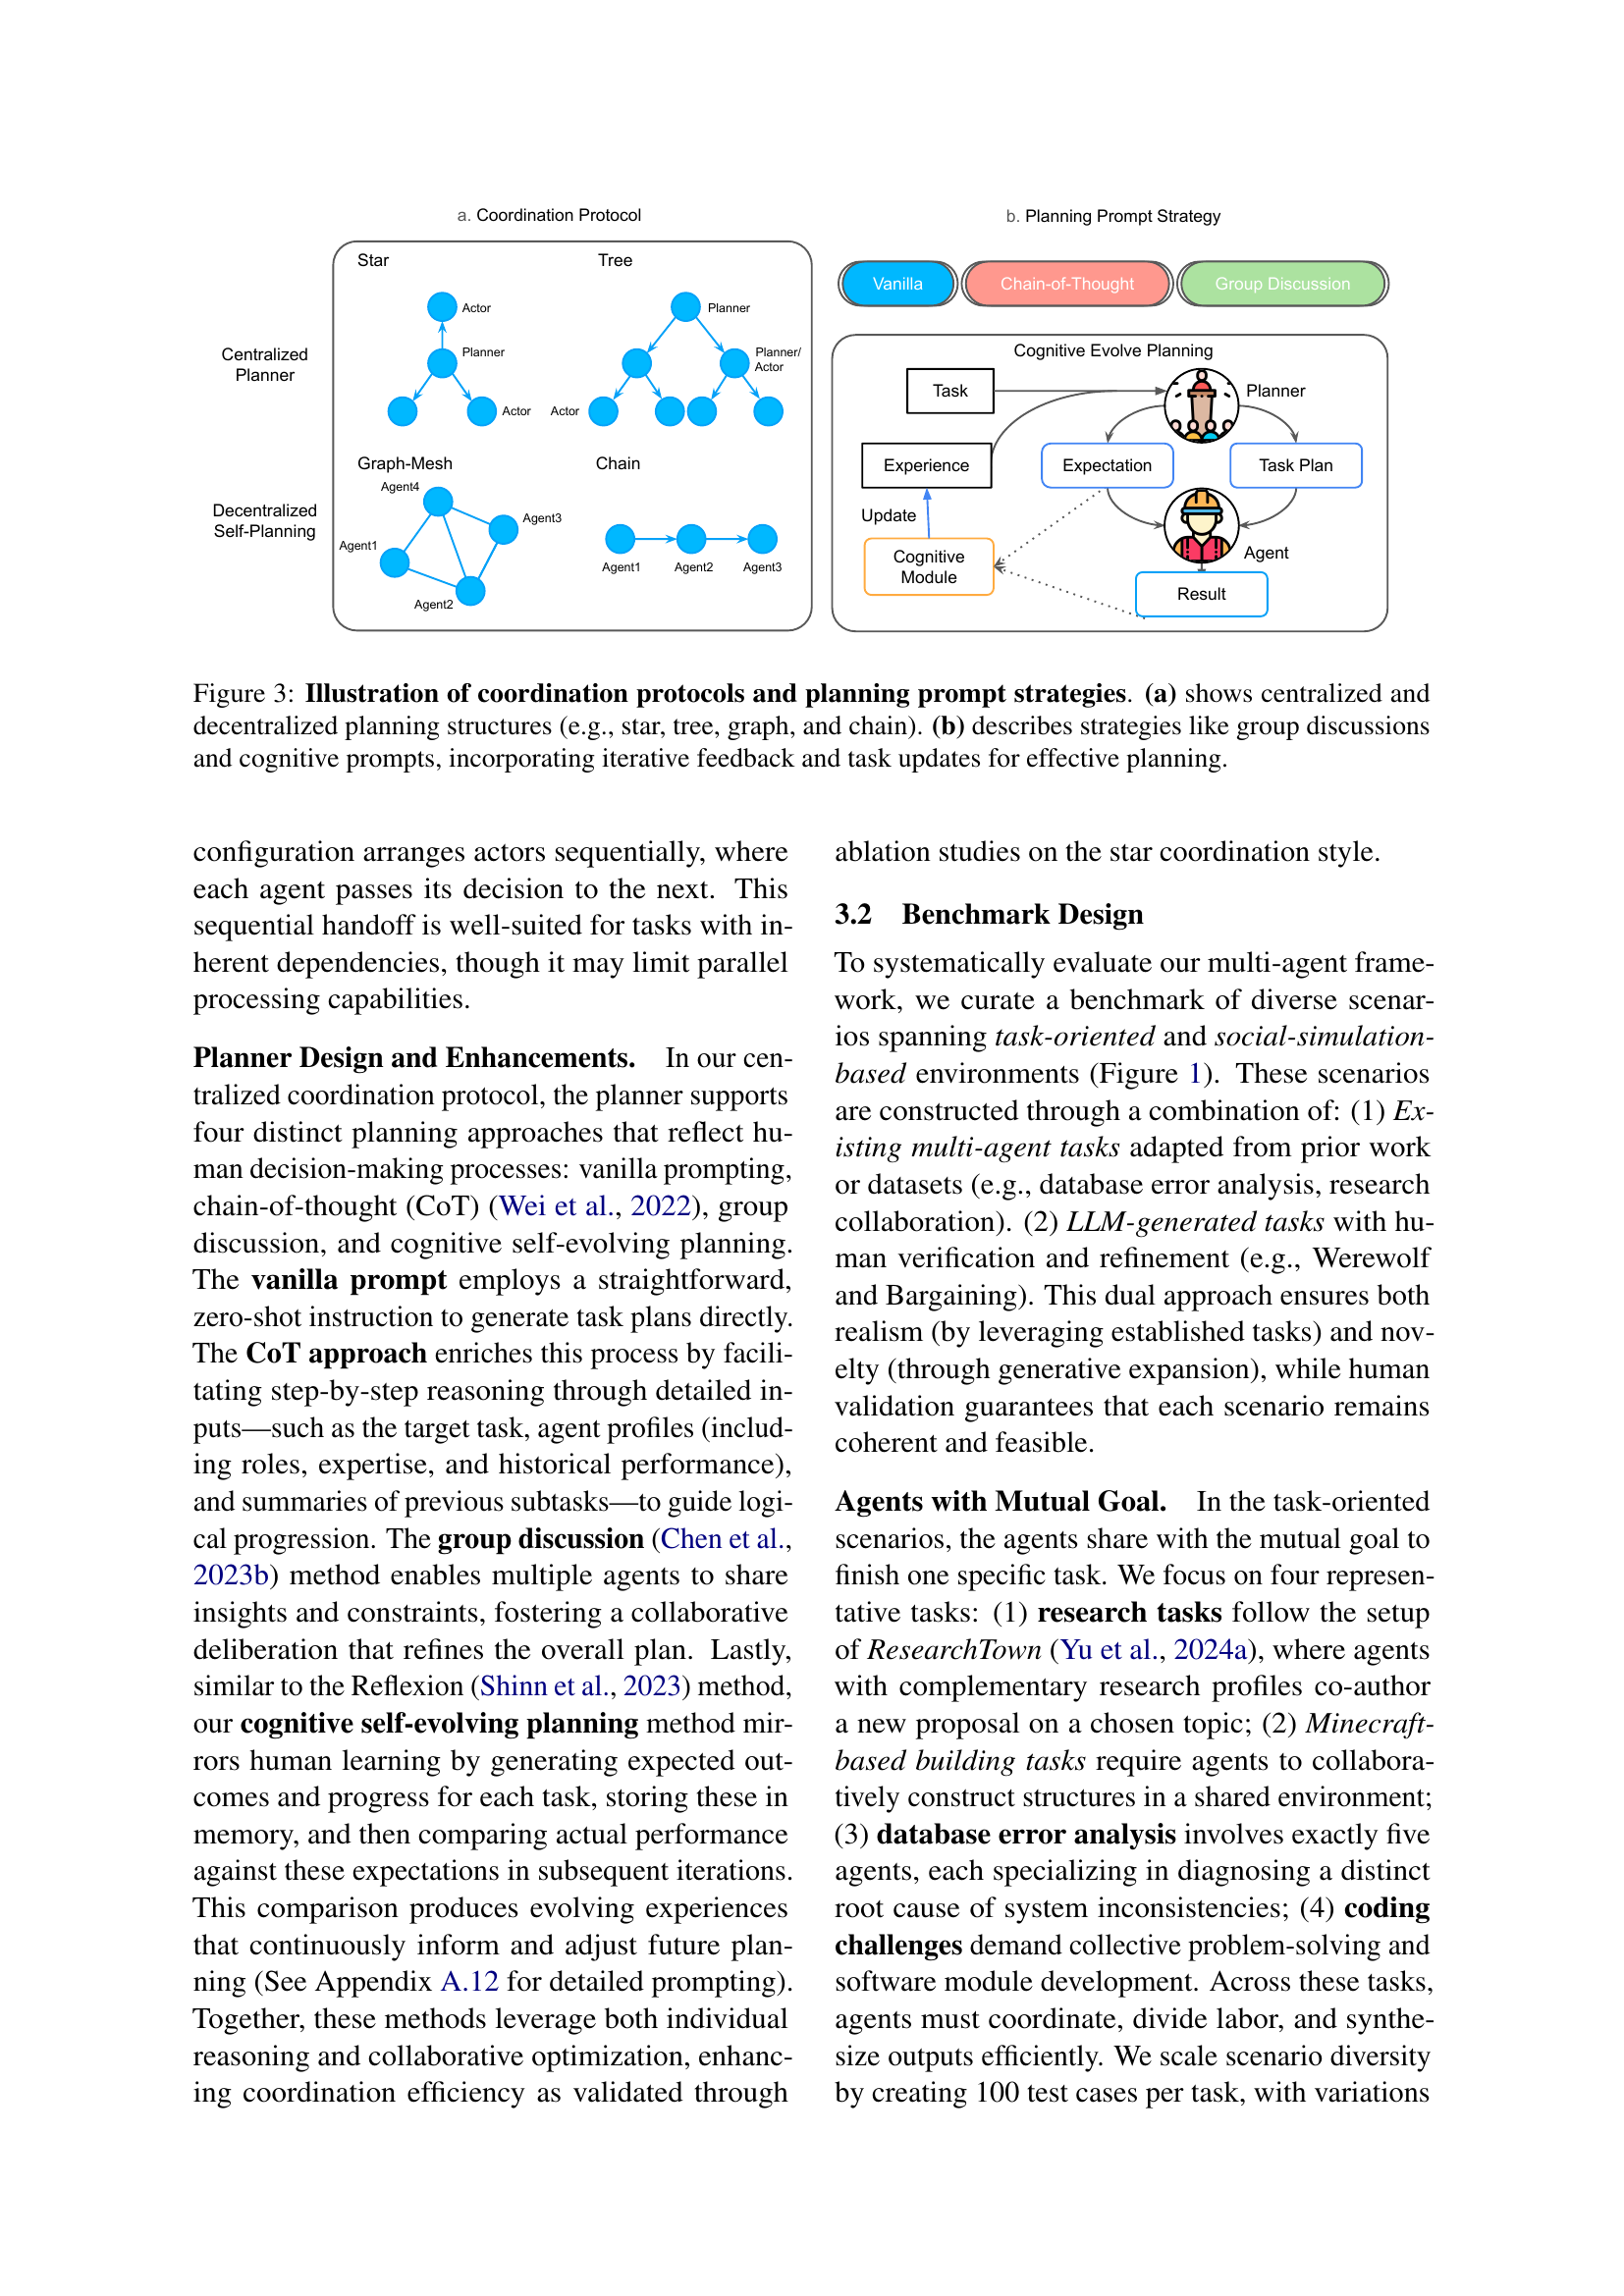
🔼 This figure illustrates the different coordination protocols and planning strategies used in the MultiAgentBench framework. Panel (a) shows four different coordination protocols: star, tree, graph, and chain. These represent different ways the agents can communicate and coordinate their actions to complete a task. The star and tree structures are centralized, meaning a single agent or a small group of agents leads the coordination effort. The graph and chain structures are decentralized; in the graph structure, multiple agents communicate directly with each other, while in the chain structure, communication flows sequentially from one agent to the next. Panel (b) depicts four different prompt strategies for planning: Vanilla Prompting, Chain-of-Thought (CoT), Group Discussion, and Cognitive Evolving Planning. These methods showcase how different approaches can influence the planning process. The vanilla prompt provides a basic instruction, while CoT guides the agent through step-by-step reasoning. Group discussion involves multiple agents sharing ideas and refining the plan collaboratively, whereas cognitive self-evolving planning allows agents to continually update their plans based on their experiences and feedback.
read the caption
Figure 3: Illustration of coordination protocols and planning prompt strategies. (a) shows centralized and decentralized planning structures (e.g., star, tree, graph, and chain). (b) describes strategies like group discussions and cognitive prompts, incorporating iterative feedback and task updates for effective planning.

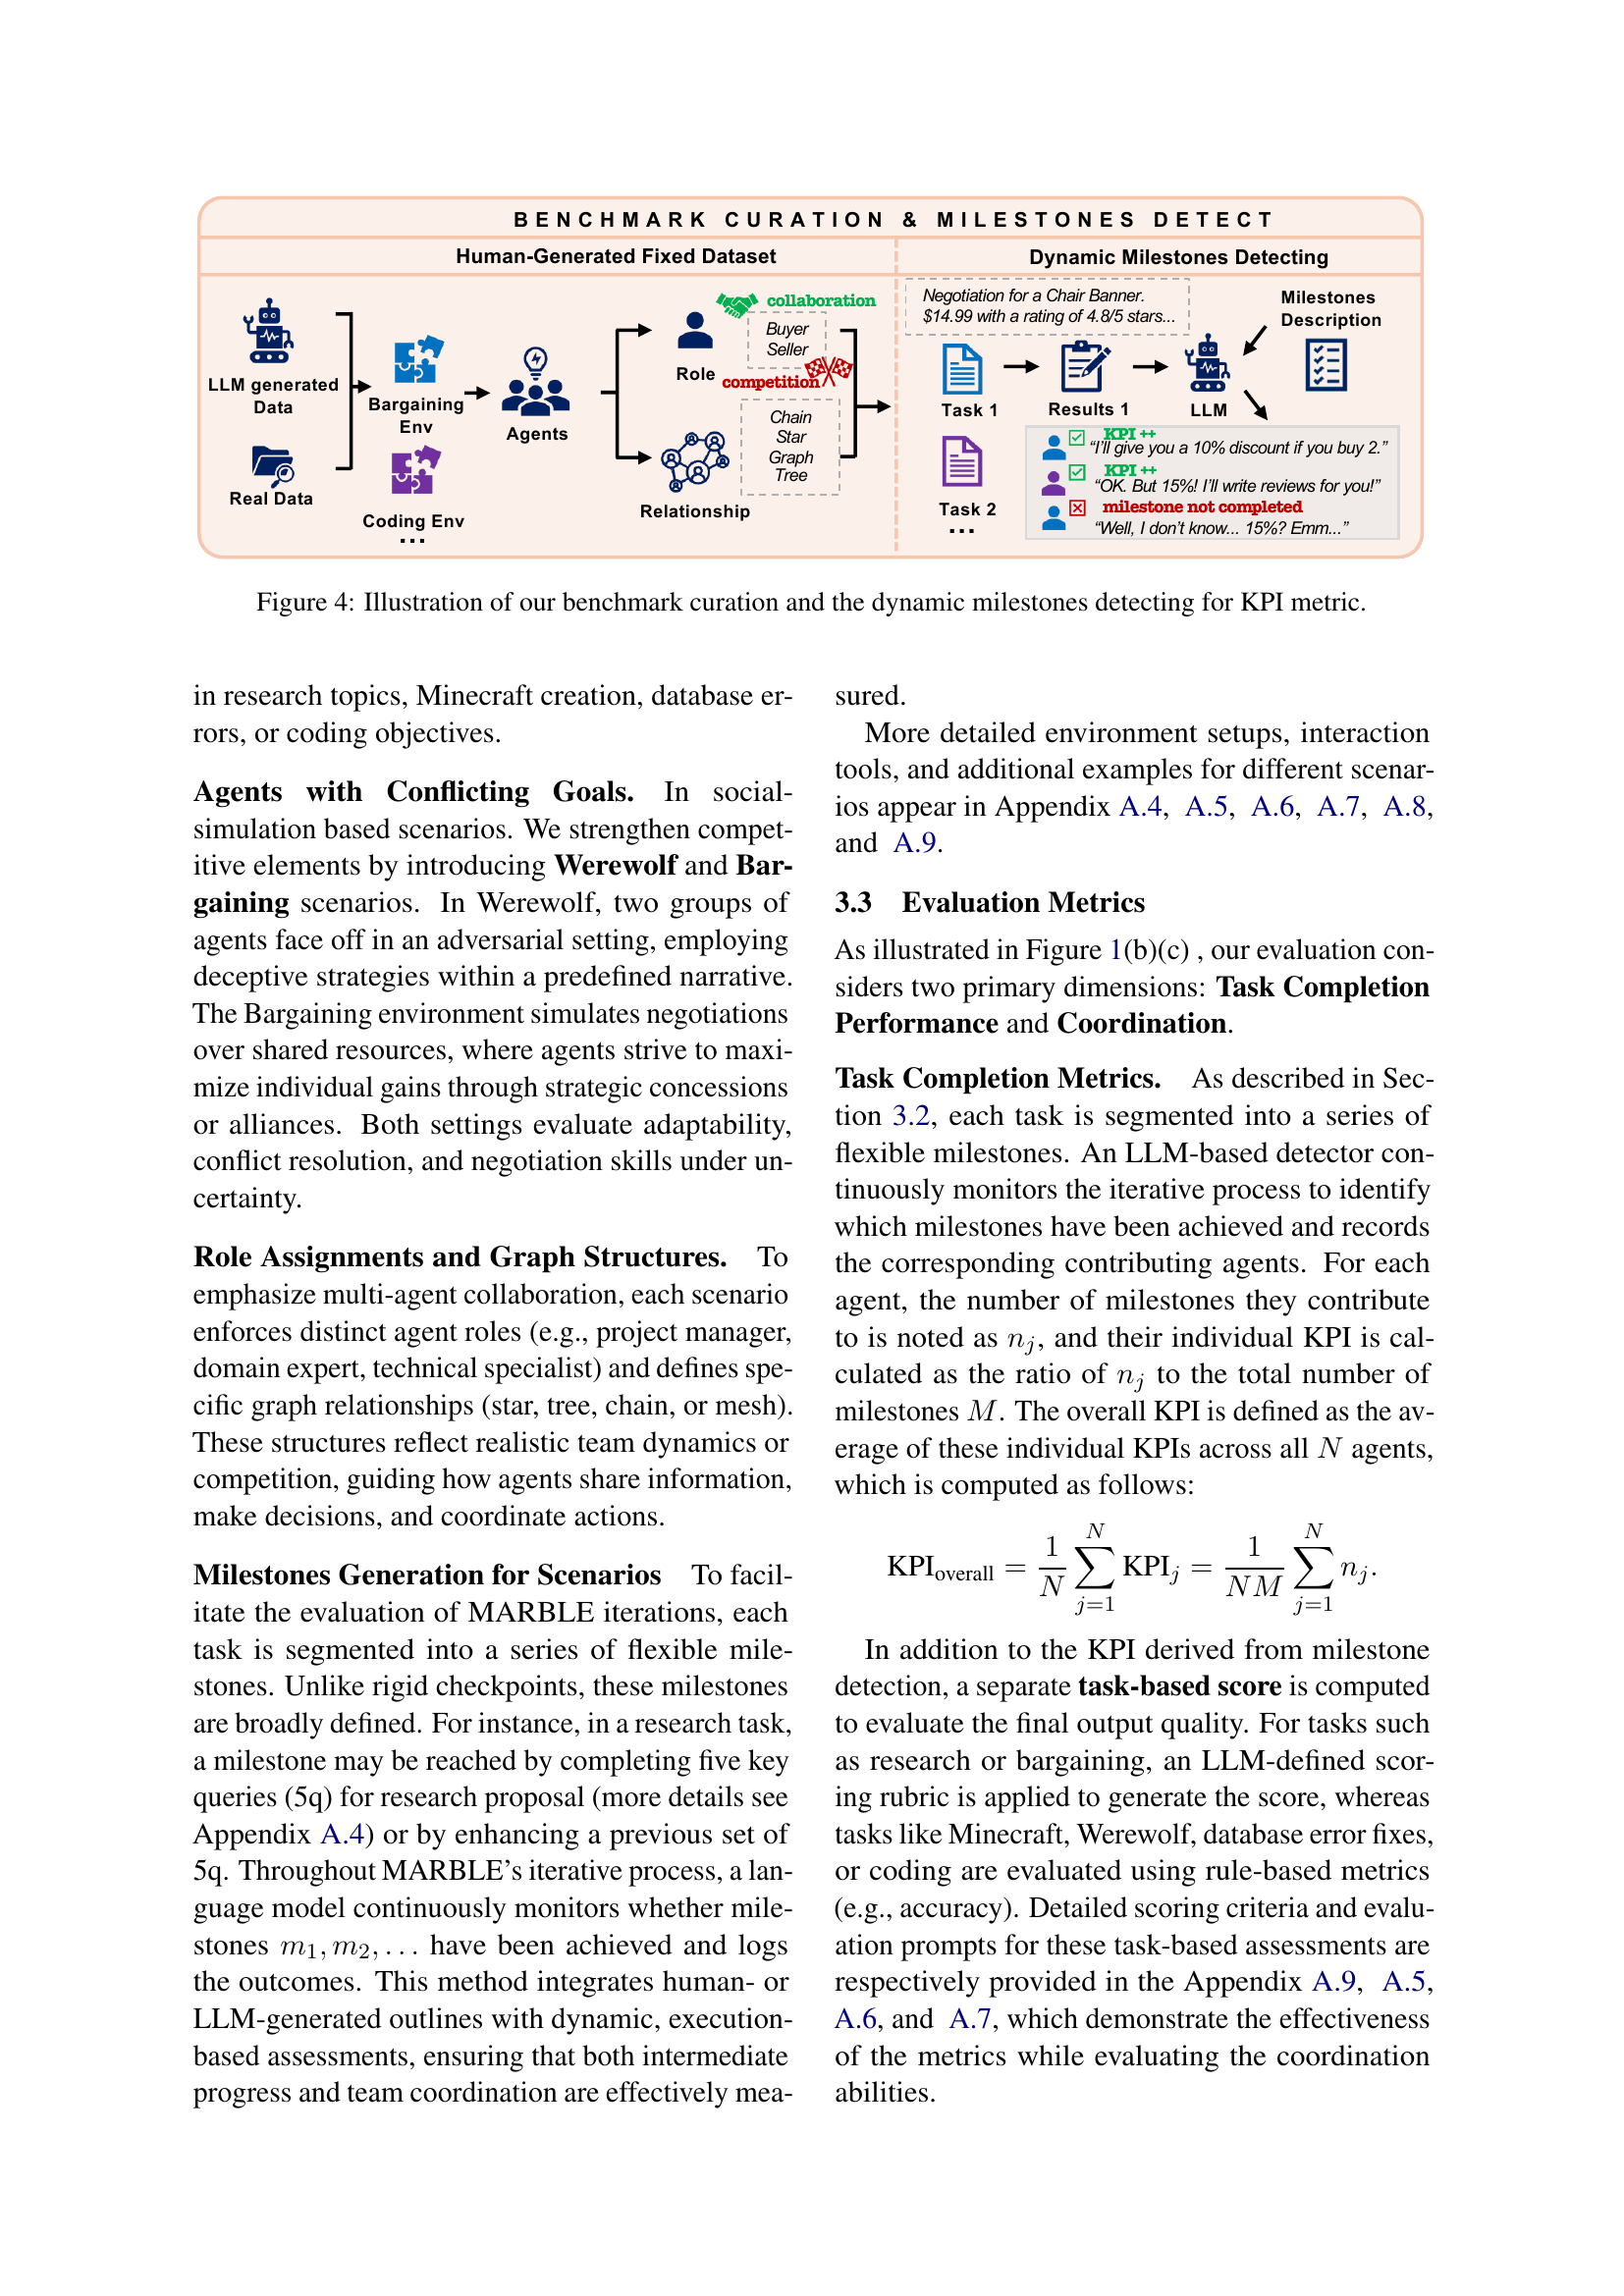
🔼 This figure illustrates the process of creating the MultiAgentBench benchmark and the method for dynamically detecting milestones to compute Key Performance Indicators (KPIs). The benchmark curation involves both human-generated datasets (for fixed tasks) and dynamic milestone detection (for scenarios with evolving tasks). Human-generated datasets provide a baseline of well-defined tasks. Dynamic milestone detection uses LLMs to monitor task progress and identify completion of intermediate steps or ‘milestones,’ contributing to a more nuanced evaluation of agent performance beyond just final task success. The process is shown for two scenarios: Minecraft creation (a human-generated fixed dataset), and a bargaining scenario (dynamic milestone detection). The dynamic milestones are then used to calculate the KPI, providing a more comprehensive assessment of multi-agent system performance.
read the caption
Figure 4: Illustration of our benchmark curation and the dynamic milestones detecting for KPI metric.
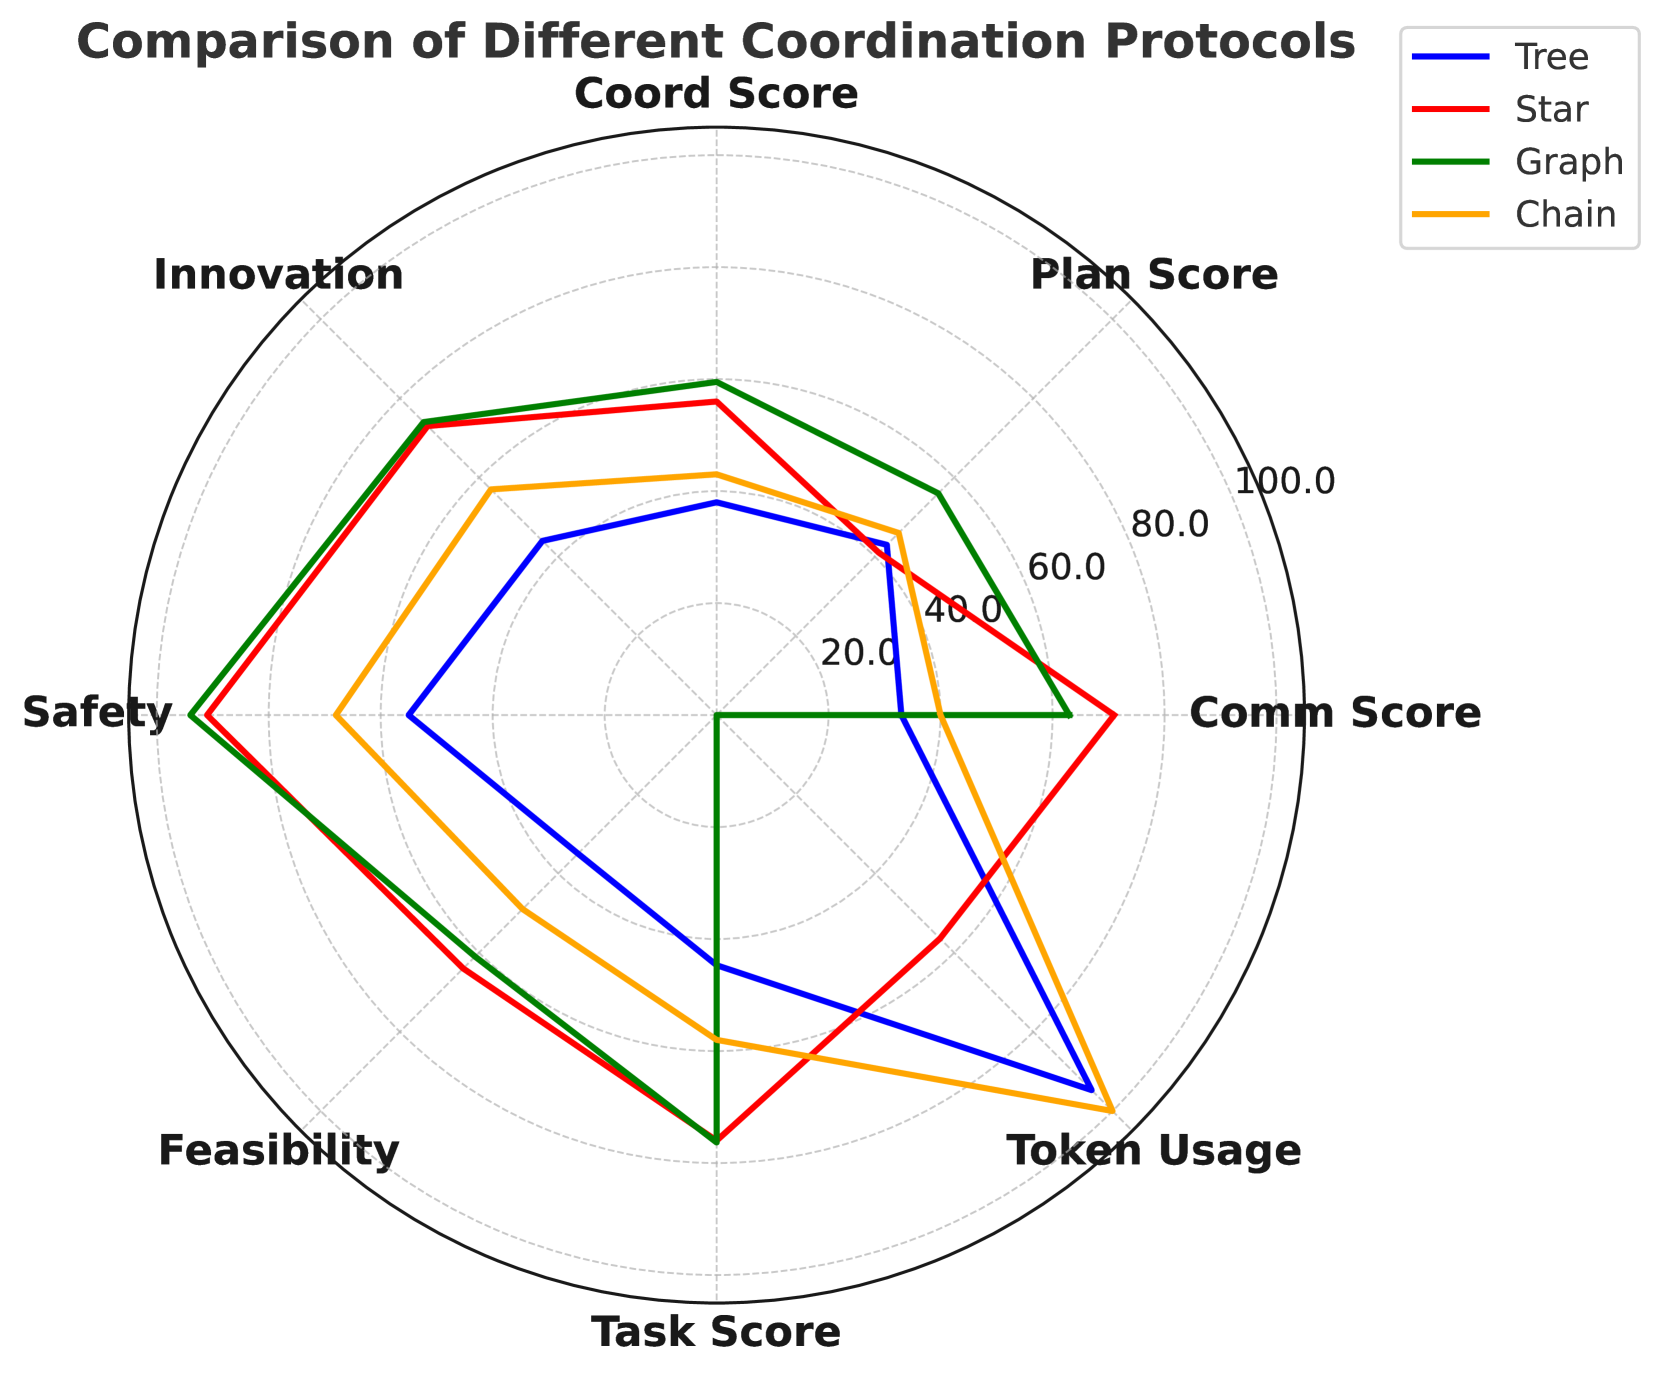
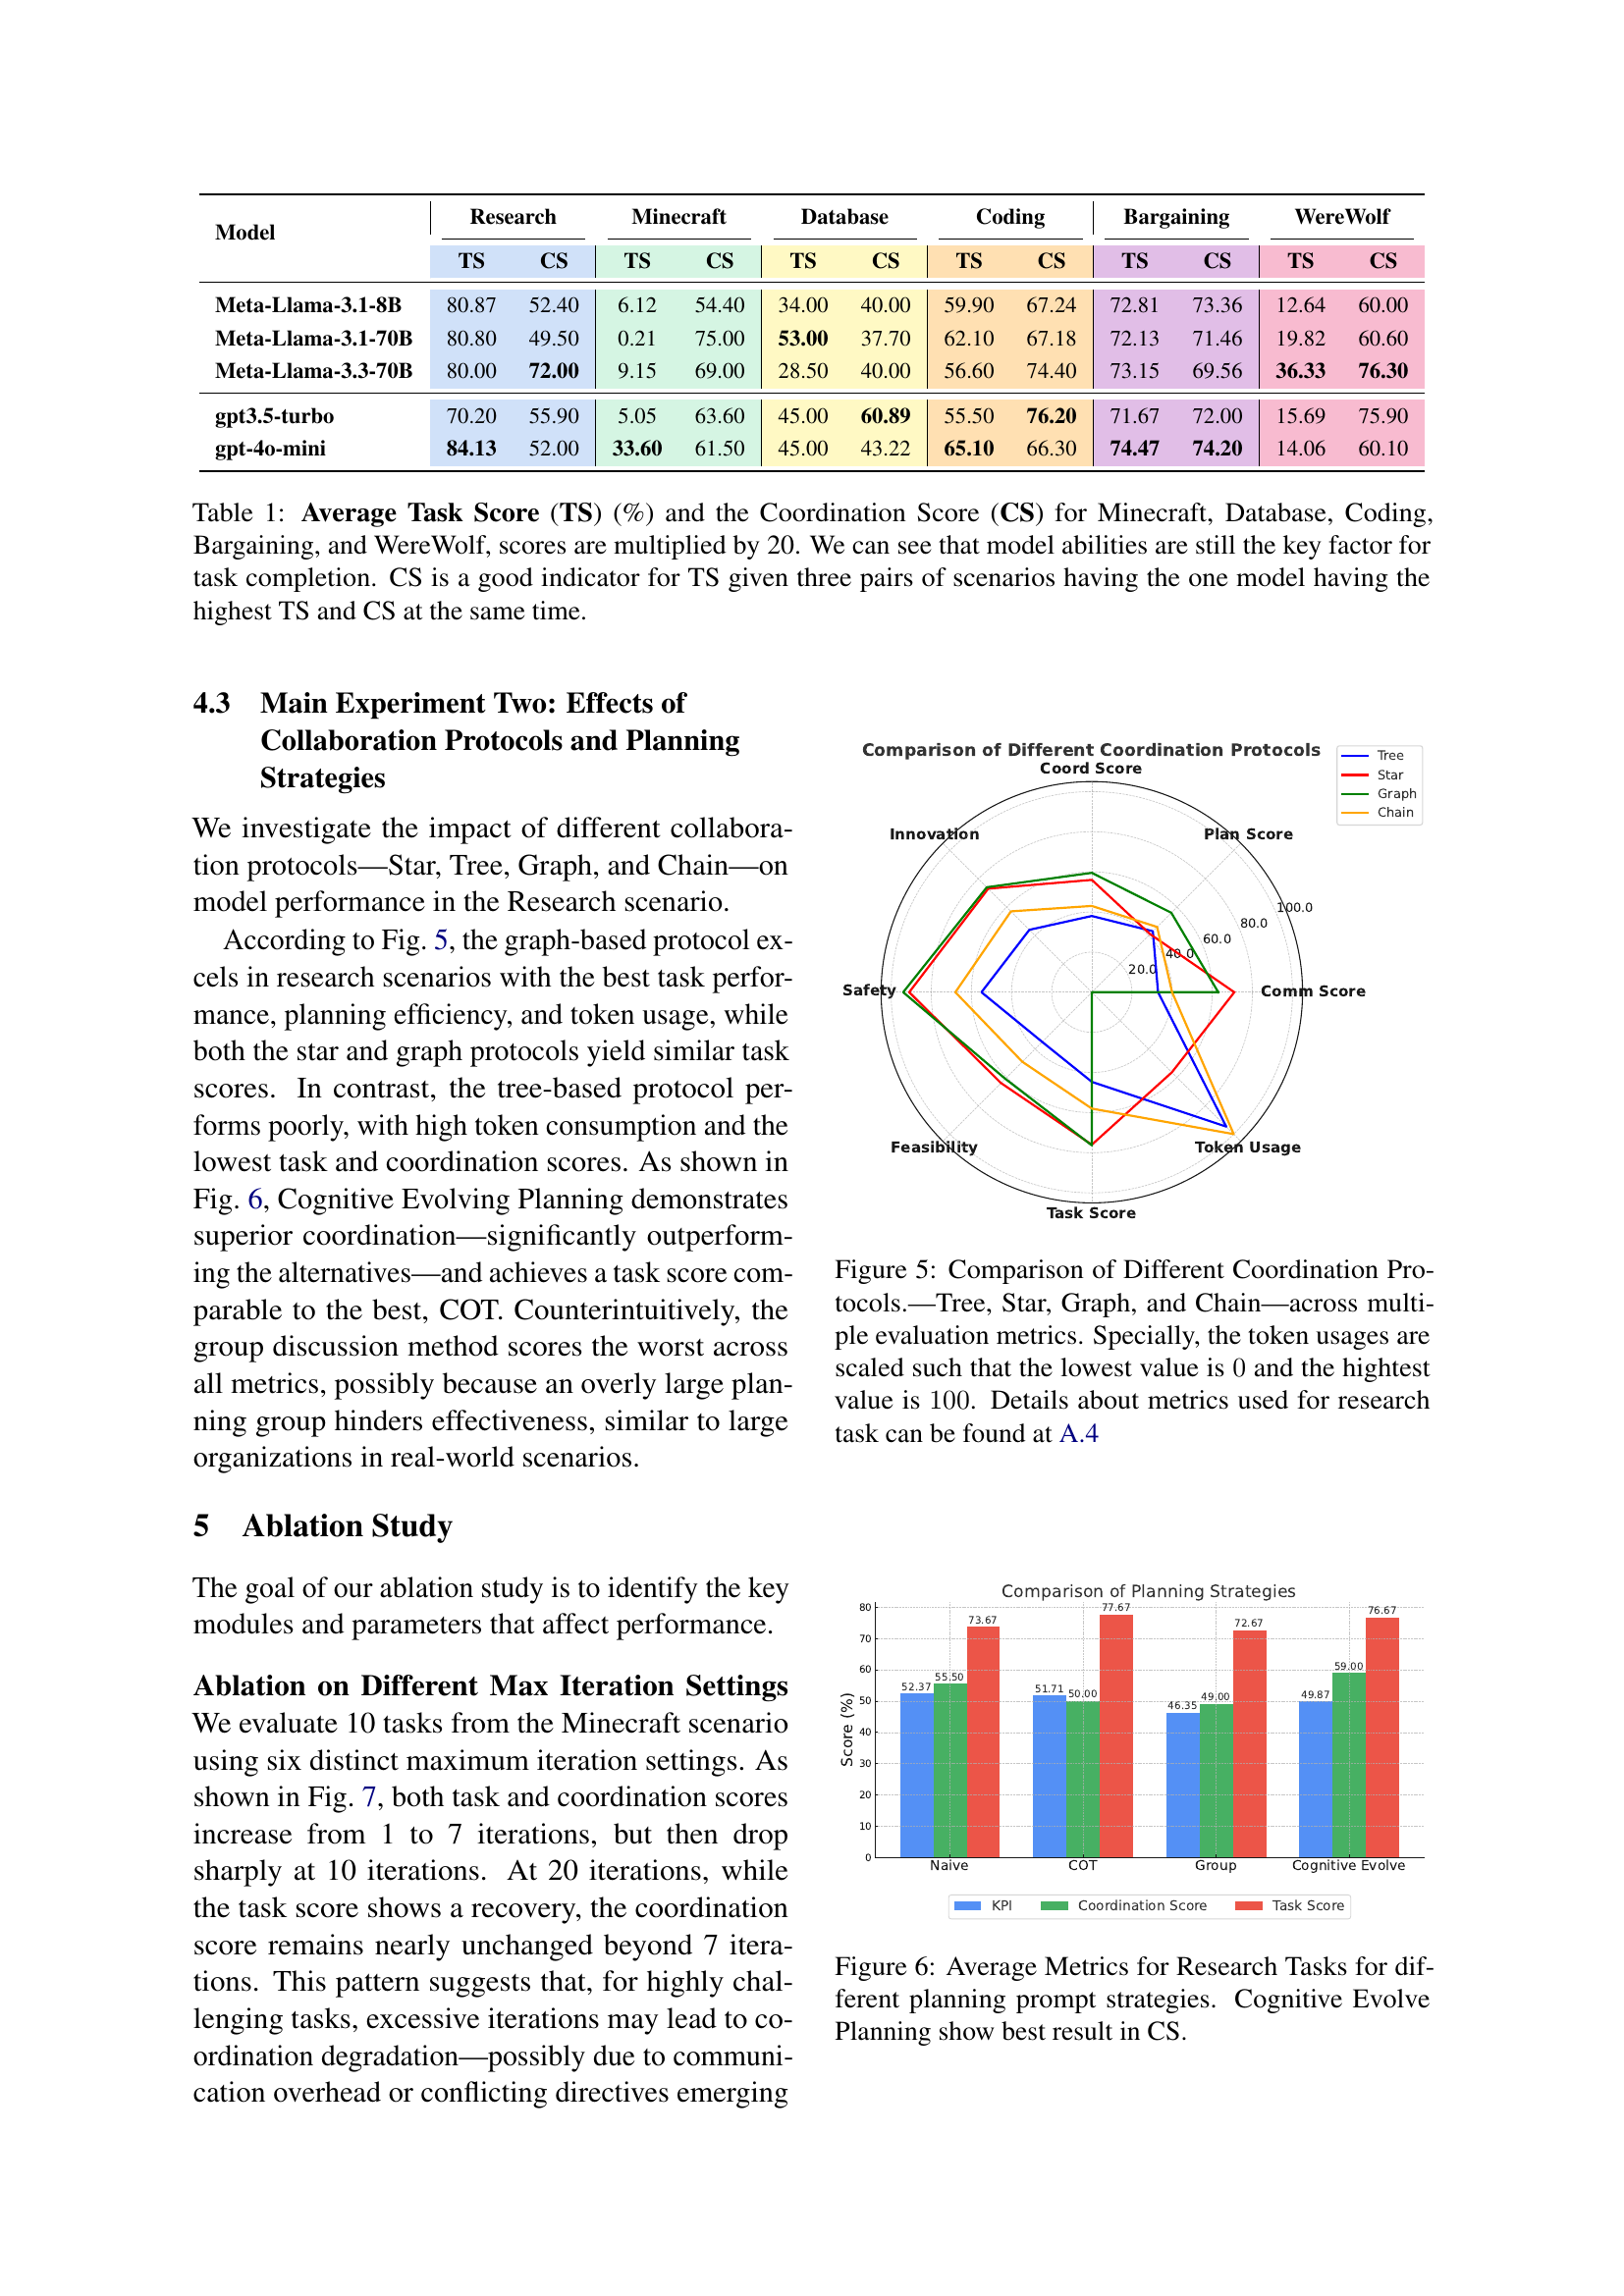
🔼 This figure compares four different multi-agent coordination protocols (Tree, Star, Graph, and Chain) across multiple evaluation metrics. The metrics assess various aspects of the agents’ performance, including task completion, communication effectiveness, planning quality, and resource usage (token usage). The token usage metric is normalized, with 0 representing the lowest and 100 the highest usage. Detailed information about the metrics used for the research task scenario is provided in Appendix A.4 of the paper. The figure visually represents the performance of each protocol, highlighting strengths and weaknesses of each approach for different aspects of coordination.
read the caption
Figure 5: Comparison of Different Coordination Protocols.—Tree, Star, Graph, and Chain—across multiple evaluation metrics. Specially, the token usages are scaled such that the lowest value is 00 and the hightest value is 100100100100. Details about metrics used for research task can be found at A.4

🔼 The figure presents a bar chart comparing the average metrics (Task Score and Coordination Score) across four different planning prompt strategies applied to the Research Task within the MultiAgentBench framework. The strategies compared are Vanilla Prompting, Chain-of-Thought prompting, Group Discussion, and Cognitive Evolving Planning. The chart clearly demonstrates that the Cognitive Evolving Planning strategy yields the highest Coordination Score, indicating its effectiveness in facilitating collaboration among the LLM agents.
read the caption
Figure 6: Average Metrics for Research Tasks for different planning prompt strategies. Cognitive Evolve Planning show best result in CS.

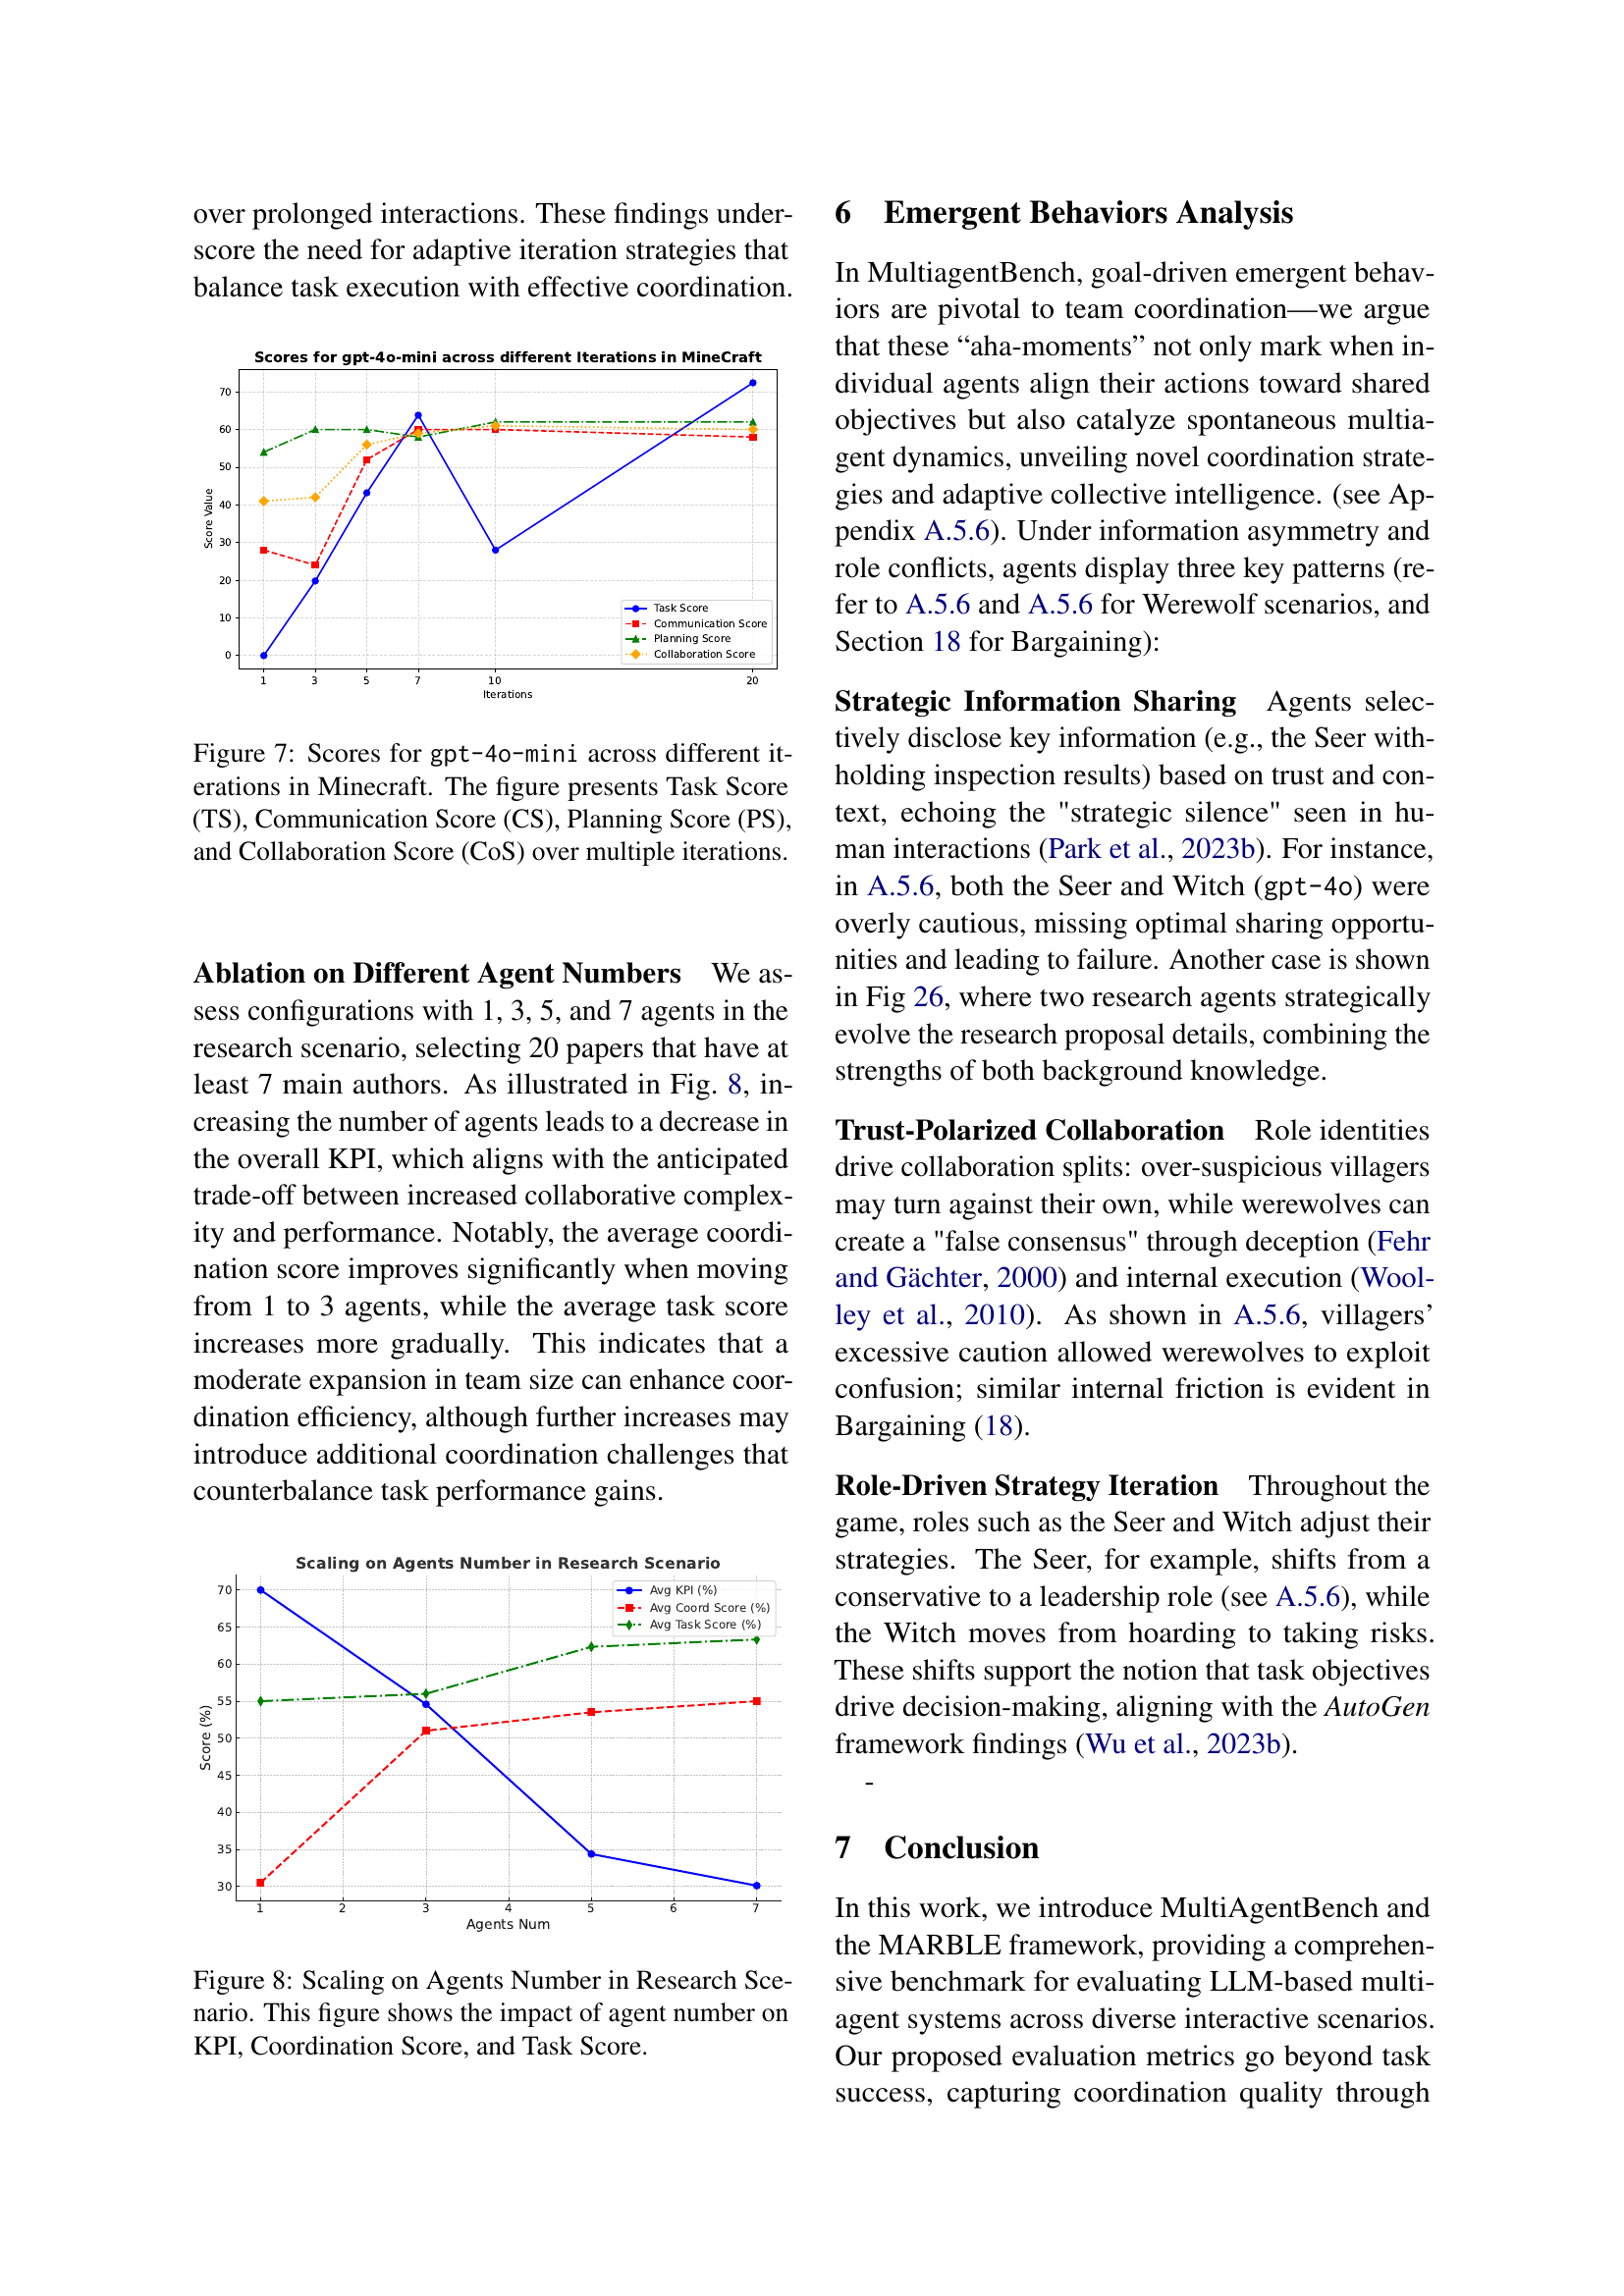
🔼 This figure displays the performance of the gpt-4o-mini model across multiple iterations of a Minecraft task. It tracks four key metrics over time: Task Score (TS), which measures the overall success in completing the Minecraft task; Communication Score (CS), which assesses the quality of communication between agents; Planning Score (PS), which evaluates the effectiveness of the planning process; and Collaboration Score (CoS), which represents a combination of communication and planning, reflecting overall team effectiveness. By observing the trends in each metric across iterations, we can understand the model’s learning trajectory, its ability to improve task performance over time, and its efficiency in collaborative problem-solving.
read the caption
Figure 7: Scores for gpt-4o-mini across different iterations in Minecraft. The figure presents Task Score (TS), Communication Score (CS), Planning Score (PS), and Collaboration Score (CoS) over multiple iterations.

🔼 This figure demonstrates the relationship between the number of agents involved in a research task and the overall performance metrics. The x-axis represents the number of agents, while the y-axis displays three key performance indicators: KPI (Key Performance Indicator), Coordination Score, and Task Score. The KPI represents the overall task completion success rate, the Coordination Score reflects the quality of collaboration and communication among agents, and the Task Score reflects the quality of the final research output. The graph shows how these three metrics change as the number of agents involved increases. This helps analyze the impact of team size on efficiency and collaboration in a multi-agent setting.
read the caption
Figure 8: Scaling on Agents Number in Research Scenario. This figure shows the impact of agent number on KPI, Coordination Score, and Task Score.

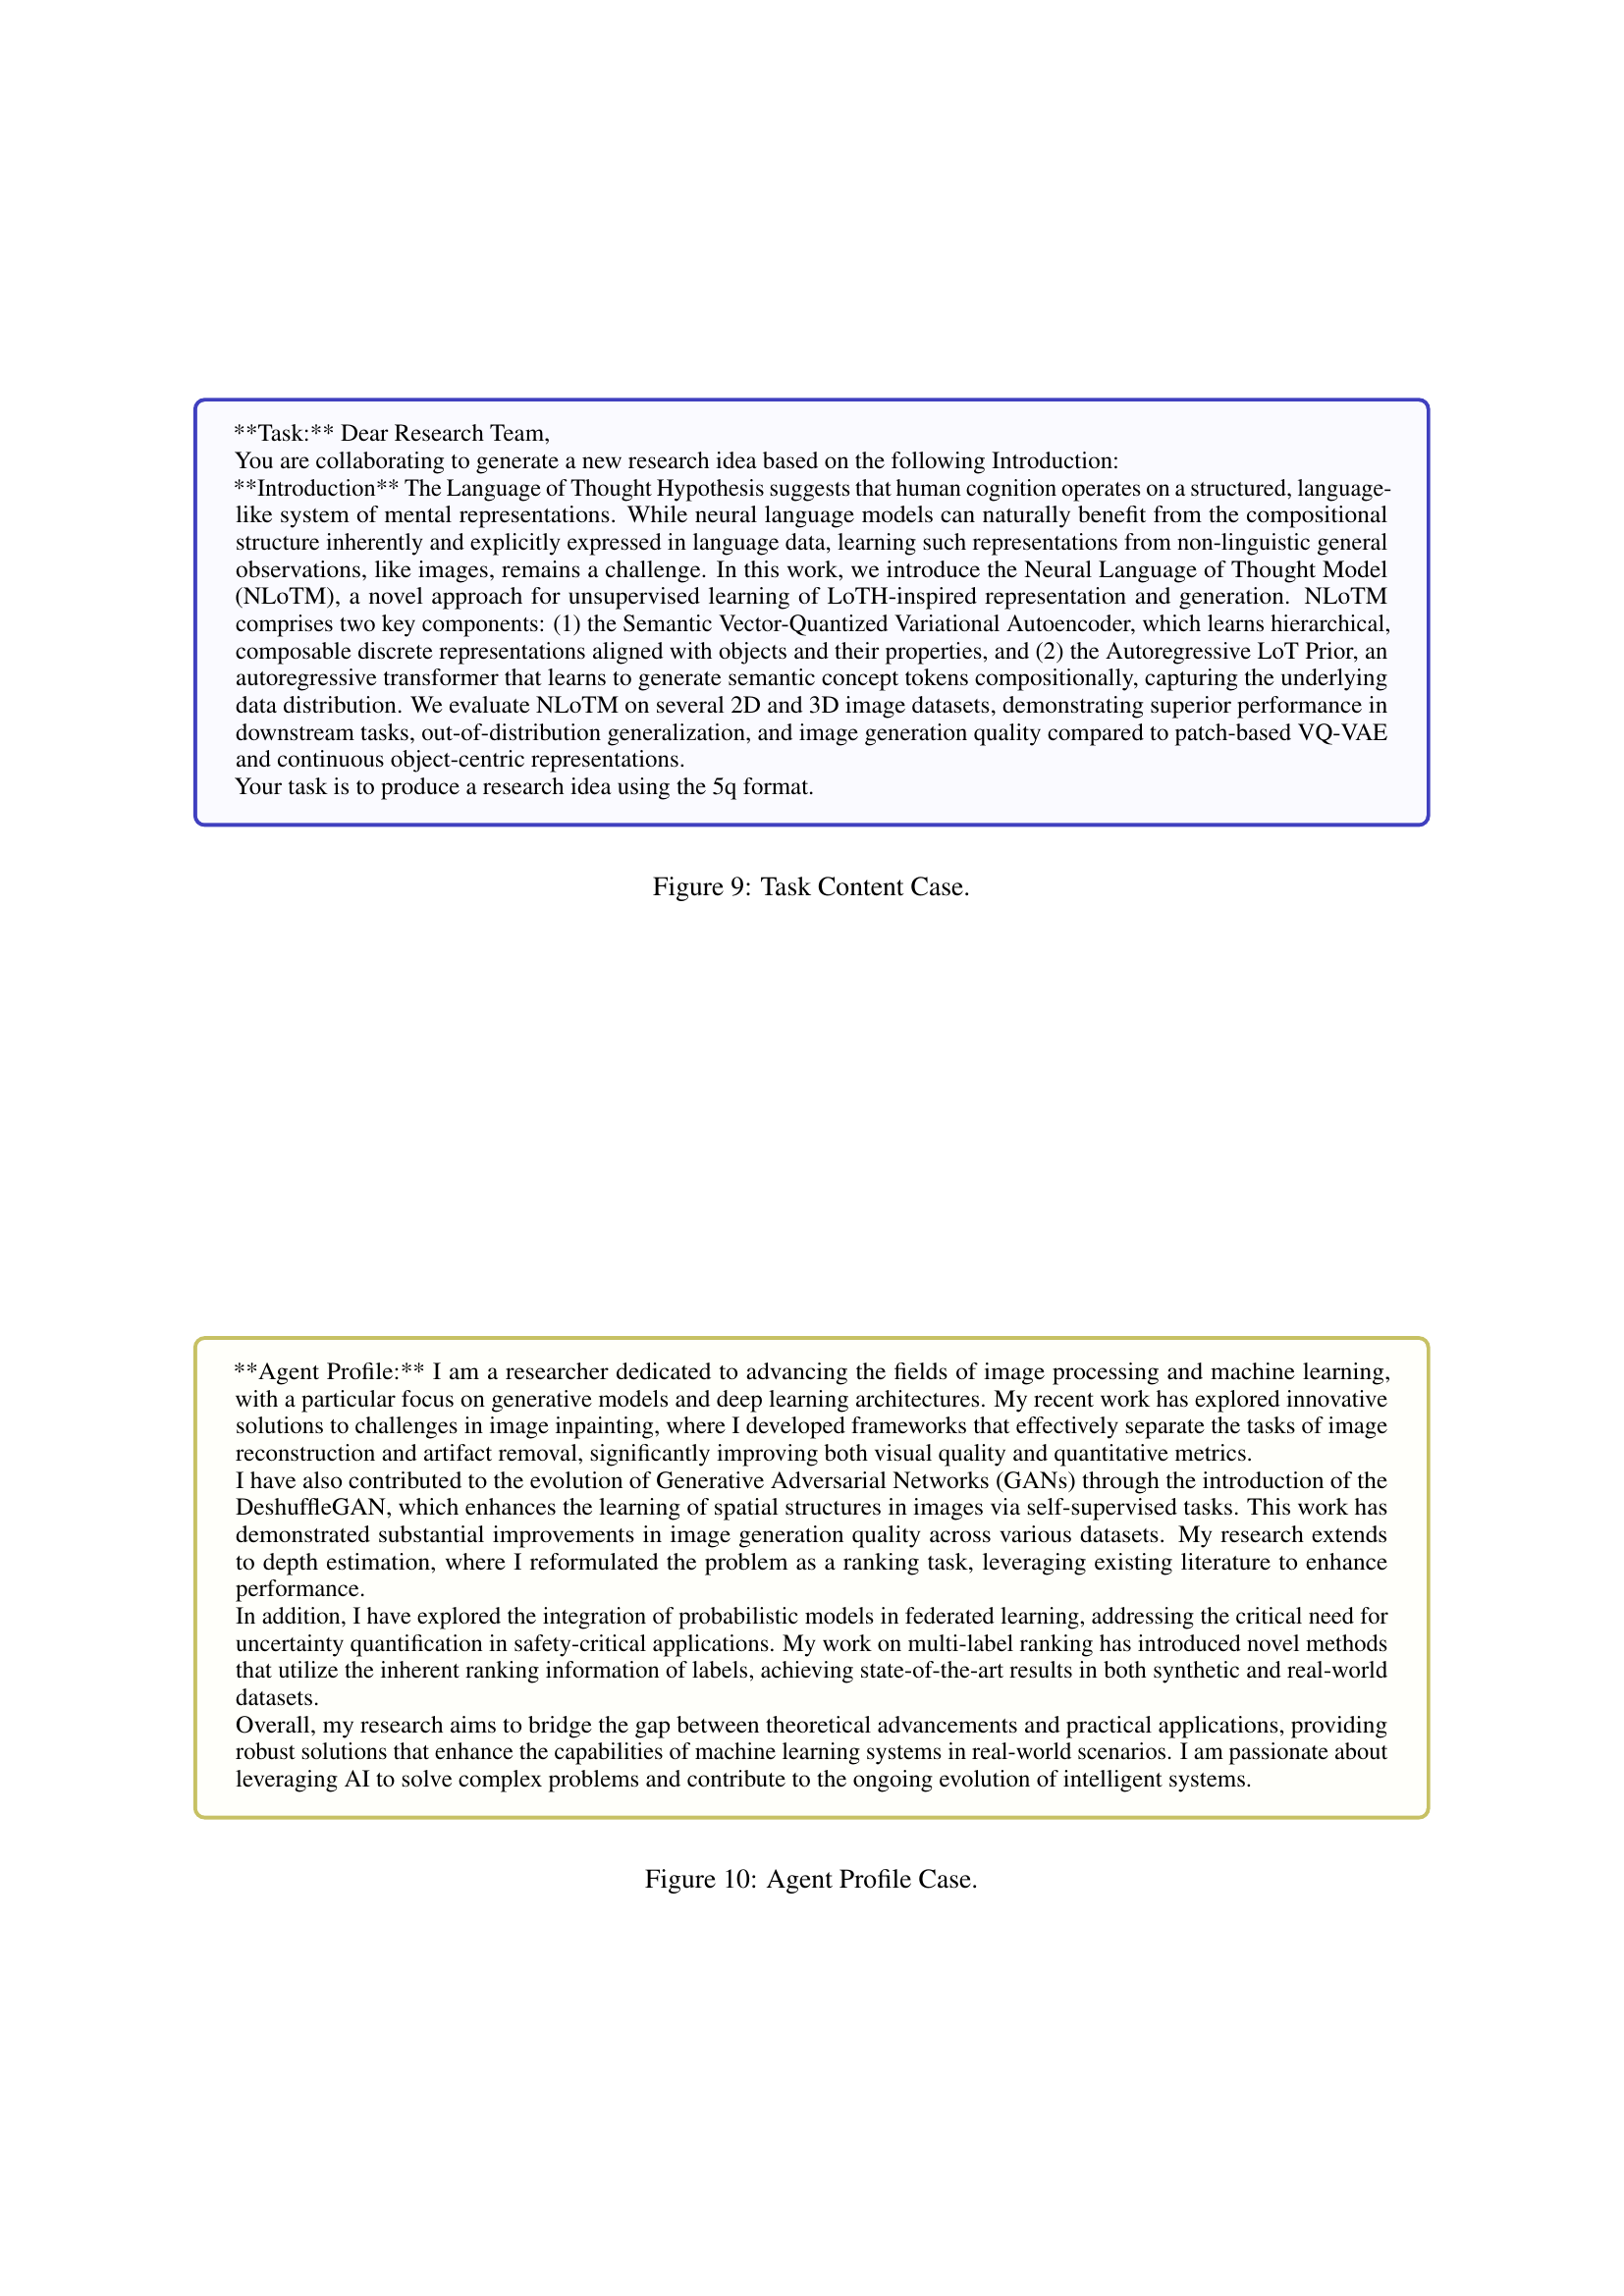
🔼 This figure shows an example of the task content provided to the agents in the Research scenario. It displays the introduction to a research paper on the Neural Language of Thought Model (NLoTM), which is designed to learn hierarchical, composable discrete representations from non-linguistic data. The agents are tasked with generating a novel research idea based on this introduction, following a specified 5-question (5q) format to ensure clarity, feasibility, and relevance.
read the caption
Figure 9: Task Content Case.
🔼 This figure shows an example of an agent profile used in the MultiAgentBench framework. The profile provides a detailed description of an agent’s expertise, past work, and personality traits, which are relevant to the agent’s participation in multi-agent tasks. This example illustrates the level of detail and specificity included in the agent profiles to ensure realistic interactions between agents in complex scenarios.
read the caption
Figure 10: Agent Profile Case.
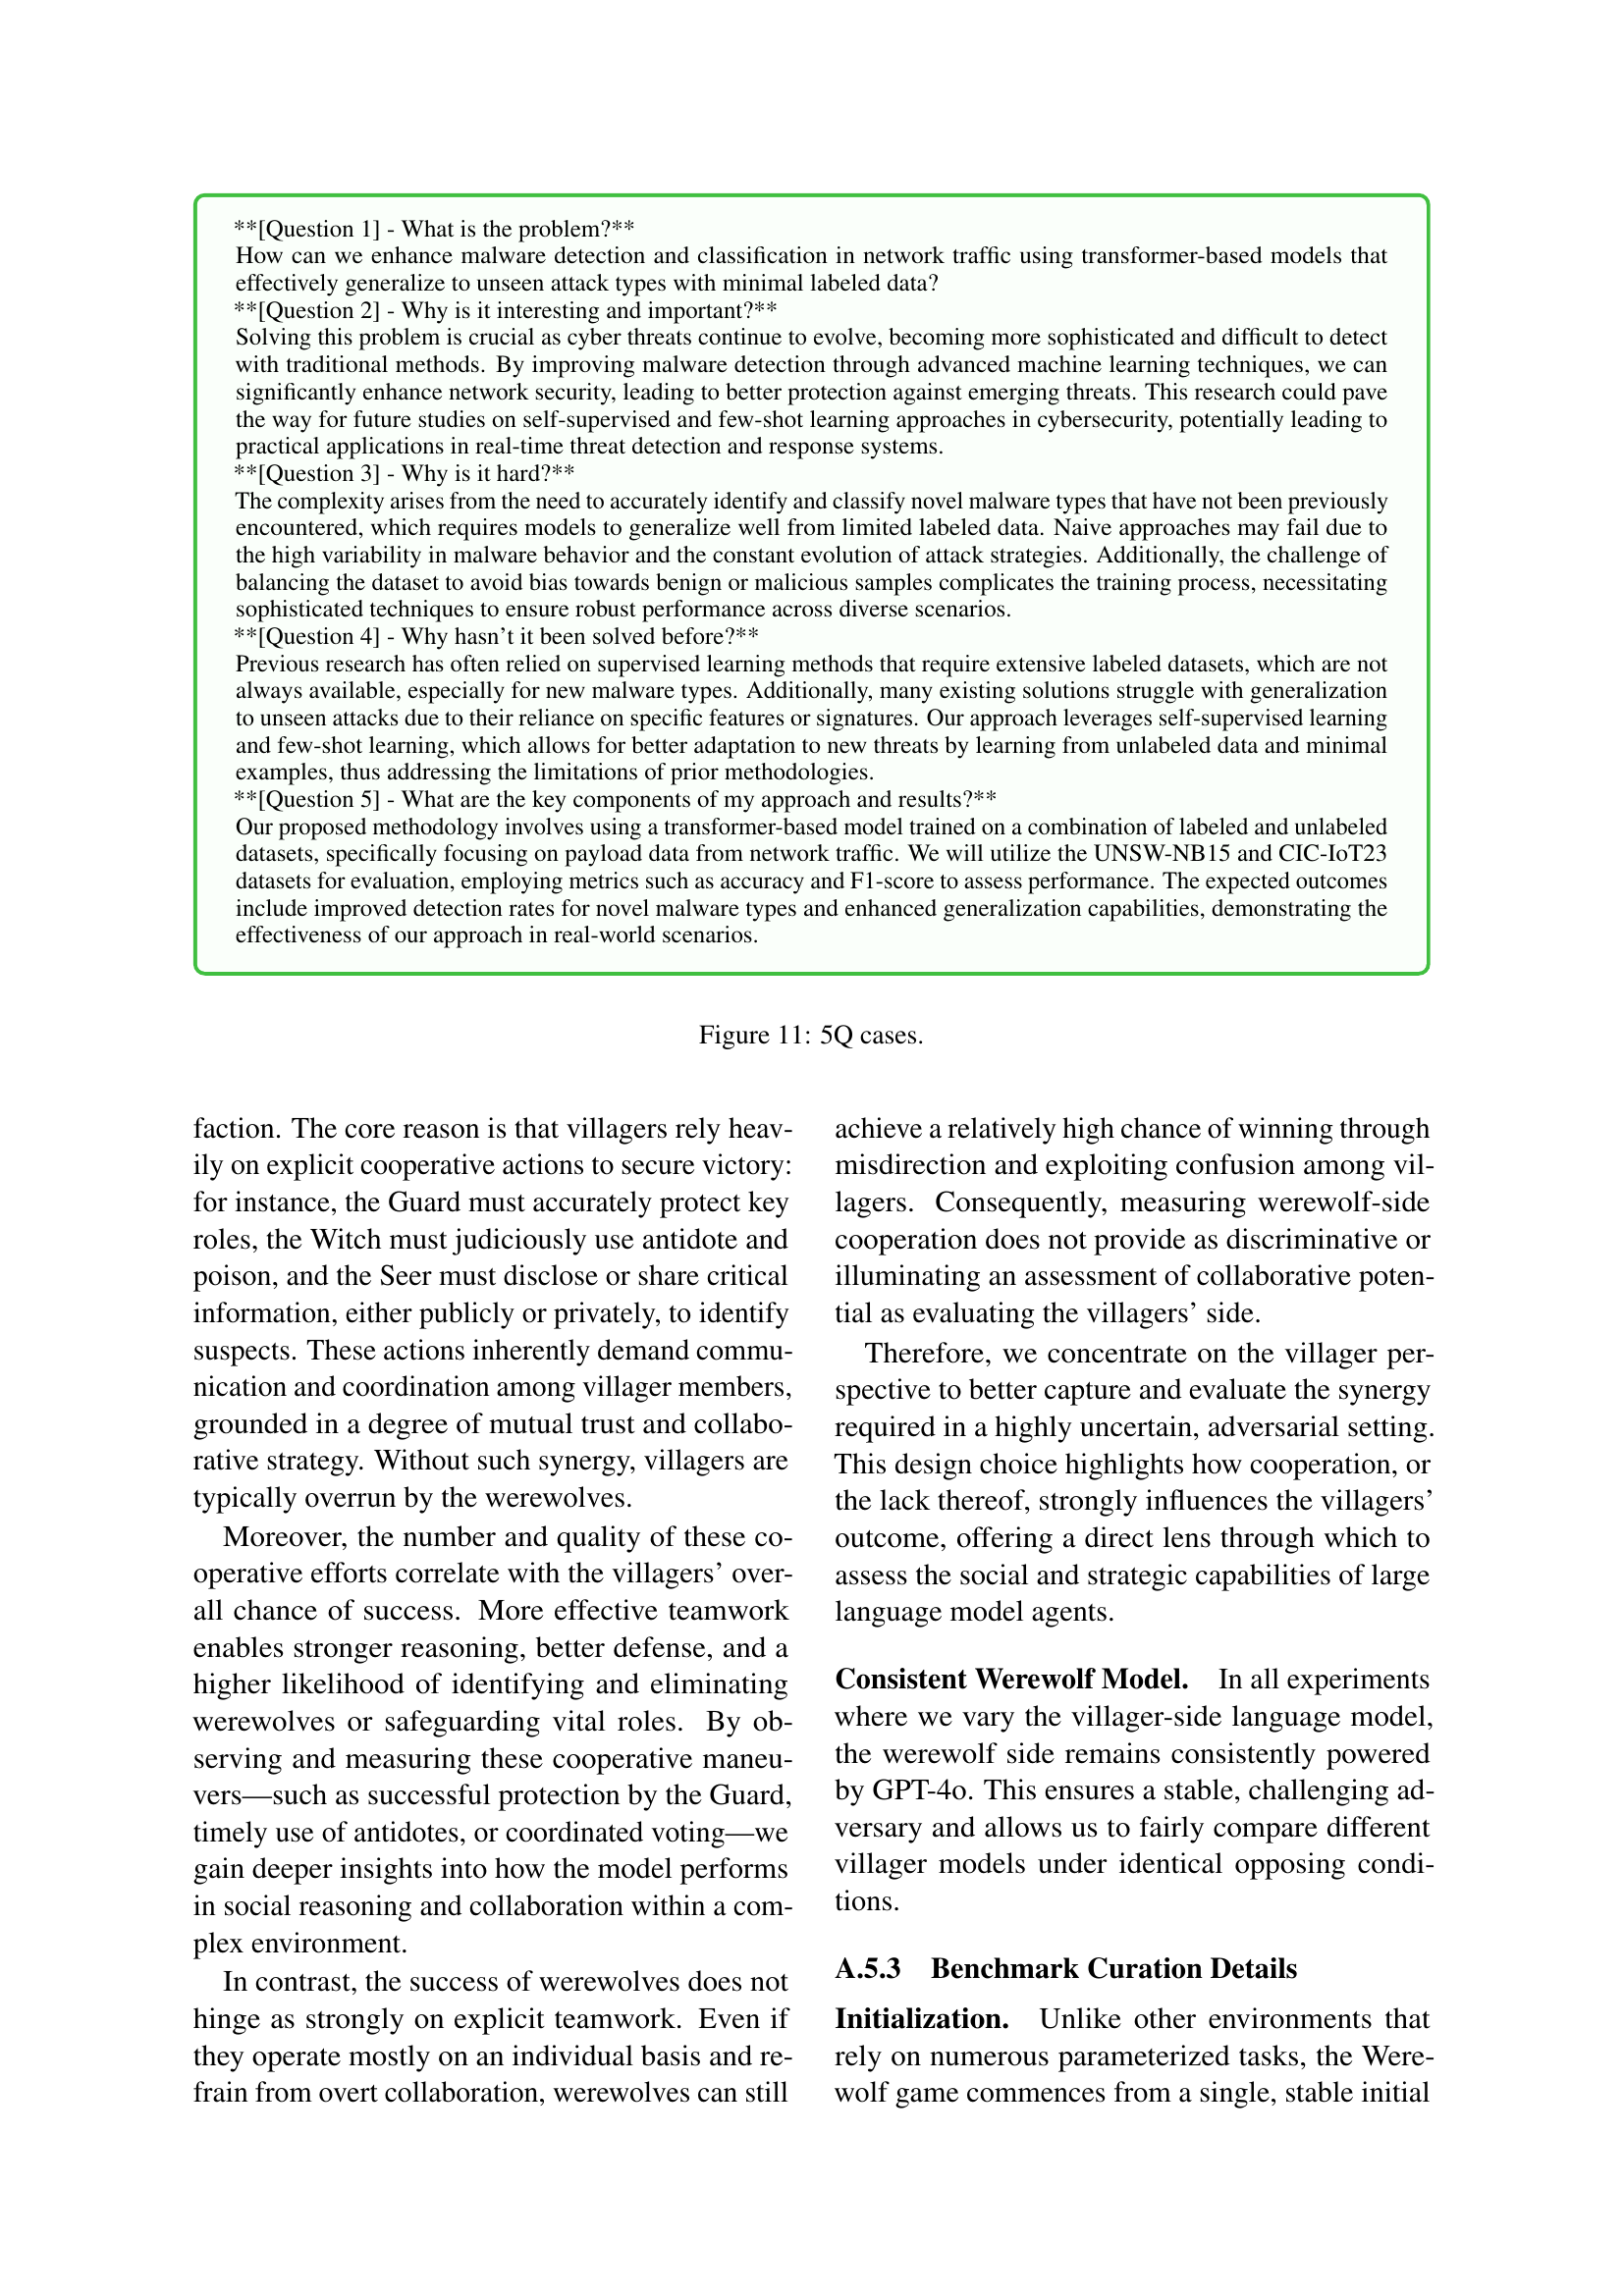
🔼 This figure presents an example of a research idea formulated using the 5-question (5Q) format. The 5Q format structures a research idea into five core questions addressing the problem’s definition, significance, challenges, prior work, and proposed approach. The example showcases a research idea focused on enhancing malware detection and classification in network traffic using transformer-based models. Each of the five questions provides detailed information addressing various aspects of the proposed research, highlighting its novelty, relevance, challenges, and potential contributions.
read the caption
Figure 11: 5Q cases.

🔼 This scatter plot visualizes the relationship between the ‘Net Score’ and the ‘Result Score’ in the Werewolf game simulations. The Net Score represents the cumulative point difference between the Villagers and Werewolves throughout a game, reflecting the overall advantage of one team over the other. The Result Score indicates the final outcome of the game: the difference in the number of surviving villagers and werewolves. The plot shows that a higher Net Score strongly correlates with a positive Result Score (Villager victory), while a lower Net Score often leads to a negative Result Score (Werewolf victory). This suggests that the Net Score effectively predicts the game’s outcome.
read the caption
Figure 12: Net Score vs. Result Score (Scatter Plot)
More on tables
| Model | Comm (Human) | Plan (Human) | Comm (Machine) | Plan (Machine) |
|---|---|---|---|---|
| llama31_70b | 3.19 | 3.19 | 3.12 | 3.00 |
| llama33 | 3.94 | 3.44 | 3.89 | 3.89 |
| gpt-4o-mini | 3.61 | 3.33 | 3.00 | 3.00 |
| gpt3.5-turbo | 3.75 | 3.44 | 4.00 | 3.75 |
| llama31_8b | 2.62 | 3.06 | 3.00 | 3.00 |
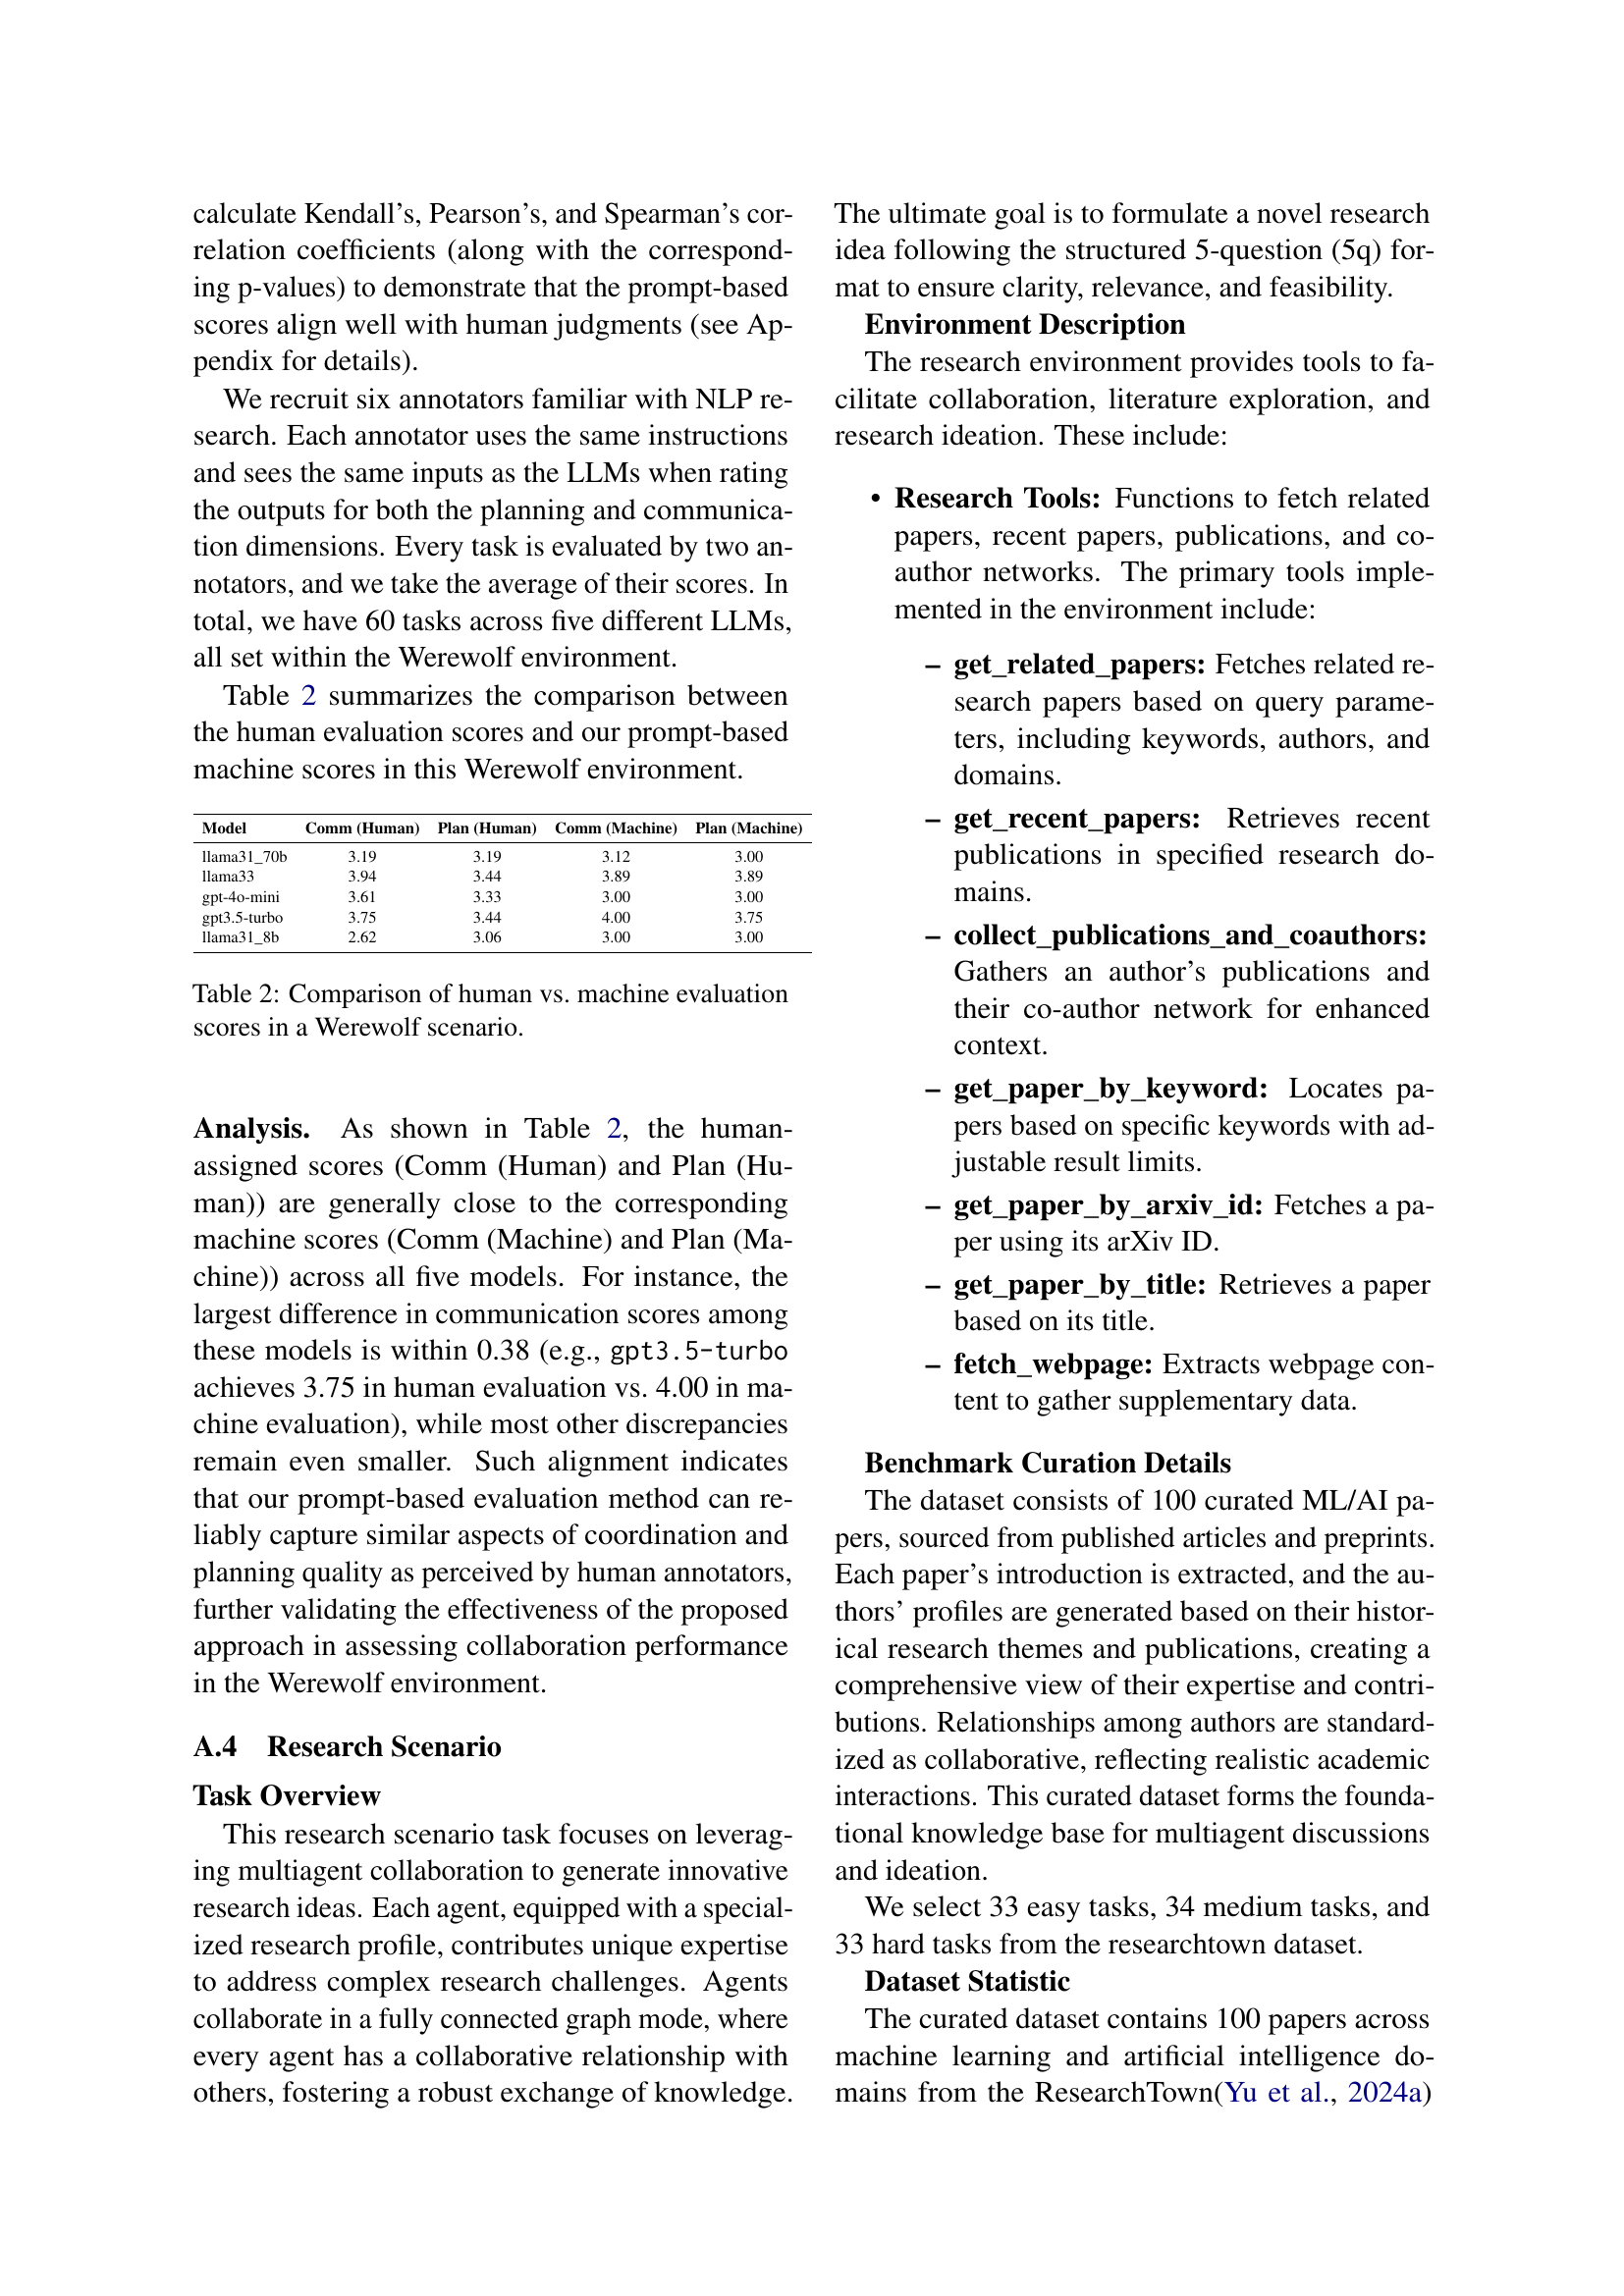
🔼 This table presents a comparison of human and machine evaluation scores for the Werewolf game scenario. It shows how well the automatically generated scores from the system’s evaluation method align with human judgments. For each model (llama31_70b, llama33, gpt-40-mini, gpt3.5-turbo, llama31_8b), it lists the human-assigned scores for both communication and planning aspects, followed by the corresponding machine-generated scores for these same aspects. The comparison allows for an assessment of the accuracy and reliability of the automated scoring system in relation to human perception.
read the caption
Table 2: Comparison of human vs. machine evaluation scores in a Werewolf scenario.
| Faction | Action/Outcome | Points |
| Villager | Villager candidate elected as sheriff | +2 |
| Guard successfully protects a target from werewolf attack | +2 | |
| Witch successfully saves a target from werewolf attack | +2 | |
| Witch uses poison to kill a werewolf | +2 | |
| Werewolf is voted out during the day | +2 | |
| Each villager who votes for a werewolf | +0.2 | |
| Each villager who votes for a villager | -0.1 | |
| Witch uses poison to kill a villager | -2 | |
| Starting from the second day, the seer gains +1 point for each additional day survived | +1/day | |
| Werewolf | Werewolf candidate elected as sheriff | +2 |
| Werewolves successfully choose a target to attack at night | +1 | |
| A villager is voted out during the day | +1 |
🔼 This table details the scoring system used in the Werewolf game simulation within the MultiAgentBench framework. It outlines how points are awarded to both Villagers and Werewolves based on their actions and the game’s outcome. Positive points are awarded to Villagers for successfully completing tasks like electing a sheriff, protecting key villagers, or eliminating werewolves. Negative points are given to Villagers for incorrect votes or failures. Werewolves earn points by eliminating villagers or being elected sheriff. This scoring system helps quantify the effectiveness of collaboration and strategic decision-making within the multi-agent game.
read the caption
Table 3: Scoring Rules for Villagers and Werewolves in Full-Game Simulation
| Model | Completion Ratio | Villager Net Score |
|---|---|---|
| llama3.1-8B | 0.2412 | -1.2055 |
| llama3.1-70B | 0.3641 | -1.0736 |
| llama3.3-70B | 0.3754 | 0.2802 |
| gpt-3.5-turbo | 0.2217 | -0.7272 |
| gpt-4o-mini | 0.2503 | -1.4207 |
🔼 This table presents the results of single-day simulations in the Werewolf game environment. For each of the five evaluated language models (Meta-Llama-3.1-8B, Meta-Llama-3.1-70B, Meta-Llama-3.3-70B, GPT-3.5-turbo, and GPT-40-mini), it shows two key metrics: the Completion Ratio (representing the percentage of successfully completed daily tasks) and the Villager Net Score (the difference in points accumulated by the villagers versus the werewolves in a single day). The data provides insights into the models’ short-term performance in cooperative multi-agent scenarios, focusing on their ability to successfully execute immediate tasks within the context of a complex social setting.
read the caption
Table 4: Single-Day Simulation metrics for each model: completion ratio, villager net score.
| Model | Net Score | Result Score | Win Rate |
|---|---|---|---|
| llama3.1-8B | -5.0839 | -2.3793 | 0.0115 |
| llama3.1-70B | -5.2892 | -2.0000 | 0.0323 |
| llama3.3-70B | 0.4511 | -0.1915 | 0.3511 |
| gpt-3.5-turbo | -2.8230 | -1.3448 | 0.0920 |
| gpt-4o-mini | -4.6649 | -2.0825 | 0.0309 |
| gpt-4o(baseline) | -2.1946 | -0.7742 | 0.2473 |
🔼 This table presents the results of a full-game simulation in a Werewolf scenario, evaluating the performance of five different large language models (LLMs). For each model, it shows the net score (the difference in points accumulated by villagers vs. werewolves), the result score (final difference in surviving villagers minus surviving werewolves), and the villager win rate (percentage of games won by the villagers). The results illustrate how the different models perform in terms of long-term strategic planning, cooperation, and adaptation within a complex, competitive environment.
read the caption
Table 5: Full-Run Simulation metrics for each model: net score, result score, and villager win rate.
| Trait | Very Negative | Moderately Negative | Slightly Negative | Slightly Positive | Moderately Positive | Very Positive |
|---|---|---|---|---|---|---|
| OPE (Openness) | 60% | 71% | unimaginative (62%) | imaginative (55%) | 77% | 75% |
| CON (Conscientiousness) | 68% | 68% | irresponsible (66%) | responsible (67%) | 63% | 68% |
| EXT (Extraversion) | 60% | 67% | introverted (59%) | extraverted (58%) | 75% | 81% |
| AGR (Agreeableness) | 71% | 69% | distrustful (59%) | trustful (71%) | 68% | 62% |
| NEU (Neuroticism) | 59% | 59% | relaxed (81%) | nervous (70%) | 55% | 76% |
🔼 This table shows the distribution of the Big Five personality traits (Openness, Conscientiousness, Extraversion, Agreeableness, and Neuroticism) across different categories in the dataset. Each trait is categorized into six levels ranging from Very Negative to Very Positive, with percentages indicating the proportion of occurrences in each level. Descriptive adjectives are added to some categories to provide qualitative insights into personality tendencies.
read the caption
Table 6: Distribution of Personality Traits in Percentage
| Model | B-Comm | B-Plan | B-Collab Avg | S-Comm | S-Plan | S-Collab Avg | Final Bargaining |
|---|---|---|---|---|---|---|---|
| gpt-3.5-turbo | 3.590 | 3.550 | 3.570 | 3.700 | 3.560 | 3.630 | 3.600 |
| gpt-4o-mini | 3.550 | 3.510 | 3.530 | 4.020 | 3.760 | 3.890 | 3.710 |
| Llama-3.1-70B-Instruct-Turbo | 3.030 | 3.480 | 3.255 | 4.180 | 3.600 | 3.890 | 3.573 |
| Llama-3.1-8B-Instruct-Turbo | 3.710 | 3.490 | 3.600 | 3.840 | 3.630 | 3.735 | 3.668 |
| Llama-3.3-70B-Instruct-Turbo | 3.010 | 3.430 | 3.220 | 3.930 | 3.540 | 3.735 | 3.478 |
🔼 This table presents a detailed breakdown of the performance of five different large language models (LLMs) in a multi-agent bargaining scenario. For each model, it shows the individual Communication, Planning, and Collaboration scores (averaged across both buyer and seller roles) along with the overall Final Bargaining Score. The Collaboration score is an average of the Communication and Planning scores. This table allows for a nuanced comparison of the models’ abilities in negotiation, highlighting their strengths and weaknesses in communication, strategic planning, and overall negotiation effectiveness.
read the caption
Table 7: Buyer and Seller detailed scores (Communication, Planning, and their Collab average), plus the Final Bargaining Score for each model.
| Bargaining (TS) | ||
|---|---|---|
| Model | Buyer | Seller |
| Meta-Llama-3.1-8B | 3.573 | 3.708 |
| Meta-Llama-3.1-70B | 3.557 | 3.656 |
| Meta-Llama-3.3-70B | 3.519 | 3.796 |
| gpt3.5-turbo | 3.535 | 3.632 |
| gpt-4o-mini | 3.578 | 3.869 |
🔼 This table presents the Task Scores (TS) achieved by different language models in the Bargaining task of the MultiAgentBench benchmark. It specifically shows the performance of each model from the perspective of both the Buyer and Seller roles in a negotiation scenario. The scores reflect the quality of each model’s negotiation strategies and outcomes. A higher score indicates better performance in achieving a successful and mutually beneficial agreement.
read the caption
Table 8: Bargaining (TS) Performance
Full paper#