TL;DR#
Evaluating AI-generated visuals hinges on quality and text alignment. Current models rely on high-quality, large-scale human annotations, aligning with Scaling Law principles. Existing datasets often miss systematic capture of key dimensions or fail to disentangle quality from alignment, limiting LMM potential in real scenarios.
This paper introduces Q-Eval-100K, a dataset designed to evaluate visual quality and alignment level featuring 100K instances with 960K human annotations. Also, it presents Q-Eval-Score, a framework for assessing both dimensions and offers Vague-to-Specific strategy for long prompts.
Key Takeaways#
Why does it matter?#
This paper introduces Q-Eval-100K, a large-scale dataset crucial for evaluating and improving text-to-vision models. The work provides a new benchmark, facilitating more reliable assessment of AI-generated content quality and alignment with textual prompts, fostering advancements in generative AI research.
Visual Insights#

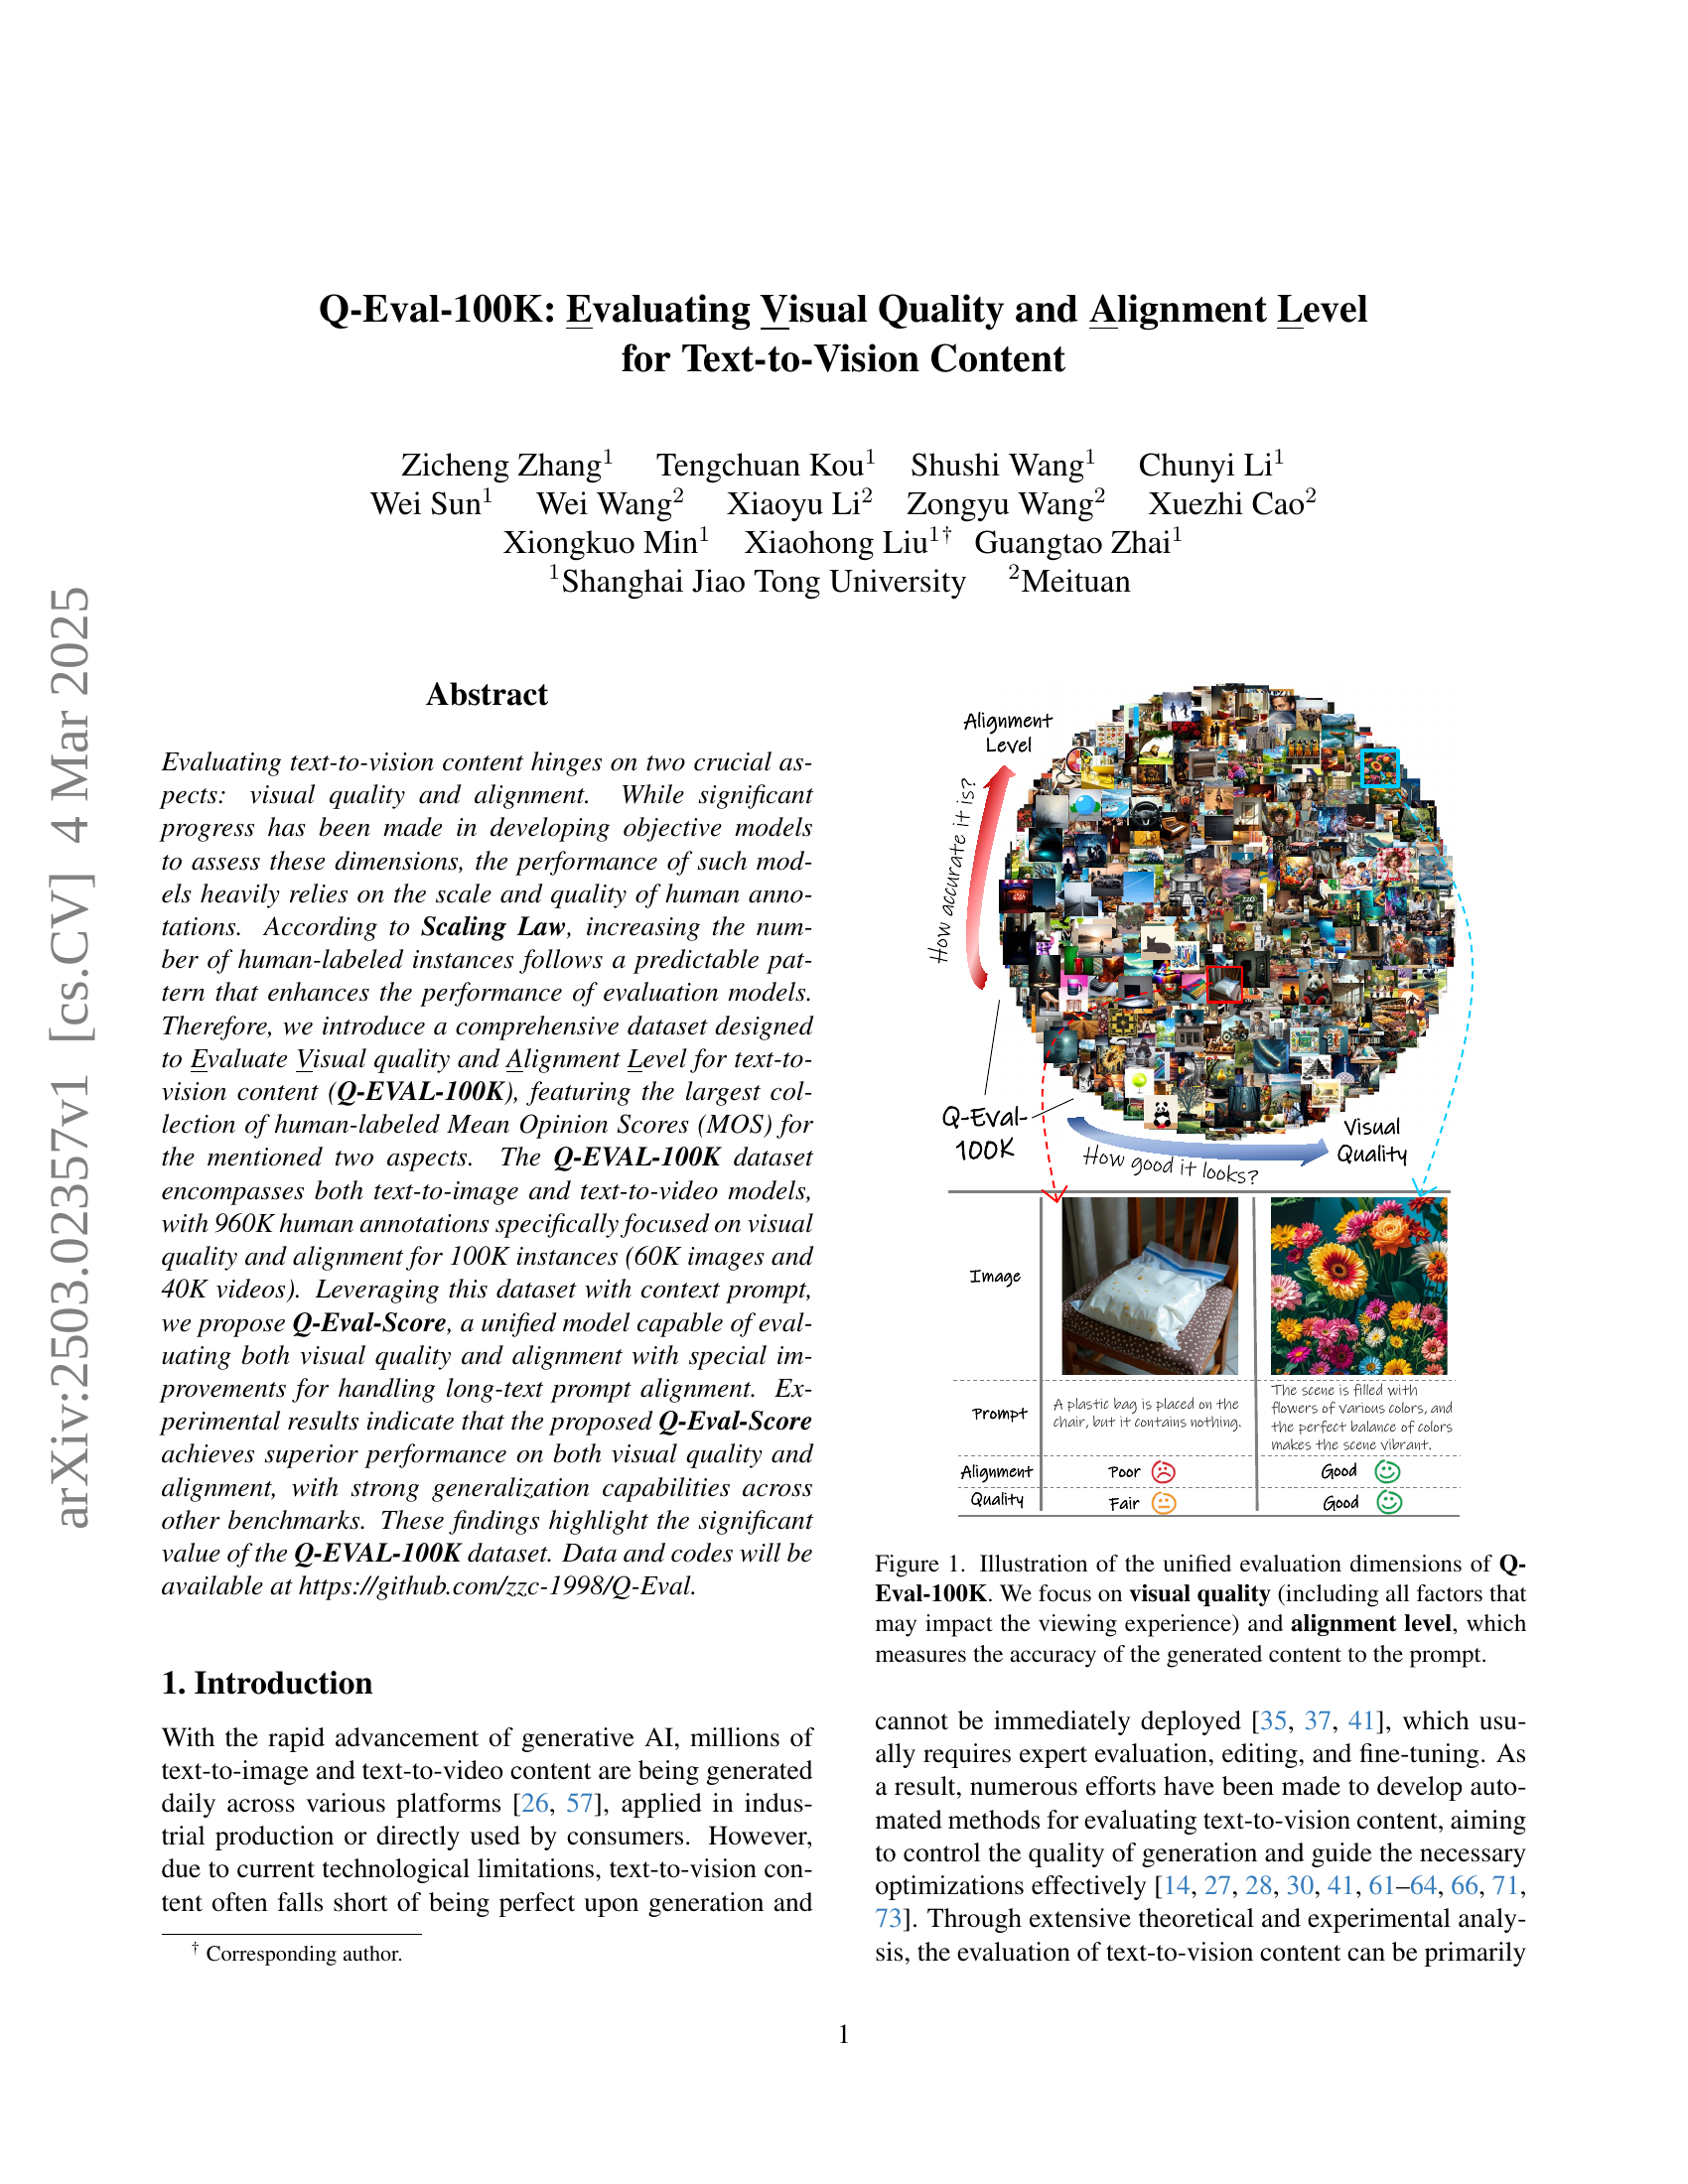
🔼 The figure illustrates the two key aspects of evaluating text-to-vision content using the Q-Eval-100K dataset: visual quality and alignment. Visual quality encompasses all factors influencing the viewing experience, such as clarity, color balance, aesthetic appeal, and overall visual fidelity. Alignment, on the other hand, assesses how accurately the generated image or video matches the given text prompt. The figure uses examples to visually represent different levels of visual quality (poor, fair, good, excellent) and alignment, demonstrating the range captured by the Q-Eval-100K dataset.
read the caption
Figure 1: Illustration of the unified evaluation dimensions of Q-Eval-100K. We focus on visual quality (including all factors that may impact the viewing experience) and alignment level, which measures the accuracy of the generated content to the prompt.
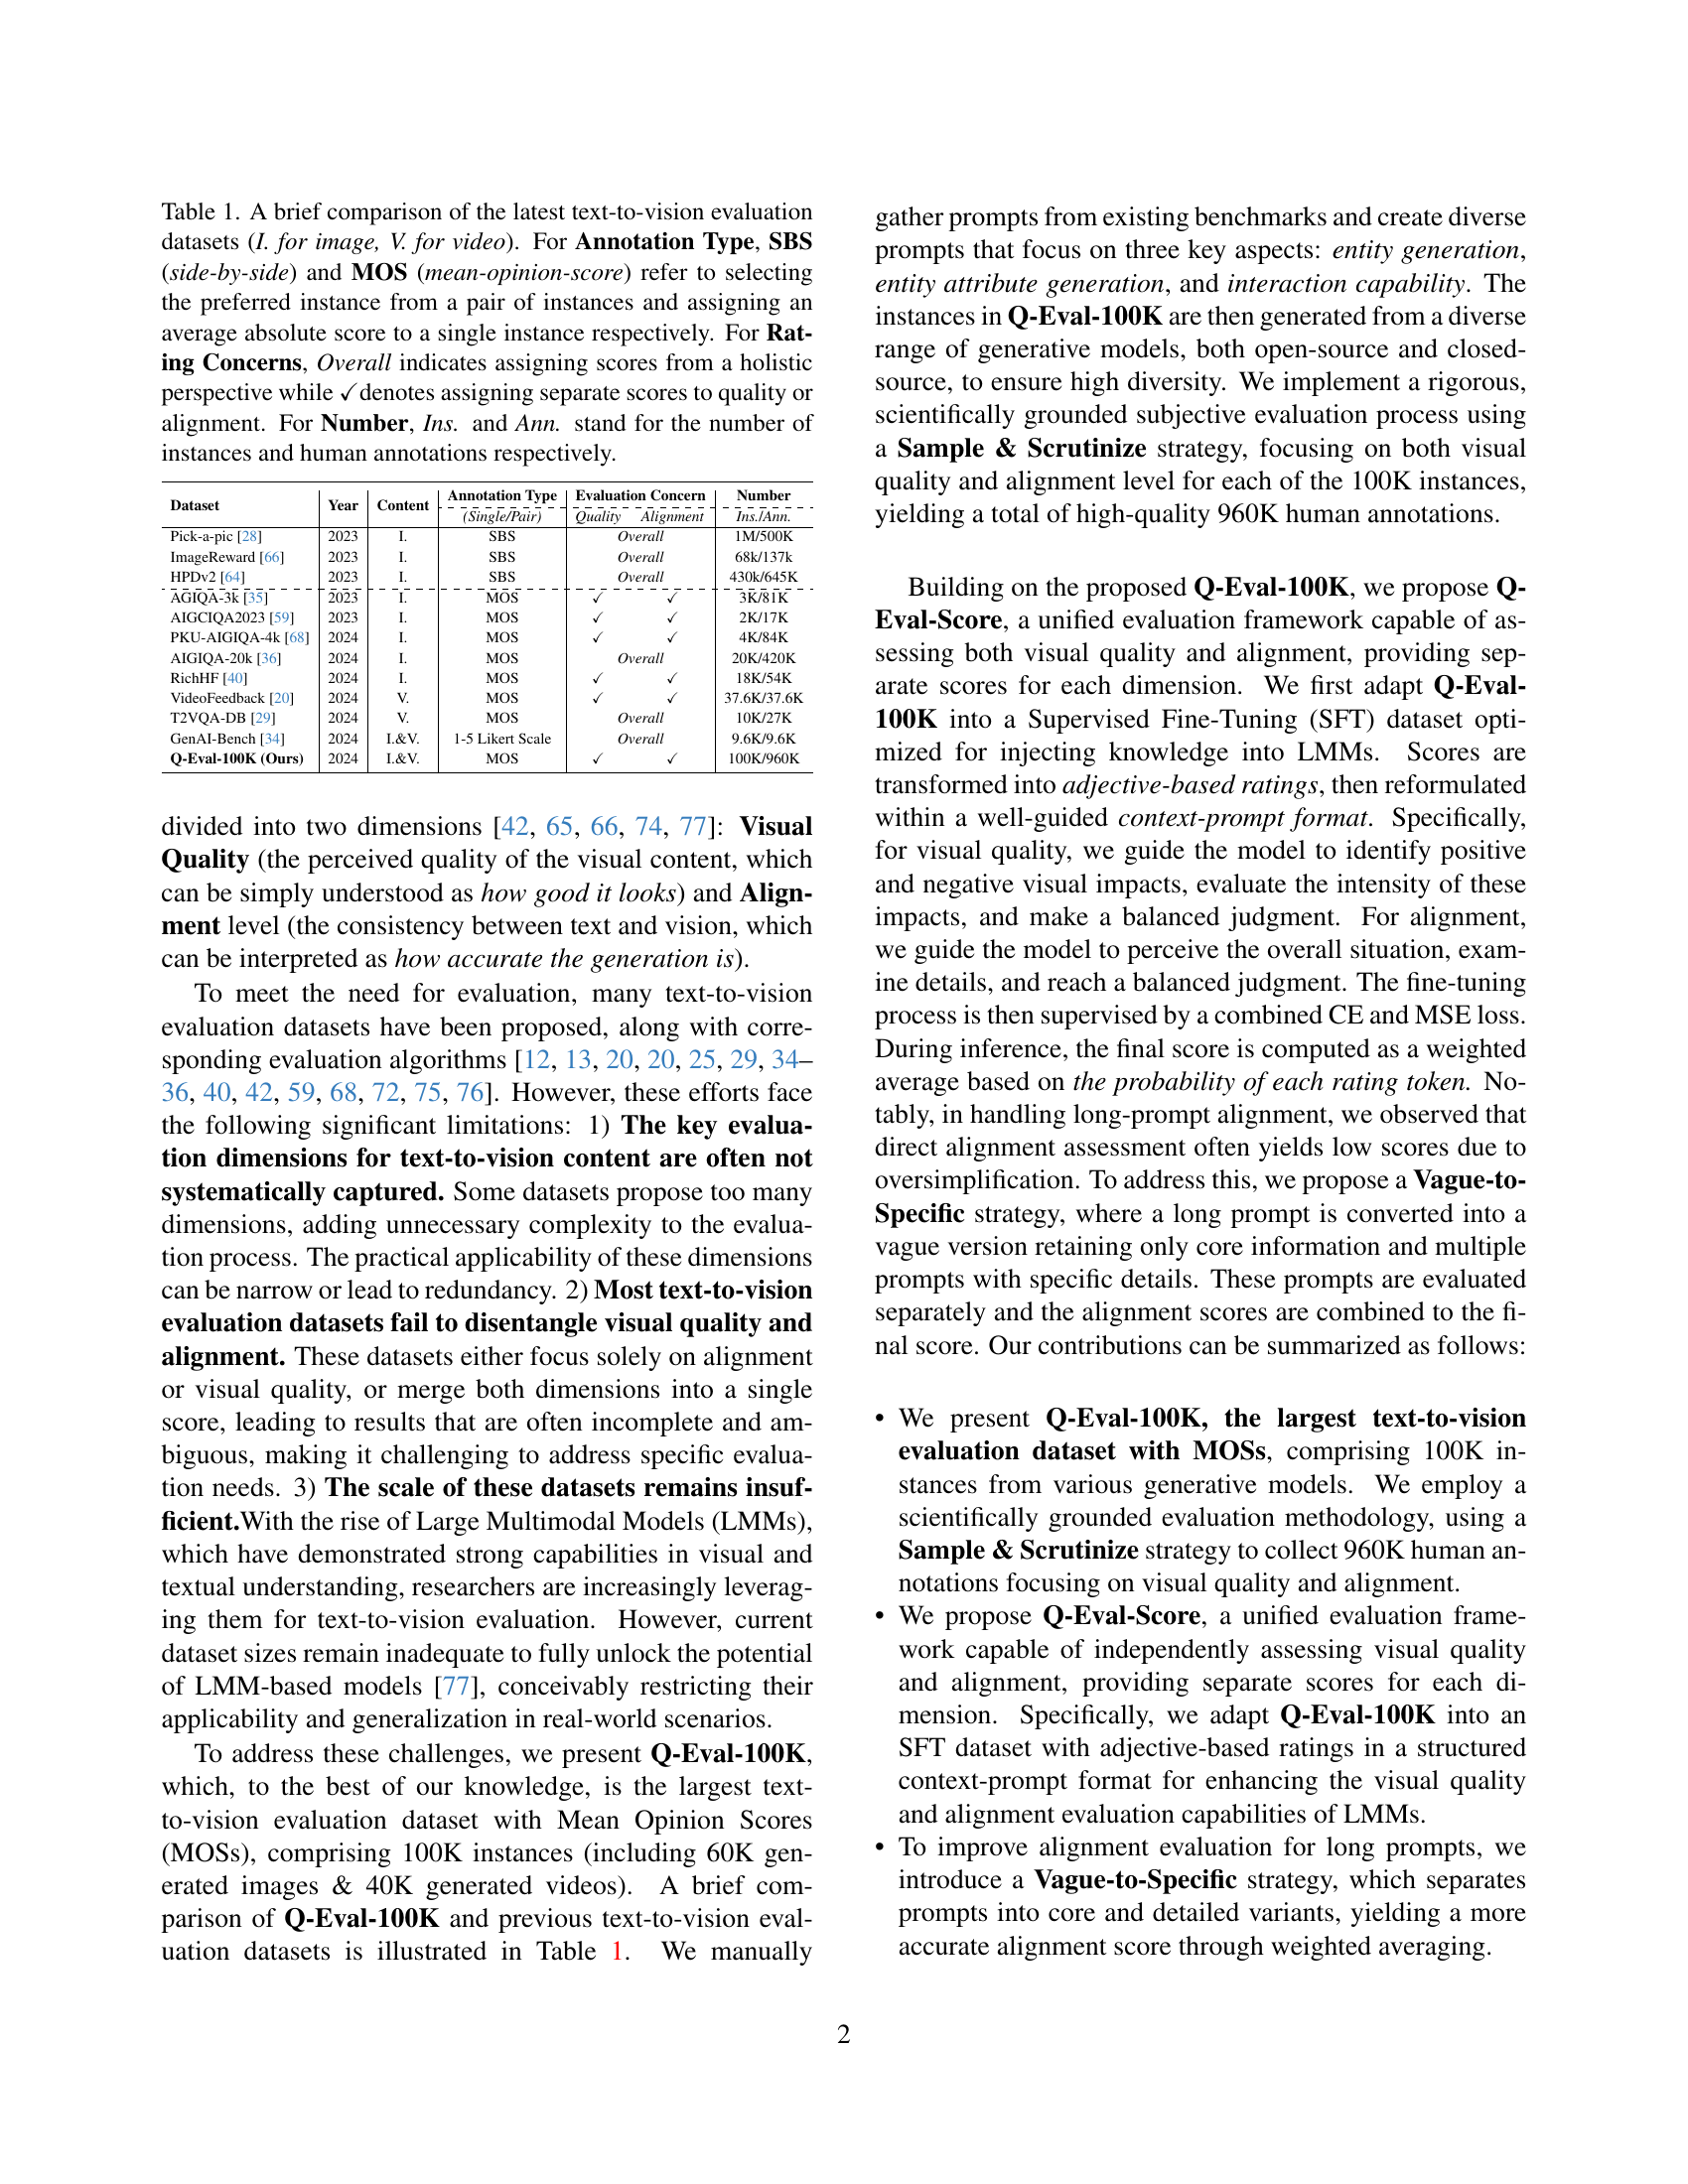
| Dataset | Year | Content | Annotation Type | Evaluation Concern | Number | |
|---|---|---|---|---|---|---|
| \cdashline4-7 | (Single/Pair) | Quality | Alignment | Ins./Ann. | ||
| Pick-a-pic [28] | 2023 | I. | SBS | Overall | 1M/500K | |
| ImageReward [66] | 2023 | I. | SBS | Overall | 68k/137k | |
| HPDv2 [64] | 2023 | I. | SBS | Overall | 430k/645K | |
| \hdashlineAGIQA-3k [35] | 2023 | I. | MOS | ✓ | ✓ | 3K/81K |
| AIGCIQA2023 [59] | 2023 | I. | MOS | ✓ | ✓ | 2K/17K |
| PKU-AIGIQA-4k [68] | 2024 | I. | MOS | ✓ | ✓ | 4K/84K |
| AIGIQA-20k [36] | 2024 | I. | MOS | Overall | 20K/420K | |
| RichHF [40] | 2024 | I. | MOS | ✓ | ✓ | 18K/54K |
| VideoFeedback [20] | 2024 | V. | MOS | ✓ | ✓ | 37.6K/37.6K |
| T2VQA-DB [29] | 2024 | V. | MOS | Overall | 10K/27K | |
| GenAI-Bench [34] | 2024 | I.&V. | 1-5 Likert Scale | Overall | 9.6K/9.6K | |
| Q-Eval-100K (Ours) | 2024 | I.&V. | MOS | ✓ | ✓ | 100K/960K |
🔼 This table compares several recent text-to-vision evaluation datasets, highlighting key differences in their characteristics. It details the year of release, whether the dataset contains images (I) or videos (V), the type of annotation used (side-by-side comparison or mean opinion score), what aspects of the generated content were rated (overall quality, or separate quality and alignment scores), and finally the number of instances and annotations collected. Side-by-side (SBS) annotation involves human raters choosing the better of two examples, while mean-opinion-score (MOS) involves giving a numerical rating to a single example. The table helps illustrate the scale and scope of Q-Eval-100K in comparison to existing datasets.
read the caption
Table 1: A brief comparison of the latest text-to-vision evaluation datasets (I. for image, V. for video). For Annotation Type, SBS (side-by-side) and MOS (mean-opinion-score) refer to selecting the preferred instance from a pair of instances and assigning an average absolute score to a single instance respectively. For Rating Concerns, Overall indicates assigning scores from a holistic perspective while ✓denotes assigning separate scores to quality or alignment. For Number, Ins. and Ann. stand for the number of instances and human annotations respectively.
In-depth insights#
Eval Metric Gap#
The evaluation metric gap highlights a critical disconnect between automated evaluation metrics and human perception in assessing AI-generated content. Traditional metrics often fail to capture the nuances of visual quality, alignment, and aesthetic appeal as perceived by humans. This discrepancy arises because automated metrics tend to focus on low-level features or statistical measures that do not fully align with the complex cognitive processes involved in human judgment. The gap is exacerbated by the subjective nature of aesthetics, where individual preferences and cultural factors play a significant role, making it challenging for automated systems to accurately reflect human perception. Addressing this gap requires developing more sophisticated evaluation metrics that incorporate higher-level features, contextual understanding, and even elements of human feedback. Bridging the evaluation metric gap is essential for ensuring that AI-generated content is not only statistically sound but also visually pleasing and aligned with human expectations.
LMM’s SFT Tuning#
Supervised Fine-Tuning (SFT) of Large Multimodal Models (LMMs) is crucial for aligning them with specific tasks. This process often involves converting datasets into formats suitable for LMMs, like transforming scores into adjective-based ratings, facilitating better understanding. SFT enables LMMs to learn intricate relationships between text and vision, improving both visual quality and alignment. By using techniques like context-aware prompts, LMMs can be guided to generate more detailed and accurate outputs, making the evaluation process more reliable and interpretable. The effectiveness of SFT heavily relies on the quality and structure of the training data. The proper loss functions like CE and MSE are essential for optimizing performance, balancing general understanding with precise score prediction. Special handling might be needed for certain inputs. Vague-to-Specific strategy is proposed for long prompts.
Vague-to-Spec.#
The “Vague-to-Specific” strategy addresses the challenge of evaluating alignment in long prompts. Direct assessment often leads to low scores due to oversimplification. This strategy involves LLMs in summarizing long prompts into vague versions that retain core information. The original prompt is also split into specific prompts with detailed information. The alignment score is calculated separately for each part. Vague prompts capture the overall concept, while specific prompts focus on precise details. The results from the two branches are combined using weighted averaging, providing a more comprehensive and accurate alignment evaluation. By capturing both the general picture and the granular details, the strategy improves alignment evaluation, especially in complex prompts.
Align vs. Quality#
Alignment and quality represent distinct yet intertwined facets of text-to-vision content evaluation. Alignment assesses the fidelity between the textual prompt and the generated visual output, focusing on accurate representation and detail adherence. High alignment signifies the visual content faithfully mirrors the prompt. Conversely, quality encompasses the aesthetic and perceptual aspects of the visual, involving factors like clarity, color vibrancy, and overall appeal. Superior quality visuals are inherently pleasing and engaging. Optimizing solely for alignment may yield technically accurate but visually unappealing results, while prioritizing quality without alignment can lead to aesthetically pleasing outputs that deviate from the prompt’s intent. An ideal text-to-vision system should strike a balance, ensuring both accurate alignment and high visual quality for optimal user satisfaction and effective communication.
Scale Improves QA#
While “Scale Improves QA” isn’t explicitly present, the broader theme of scaling data and models to enhance evaluation capabilities strongly resonates within the research. The authors leverage Scaling Law to build Q-EVAL-100K, implying that larger, high-quality datasets directly translate to better evaluation models. This signifies that increasing the number of human-labeled instances following predictable patterns enhances performance. Thus Q-Eval-Score benefits from improved QA by SFT from the human-labeled Mean Opinion Scores (MOS) for the mentioned two aspects like visual quality and alignment for 100K instances. In essence, the research posits that scale is a critical enabler for improving the accuracy, reliability, and generalizability of quality assessment in text-to-vision content generation.
More visual insights#
More on figures

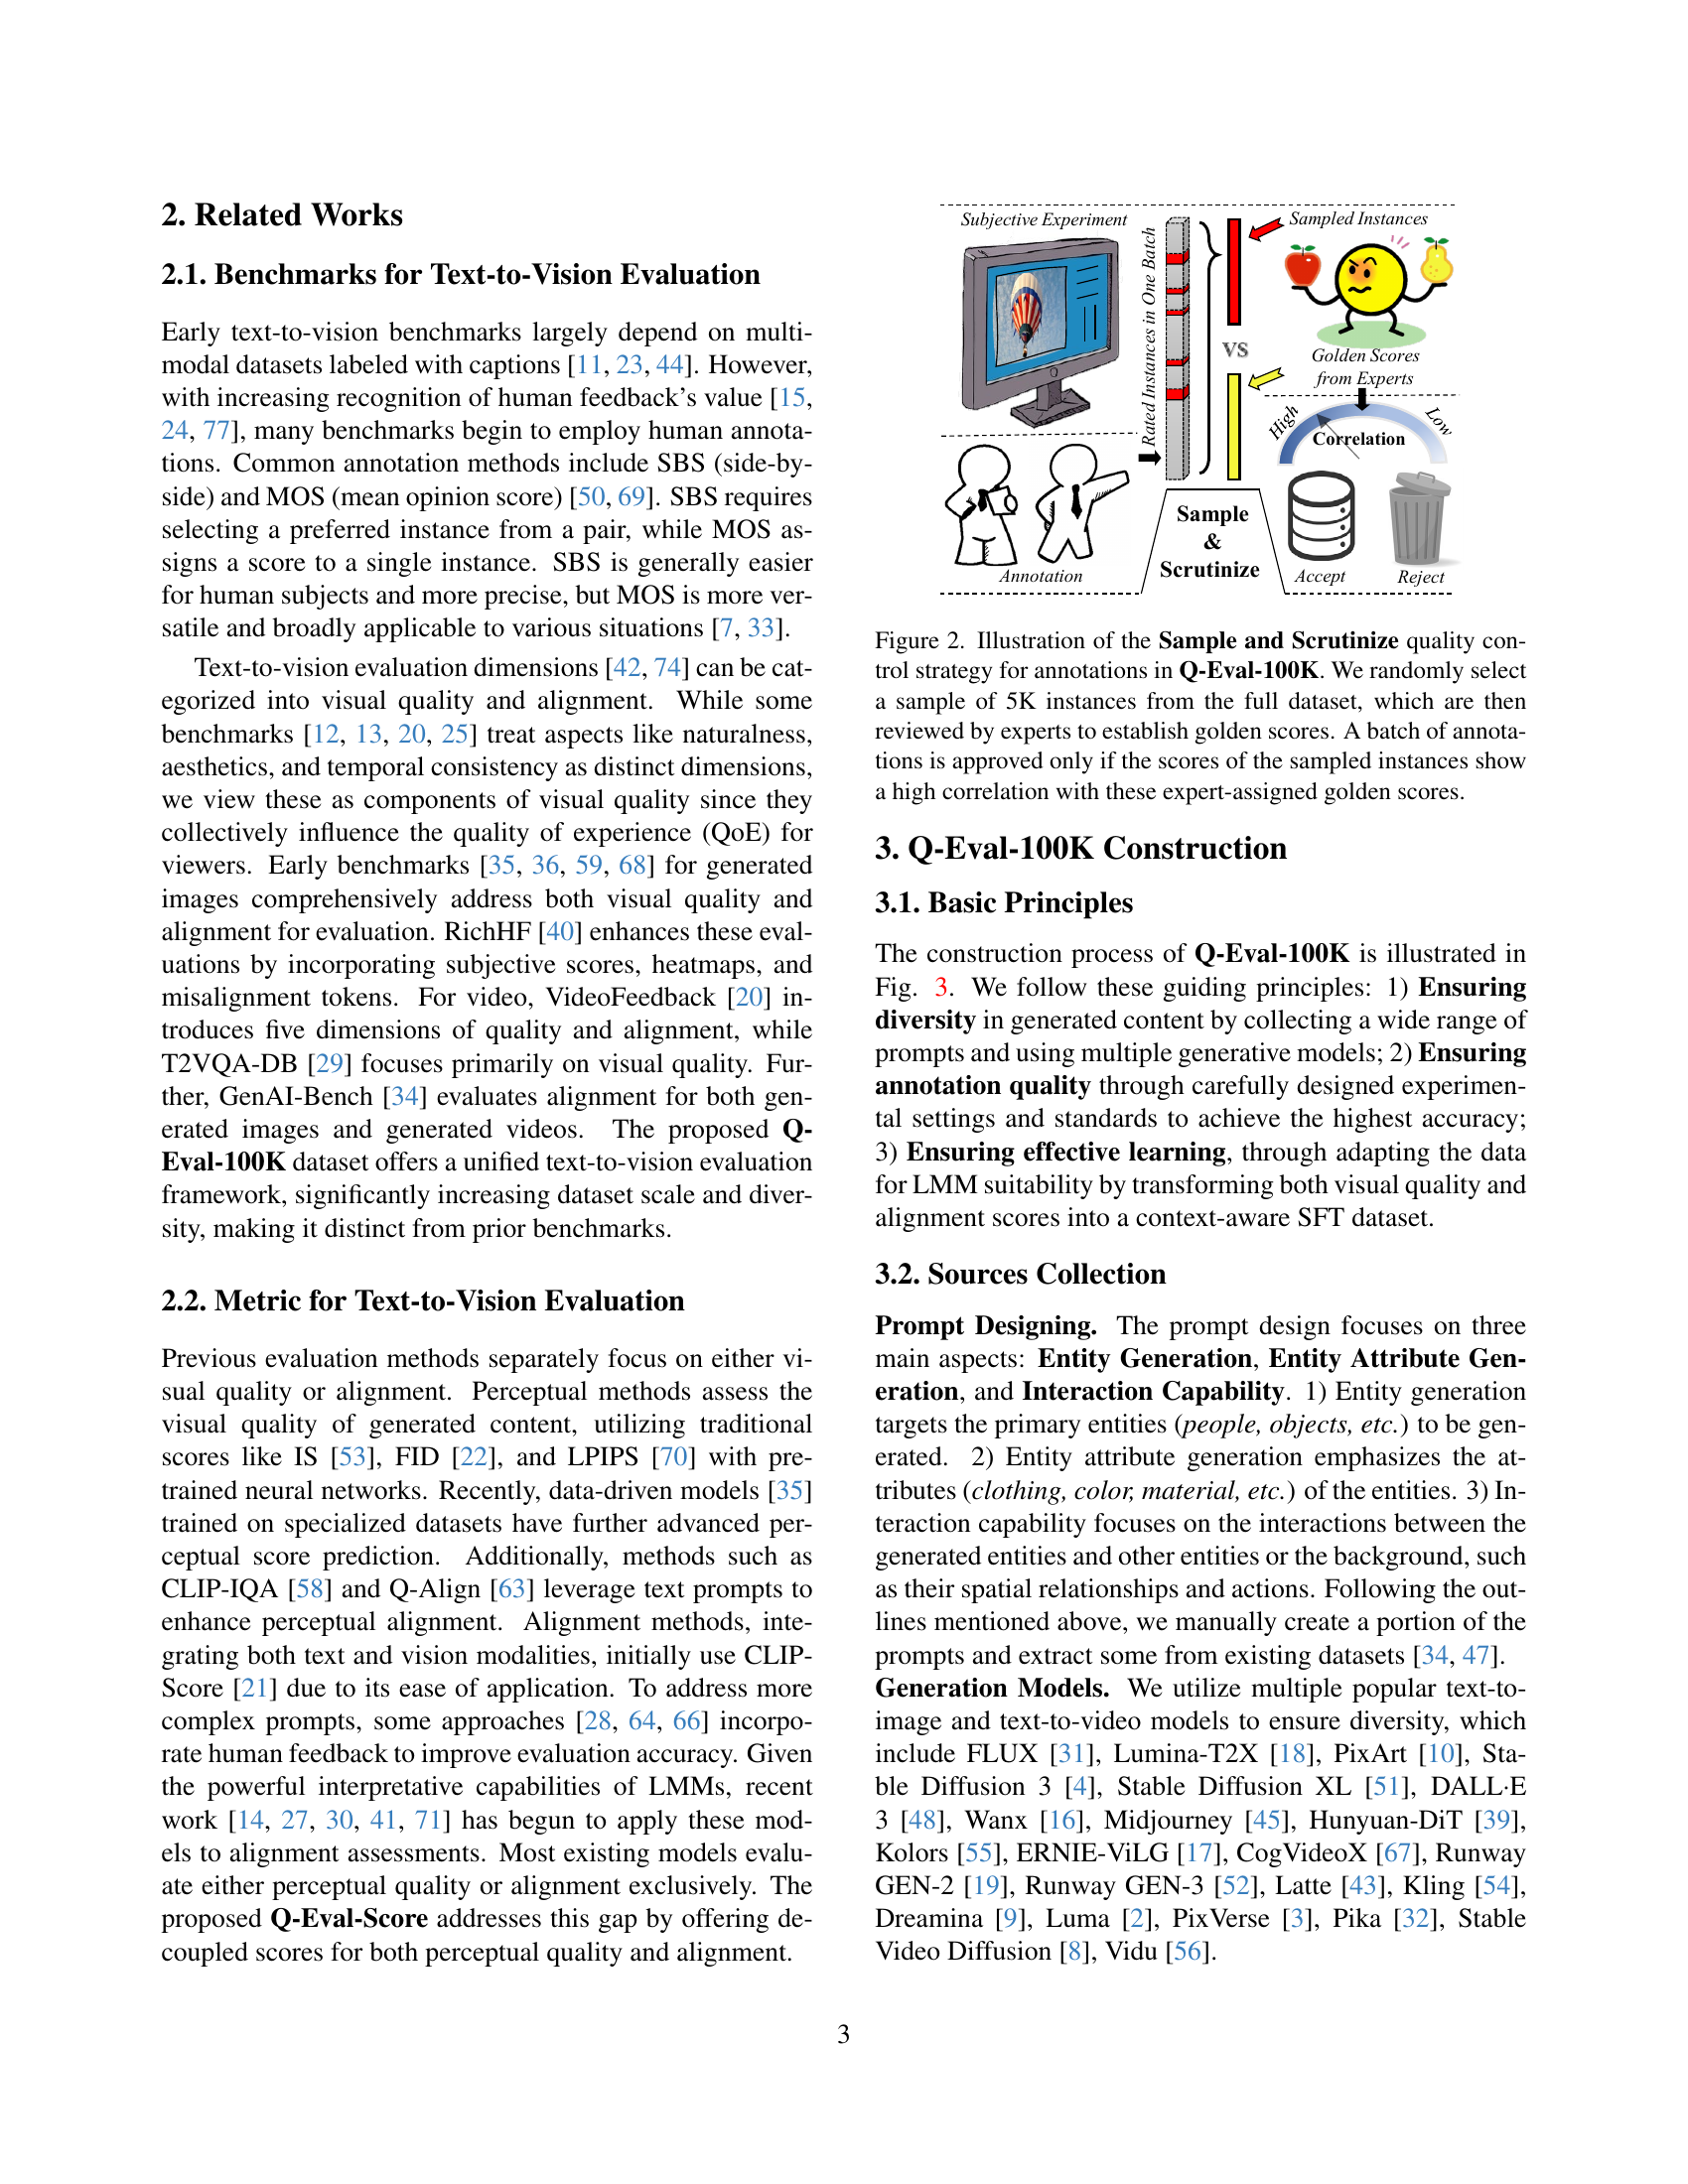
🔼 The figure illustrates a quality control process for ensuring the accuracy of annotations in the Q-Eval-100K dataset. A random sample of 5,000 instances from the complete dataset is selected and evaluated by experts to establish ‘golden scores’ – the benchmark for quality. Any subsequent batch of annotations is only accepted if the scores given by annotators for the sampled instances exhibit a high correlation with these expert-determined golden scores. This process helps to maintain a consistent and reliable standard of annotation quality across the entire dataset.
read the caption
Figure 2: Illustration of the Sample and Scrutinize quality control strategy for annotations in Q-Eval-100K. We randomly select a sample of 5K instances from the full dataset, which are then reviewed by experts to establish golden scores. A batch of annotations is approved only if the scores of the sampled instances show a high correlation with these expert-assigned golden scores.

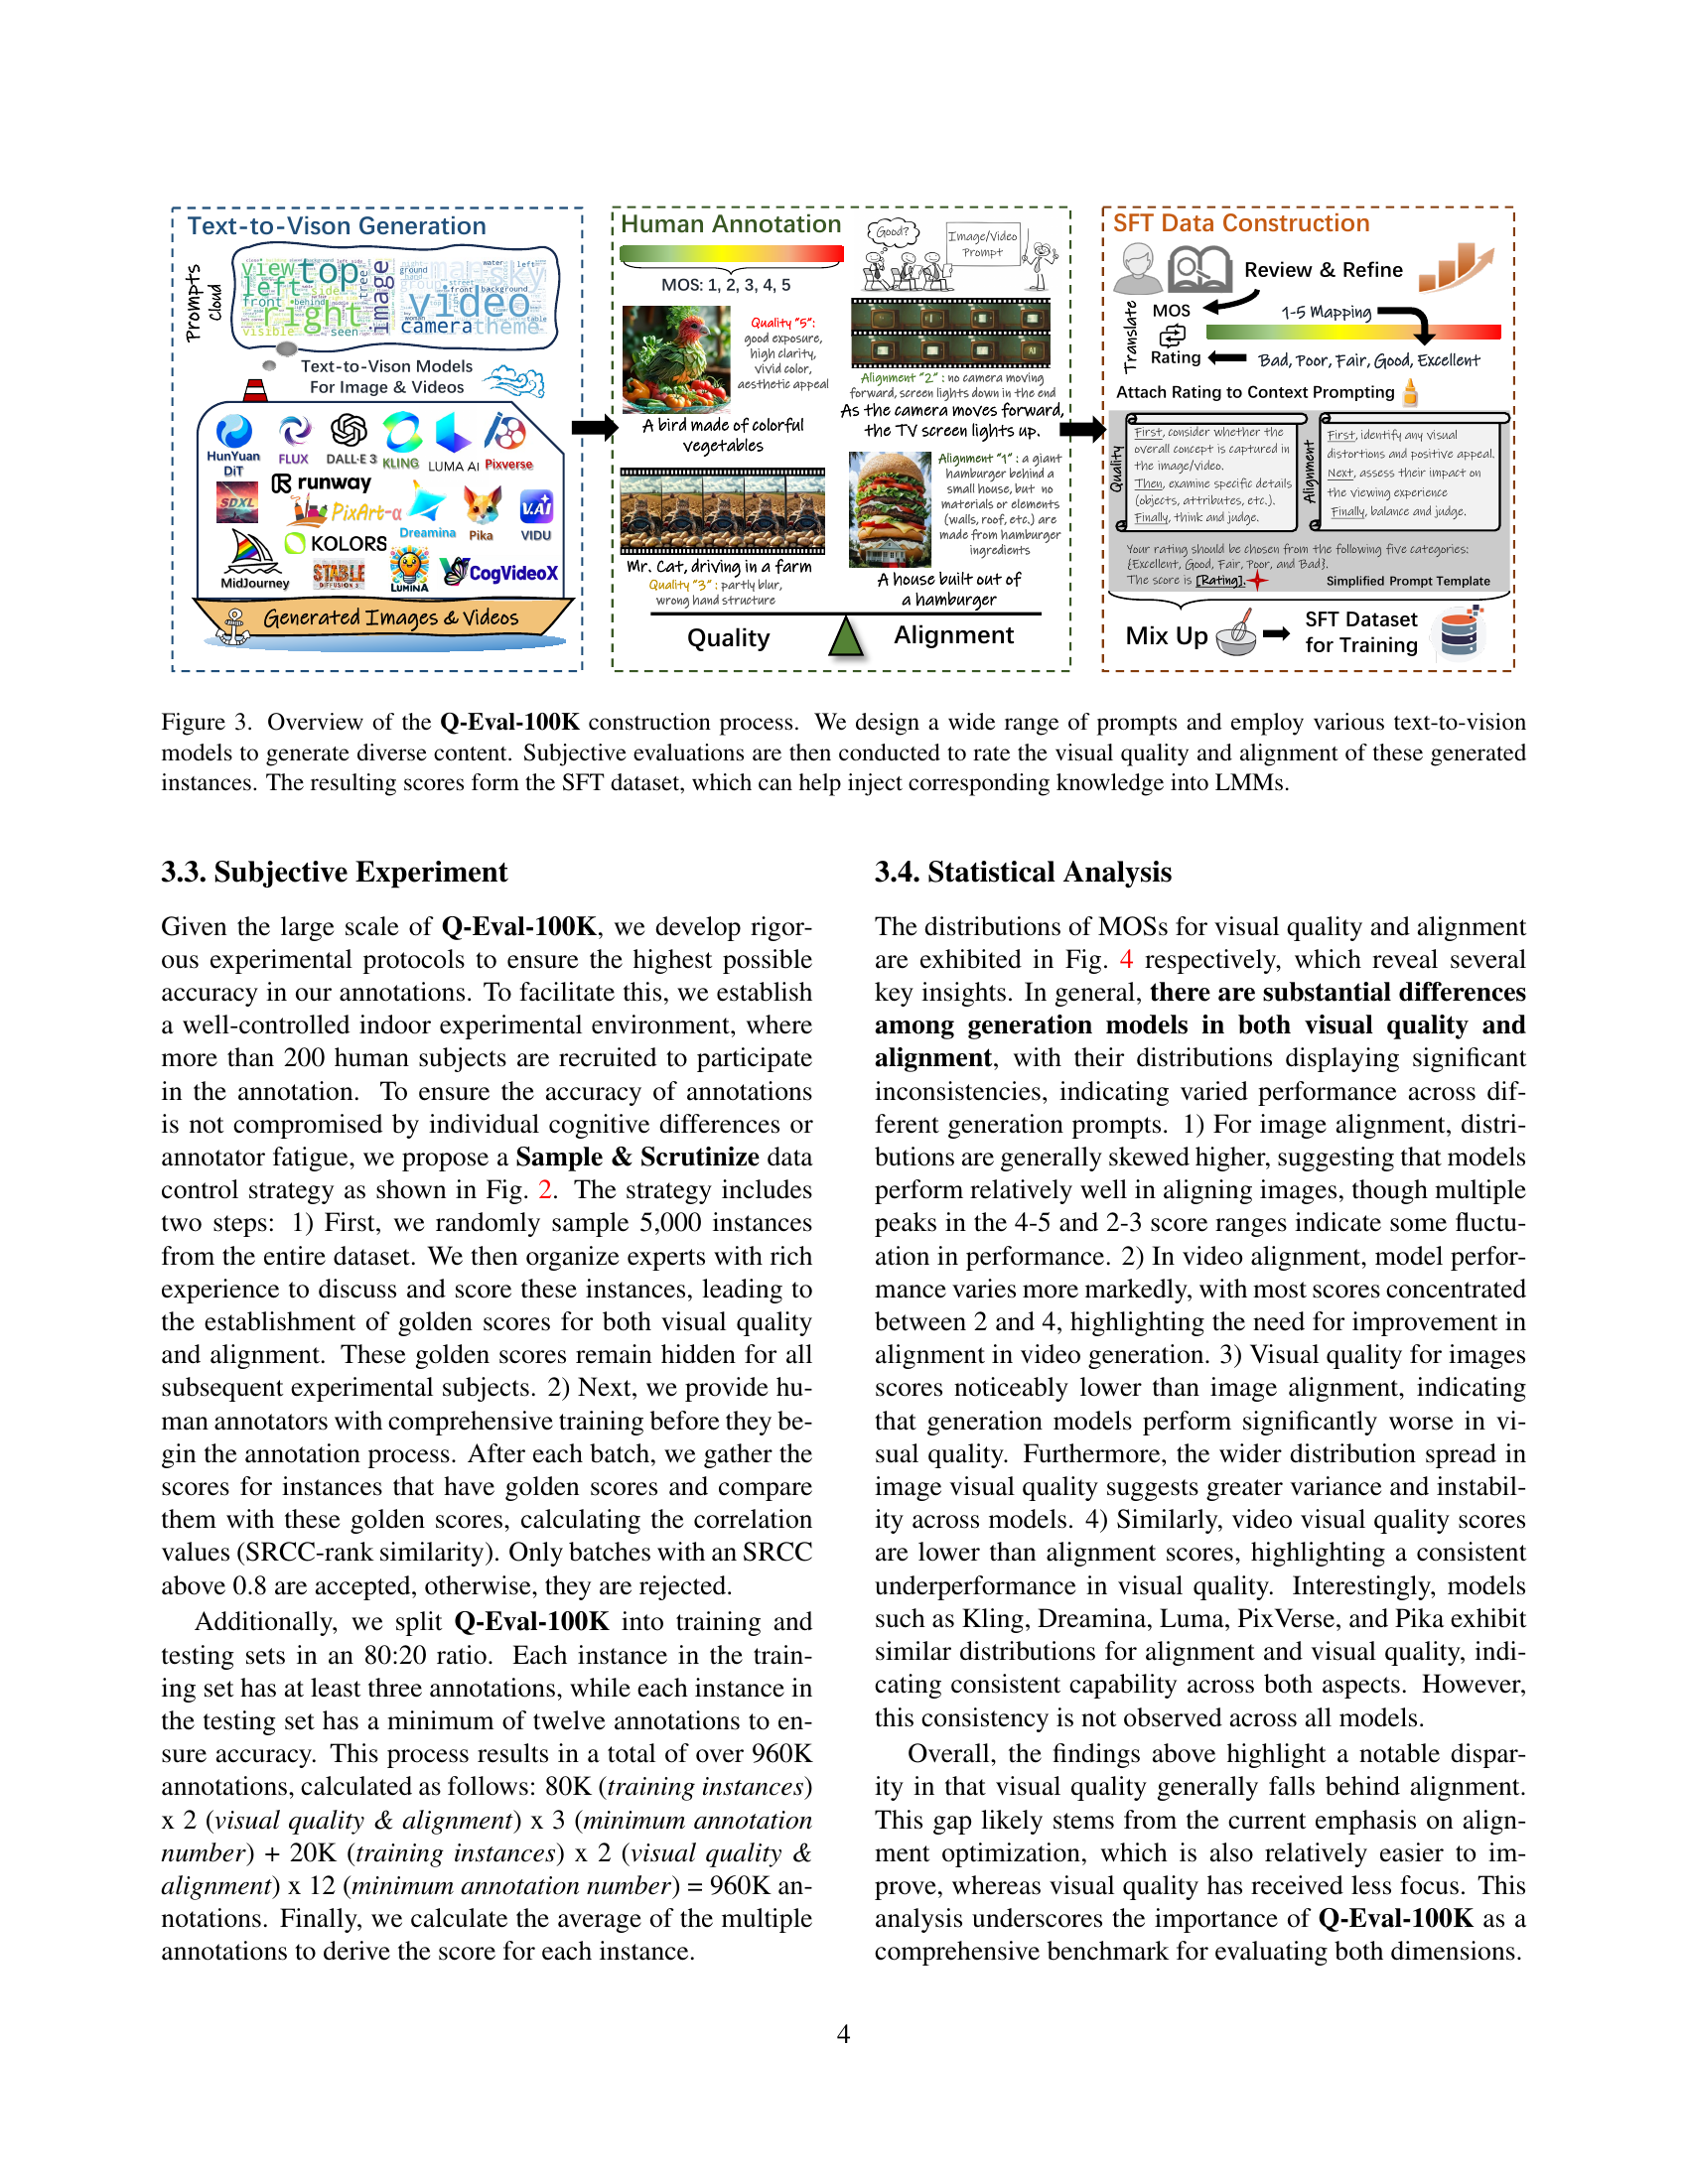
🔼 The figure illustrates the Q-Eval-100K dataset creation process. It starts with prompt design, encompassing diverse prompts created manually and sourced from other datasets. These prompts are fed into various text-to-vision models to generate a wide range of images and videos. Human annotators then subjectively evaluate each generated instance, assessing both its visual quality and alignment with the original prompt. These evaluations are represented by Mean Opinion Scores (MOS). The resulting MOS data then forms a Supervised Fine-Tuning (SFT) dataset. This SFT dataset is specifically designed to train Large Multimodal Models (LMMs), effectively injecting human judgment on visual quality and alignment into the model’s training process.
read the caption
Figure 3: Overview of the Q-Eval-100K construction process. We design a wide range of prompts and employ various text-to-vision models to generate diverse content. Subjective evaluations are then conducted to rate the visual quality and alignment of these generated instances. The resulting scores form the SFT dataset, which can help inject corresponding knowledge into LMMs.
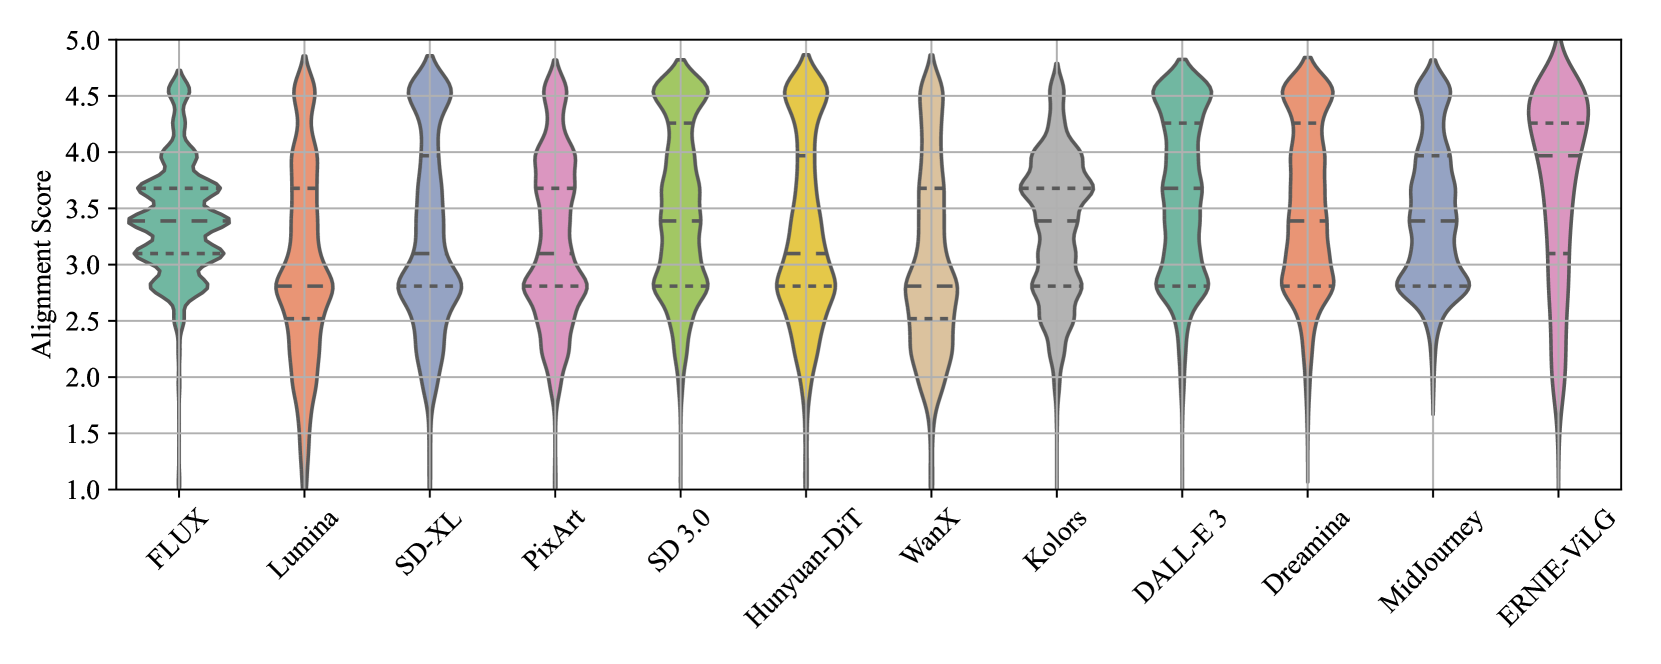
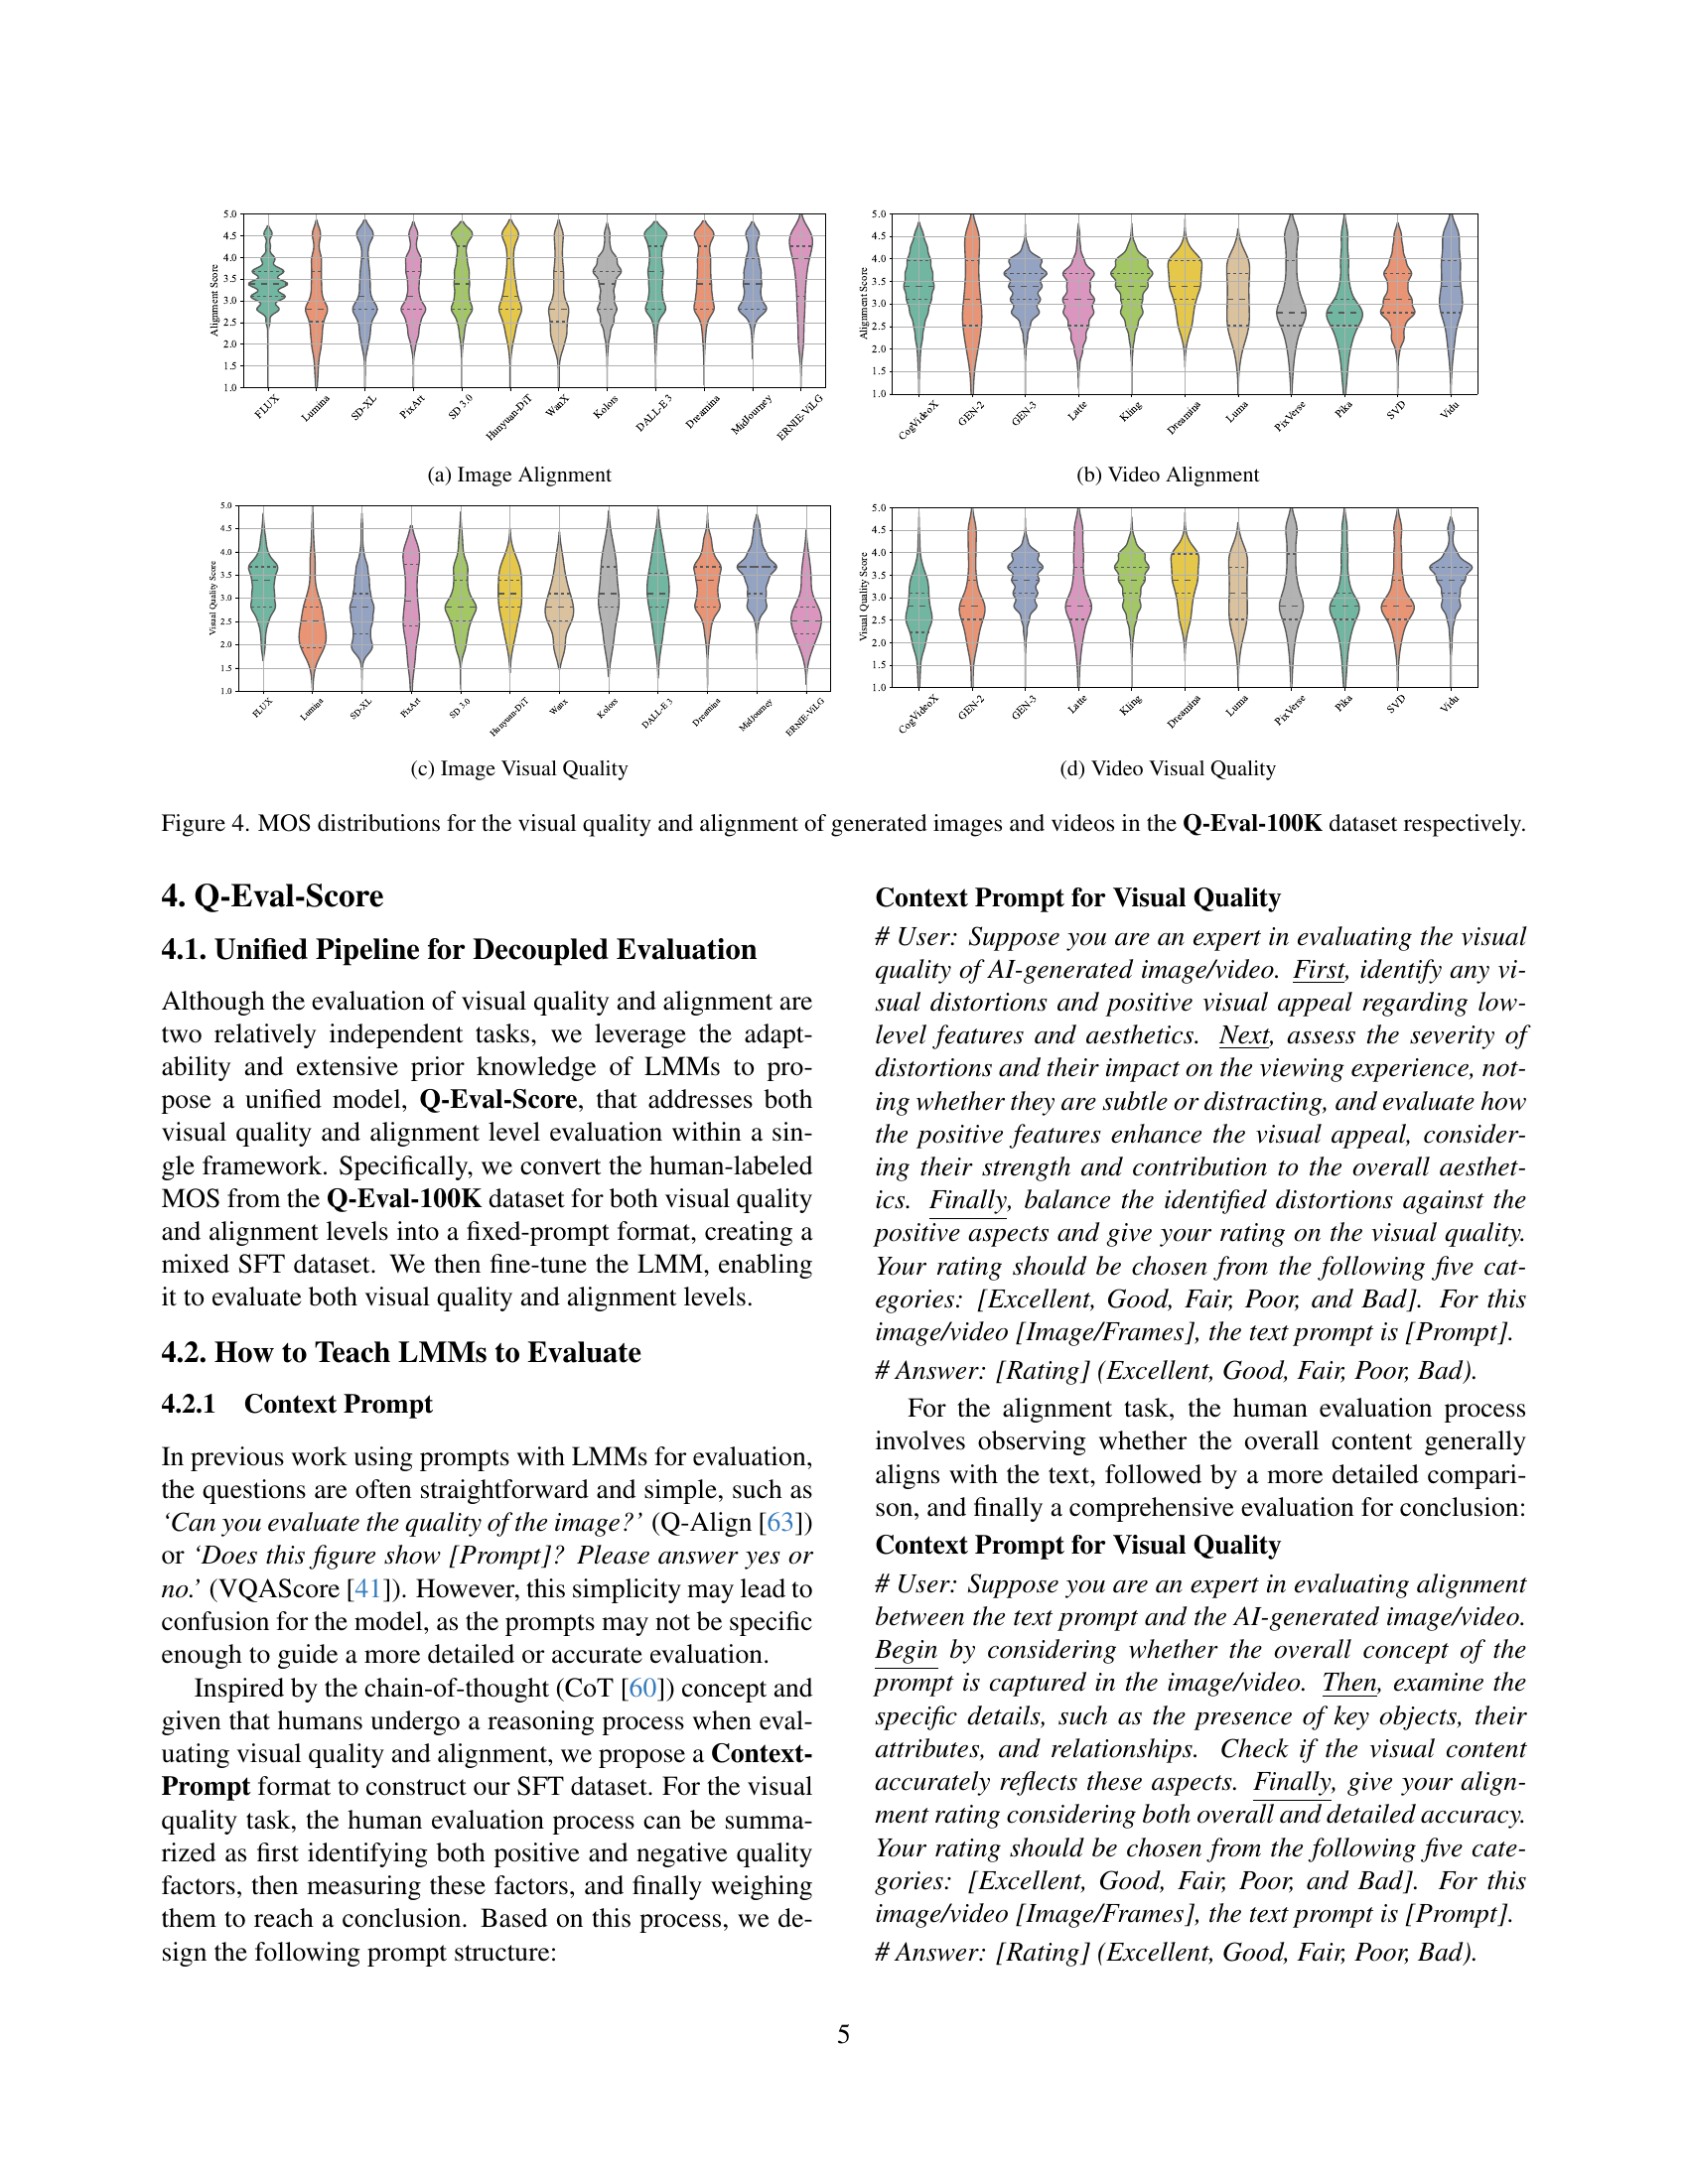
🔼 This figure shows the distribution of Mean Opinion Scores (MOS) for image alignment across different text-to-image generative models. It uses violin plots to represent the distribution of scores for each model, visualizing both the central tendency and the spread of scores. This allows for comparison of the alignment capabilities of various models, showing which models tend to produce more consistent alignments between the generated images and their corresponding text prompts.
read the caption
(a) Image Alignment

🔼 This figure shows the distribution of Mean Opinion Scores (MOS) for video alignment across various text-to-video generation models. The MOS represents human judgment on how well the generated video aligns with the corresponding text prompt. The box plots visualize the range, median, and quartiles of MOS scores for each model. The variations in the distributions reveal the differences in the alignment capabilities of different generation models. Models closer to a score of 5 demonstrate a higher level of alignment, indicating a better correspondence between the visual content of the video and the text prompt.
read the caption
(b) Video Alignment

🔼 This figure is a violin plot showing the distribution of Mean Opinion Scores (MOS) for the visual quality of generated images across various generative models. Each violin represents a different model, and the width of the violin reflects the density of scores at different MOS values. The plot provides a visualization of the performance of various models on the image visual quality, allowing for a comparison of their visual quality capabilities.
read the caption
(c) Image Visual Quality

🔼 This figure (d) shows the distribution of Mean Opinion Scores (MOS) for the visual quality of generated videos in the Q-Eval-100K dataset. It uses violin plots to visualize the MOS distribution across different video generation models, showing the variation in visual quality for each model. The x-axis represents different models, and the y-axis represents the MOS values for visual quality. The violin plot shows both the probability density and the quantiles of the data. The wider the violin, the higher the data density for that model and the higher the variability of the visual quality.
read the caption
(d) Video Visual Quality

🔼 This figure displays violin plots showing the distributions of Mean Opinion Scores (MOS) for visual quality and alignment of generated images and videos from the Q-Eval-100K dataset. Each plot represents a different model’s performance on image alignment, video alignment, image visual quality, and video visual quality, allowing for a comparison of model performance across these categories and media types.
read the caption
Figure 4: MOS distributions for the visual quality and alignment of generated images and videos in the Q-Eval-100K dataset respectively.

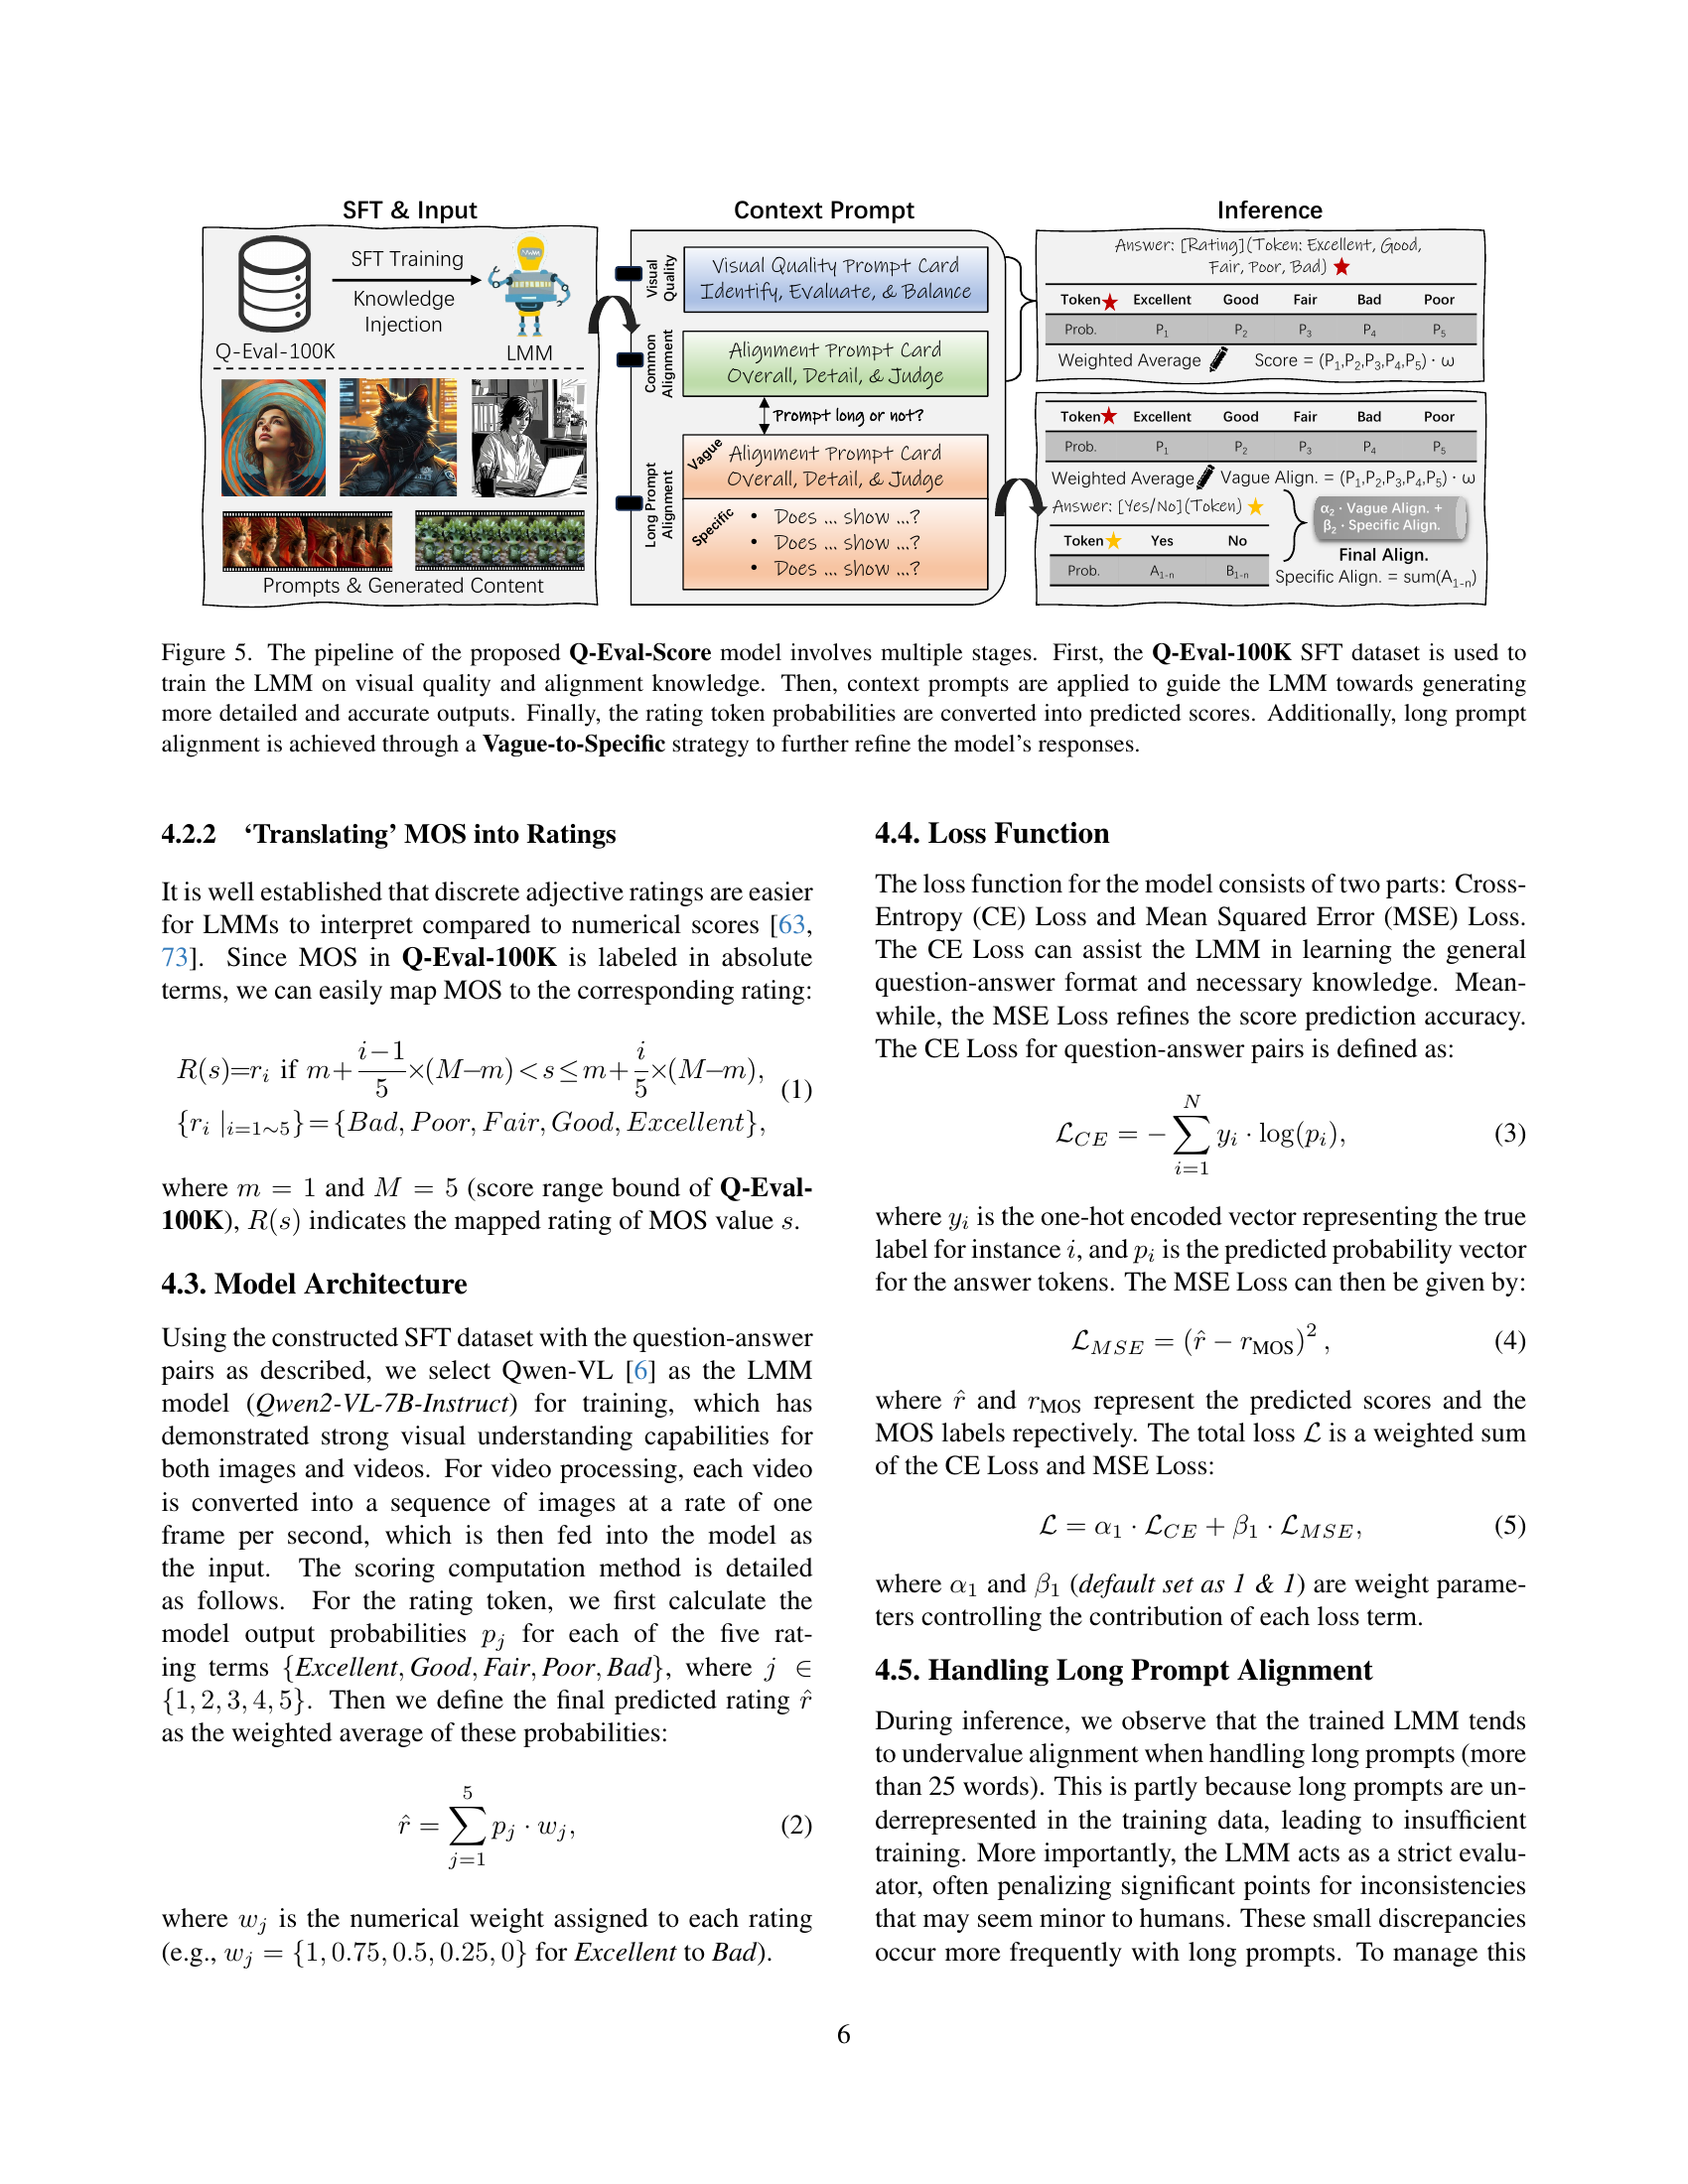
🔼 The Q-Eval-Score model uses a multi-stage process to evaluate visual quality and alignment in text-to-vision content. First, a large language model (LMM) is trained on the Q-Eval-100K dataset, learning to assess both visual quality and alignment. Next, context prompts are used to guide the LMM, prompting more detailed and accurate responses. The model outputs probabilities for different rating tokens (e.g., Excellent, Good, Fair, Poor, Bad), which are then converted into final scores. A special ‘Vague-to-Specific’ strategy further refines the alignment scores, particularly for long prompts, by breaking them down into more manageable parts for evaluation.
read the caption
Figure 5: The pipeline of the proposed Q-Eval-Score model involves multiple stages. First, the Q-Eval-100K SFT dataset is used to train the LMM on visual quality and alignment knowledge. Then, context prompts are applied to guide the LMM towards generating more detailed and accurate outputs. Finally, the rating token probabilities are converted into predicted scores. Additionally, long prompt alignment is achieved through a Vague-to-Specific strategy to further refine the model’s responses.

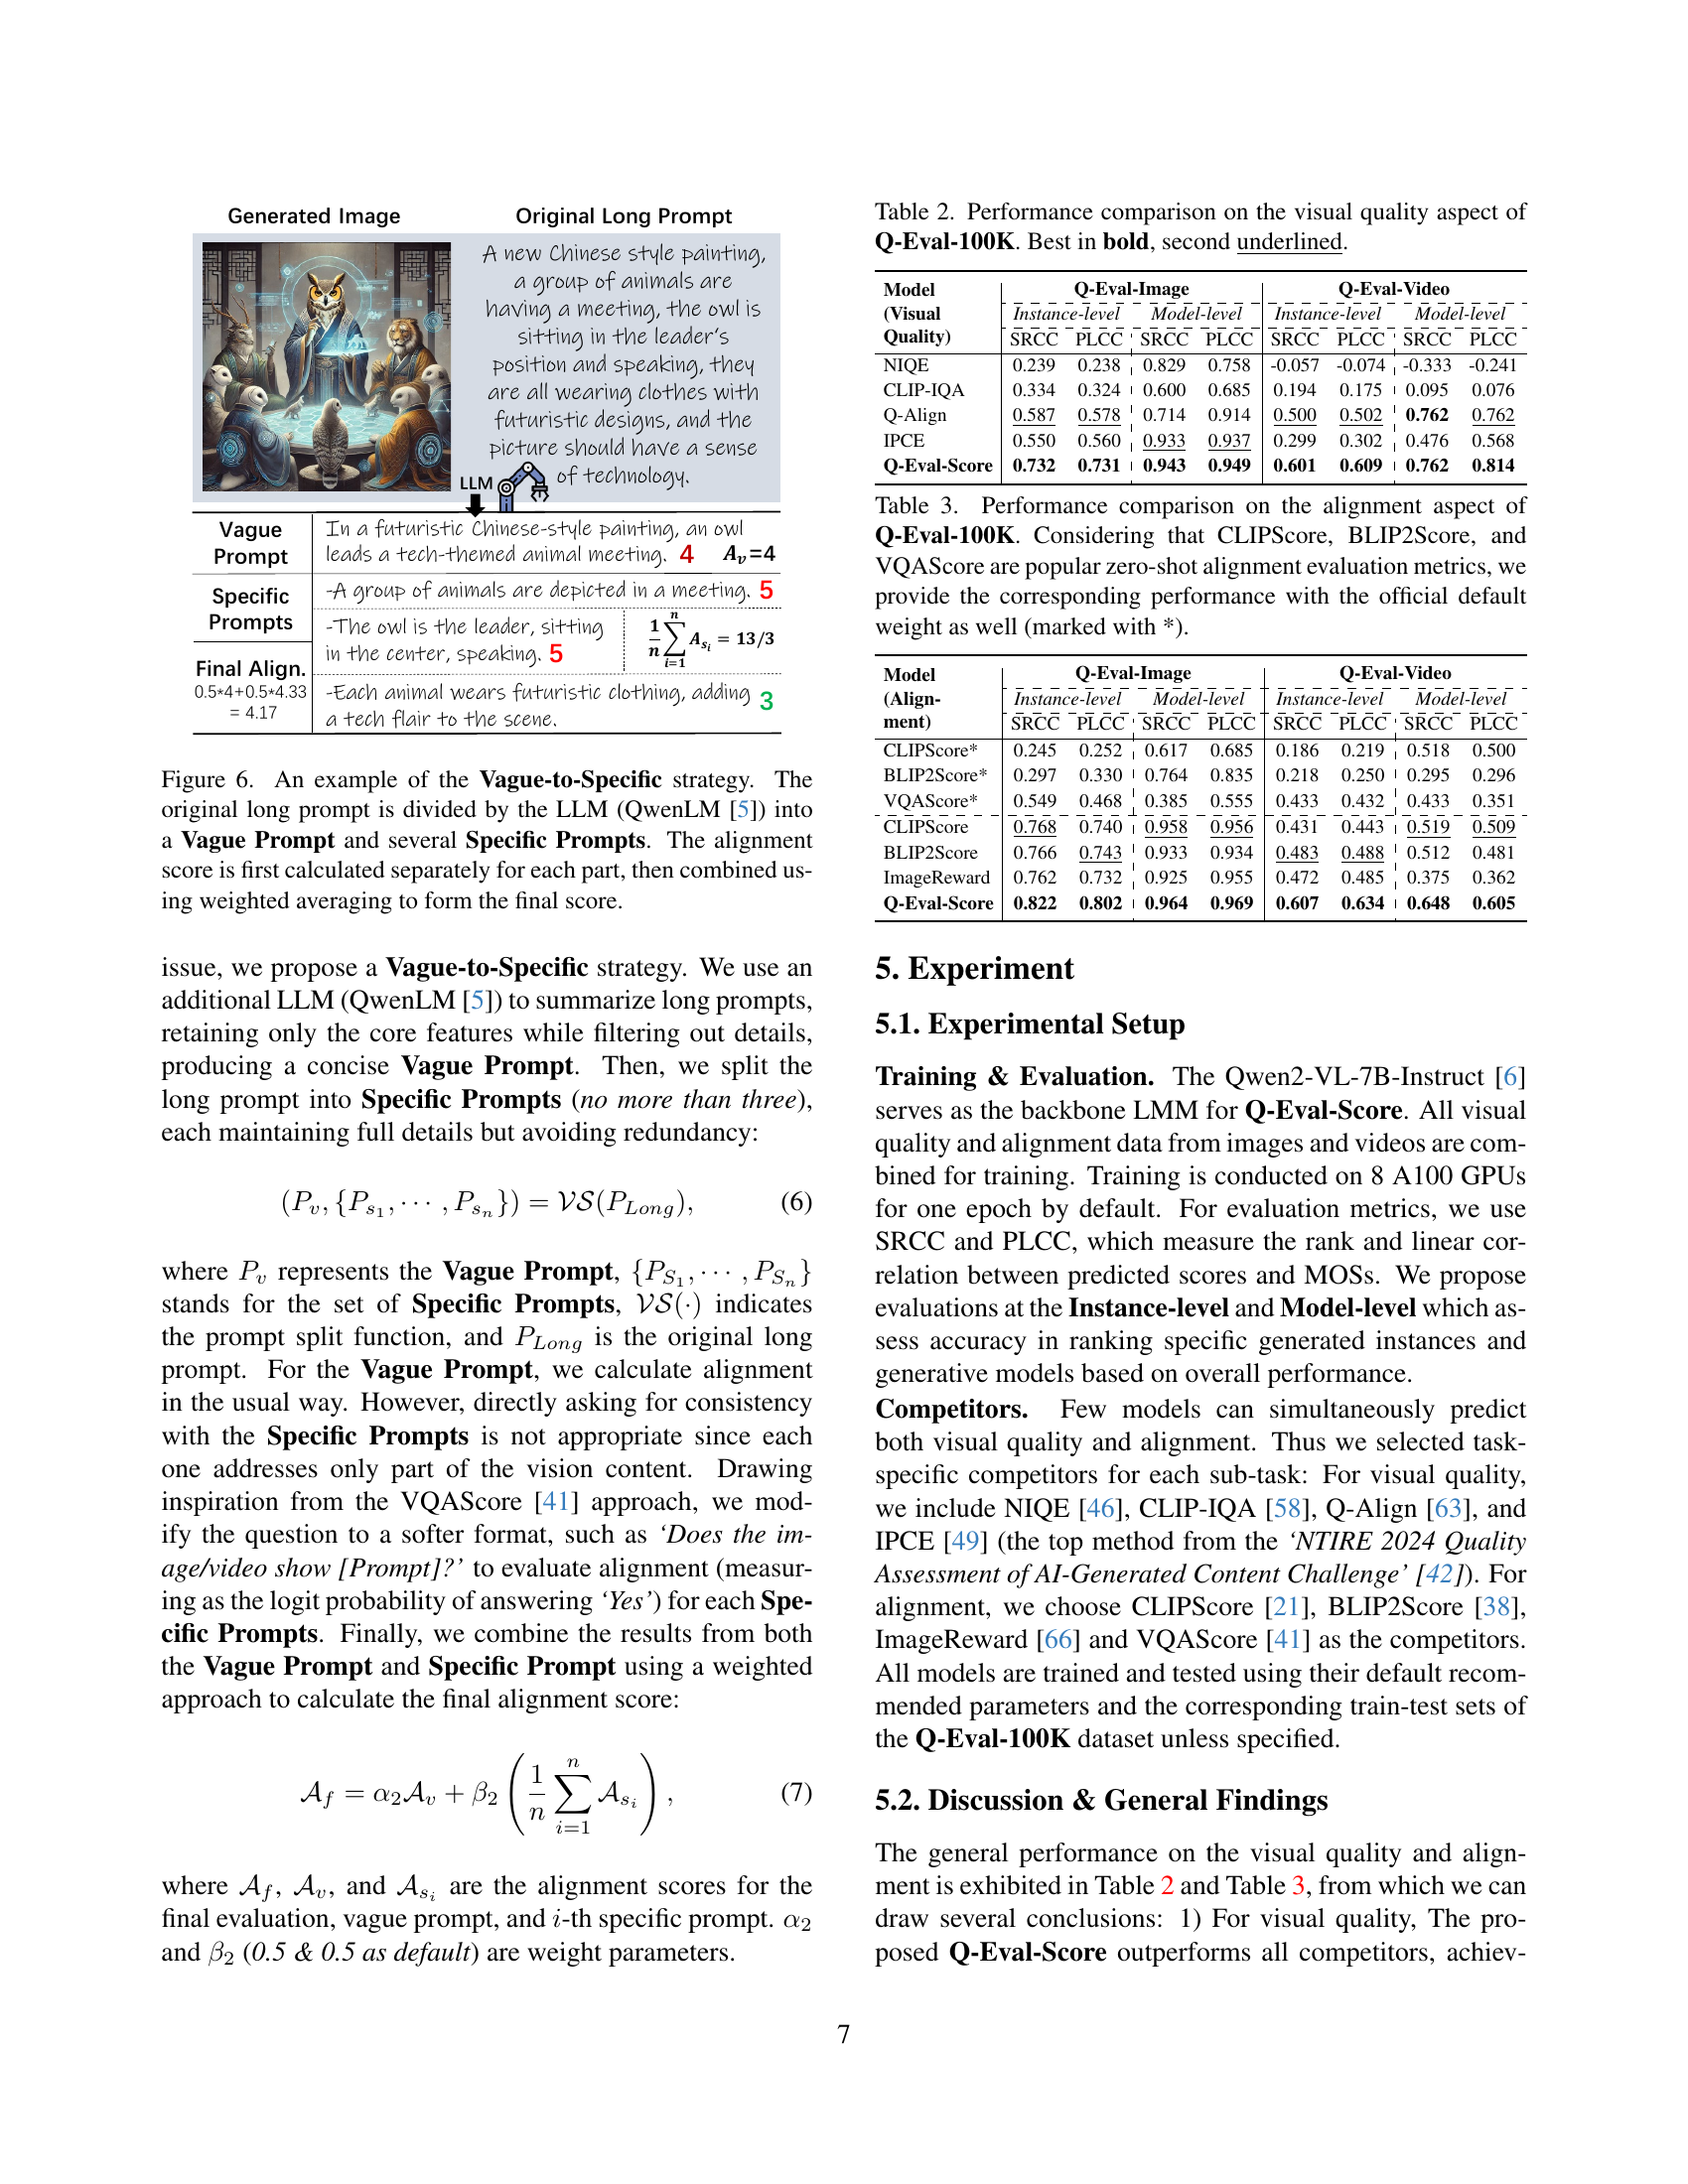
🔼 The figure illustrates the Vague-to-Specific strategy used to evaluate alignment in long prompts. A long prompt, describing a complex scene, is fed into a Large Language Model (LLM). The LLM processes this prompt and outputs two things: 1) a concise summary (the ‘Vague Prompt’) capturing the essence of the original prompt, and 2) several shorter, more specific prompts (the ‘Specific Prompts’) that break down the original prompt’s details. The alignment score is then calculated separately for the Vague Prompt and each Specific Prompt. These individual scores are finally combined using weighted averaging to get a final alignment score that more accurately reflects the overall consistency between the generated image and the original complex prompt.
read the caption
Figure 6: An example of the Vague-to-Specific strategy. The original long prompt is divided by the LLM (QwenLM [5]) into a Vague Prompt and several Specific Prompts. The alignment score is first calculated separately for each part, then combined using weighted averaging to form the final score.

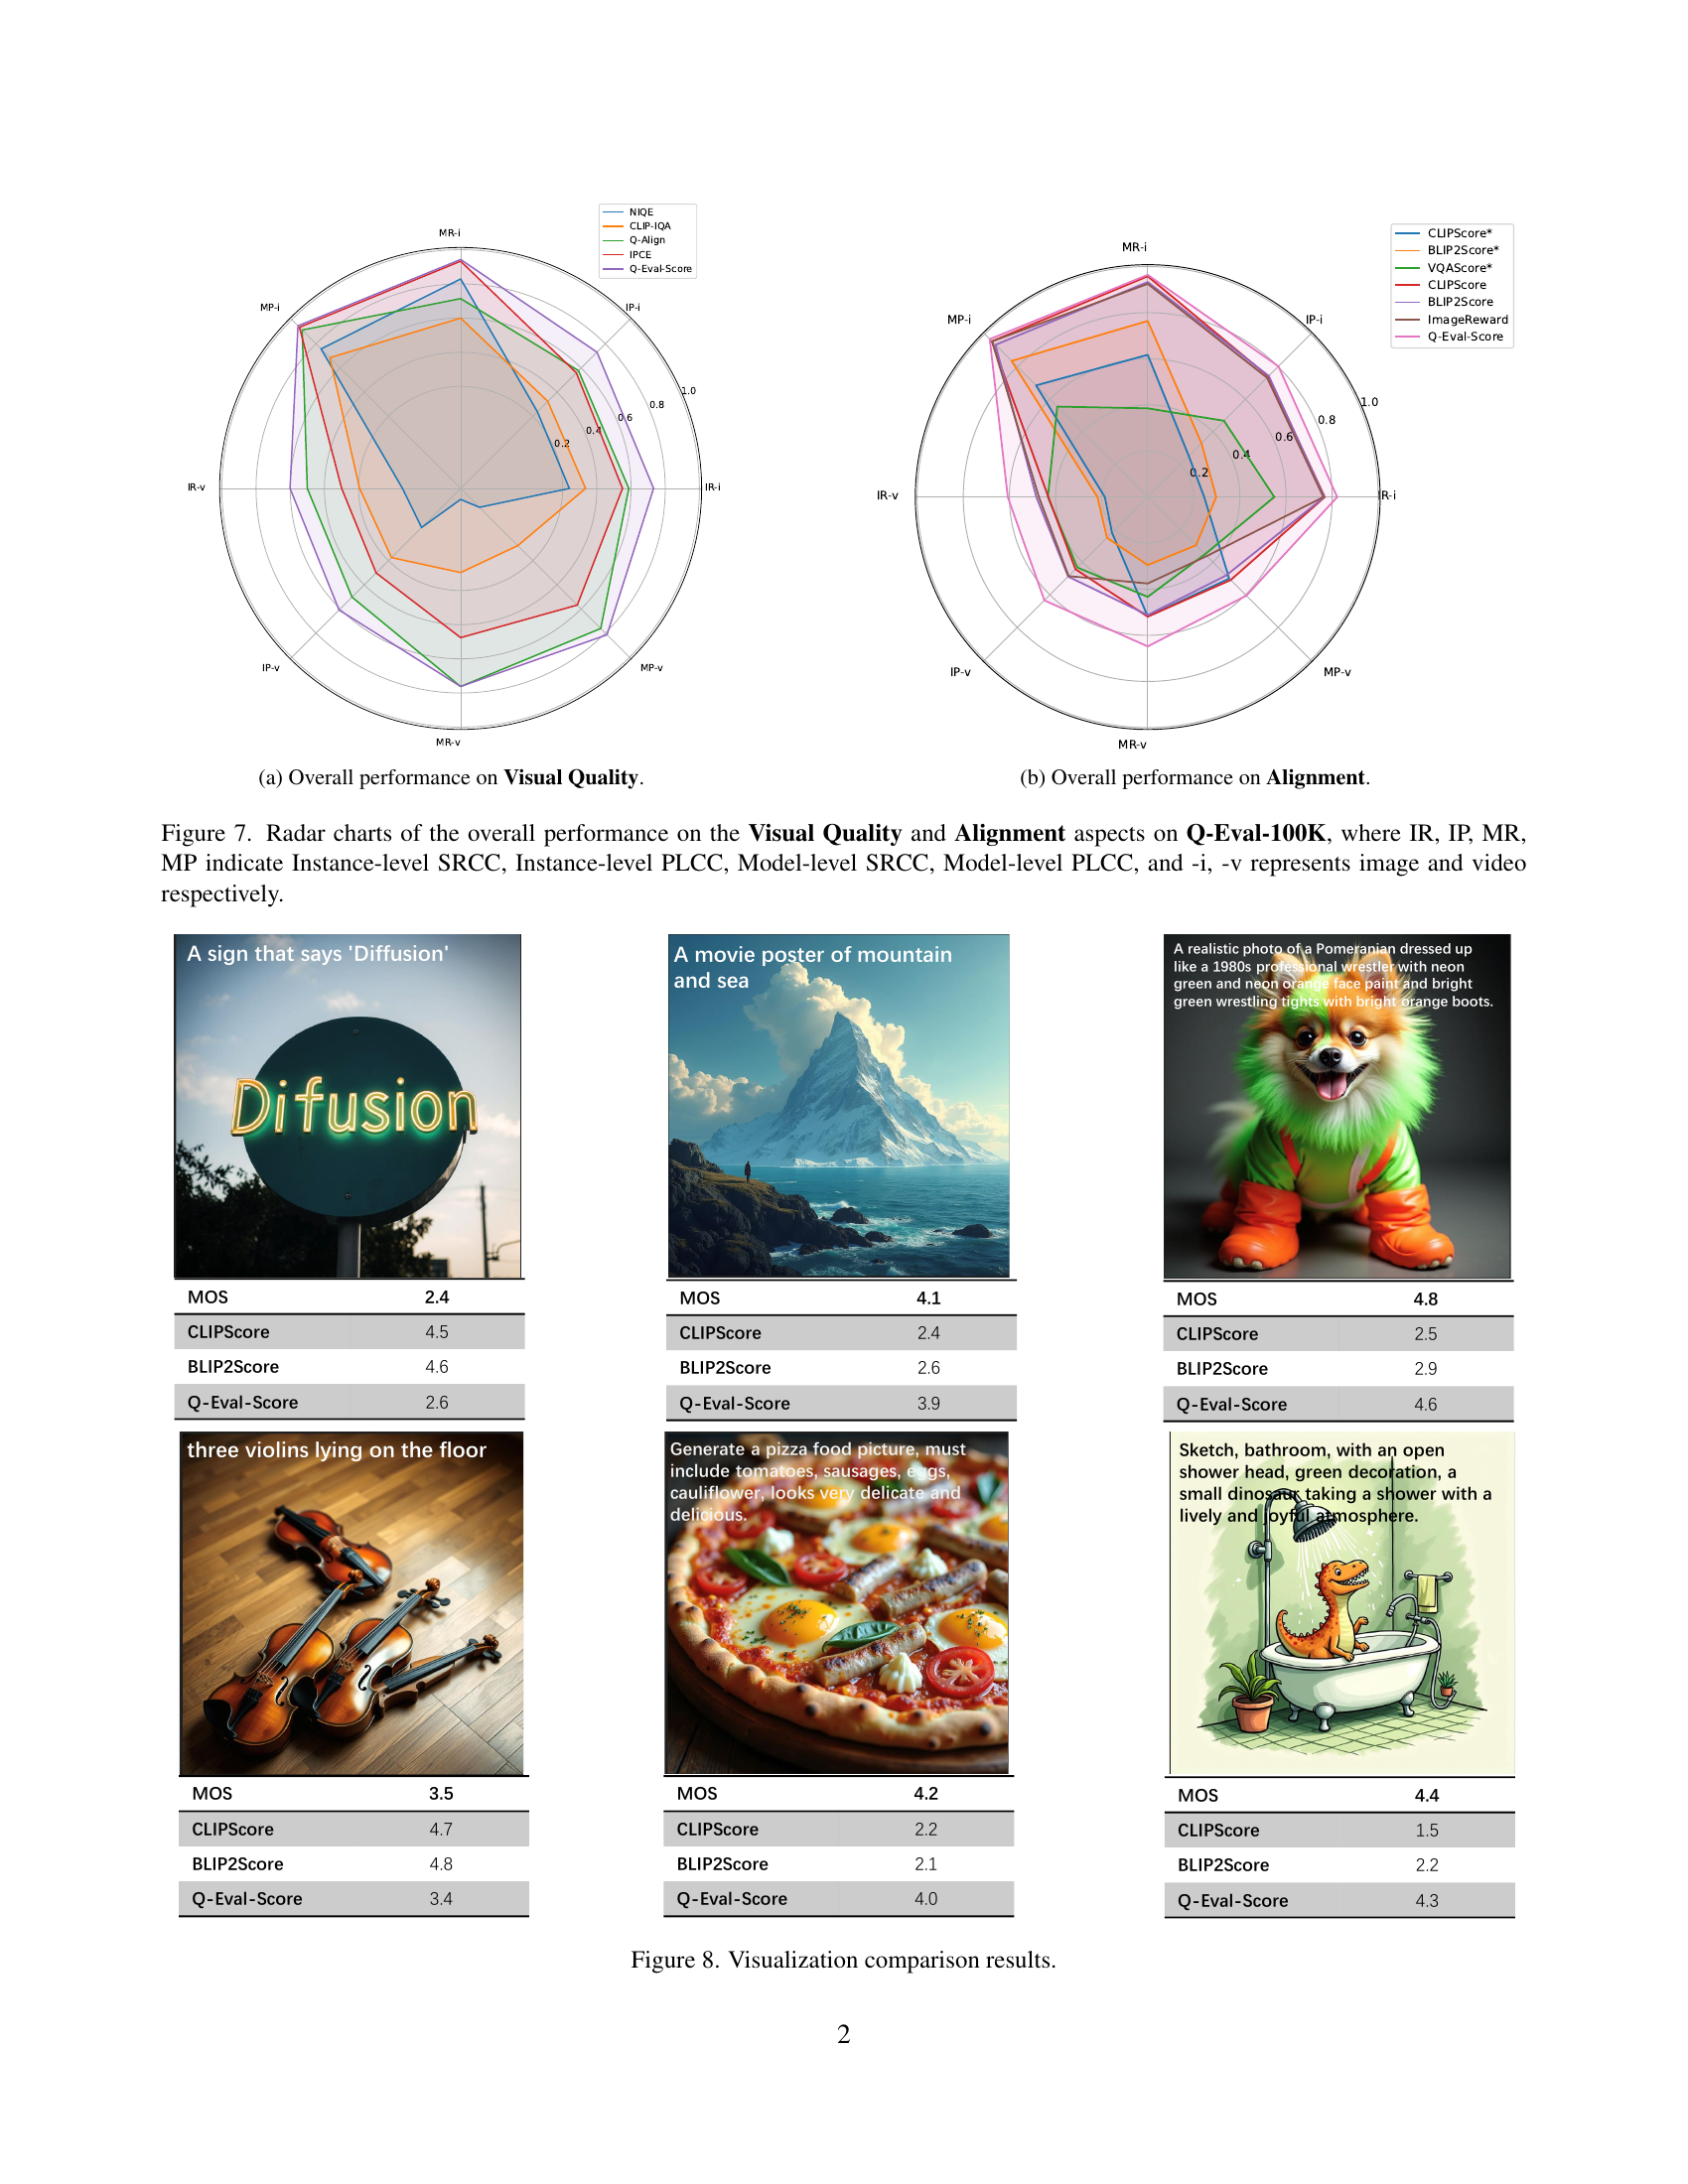
🔼 This radar chart visualizes the overall performance of various models on visual quality assessment. Each axis represents a specific evaluation metric (Instance-level SRCC, Instance-level PLCC, Model-level SRCC, Model-level PLCC for both image and video), and each model’s performance is plotted as a point on the chart. The radial distance of the point from the center indicates the model’s performance score, allowing for a direct comparison across different models and evaluation metrics.
read the caption
(a)

🔼 This radar chart visualizes the overall performance of various models on the alignment aspect of the Q-Eval-100K dataset. The chart presents the Instance-level and Model-level performance of each model, measured using SRCC (Spearman rank correlation coefficient) and PLCC (Pearson linear correlation coefficient). Specifically, it compares the performance of CLIPScore, BLIP2Score, VQAScore, and Q-Eval-Score across different evaluation metrics on both images and videos.
read the caption
(b)

🔼 This figure presents a comparative analysis of visual quality and alignment performance across multiple evaluation methods on the Q-Eval-100K dataset. Two radar charts display the results: one for visual quality and one for alignment. Each chart shows the performance of different methods (indicated by abbreviations such as CLIPScore, BLIP2Score, and Q-Eval-Score) across four evaluation metrics: instance-level Spearman’s rank correlation coefficient (SRCC), instance-level Pearson linear correlation coefficient (PLCC), model-level SRCC, and model-level PLCC. The results are further broken down by image (’-i’) and video (’-v’) modalities. This allows for a comprehensive comparison of the methods’ performance across different evaluation aspects and data types.
read the caption
Figure 7: Radar charts of the overall performance on the Visual Quality and Alignment aspects on Q-Eval-100K, where IR, IP, MR, MP indicate Instance-level SRCC, Instance-level PLCC, Model-level SRCC, Model-level PLCC, and -i, -v represents image and video respectively.

🔼 This figure presents a visual comparison of the results from different evaluation methods, including CLIPScore, BLIP2Score, and Q-Eval-Score. For each of six example image-text pairs, the figure shows the Mean Opinion Score (MOS) from human evaluations alongside the scores assigned by each of the evaluation methods. This comparison allows for a visual assessment of how well each evaluation metric correlates with human judgments of visual quality and alignment.
read the caption
Figure 8: Visualization comparison results.
More on tables
| Model (Visual Quality) | Q-Eval-Image | Q-Eval-Video | ||||||
|---|---|---|---|---|---|---|---|---|
| \cdashline2-9 | Instance-level | Model-level | Instance-level | Model-level | ||||
| \cdashline2-9 | SRCC | PLCC | SRCC | PLCC | SRCC | PLCC | SRCC | PLCC |
| NIQE | 0.239 | 0.238 | 0.829 | 0.758 | -0.057 | -0.074 | -0.333 | -0.241 |
| CLIP-IQA | 0.334 | 0.324 | 0.600 | 0.685 | 0.194 | 0.175 | 0.095 | 0.076 |
| Q-Align | 0.587 | 0.578 | 0.714 | 0.914 | 0.500 | 0.502 | 0.762 | 0.762 |
| IPCE | 0.550 | 0.560 | 0.933 | 0.937 | 0.299 | 0.302 | 0.476 | 0.568 |
| Q-Eval-Score | 0.732 | 0.731 | 0.943 | 0.949 | 0.601 | 0.609 | 0.762 | 0.814 |
🔼 Table 2 presents a comparative analysis of various methods for evaluating the visual quality of images generated by text-to-image models, using the Q-Eval-100K dataset. It compares the performance of different metrics, including NIQE, CLIP-IQA, Q-Align, IPCE, and the proposed Q-Eval-Image, across both instance-level and model-level evaluations. The metrics’ performance is measured using SRCC and PLCC, reflecting the rank and linear correlation with human annotations. The table highlights the superior performance of Q-Eval-Image in both instance and model-level evaluations.
read the caption
Table 2: Performance comparison on the visual quality aspect of Q-Eval-100K. Best in bold, second underlined.
| Model (Alignment) | Q-Eval-Image | Q-Eval-Video | ||||||
|---|---|---|---|---|---|---|---|---|
| \cdashline2-9 | Instance-level | Model-level | Instance-level | Model-level | ||||
| \cdashline2-9 | SRCC | PLCC | SRCC | PLCC | SRCC | PLCC | SRCC | PLCC |
| CLIPScore* | 0.245 | 0.252 | 0.617 | 0.685 | 0.186 | 0.219 | 0.518 | 0.500 |
| BLIP2Score* | 0.297 | 0.330 | 0.764 | 0.835 | 0.218 | 0.250 | 0.295 | 0.296 |
| VQAScore* | 0.549 | 0.468 | 0.385 | 0.555 | 0.433 | 0.432 | 0.433 | 0.351 |
| \hdashlineCLIPScore | 0.768 | 0.740 | 0.958 | 0.956 | 0.431 | 0.443 | 0.519 | 0.509 |
| BLIP2Score | 0.766 | 0.743 | 0.933 | 0.934 | 0.483 | 0.488 | 0.512 | 0.481 |
| ImageReward | 0.762 | 0.732 | 0.925 | 0.955 | 0.472 | 0.485 | 0.375 | 0.362 |
| Q-Eval-Score | 0.822 | 0.802 | 0.964 | 0.969 | 0.607 | 0.634 | 0.648 | 0.605 |
🔼 Table 3 presents a performance comparison of different methods for evaluating the alignment aspect of the Q-Eval-100K dataset. It compares the performance of Q-Eval-Score with several popular zero-shot alignment evaluation metrics (CLIPScore, BLIP2Score, and VQAScore). Results are shown for both image and video data, considering both instance-level (individual generated examples) and model-level (overall model performance) accuracy. To provide a fair comparison, results for the zero-shot methods are also included using their default weights (marked with an asterisk). This allows for a comprehensive evaluation of Q-Eval-Score’s performance compared to existing methods in the field.
read the caption
Table 3: Performance comparison on the alignment aspect of Q-Eval-100K. Considering that CLIPScore, BLIP2Score, and VQAScore are popular zero-shot alignment evaluation metrics, we provide the corresponding performance with the official default weight as well (marked with *).
| Model | Q-Eval-Image (Quality) | Q-Eval-Video (Quality) | Q-Eval-Image (Alignment) | Q-Eval-Video (Alignment) | ||||||||||||
|---|---|---|---|---|---|---|---|---|---|---|---|---|---|---|---|---|
| \cdashline2-17 | Instance-level | Model-level | Instance-level | Model-level | Instance-level | Model-level | Instance-level | Model-level | ||||||||
| \cdashline2-17 | SRCC | PLCC | SRCC | PLCC | SRCC | PLCC | SRCC | PLCC | SRCC | PLCC | SRCC | PLCC | SRCC | PLCC | SRCC | PLCC |
| w/o SFT Training | 0.071 | 0.096 | 0.257 | 0.136 | 0.018 | 0.008 | 0.262 | 0.314 | 0.529 | 0.423 | 0.560 | 0.705 | 0.464 | 0.437 | 0.567 | 0.478 |
| w/o Context Prompt | 0.504 | 0.509 | 0.600 | 0.756 | 0.598 | 0.591 | 0.571 | 0.638 | 0.805 | 0.776 | 0.960 | 0.963 | 0.588 | 0.597 | 0.601 | 0.602 |
| w/o CE Loss | 0.652 | 0.622 | 0.932 | 0.910 | 0.247 | 0.249 | 0.071 | 0.239 | 0.804 | 0.776 | 0.948 | 0.961 | 0.604 | 0.626 | 0.642 | 0.593 |
| w/o MSE Loss | 0.665 | 0.673 | 0.933 | 0.941 | 0.595 | 0.583 | 0.690 | 0.712 | 0.795 | 0.763 | 0.954 | 0.958 | 0.580 | 0.605 | 0.624 | 0.599 |
| Q-Eval-Score | 0.732 | 0.731 | 0.943 | 0.949 | 0.601 | 0.609 | 0.762 | 0.814 | 0.822 | 0.802 | 0.964 | 0.969 | 0.607 | 0.634 | 0.648 | 0.605 |
🔼 This ablation study analyzes the impact of different components of the Q-Eval-Score model on its performance. It examines the contribution of supervised fine-tuning (SFT) training, context prompts, cross-entropy (CE) loss, and mean squared error (MSE) loss. The table presents the performance metrics (Instance-level SRCC, Instance-level PLCC, Model-level SRCC, Model-level PLCC) for both image and video data, comparing the full Q-Eval-Score model to variations where one component is removed.
read the caption
Table 4: Ablation Study of Q-Eval-Score.
| Model (Alignment) | Q-Eval-Image (Long) | Q-Eval-Video (Long) | ||
|---|---|---|---|---|
| \cdashline2-5 | Instance-level | Instance-level | ||
| \cdashline2-5 | SRCC | PLCC | SRCC | PLCC |
| CLIPScore | 0.533 | 0.547 | 0.359 | 0.367 |
| BLIP2Score | 0.620 | 0.636 | 0.392 | 0.395 |
| VQAScore | 0.432 | 0.325 | 0.344 | 0.350 |
| \hdashlinew/o V2S | 0.591 | 0.599 | 0.480 | 0.470 |
| w V2S | 0.620 | 0.623 | 0.517 | 0.512 |
🔼 This table presents a comparison of alignment evaluation performance on a subset of the Q-Eval-100K dataset containing long prompts (over 25 words). The comparison focuses on the proposed Q-Eval-Score model, specifically contrasting its performance with and without the application of the Vague-to-Specific (V2S) strategy. The results are presented for both image and video data using the Instance-level SRCC and PLCC metrics to show the impact of the V2S strategy on the model’s ability to effectively handle long prompts.
read the caption
Table 5: Performance comparison on the alignment aspect of Q-Eval-100K on the long prompt subset, where w/o V2S and w V2S represents the proposed Q-Eval-Score model with and without the Vague-to-Specific strategy respectively.
| Model (Alignment) | GenAI-Bench (Image) | GenAI-Bench (Video) | ||
|---|---|---|---|---|
| \cdashline2-5 | SRCC | PLCC | SRCC | PLCC |
| CLIPScore* | 0.174 | 0.169 | 0.269 | 0.269 |
| BLIP2Score* | 0.221 | 0.209 | 0.289 | 0.275 |
| VQAScore* | 0.556 | 0.502 | 0.527 | 0.505 |
| \hdashlineCLIPScore | 0.681 | 0.670 | 0.610 | 0.628 |
| BLIP2Score | 0.687 | 0.679 | 0.679 | 0.705 |
| ImageReward | 0.664 | 0.656 | 0.663 | 0.684 |
| Q-Eval-Score | 0.757 | 0.747 | 0.717 | 0.714 |
🔼 This table presents the cross-dataset validation results of Q-Eval-Score on the GenAI-Bench dataset. Q-Eval-Score, which was originally trained on the Q-Eval-100K dataset, is evaluated on GenAI-Bench to assess its generalization capabilities. The table compares the performance of Q-Eval-Score against several other popular alignment evaluation metrics (CLIPScore, BLIP2Score, and VQAScore), showing the SRCC and PLCC scores for both image and video alignment tasks on GenAI-Bench. An asterisk (*) indicates that the default weights were used for the respective methods.
read the caption
Table 6: Cross-dataset validation performance on GenAI-Bench. The Q-Eval-Score is trained on the Q-Eval-100K and then validated on GenAI-Bench. * indicates using default weight.
| Category | Subcategory | Count |
| Entity Generation | Simple Entity Generation | 1439 |
| \cdashline2-3 | Simple Human Generation | / |
| Simple Object Generation | / | |
| Other Simple Entity Generation | / | |
| Complex Entity Generation | 1729 | |
| Character Information Generation | / | |
| Text and Symbol Generation | / | |
| Chart Generation | / | |
| Entity Attribute Generation | Basic Entity Attributes | 1656 |
| \cdashline2-3 | Entity Shape Generation | / |
| Entity Position Generation | / | |
| Entity Color Generation | / | |
| Entity State Generation | / | |
| Other Entity Attributes Generation | / | |
| Person and Animal Attributes Generation | 1500 | |
| \cdashline2-3 | Emotion Generation | / |
| Action Generation | / | |
| Specific Age Person Generation | / | |
| Specific Gender Person Generation | / | |
| Other Person and Animal Attributes | / | |
| Portrait Generation | 531 | |
| \cdashline2-3 | Simple Portrait Generation | / |
| Complex Portrait Generation | / | |
| Scene and Theme Generation | 2450 | |
| \cdashline2-3 | Theme Generation | / |
| Scene Generation | / | |
| Style Generation | 294 | |
| Basic Visual Attributes Generation | 321 | |
| \cdashline2-3 | Image Sharpness Generation | / |
| Exposure Generation | / | |
| Lighting Generation | / | |
| Contrast Generation | / | |
| Color Saturation Generation | / | |
| Noise Level Generation | / | |
| Composition Generation | / | |
| Color Balance Generation | / | |
| Depth of Field Generation | / | |
| Perspective Generation | / | |
| Camera Angle Generation | / | |
| Other Basic Visual Attributes Generation | / | |
| Interaction Ability | Interacting Multi-Entity Generation | 1729 |
| \cdashline2-3 | Sequential Relationship Multi-Entity Generation | / |
| Causal Relationship Multi-Entity Generation | / | |
| Spatial Relationship Multi-Entity Generation | / |
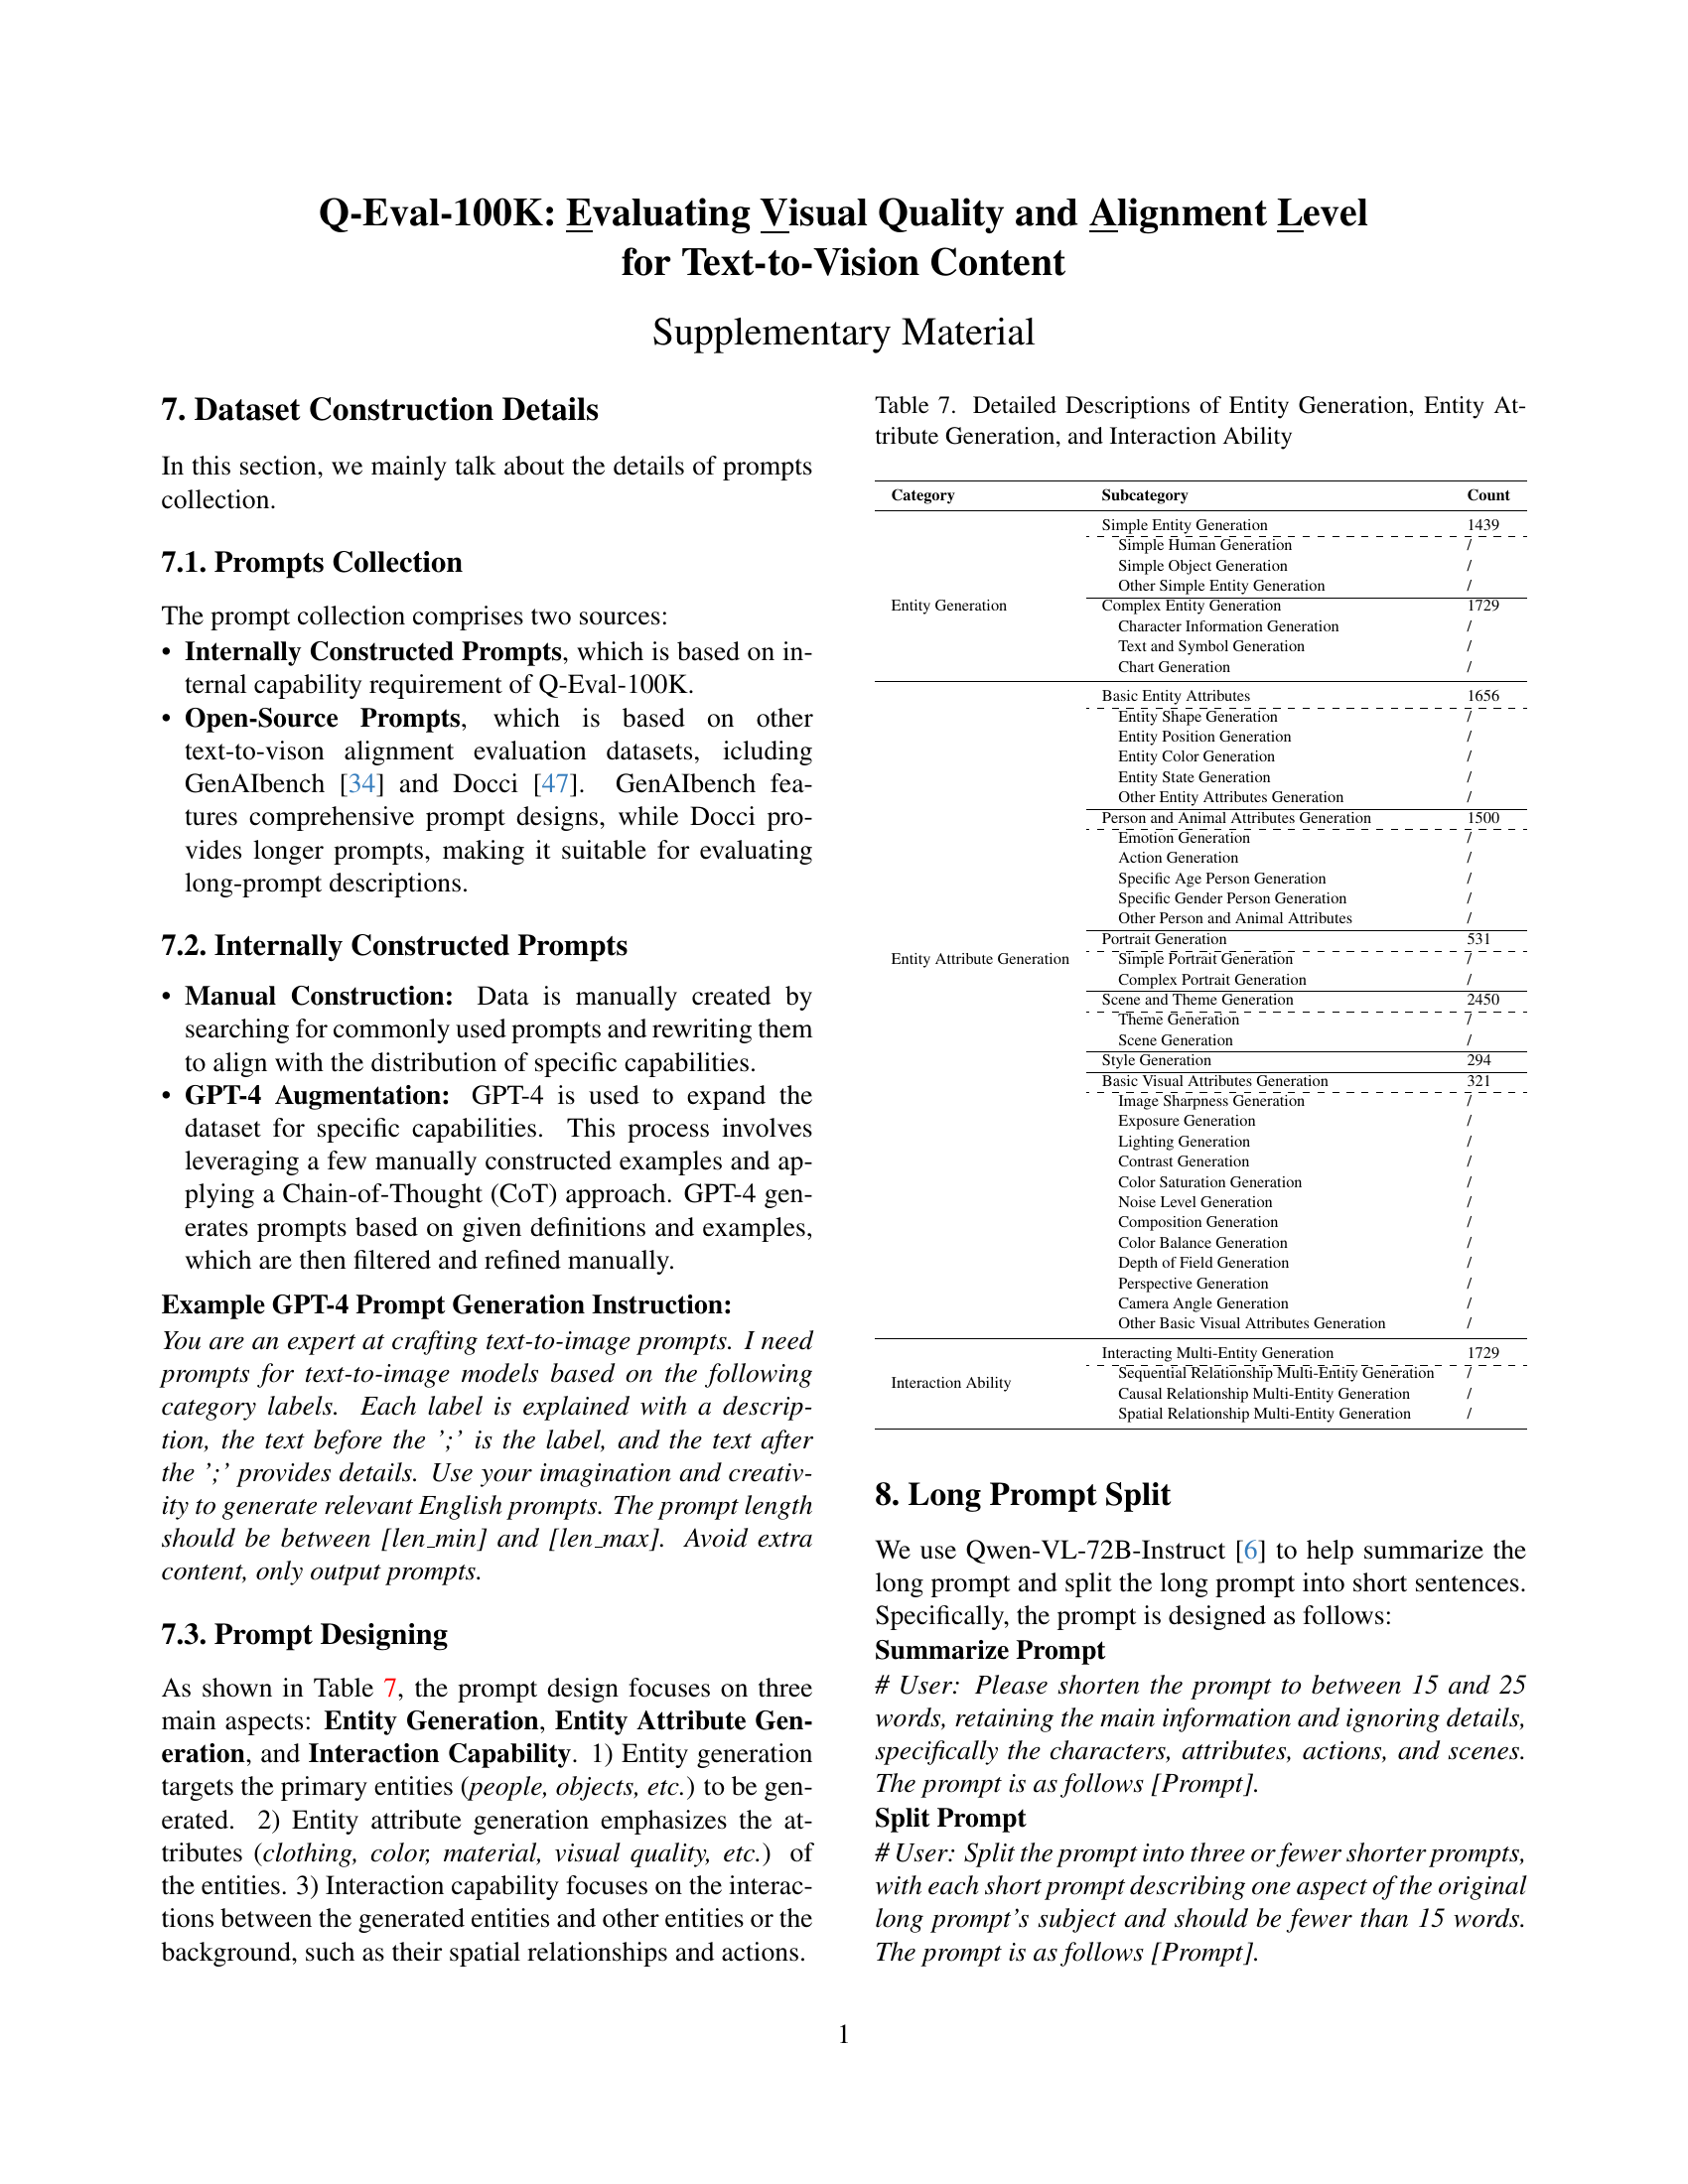
🔼 Table 7 provides a detailed breakdown of the prompt design used in the Q-Eval-100K dataset creation. It categorizes the prompts based on three key aspects: Entity Generation (creation of the primary entities within the image or video), Entity Attribute Generation (defining the characteristics of those entities), and Interaction Ability (describing the relationships and actions between entities or with the background). Each aspect is further divided into subcategories, illustrating the diversity and complexity of prompts included. The ‘Count’ column indicates the number of prompts within each subcategory.
read the caption
Table 7: Detailed Descriptions of Entity Generation, Entity Attribute Generation, and Interaction Ability
| Dataset | AGIQAQuality | T2VQA | AGIQAAlign | TIFA160 |
|---|---|---|---|---|
| Method | SRCC/PLCC | SRCC/PLCC | SRCC/PLCC | SRCC/PLCC |
| Q-Align | 0.6581/0.6743 | 0.2539/0.2198 | Inapplicable | Inapplicable |
| CLIPScore | Inapplicable | Inapplicable | 0.5515/0.5627 | 0.5903/0.5952 |
| BLIP2Score | Inapplicable | Inapplicable | 0.6873/0.7085 | 0.7267/0.7468 |
| Q-Eval-Score | 0.7256/0.7248 | 0.4479/0.4498 | 0.7544/0.7432 | 0.7845/0.7954 |
🔼 This table presents the cross-validation results of different models (Q-Align, CLIPScore, BLIP2Score, and Q-Eval-Score) on four datasets: AGIQA-Quality, T2VQA, AGIQA-Align, and TIFA160. All models were pre-trained using the Q-Eval-100K dataset. The results, reported as SRCC/PLCC (Spearman Rank Correlation Coefficient/Pearson Linear Correlation Coefficient), demonstrate the generalization performance of each model across different datasets and tasks (visual quality and alignment).
read the caption
Table 8: Cross-validation (All pre-trained on Q-Eval-100K).
Full paper#