TL;DR#
Large Language Models for coding are powerful, but require high-quality, verifiable training data. Current code resources fail to cover a broad range of coding tasks, from simple to algorithmic, and often lack verifiable correctness, such as unit tests. This presents a challenge for training robust and reliable coding models. Datasets are either limited in scale, lack diversity and complexity, or don’t offer reliable response verification, hindering the development of truly capable coding assistants.
To address this, this paper introduces KODCODE, a synthetic dataset of 447K coding questions with verified solutions and unit tests. KODCODE uses a three-step pipeline: question synthesis from 12 sources, solution and test generation with self-verification, and post-training data synthesis to diversify questions. It evaluates its effectiveness on coding benchmarks, demonstrating state-of-the-art performance surpassing models such as Qwen2.5-Coder and DeepSeek-R1, showing its potential to advance SFT and RL post-training pipelines.
Key Takeaways#
Why does it matter?#
This work introduces a large-scale, diverse, and verifiable synthetic dataset that boosts coding LLM performance, offering a new benchmark and directions for future research.
Visual Insights#

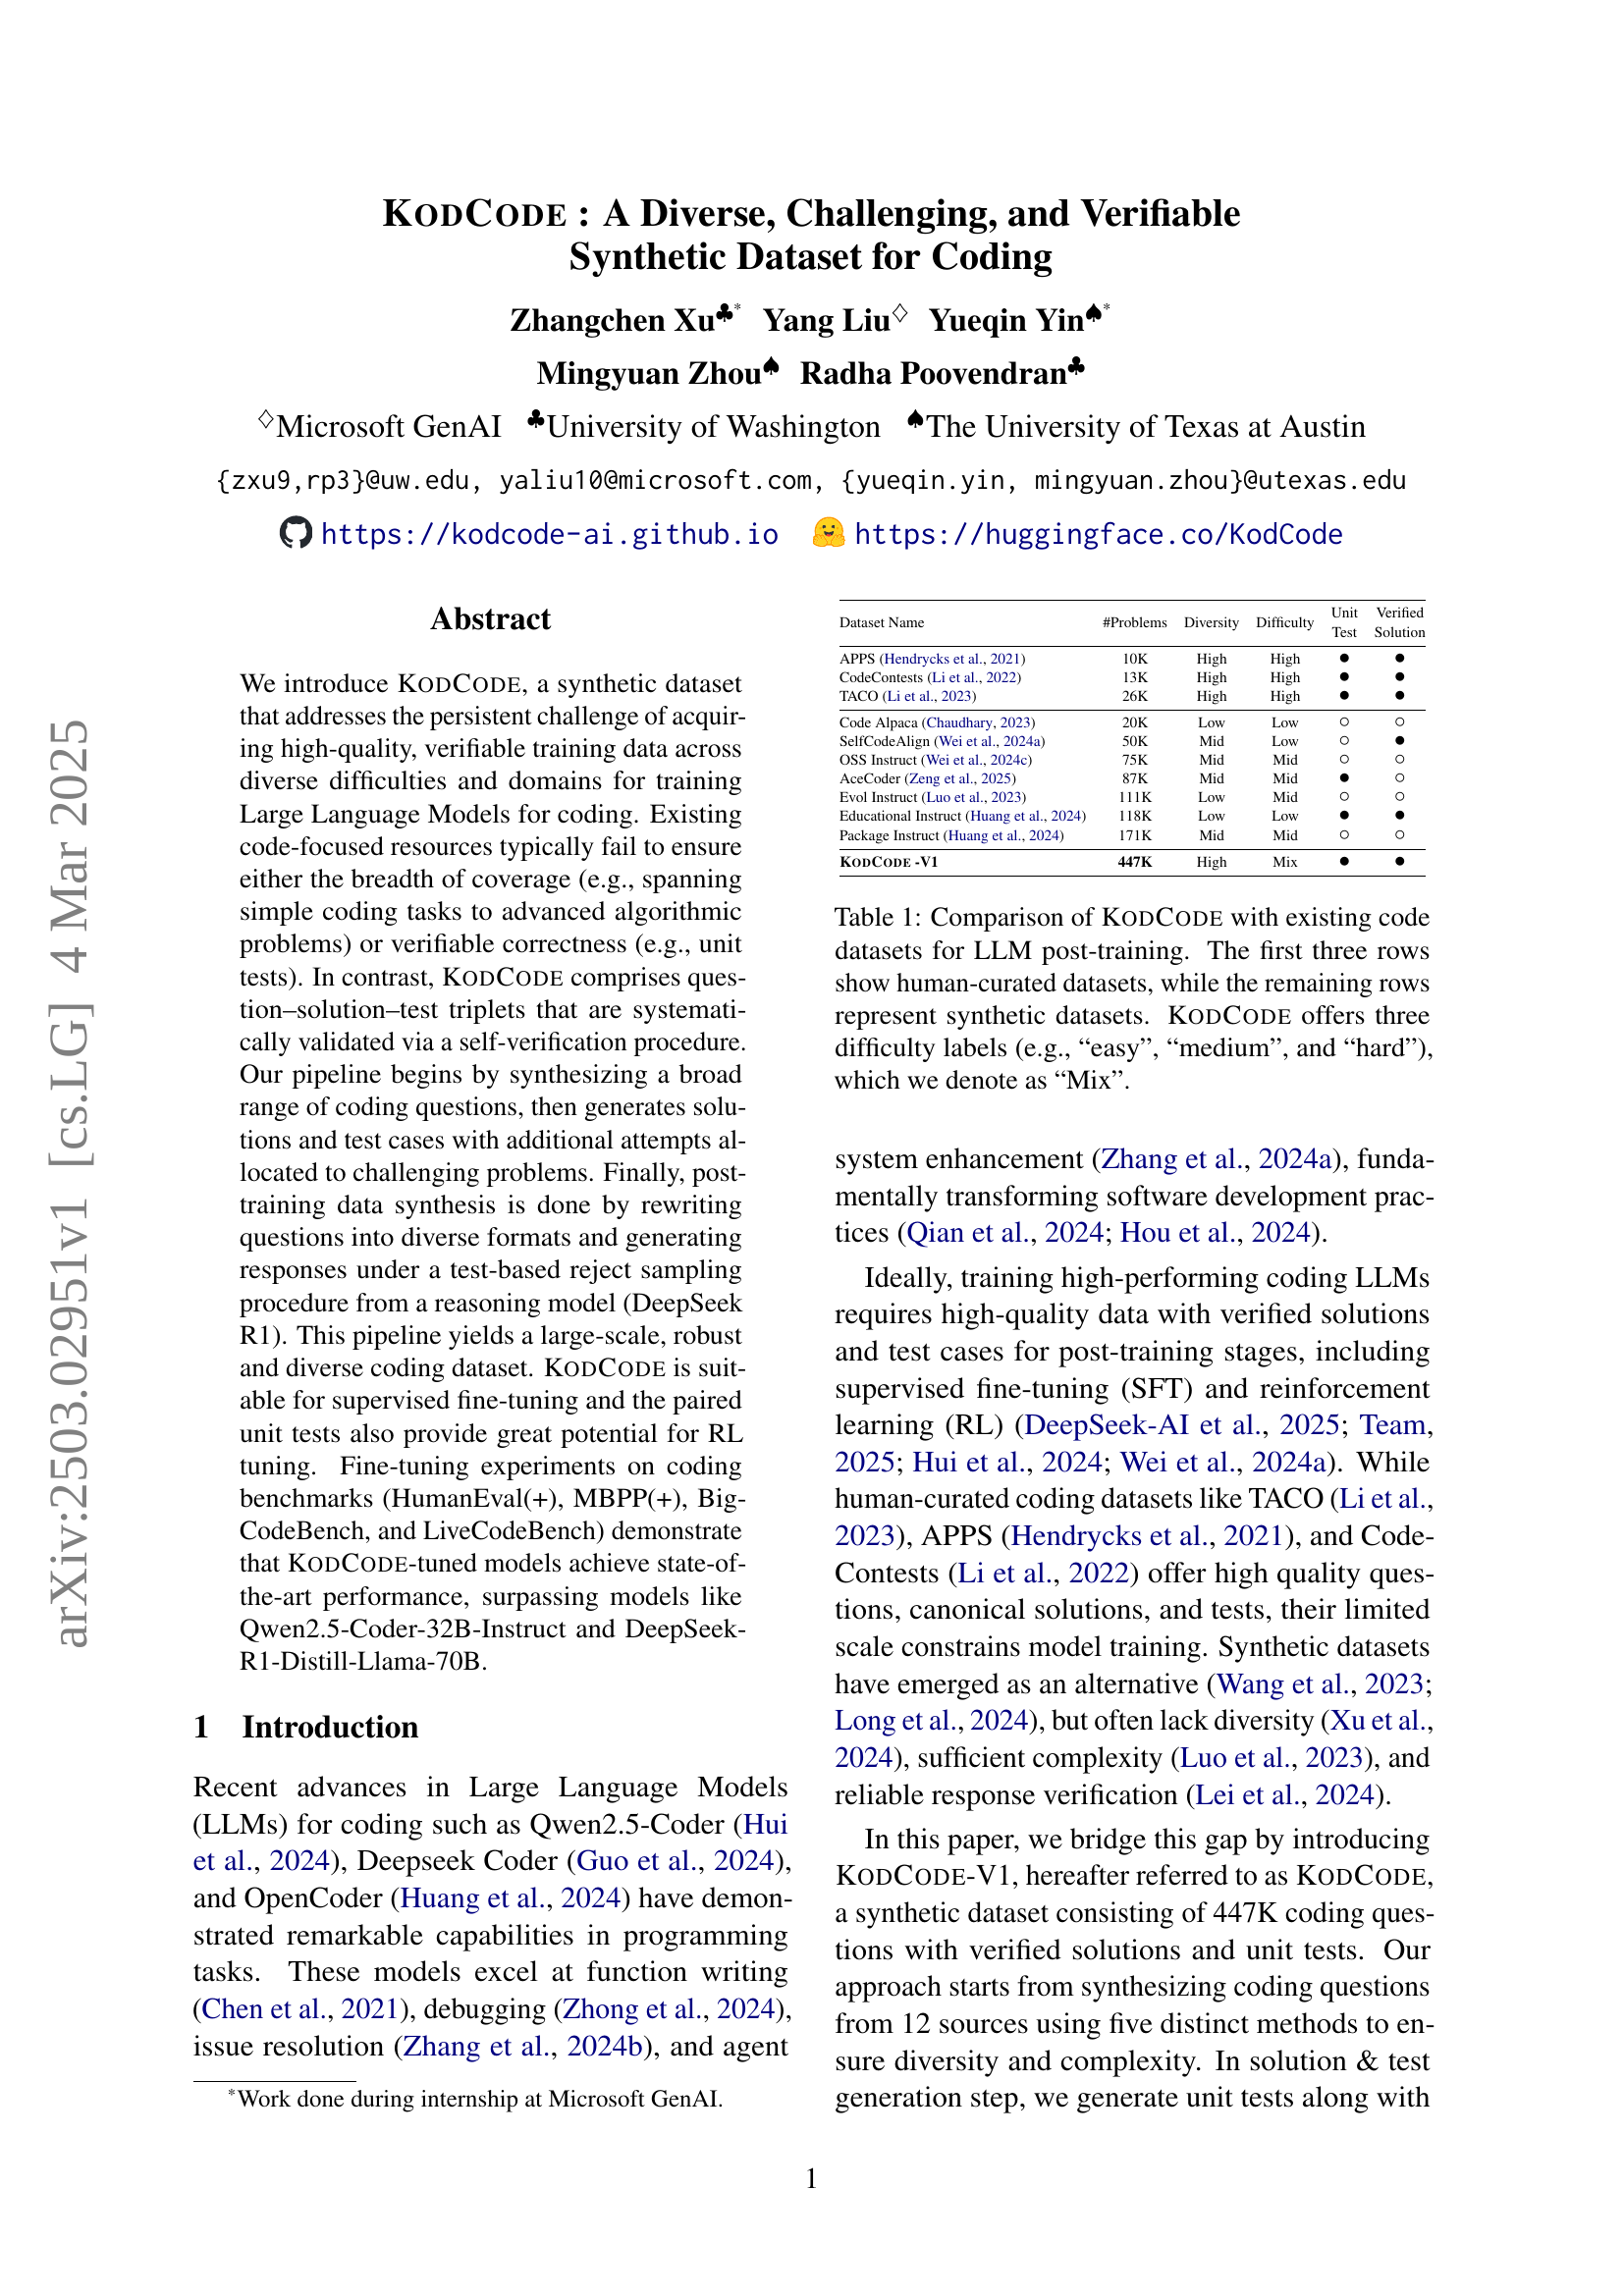
🔼 This figure illustrates the three-step pipeline used to create the KodCode-V1 dataset. First, coding questions are synthesized using diverse methods. Second, solutions and corresponding unit tests are generated, undergoing a self-verification process to ensure correctness. Finally, post-training data synthesis expands the dataset by rewriting questions and creating chain-of-thought responses via a reasoning model. The resulting dataset contains 447,000 question-solution-test triplets, with the distribution of each subset shown on the right side of the figure.
read the caption
Figure 1: This figure demonstrates the pipeline for generating KodCode-V1. Our approach follows a three-step pipeline: Coding Question Synthesis, Solution & Test Generation, and Post-training Data Synthesis. The final KodCode-V1 dataset contains 447K verified question-solution-test triplets. The distribution of each subset is demonstrated on the right.
| Dataset Name | #Problems | Diversity | Difficulty | Unit Test | Verified Solution |
| APPS (Hendrycks et al., 2021) | 10K | High | High | ||
| CodeContests (Li et al., 2022) | 13K | High | High | ||
| TACO (Li et al., 2023) | 26K | High | High | ||
| Code Alpaca (Chaudhary, 2023) | 20K | Low | Low | ||
| SelfCodeAlign (Wei et al., 2024a) | 50K | Mid | Low | ||
| OSS Instruct (Wei et al., 2024c) | 75K | Mid | Mid | ||
| AceCoder (Zeng et al., 2025) | 87K | Mid | Mid | ||
| Evol Instruct (Luo et al., 2023) | 111K | Low | Mid | ||
| Educational Instruct (Huang et al., 2024) | 118K | Low | Low | ||
| Package Instruct (Huang et al., 2024) | 171K | Mid | Mid | ||
| KodCode -V1 | 447K | High | Mix |
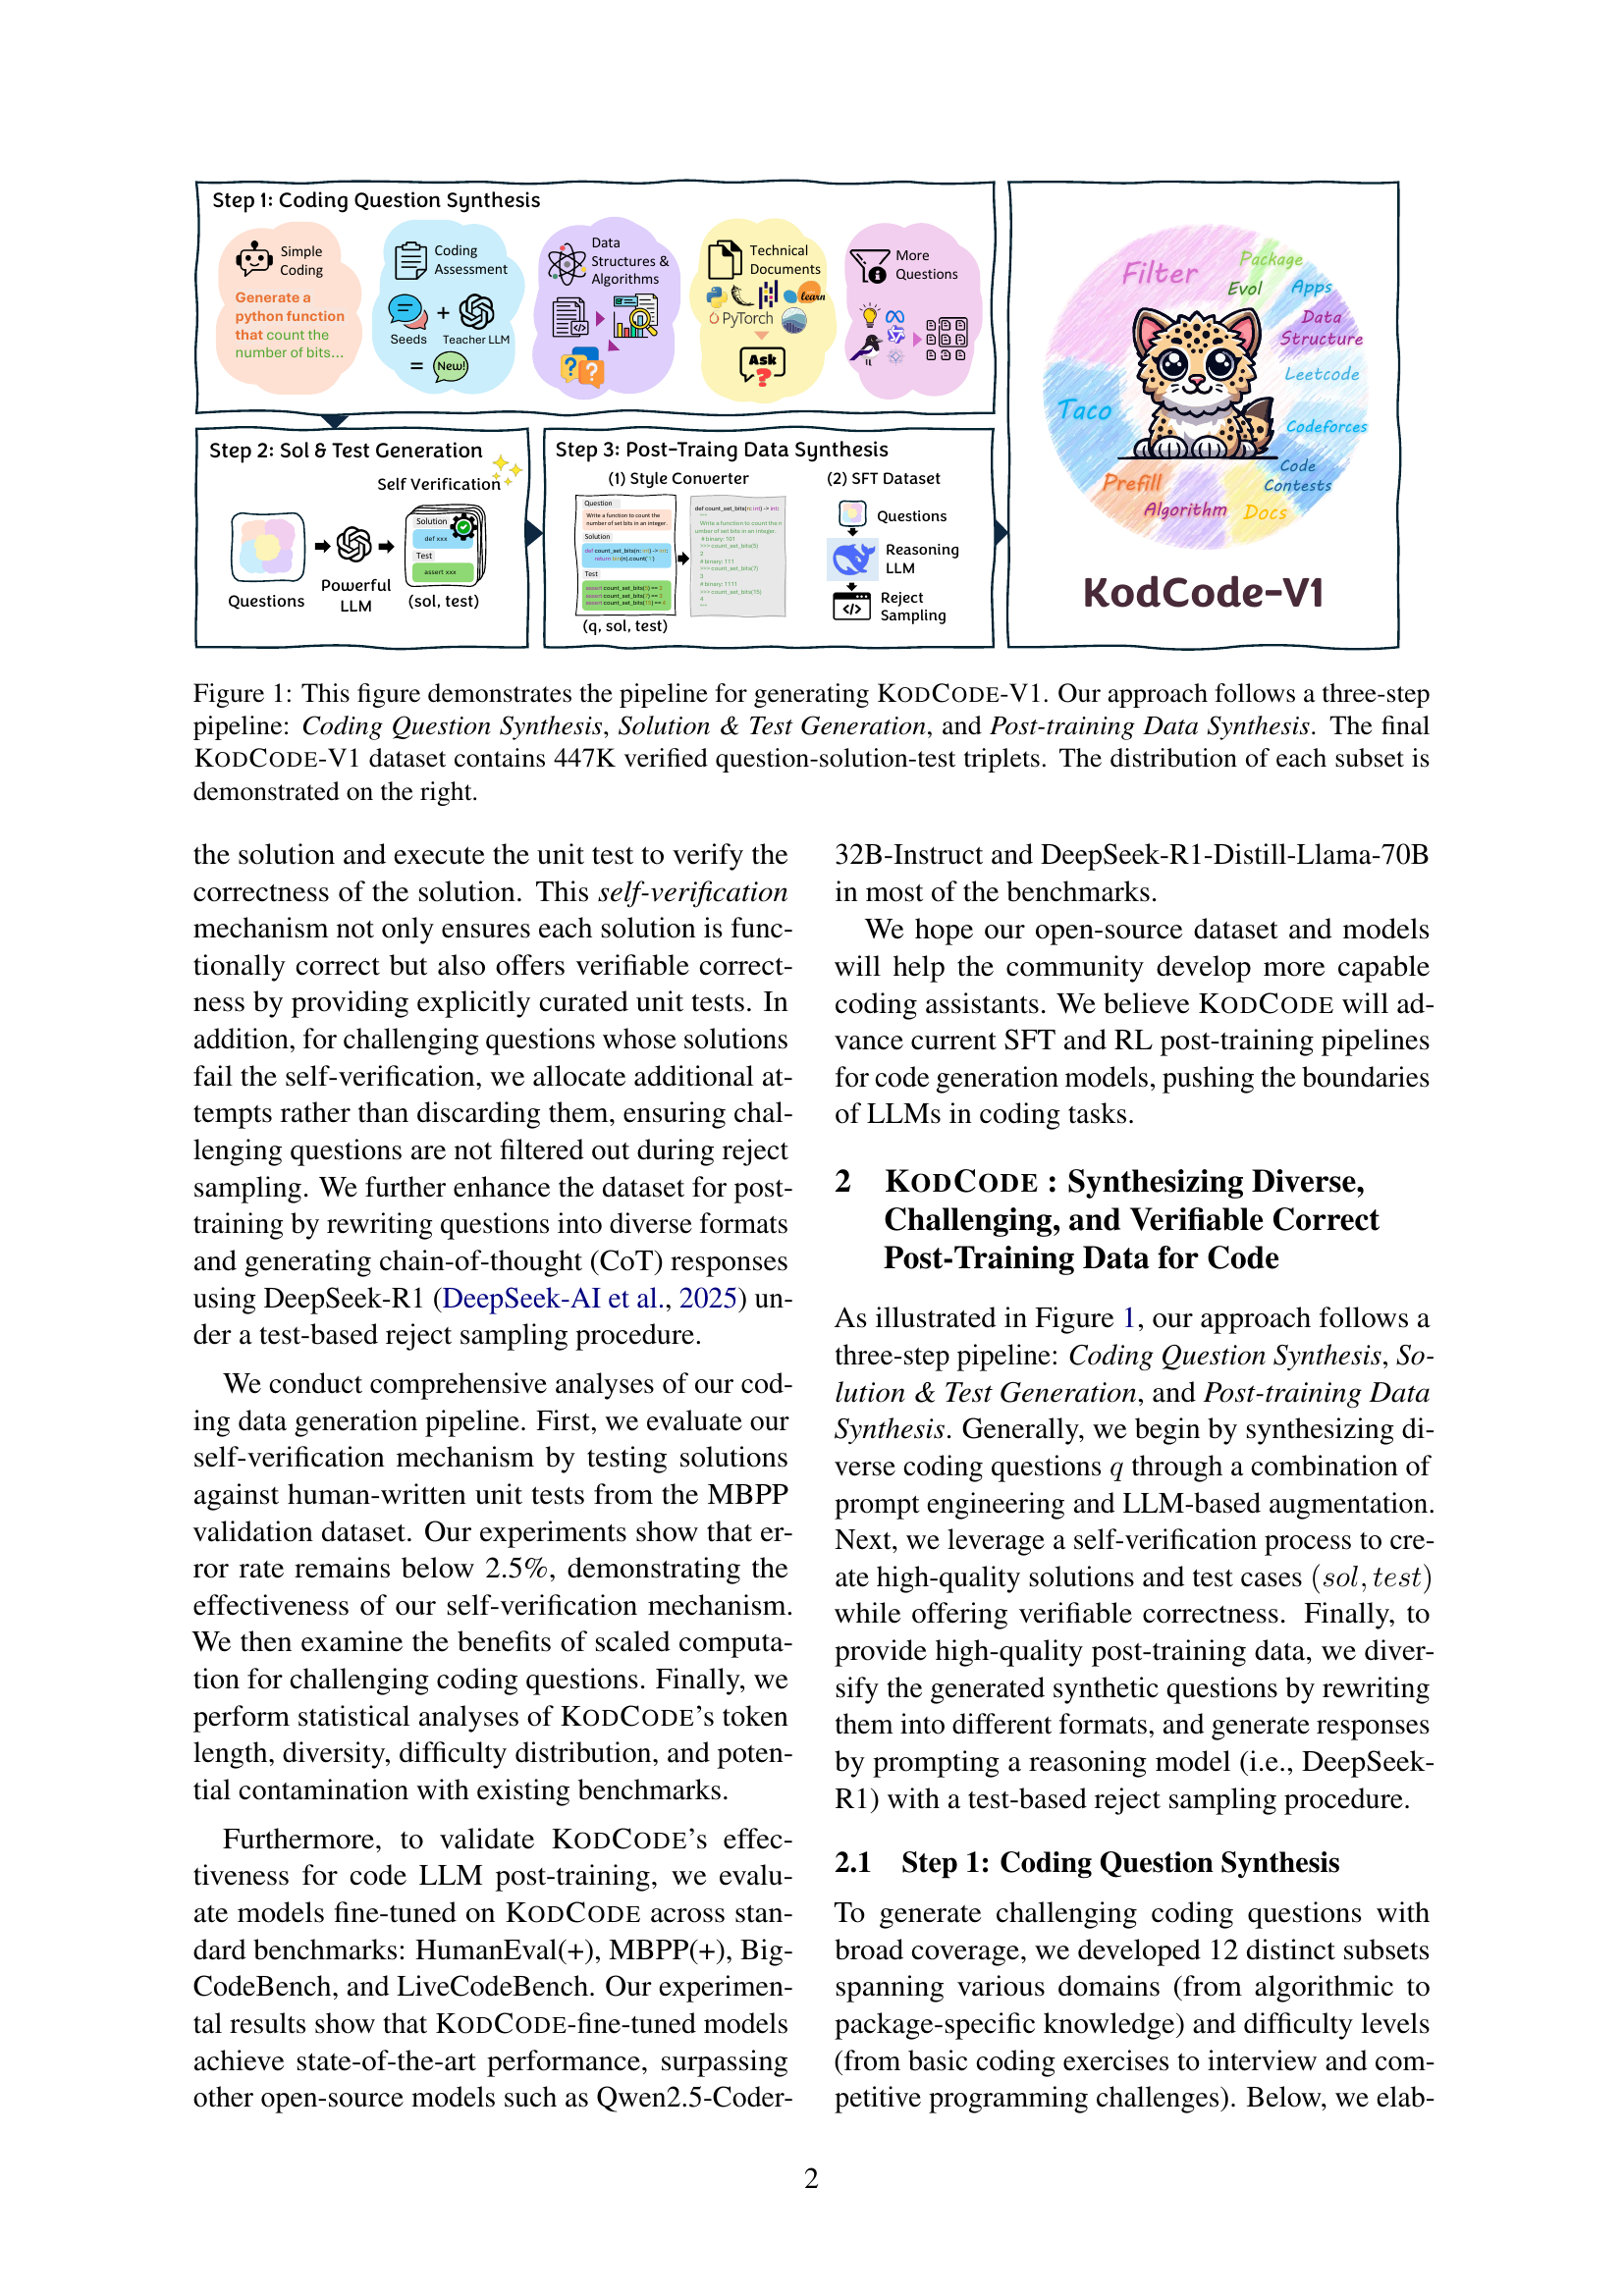
🔼 This table compares KodCode to other code datasets used for training Large Language Models (LLMs). It highlights key differences in terms of data source (human-curated vs. synthetic), the number of problems available, diversity of coding tasks, difficulty levels of the problems, and whether the dataset includes unit tests for verifying solution correctness. KodCode is shown to stand out by offering a large-scale, synthetically generated dataset with a built-in self-verification mechanism and three distinct difficulty levels, addressing limitations found in existing datasets.
read the caption
Table 1: Comparison of KodCode with existing code datasets for LLM post-training. The first three rows show human-curated datasets, while the remaining rows represent synthetic datasets. KodCode offers three difficulty labels (e.g., “easy”, “medium”, and “hard”), which we denote as “Mix”.
In-depth insights#
Code Data Synthesis#
Code data synthesis is an essential strategy for augmenting training datasets, particularly in scenarios where high-quality data is scarce. Synthetic data offers a scalable and cost-effective way to improve the performance of models. Techniques like prompt engineering and LLM-based augmentation are leveraged for data generation. Moreover, diverse data distribution and complexity, along with reliable response verification, is vital in order to successfully fine-tune data.
Self-Verifying LLM#
Self-verifying LLMs represent a crucial shift towards more reliable AI. These models aim to intrinsically assess the correctness of their outputs, rather than relying solely on external validation. This is particularly important in applications where mistakes can be costly. Approaches range from incorporating confidence scores to generating justifications that support the final answer. A key challenge is preventing overconfidence, where the model inaccurately assigns high certainty to incorrect outputs. Furthermore, effectively utilizing self-verification to guide iterative refinement and error correction is a complex research area. Success in this domain could significantly improve the trustworthiness and deployment of LLMs in sensitive real-world scenarios. This approach could allow for AI to more accurately flag its errors, increasing safety.
Dataset Diversity#
Dataset diversity is crucial for training robust and generalizable coding LLMs. A diverse dataset should span a wide range of programming languages, coding tasks, and difficulty levels. Including examples from various domains, such as web development, data science, and system administration, can help the model learn different coding styles and patterns. It is crucial to address different skill level, from beginner-level to expert-level problems, to ensure the model can assist users with varying coding needs and also covering various aspect of coding and reasoning is extremely important. LLMs trained on diverse datasets tend to perform better on unseen tasks and generalize well across different coding scenarios. Diversity should also encompass a range of code complexities, from short snippets to complex projects, to train the model’s ability to handling coding tasks of varying scales.
Style Transfer SFT#
The concept of “Style Transfer SFT”, though not explicitly mentioned in the paper, evokes the crucial task of adapting models to diverse input formats. Style transfer in this context involves transforming coding questions into various representations without altering the underlying logic. The success of KODCODE in fine-tuning models hinges on its LLM-based style conversion, making the model robust to different question phrasing and presentation styles. This helps bridge the gap between training datasets and the real world by enabling the model to generalize across variable input styles. By reformatting coding questions into more natural and non-natural language formats, the effectiveness in improving the model performance can be demonstrated and shows greater flexibility. Style transfer improves versatility for SFT.
Scale for Hardness#
While not explicitly a header, the concept of ‘Scale for Hardness’ is implicitly addressed within the paper’s methodology. The paper details a process of allocating additional attempts at self-verification for more challenging coding questions. This mechanism effectively scales the computational resources dedicated to problems based on their inherent difficulty. This is critical as simply discarding problems that initially fail self-verification risks biasing the dataset towards simpler tasks. By allowing more attempts, the pipeline retains a broader range of difficulties, thus contributing to a more robust and challenging training dataset. The observed pass rate improvements with increased attempts, particularly for tasks from Codeforces, Taco, and Docs, confirms that scaling efforts enhance the inclusion of harder, algorithmically complex problems. This ensures that the dataset isn’t skewed towards easier, more readily solvable questions, which ultimately contributes to the ability of models trained on it to tackle a more diverse and complex range of coding challenges.
More visual insights#
More on figures

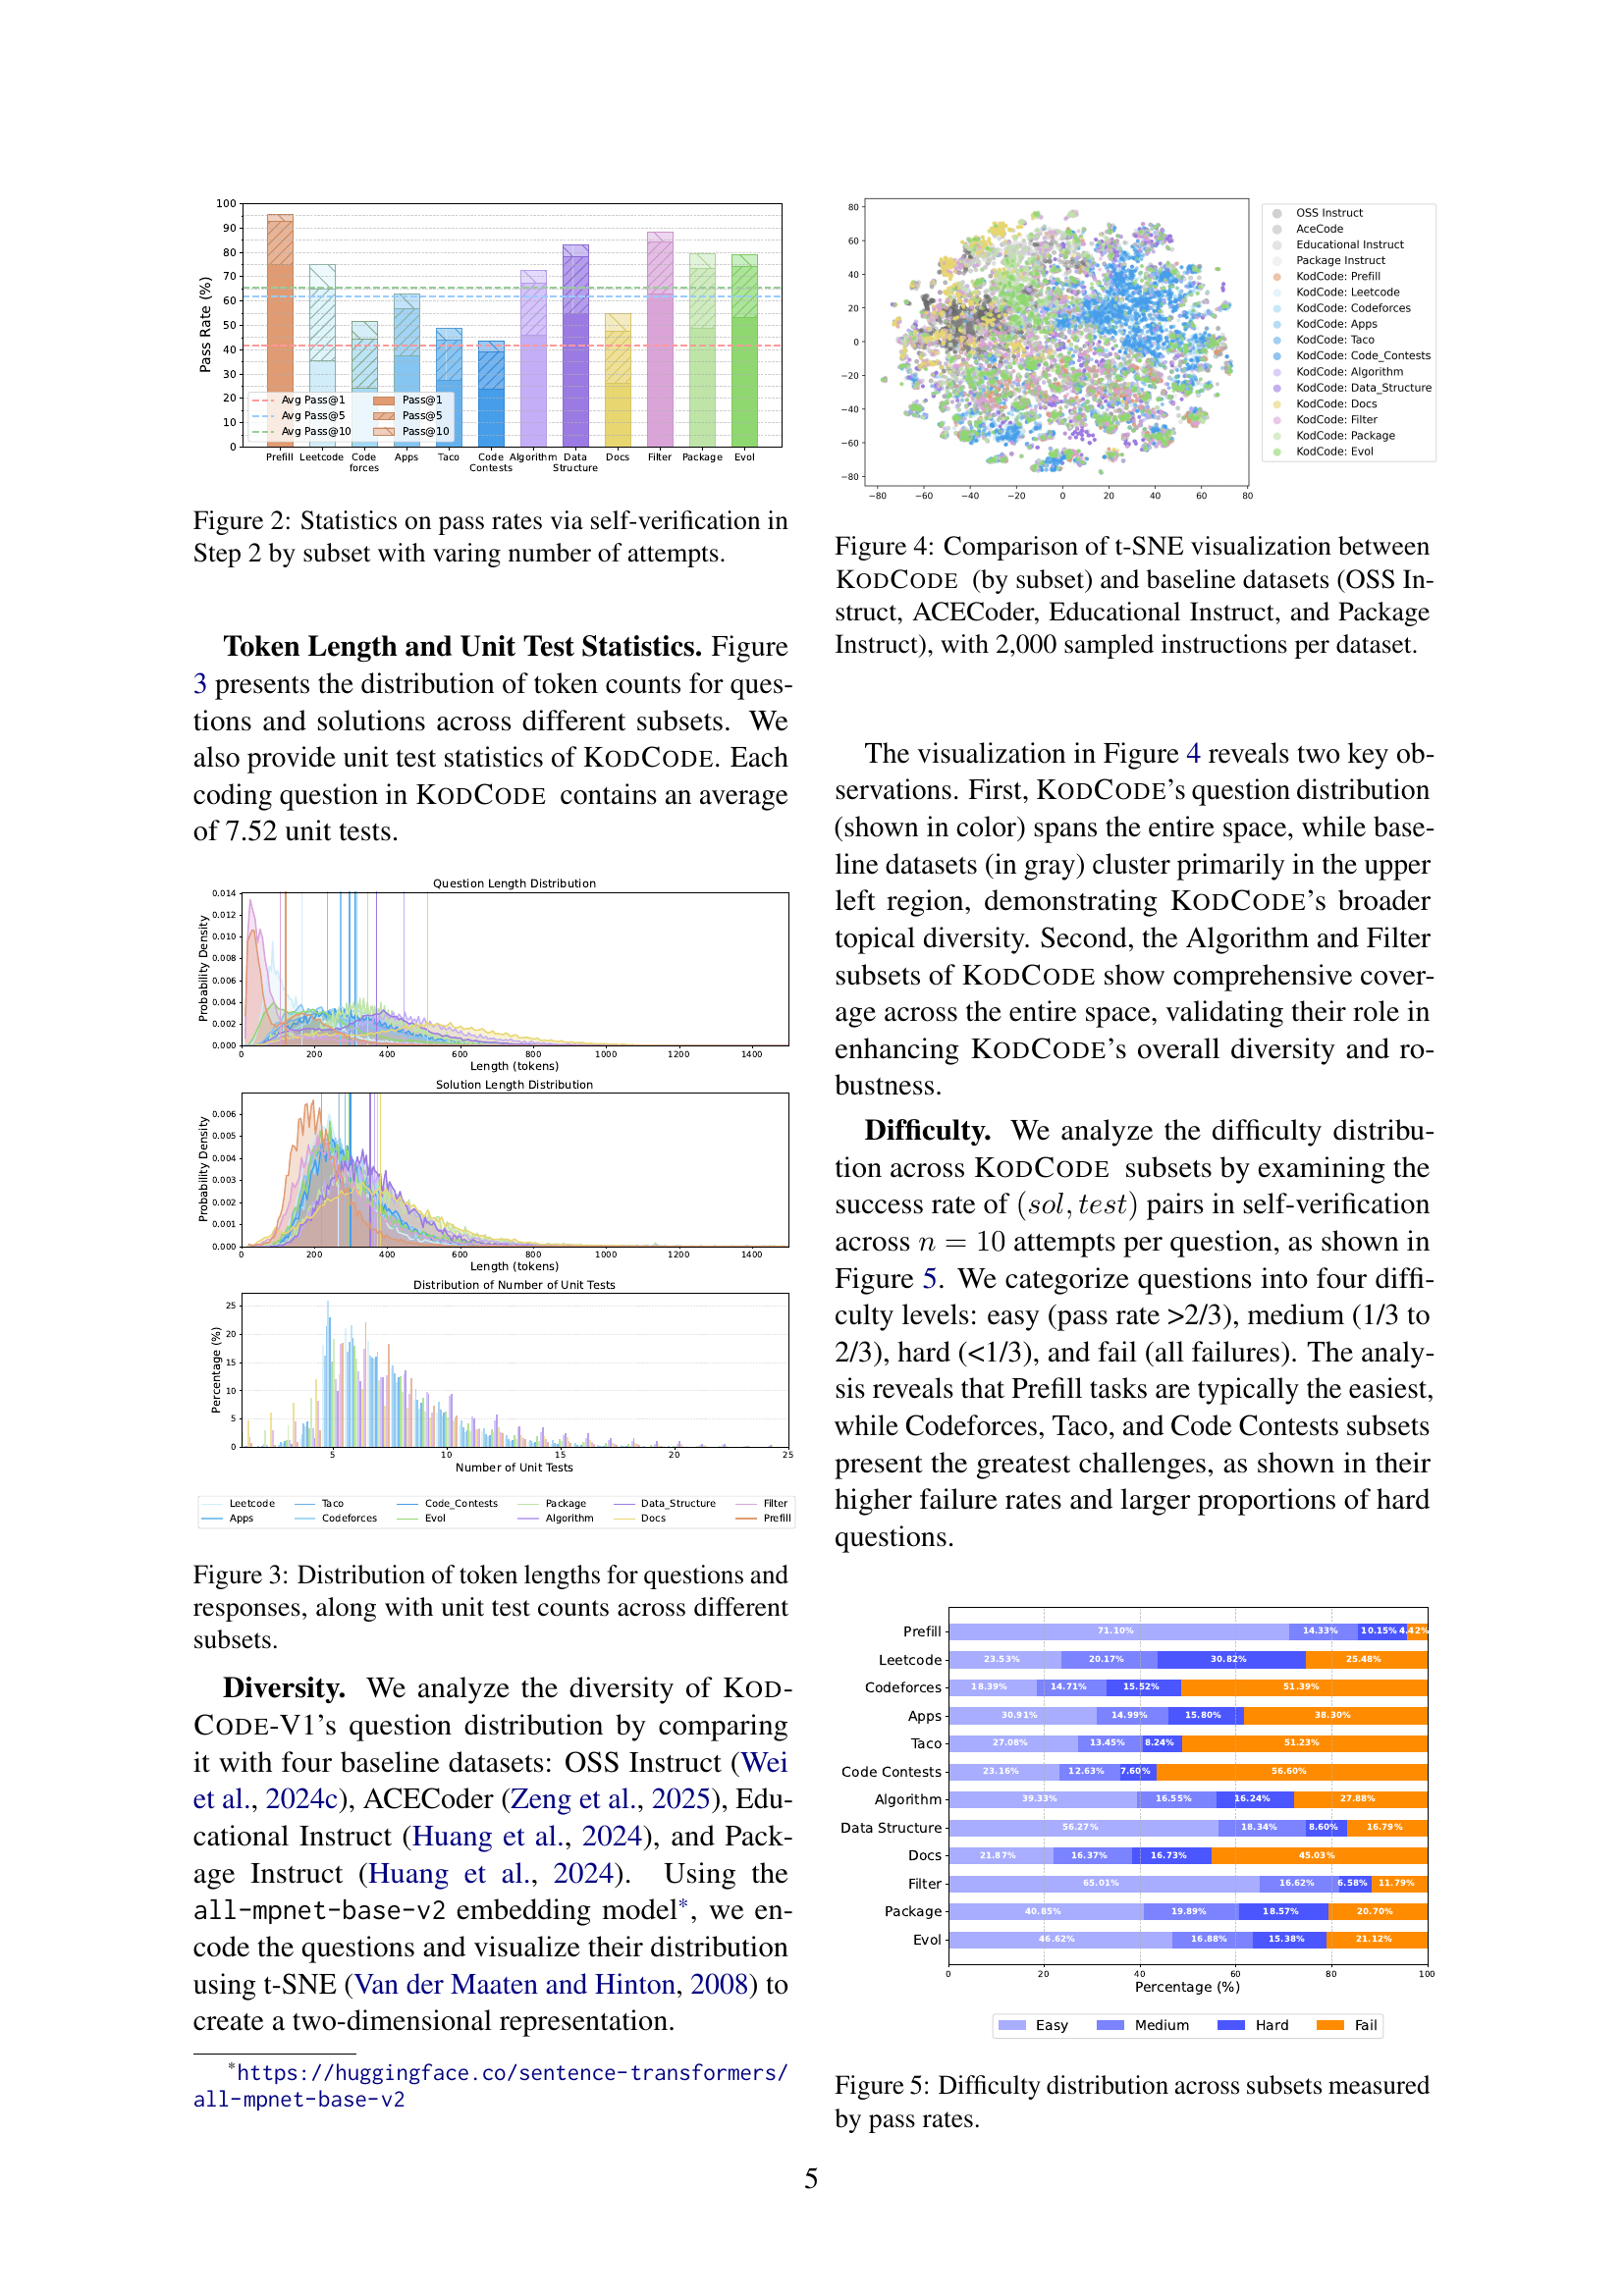
🔼 This figure visualizes the success rate of the self-verification process in Step 2 of the KODCODE dataset generation pipeline. It displays the pass rate for each subset of coding questions (Prefill, LeetCode, Codeforces, etc.) with varying numbers of self-verification attempts (1, 5, and 10). Higher pass rates indicate that the questions in that subset were generally easier to solve and verify, while lower pass rates may reflect increased difficulty. The graph allows assessment of the effectiveness of increasing verification attempts in generating verifiable solutions, showing how many more successful solutions are produced with more attempts.
read the caption
Figure 2: Statistics on pass rates via self-verification in Step 2 by subset with varing number of attempts.

🔼 This figure presents three distinct histograms visualizing the distribution of token lengths for questions and their corresponding responses across various subsets of the KODCODE dataset. A supplementary bar chart displays the average number of unit tests associated with each question in these subsets. This allows for a comparative analysis of the textual length characteristics of questions and answers, and the associated test suite complexity across different question categories within the dataset. This analysis helps to understand the diversity and challenge level within the dataset.
read the caption
Figure 3: Distribution of token lengths for questions and responses, along with unit test counts across different subsets.

🔼 This figure uses t-distributed Stochastic Neighbor Embedding (t-SNE) to visualize the high-dimensional vector representations of coding instructions from KODCODE and four other datasets: OSS Instruct, ACECoder, Educational Instruct, and Package Instruct. Each point represents a coding instruction, and the proximity of points indicates semantic similarity. The visualization reveals KODCODE’s superior diversity compared to the baseline datasets, as its instructions span a wider range of the embedding space. This indicates that KODCODE covers a broader range of coding topics and styles than the other datasets.
read the caption
Figure 4: Comparison of t-SNE visualization between KodCode (by subset) and baseline datasets (OSS Instruct, ACECoder, Educational Instruct, and Package Instruct), with 2,000 sampled instructions per dataset.
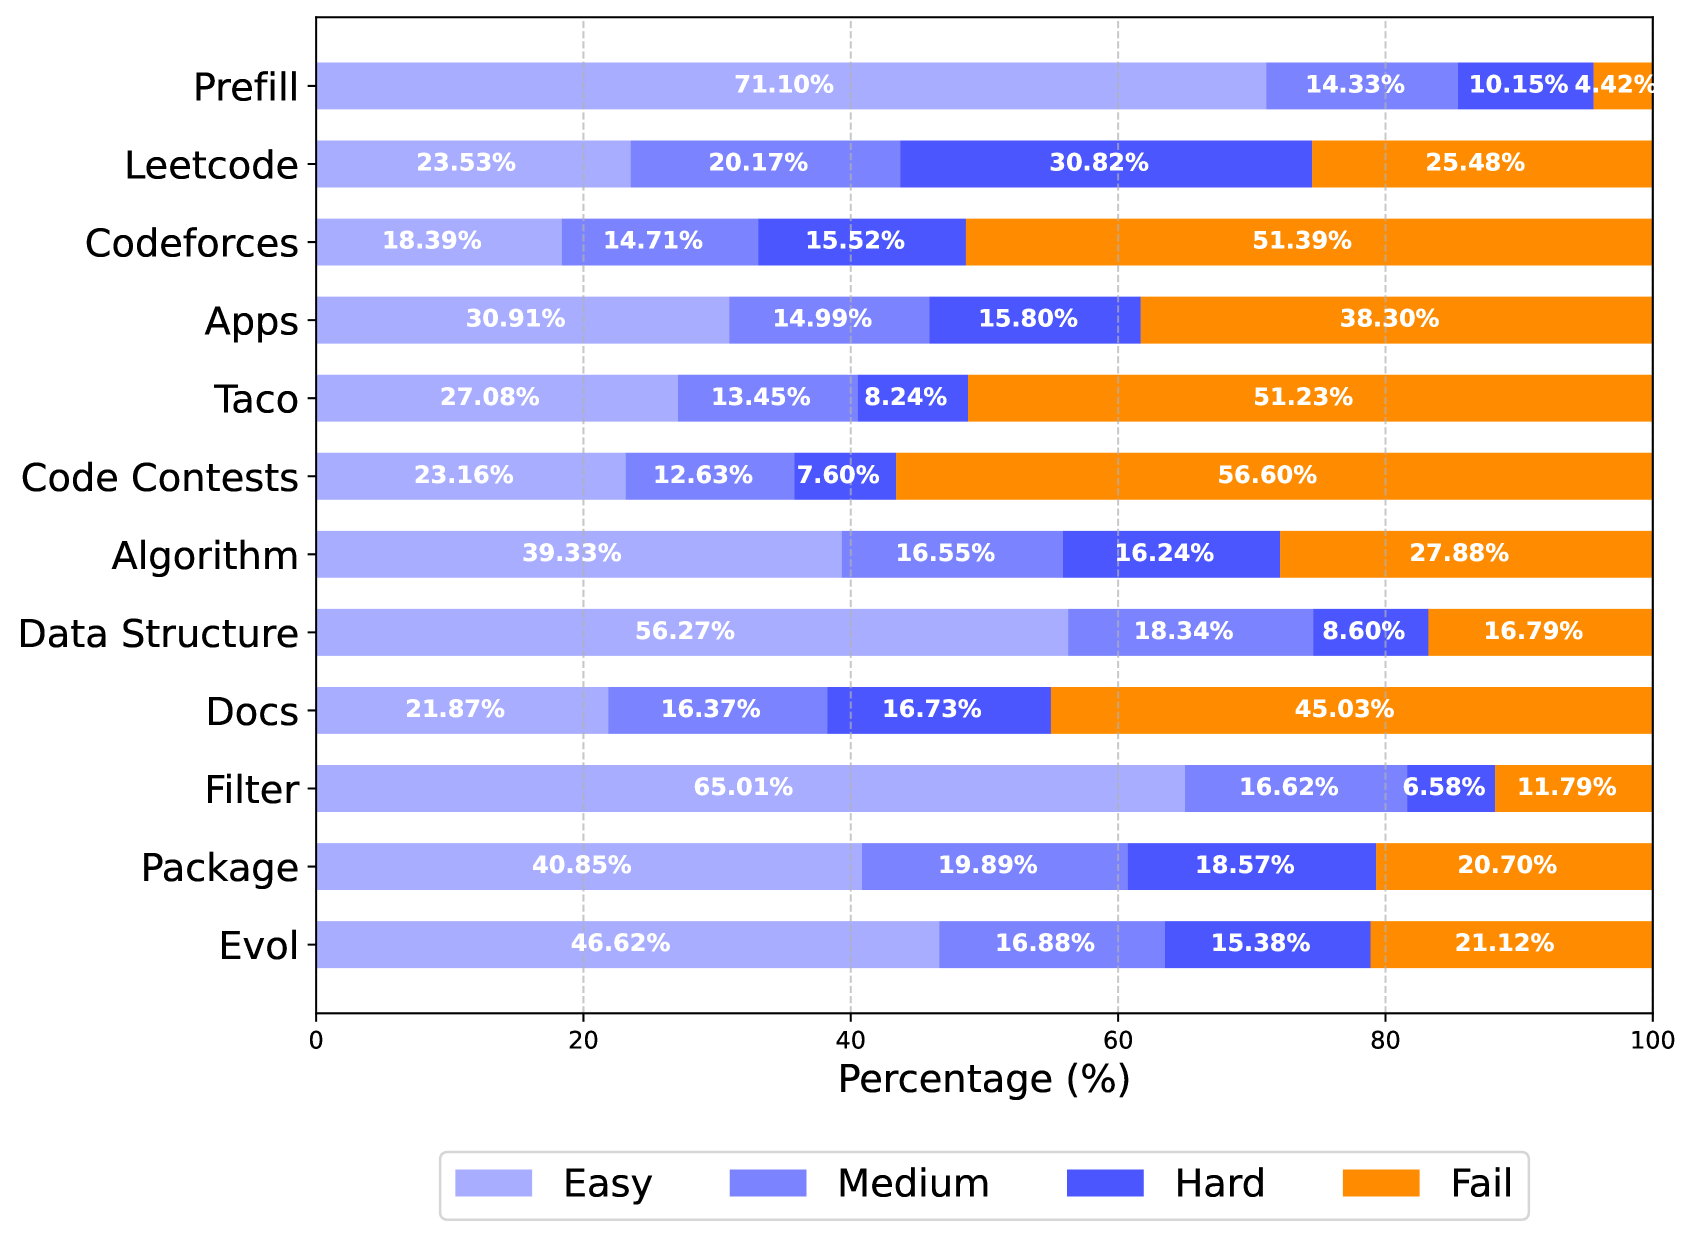
🔼 This figure shows the distribution of question difficulty across different subsets of the KODCODE dataset. The difficulty is measured by the pass rate of the self-verification process for each question, using the number of successful attempts out of a maximum of 10. The subsets are categorized into four difficulty levels: easy (pass rate > 2/3), medium (1/3 to 2/3), hard (<1/3), and fail (all failures). The chart displays the percentage of questions in each difficulty level for every subset, providing a visual representation of the distribution of question difficulty in the dataset.
read the caption
Figure 5: Difficulty distribution across subsets measured by pass rates.

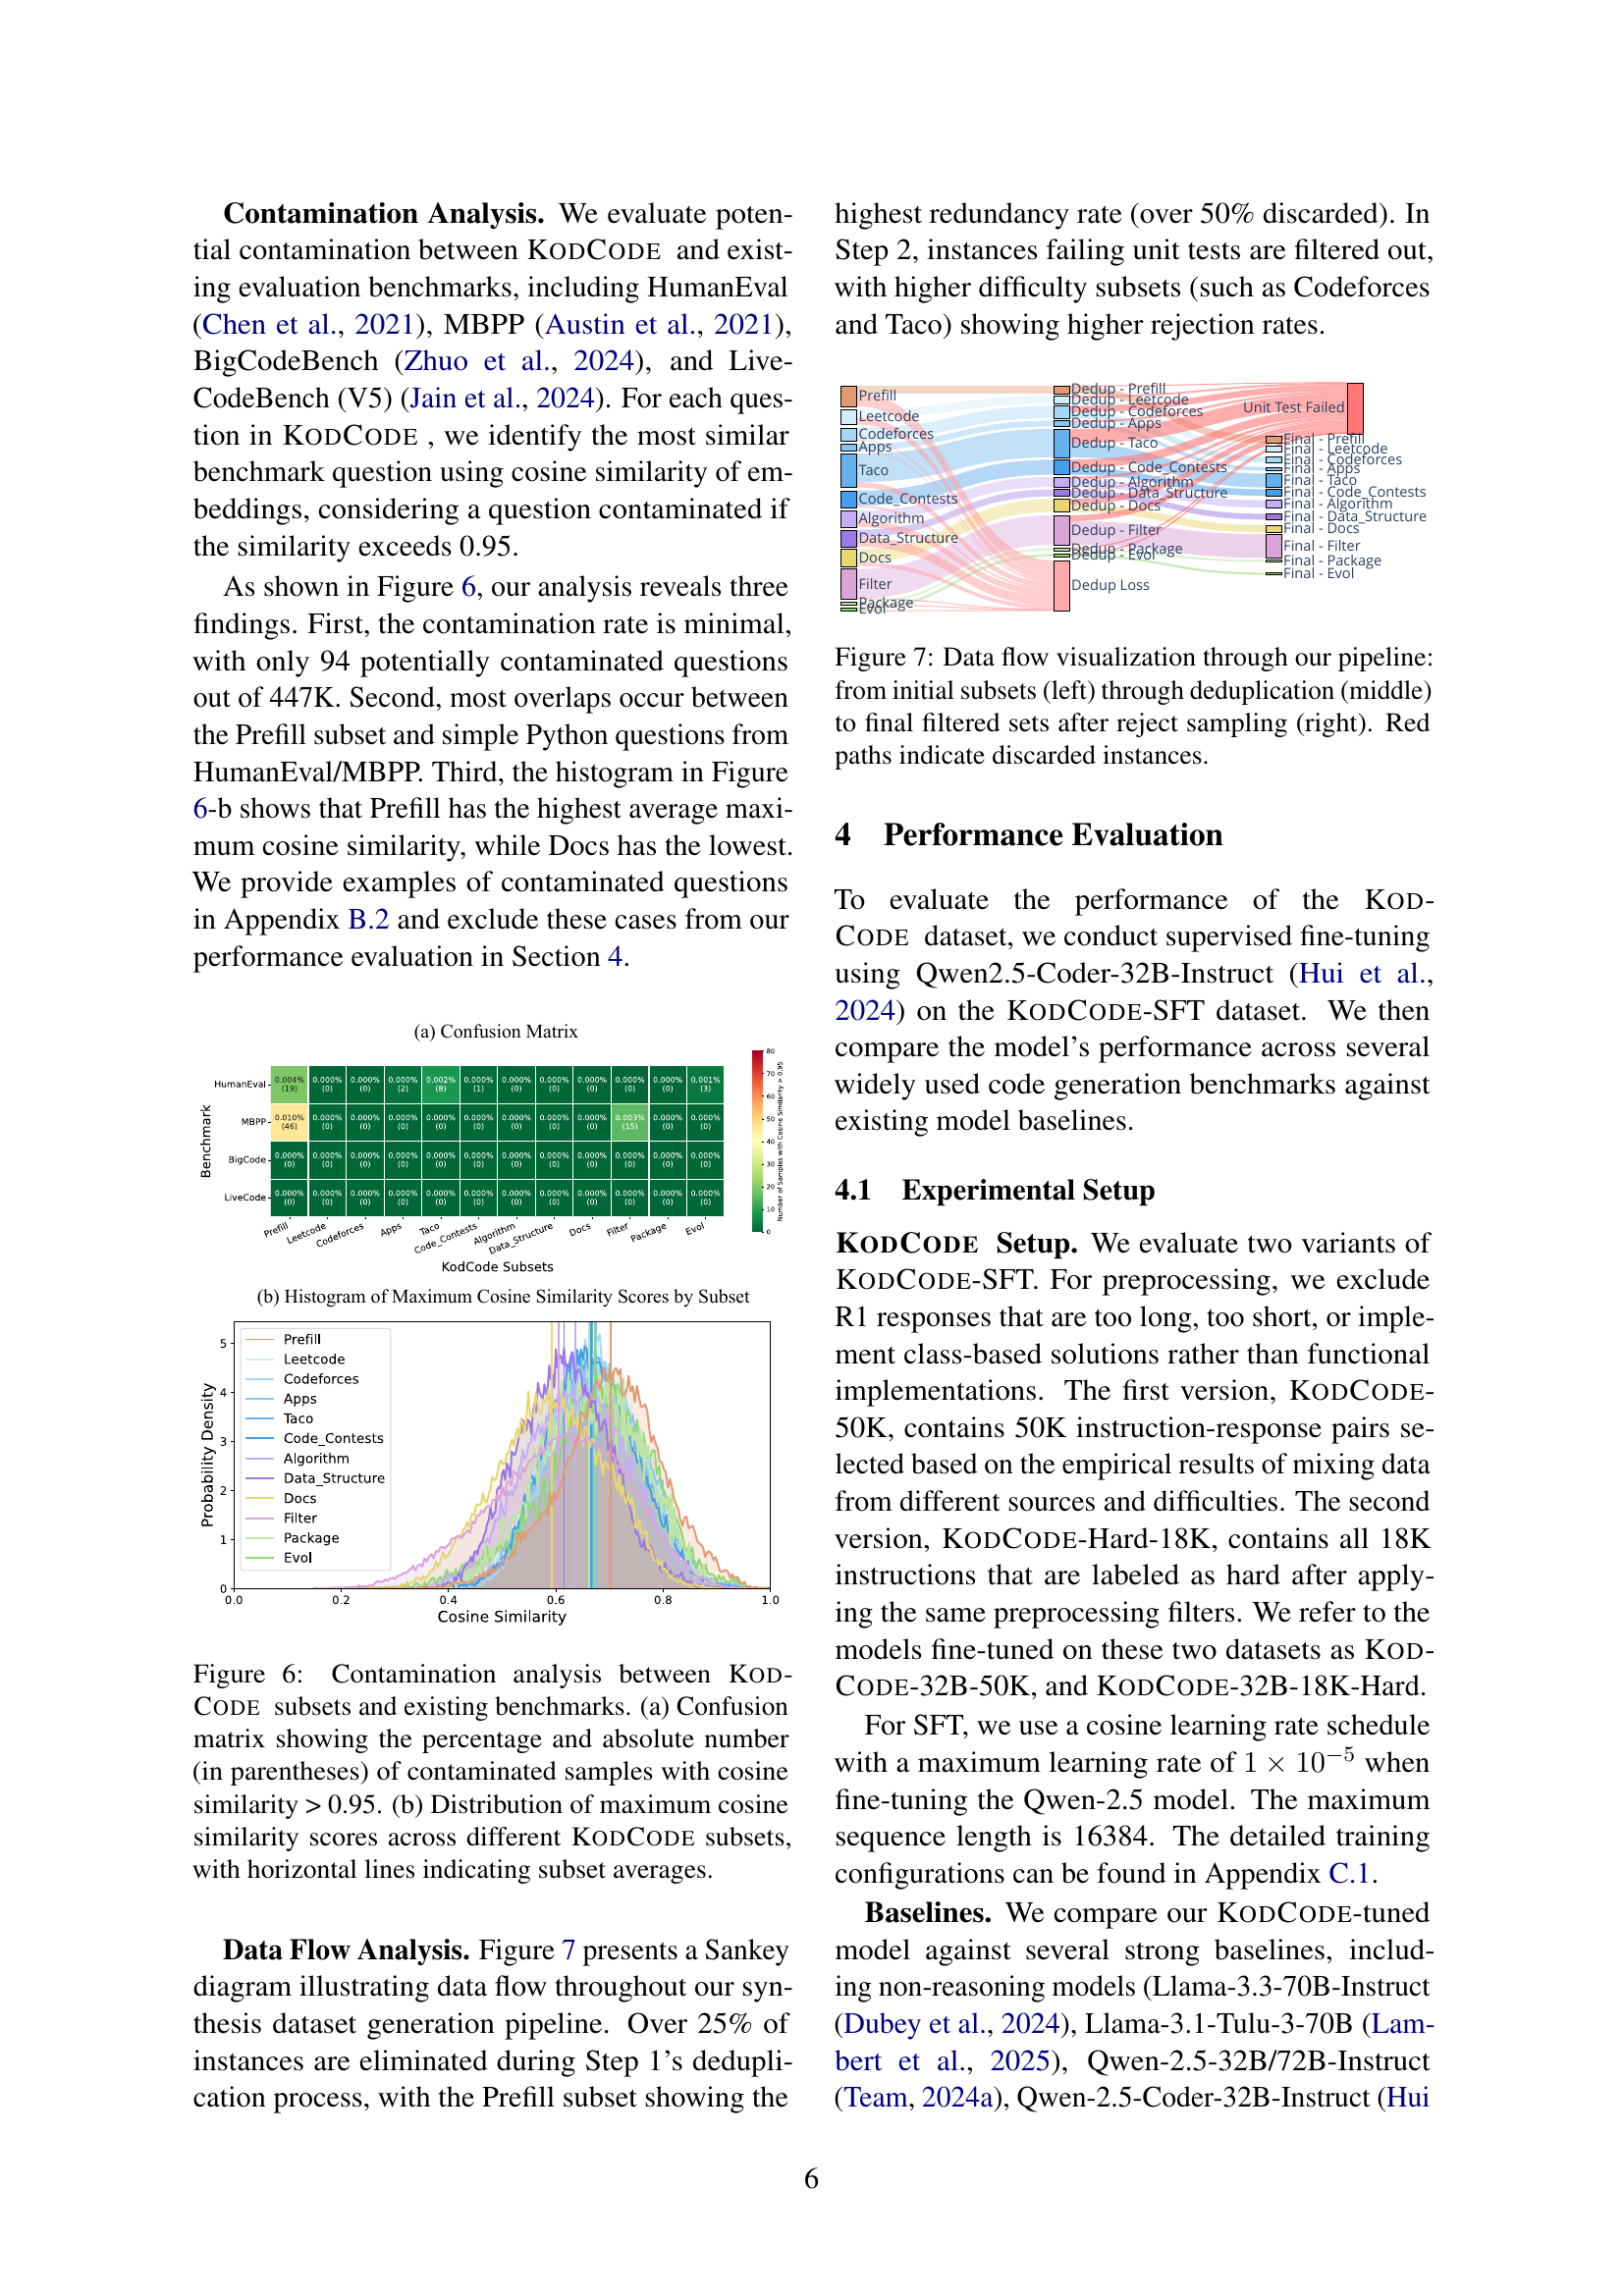
🔼 Figure 6 presents a detailed analysis of potential overlaps between the KODCODE dataset and existing code benchmarks. Part (a) is a confusion matrix that visually represents the number of KODCODE samples exhibiting high similarity (cosine similarity > 0.95) to each benchmark. The percentages and raw counts are provided within the matrix cells, illustrating the extent of potential contamination for each KODCODE subset. Part (b) provides a supplementary histogram showing the distribution of maximum cosine similarity scores within each KODCODE subset. Horizontal lines on the histogram highlight the average maximum similarity for each subset, offering a clearer picture of the overall similarity levels.
read the caption
Figure 6: Contamination analysis between KodCode subsets and existing benchmarks. (a) Confusion matrix showing the percentage and absolute number (in parentheses) of contaminated samples with cosine similarity > 0.95. (b) Distribution of maximum cosine similarity scores across different KodCode subsets, with horizontal lines indicating subset averages.

🔼 This figure illustrates the data flow within the KODCODE dataset creation pipeline. Starting from twelve initial subsets of coding questions (left), the pipeline proceeds through a deduplication step to remove redundant questions (middle). The remaining questions then undergo a reject sampling process where solutions and tests are generated, and those that fail verification are removed (right). The red paths highlight questions removed during the deduplication and reject sampling phases. The final dataset is considerably smaller than the initial number of coding questions indicating the effectiveness of the data cleaning steps.
read the caption
Figure 7: Data flow visualization through our pipeline: from initial subsets (left) through deduplication (middle) to final filtered sets after reject sampling (right). Red paths indicate discarded instances.

🔼 This figure shows a pie chart illustrating the distribution of various coding task categories within the Magpie Coding dataset before any filtering was applied. The pie chart visually represents the proportion of questions in each category, providing an overview of the dataset’s initial composition before any refinement or selection processes were implemented. This helps illustrate the diversity of tasks addressed in the original Magpie data and the impact that subsequent filtering steps had on the final dataset composition.
read the caption
Figure 8: Task categories of the collected Magpie Coding data before filtering.

🔼 This figure shows a coding task (Task 511) from the MBPP dataset that failed the self-verification process during the KODCODE dataset generation. The task requires writing a Python function to find the minimum sum of factors for a given number. The figure displays the GPT-40 generated response (incorrect), the correct solution, and the associated unit tests.
read the caption
Figure 9: Failed Task 511.

🔼 This figure shows a failed example from the MBPP validation dataset (Task 525). The task is to write a Python function to determine if two lines are parallel. The function should accept two lines represented as tuples, handling both two-element (a,b) and three-element (a,b,c) tuples. The GPT-40 response’s solution incorrectly assumes all input lines are represented by three-element tuples (a,b,c), resulting in a failed unit test when only two-element tuples are provided. This highlights a limitation of the GPT-40 model in handling edge cases and generalizing to different input formats.
read the caption
Figure 10: Failed Task 525.

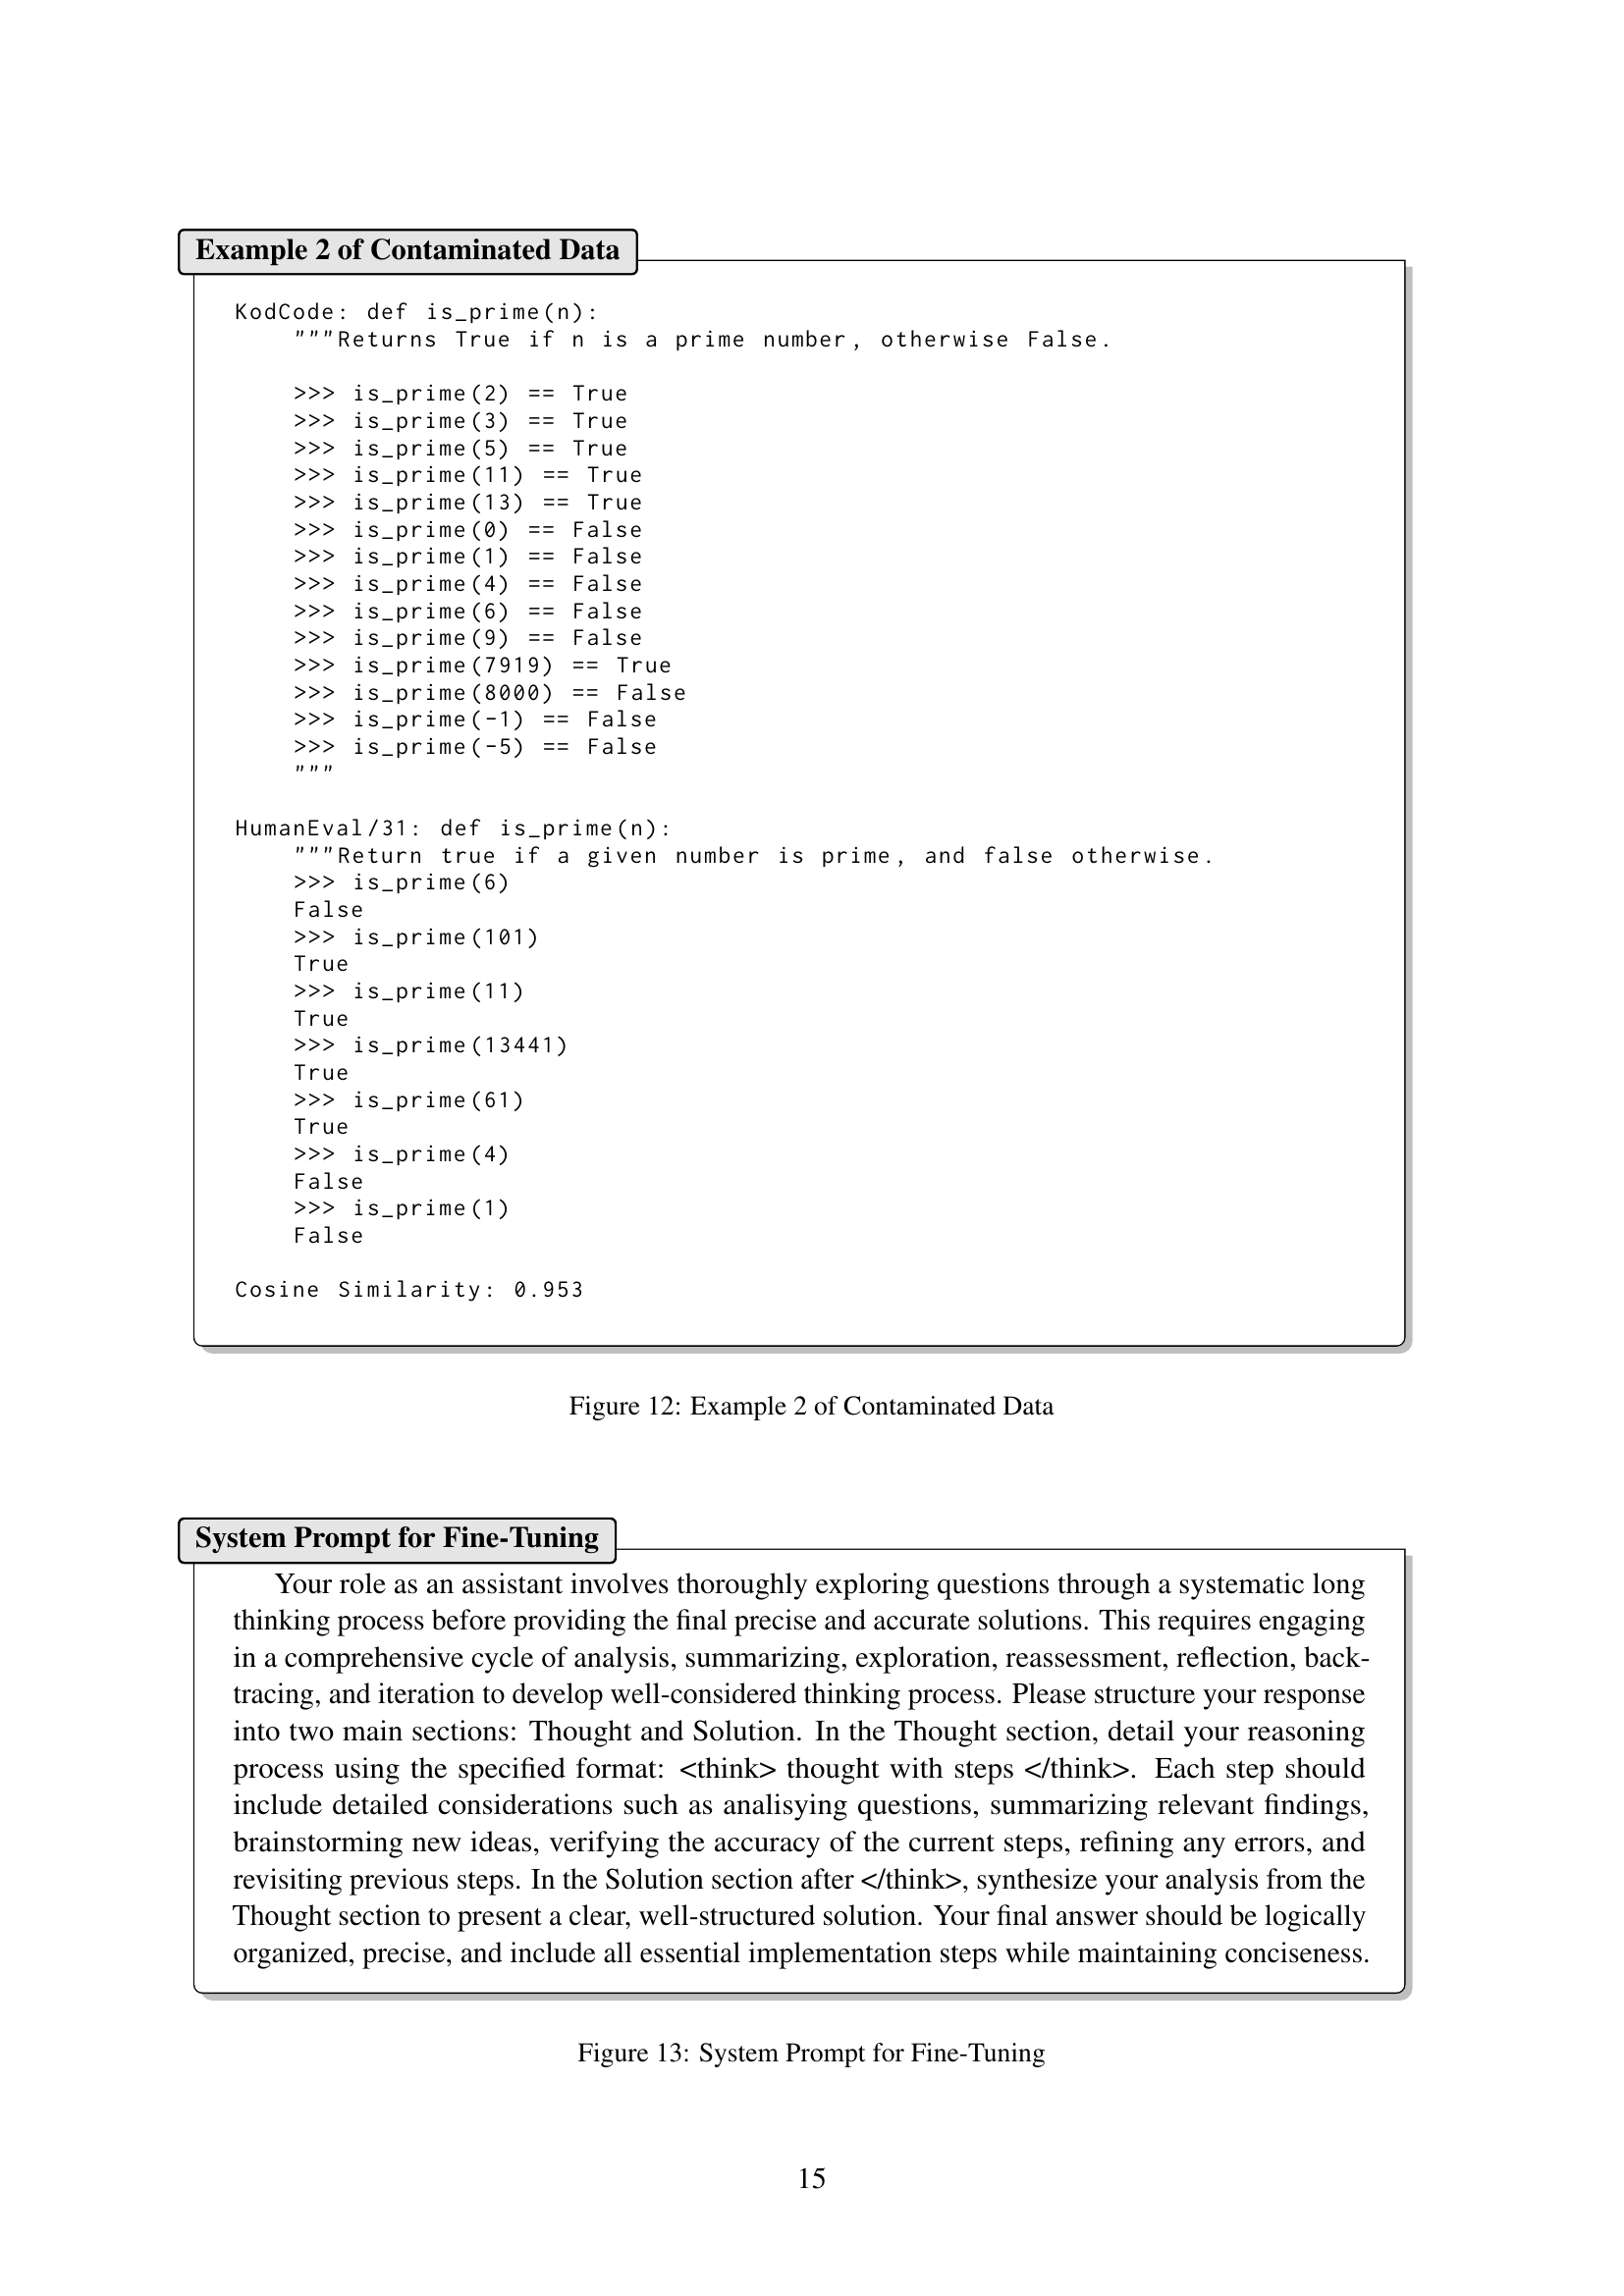
🔼 This figure shows an example of data contamination found in the KODCODE dataset. It highlights a question from KODCODE that is nearly identical to a question from the MBPP benchmark dataset. Specifically, it demonstrates a KODCODE question about counting uppercase letters in a string and its almost exact equivalent from MBPP. This illustrates a potential limitation in the dataset generation process, where some synthetically generated questions closely resemble pre-existing questions from other established benchmarks.
read the caption
Figure 11: Example 1 of Contaminated Data
More on tables
| Model Name | HumanEval | MBPP | BigCodeBench-C | BigCodeBench-I | LiveCodeBench (v5) | Average | |||||||
| Base | Plus | Base | Plus | Full | Hard | Full | Hard | Easy | Medium | Hard | |||
| Non-Reasoning Models | Llama-3.1-Tulu-3-70B | 83.5 | 78.0 | 75.9 | 65.9 | 55.0 | 25.0 | 43.4 | 20.9 | 61.7 | 15.4 | 3.7 | 50.15 |
| Llama-3.3-70B-Instruct | 82.9 | 77.4 | 87.3 | 73.0 | 57.9 | 29.1 | 47.0 | 26.4 | 81.4 | 21.1 | 8.5 | 55.5 | |
| Qwen2.5-32B-Instruct | 89.6 | 79.9 | 87.8 | 73.8 | 53.2 | 26.4 | 45.4 | 22.3 | 80.3 | 35.9 | 8.5 | 56.27 | |
| Qwen2.5-72B-Instruct | 87.8 | 81.1 | 90.2 | 76.2 | 57.5 | 33.1 | 46.1 | 21.6 | 69.9 | 39.9 | 7.0 | 57.15 | |
| Qwen2.5-Coder-32B-Instruct | 90.9 | 85.4 | 90.2 | 77.0 | 57.6 | 31.1 | 49.4 | 25.7 | 80.6 | 39.0 | 8.2 | 59.25 | |
| Reasoning Models | Sky-T1-32B-Preview | 87.8 | 80.5 | 87.3 | 74.1 | 51.0 | 27.0 | 44.2 | 24.3 | 81.4 | 21.1 | 8.5 | 54.9 |
| QwQ-32B-Preview | 87.8 | 82.3 | 84.4 | 69.8 | 53.9 | 26.4 | 38.8 | 23.0 | 90.0 | 51.7 | 10.0 | 56.75 | |
| DeepSeek-R1-Distill-Qwen-32B | 87.8 | 81.1 | 83.9 | 69.3 | 55.1 | 27.7 | 44.1 | 23.0 | 83.9 | 52.9 | 17.8 | 57.51 | |
| DeepSeek-R1-Distill-Llama-70B | 89.0 | 80.5 | 81.7 | 68.8 | 53.5 | 25.7 | 43.9 | 25.7 | 88.5 | 56.2 | 18.9 | 57.79 | |
| Bespoke-Stratos-32B | 88.4 | 83.5 | 88.1 | 75.1 | 56.2 | 33.1 | 47.3 | 27.0 | 86.7 | 49.5 | 10.4 | 59.64 | |
| KodCode | KodCode-32B-50K | 92.7 | 85.4 | 89.9 | 76.2 | 59.8 | 37.8 | 51.1 | 32.4 | 87.8 | 35.9 | 6.7 | 61.22 |
| KodCode-32B-18K-Hard | 90.9 | 86.6 | 89.2 | 77.0 | 59.7 | 37.2 | 50.5 | 31.1 | 90.7 | 39.3 | 5.6 | 61.26 | |
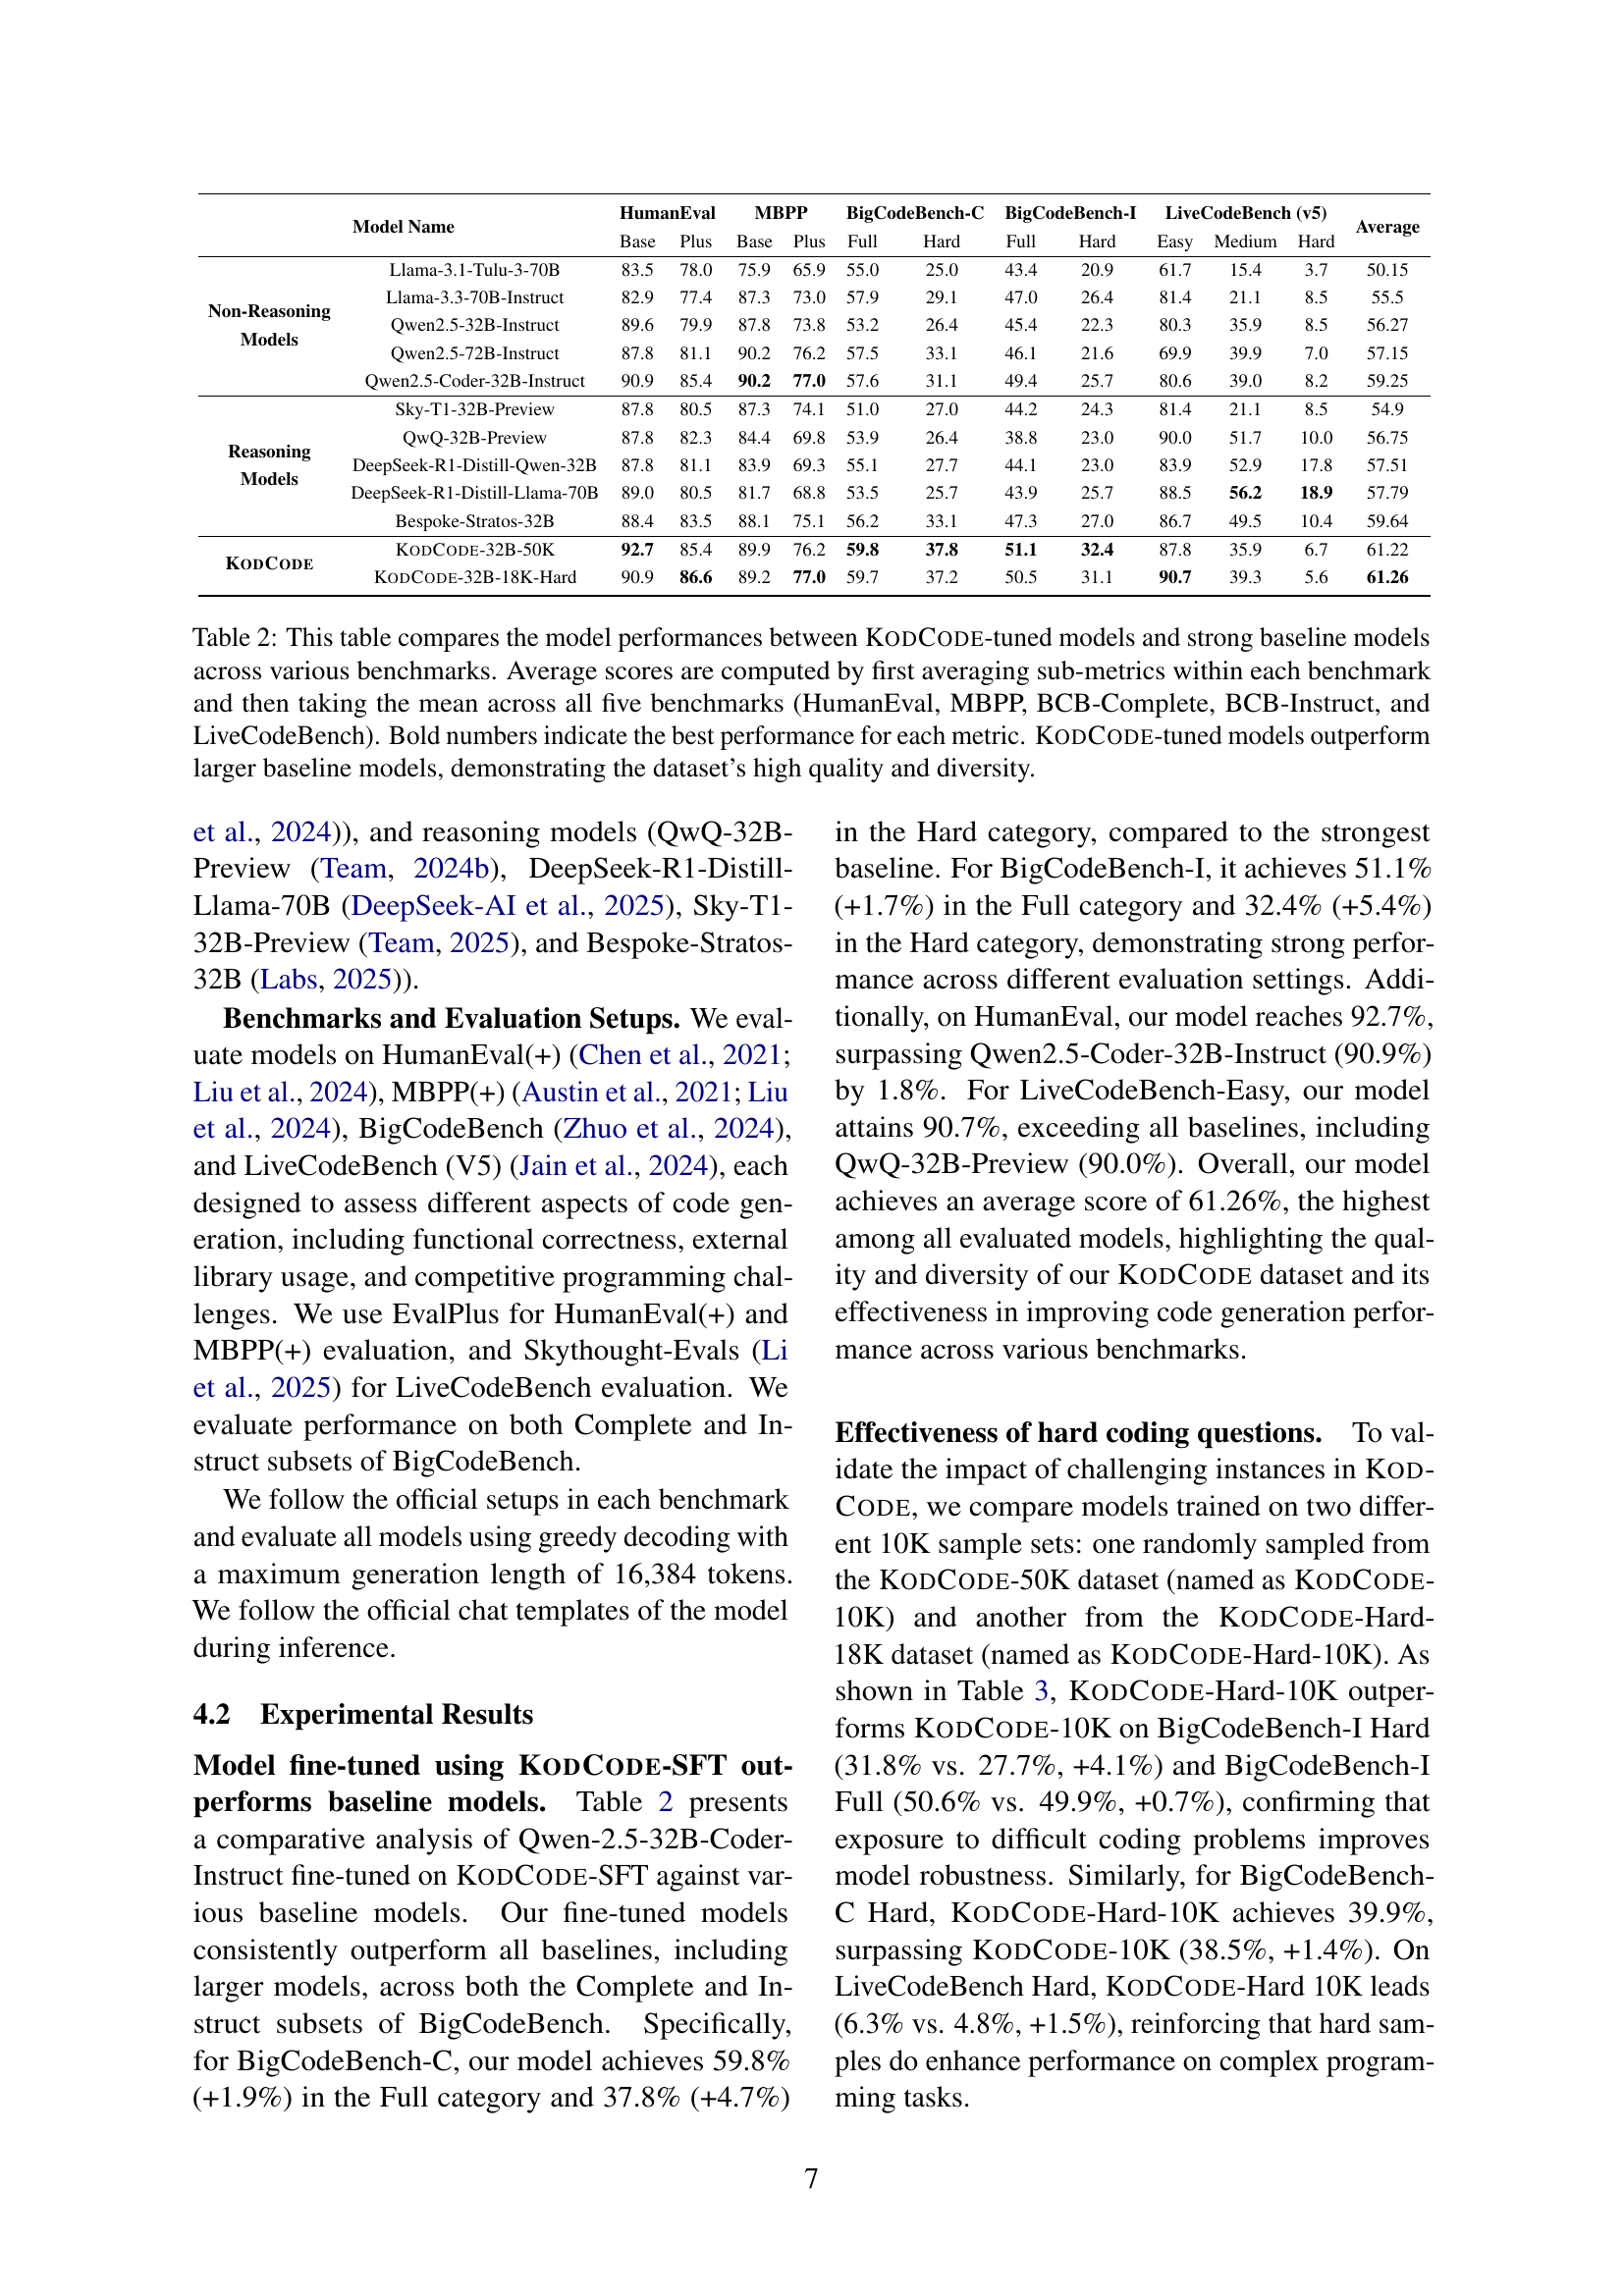
🔼 Table 2 presents a comparison of the performance of various large language models (LLMs) on five different coding benchmarks: HumanEval, MBPP, BigCodeBench-Complete, BigCodeBench-Instruct, and LiveCodeBench. The models compared include several strong baseline LLMs and two models fine-tuned using the KodCode dataset. For each benchmark, sub-metrics were averaged, and then the average across all five benchmarks is reported. Bold values indicate the highest score for each metric. The results demonstrate that LLMs fine-tuned on the KodCode dataset significantly outperform larger baseline models, highlighting KodCode’s high quality and diversity as a training dataset.
read the caption
Table 2: This table compares the model performances between KodCode-tuned models and strong baseline models across various benchmarks. Average scores are computed by first averaging sub-metrics within each benchmark and then taking the mean across all five benchmarks (HumanEval, MBPP, BCB-Complete, BCB-Instruct, and LiveCodeBench). Bold numbers indicate the best performance for each metric. KodCode-tuned models outperform larger baseline models, demonstrating the dataset’s high quality and diversity.
| Benchmarks | KodCode Hard-10K | KodCode -10K | KodCode NoConvert-10K |
| BigCodeBench-C Full (%) | 60.4 | 61.1 | 60.3 |
| BigCodeBench-C Hard (%) | 39.9 | 38.5 | 35.1 |
| BigCodeBench-I Full (%) | 50.6 | 49.9 | 49.6 |
| BigCodeBench-I Hard (%) | 31.8 | 27.7 | 28.4 |
| LiveCodeBench Easy | 87.8 | 87.8 | 86.4 |
| LiveCodeBench Medium | 35.3 | 32.6 | 32.6 |
| LiveCodeBench Hard | 6.3 | 4.8 | 5.6 |
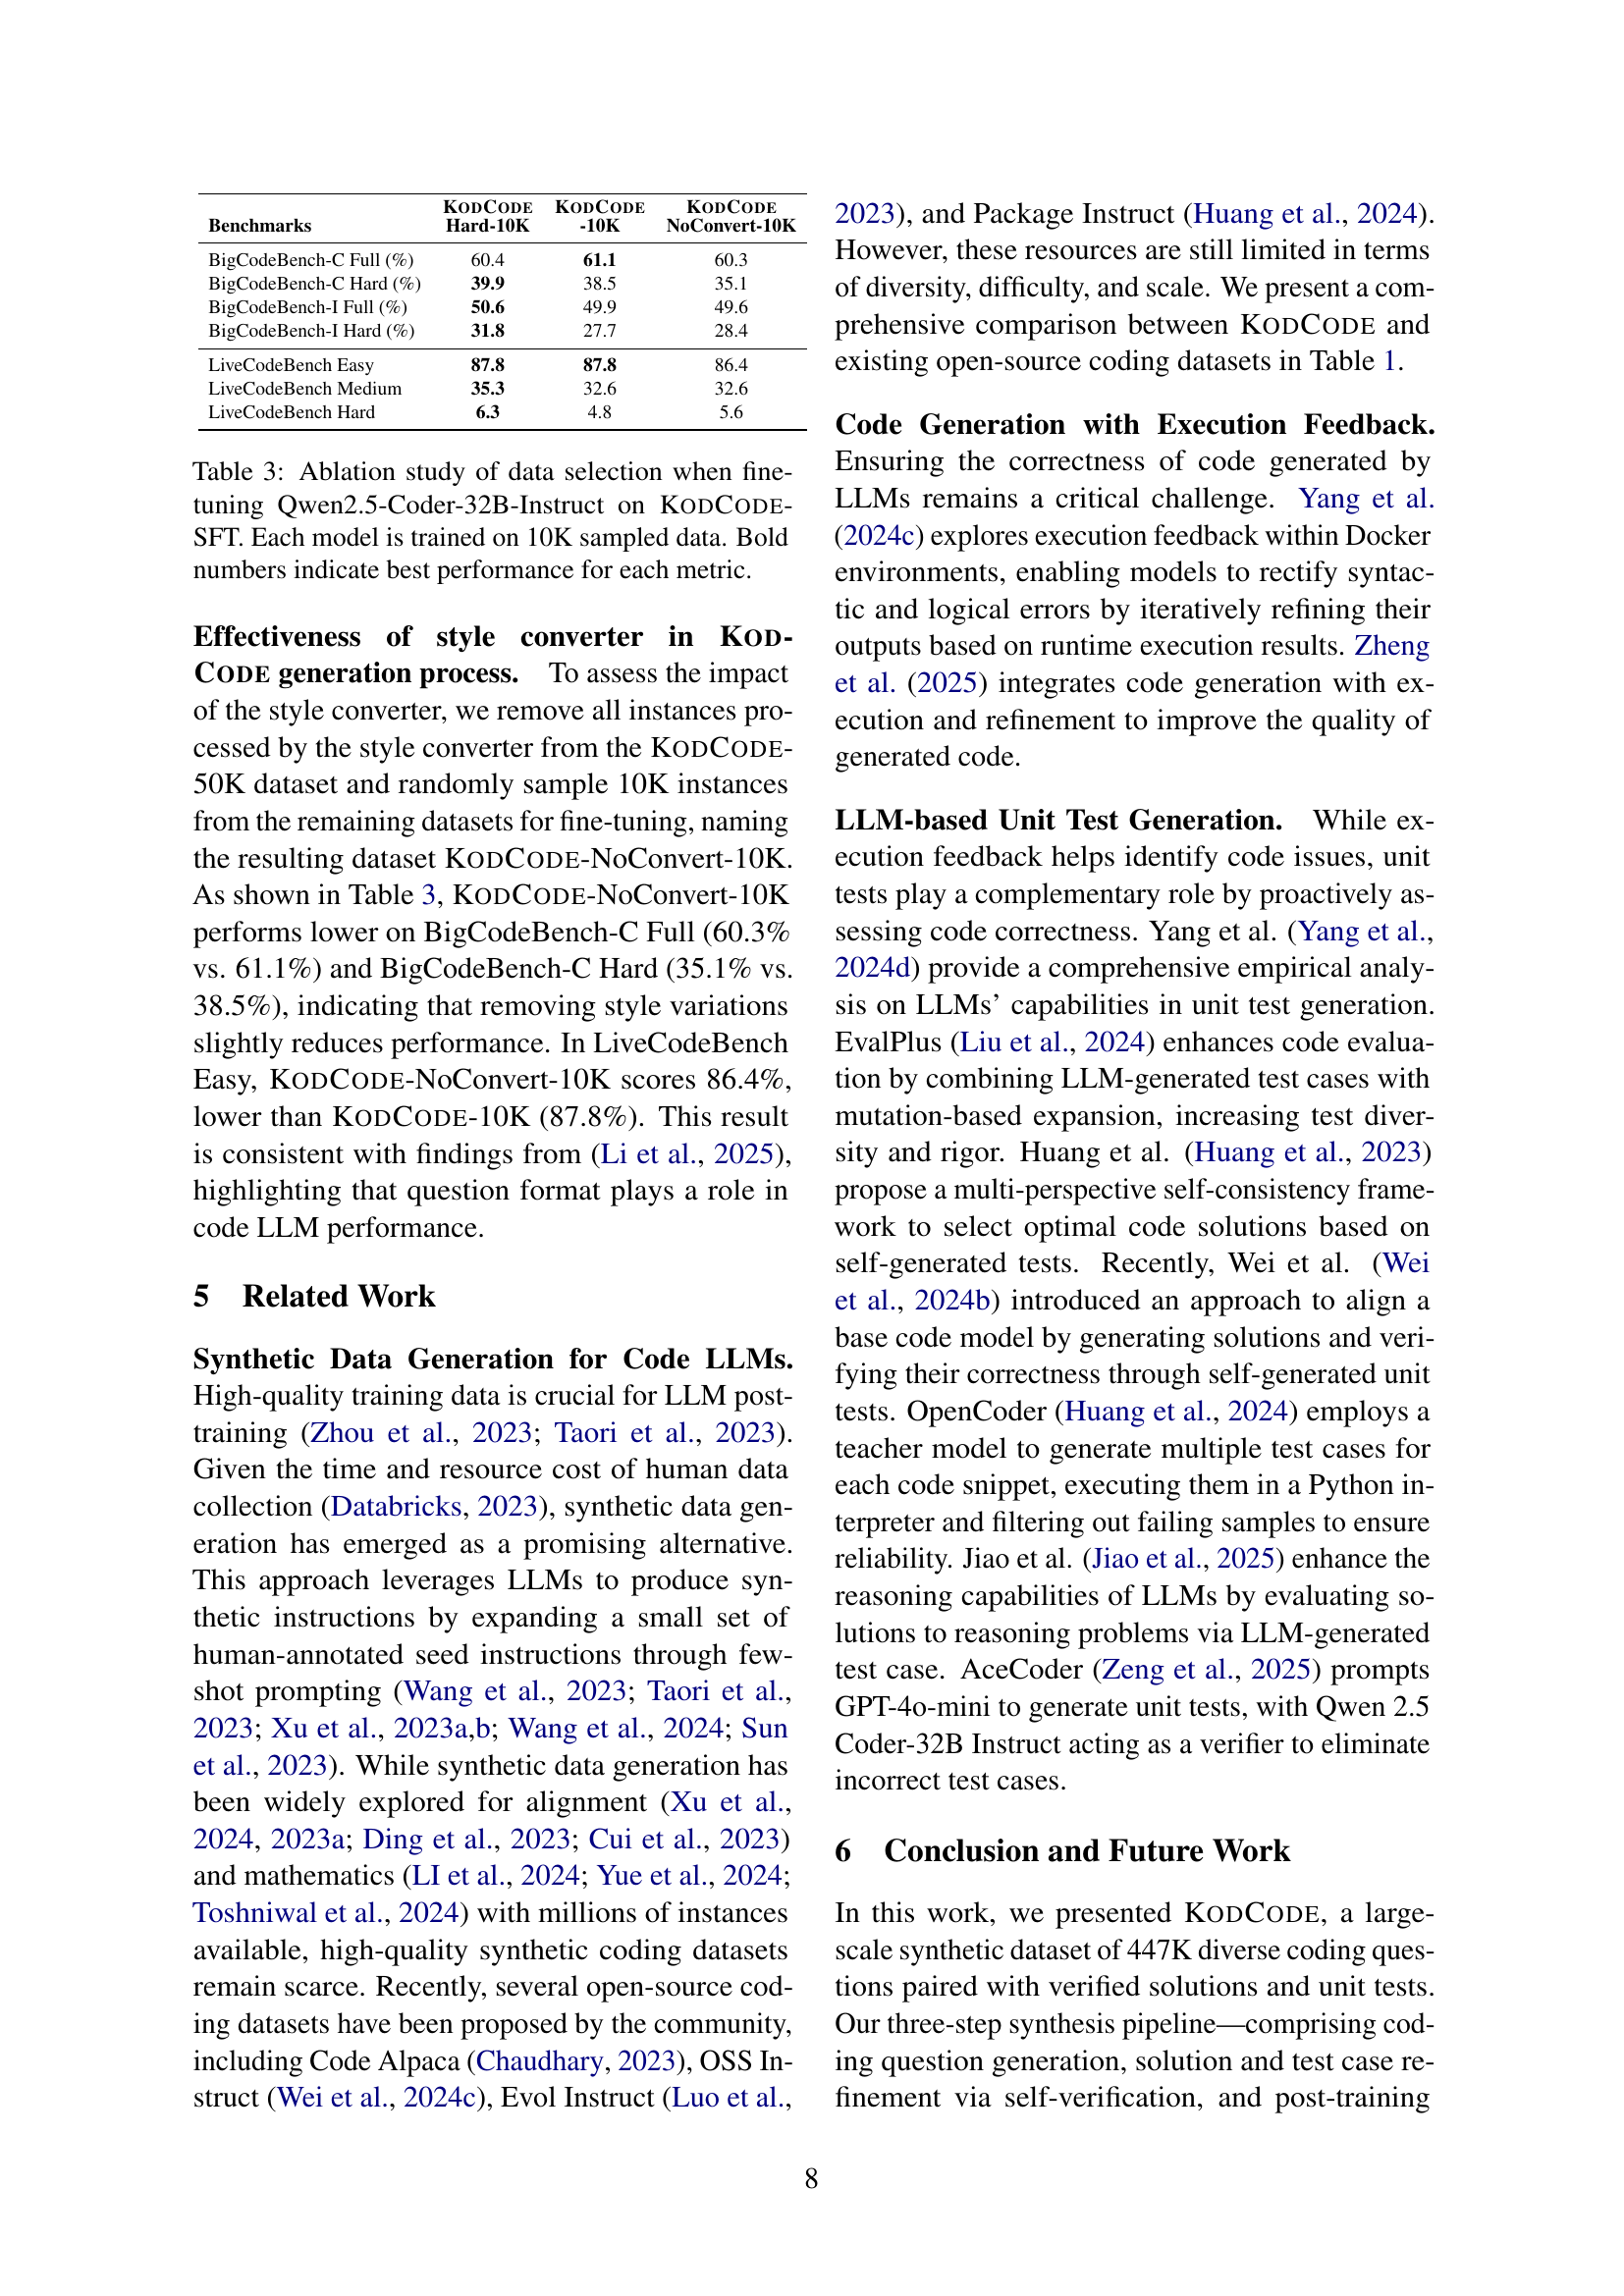
🔼 This ablation study investigates the impact of data selection on the performance of the Qwen2.5-Coder-32B-Instruct model when fine-tuned on the KodCode-SFT dataset. Three different subsets of the KodCode-SFT dataset were sampled, each containing 10,000 data points. The first subset was a random sample from the full KodCode-SFT dataset (KODCODE-10K). The second contained only the most challenging instances (KODCODE-Hard-10K). The third (NoConvert-10K) excluded data augmented by a style converter. The table compares the performance of the model trained on each subset across four different benchmarks (BigCodeBench-C Full, BigCodeBench-C Hard, BigCodeBench-I Full, BigCodeBench-I Hard, LiveCodeBench Easy, LiveCodeBench Medium, LiveCodeBench Hard). The results show how different data sampling strategies affect the model’s ability to perform well across various difficulty levels and benchmarks.
read the caption
Table 3: Ablation study of data selection when fine-tuning Qwen2.5-Coder-32B-Instruct on KodCode-SFT. Each model is trained on 10K sampled data. Bold numbers indicate best performance for each metric.
| Hyper-parameter | Value |
| Learning Rate | |
| Number of Epochs | / |
| Number of Devices | |
| Per-device Batch Size | |
| Gradient Accumulation Steps | |
| Effective Batch Size | |
| Optimizer | Adamw |
| Learning Rate Scheduler | cosine |
| Warmup Steps | |
| Max Sequence Length |
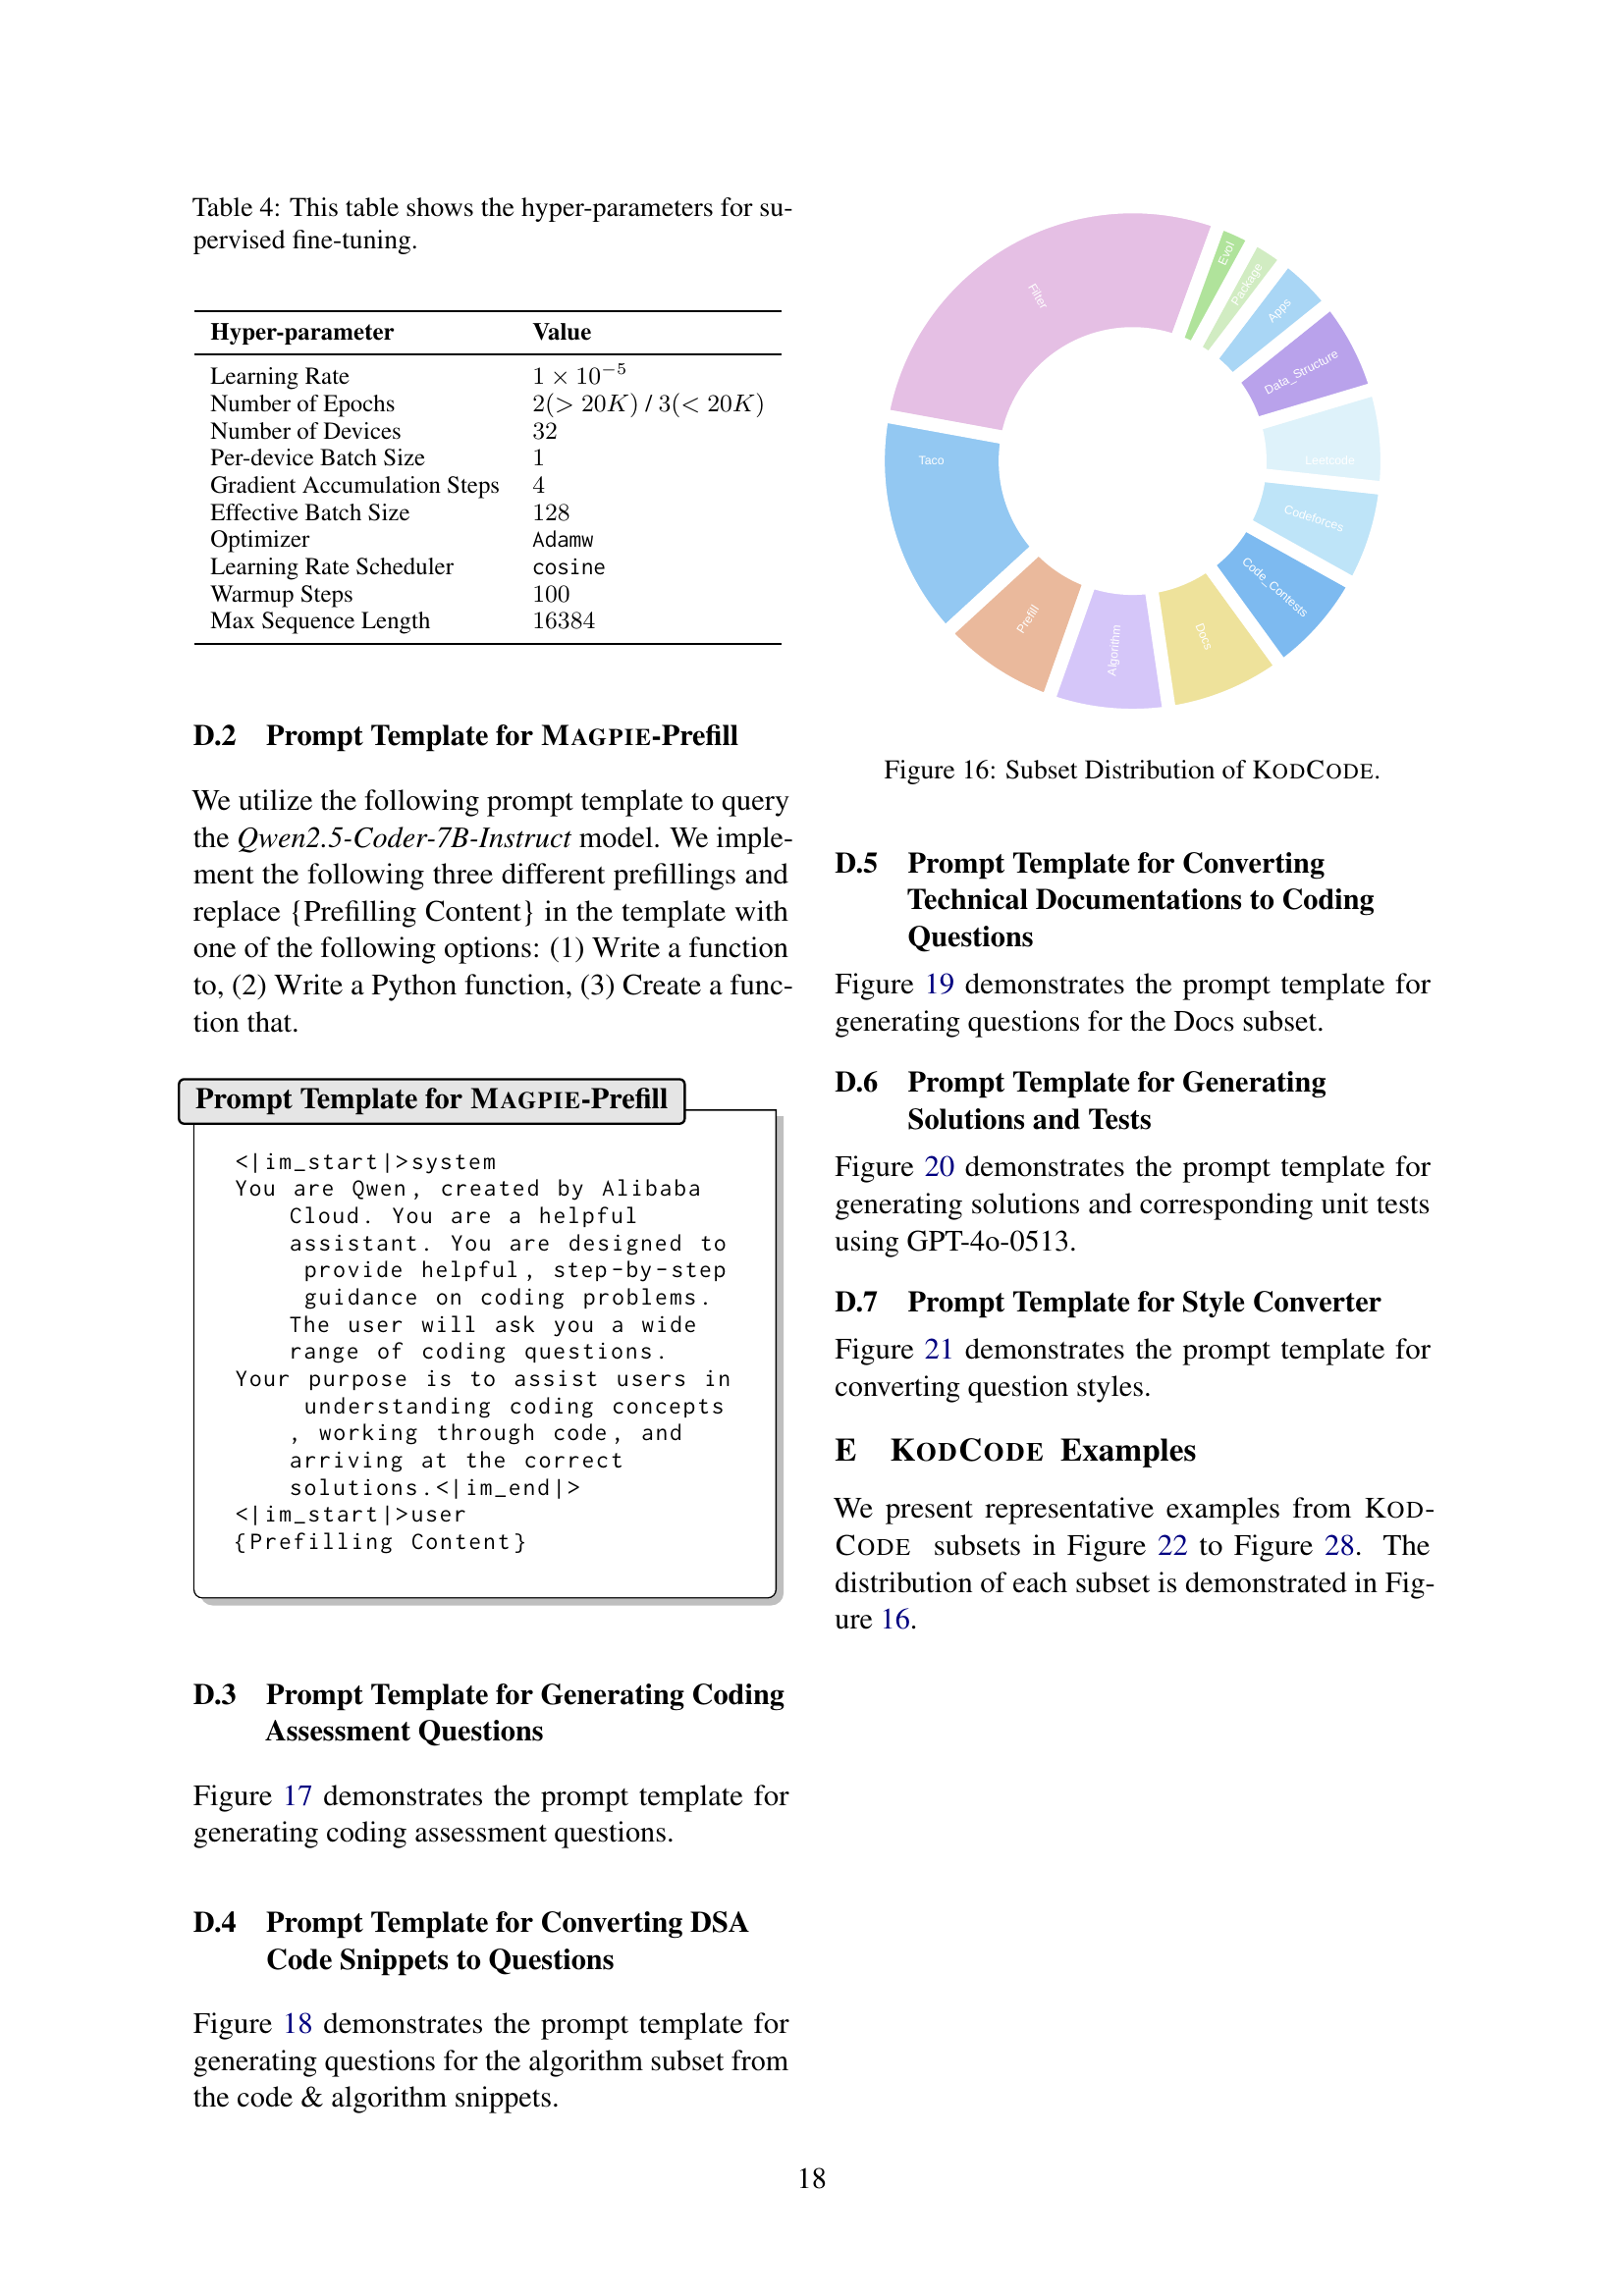
🔼 Table 4 presents the hyperparameters used during the supervised fine-tuning process of the Qwen-2.5 model on the KODCODE dataset. It lists the hyperparameter name and its corresponding value, providing details such as the learning rate, number of epochs, batch size, optimizer used (Adamw), learning rate scheduler (cosine), and maximum sequence length. This table is crucial for understanding the specific settings used in the model’s training phase.
read the caption
Table 4: This table shows the hyper-parameters for supervised fine-tuning.
Full paper#