TL;DR#
While word-level quality estimation (QE) has the potential to aid human post-editing of machine translation (MT), its practical impact on post-editing workflows and the factors influencing its effectiveness are not well-understood. Current QE evaluation practices often assume that increased accuracy directly translates to improved usability, neglecting the real-world challenges of integrating these methods into professional translation processes. Thus, QE’s true contribution remains unclear.
The study QE4PE aims to bridge this gap by conducting a large-scale evaluation with 42 professional translators in English-Italian/Dutch. It compares four error-span highlight modalities, incl. supervised/uncertainty-based word-level QE, using behavioral logs, human annotation, and questionnaires. The results underscore the importance of domain, language, and editor speed, and reveal modest differences between human and automated highlights, revealing the gap in accuracy and usability.
Key Takeaways#
Why does it matter?#
This study addresses the critical gap between the accuracy and practical usability of word-level QE in real-world post-editing scenarios. By using a diverse group of professional translators and realistic tasks, it offers insights into factors influencing the effectiveness of QE and provides direction for future QE development and implementation.
Visual Insights#

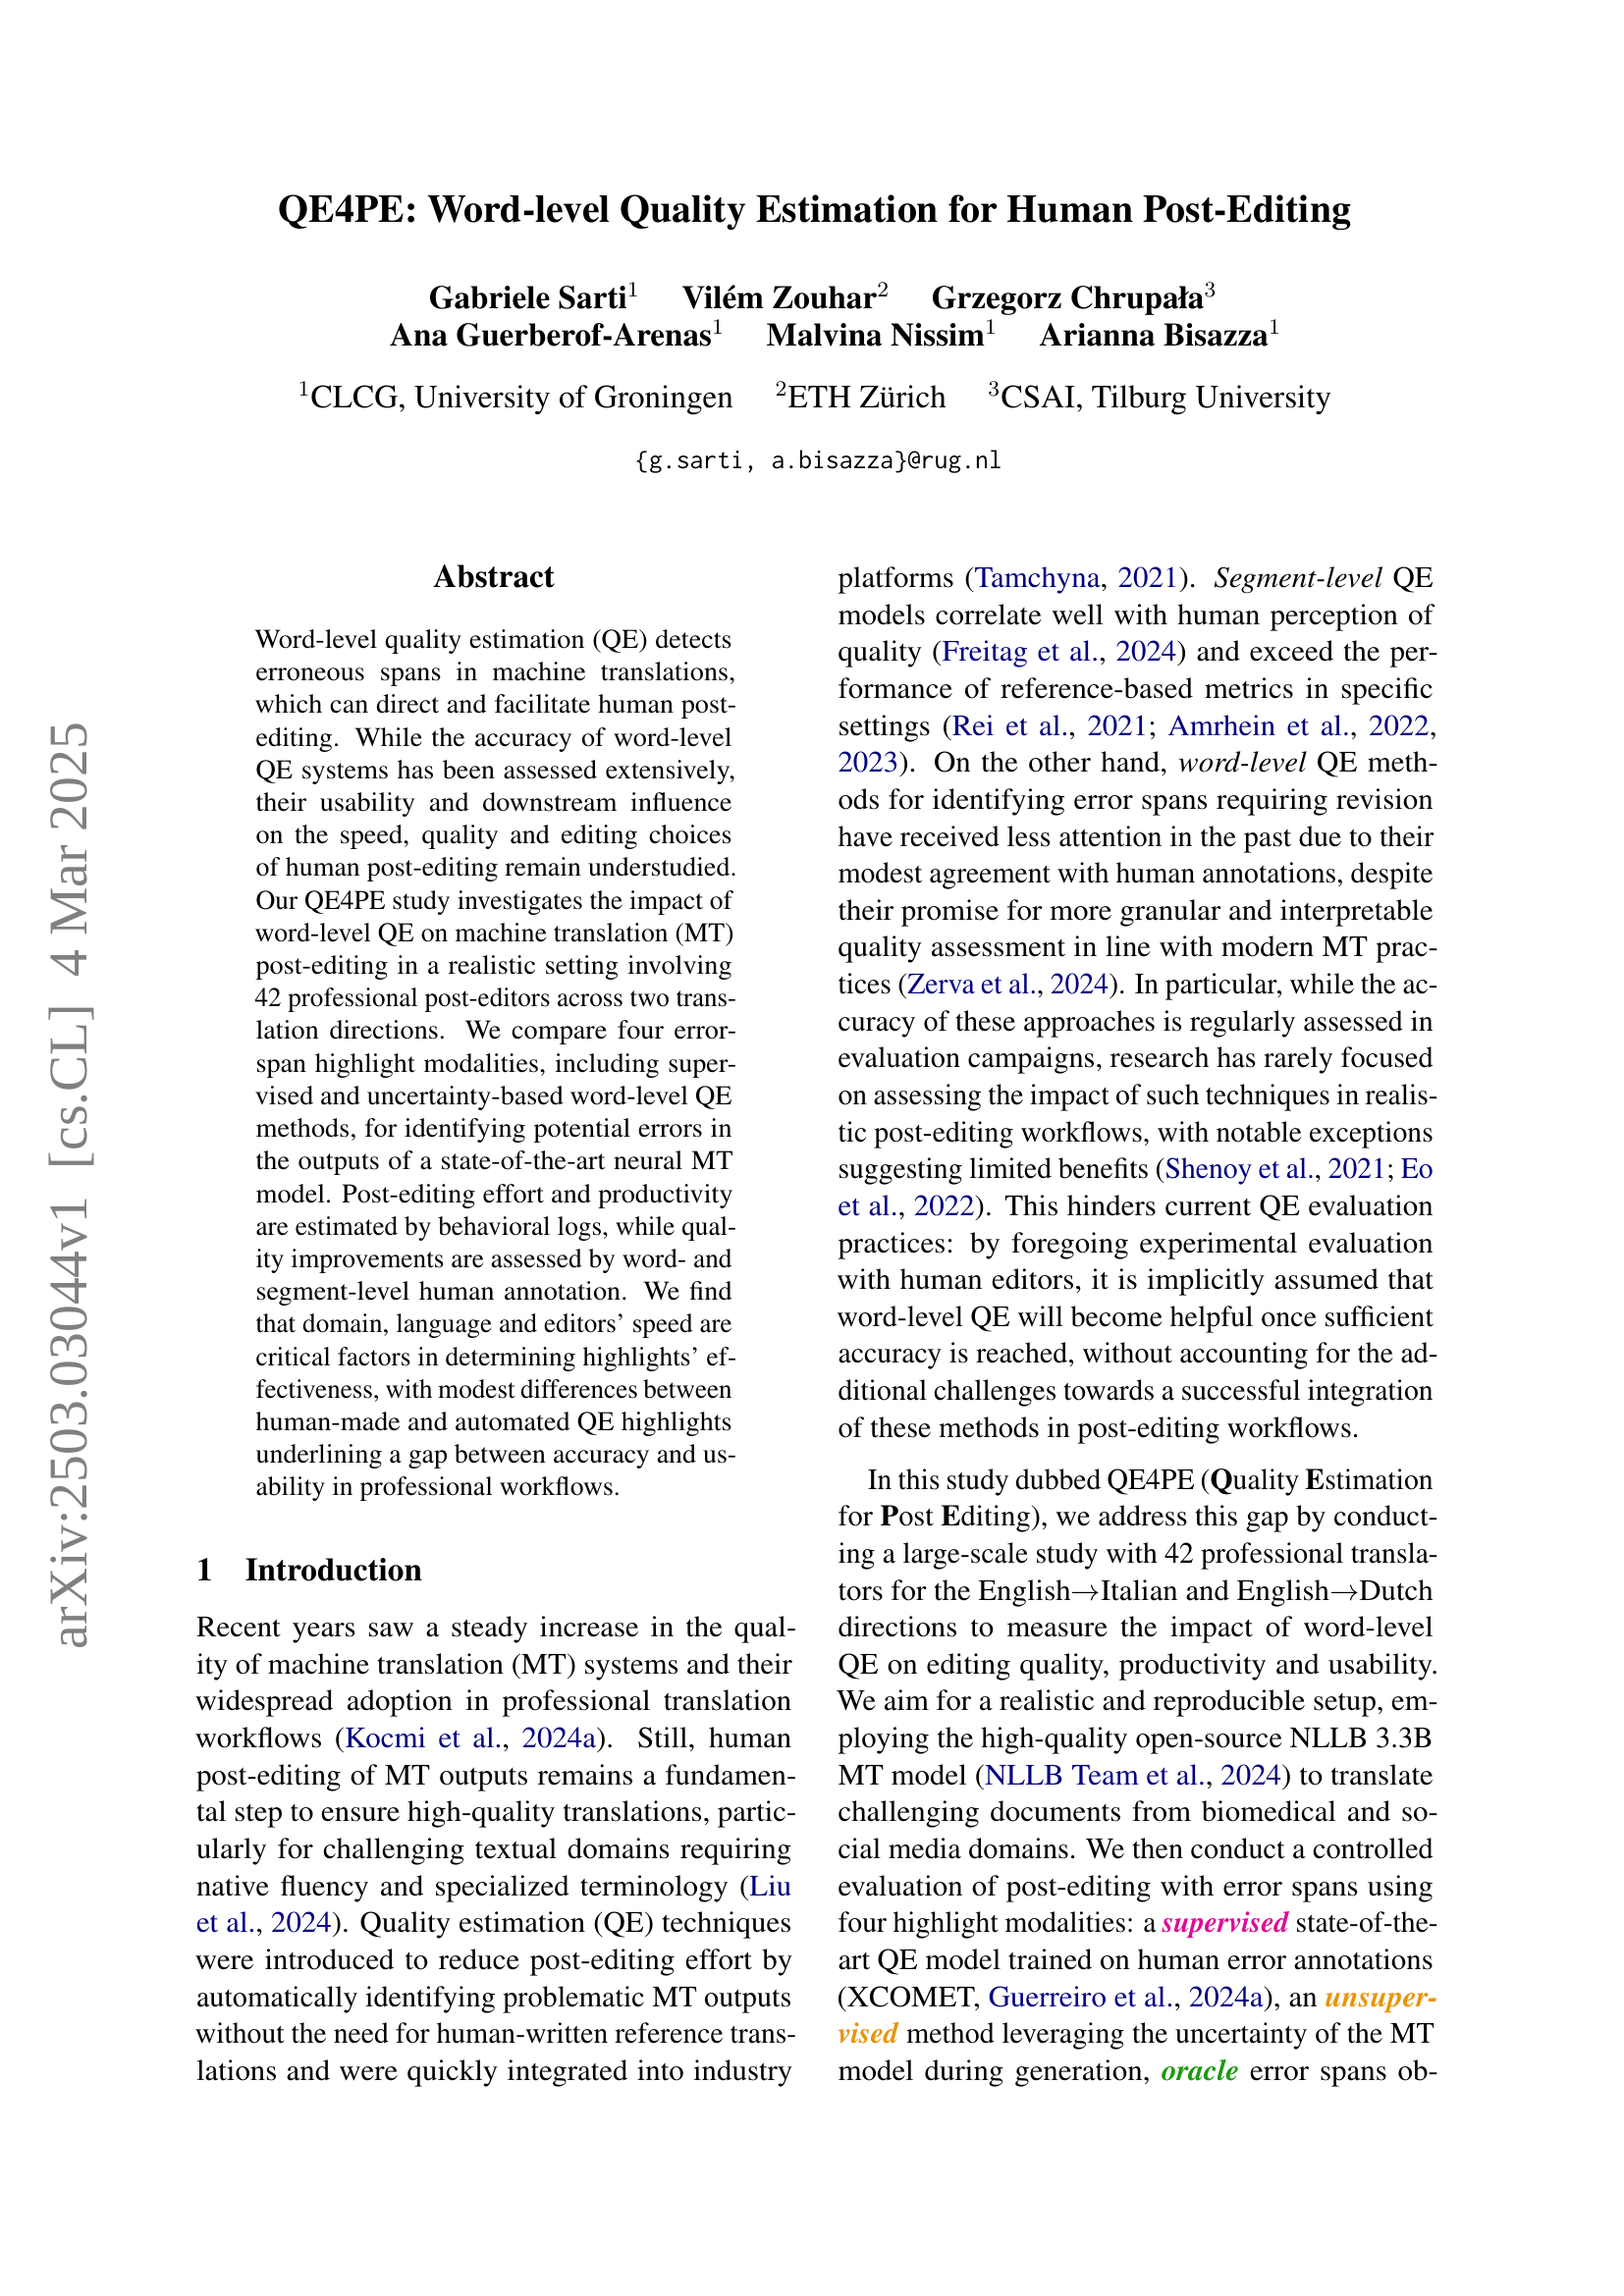
🔼 The figure illustrates the QE4PE study’s workflow. Professional translators post-edit machine translations (MT) generated by a neural MT model. The study compares four conditions: no highlights, unsupervised word-level quality estimation (QE), supervised word-level QE, and oracle highlights (representing perfect QE). Two translation directions (English-Italian and English-Dutch) are used. Editing logs and questionnaires assess the impact of each highlight modality on editing effort, productivity, and usability. Finally, human annotations (MQM and ESA) and automatic metrics evaluate the quality of both the initial MT and the post-edited translations.
read the caption
Figure 1: A summary of the QE4PE study. Documents are translated by a neural MT model and reviewed by professional editors across two translation directions and four highlight modalities. These include a no highlight baseline and three settings using unsupervised, supervised, and oracle word-level QE methods. Editing effort, productivity and usability across modalities are estimated from editing logs and questionnaires. Finally, the quality of MT and edited outputs is assessed with MQM/ESA human annotations and automatic metrics.
| Base Freq. | Measured | Projected | ||||||||
| EnglishItalian | ||||||||||
| No High. | - | 0.05 | - | - | - | - | - | - | - | - |
| Random | 0.16 | - | - | - | - | - | 0.06 | 1.20 | 0.18 | 1.20 |
| Oracle | 0.15 | 0.12 | 0.37 | 4.62 | 0.45 | 4.1 | 0.18↓0.19 | 6.00↑1.38 | 0.55↑0.10 | 4.23↑0.14 |
| Unsup. | 0.16 | 0.13 | 0.25 | 2.27 | 0.21 | 2.2 | 0.11↓0.14 | 2.75↑0.48 | 0.37↑0.16 | 2.47↑0.26 |
| Sup. | 0.12 | 0.16 | 0.28 | 2.00 | 0.22 | 2.0 | 0.14↓0.14 | 3.50↑1.50 | 0.35↑0.13 | 3.18↑1.18 |
| EnglishDutch | ||||||||||
| No High. | - | 0.14 | - | - | - | - | - | - | - | - |
| Random | 0.17 | - | - | - | - | - | 0.16 | 1.14 | 0.19 | 1.19 |
| Oracle | 0.20 | 0.10 | 0.26 | 4.33 | 0.53 | 3.12 | 0.28↑0.02 | 2.55↓1.78 | 0.40↓0.13 | 2.35↓0.77 |
| Unsup. | 0.20 | 0.11 | 0.20 | 2.50 | 0.36 | 2.00 | 0.22↑0.02 | 1.83↓0.67 | 0.31↓0.05 | 1.72↓0.28 |
| Sup. | 0.12 | 0.09 | 0.24 | 3.43 | 0.33 | 3.30 | 0.28↑0.04 | 2.33↓1.10 | 0.24↓0.09 | 2.40↓0.90 |
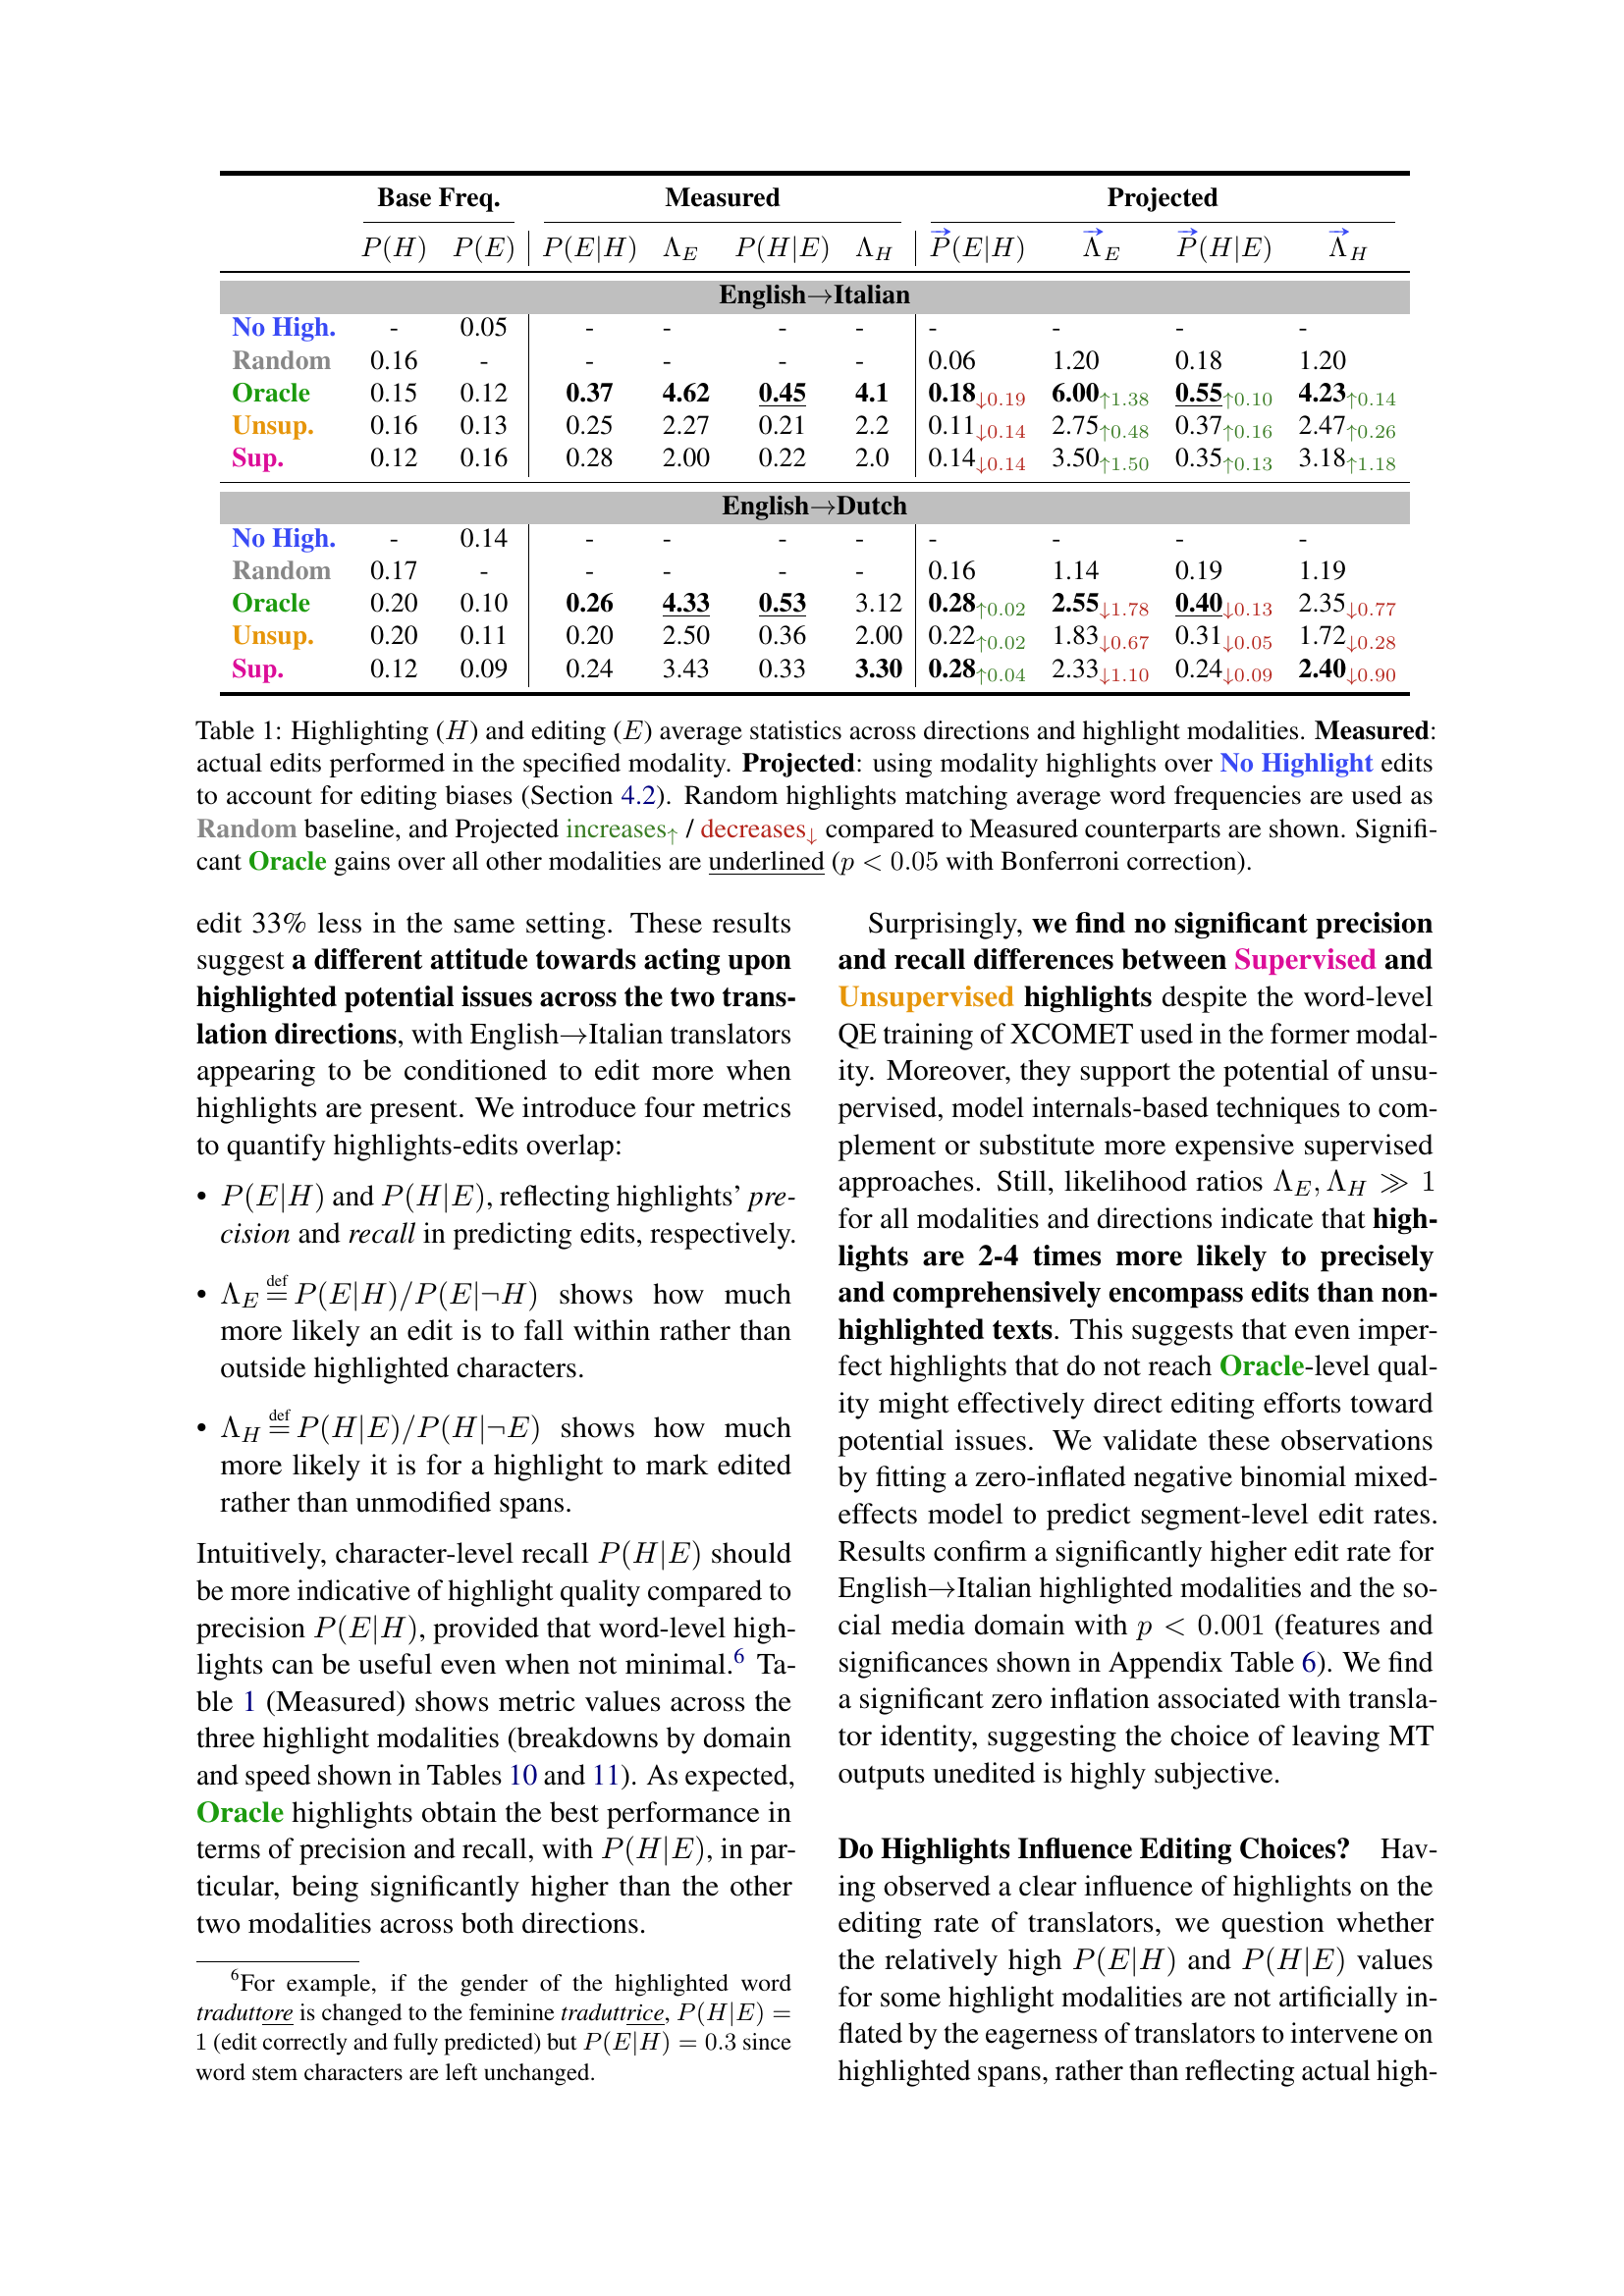
🔼 This table presents a comparison of highlighting and editing statistics across different post-editing scenarios. It shows the measured and projected impact of various highlight methods (no highlights, oracle, unsupervised, supervised) on professional post-editors’ behavior. The ‘Measured’ values reflect actual edits made with each highlight method, while ‘Projected’ values estimate the effect of highlights by comparing edits made with highlights to those made without, thereby controlling for natural editing bias. A random baseline is also provided. Statistical significance (p<0.05 using Bonferroni correction) is indicated for Oracle’s superior performance compared to other methods.
read the caption
Table 1: Highlighting (H𝐻Hitalic_H) and editing (E𝐸Eitalic_E) average statistics across directions and highlight modalities. Measured: actual edits performed in the specified modality. Projected: using modality highlights over No Highlight edits to account for editing biases (Section 4.2). Random highlights matching average word frequencies are used as Random baseline, and Projected increases↑ / decreases↓ compared to Measured counterparts are shown. Significant Oracle gains over all other modalities are underlined (p<0.05𝑝0.05p<0.05italic_p < 0.05 with Bonferroni correction).
In-depth insights#
QE: Accuracy vs Use#
The challenge in Quality Estimation (QE) isn’t solely about achieving high accuracy in identifying errors. The real hurdle lies in ensuring QE systems are actually useful and integrated into human workflows. A highly accurate QE system that’s cumbersome or doesn’t align with how translators work will be less effective than a slightly less accurate but more user-friendly one. It involves understanding how humans perceive and interact with QE-provided information. Aspects like presentation, the cognitive load it adds, and whether it genuinely helps editors make better/faster choices are crucial. Therefore, evaluations should move beyond just accuracy metrics and assess real-world impact on editing speed, quality, and user satisfaction, recognizing a potential gap between technical accuracy and practical usability.
Highlight Impact Factors#
Highlight impact factors are explored in the paper, emphasizing that the translation direction and domain significantly influence the effect of highlights on editing productivity. This suggests that highlights alone aren’t predictive of edit times. Also, the effectiveness of highlights varies, attributed to differing translator responses and the nature of errors across domains. English-Italian translators edit more with highlights, while English-Dutch translators focus on highlighted spans regardless.
GROTE for Editing#
GROTE is a custom-built, simple online interface to avoid confounding factors. It supports real-time logging of user actions, enabling quantitative assessment of editing effort and productivity across different highlight modalities. It lacks standard features like translation memories and spellchecking to control for editor proficiency. The interface follows industry practices, presenting source and translated texts in two columns. It also supports the removal of highlights, which disappear upon editing. These design choices prioritize data collection and comparability over feature richness.
Cultural Usability#
Cultural usability is vital, yet often overlooked in tech design. Understanding cultural nuances—values, beliefs, and communication styles—is crucial for user-friendly interfaces. A design embraced in one culture might offend or confuse in another. Effective design considers language, symbols, colors, and layout preferences to resonate with diverse users. Ignoring this can lead to exclusion, frustration, and even mistrust. Research emphasizes the need for culturally adaptive interfaces that prioritize inclusivity and respect. By embracing cultural sensitivity, tech can be truly accessible and beneficial globally.
Need Finer Eval#
To improve word-level QE quality, finer-grained evaluations are needed. Current metrics might not fully capture the subtle enhancements from highlights, requiring deeper analysis. There is a suggestion that focusing solely on accuracy scores for word-level QE systems might be misleading. Future work involves exploring new ways to assess usability of word-level QE highlights. To properly assess and improve the helpfulness of QE systems in real-world scenarios, a deeper understanding of how these subtle changes impact the overall editing process is important.
More visual insights#
More on figures

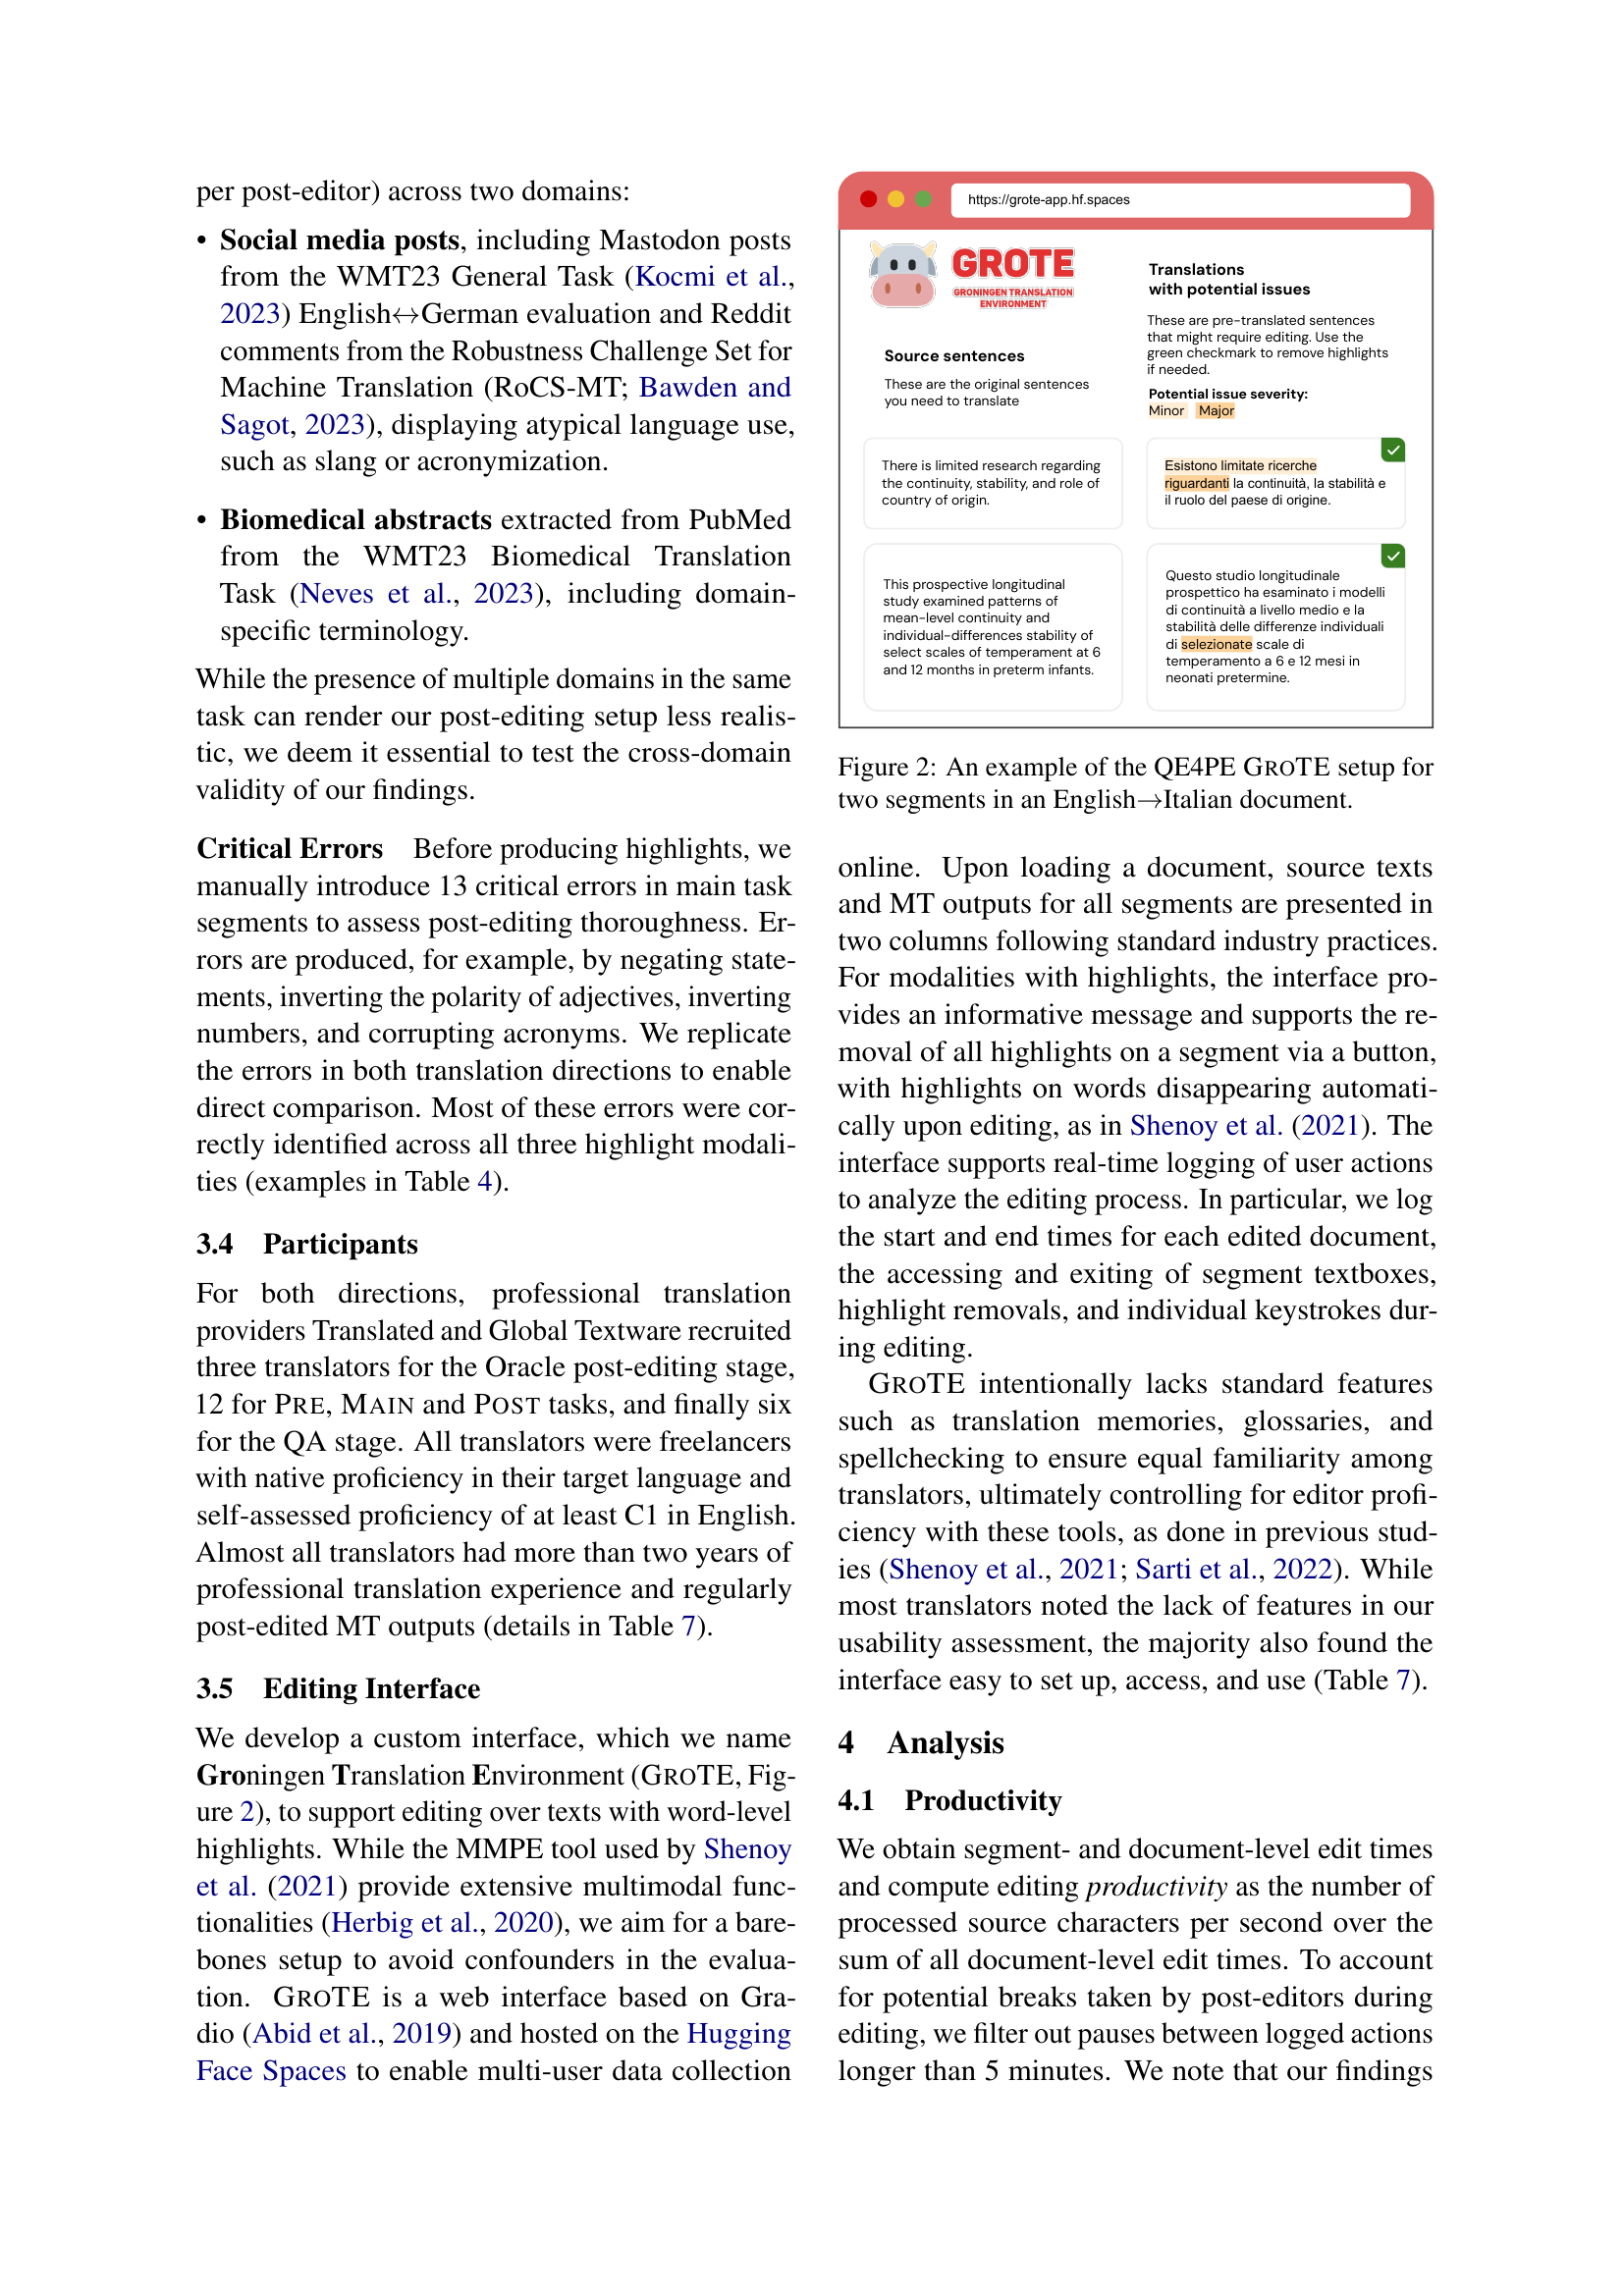
🔼 Figure 2 shows a screenshot of the GROTE interface used in the QE4PE study. The interface is designed for professional translators to post-edit machine translation (MT) outputs. It displays the source sentence in one column and the machine-translated sentence in an adjacent column. In this example, the interface highlights potential errors in the Italian translation, allowing the translators to focus their edits. The highlights correspond to different QE models, including supervised and unsupervised methods, used to identify and classify errors at the word level. Translators can interact with the interface by making edits and confirming their changes via checkmarks. This screenshot demonstrates the controlled experimental environment used to study the effects of different QE methods on professional post-editing workflows.
read the caption
Figure 2: An example of the QE4PE GroTE setup for two segments in an English→→\rightarrow→Italian document.

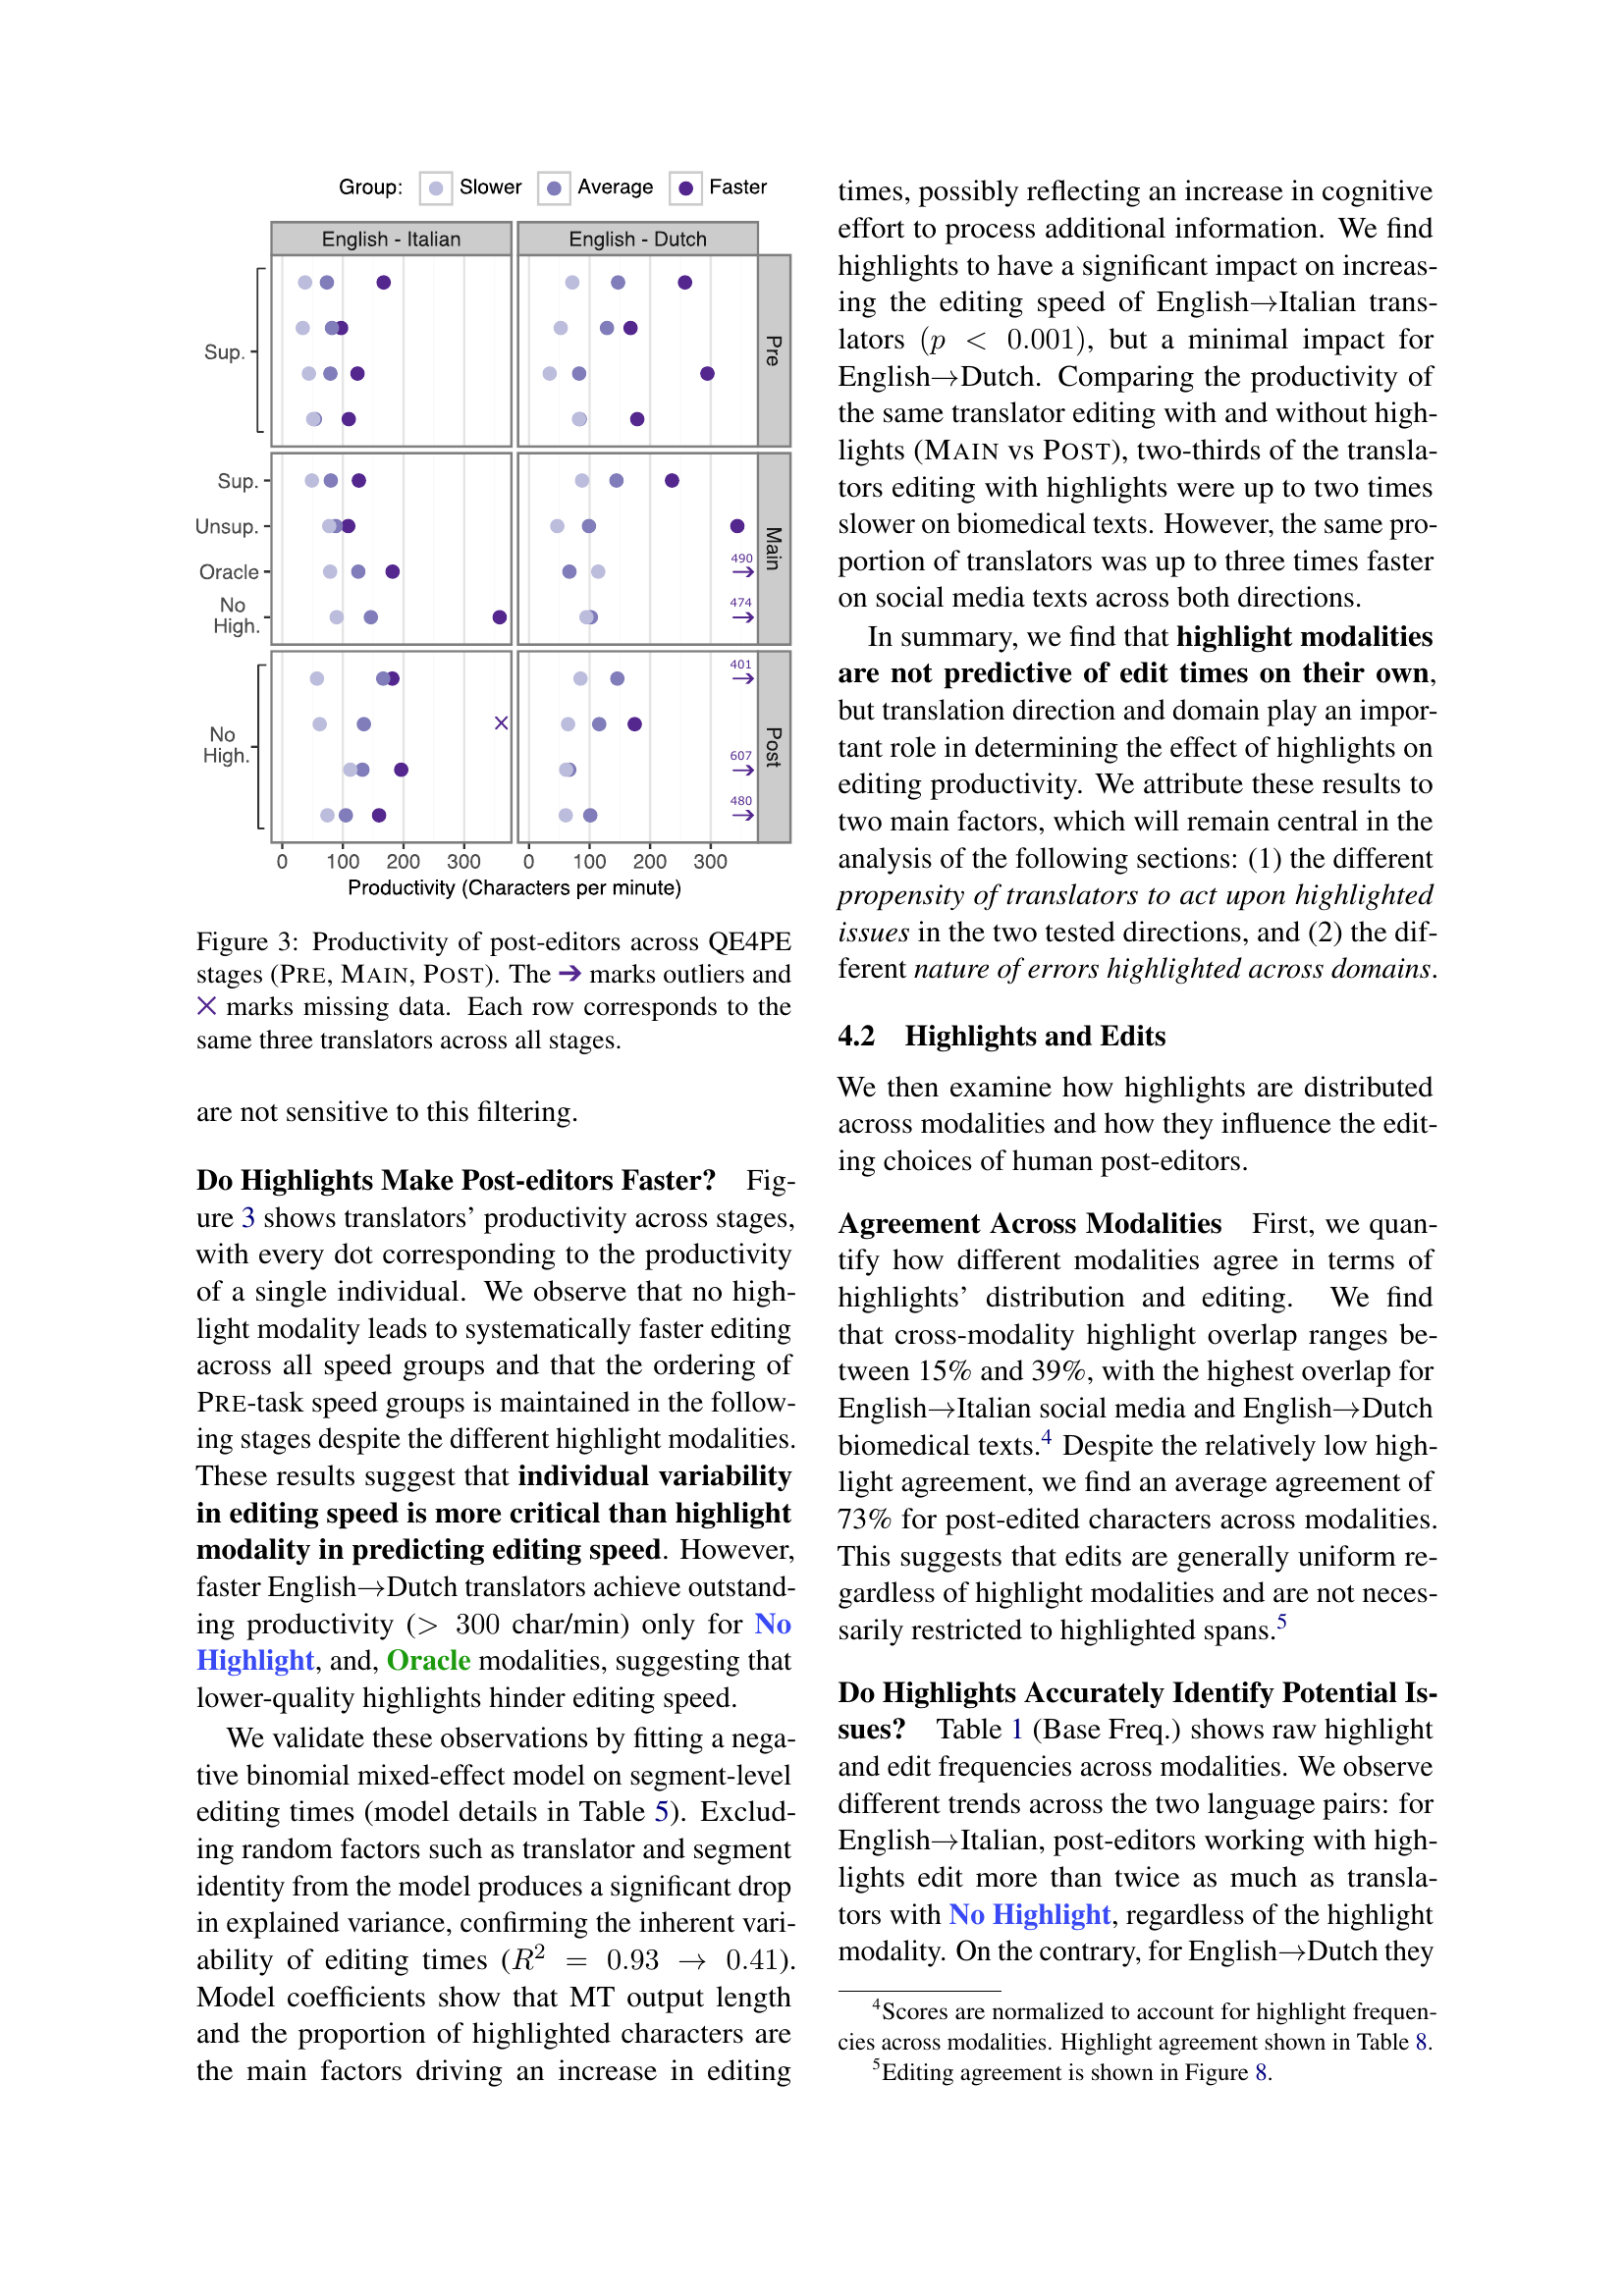
🔼 This figure displays the productivity of post-editors throughout the QE4PE study across three stages: Pre-task, Main task, and Post-task. Productivity is measured in characters per minute. The data points represent individual post-editors’ productivity in each stage. Outliers are marked with a ➔ symbol, and missing data points are indicated by a ✕. Each row shows the productivity of the same three post-editors across the three stages, allowing for a within-subjects comparison of productivity changes.
read the caption
Figure 3: Productivity of post-editors across QE4PE stages (Pre, Main, Post). The ➔ marks outliers and ✕ marks missing data. Each row corresponds to the same three translators across all stages.

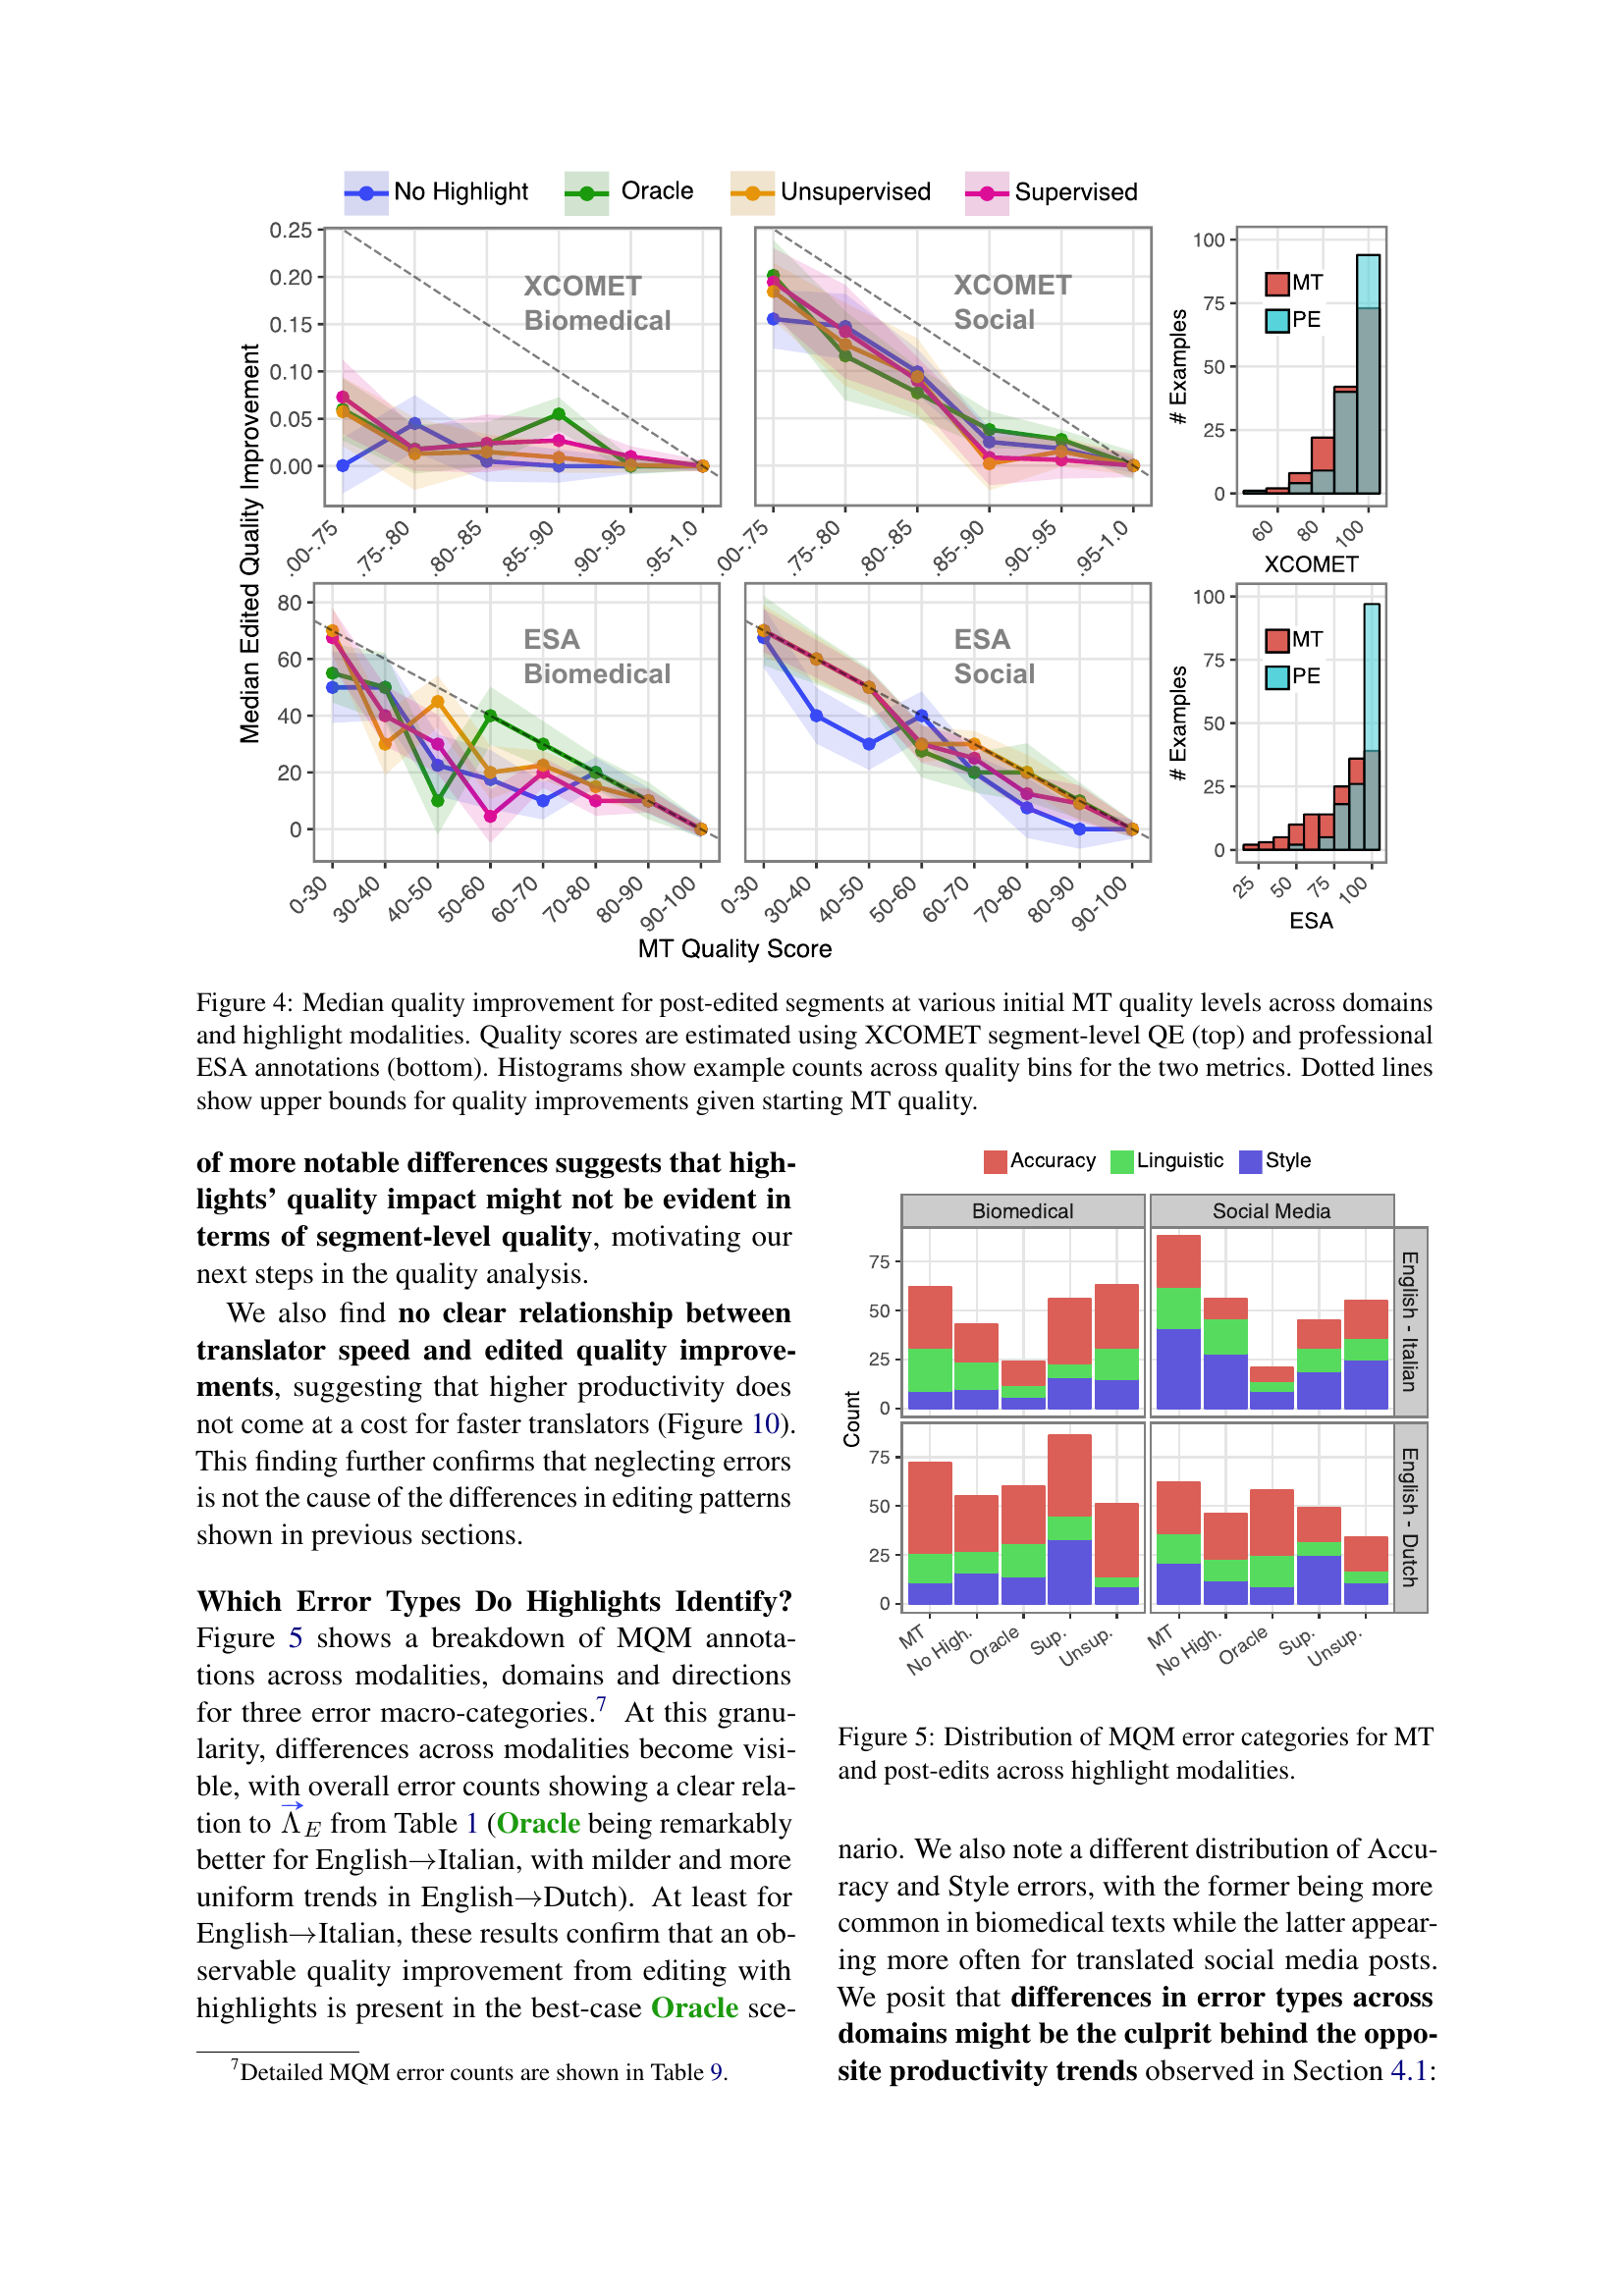
🔼 This figure displays the median quality improvements after post-editing, categorized by initial Machine Translation (MT) quality levels, domains (biomedical and social media), and highlight modalities. The top half uses XCOMET segment-level Quality Estimation (QE) scores to measure quality, while the bottom half utilizes professional ESA (Expert-based Segment Assessment) annotations for a more human-centric evaluation. Histograms alongside each line graph show the number of data points within each quality bin. Dotted lines represent the maximum achievable quality improvement based on the initial MT quality, providing context for the results.
read the caption
Figure 4: Median quality improvement for post-edited segments at various initial MT quality levels across domains and highlight modalities. Quality scores are estimated using XCOMET segment-level QE (top) and professional ESA annotations (bottom). Histograms show example counts across quality bins for the two metrics. Dotted lines show upper bounds for quality improvements given starting MT quality.

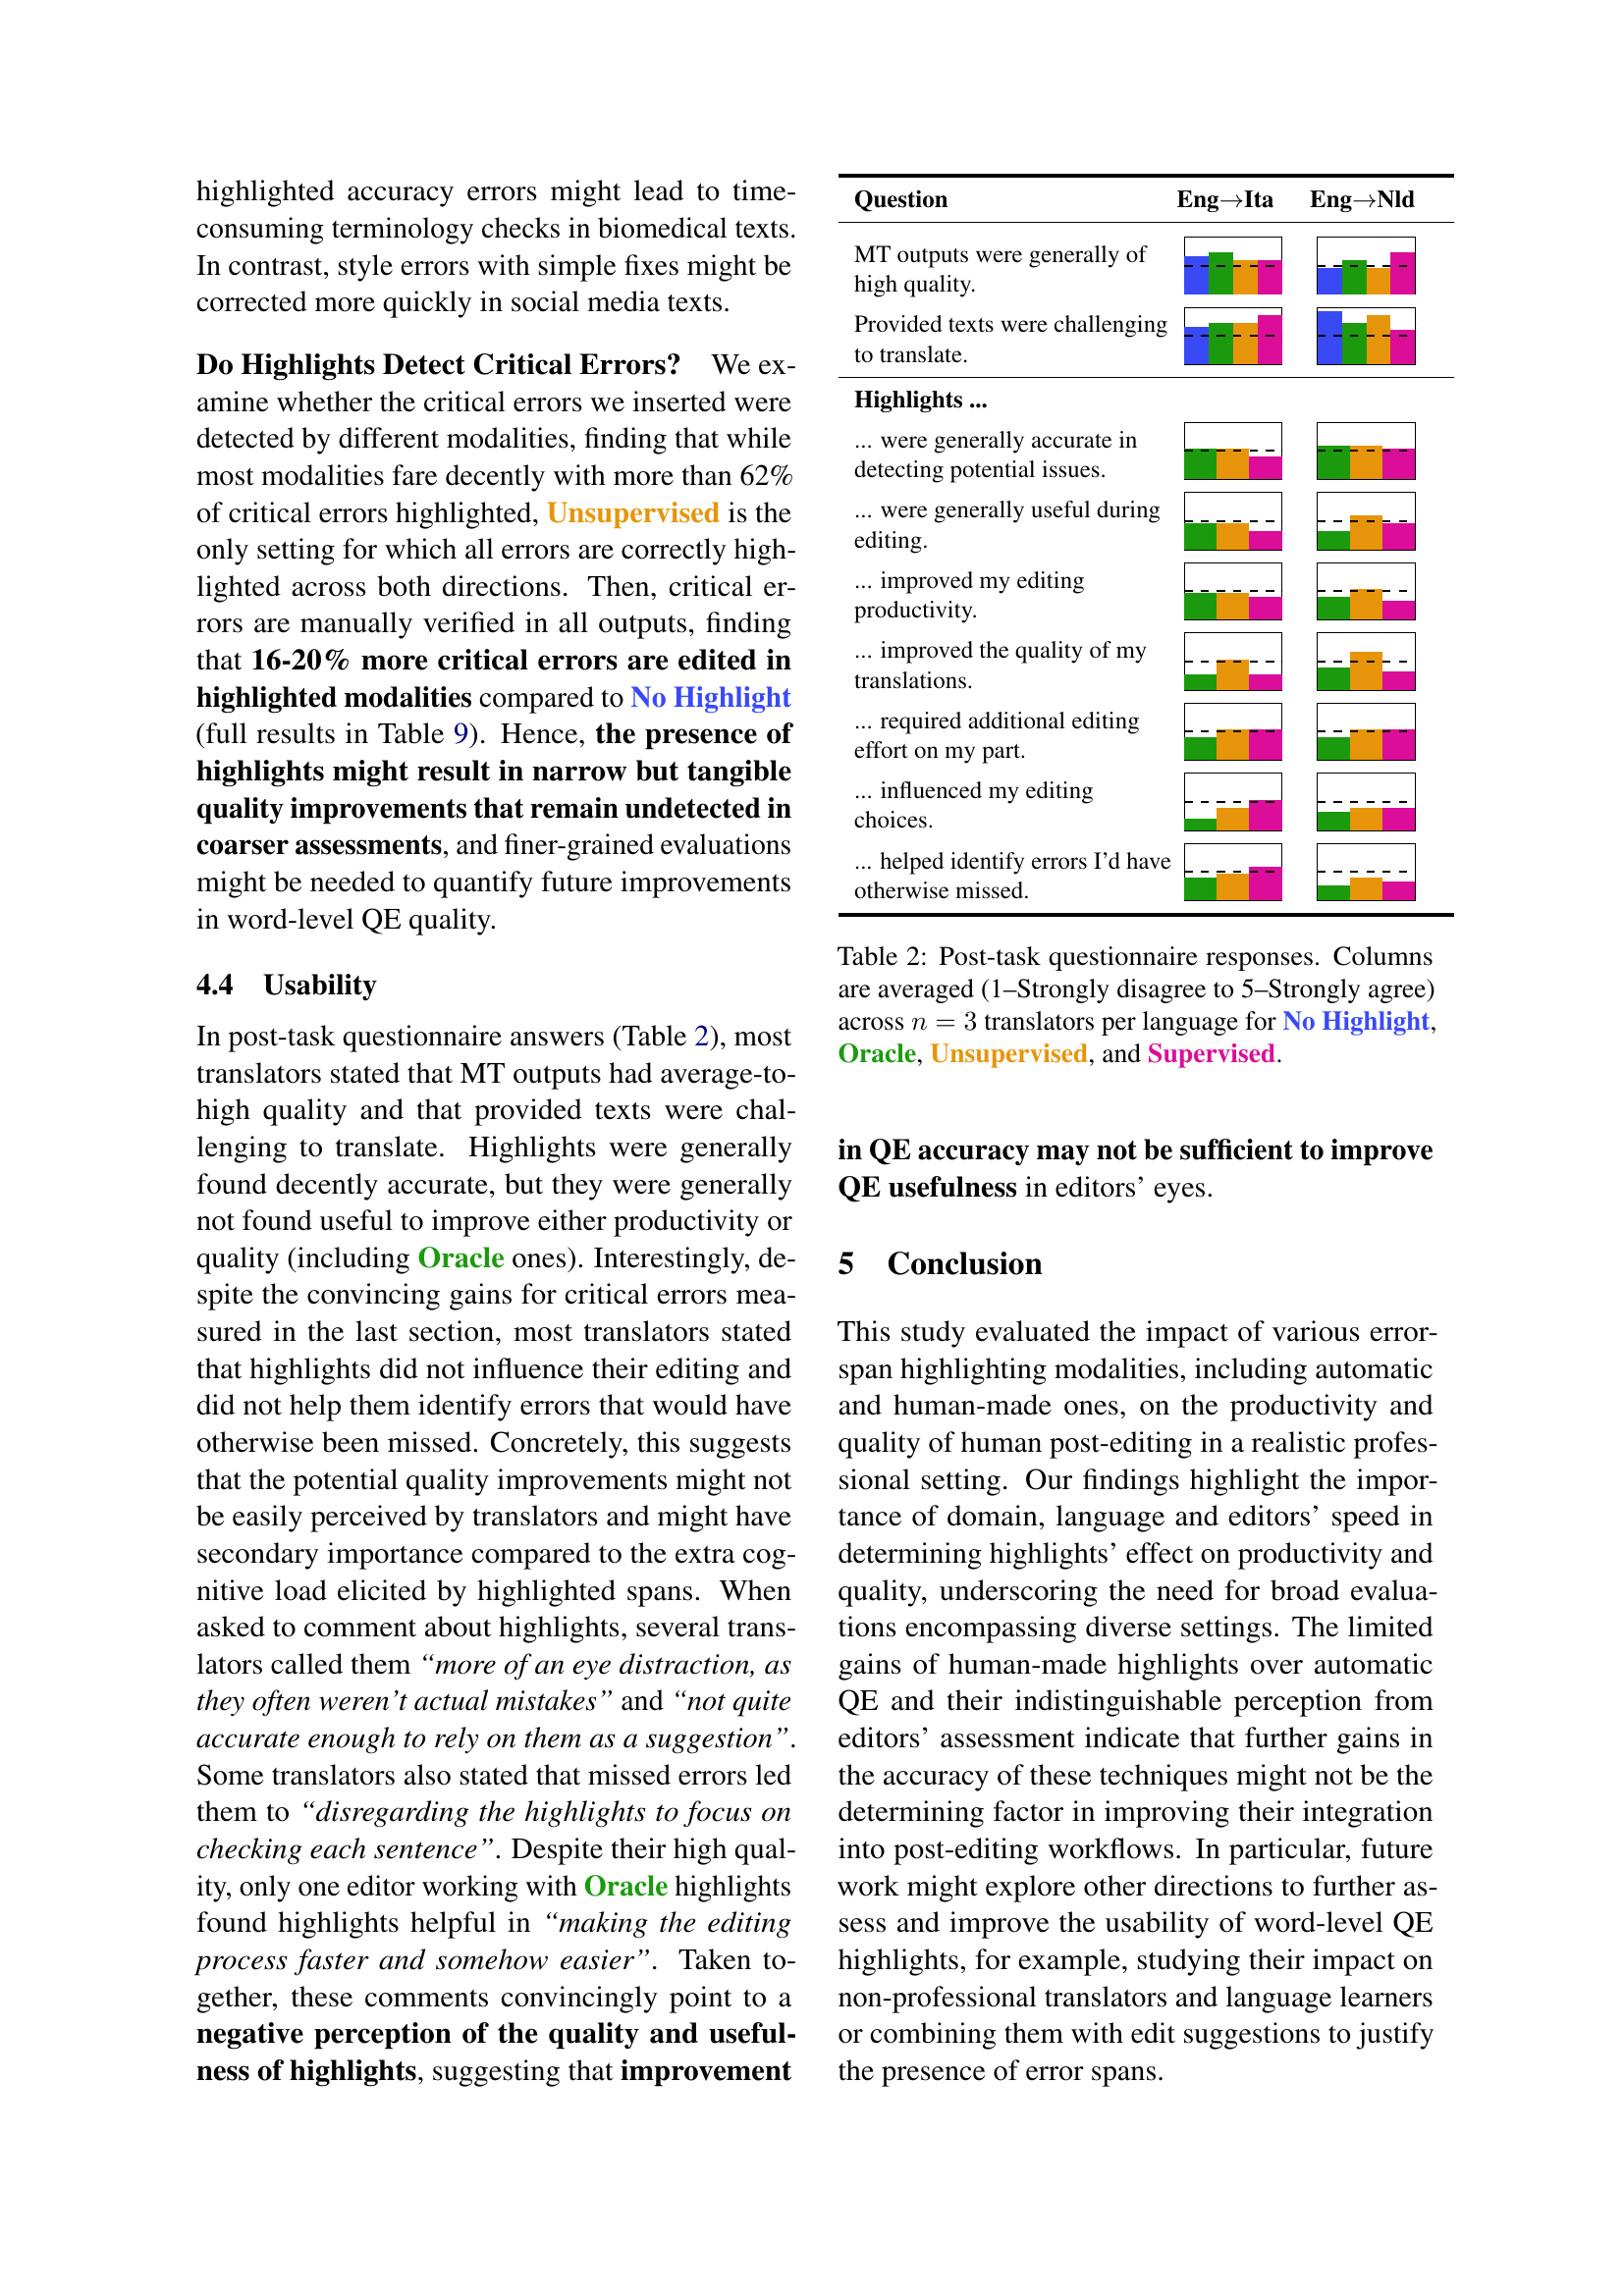
🔼 This figure displays a breakdown of errors categorized using the Multidimensional Quality Metrics (MQM) framework. It compares the distribution of errors in the original machine translation (MT) outputs to the errors found in post-edited translations. The comparison is shown across four different highlight modalities: No Highlight, Oracle, Unsupervised, and Supervised. These modalities represent different methods of highlighting potential errors in the MT output, with ‘Oracle’ indicating error spans identified through consensus amongst human post-editors. The figure visually represents the frequency of various error types (Accuracy, Linguistic, and Style) for both Biomedical and Social Media domains across both English-to-Italian and English-to-Dutch translation directions.
read the caption
Figure 5: Distribution of MQM error categories for MT and post-edits across highlight modalities.

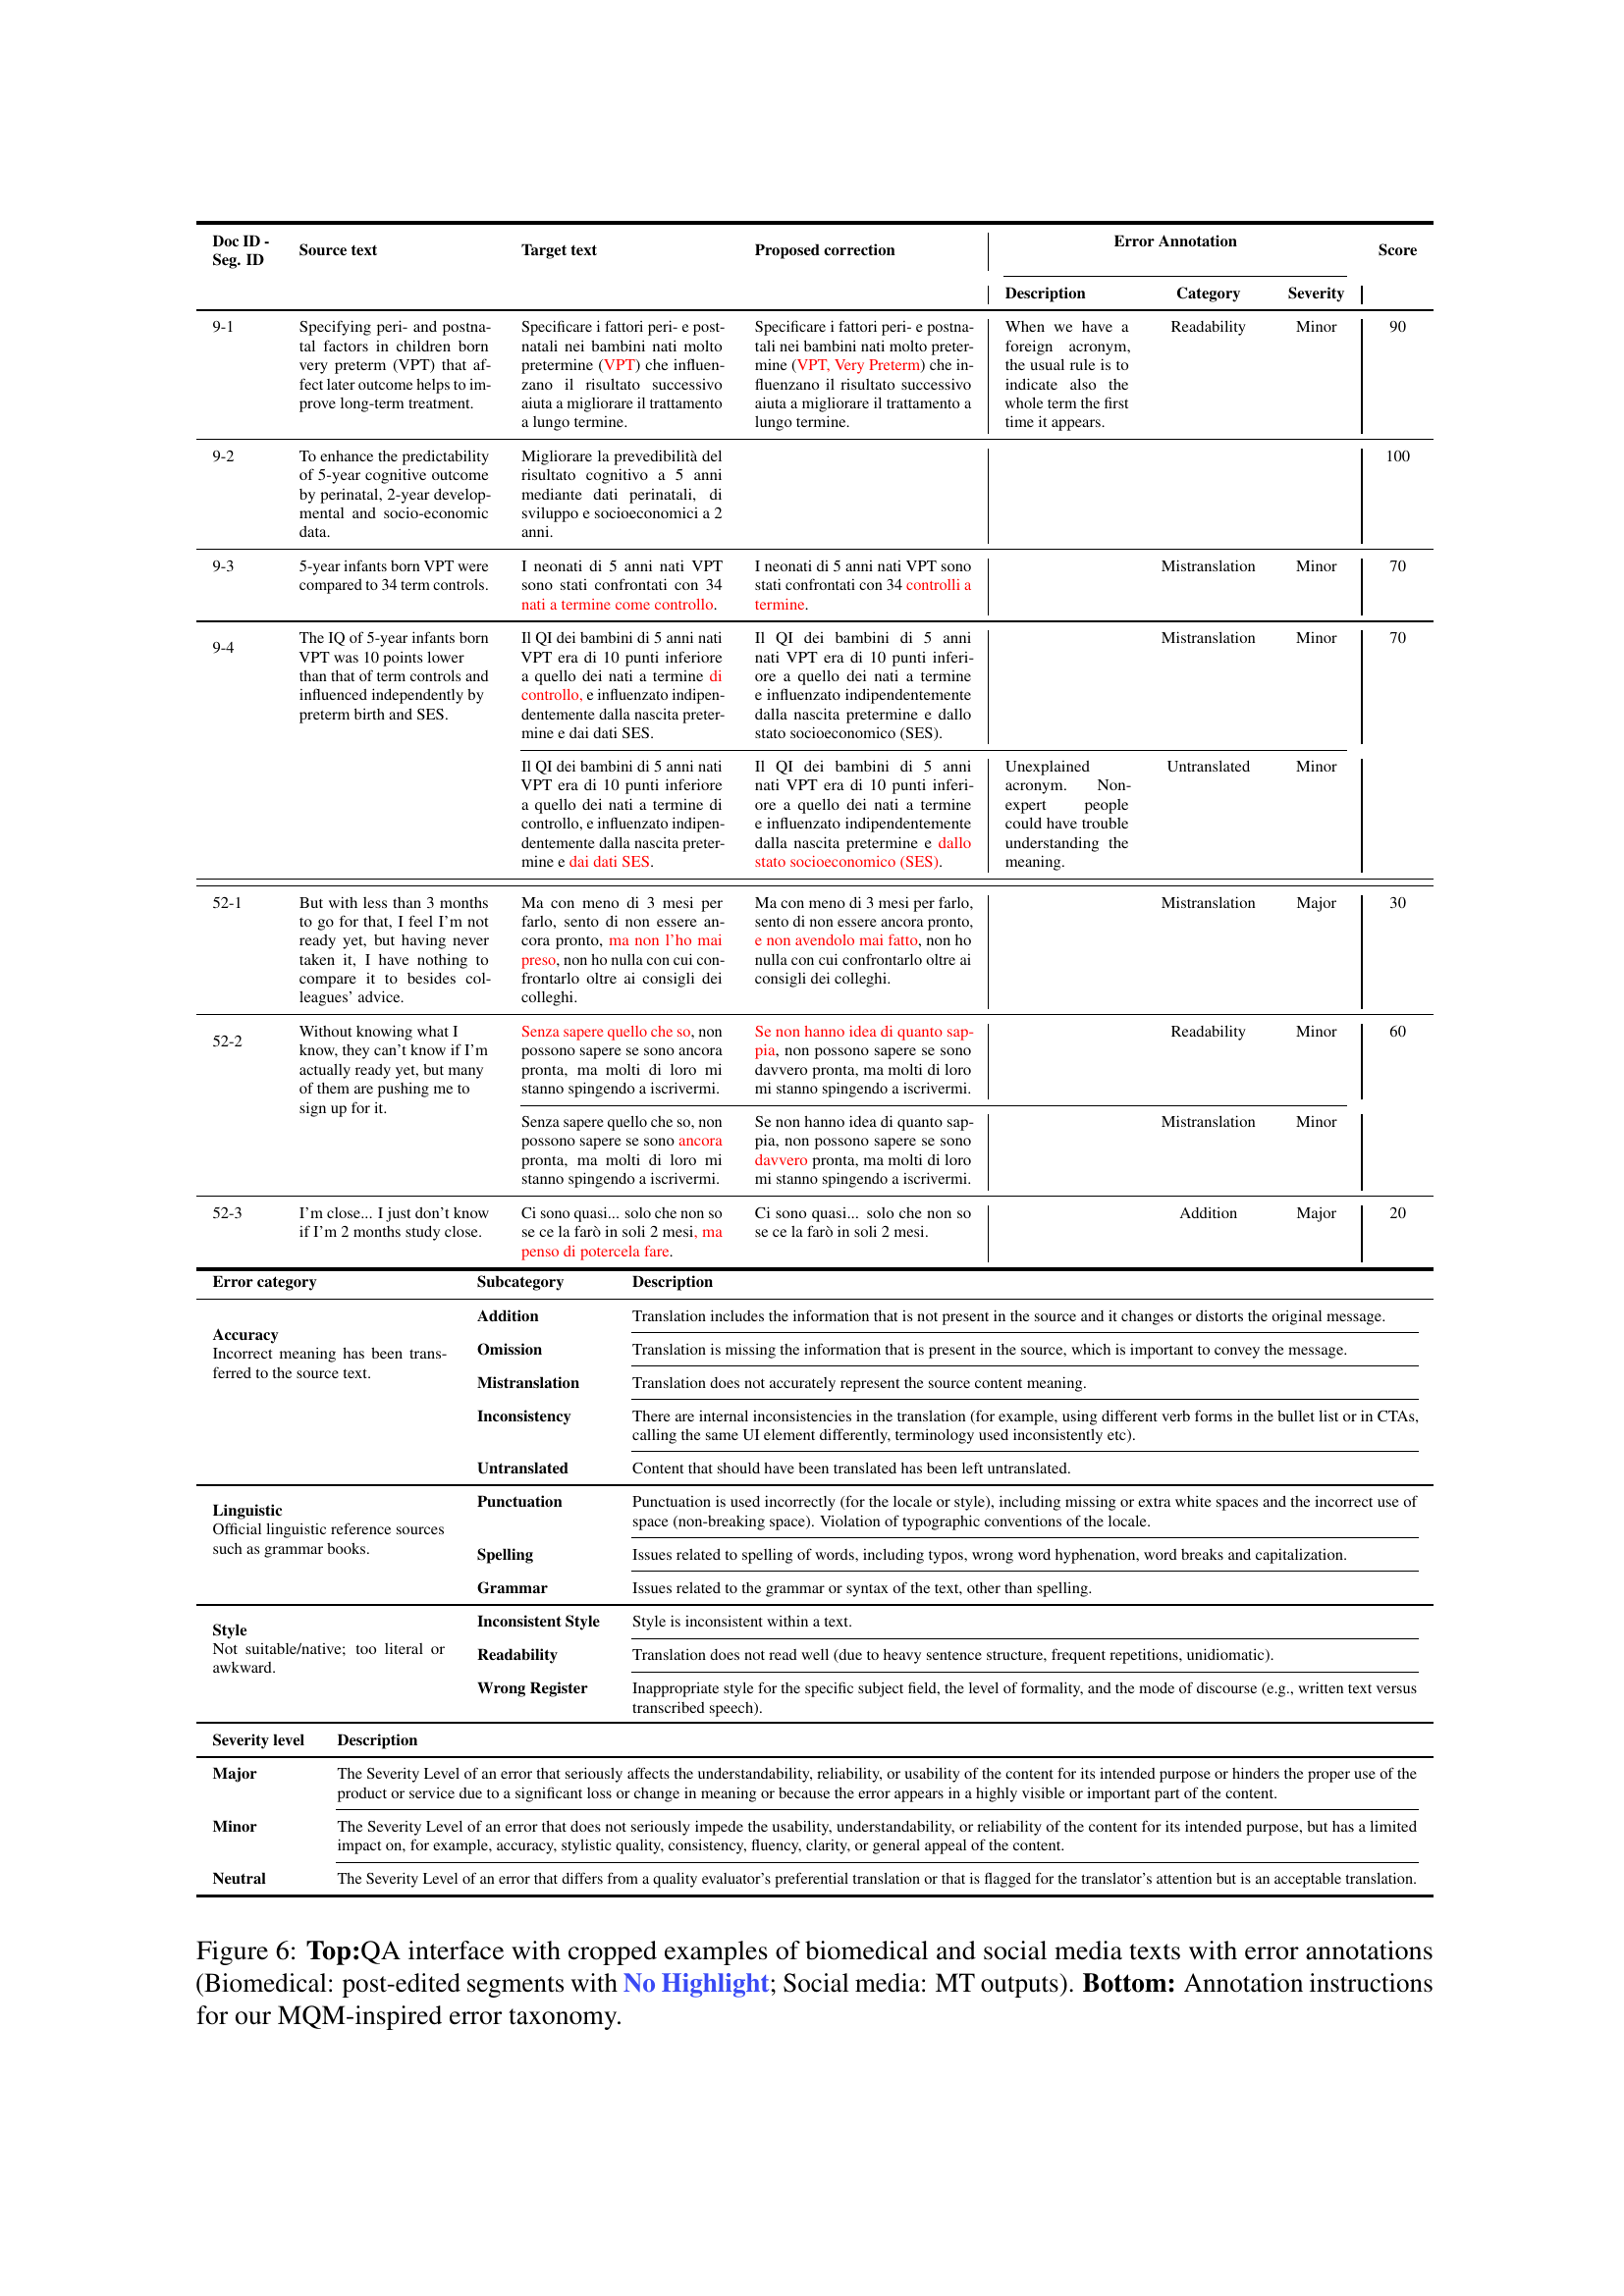
🔼 Figure 6 shows the quality assessment process of the study. The top half displays screenshots of the Groningen Translation Environment (GROTE) interface, showcasing examples of biomedical and social media texts with and without error highlights. The biomedical examples show post-edited segments without highlights, while the social media examples are the original machine translation outputs. The bottom half provides a detailed description of the annotation guidelines and the taxonomy used for error categorization, which follows the Multidimensional Quality Metrics (MQM) scheme.
read the caption
Figure 6: Top:QA interface with cropped examples of biomedical and social media texts with error annotations (Biomedical: post-edited segments with No Highlight; Social media: MT outputs). Bottom: Annotation instructions for our MQM-inspired error taxonomy.

🔼 Figure 7 presents a comparative analysis of post-editing behavior across different highlight modalities (no highlight, oracle, unsupervised, and supervised), domains (biomedical and social media), and translation directions (English-Italian and English-Dutch). The top panel displays the overall post-editing rate for each condition, illustrating how quickly editors completed their work. The bottom panel shows the proportion of edits made within the highlighted spans provided by the different QE methods. Statistical significance levels are indicated using asterisks (*** for p<0.001, ** for p<0.01, * for p<0.05) and ’ns’ denotes results that were not statistically significant after correcting for multiple comparisons using the Bonferroni method.
read the caption
Figure 7: Top: Post-editing rate across highlight modalities, domains and directions. Bottom: Proportion of edits in highlighted spans across highlight modalities. *** =p<0.001absent𝑝0.001=p<0.001= italic_p < 0.001, ** =p<0.01absent𝑝0.01=p<0.01= italic_p < 0.01, * =p<0.05absent𝑝0.05=p<0.05= italic_p < 0.05, ns === not significant with Bonferroni correction.

🔼 Figure 8 displays the level of agreement between different post-editing methods. The data is averaged across all translator pairs for each modality (3 for intra-modality comparisons and 9 for inter-modality comparisons) and across all the segments. The results show the extent to which different highlighting methods lead to similar editing choices.
read the caption
Figure 8: Post-editing agreement across various modalities (Section 4.2). Results are averaged across all translator pairs for the two modalities (n=3𝑛3n=3italic_n = 3 intra-modality, n=9𝑛9n=9italic_n = 9 inter-modality for every language) and all segments.

🔼 Figure 9 presents a comparison of the quality scores obtained from the ESA (Error Severity Assessment) metric, applied to both machine translation (MT) outputs and their corresponding post-edited versions. The comparison is done across two different domains (biomedical and social media) and two translation directions (English-Italian and English-Dutch). The figure visually demonstrates the distribution of ESA scores for each condition, showing that post-editing generally improves translation quality across both domains and translation pairs. The comparable distributions suggest that the post-editing process yields relatively consistent improvements in quality regardless of the source text domain or language.
read the caption
Figure 9: ESA ratings for MT outputs and post-edits across domains and translation directions, showing comparable quality distributions for MT and post-edits across domains and directions.
More on tables
| Question | EngIta | EngNld |
| MT outputs were generally of high quality. | ||
| Provided texts were challenging to translate. | ||
| Highlights … | ||
| … were generally accurate in detecting potential issues. | ||
| … were generally useful during editing. | ||
| … improved my editing productivity. | ||
| … improved the quality of my translations. | ||
| … required additional editing effort on my part. | ||
| … influenced my editing choices. | ||
| … helped identify errors I’d have otherwise missed. |
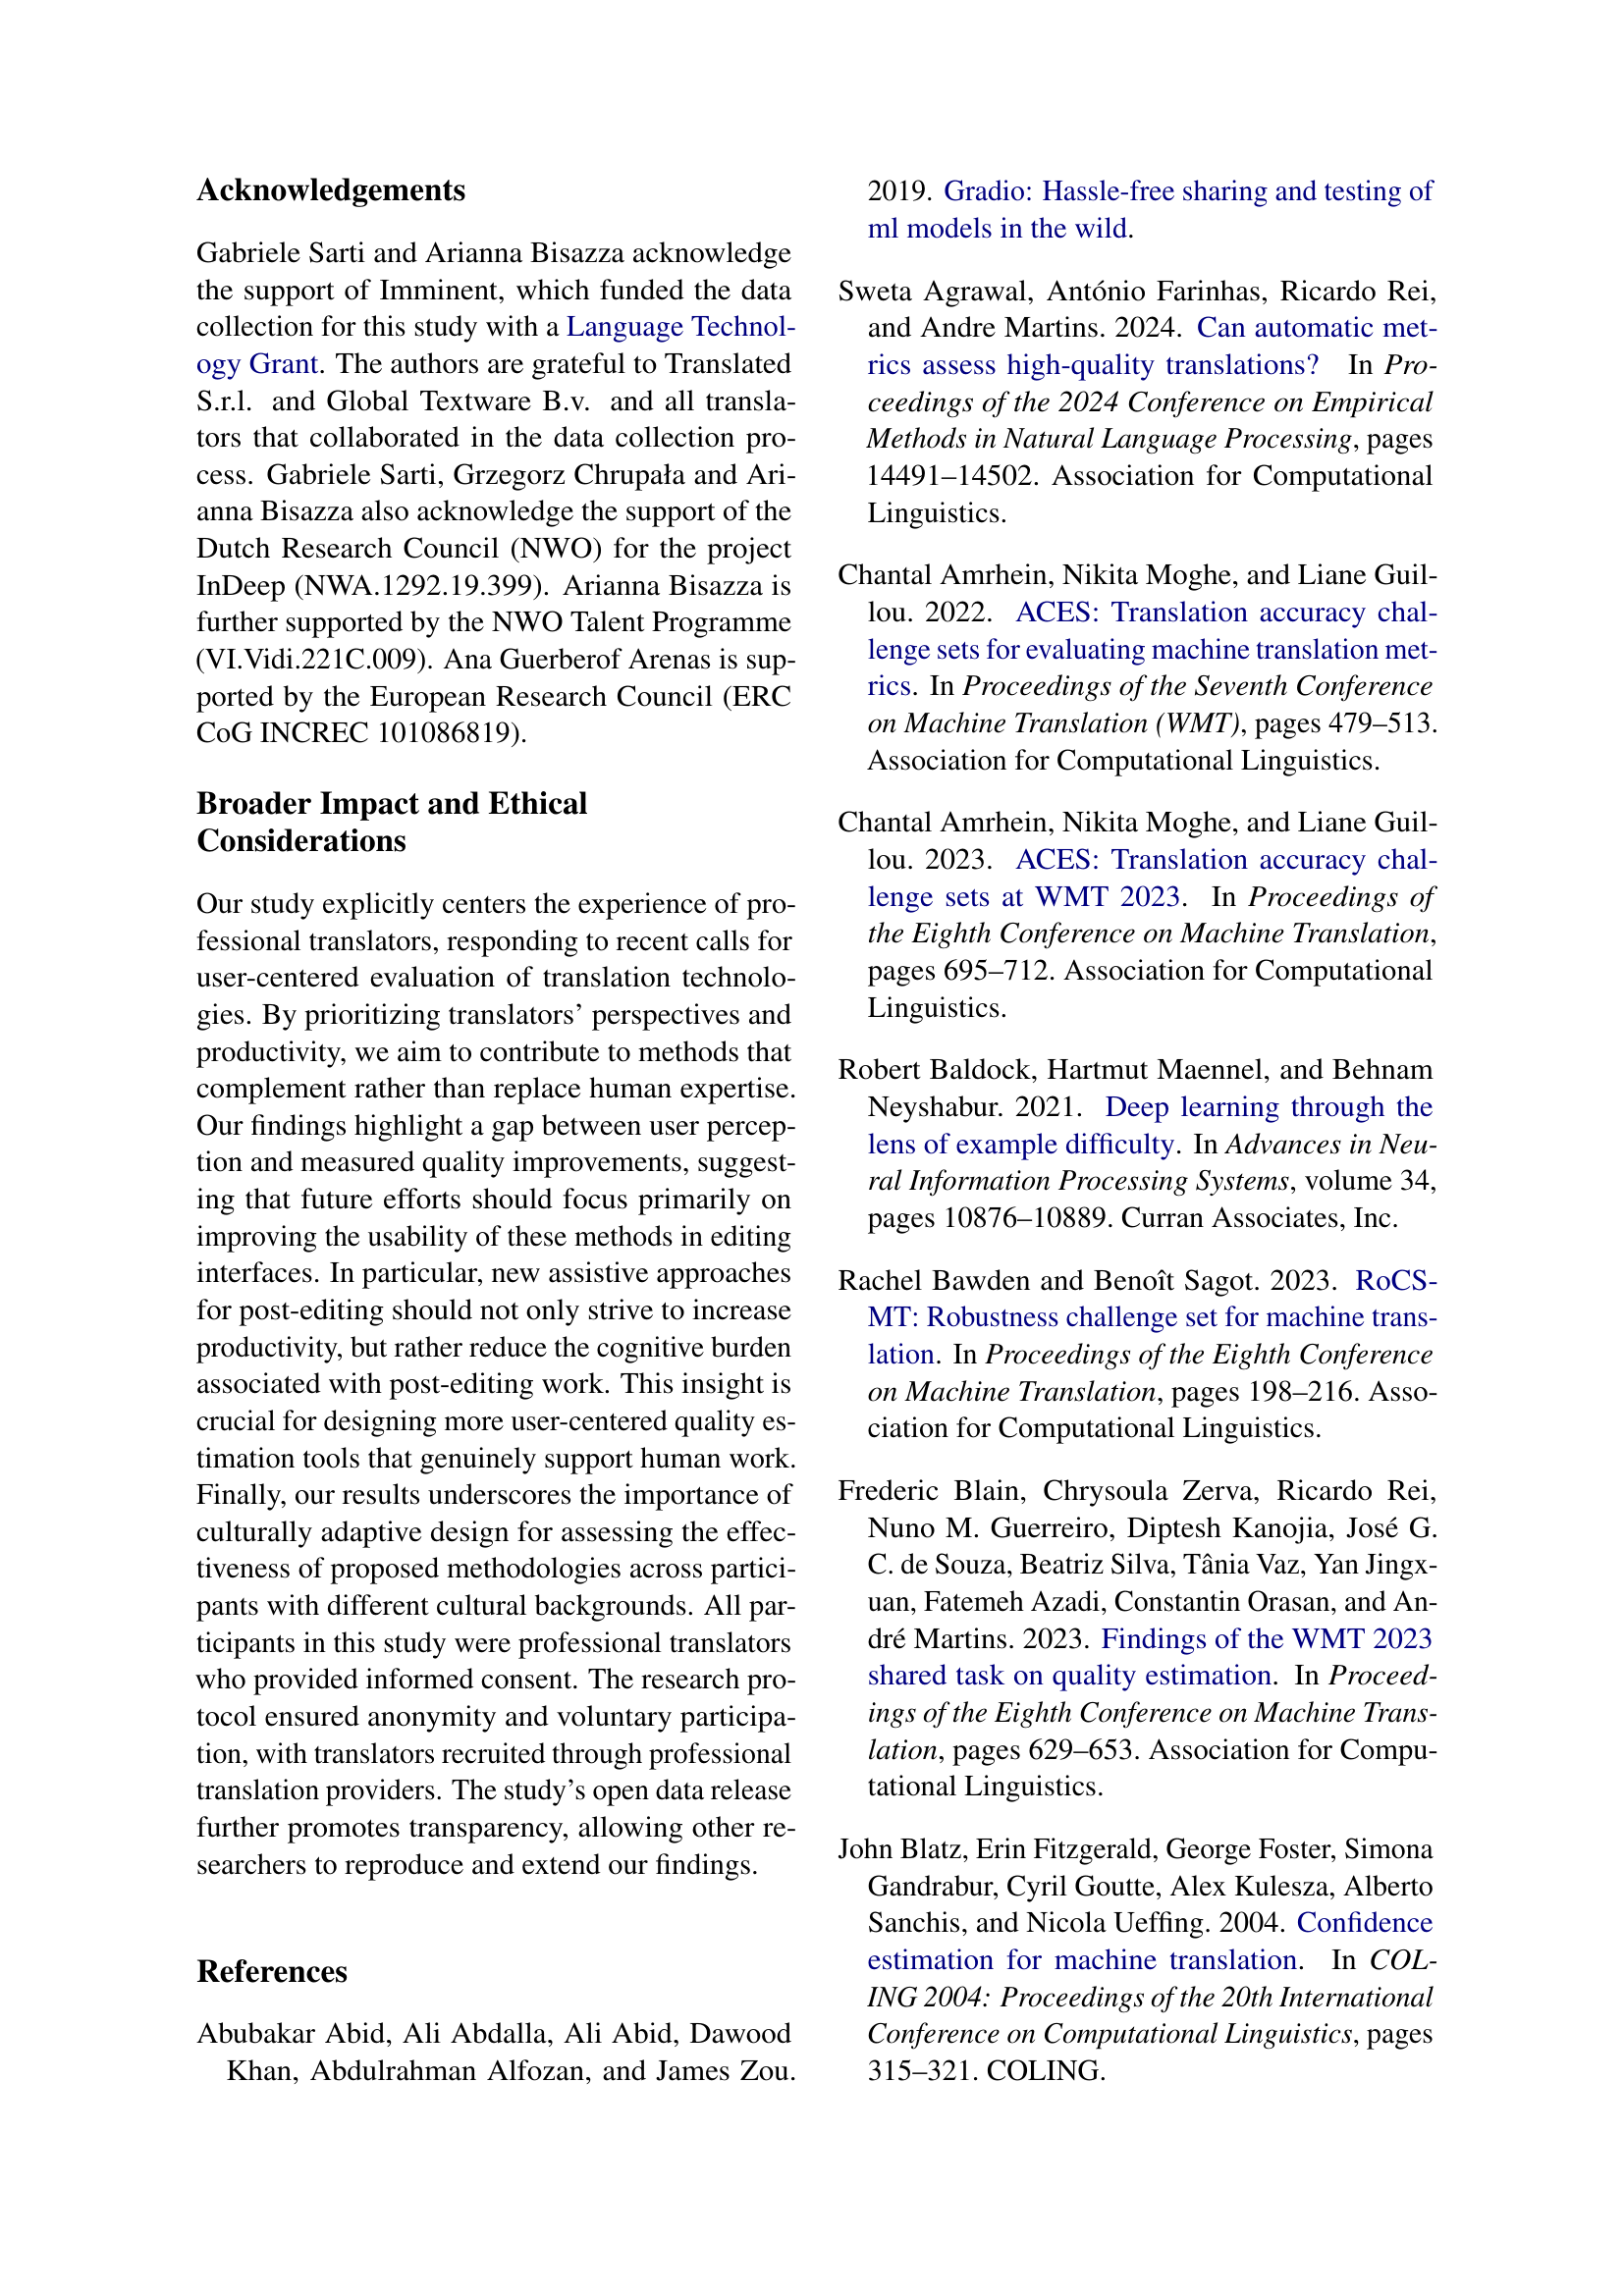
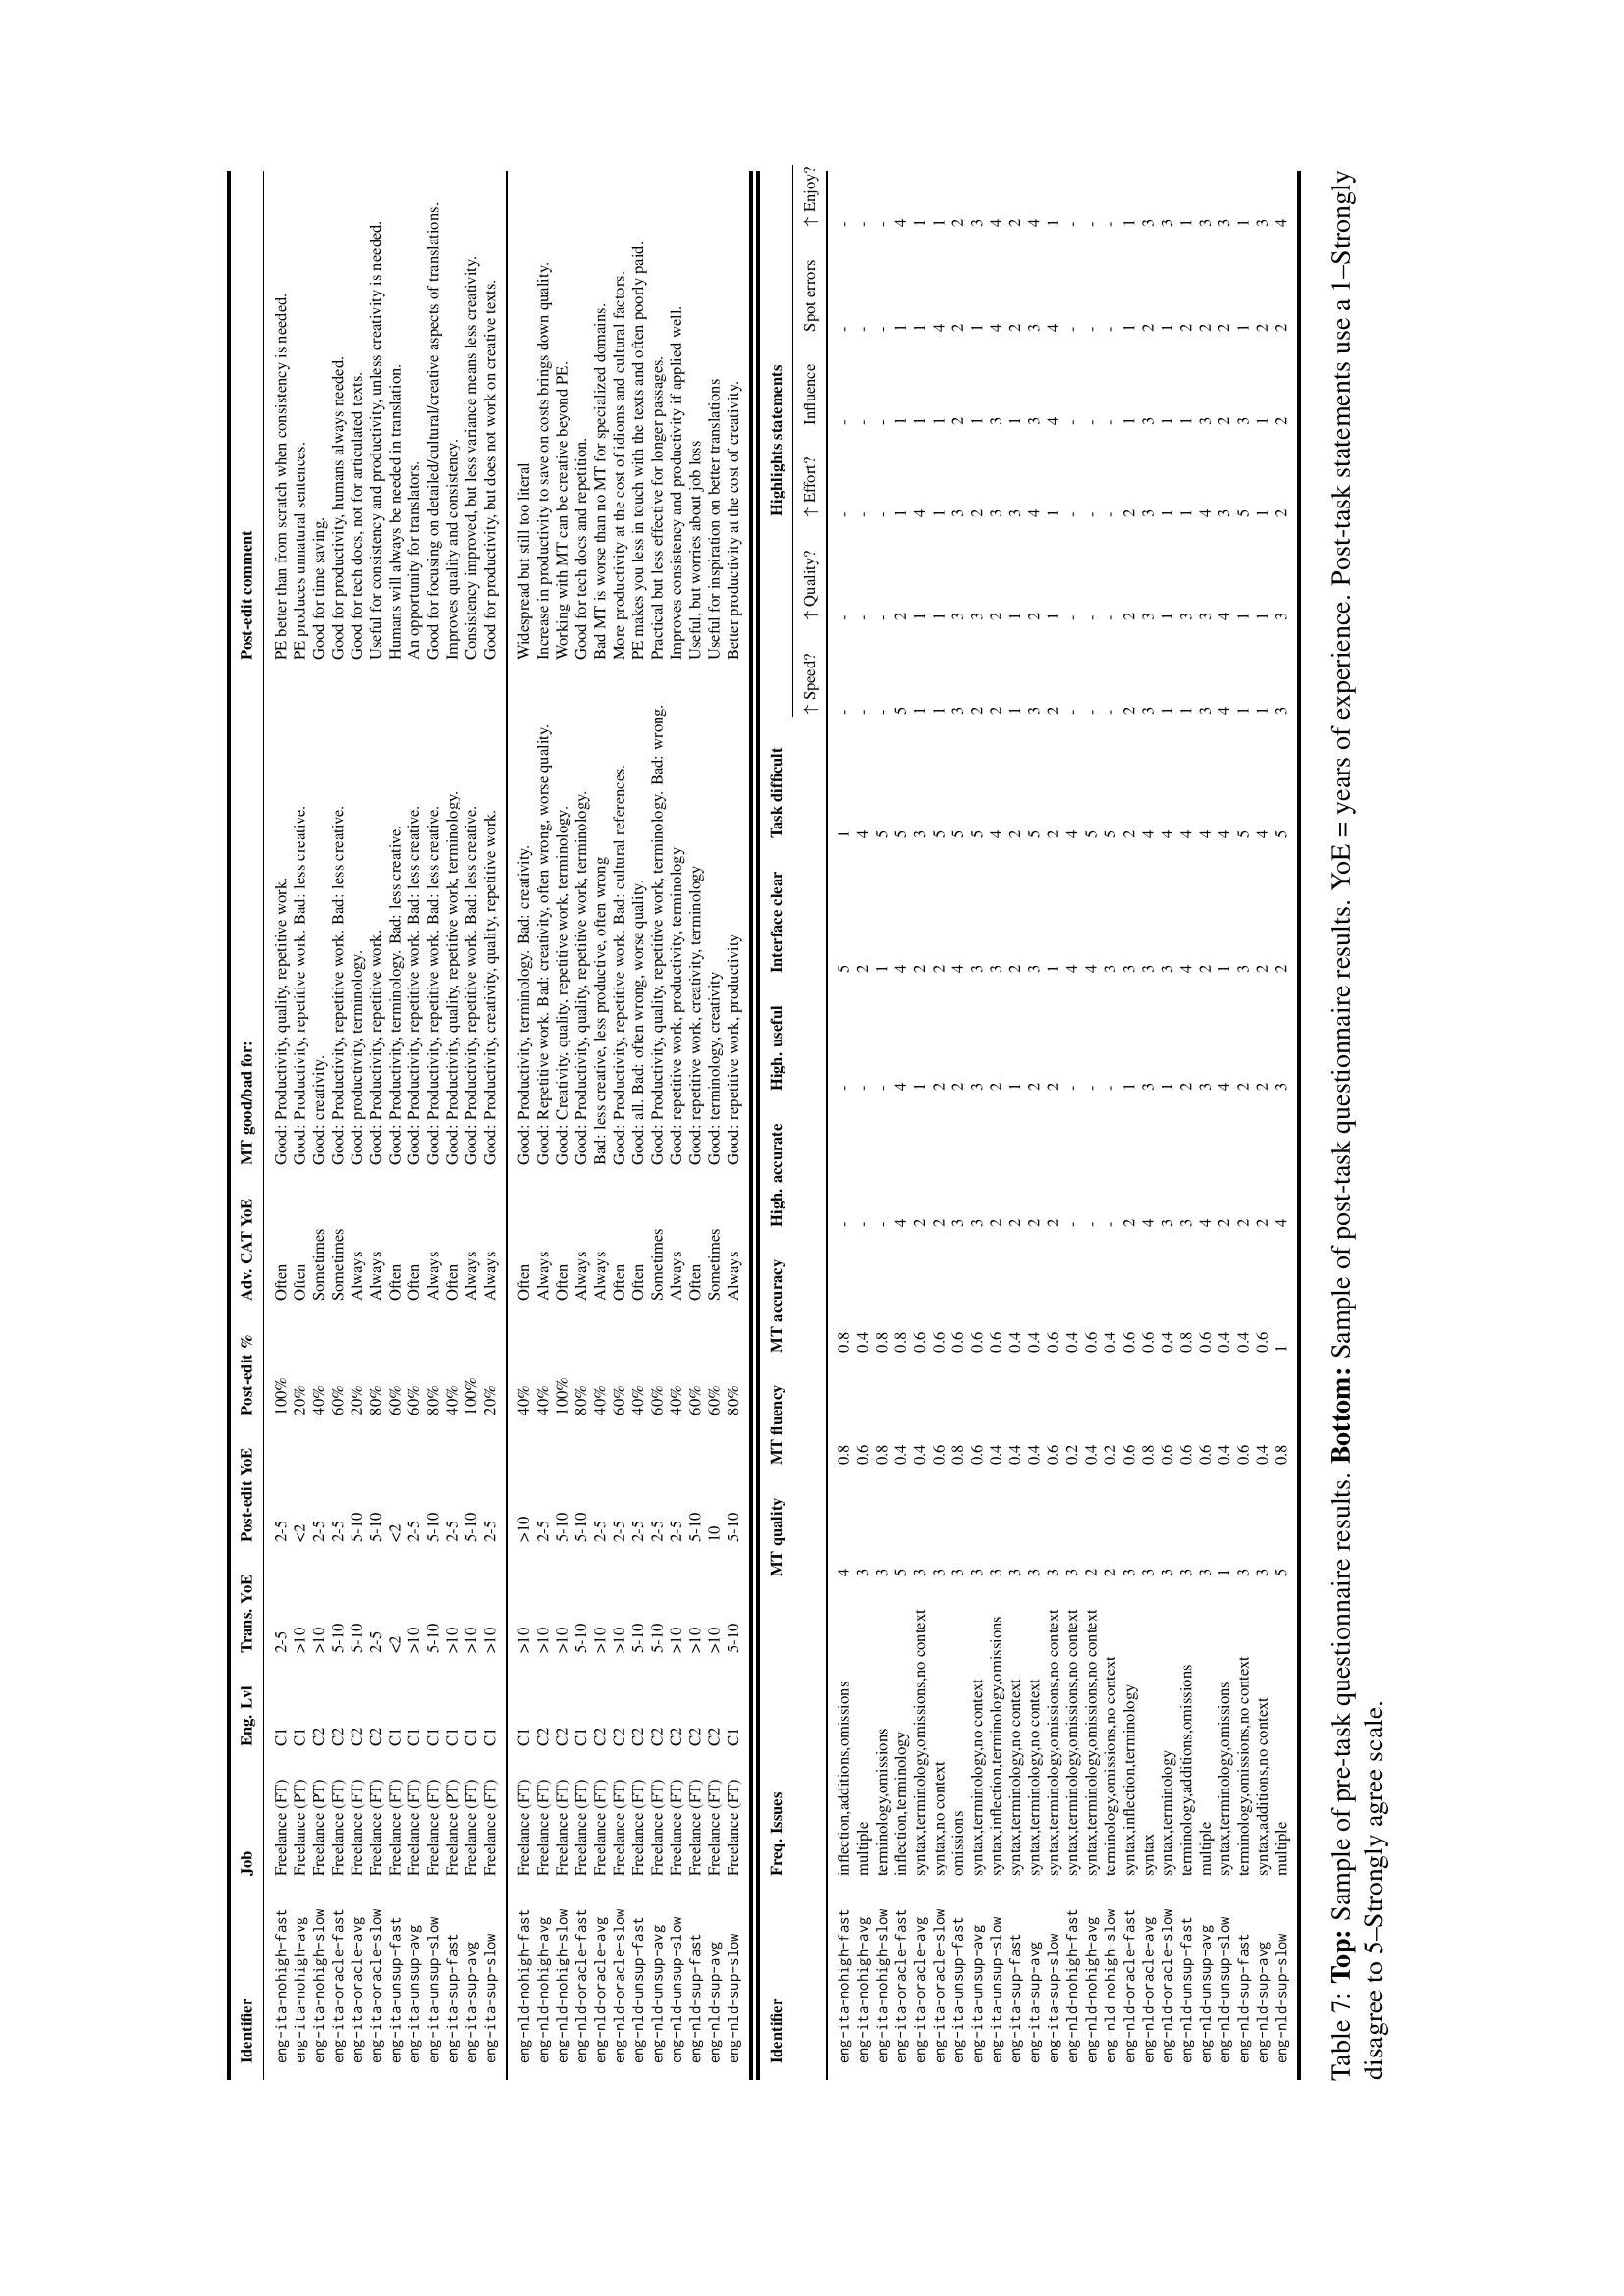
🔼 This table presents the results of a post-task questionnaire administered to professional translators after they completed the main translation task. The questionnaire assessed their perceptions of various aspects of the machine translation (MT) outputs and the provided highlighting modalities (No Highlight, Oracle, Unsupervised, and Supervised). The responses were rated on a 5-point Likert scale (1-Strongly disagree to 5-Strongly agree). Each column shows the average score across three translators per language direction for each highlight modality.
read the caption
Table 2: Post-task questionnaire responses. Columns are averaged (1–Strongly disagree to 5–Strongly agree) across n=3𝑛3n=3italic_n = 3 translators per language for No Highlight, Oracle, Unsupervised, and Supervised.
| Doc ID - Seg. ID | Source text | Target text | Proposed correction | Error Annotation | Score | ||
| Description | Category | Severity | |||||
| 9-1 | Specifying peri- and postnatal factors in children born very preterm (VPT) that affect later outcome helps to improve long-term treatment. | Specificare i fattori peri- e postnatali nei bambini nati molto pretermine (VPT) che influenzano il risultato successivo aiuta a migliorare il trattamento a lungo termine. | Specificare i fattori peri- e postnatali nei bambini nati molto pretermine (VPT, Very Preterm) che influenzano il risultato successivo aiuta a migliorare il trattamento a lungo termine. | When we have a foreign acronym, the usual rule is to indicate also the whole term the first time it appears. | Readability | Minor | 90 |
| 9-2 | To enhance the predictability of 5-year cognitive outcome by perinatal, 2-year developmental and socio-economic data. | Migliorare la prevedibilità del risultato cognitivo a 5 anni mediante dati perinatali, di sviluppo e socioeconomici a 2 anni. | 100 | ||||
| 9-3 | 5-year infants born VPT were compared to 34 term controls. | I neonati di 5 anni nati VPT sono stati confrontati con 34 nati a termine come controllo. | I neonati di 5 anni nati VPT sono stati confrontati con 34 controlli a termine. | Mistranslation | Minor | 70 | |
| 9-4 | The IQ of 5-year infants born VPT was 10 points lower than that of term controls and influenced independently by preterm birth and SES. | Il QI dei bambini di 5 anni nati VPT era di 10 punti inferiore a quello dei nati a termine di controllo, e influenzato indipendentemente dalla nascita pretermine e dai dati SES. | Il QI dei bambini di 5 anni nati VPT era di 10 punti inferiore a quello dei nati a termine e influenzato indipendentemente dalla nascita pretermine e dallo stato socioeconomico (SES). | Mistranslation | Minor | 70 | |
| Il QI dei bambini di 5 anni nati VPT era di 10 punti inferiore a quello dei nati a termine di controllo, e influenzato indipendentemente dalla nascita pretermine e dai dati SES. | Il QI dei bambini di 5 anni nati VPT era di 10 punti inferiore a quello dei nati a termine e influenzato indipendentemente dalla nascita pretermine e dallo stato socioeconomico (SES). | Unexplained acronym. Non-expert people could have trouble understanding the meaning. | Untranslated | Minor | |||
| 52-1 | But with less than 3 months to go for that, I feel I’m not ready yet, but having never taken it, I have nothing to compare it to besides colleagues’ advice. | Ma con meno di 3 mesi per farlo, sento di non essere ancora pronto, ma non l’ho mai preso, non ho nulla con cui confrontarlo oltre ai consigli dei colleghi. | Ma con meno di 3 mesi per farlo, sento di non essere ancora pronto, e non avendolo mai fatto, non ho nulla con cui confrontarlo oltre ai consigli dei colleghi. | Mistranslation | Major | 30 | |
| 52-2 | Without knowing what I know, they can’t know if I’m actually ready yet, but many of them are pushing me to sign up for it. | Senza sapere quello che so, non possono sapere se sono ancora pronta, ma molti di loro mi stanno spingendo a iscrivermi. | Se non hanno idea di quanto sappia, non possono sapere se sono davvero pronta, ma molti di loro mi stanno spingendo a iscrivermi. | Readability | Minor | 60 | |
| Senza sapere quello che so, non possono sapere se sono ancora pronta, ma molti di loro mi stanno spingendo a iscrivermi. | Se non hanno idea di quanto sappia, non possono sapere se sono davvero pronta, ma molti di loro mi stanno spingendo a iscrivermi. | Mistranslation | Minor | ||||
| 52-3 | I’m close… I just don’t know if I’m 2 months study close. | Ci sono quasi… solo che non so se ce la farò in soli 2 mesi, ma penso di potercela fare. | Ci sono quasi… solo che non so se ce la farò in soli 2 mesi. | Addition | Major | 20 | |
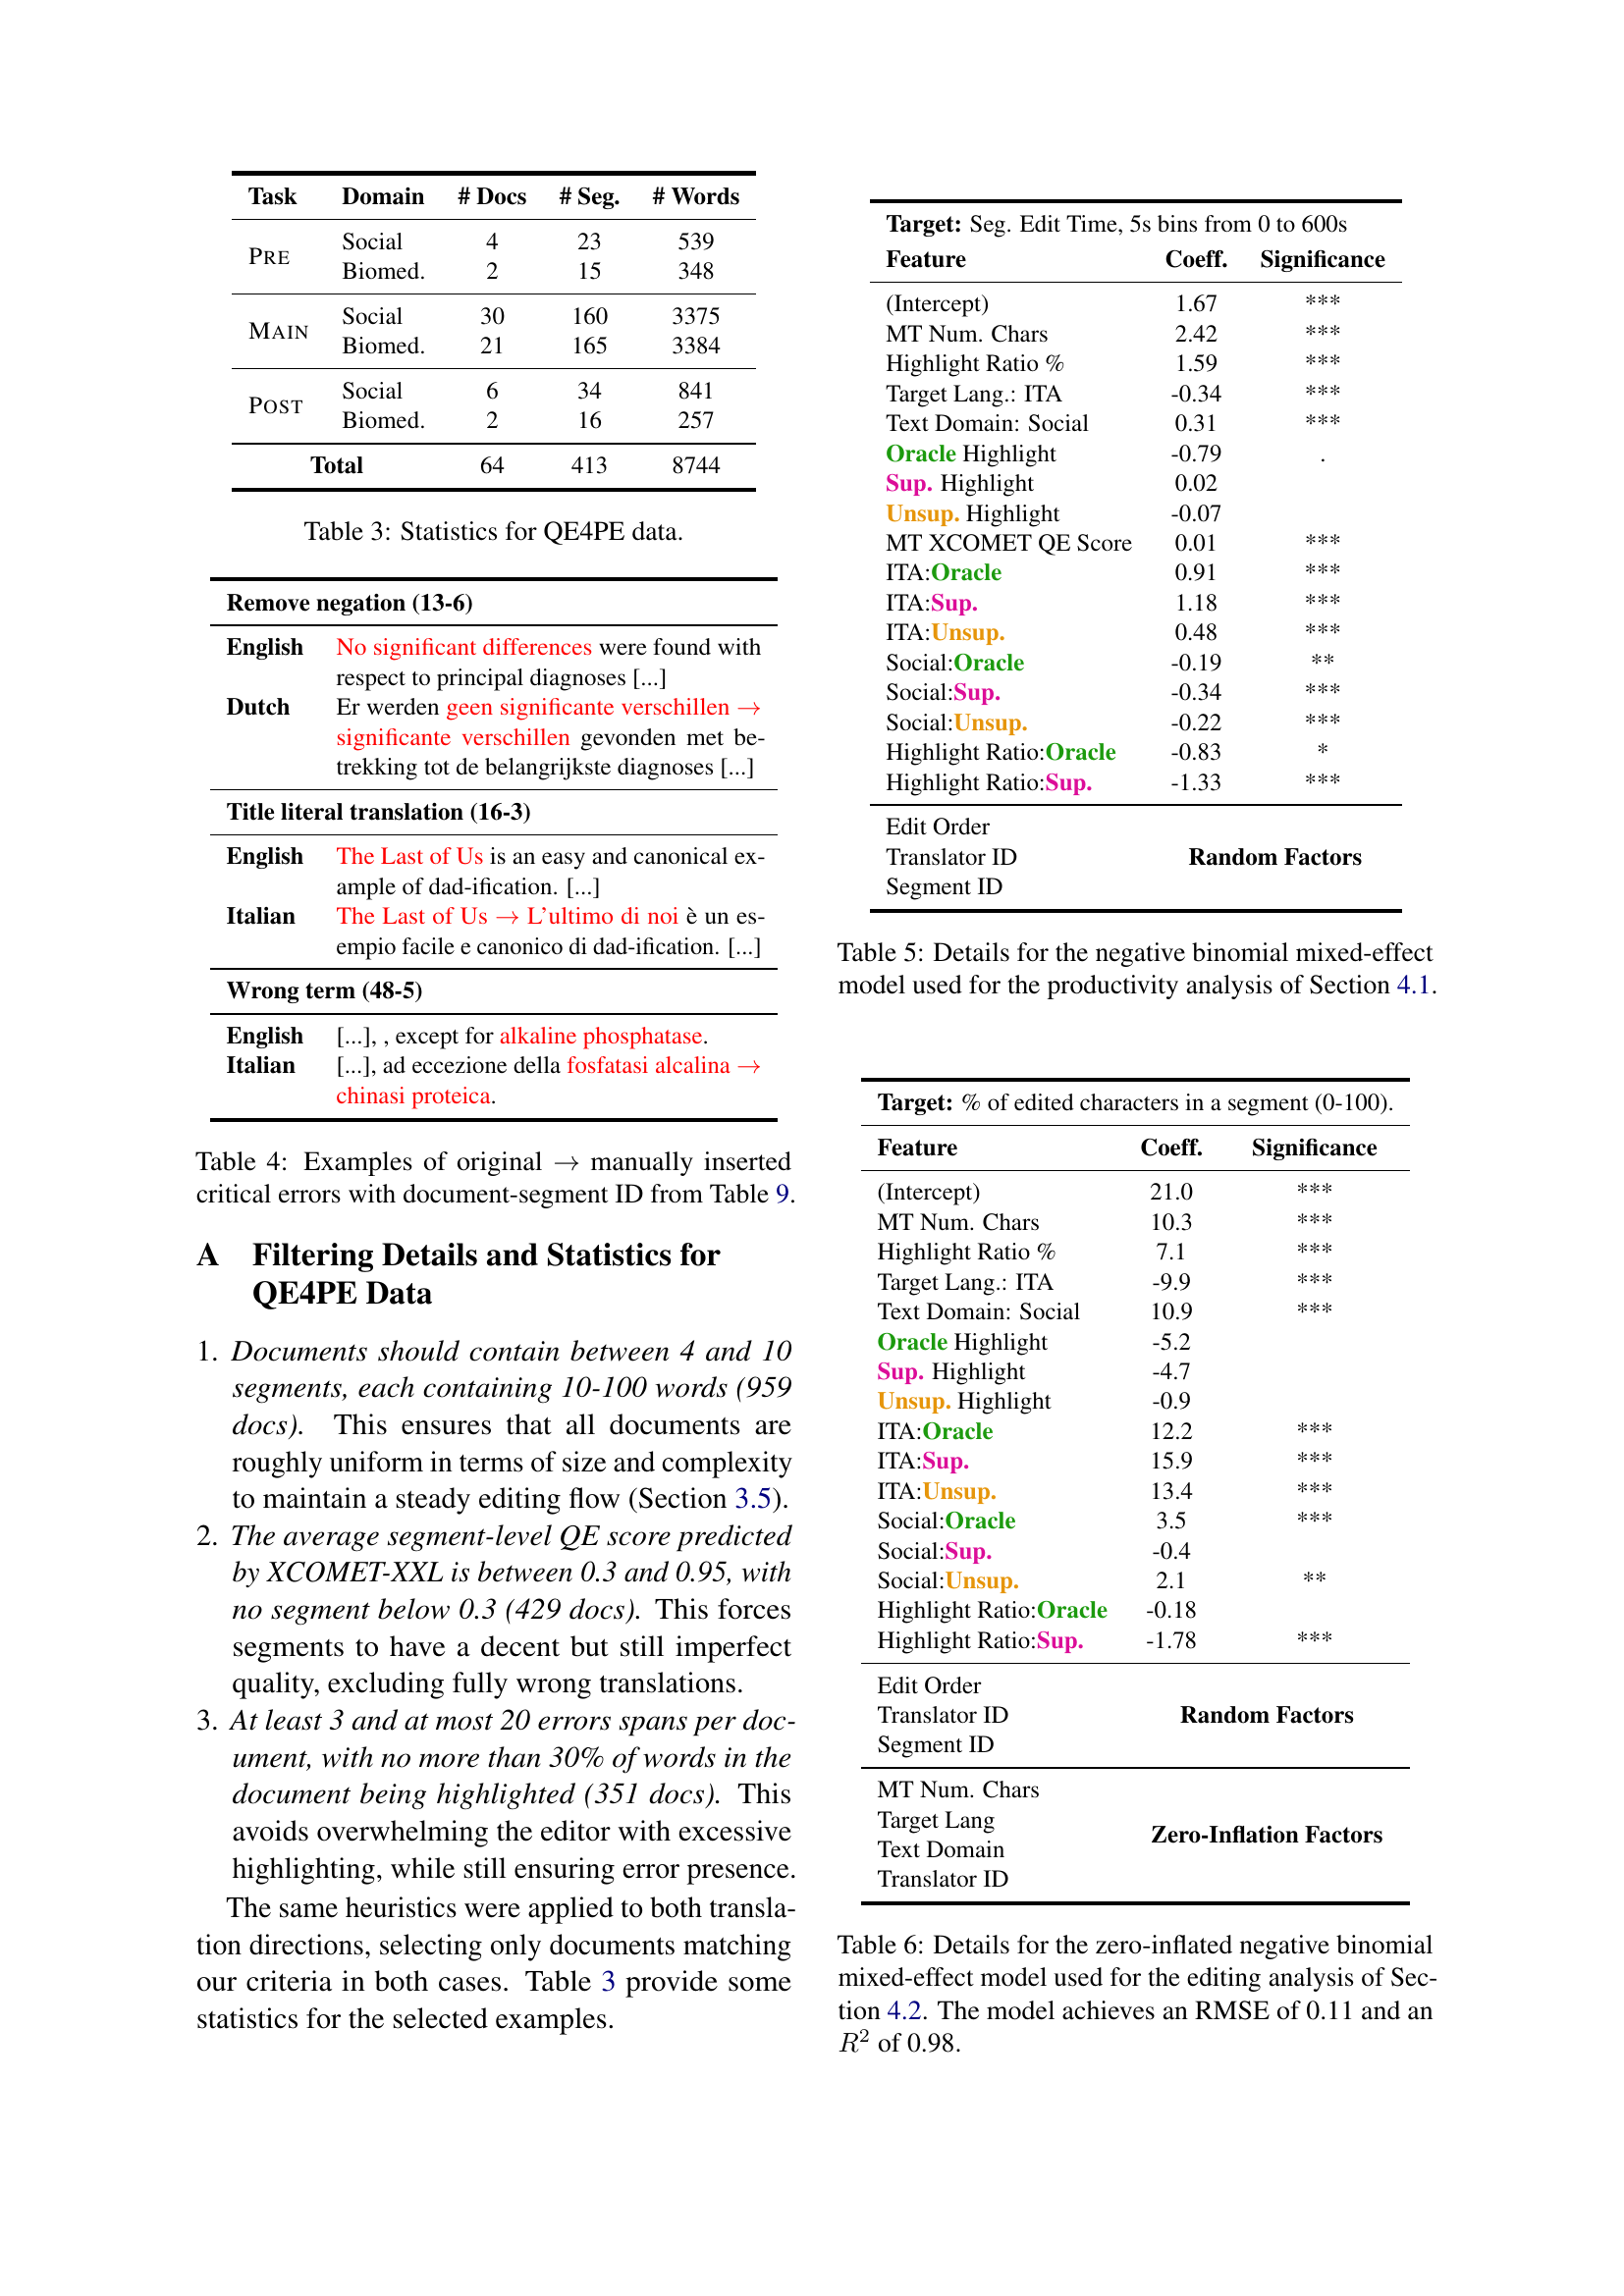
🔼 This table presents a summary of the dataset used in the QE4PE study. It shows the number of documents, segments, and words for each stage of the study (Pretask, Main Task, Post-task) and for both domains (Social Media and Biomedical). The data is broken down by language pair (English-Italian and English-Dutch). This dataset was used to evaluate the impact of different word-level quality estimation highlight modalities on post-editing performance by professional translators.
read the caption
Table 3: Statistics for QE4PE data.
| Error category | Subcategory | Description |
|
Accuracy Incorrect meaning has been transferred to the source text. | Addition | Translation includes the information that is not present in the source and it changes or distorts the original message. |
| Omission | Translation is missing the information that is present in the source, which is important to convey the message. | |
| Mistranslation | Translation does not accurately represent the source content meaning. | |
| Inconsistency | There are internal inconsistencies in the translation (for example, using different verb forms in the bullet list or in CTAs, calling the same UI element differently, terminology used inconsistently etc). | |
| Untranslated | Content that should have been translated has been left untranslated. | |
|
Linguistic Official linguistic reference sources such as grammar books. | Punctuation | Punctuation is used incorrectly (for the locale or style), including missing or extra white spaces and the incorrect use of space (non-breaking space). Violation of typographic conventions of the locale. |
| Spelling | Issues related to spelling of words, including typos, wrong word hyphenation, word breaks and capitalization. | |
| Grammar | Issues related to the grammar or syntax of the text, other than spelling. | |
|
Style Not suitable/native; too literal or awkward. | Inconsistent Style | Style is inconsistent within a text. |
| Readability | Translation does not read well (due to heavy sentence structure, frequent repetitions, unidiomatic). | |
| Wrong Register | Inappropriate style for the specific subject field, the level of formality, and the mode of discourse (e.g., written text versus transcribed speech). |
🔼 This table presents examples of manually introduced errors in the study’s data. Each row shows an original sentence, a manually edited (incorrect) version of that sentence, and the document and segment IDs where the error occurs (referencing Table 9 for those IDs). The examples illustrate different types of errors introduced, including negation errors, wrong term usage, and literal translations. These errors were introduced to assess the effectiveness of different highlight modalities in helping post-editors identify and correct critical issues.
read the caption
Table 4: Examples of original →→\rightarrow→ manually inserted critical errors with document-segment ID from Table 9.
| Severity level | Description |
| Major | The Severity Level of an error that seriously affects the understandability, reliability, or usability of the content for its intended purpose or hinders the proper use of the product or service due to a significant loss or change in meaning or because the error appears in a highly visible or important part of the content. |
| Minor | The Severity Level of an error that does not seriously impede the usability, understandability, or reliability of the content for its intended purpose, but has a limited impact on, for example, accuracy, stylistic quality, consistency, fluency, clarity, or general appeal of the content. |
| Neutral | The Severity Level of an error that differs from a quality evaluator’s preferential translation or that is flagged for the translator’s attention but is an acceptable translation. |
🔼 This table presents the details of the negative binomial mixed-effect statistical model employed in Section 4.1 to analyze the impact of different highlight modalities on post-editor productivity. It lists the variables included in the model (intercept, MT character count, highlight ratio, target language, text domain, and various highlight modality indicators), their coefficients, and the statistical significance of those coefficients. The model helps determine which factors significantly affect the speed at which post-editors complete their work.
read the caption
Table 5: Details for the negative binomial mixed-effect model used for the productivity analysis of Section 4.1.
| Task | Domain | # Docs | # Seg. | # Words |
| Pre | Social | 4 | 23 | 539 |
| Biomed. | 2 | 15 | 348 | |
| Main | Social | 30 | 160 | 3375 |
| Biomed. | 21 | 165 | 3384 | |
| Post | Social | 6 | 34 | 841 |
| Biomed. | 2 | 16 | 257 | |
| Total | 64 | 413 | 8744 | |
🔼 This table details the statistical model used to analyze how various factors influence the amount of editing done by human post-editors in the study. It specifically focuses on the zero-inflated negative binomial mixed-effect model, which accounts for both the number of edits and the fact that many segments might have zero edits. Key variables included in the model are the number of characters in the machine translation output, the percentage of characters highlighted, the language pair, the type of text (biomedical or social media), the specific highlight modality used (oracle, supervised, or unsupervised), the order in which editors completed the tasks, the unique translator ID, and the segment ID. The model’s performance is measured by its root mean square error (RMSE) and R-squared (R²) values; in this instance, the model achieved an RMSE of 0.11 and an R² of 0.98, indicating a high level of accuracy and a strong fit.
read the caption
Table 6: Details for the zero-inflated negative binomial mixed-effect model used for the editing analysis of Section 4.2. The model achieves an RMSE of 0.11 and an R2superscript𝑅2R^{2}italic_R start_POSTSUPERSCRIPT 2 end_POSTSUPERSCRIPT of 0.98.
| Remove negation (13-6) | |
| English | No significant differences were found with respect to principal diagnoses […] |
| Dutch | Er werden geen significante verschillen significante verschillen gevonden met betrekking tot de belangrijkste diagnoses […] |
| Title literal translation (16-3) | |
| English | The Last of Us is an easy and canonical example of dad-ification. […] |
| Italian | The Last of Us L’ultimo di noi è un esempio facile e canonico di dad-ification. […] |
| Wrong term (48-5) | |
| English | […], , except for alkaline phosphatase. |
| Italian | […], ad eccezione della fosfatasi alcalina chinasi proteica. |
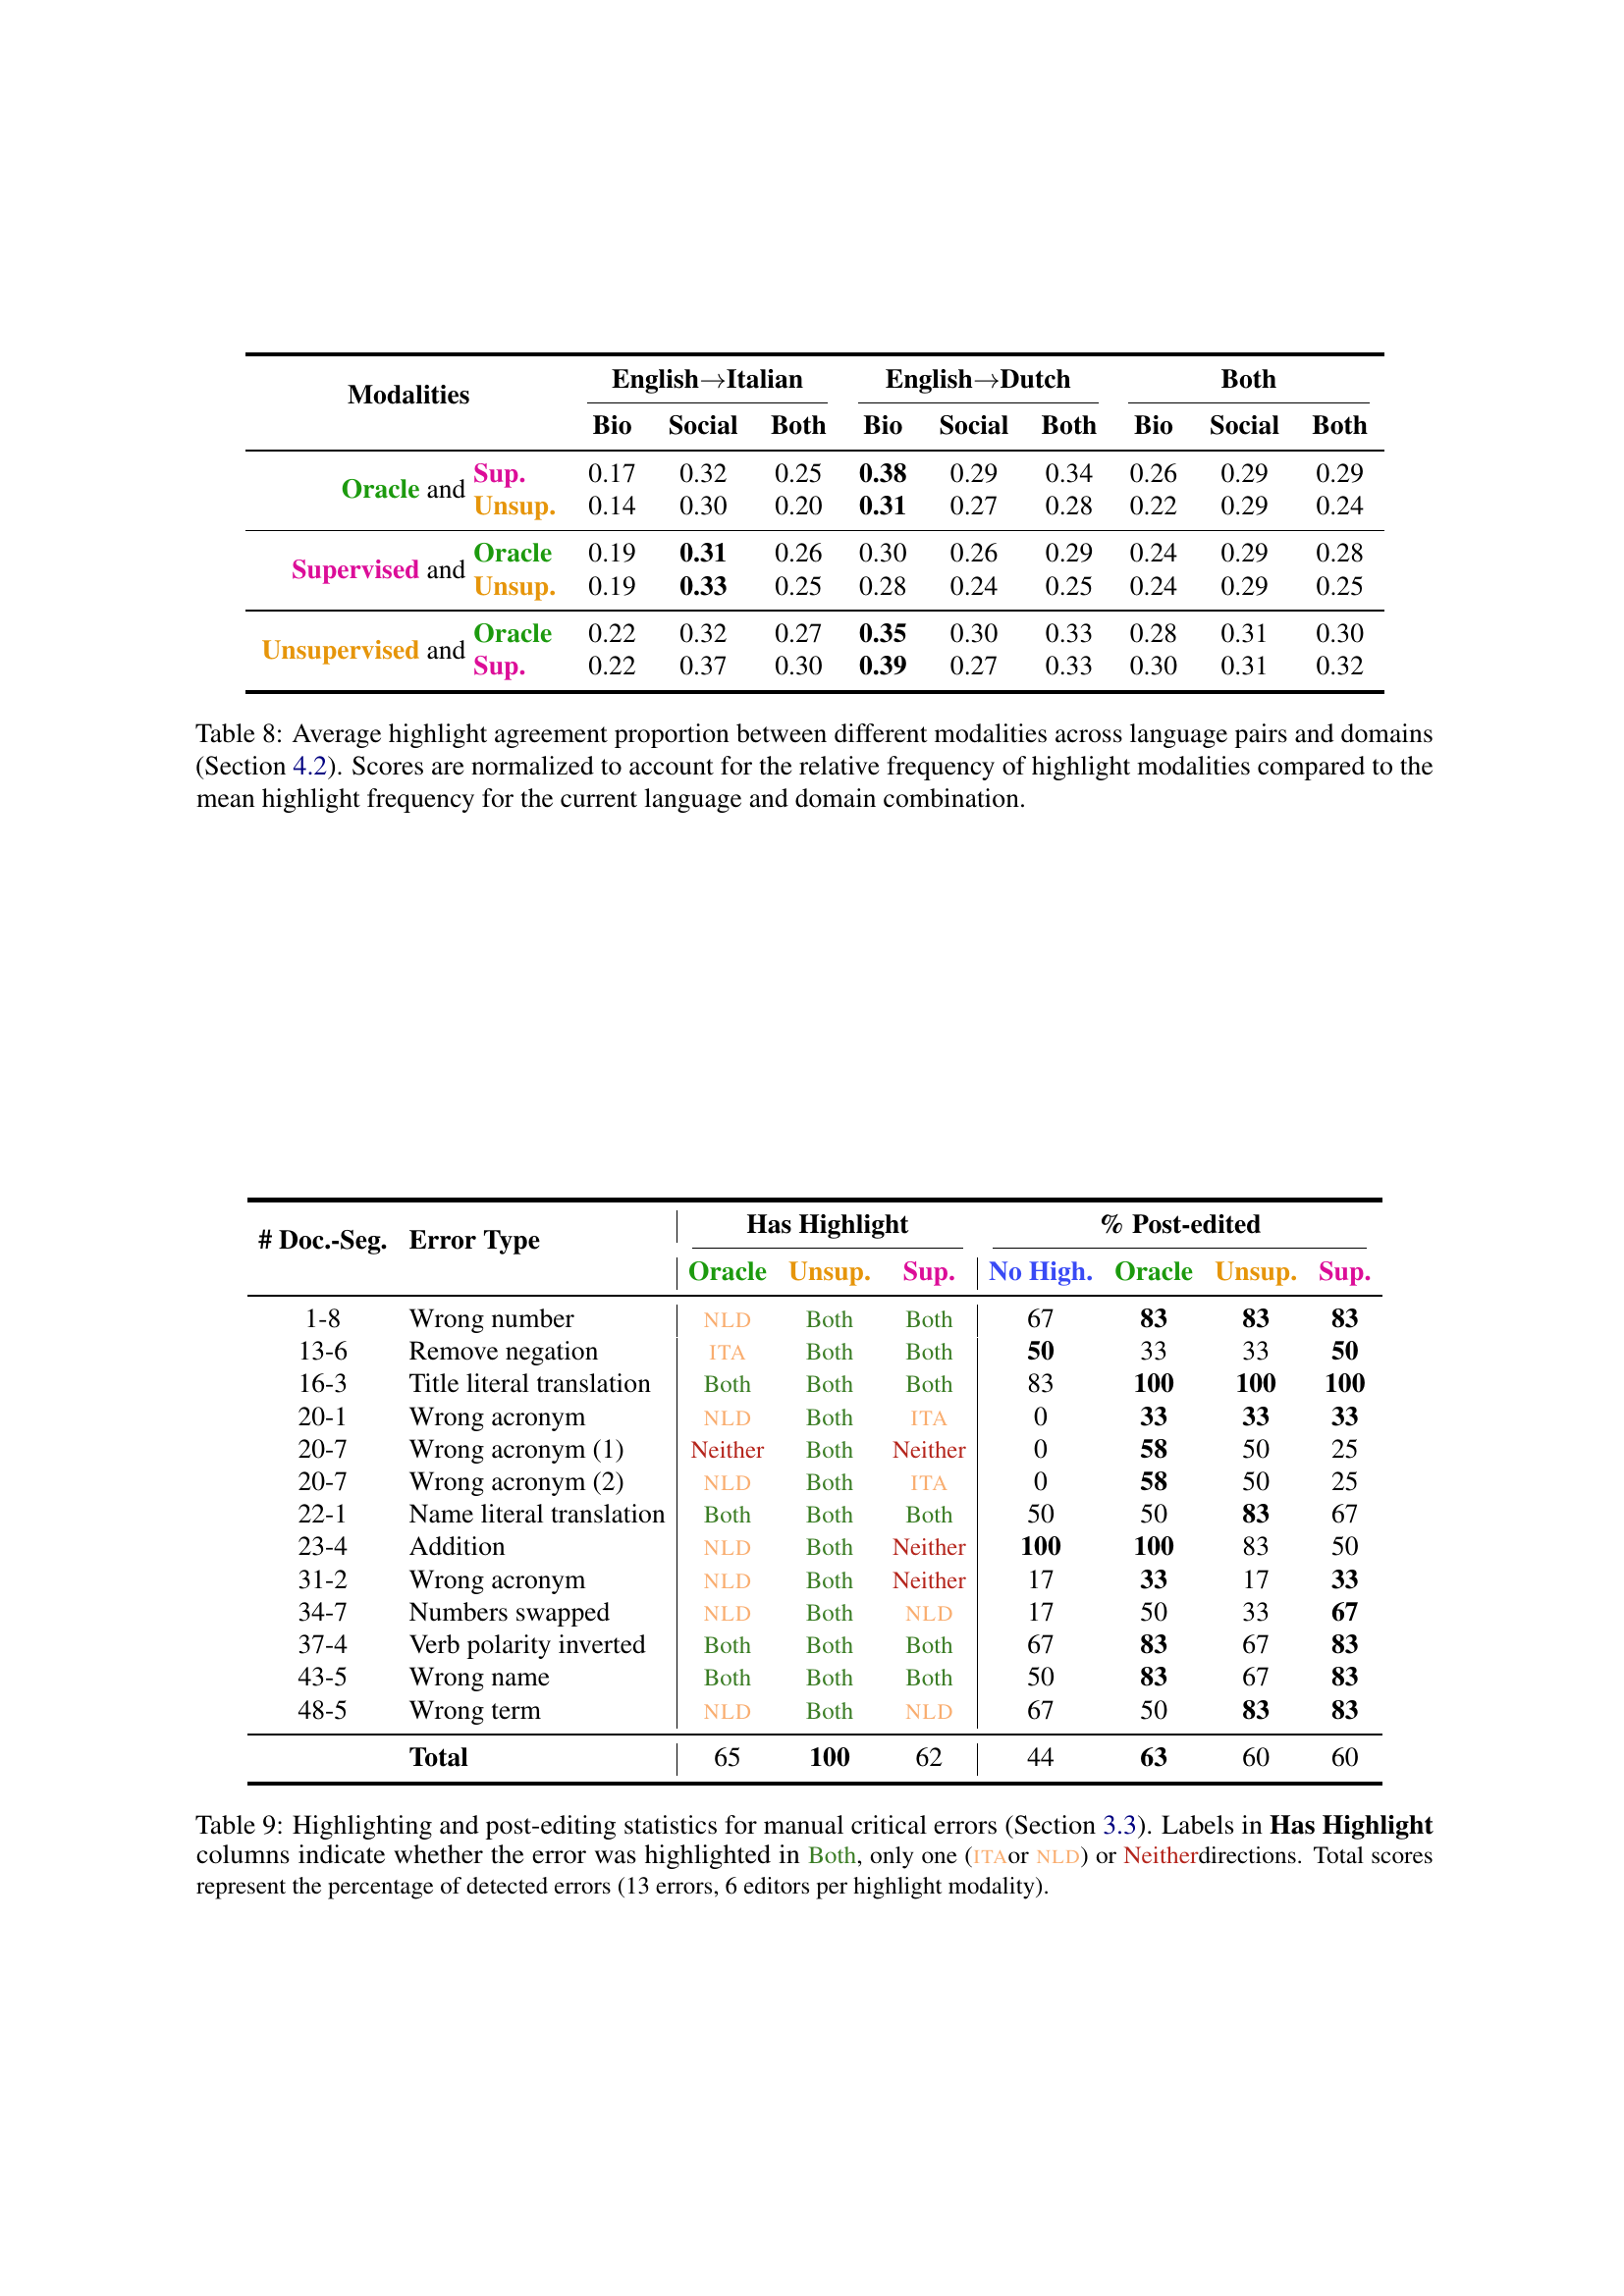
🔼 This table displays the degree of overlap between different word-level quality estimation (QE) highlight modalities. The modalities compared are Oracle, Supervised, and Unsupervised QE highlights, and a No Highlight baseline. The overlap is calculated for both English-Italian and English-Dutch translation directions and across two domains (Biomedical and Social Media). Importantly, the scores have been normalized to account for the varying frequencies of highlights across the different methods, making it easier to compare the relative agreement among them regardless of the overall number of highlights used.
read the caption
Table 8: Average highlight agreement proportion between different modalities across language pairs and domains (Section 4.2). Scores are normalized to account for the relative frequency of highlight modalities compared to the mean highlight frequency for the current language and domain combination.
| Target: Seg. Edit Time, 5s bins from 0 to 600s | ||
| Feature | Coeff. | Significance |
| (Intercept) | 1.67 | *** |
| MT Num. Chars | 2.42 | *** |
| Highlight Ratio % | 1.59 | *** |
| Target Lang.: ITA | -0.34 | *** |
| Text Domain: Social | 0.31 | *** |
| Oracle Highlight | -0.79 | . |
| Sup. Highlight | 0.02 | |
| Unsup. Highlight | -0.07 | |
| MT XCOMET QE Score | 0.01 | *** |
| ITA:Oracle | 0.91 | *** |
| ITA:Sup. | 1.18 | *** |
| ITA:Unsup. | 0.48 | *** |
| Social:Oracle | -0.19 | ** |
| Social:Sup. | -0.34 | *** |
| Social:Unsup. | -0.22 | *** |
| Highlight Ratio:Oracle | -0.83 | * |
| Highlight Ratio:Sup. | -1.33 | *** |
| Edit Order | Random Factors | |
| Translator ID | ||
| Segment ID | ||
🔼 This table presents the results of a manual evaluation of how well different word-level quality estimation (QE) highlight modalities helped post-editors identify and correct intentionally introduced critical errors in machine translation (MT) outputs. The table shows, for each of the 13 inserted errors and four QE highlight modalities (No Highlight, Oracle, Unsupervised, Supervised), whether the error was highlighted in both translation directions (English-Italian and English-Dutch), only one direction, or neither. The ‘Total’ row shows the percentage of errors correctly identified by each method. This percentage represents the proportion of errors that at least one of the six post-editors successfully identified for each QE modality.
read the caption
Table 9: Highlighting and post-editing statistics for manual critical errors (Section 3.3). Labels in Has Highlight columns indicate whether the error was highlighted in Both, only one (itaor nld) or Neitherdirections. Total scores represent the percentage of detected errors (13 errors, 6 editors per highlight modality).
| Target: % of edited characters in a segment (0-100). | ||
| Feature | Coeff. | Significance |
| (Intercept) | 21.0 | *** |
| MT Num. Chars | 10.3 | *** |
| Highlight Ratio % | 7.1 | *** |
| Target Lang.: ITA | -9.9 | *** |
| Text Domain: Social | 10.9 | *** |
| Oracle Highlight | -5.2 | |
| Sup. Highlight | -4.7 | |
| Unsup. Highlight | -0.9 | |
| ITA:Oracle | 12.2 | *** |
| ITA:Sup. | 15.9 | *** |
| ITA:Unsup. | 13.4 | *** |
| Social:Oracle | 3.5 | *** |
| Social:Sup. | -0.4 | |
| Social:Unsup. | 2.1 | ** |
| Highlight Ratio:Oracle | -0.18 | |
| Highlight Ratio:Sup. | -1.78 | *** |
| Edit Order | Random Factors | |
| Translator ID | ||
| Segment ID | ||
| MT Num. Chars | Zero-Inflation Factors | |
| Target Lang | ||
| Text Domain | ||
| Translator ID | ||
🔼 This table presents the results of analyzing highlighting and editing statistics. It shows the probability of highlights (P(H)), the probability of edits (P(E)), and the conditional probabilities of edits given highlights (P(E|H)) and edits not given highlights (P(E|¬H)). It also displays the likelihood ratios (ΛE and ΛH) which represent how much more likely an edit is to occur within a highlighted span, and how much more likely it is for a highlighted span to contain an edit. This analysis is done across different domains (Biomedical and Social Media), highlight modalities (Oracle, Unsupervised, and Supervised), and translation directions (English-Italian and English-Dutch). Results are provided for both the measured edits (the actual edits observed) and projected edits (edits estimated by applying highlights from other modalities to the No-Highlight condition) to examine highlight-induced bias. Finally, the F1 score for each highlight modality is included to measure the overall performance. Each data point represents the average values from three post-editors.
read the caption
Table 10: Highlighting (H𝐻Hitalic_H) and editing (E𝐸Eitalic_E) statistics for each domain, modality and translation direction combination (n=3𝑛3n=3italic_n = 3 post-editors per combination). Values after slashes are adjusted by projecting highlights of the specified modality over edits from No Highlight translators to estimate highlight-induced editing biases (Section 4.2). A Random baseline is added by projecting random highlights matching the average frequency over all modalities for specific domain and translation direction settings.
| Identifier | Job | Eng. Lvl | Trans. YoE | Post-edit YoE | Post-edit % | Adv. CAT YoE | MT good/bad for: | Post-edit comment |
| eng-ita-nohigh-fast | Freelance (FT) | C1 | 2-5 | 2-5 | 100% | Often | Good: Productivity, quality, repetitive work. | PE better than from scratch when consistency is needed. |
| eng-ita-nohigh-avg | Freelance (PT) | C1 | >10 | <2 | 20% | Often | Good: Productivity, repetitive work. Bad: less creative. | PE produces unnatural sentences. |
| eng-ita-nohigh-slow | Freelance (PT) | C2 | >10 | 2-5 | 40% | Sometimes | Good: creativity. | Good for time saving. |
| eng-ita-oracle-fast | Freelance (FT) | C2 | 5-10 | 2-5 | 60% | Sometimes | Good: Productivity, repetitive work. Bad: less creative. | Good for productivity, humans always needed. |
| eng-ita-oracle-avg | Freelance (FT) | C2 | 5-10 | 5-10 | 20% | Always | Good: productivity, terminology. | Good for tech docs, not for articulated texts. |
| eng-ita-oracle-slow | Freelance (FT) | C2 | 2-5 | 5-10 | 80% | Always | Good: Productivity, repetitive work. | Useful for consistency and productivity, unless creativity is needed. |
| eng-ita-unsup-fast | Freelance (FT) | C1 | <2 | <2 | 60% | Often | Good: Productivity, terminology. Bad: less creative. | Humans will always be needed in translation. |
| eng-ita-unsup-avg | Freelance (FT) | C1 | >10 | 2-5 | 60% | Often | Good: Productivity, repetitive work. Bad: less creative. | An opportunity for translators. |
| eng-ita-unsup-slow | Freelance (FT) | C1 | 5-10 | 5-10 | 80% | Always | Good: Productivity, repetitive work. Bad: less creative. | Good for focusing on detailed/cultural/creative aspects of translations. |
| eng-ita-sup-fast | Freelance (PT) | C1 | >10 | 2-5 | 40% | Often | Good: Productivity, quality, repetitive work, terminology. | Improves quality and consistency. |
| eng-ita-sup-avg | Freelance (FT) | C1 | >10 | 5-10 | 100% | Always | Good: Productivity, repetitive work. Bad: less creative. | Consistency improved, but less variance means less creativity. |
| eng-ita-sup-slow | Freelance (FT) | C1 | >10 | 2-5 | 20% | Always | Good: Productivity, creativity, quality, repetitive work. | Good for productivity, but does not work on creative texts. |
| eng-nld-nohigh-fast | Freelance (FT) | C1 | >10 | >10 | 40% | Often | Good: Productivity, terminology. Bad: creativity. | Widespread but still too literal |
| eng-nld-nohigh-avg | Freelance (FT) | C2 | >10 | 2-5 | 40% | Always | Good: Repetitive work. Bad: creativity, often wrong, worse quality. | Increase in productivity to save on costs brings down quality. |
| eng-nld-nohigh-slow | Freelance (FT) | C2 | >10 | 5-10 | 100% | Often | Good: Creativity, quality, repetitive work, terminology. | Working with MT can be creative beyond PE. |
| eng-nld-oracle-fast | Freelance (FT) | C1 | 5-10 | 5-10 | 80% | Always | Good: Productivity, quality, repetitive work, terminology. | Good for tech docs and repetition. |
| eng-nld-oracle-avg | Freelance (FT) | C2 | >10 | 2-5 | 40% | Always | Bad: less creative, less productive, often wrong | Bad MT is worse than no MT for specialized domains. |
| eng-nld-oracle-slow | Freelance (FT) | C2 | >10 | 2-5 | 60% | Often | Good: Productivity, repetitive work. Bad: cultural references. | More productivity at the cost of idioms and cultural factors. |
| eng-nld-unsup-fast | Freelance (FT) | C2 | 5-10 | 2-5 | 40% | Often | Good: all. Bad: often wrong, worse quality. | PE makes you less in touch with the texts and often poorly paid. |
| eng-nld-unsup-avg | Freelance (FT) | C2 | 5-10 | 2-5 | 60% | Sometimes | Good: Productivity, quality, repetitive work, terminology. Bad: wrong. | Practical but less effective for longer passages. |
| eng-nld-unsup-slow | Freelance (FT) | C2 | >10 | 2-5 | 40% | Always | Good: repetitive work, productivity, terminology | Improves consistency and productivity if applied well. |
| eng-nld-sup-fast | Freelance (FT) | C2 | >10 | 5-10 | 60% | Often | Good: repetitive work, creativity, terminology | Useful, but worries about job loss |
| eng-nld-sup-avg | Freelance (FT) | C2 | >10 | 10 | 60% | Sometimes | Good: terminology, creativity | Useful for inspiration on better translations |
| eng-nld-sup-slow | Freelance (FT) | C1 | 5-10 | 5-10 | 80% | Always | Good: repetitive work, productivity | Better productivity at the cost of creativity. |
🔼 This table presents a statistical analysis of highlighting and editing in a post-editing task, broken down by domain (Biomedical and Social Media), translation direction (English-Italian and English-Dutch), and translator speed (Fast, Average, Slow). For each category, it shows the probability of highlighting (P(H)), the probability of editing (P(E)), the probability of editing given highlighting (P(E|H)), the probability of editing given no highlighting (P(E|¬H)), the likelihood ratio of editing given highlighting (ΛE), the probability of highlighting given editing (P(H|E)), the probability of highlighting given no editing (P(H|¬E)), the likelihood ratio of highlighting given editing (ΛH), and the F1 score for highlighting (F1H). Values after slashes represent adjusted probabilities, accounting for potential biases introduced by the presence of highlights; this adjustment is based on a comparison with the ‘No Highlight’ condition. The data is aggregated across four post-editors per condition. The table helps understand how highlighting techniques affect the editing behavior of translators, and to what extent the highlight modalities correctly predicted areas needing edits.
read the caption
Table 11: Highlighting (H𝐻Hitalic_H) and editing (E𝐸Eitalic_E) statistics for each domain, and translation direction across translator speeds (n=4𝑛4n=4italic_n = 4 post-editors per combination, regardless of highlight modality). Values after slashes are adjusted by projecting highlights of the specified modality over edits from No Highlight translators to estimate highlight-induced editing biases (Section 4.2).
| Identifier | Freq. Issues | MT quality | MT fluency | MT accuracy | High. accurate | High. useful | Interface clear | Task difficult | Highlights statements | |||||
| Speed? | Quality? | Effort? | Influence | Spot errors | Enjoy? | |||||||||
| eng-ita-nohigh-fast | inflection,additions,omissions | 4 | 0.8 | 0.8 | - | - | 5 | 1 | - | - | - | - | - | - |
| eng-ita-nohigh-avg | multiple | 3 | 0.6 | 0.4 | - | - | 2 | 4 | - | - | - | - | - | - |
| eng-ita-nohigh-slow | terminology,omissions | 3 | 0.8 | 0.8 | - | - | 1 | 5 | - | - | - | - | - | - |
| eng-ita-oracle-fast | inflection,terminology | 5 | 0.4 | 0.8 | 4 | 4 | 4 | 5 | 5 | 2 | 1 | 1 | 1 | 4 |
| eng-ita-oracle-avg | syntax,terminology,omissions,no context | 3 | 0.4 | 0.6 | 2 | 1 | 2 | 3 | 1 | 1 | 4 | 1 | 1 | 1 |
| eng-ita-oracle-slow | syntax,no context | 3 | 0.6 | 0.6 | 2 | 2 | 2 | 5 | 1 | 1 | 1 | 1 | 4 | 1 |
| eng-ita-unsup-fast | omissions | 3 | 0.8 | 0.6 | 3 | 2 | 4 | 5 | 3 | 3 | 3 | 2 | 2 | 2 |
| eng-ita-unsup-avg | syntax,terminology,no context | 3 | 0.6 | 0.6 | 3 | 3 | 3 | 5 | 2 | 3 | 2 | 1 | 1 | 3 |
| eng-ita-unsup-slow | syntax,inflection,terminology,omissions | 3 | 0.4 | 0.6 | 2 | 2 | 3 | 4 | 2 | 2 | 3 | 3 | 4 | 4 |
| eng-ita-sup-fast | syntax,terminology,no context | 3 | 0.4 | 0.4 | 2 | 1 | 2 | 2 | 1 | 1 | 3 | 1 | 2 | 2 |
| eng-ita-sup-avg | syntax,terminology,no context | 3 | 0.4 | 0.4 | 2 | 2 | 3 | 5 | 3 | 2 | 4 | 3 | 3 | 4 |
| eng-ita-sup-slow | syntax,terminology,omissions,no context | 3 | 0.6 | 0.6 | 2 | 2 | 1 | 2 | 2 | 1 | 1 | 4 | 4 | 1 |
| eng-nld-nohigh-fast | syntax,terminology,omissions,no context | 3 | 0.2 | 0.4 | - | - | 4 | 4 | - | - | - | - | - | - |
| eng-nld-nohigh-avg | syntax,terminology,omissions,no context | 2 | 0.4 | 0.6 | - | - | 4 | 5 | - | - | - | - | - | - |
| eng-nld-nohigh-slow | terminology,omissions,no context | 2 | 0.2 | 0.4 | - | - | 3 | 5 | - | - | - | - | - | - |
| eng-nld-oracle-fast | syntax,inflection,terminology | 3 | 0.6 | 0.6 | 2 | 1 | 3 | 2 | 2 | 2 | 2 | 1 | 1 | 1 |
| eng-nld-oracle-avg | syntax | 3 | 0.8 | 0.6 | 4 | 3 | 3 | 4 | 3 | 3 | 3 | 3 | 2 | 3 |
| eng-nld-oracle-slow | syntax,terminology | 3 | 0.6 | 0.4 | 3 | 1 | 3 | 4 | 1 | 1 | 1 | 1 | 1 | 3 |
| eng-nld-unsup-fast | terminology,additions,omissions | 3 | 0.6 | 0.8 | 3 | 2 | 4 | 4 | 1 | 3 | 1 | 1 | 2 | 1 |
| eng-nld-unsup-avg | multiple | 3 | 0.6 | 0.6 | 4 | 3 | 2 | 4 | 3 | 3 | 4 | 3 | 2 | 3 |
| eng-nld-unsup-slow | syntax,terminology,omissions | 1 | 0.4 | 0.4 | 2 | 4 | 1 | 4 | 4 | 4 | 3 | 2 | 2 | 3 |
| eng-nld-sup-fast | terminology,omissions,no context | 3 | 0.6 | 0.4 | 2 | 2 | 3 | 5 | 1 | 1 | 5 | 3 | 1 | 1 |
| eng-nld-sup-avg | syntax,additions,no context | 3 | 0.4 | 0.6 | 2 | 2 | 2 | 4 | 1 | 1 | 1 | 1 | 2 | 3 |
| eng-nld-sup-slow | multiple | 5 | 0.8 | 1 | 4 | 3 | 2 | 5 | 3 | 3 | 2 | 2 | 2 | 4 |
🔼 This table presents a quantitative analysis of errors in machine translation (MT) outputs, categorized according to the Multidimensional Quality Metrics (MQM) framework. The data is broken down by translation direction (English-Italian and English-Dutch), error type (following the MQM taxonomy), error severity (minor or major), and the highlight modality used during post-editing. The four highlight modalities being compared are: no highlighting, oracle highlights (based on expert consensus), unsupervised highlights (based on model uncertainty), and supervised highlights (from a trained quality estimation model). This allows for a comparison of the error rates under different conditions and assessment of how effectively the highlighting techniques guide human post-editors in identifying and correcting errors.
read the caption
Table 12: MQM error counts averaged across n=3𝑛3n=3italic_n = 3 translators per highlight modality for every translation direction. A description of MQM categories is available in Figure 6.
| Modalities | EnglishItalian | EnglishDutch | Both | |||||||
| Bio | Social | Both | Bio | Social | Both | Bio | Social | Both | ||
| Oracle and | Sup. | 0.17 | 0.32 | 0.25 | 0.38 | 0.29 | 0.34 | 0.26 | 0.29 | 0.29 |
| Unsup. | 0.14 | 0.30 | 0.20 | 0.31 | 0.27 | 0.28 | 0.22 | 0.29 | 0.24 | |
| Supervised and | Oracle | 0.19 | 0.31 | 0.26 | 0.30 | 0.26 | 0.29 | 0.24 | 0.29 | 0.28 |
| Unsup. | 0.19 | 0.33 | 0.25 | 0.28 | 0.24 | 0.25 | 0.24 | 0.29 | 0.25 | |
| Unsupervised and | Oracle | 0.22 | 0.32 | 0.27 | 0.35 | 0.30 | 0.33 | 0.28 | 0.31 | 0.30 |
| Sup. | 0.22 | 0.37 | 0.30 | 0.39 | 0.27 | 0.33 | 0.30 | 0.31 | 0.32 | |
🔼 This table presents the performance of different quality estimation methods in identifying errors in machine translation. It compares Average Precision (AP) and Area Under the Precision-Recall Curve (AU) for four methods: LOGPROBS, PREDICTION DEPTH, LOGPROBS MCD VAR, and XCOMET-XXL. The evaluation is done using human post-edited data from two different datasets: DivEMT (using mBART 1-to-50 model) and QE4PE (using NLLB 3.3B model). The QE4PE results use a consensus-based Oracle approach to represent an upper bound for agreement on errors.
read the caption
Table 13: Average Precision (AP) and Area Under the Precision-Recall Curve (AU) between metrics and error spans derived from human post-editing. We use mBART 1-to-50 (Tang et al., 2021) and NLLB 3B (NLLB Team et al., 2024) respectively for DivEMT and QE4PE. For DivEMT, a single post-editor is available for computing the agreement, while for QE4PE we use consensus-based Oracle highlights. For QE4PE, we report the average agreement between individual oracle post-editors and their consensus as an agreement upper bound.
Full paper#