TL;DR#
Creating realistic 3D talking heads driven by speech is challenging. Existing methods often fall short in achieving truly believable lip movements, as they don’t fully capture the subtle nuances of natural speech. Current evaluation metrics are also inadequate, focusing on geometric differences rather than perceptual accuracy. Datasets often lack the necessary range of expressions and speech intensities, further hindering progress in this field.
To address these limitations, this paper defines three key criteria for perceptually accurate lip synchronization: Temporal Synchronization, Lip Readability, and Expressiveness. A novel speech-mesh representation is introduced, capturing the intricate relationships between speech signals and 3D face meshes. The learned representation is used as a perceptual loss to improve existing 3D talking head generation models. New metrics, including Perceptual Lip Readability Score (PLRS), are also proposed for comprehensive evaluation. Experiments demonstrate significant improvements across all three criteria, leading to more realistic and engaging 3D talking heads.
Key Takeaways#
Why does it matter?#
This paper introduces new metrics and a speech-mesh representation for perceptually accurate 3D talking heads. It offers researchers a method to enhance lip synchronization and opens doors for more realistic and engaging virtual communication. By addressing the limitations of traditional metrics and providing a new approach to representation learning, it significantly contributes to the advancement of the field.
Visual Insights#

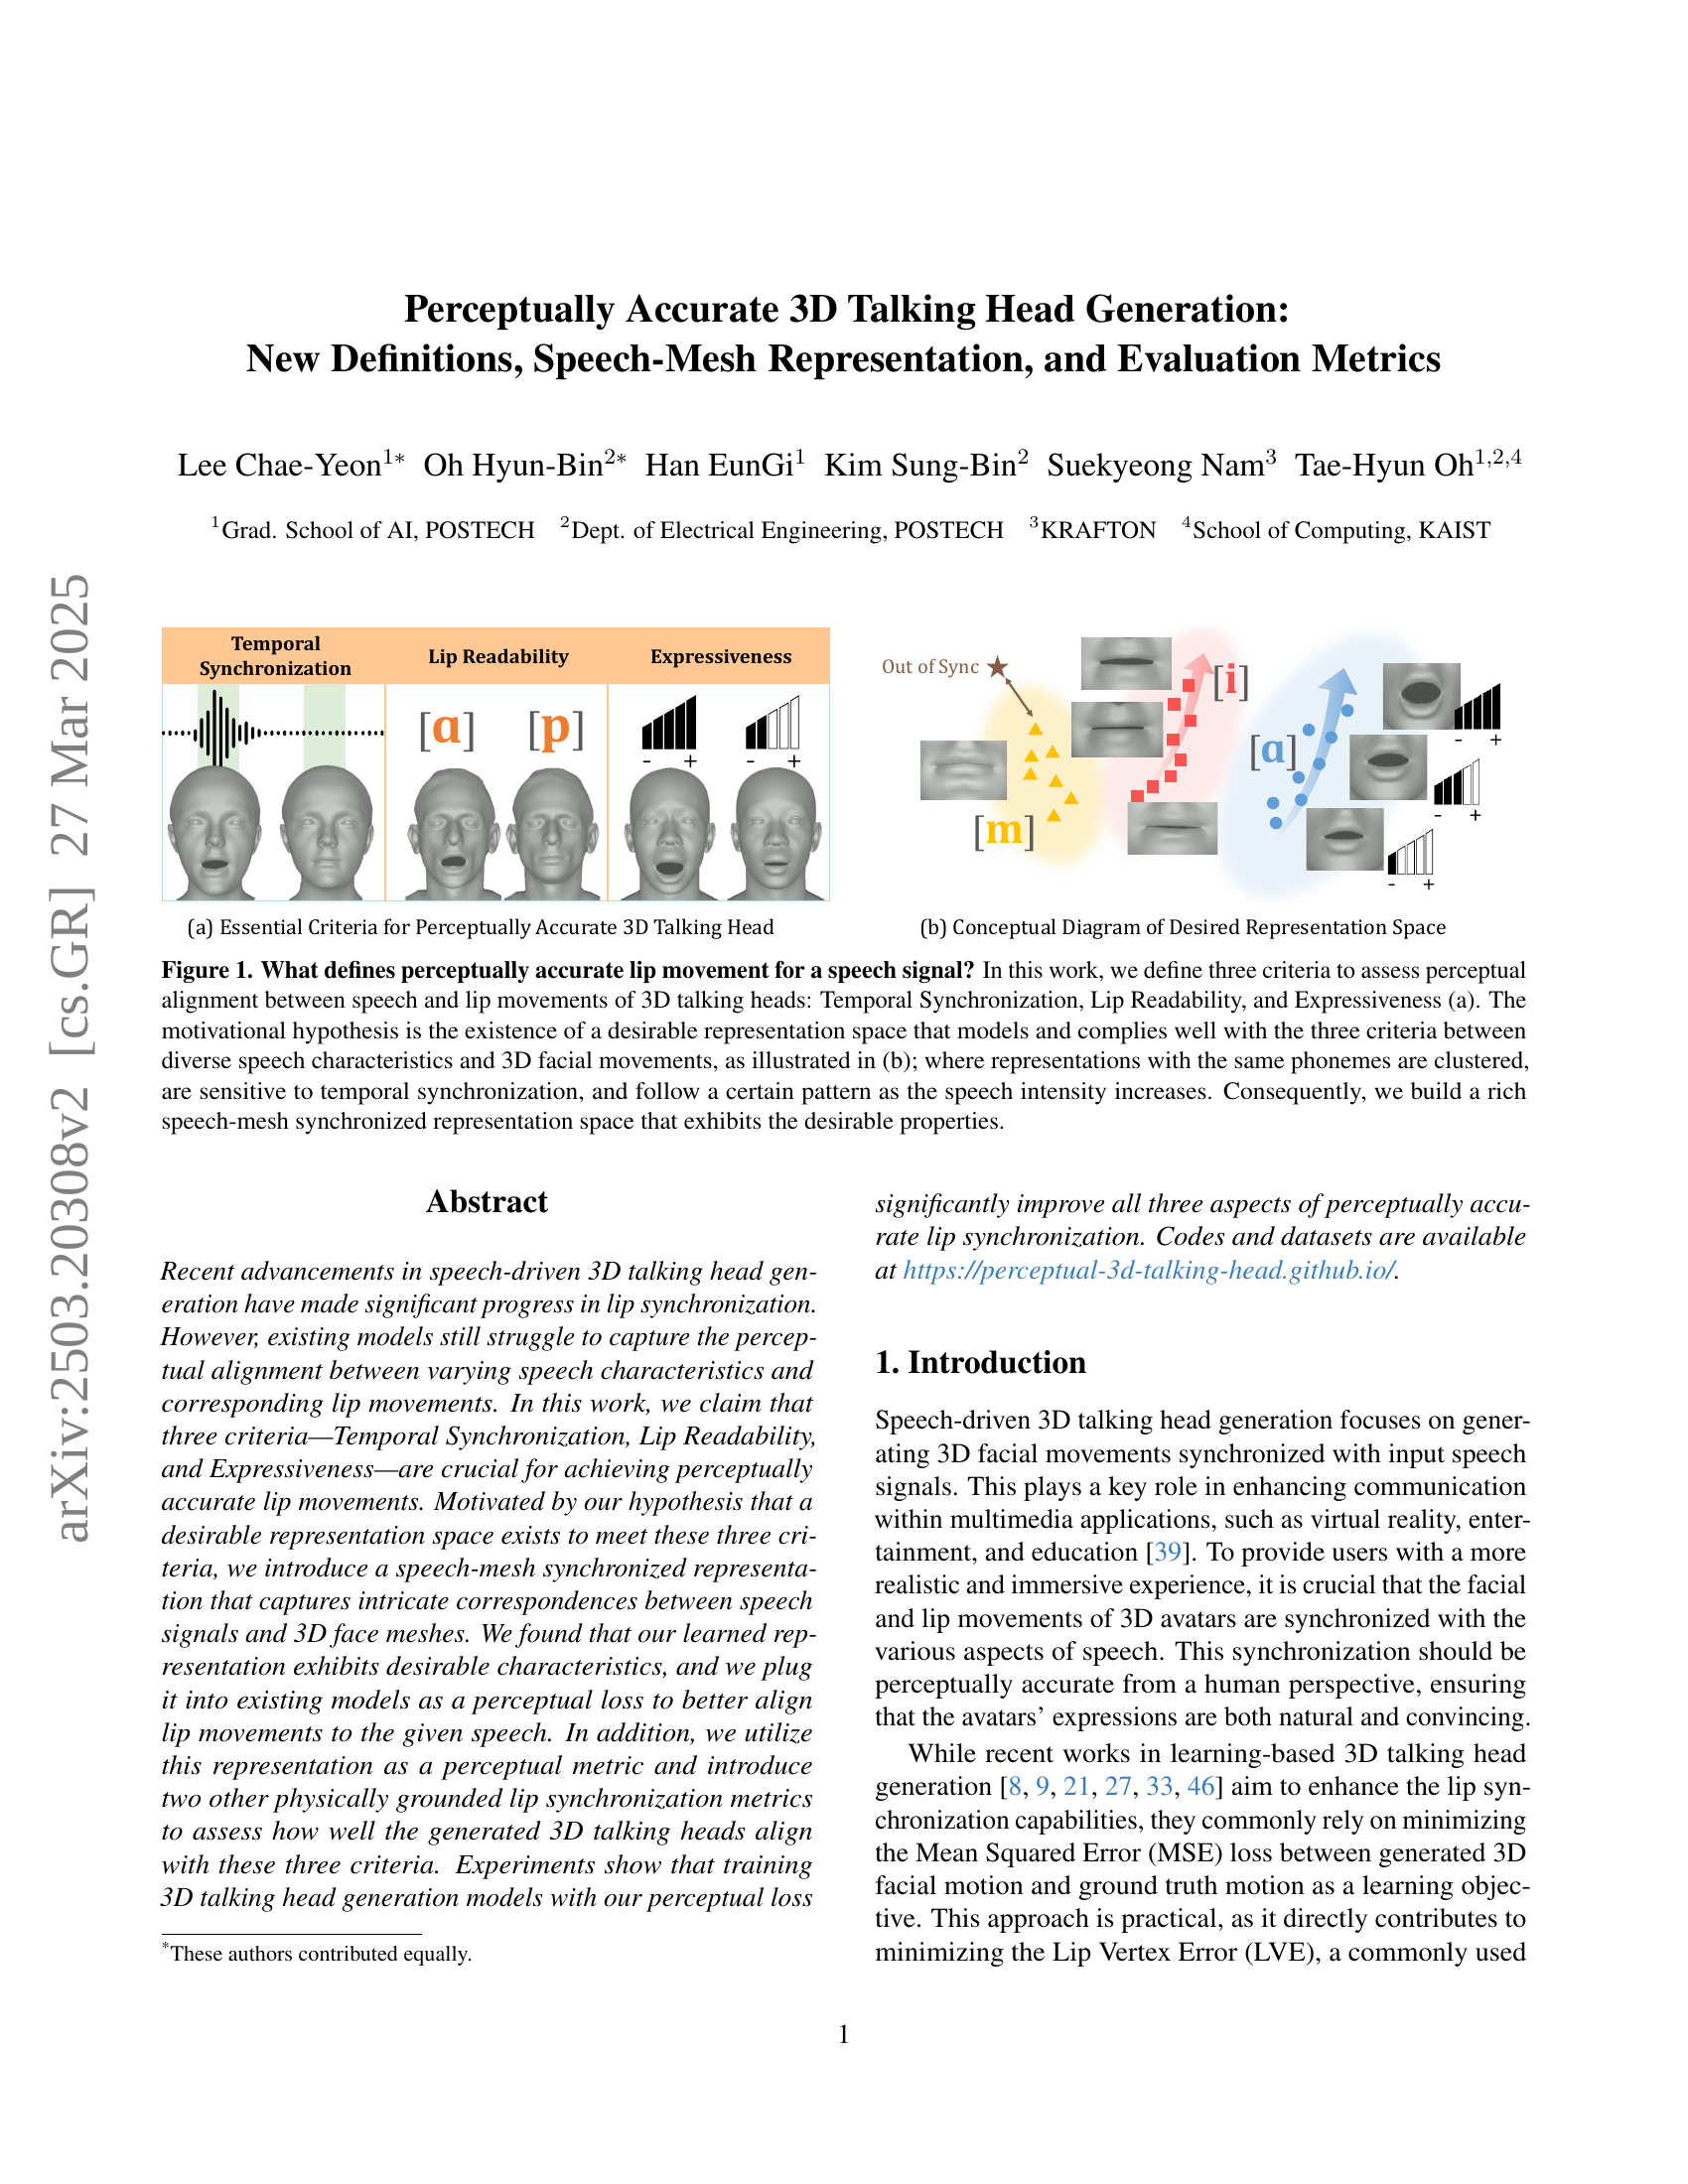
🔼 Figure 1 illustrates the key aspects of perceptually accurate 3D talking head generation. Panel (a) introduces three essential criteria for evaluating the perceptual quality of lip synchronization: Temporal Synchronization (the timing alignment between audio and visual), Lip Readability (how easily the lip movements can be understood), and Expressiveness (the naturalness and intensity of lip movements). Panel (b) presents a conceptual diagram showing a desirable representation space where speech and lip movements are closely linked. This space groups together lip movements corresponding to the same phonemes, is sensitive to the timing of speech, and clearly shows how lip movements change with varying speech intensity. The authors aim to create a rich speech-mesh synchronized representation space reflecting these properties.
read the caption
Figure 1: What defines perceptually accurate lip movement for a speech signal? In this work, we define three criteria to assess perceptual alignment between speech and lip movements of 3D talking heads: Temporal Synchronization, Lip Readability, and Expressiveness (a). The motivational hypothesis is the existence of a desirable representation space that models and complies well with the three criteria between diverse speech characteristics and 3D facial movements, as illustrated in (b); where representations with the same phonemes are clustered, are sensitive to temporal synchronization, and follow a certain pattern as the speech intensity increases. Consequently, we build a rich speech-mesh synchronized representation space that exhibits the desirable properties.
| Samples | ||
| A | B | |
| Temp. | ✓ | ✗ |
| Exp. | ✗ | ✓ |
| Prefer (%) | 17.4 | 82.6 |
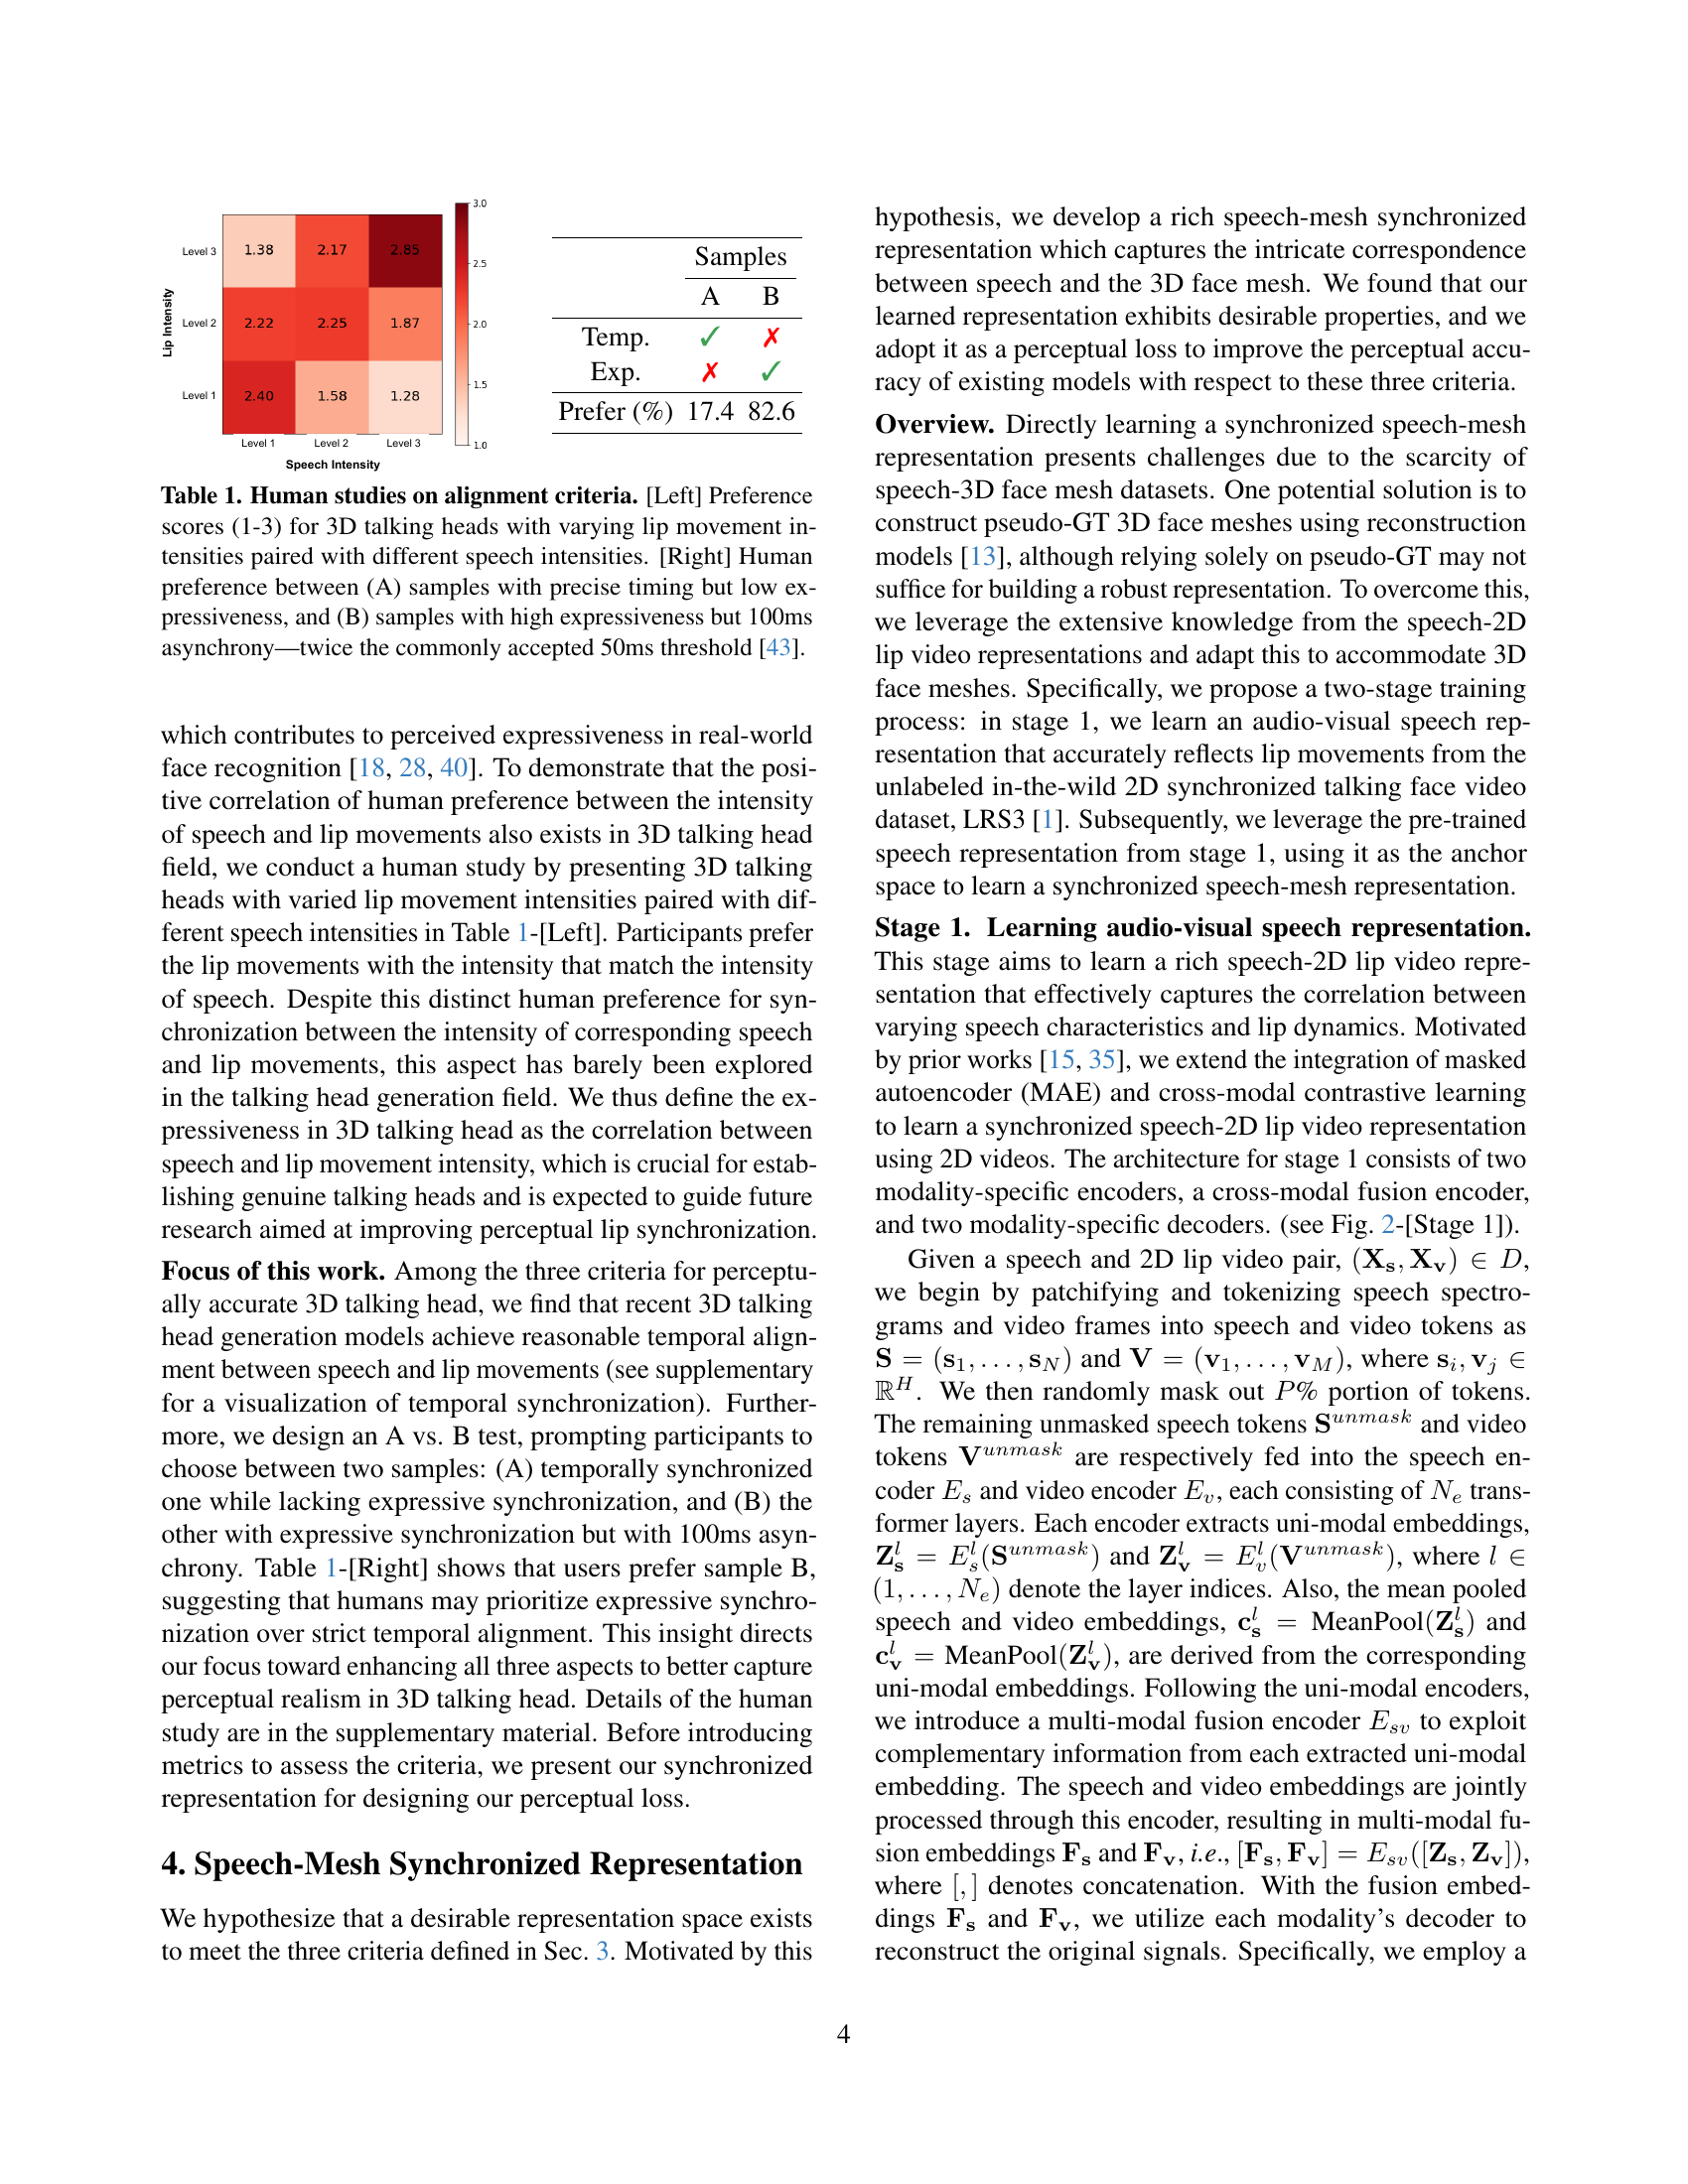
🔼 This table presents the results of two human studies evaluating the perceptual impact of different factors on 3D talking head lip synchronization. The left side shows preference scores (1-3) given by participants for 3D talking heads with varying lip movement intensities paired with different speech intensities. The right side shows the human preference between two types of video samples: sample A with precise timing but low expressiveness and sample B with high expressiveness but 100ms asynchrony (twice the commonly accepted 50ms threshold). These studies help define three key criteria for perceptually accurate lip synchronization.
read the caption
Table 1: Human studies on alignment criteria. [Left] Preference scores (1-3) for 3D talking heads with varying lip movement intensities paired with different speech intensities. [Right] Human preference between (A) samples with precise timing but low expressiveness, and (B) samples with high expressiveness but 100ms asynchrony—twice the commonly accepted 50ms threshold [43].
In-depth insights#
Perceptual Sync#
When discussing perceptual synchronization in the context of talking head generation, it’s crucial to move beyond basic lip-sync accuracy. True perceptual sync involves a holistic integration of visual and auditory cues, mirroring how humans perceive speech. This includes subtle nuances like accurate timing between phoneme production and lip movements, realistic co-articulation effects where preceding and following sounds influence lip shape, and, importantly, a visual representation of vocal effort that matches the audio. A perceptually synchronized talking head will exhibit jaw movements, facial muscle activation, and head nods that naturally align with the intonation, rhythm, and emotional tone of the speech. Achieving this requires sophisticated models capable of translating prosodic features into nuanced facial expressions, creating a compelling illusion of a speaking person. Furthermore, accurately simulating micro-expressions and subtle cues related to emotion and emphasis enhances overall believability. Existing research often focuses on minimizing geometric error, yet neglecting these critical components hinders genuine synchronization. Evaluating sync necessitates metrics beyond simple lip vertex error, considering temporal alignment, visual readability, and expressiveness. Future work should prioritize comprehensive models that address these aspects, paving the way for more realistic and engaging virtual communicators.
Speech-Mesh Space#
Speech-Mesh Space represents a novel approach to 3D talking head generation, aiming to bridge the gap between auditory and visual modalities. It hypothesizes the existence of an optimal representational space where speech characteristics and facial movements are intricately linked. The goal is to capture nuanced relationships, improving lip synchronization, readability, and expressiveness. The construction of this space likely involves deep learning techniques to map speech features and 3D mesh vertices into a shared latent space. Training strategies would be important to ensure the learned space reflects the desired perceptual alignment and avoids overfitting to specific datasets. Evaluation relies on metrics assessing temporal coherence, linguistic plausibility, and subjective human ratings. Success would lead to more realistic and engaging virtual avatars, enhancing communication across digital mediums.
Loss & Metrics#
Loss functions and metrics are crucial in 3D talking head generation. Loss functions guide the training process, optimizing the model’s parameters to accurately map speech to lip movements. Common losses like MSE, while simple, often fail to capture perceptual nuances, leading to unrealistic lip sync. Perceptual losses, informed by human perception studies, are more effective by focusing on temporal synchrony, lip readability, and expressiveness. Metrics are essential for evaluating the generated talking heads. While LVE measures geometric accuracy, it overlooks perceptual plausibility. Metrics like PLRS, MTM, and SLCC directly assess lip readability, temporal alignment, and expressiveness, offering a more holistic evaluation. Using a combination of geometric and perceptual metrics is necessary for thorough evaluation, leading to more believable and engaging virtual avatars.
Two-Stage Train#
A two-stage training approach is a common technique in machine learning, particularly when dealing with complex tasks or limited data. The initial stage often focuses on pre-training a model on a larger, more general dataset to learn useful representations or features. This pre-training helps the model develop a better understanding of the underlying data distribution and can improve its generalization ability. The second stage then involves fine-tuning the pre-trained model on a smaller, more specific dataset that is relevant to the target task. This fine-tuning allows the model to adapt its learned representations to the specific characteristics of the target task, resulting in improved performance. This approach is particularly effective when the target task has limited labeled data. By first pre-training on a larger dataset, the model can learn useful features that can then be fine-tuned to the specific task with less data. Furthermore, it can prevent overfitting. It can also be used in multimodal approach where stages are trained on different modalities.
Limited Datasets#
Addressing the challenges posed by limited datasets is crucial in advancing various fields. Small datasets hinder the development of robust and generalizable models. Overfitting becomes a significant concern, where models perform well on the training data but fail to generalize to unseen data. Data augmentation techniques, such as image rotations, flips, and crops, can artificially increase the dataset size but may not capture the true data distribution. Transfer learning, using pre-trained models on larger datasets, offers a promising approach to overcome the limitations of small datasets. However, the effectiveness of transfer learning depends on the similarity between the source and target datasets. Furthermore, limited datasets restrict the complexity of models that can be trained effectively. Simpler models with fewer parameters are often preferred to prevent overfitting. Active learning strategies, where the model iteratively selects the most informative samples to be labeled, can be employed to maximize the information gained from each labeled data point. Meta-learning, or learning to learn, aims to develop models that can quickly adapt to new tasks with limited data. These approaches are essential for building reliable models in domains where data acquisition is expensive or challenging.
More visual insights#
More on figures

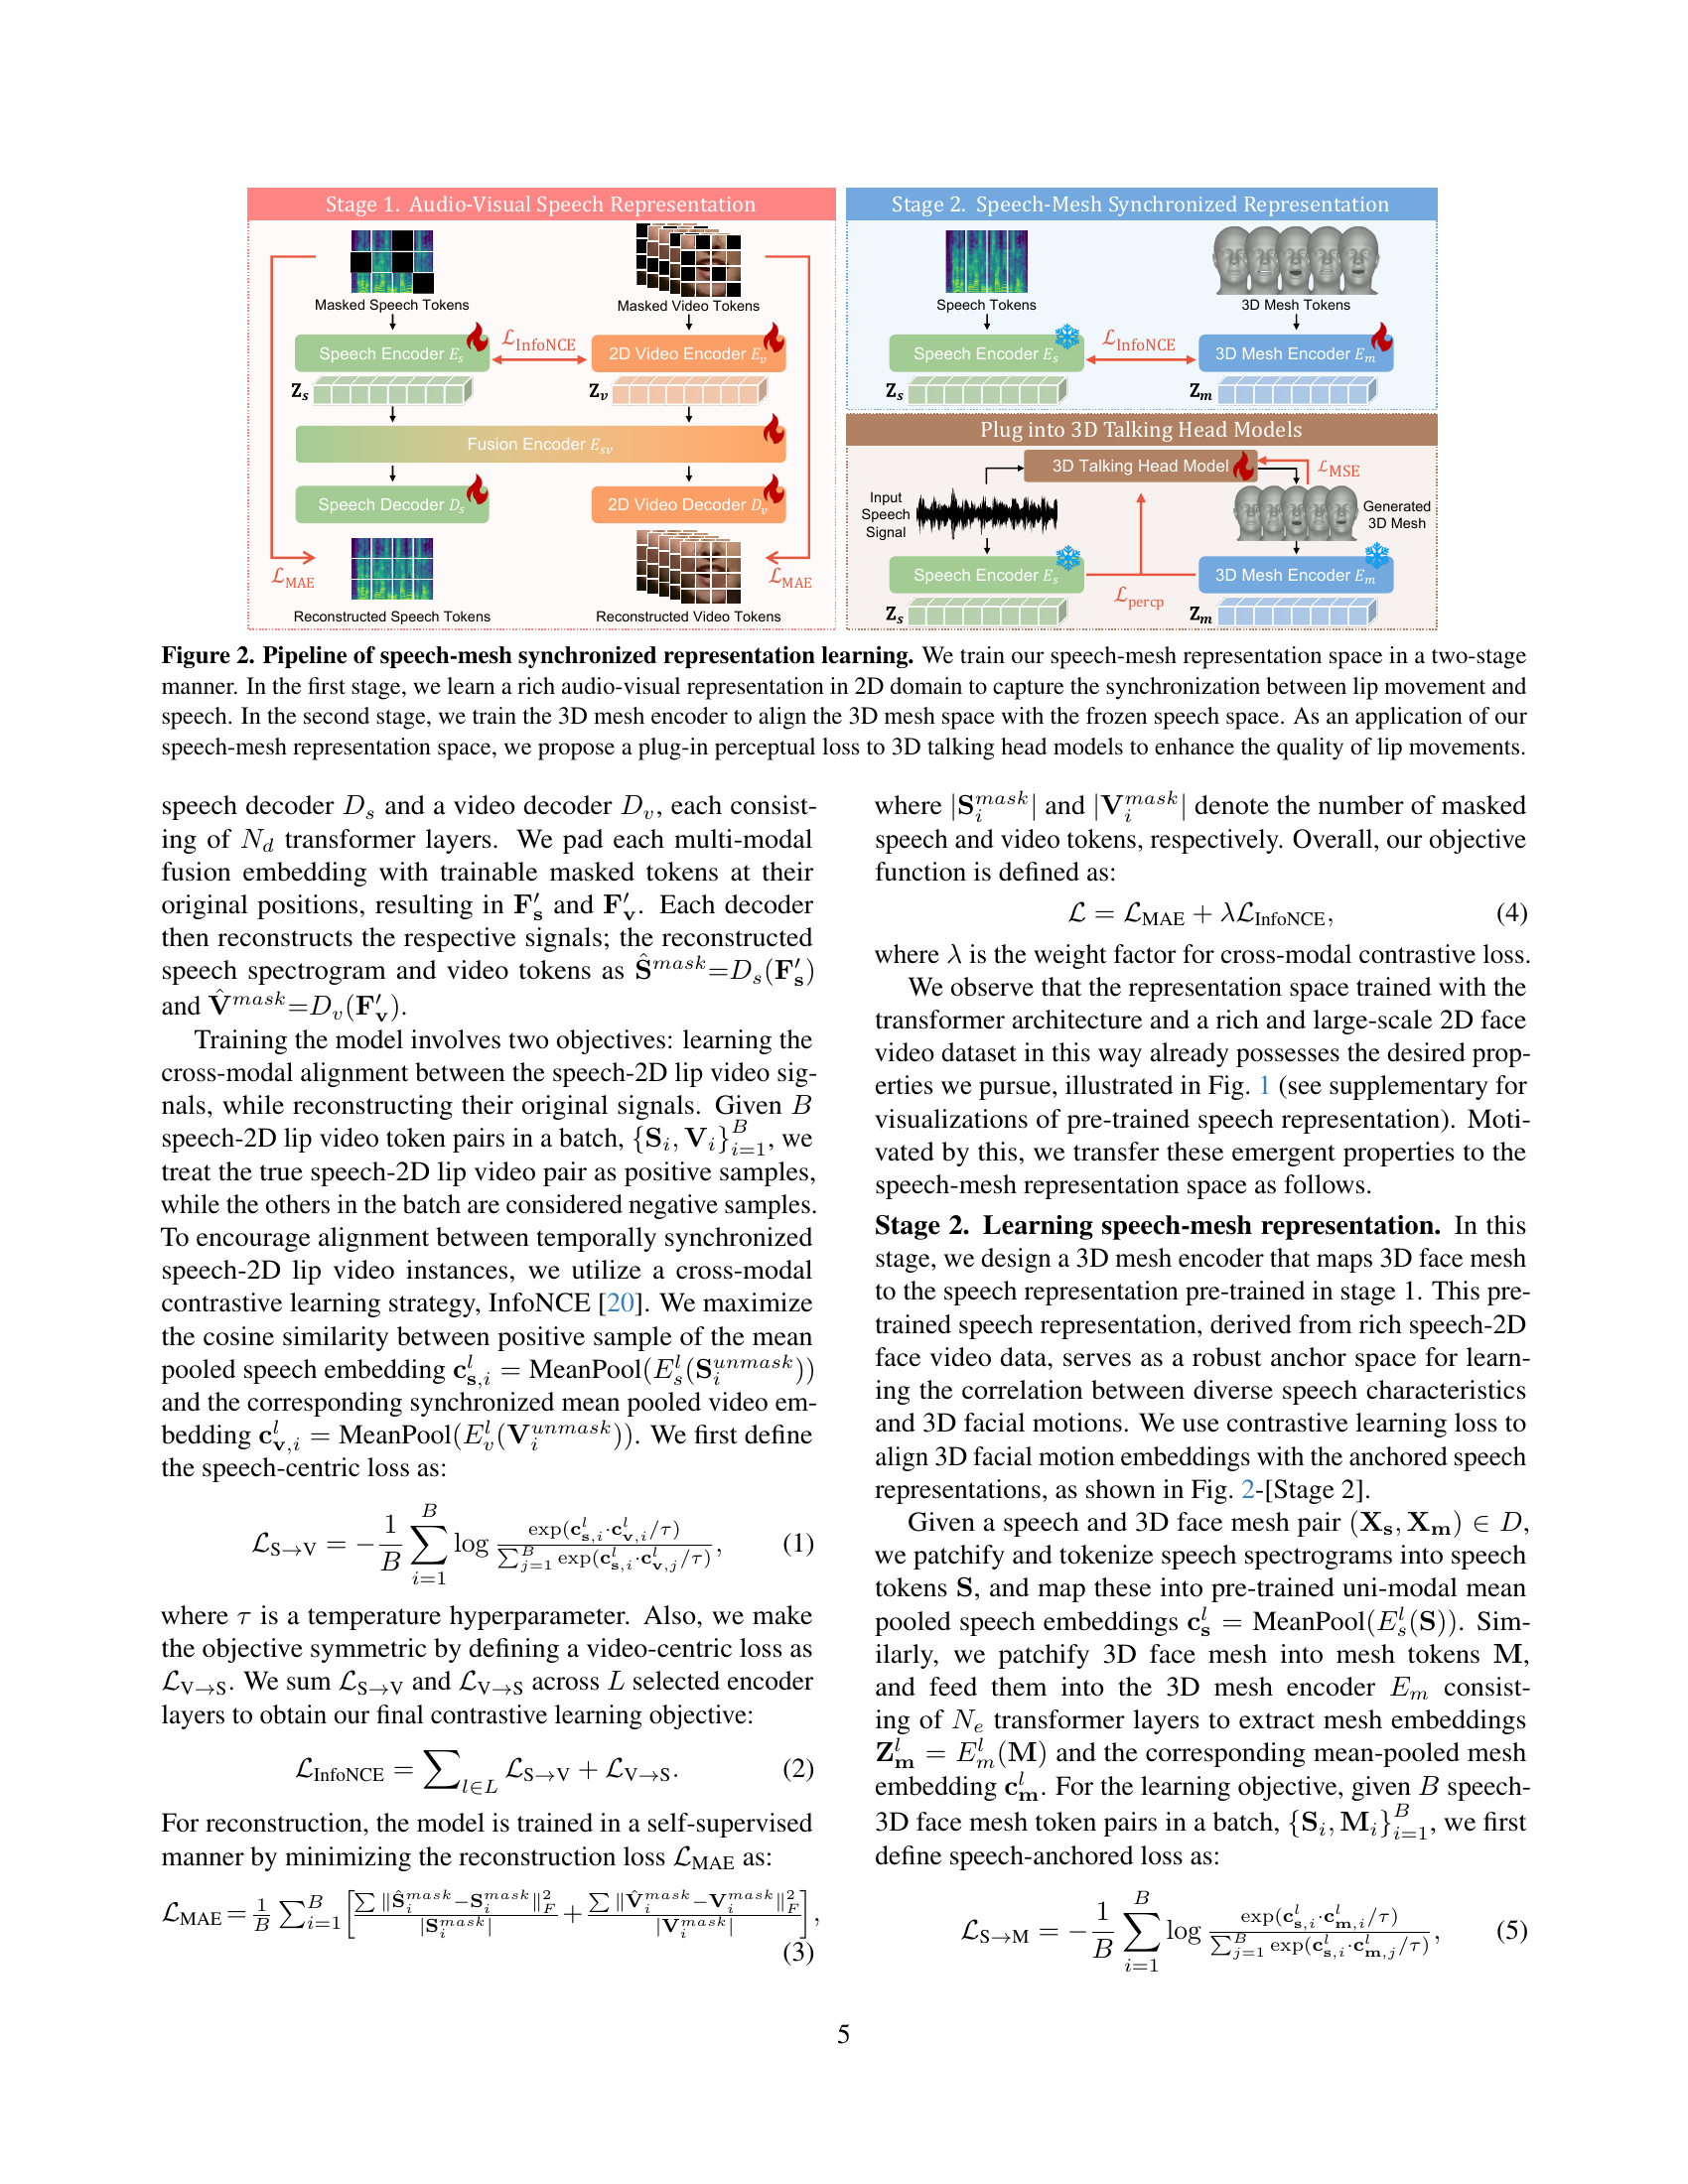
🔼 This figure illustrates the two-stage training process for learning a speech-mesh synchronized representation. The first stage involves training an audio-visual model on 2D data to capture the intricate correspondence between speech and lip movements. This learned representation is then used in the second stage as an anchor for training a 3D mesh encoder, aligning the 3D mesh space with the speech space. The resulting speech-mesh representation is then used as a plug-in perceptual loss in 3D talking head models, enhancing the quality of lip movements.
read the caption
Figure 2: Pipeline of speech-mesh synchronized representation learning. We train our speech-mesh representation space in a two-stage manner. In the first stage, we learn a rich audio-visual representation in 2D domain to capture the synchronization between lip movement and speech. In the second stage, we train the 3D mesh encoder to align the 3D mesh space with the frozen speech space. As an application of our speech-mesh representation space, we propose a plug-in perceptual loss to 3D talking head models to enhance the quality of lip movements.

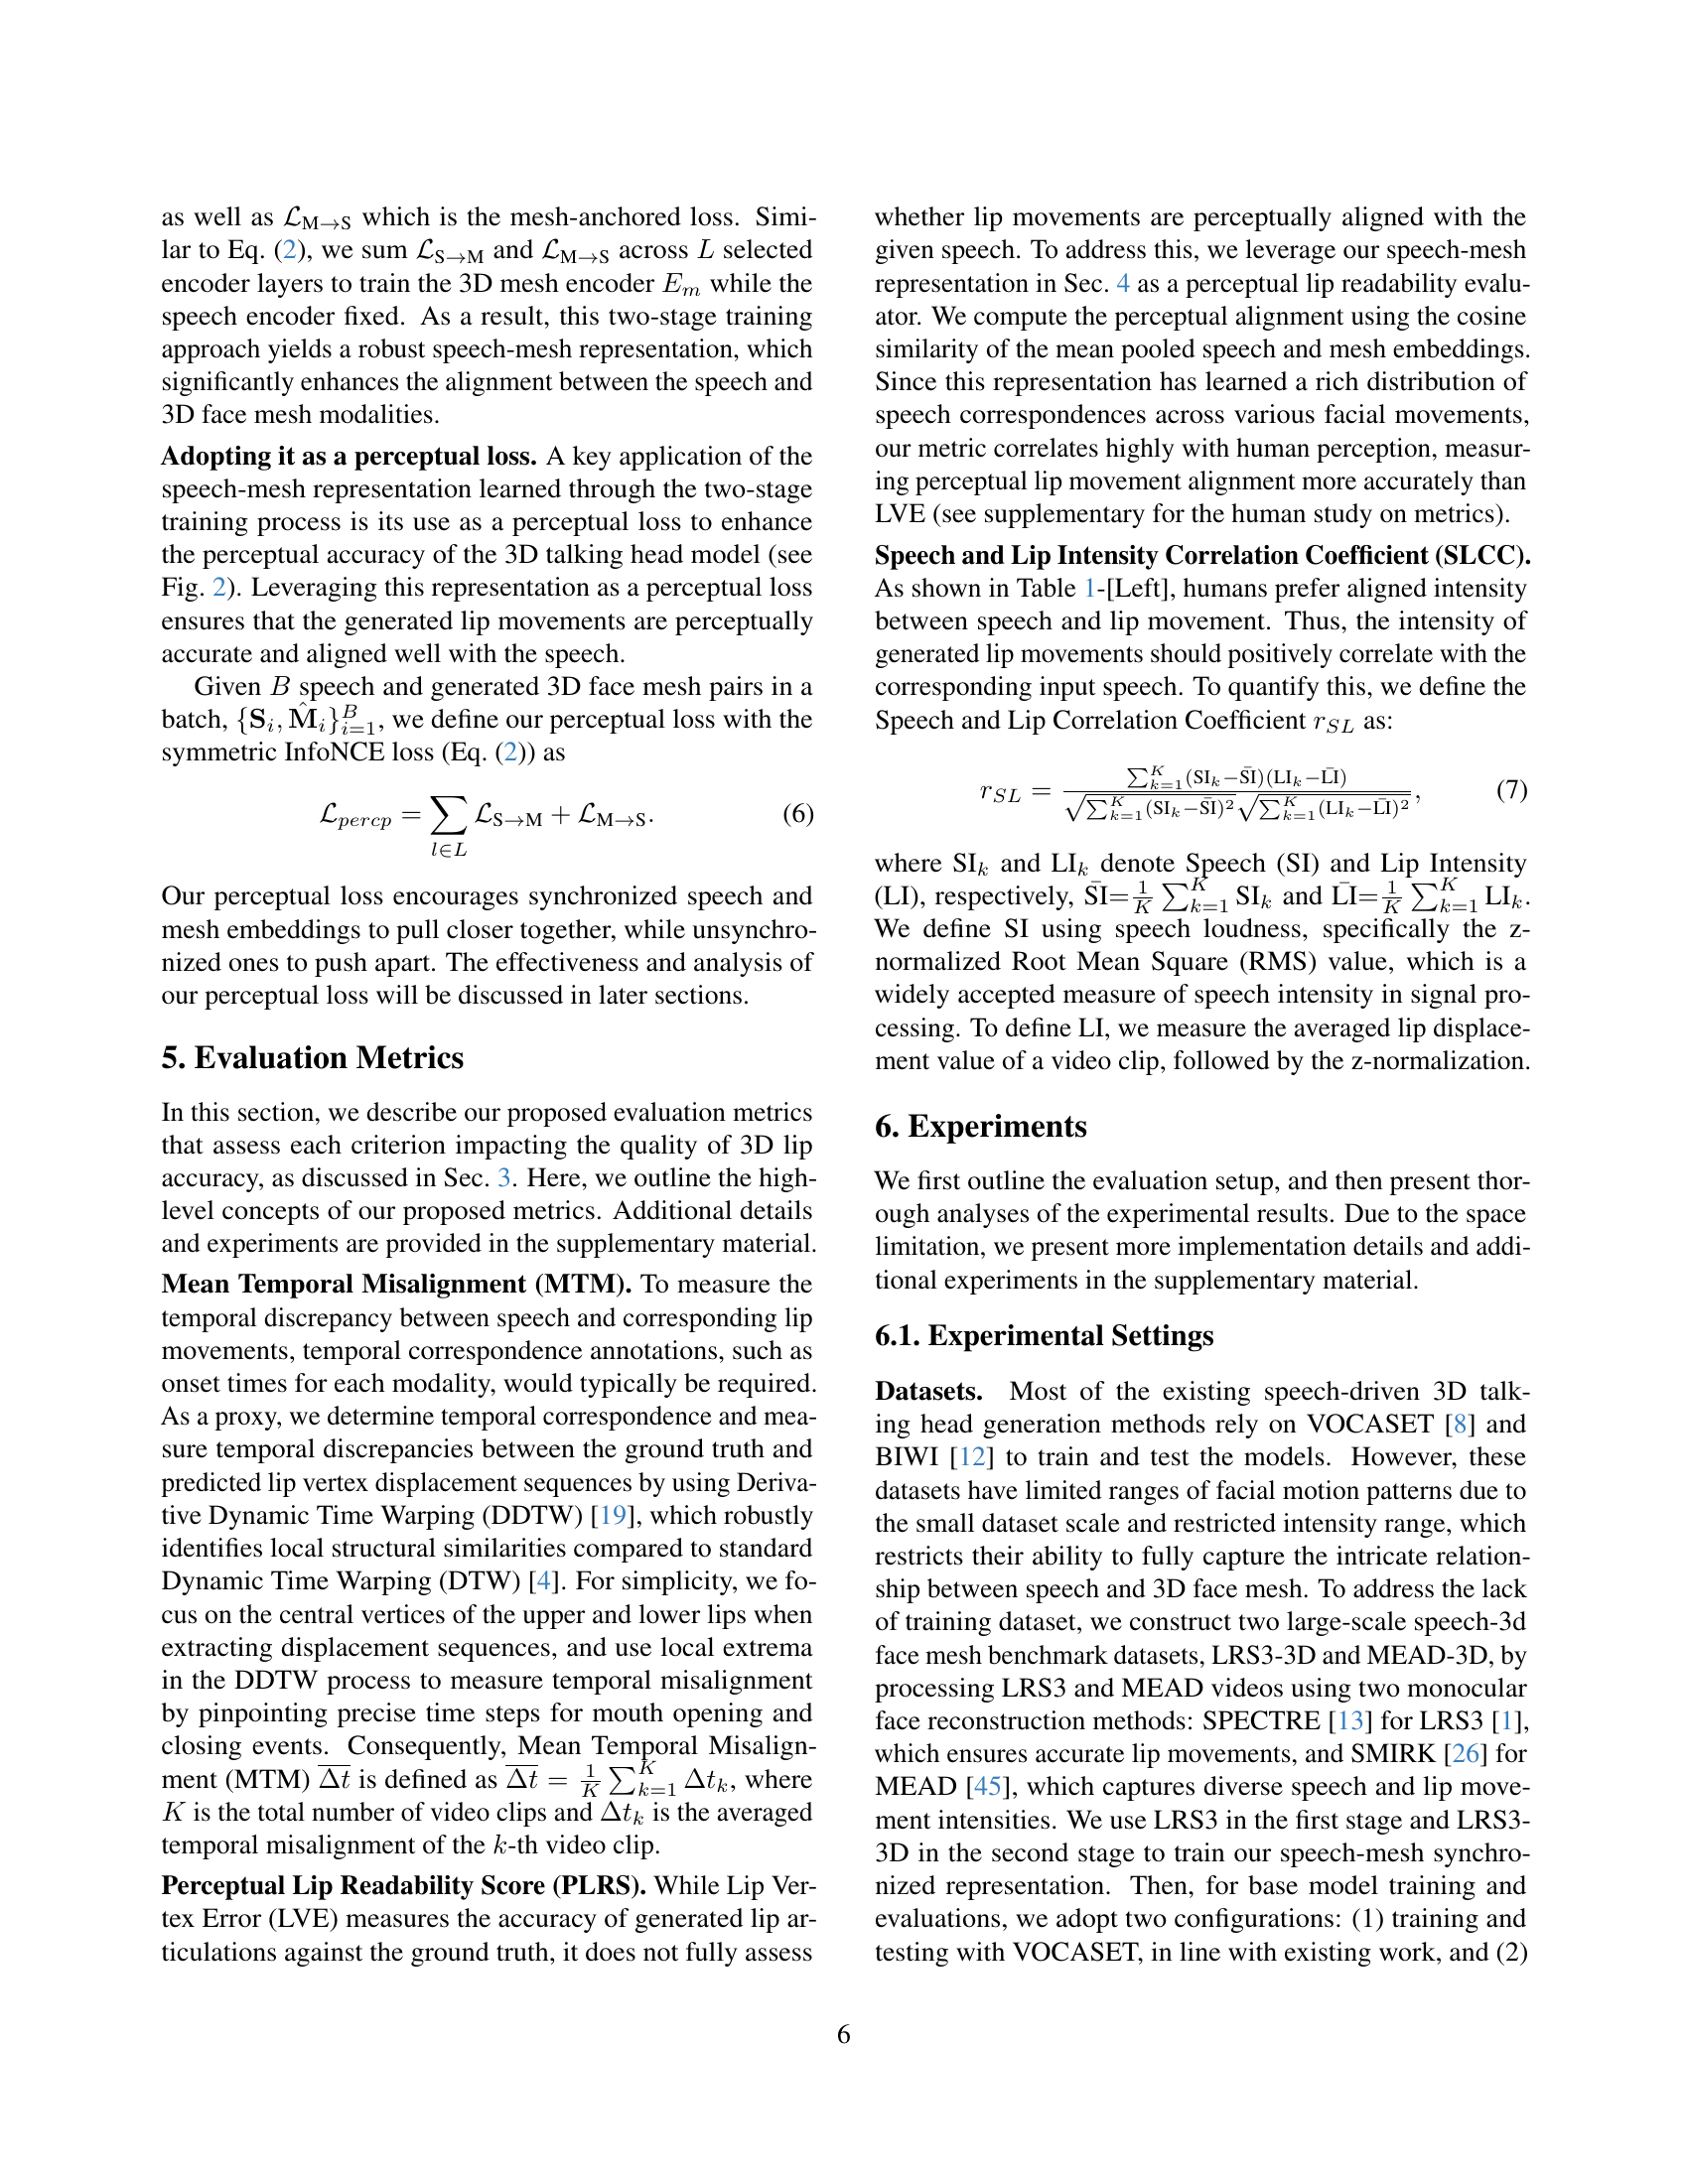
🔼 This figure showcases the impact of the proposed perceptual loss on lip readability in 3D talking head generation. Three different baseline models ([11, 46, 21]) are compared: their outputs before and after incorporating the perceptual loss are shown. The improved lip movements demonstrate a more natural and accurate lip synchronization, highlighting the effectiveness of the perceptual loss in enhancing the perceptual quality of the generated videos.
read the caption
Figure 3: Qualitative results of the effectiveness of our perceptual loss for lip readability. Our perceptual loss guides baselines [11, 46, 21] to generate perceptually accurate lip movements.

🔼 This figure presents a t-SNE visualization of the feature embeddings generated by different models in the ablation study. Each point represents a feature vector extracted from either the speech or mesh data. Points of the same color indicate features corresponding to the same phoneme. Square and circular shapes distinguish between speech and mesh features, respectively. By visualizing the data in this way, we can observe the degree of clustering and separation between different phonemes in the feature space generated by each model, thus illustrating the effectiveness of each model’s ability to capture the relationships between speech and lip movements.
read the caption
Figure 4: t-SNE plot of ablation study. We plot the t-SNE graph for each perceptual critic model. We represent the features with same phoneme as same color. Squared and circled points denote mesh and speech features from each representation, respectively.

🔼 This figure displays two graphs illustrating the properties of the speech-mesh representation, focusing on temporal synchronization and expressiveness. The first graph shows the relationship between cosine similarity and temporal offset, revealing the model’s sensitivity to temporal alignment. As the temporal offset increases, the cosine similarity decreases, indicating that the model prioritizes accurate synchronization. The second graph, a t-SNE plot, visualizes the speech features colored by intensity level. The plot demonstrates the ability of the representation to capture varying intensities of speech, where similar phonemes cluster together, and points move along a direction vector as intensity increases. These observations demonstrate the representation’s ability to capture critical aspects of perceptually accurate lip movements.
read the caption
Figure 5: Behaviors of our representation in temporal and expressiveness sensitivity. We demonstrate the effectiveness of our representation in temporal synchronization and expressiveness using a cosine similarity graph and speech feature plots, respectively. We color the point as low, medium, and high intensity.
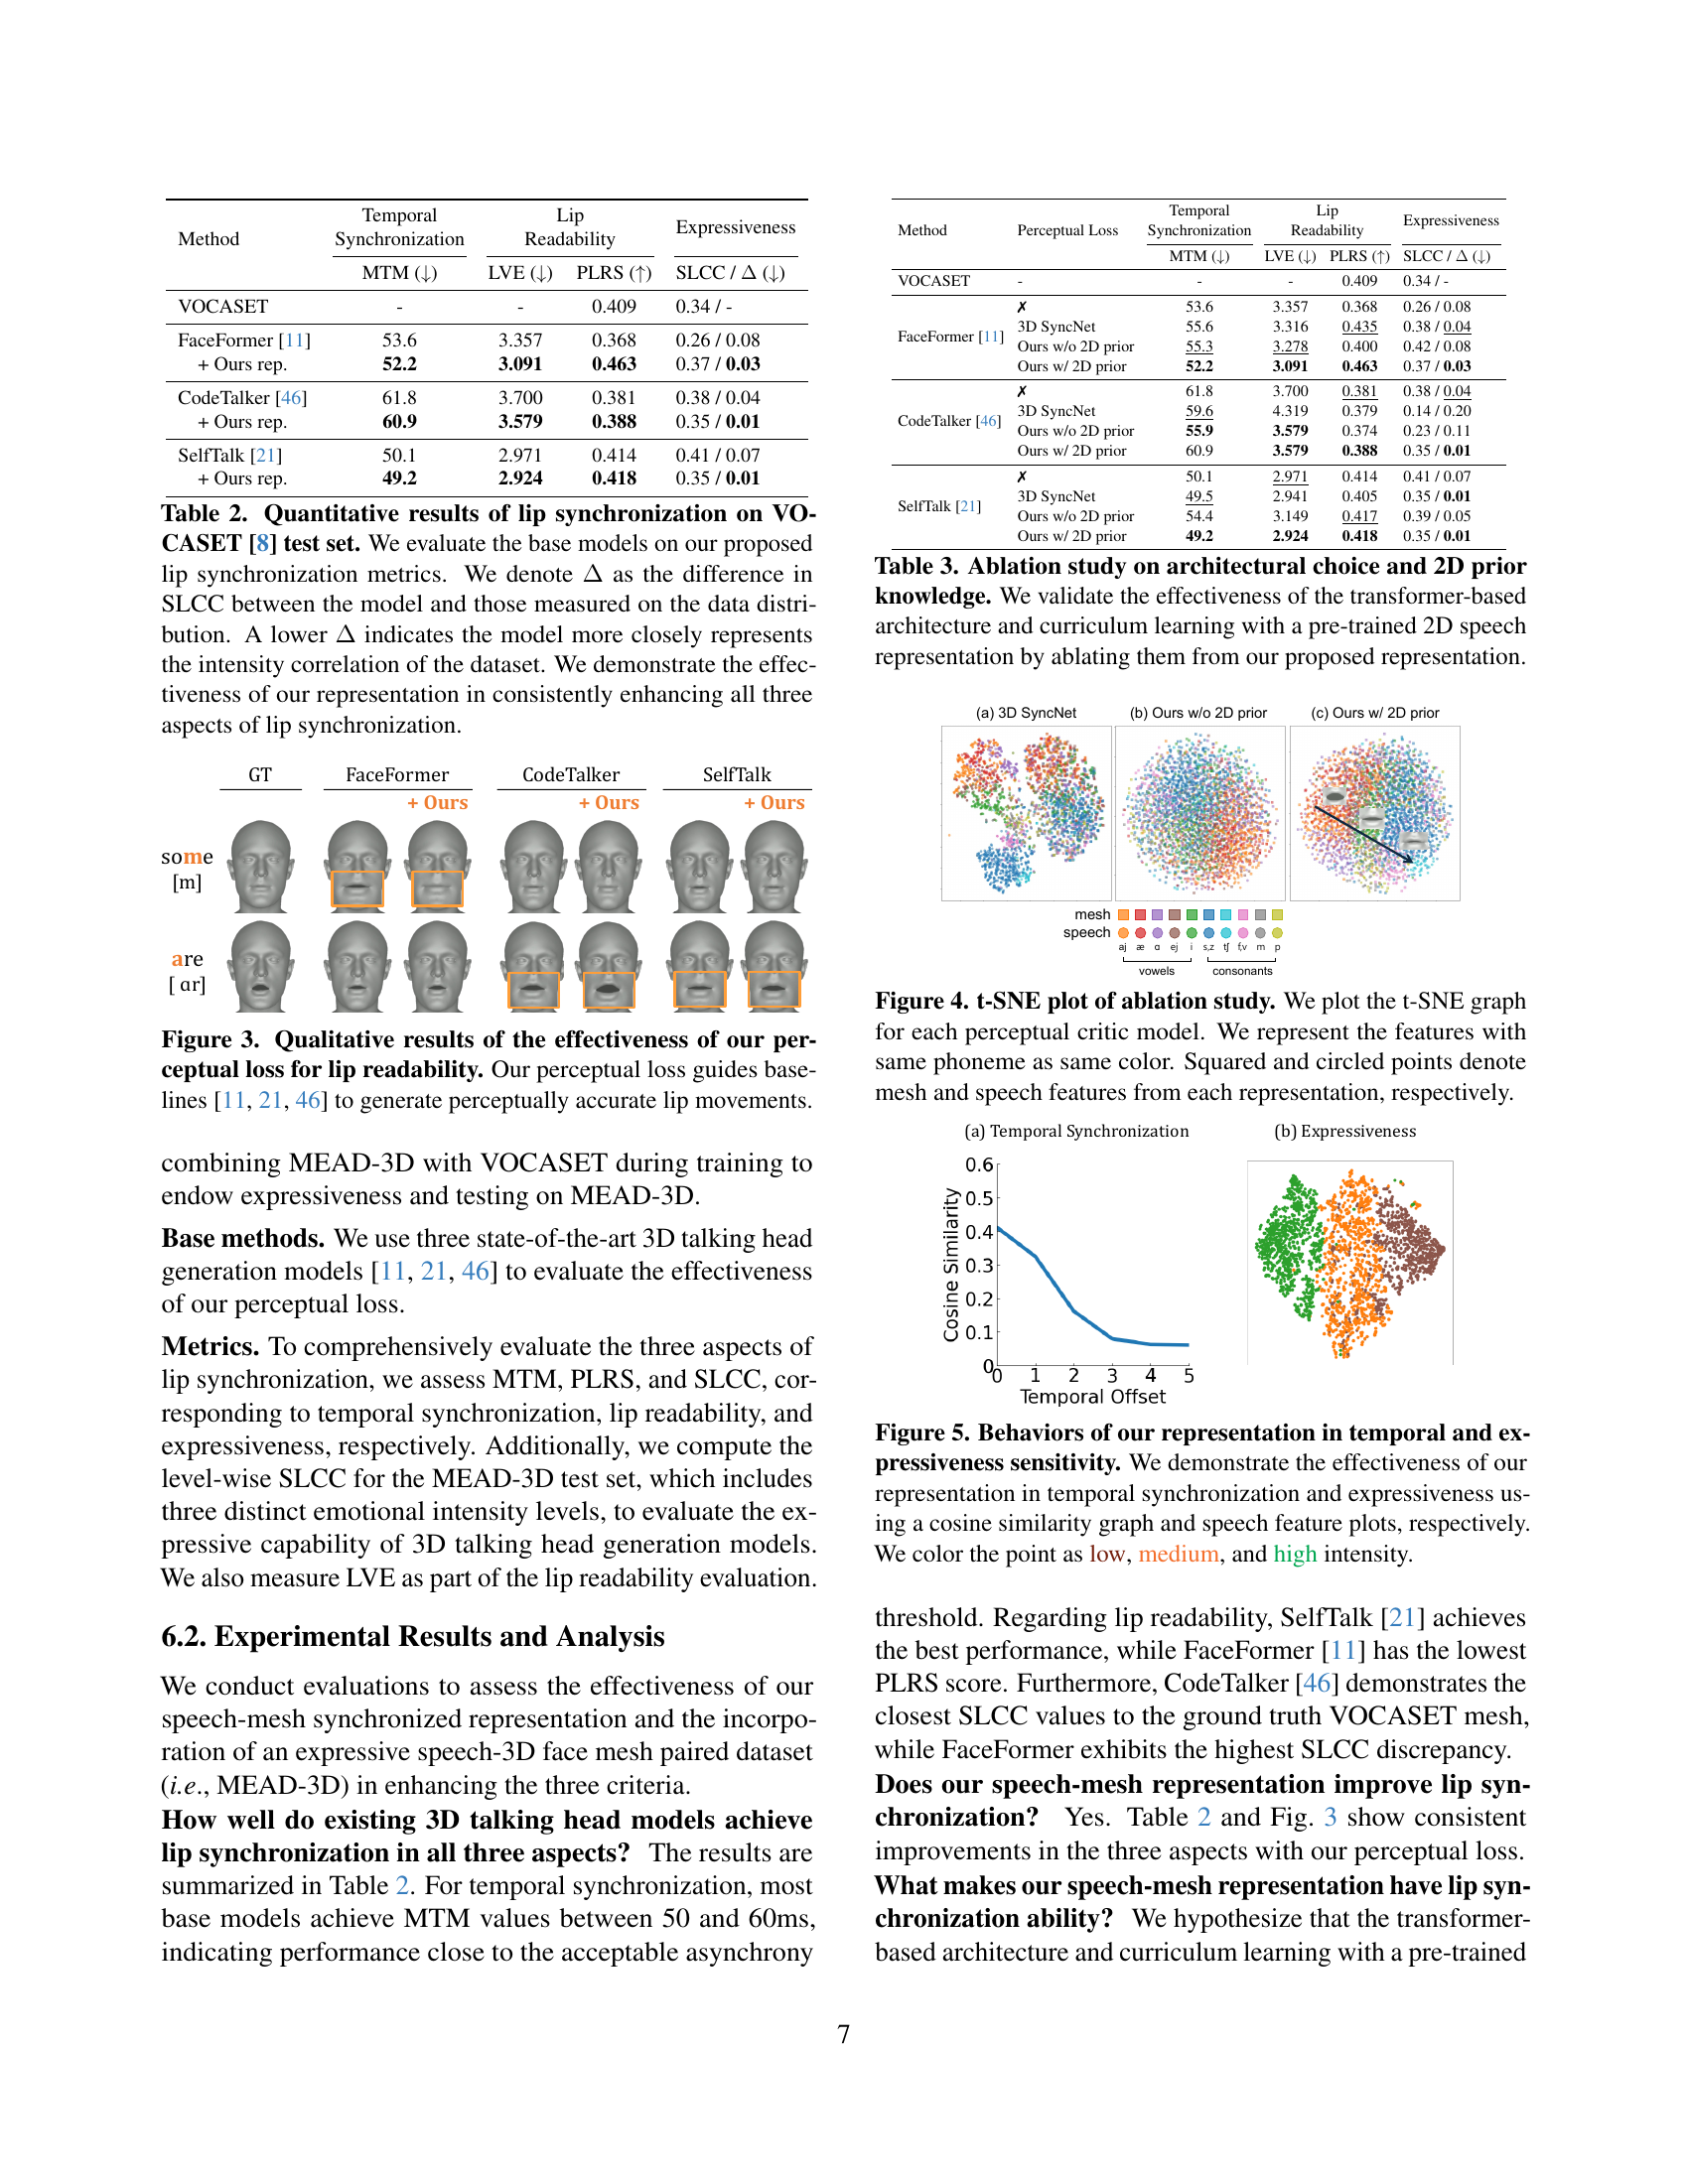
🔼 This figure displays a qualitative comparison of lip expressiveness in 3D talking head generation models. Three different models (FaceFormer, CodeTalker, SelfTalk) were trained using two datasets: VOCASET and MEAD-3D. The images show the generated lip movements for high and low intensity speech. Models trained on both datasets (MEAD-3D and VOCASET) show more expressive lip movements, particularly when further enhanced by the incorporation of a perceptual loss function. The perceptual loss leads to even better expressiveness in lip movements.
read the caption
Figure 6: Qualitative results for the expressiveness. Given high and low intensity levels of speech, models trained on both MEAD-3D and VOCASET show more expressive lip movements compared to those trained on VOCASET alone, and even better with our perceptual loss.

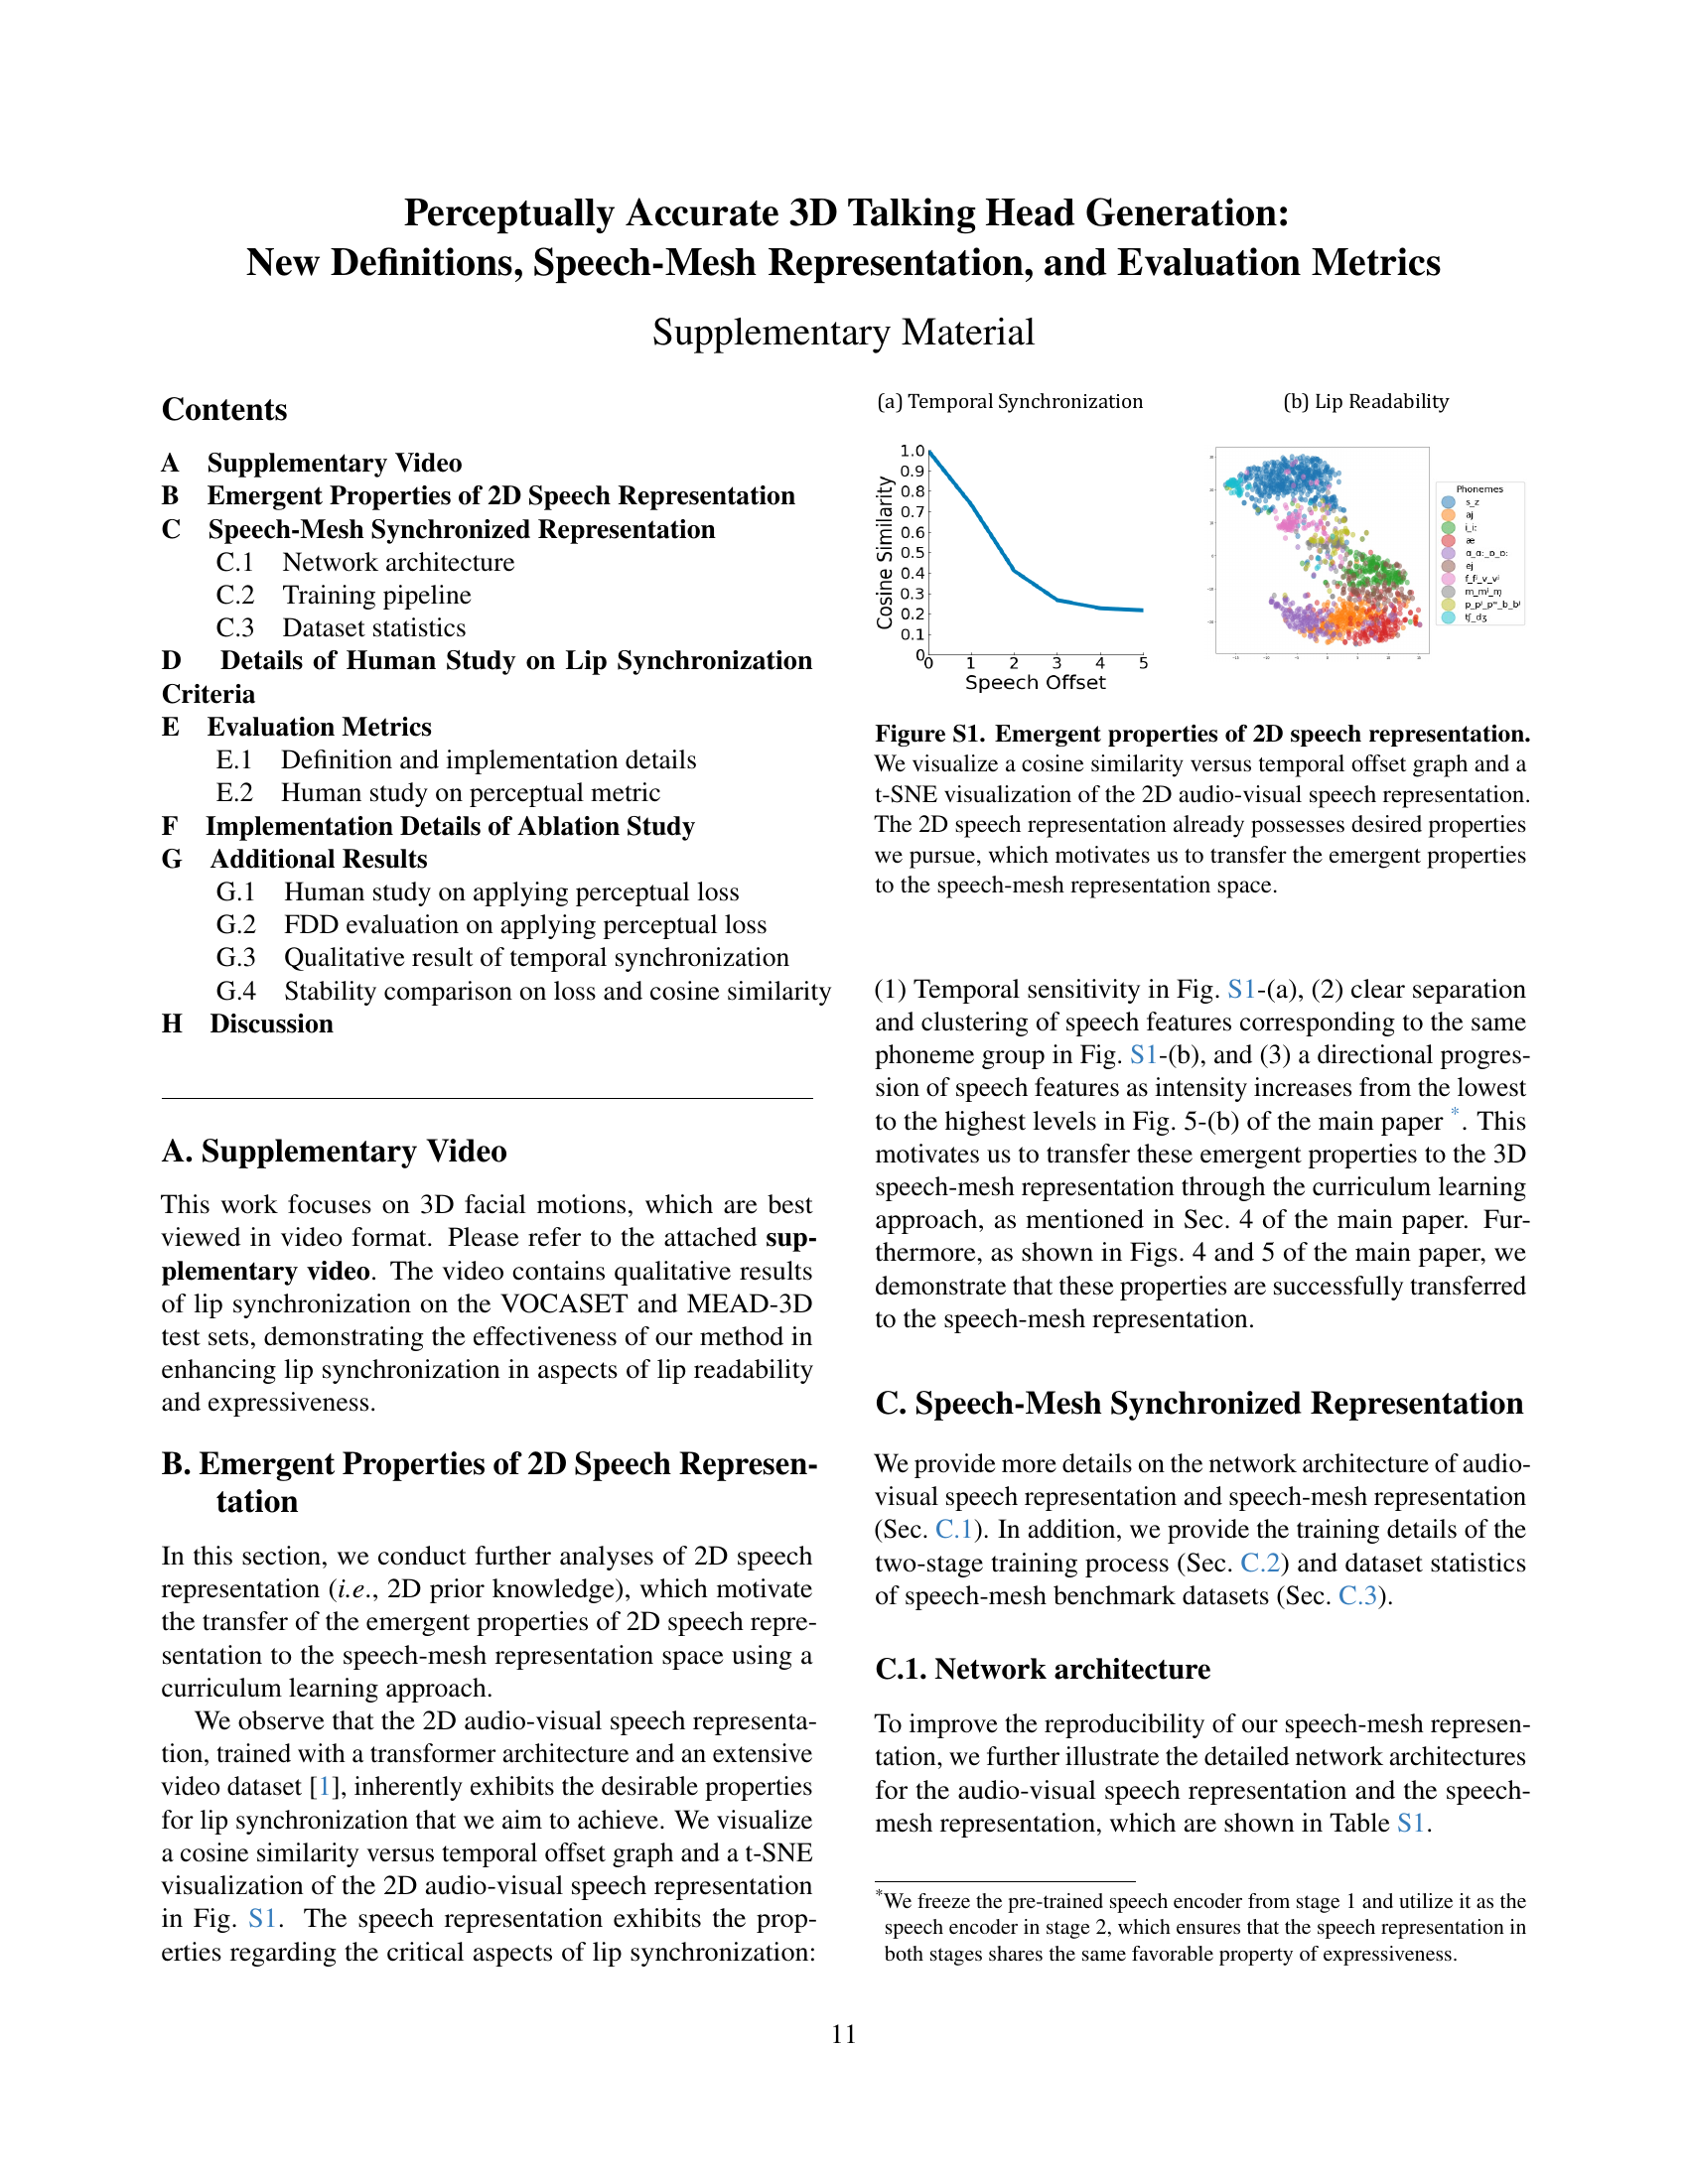
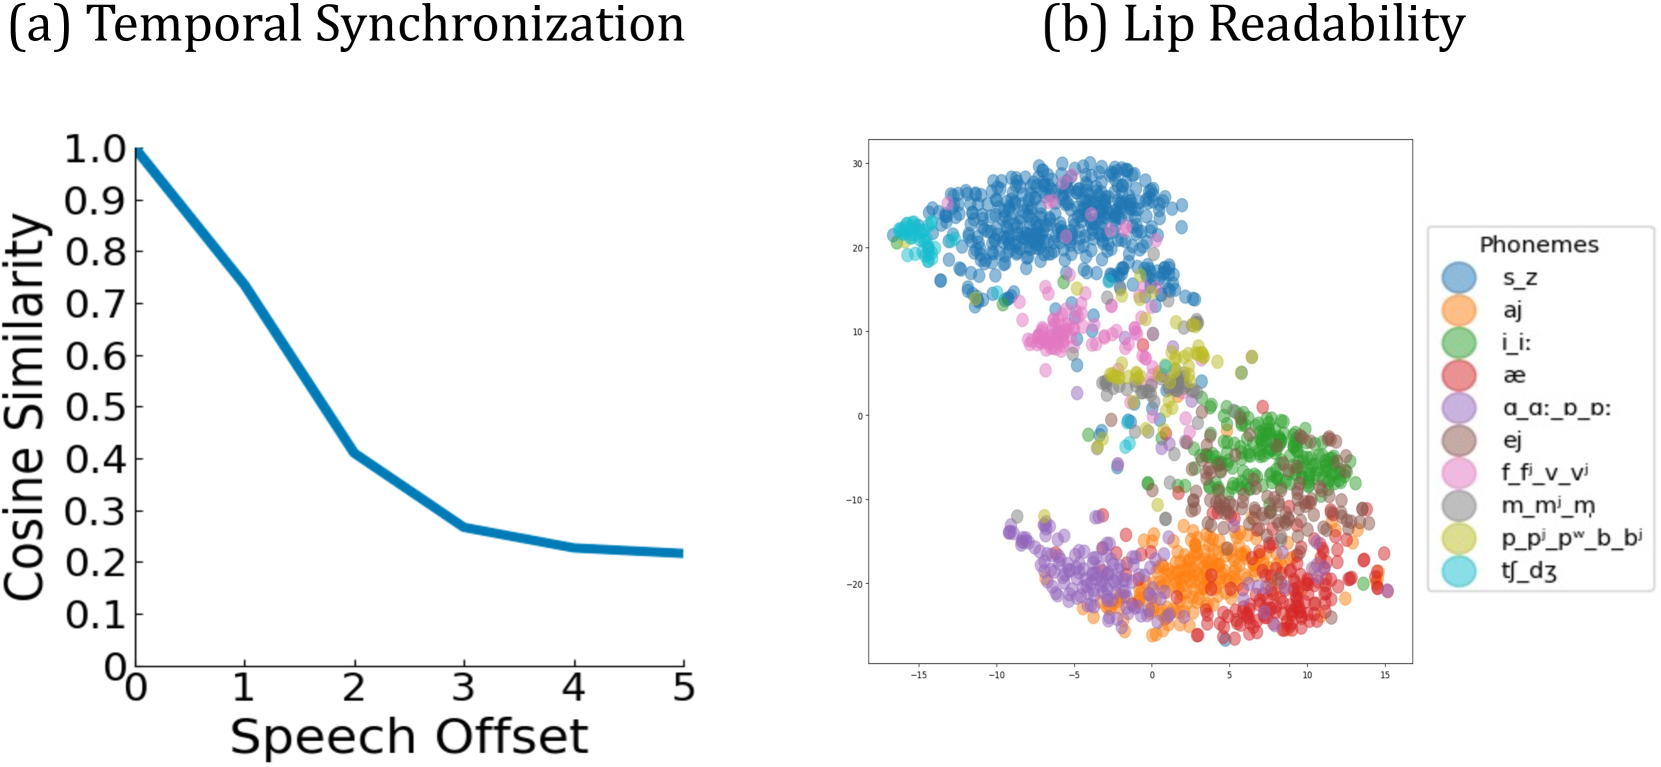
🔼 This figure demonstrates the emergent properties of a 2D audio-visual speech representation learned before training the main speech-mesh representation. The left panel shows a graph of cosine similarity plotted against temporal offset, illustrating the model’s sensitivity to temporal synchronization. The right panel displays a t-SNE visualization of the learned representation, showing how the model groups speech features with similar phonetic properties together. This observation supports the hypothesis that transferring the learned representation’s characteristics to the 3D speech-mesh representation would improve the accuracy of lip synchronization.
read the caption
Figure S1: Emergent properties of 2D speech representation. We visualize a cosine similarity versus temporal offset graph and a t-SNE visualization of the 2D audio-visual speech representation. The 2D speech representation already possesses desired properties we pursue, which motivates us to transfer the emergent properties to the speech-mesh representation space.

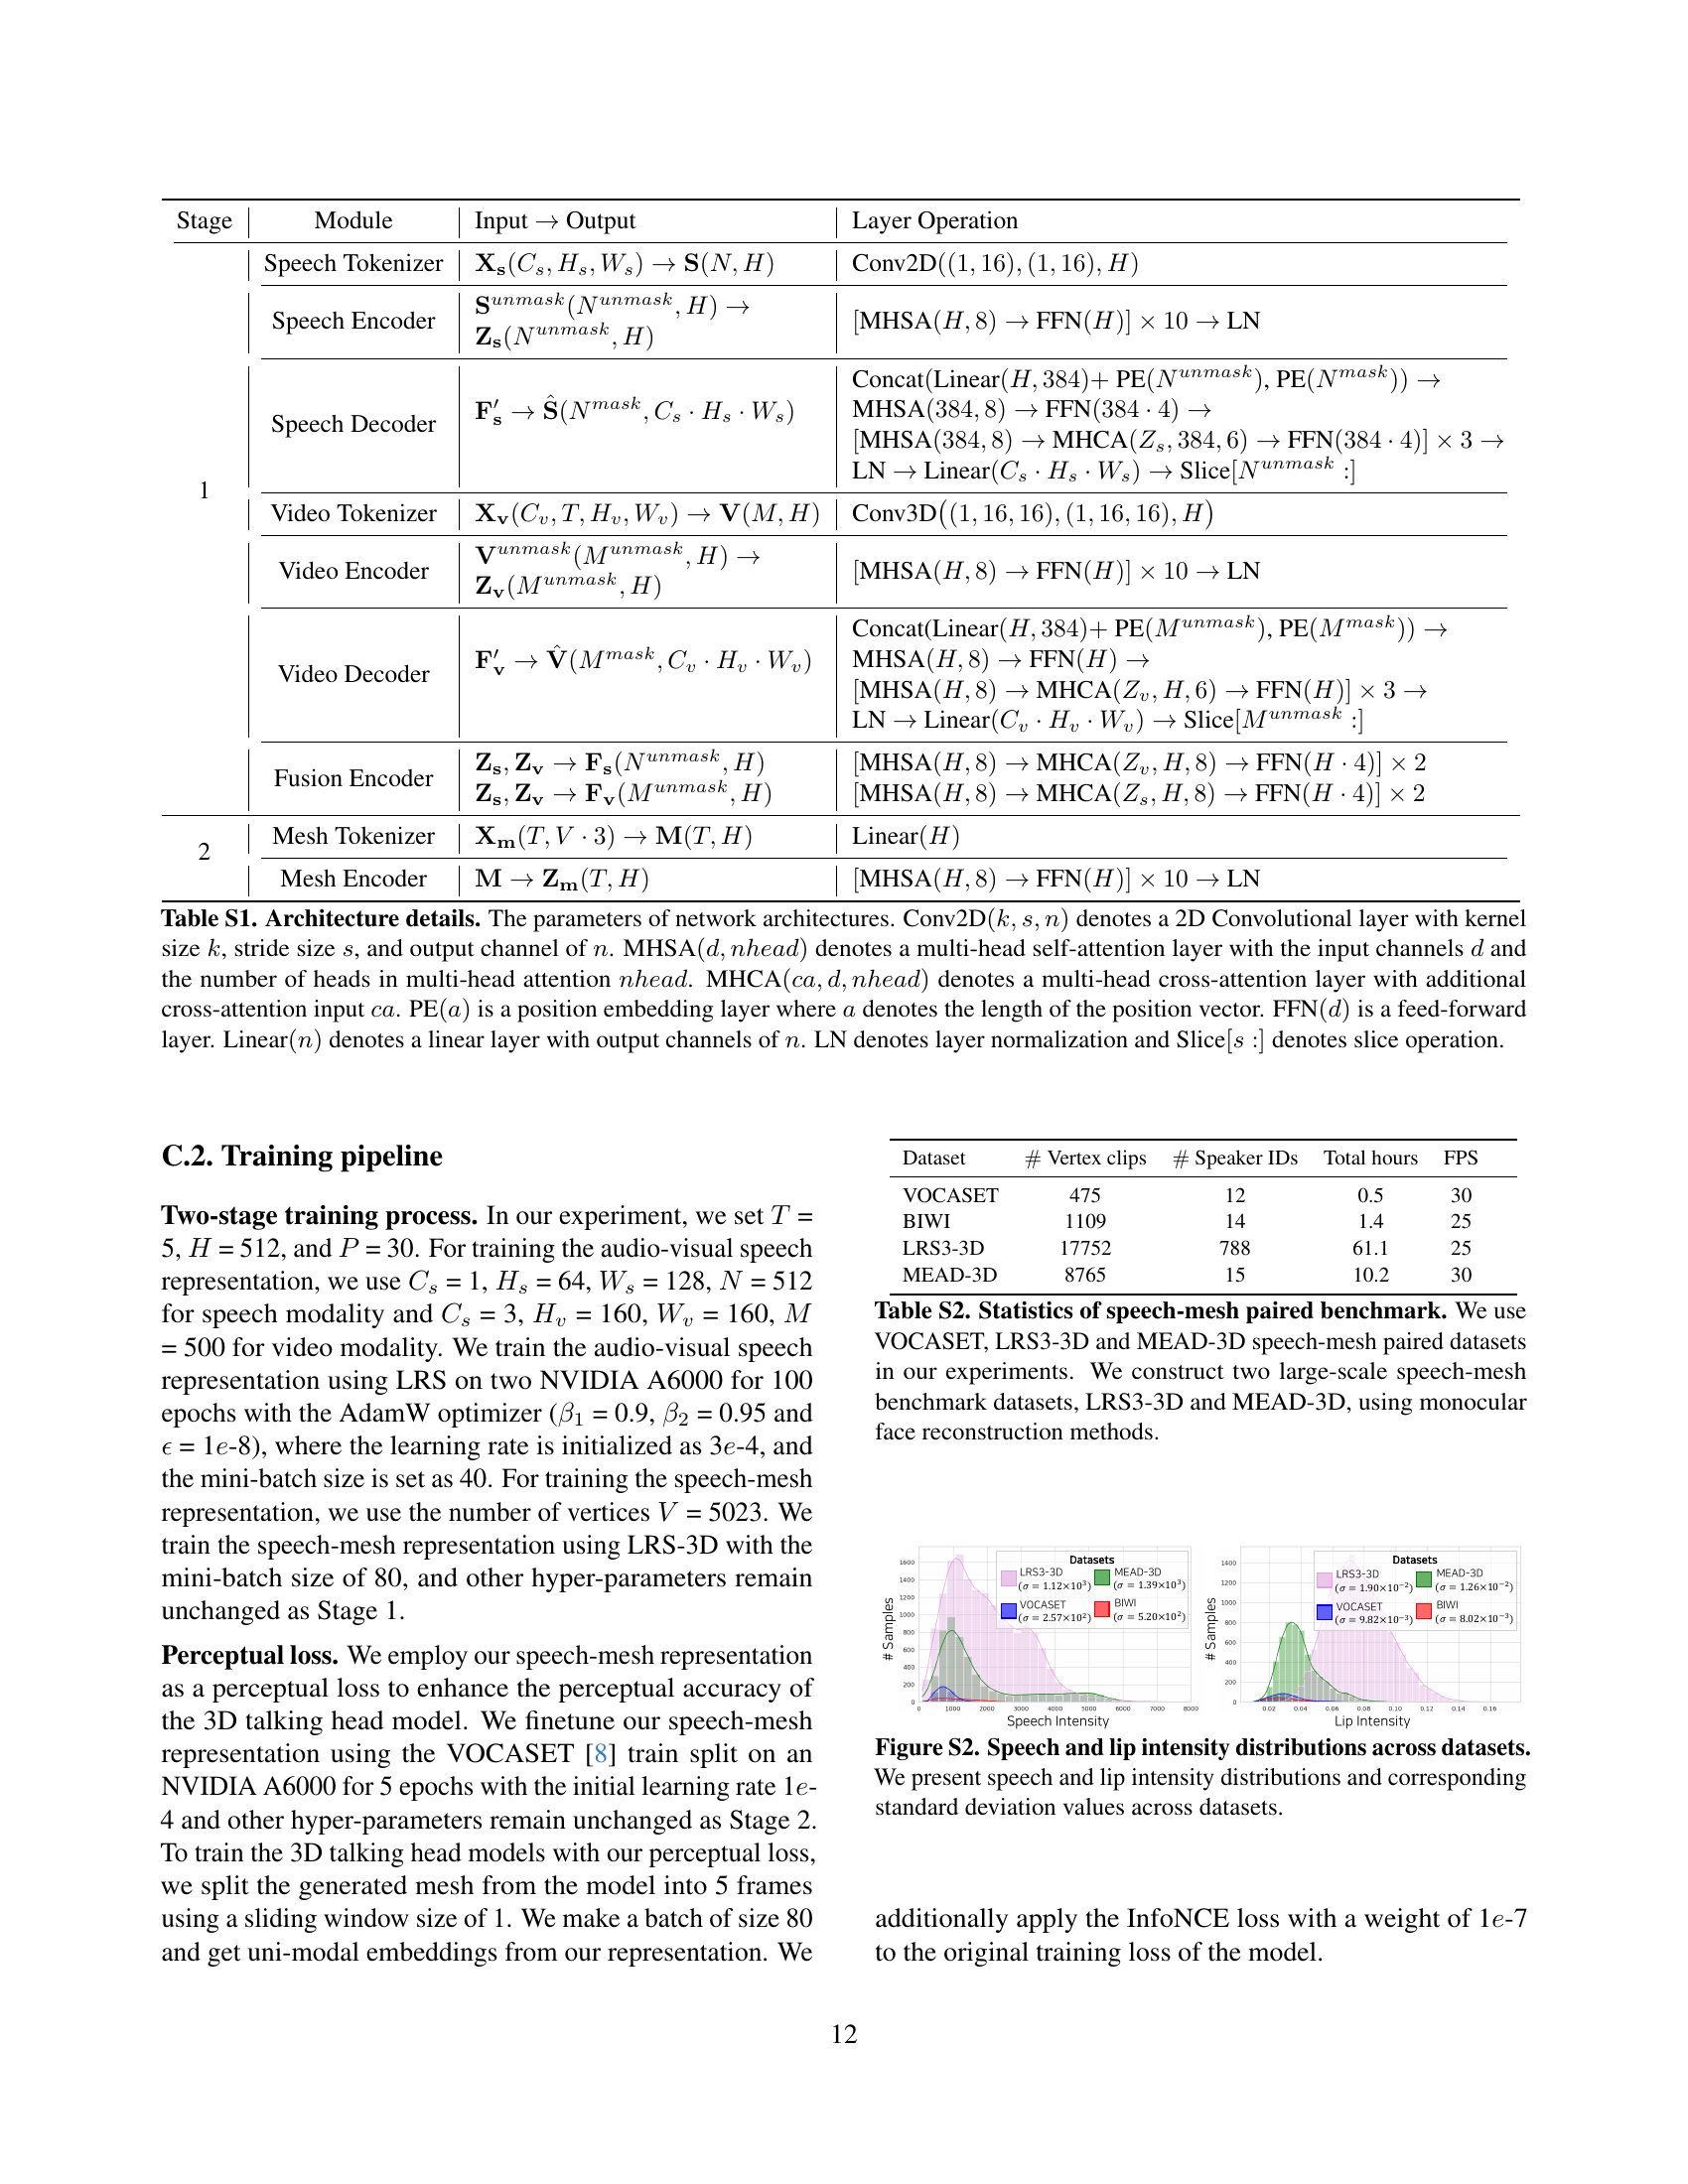
🔼 This figure displays the distributions of speech and lip intensity across four different datasets: VOCASET, BIWI, LRS3-3D, and MEAD-3D. It uses histograms to show the frequency of various intensity levels for both speech and lip movements within each dataset. The standard deviation (σ) for each distribution is also provided, indicating the variability or spread of intensity values within each dataset. The visual comparison helps illustrate the differences in the range and distribution of speech and lip intensities across these datasets.
read the caption
Figure S2: Speech and lip intensity distributions across datasets. We present speech and lip intensity distributions and corresponding standard deviation values across datasets.

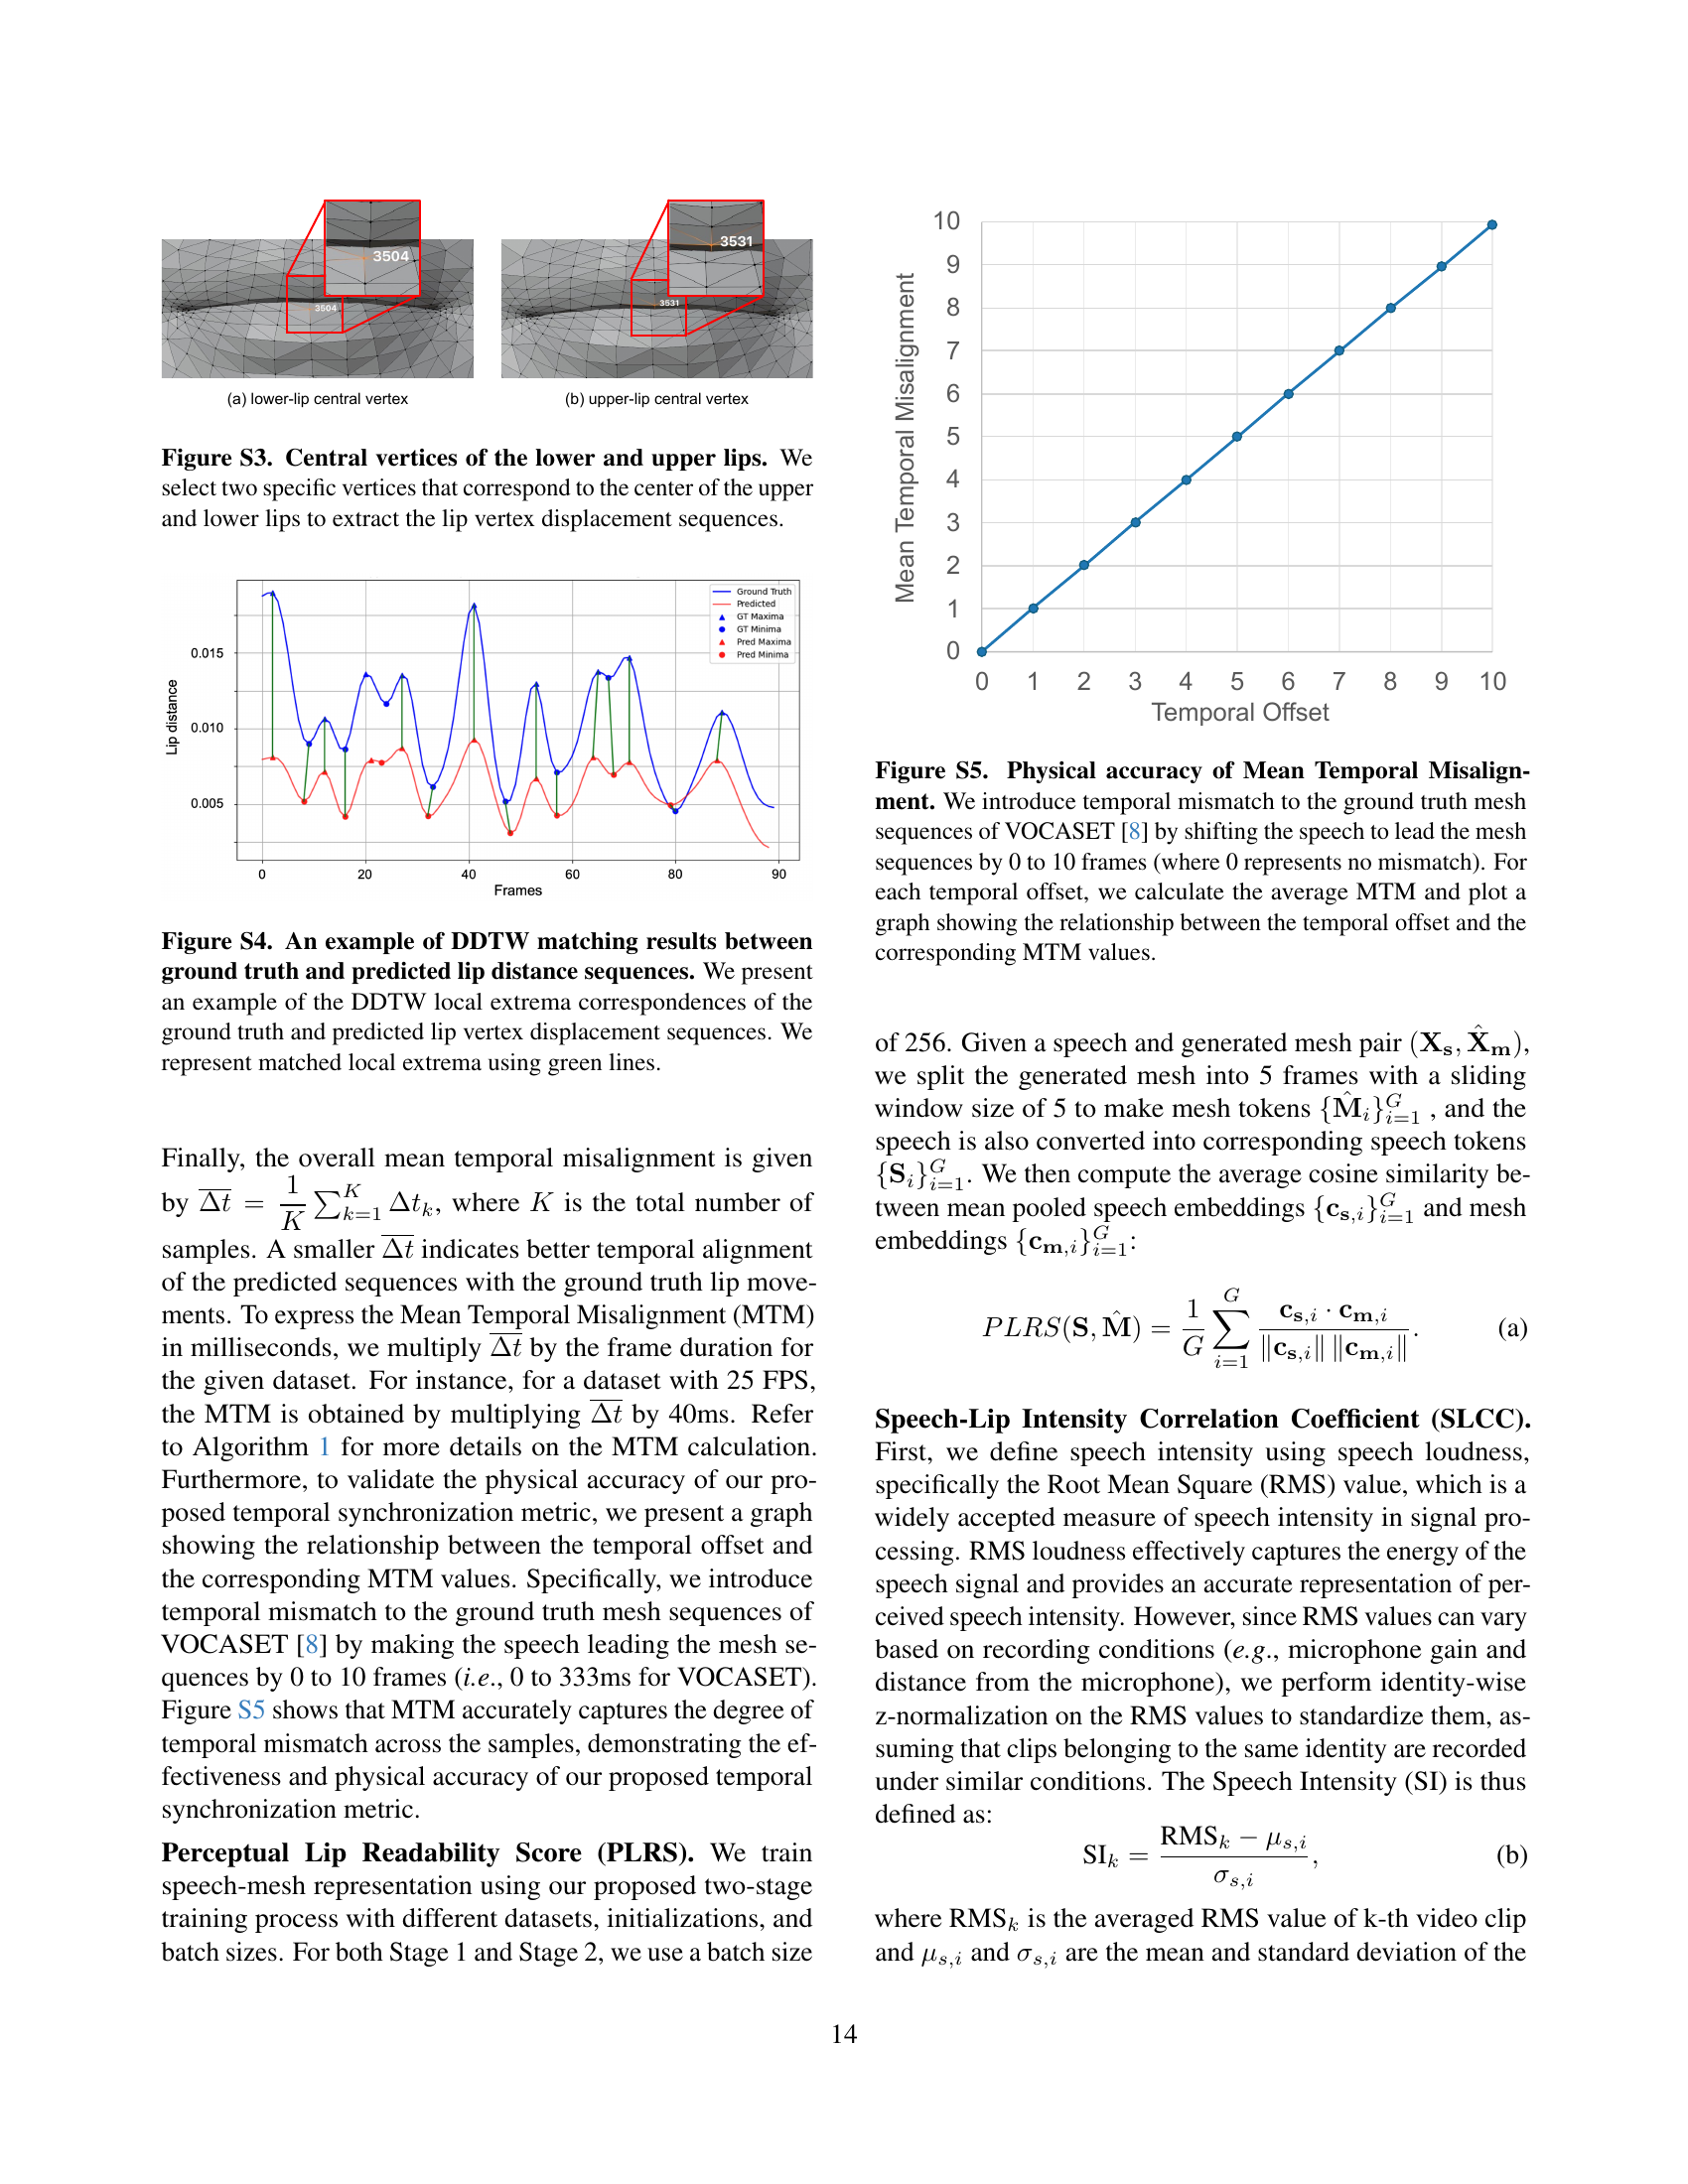
🔼 This figure shows how the lip vertex displacement sequences are extracted. Specifically, it highlights the selection of two central vertices, one from the upper lip and one from the lower lip. These vertices are chosen because they represent the central movement of the lips during speech and provide a reliable measurement of lip movements when calculating displacement sequences for evaluation metrics.
read the caption
Figure S3: Central vertices of the lower and upper lips. We select two specific vertices that correspond to the center of the upper and lower lips to extract the lip vertex displacement sequences.

🔼 This figure displays an example of Dynamic Time Warping (DDTW) applied to lip movement data. The DDTW algorithm finds the optimal alignment between two time series, in this case, the ground truth lip distances (from a reference video) and the predicted lip distances (from a generated video). The plot shows the ground truth lip distance and the predicted lip distance over time. The algorithm identifies local extrema (peaks and valleys) in both curves. Green lines connect matched extrema (peaks to peaks, valleys to valleys) demonstrating the correspondences between the two time series, and thus, how well the generated video’s lip movements match the reference video. The differences in timing between matched extrema represent the temporal misalignment between ground truth and prediction. A smaller difference indicates better lip synchronization.
read the caption
Figure S4: An example of DDTW matching results between ground truth and predicted lip distance sequences. We present an example of the DDTW local extrema correspondences of the ground truth and predicted lip vertex displacement sequences. We represent matched local extrema using green lines.

🔼 This figure demonstrates the accuracy of the Mean Temporal Misalignment (MTM) metric in capturing temporal discrepancies between speech and lip movements. The experiment systematically introduced varying degrees of asynchrony (0 to 10 frames, equivalent to 0 to 333 milliseconds in VOCASET) by shifting the timing of speech relative to the ground truth lip movements. For each level of asynchrony, the average MTM was calculated. The resulting graph plots the calculated MTM values against the corresponding temporal offset (in frames), clearly showing a direct and linear relationship: as the temporal offset increases, so does the MTM, demonstrating the metric’s effectiveness in quantifying the degree of asynchrony.
read the caption
Figure S5: Physical accuracy of Mean Temporal Misalignment. We introduce temporal mismatch to the ground truth mesh sequences of VOCASET [8] by shifting the speech to lead the mesh sequences by 0 to 10 frames (where 0 represents no mismatch). For each temporal offset, we calculate the average MTM and plot a graph showing the relationship between the temporal offset and the corresponding MTM values.

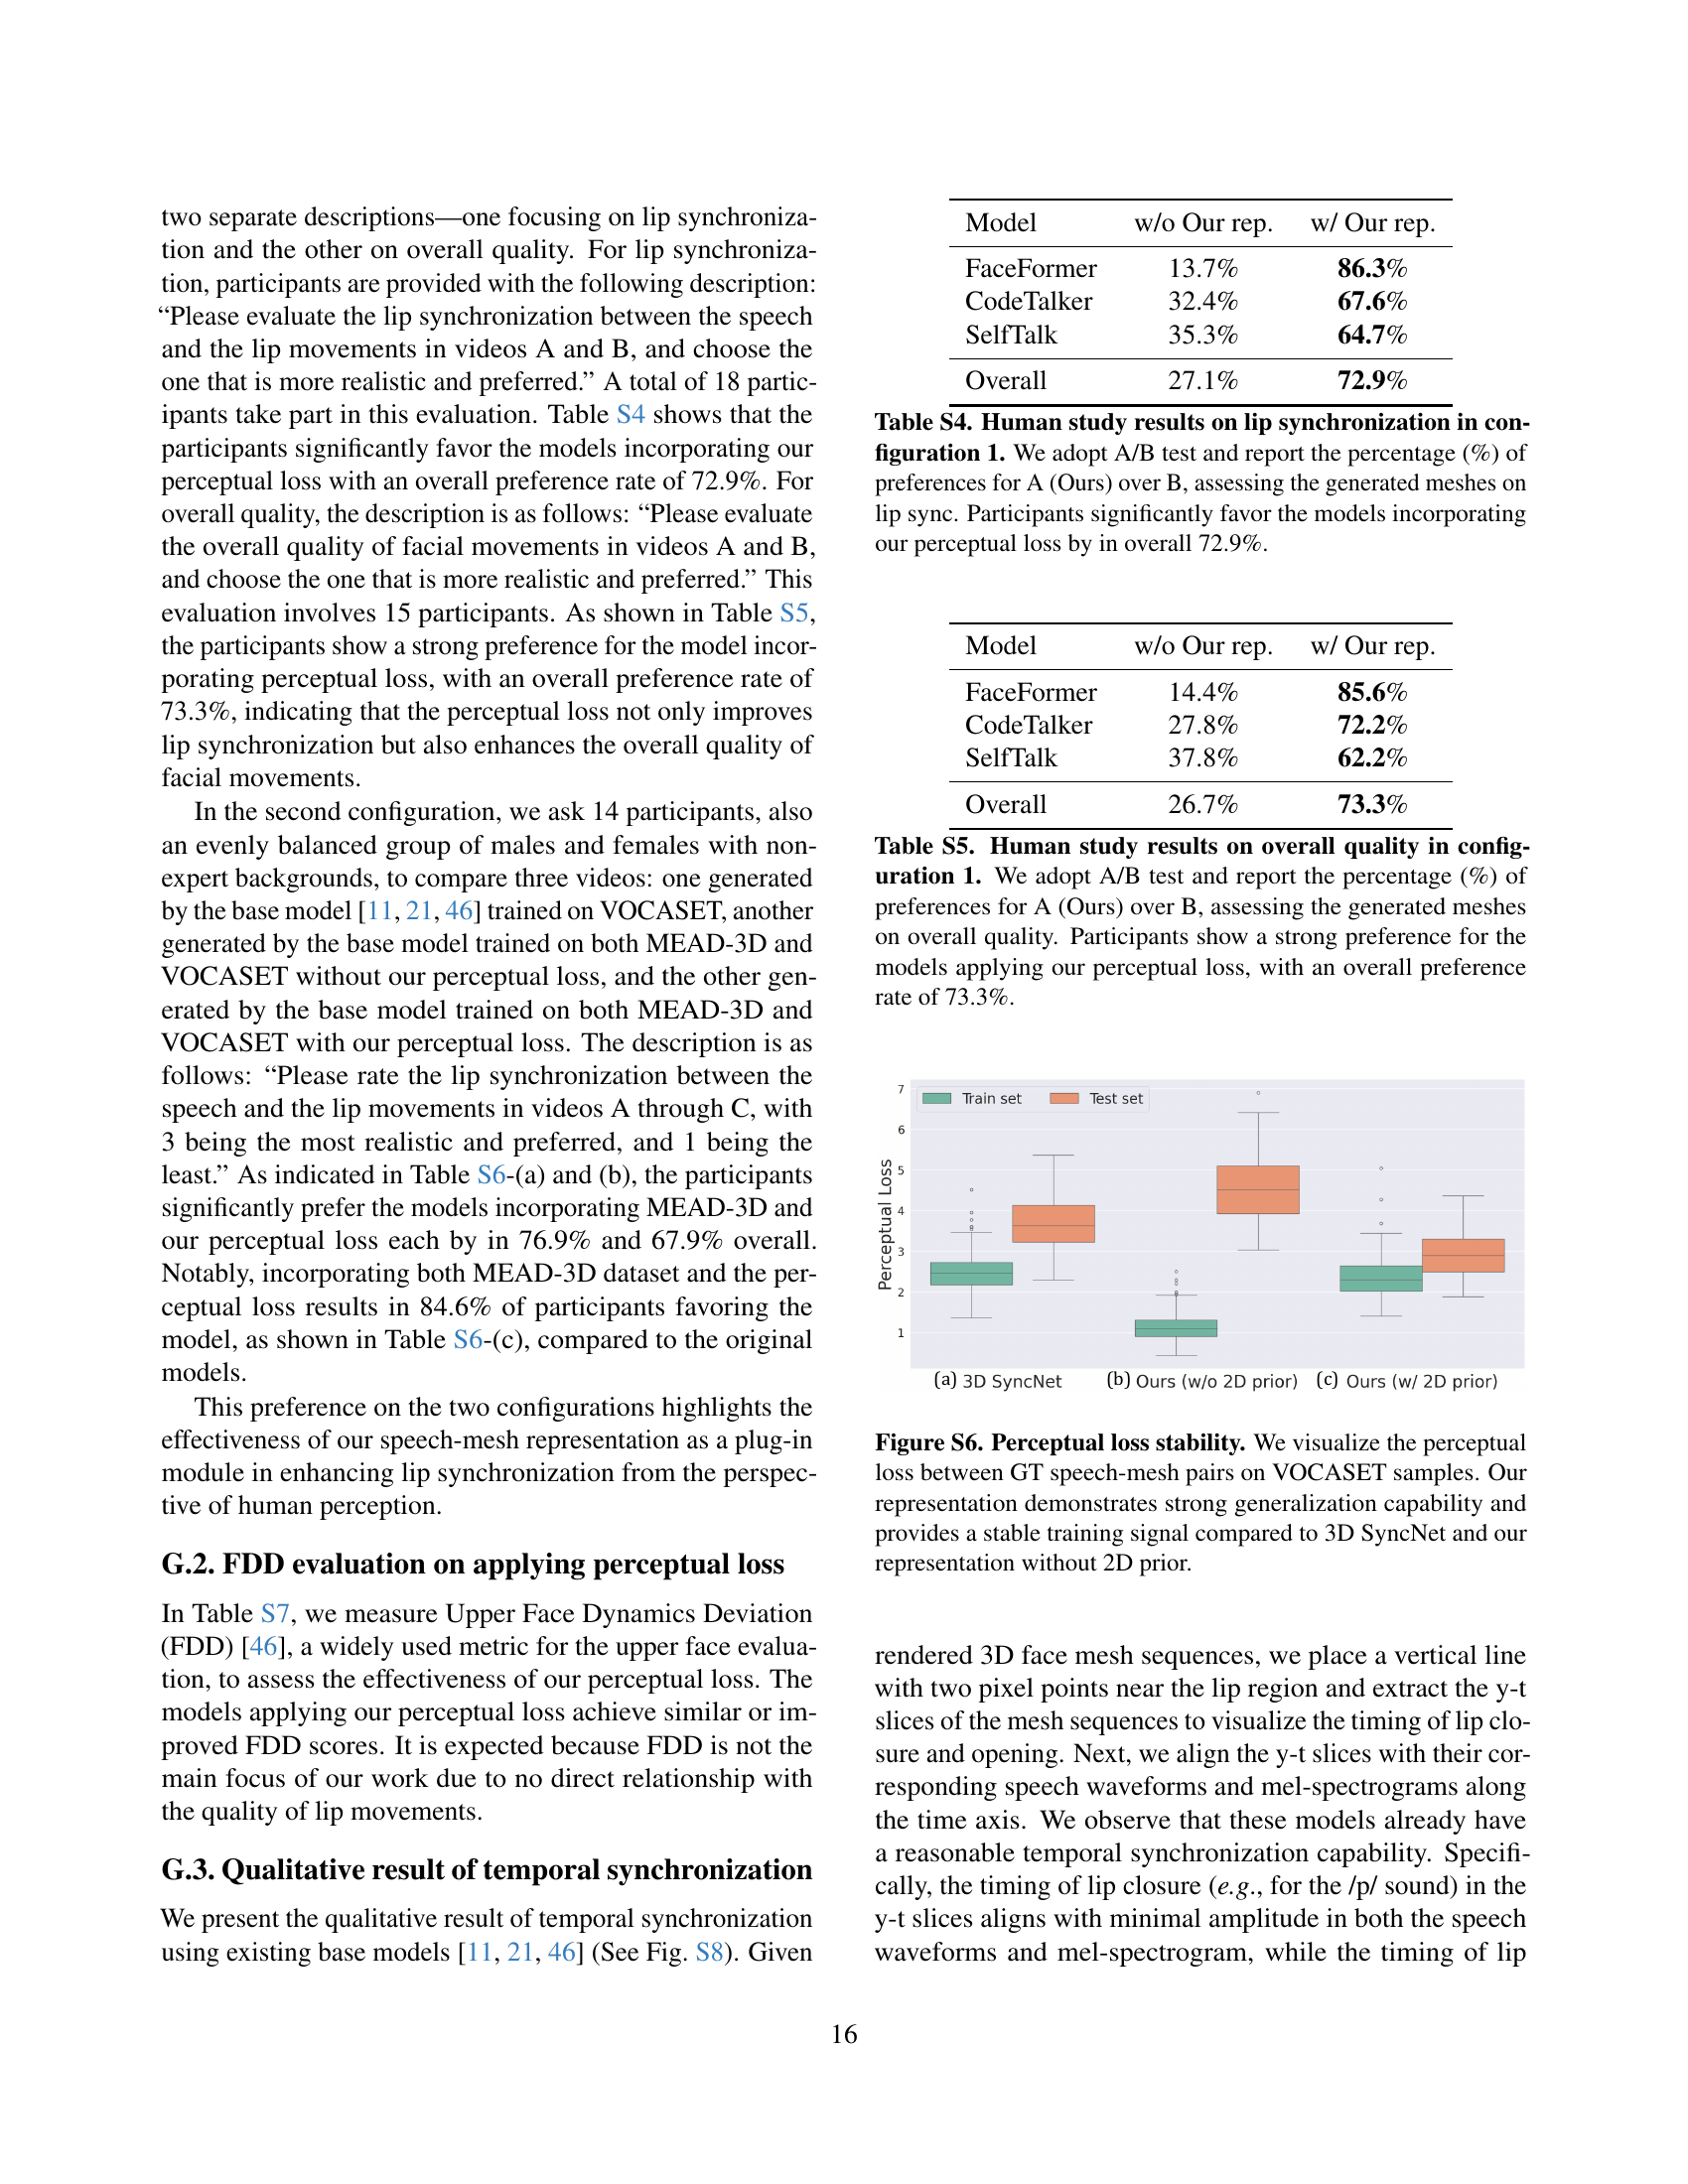
🔼 This figure displays the stability of the perceptual loss function during the training process of three different 3D talking head generation models: 3D SyncNet, a model without a 2D prior, and the proposed model with a 2D prior. The perceptual loss is visualized for both training and test sets using box plots. The y-axis represents the perceptual loss, and the x-axis shows the three models. The box plots illustrate the mean, median, and interquartile range of the perceptual loss, revealing how consistent and stable the loss is across different datasets. The model with the 2D prior exhibits substantially less variability in the perceptual loss, indicating better generalization and stability compared to 3D SyncNet and the model without the 2D prior.
read the caption
Figure S6: Perceptual loss stability. We visualize the perceptual loss between GT speech-mesh pairs on VOCASET samples. Our representation demonstrates strong generalization capability and provides a stable training signal compared to 3D SyncNet and our representation without 2D prior.

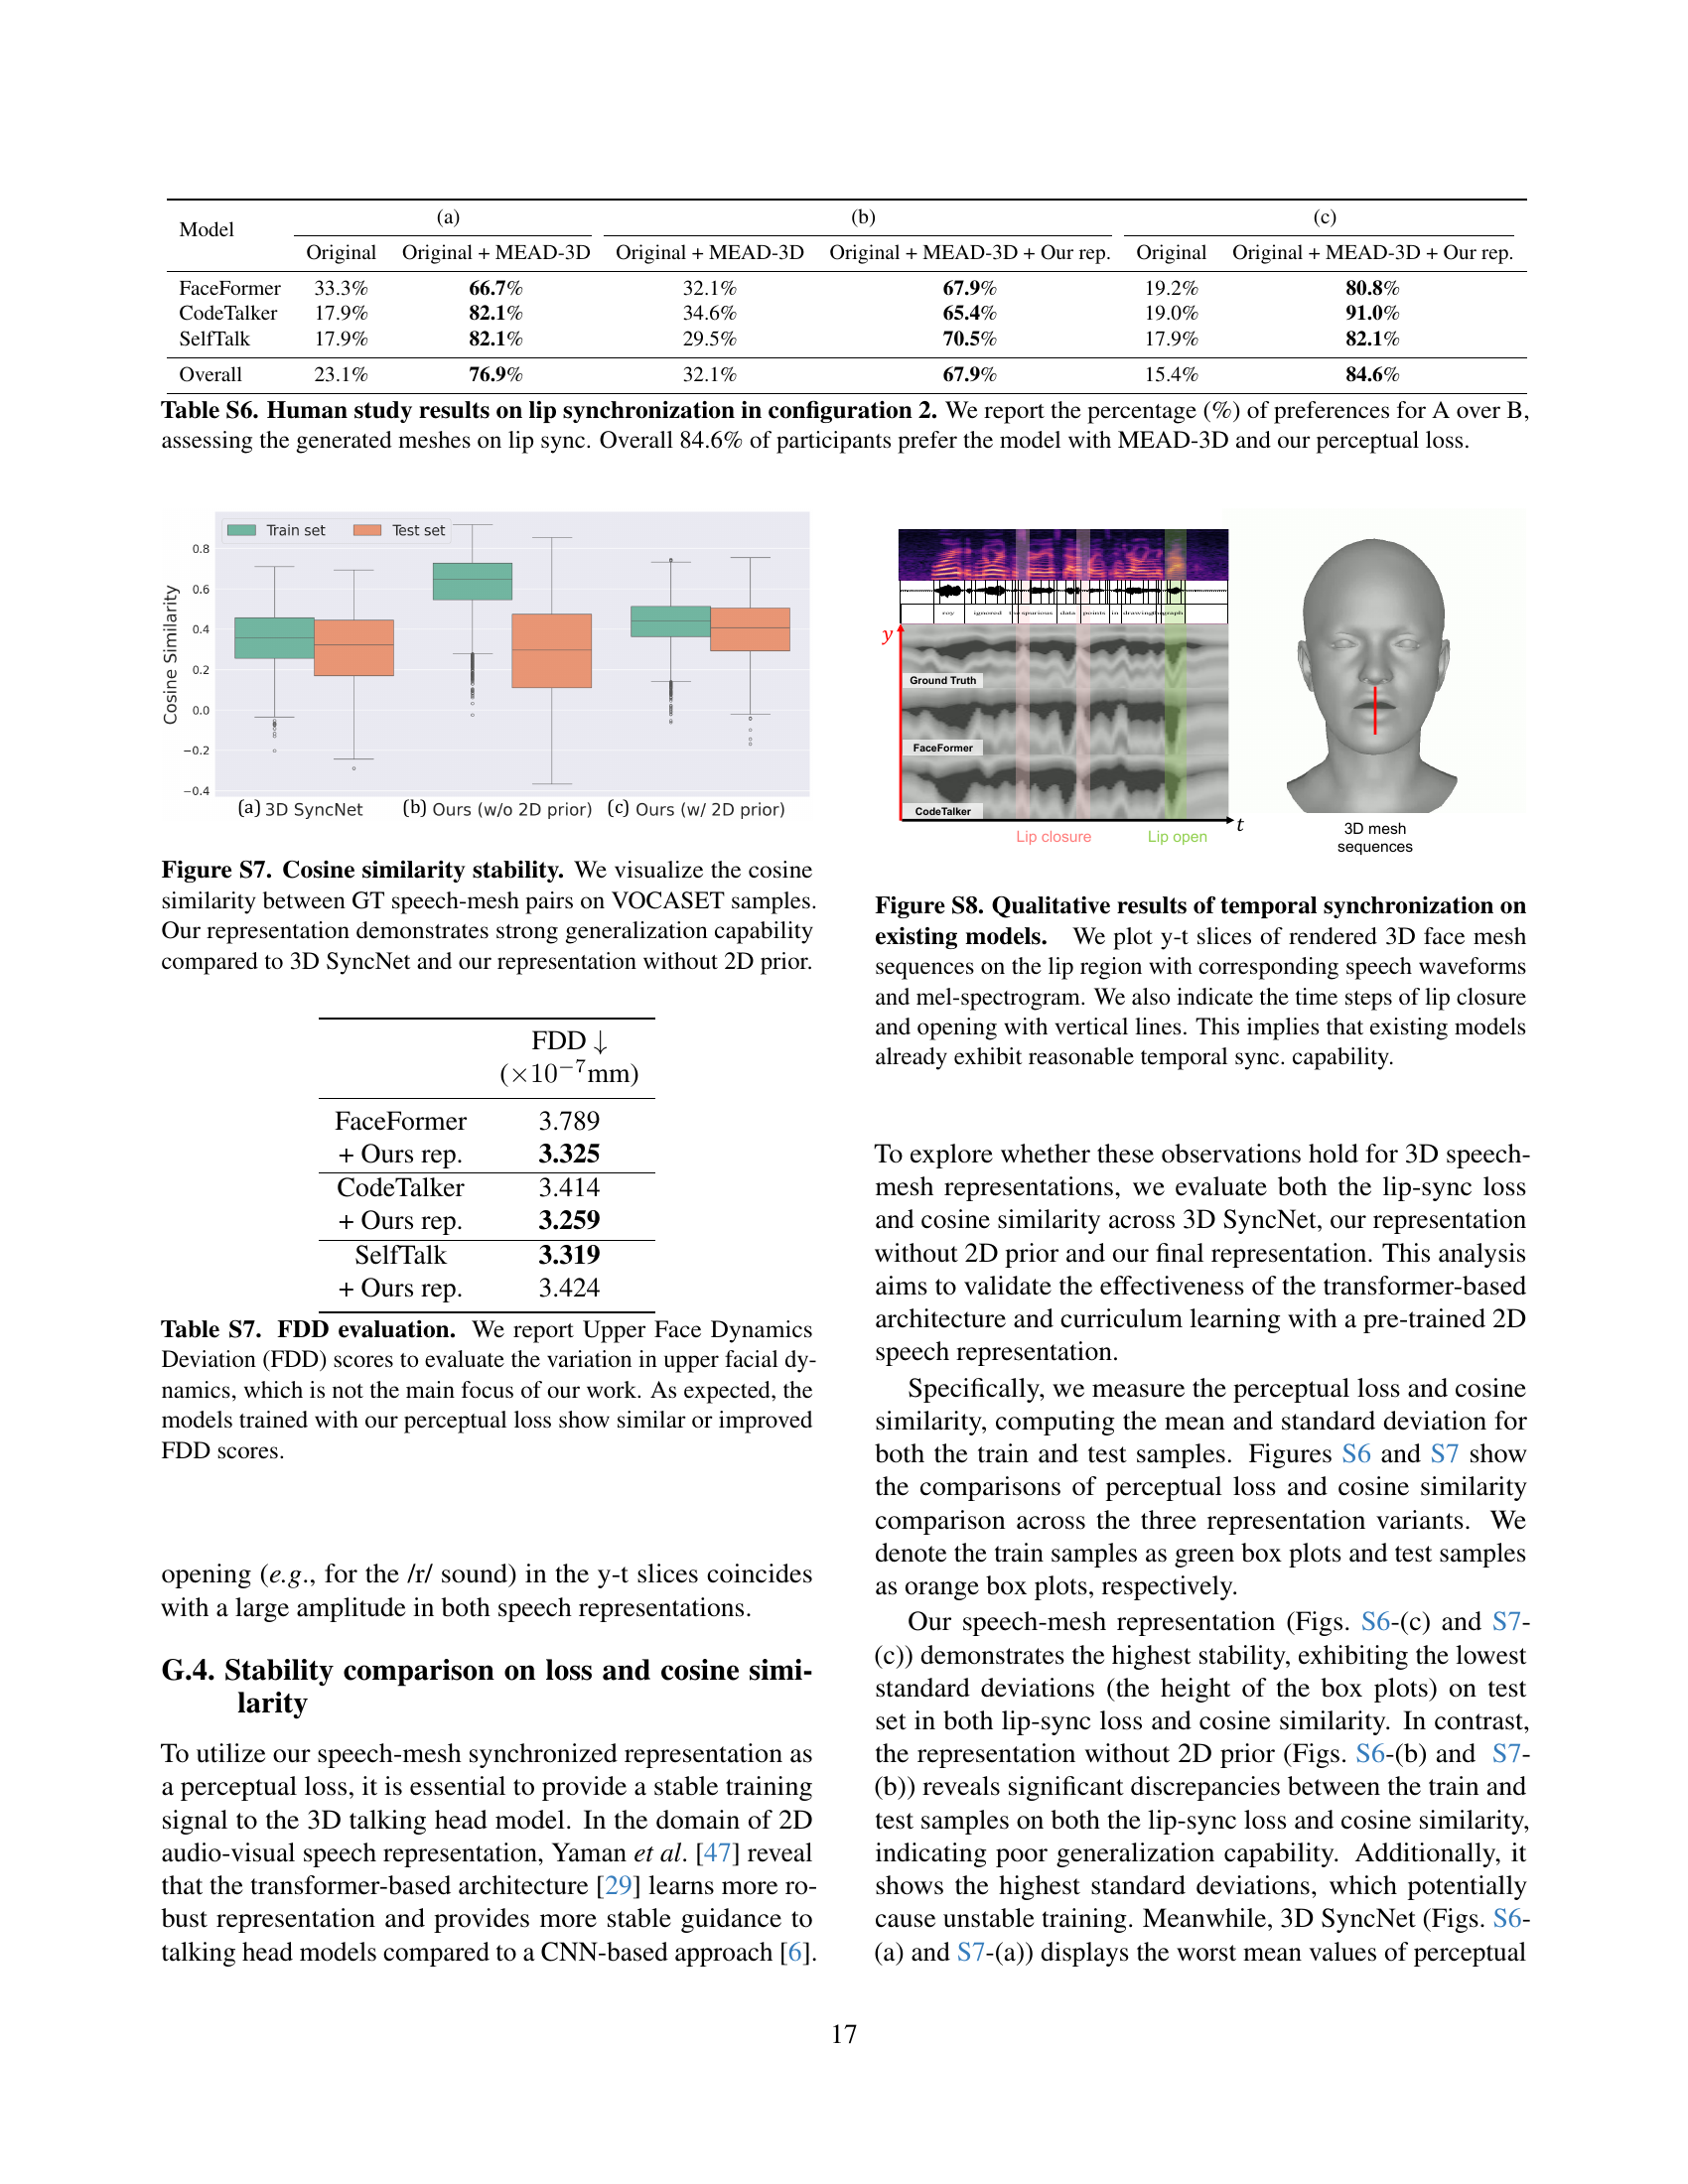
🔼 Figure S7 presents a comparison of the stability of cosine similarity scores across three different speech-mesh representations: the proposed model, the proposed model without the 2D prior, and the 3D SyncNet model. The cosine similarity, a measure of the similarity between the ground truth (GT) speech-mesh pairs and the model’s generated representations, was computed for both training and test samples from the VOCASET dataset. The results, presented as box plots, show that the proposed model exhibits significantly lower variability in cosine similarity scores across the training and testing sets than the other two models. This indicates that the proposed representation generalizes better to unseen data, highlighting its superior robustness and reliability in capturing the intricate relationships between speech and 3D facial mesh.
read the caption
Figure S7: Cosine similarity stability. We visualize the cosine similarity between GT speech-mesh pairs on VOCASET samples. Our representation demonstrates strong generalization capability compared to 3D SyncNet and our representation without 2D prior.
More on tables
| Method | Temporal | Lip | Expressiveness | |
| Synchronization | Readability | |||
| MTM () | LVE () | PLRS () | SLCC / () | |
| VOCASET | - | - | 0.409 | 0.34 / - |
| FaceFormer [11] | 53.6 | 3.357 | 0.368 | 0.26 / 0.08 |
| + Ours rep. | 52.2 | 3.091 | 0.463 | 0.37 / 0.03 |
| CodeTalker [46] | 61.8 | 3.700 | 0.381 | 0.38 / 0.04 |
| + Ours rep. | 60.9 | 3.579 | 0.388 | 0.35 / 0.01 |
| SelfTalk [21] | 50.1 | 2.971 | 0.414 | 0.41 / 0.07 |
| + Ours rep. | 49.2 | 2.924 | 0.418 | 0.35 / 0.01 |
🔼 This table presents a quantitative analysis of lip synchronization performance on the VOCASET [8] test set, using three newly proposed metrics: Mean Temporal Misalignment (MTM), Perceptual Lip Readability Score (PLRS), and Speech-Lip Intensity Correlation Coefficient (SLCC). It compares the performance of three state-of-the-art 3D talking head generation models (FaceFormer [11], CodeTalker [46], and SelfTalk [21]) both with and without the integration of a newly proposed speech-mesh representation. The difference in SLCC between model performance and the dataset distribution (ΔSLCC) is also shown. Lower ΔSLCC indicates better alignment with dataset intensity correlations. The results demonstrate how the proposed representation consistently improves all three lip synchronization aspects.
read the caption
Table 2: Quantitative results of lip synchronization on VOCASET [8] test set. We evaluate the base models on our proposed lip synchronization metrics. We denote ΔΔ\Deltaroman_Δ as the difference in SLCC between the model and those measured on the data distribution. A lower ΔΔ\Deltaroman_Δ indicates the model more closely represents the intensity correlation of the dataset. We demonstrate the effectiveness of our representation in consistently enhancing all three aspects of lip synchronization.
| Method | Perceptual Loss | Temporal | Lip | Expressiveness | |
| Synchronization | Readability | ||||
| MTM () | LVE () | PLRS () | SLCC / () | ||
| VOCASET | - | - | - | 0.409 | 0.34 / - |
| FaceFormer [11] | ✗ | 53.6 | 3.357 | 0.368 | 0.26 / 0.08 |
| 3D SyncNet | 55.6 | 3.316 | 0.435 | 0.38 / 0.04 | |
| Ours w/o 2D prior | 55.3 | 3.278 | 0.400 | 0.42 / 0.08 | |
| Ours w/ 2D prior | 52.2 | 3.091 | 0.463 | 0.37 / 0.03 | |
| CodeTalker [46] | ✗ | 61.8 | 3.700 | 0.381 | 0.38 / 0.04 |
| 3D SyncNet | 59.6 | 4.319 | 0.379 | 0.14 / 0.20 | |
| Ours w/o 2D prior | 55.9 | 3.579 | 0.374 | 0.23 / 0.11 | |
| Ours w/ 2D prior | 60.9 | 3.579 | 0.388 | 0.35 / 0.01 | |
| SelfTalk [21] | ✗ | 50.1 | 2.971 | 0.414 | 0.41 / 0.07 |
| 3D SyncNet | 49.5 | 2.941 | 0.405 | 0.35 / 0.01 | |
| Ours w/o 2D prior | 54.4 | 3.149 | 0.417 | 0.39 / 0.05 | |
| Ours w/ 2D prior | 49.2 | 2.924 | 0.418 | 0.35 / 0.01 | |
🔼 This ablation study investigates the impact of different design choices on the proposed speech-mesh synchronized representation. Specifically, it examines the contribution of the transformer-based architecture and the use of a pre-trained 2D speech representation (2D prior) to the overall performance. By systematically removing these components, the study isolates their individual effects on three key aspects of 3D talking head generation: temporal synchronization, lip readability, and expressiveness. This allows for a quantitative assessment of the importance of each element in achieving perceptually accurate lip movements.
read the caption
Table 3: Ablation study on architectural choice and 2D prior knowledge. We validate the effectiveness of the transformer-based architecture and curriculum learning with a pre-trained 2D speech representation by ablating them from our proposed representation.
| Method | Temporal | Lip | Expressiveness | ||||
| Synchronization | Readability | ||||||
| MTM () | LVE () | PLRS () | SLCC / () | ||||
| Lv1 | Lv2 | Lv3 | Avg | ||||
| MEAD-3D | - | - | 0.230 | 0.24 / - | 0.30 / - | 0.39 / - | 0.42 / - |
| FaceFormer [11] | 59.6 | 3.207 | 0.299 | 0.08 / 0.16 | 0.07 / 0.23 | 0.07 / 0.32 | 0.06 / 0.36 |
| + MEAD-3D | 59.5 | 1.139 | 0.176 | 0.26 / 0.02 | 0.30 / 0.00 | 0.34 / 0.05 | 0.35 / 0.07 |
| + Ours rep. | 55.8 | 1.114 | 0.306 | 0.27 / 0.03 | 0.27 / 0.03 | 0.32 / 0.07 | 0.33 / 0.09 |
| CodeTalker [46] | 60.7 | 3.236 | 0.294 | 0.02 / 0.22 | 0.03 / 0.27 | 0.03 / 0.36 | 0.02 / 0.40 |
| + MEAD-3D | 60.9 | 2.954 | 0.154 | 0.09 / 0.15 | 0.12 / 0.18 | 0.06 / 0.33 | 0.11 / 0.31 |
| + Ours rep. | 58.6 | 2.705 | 0.221 | 0.18 / 0.06 | 0.29 / 0.01 | 0.31 / 0.08 | 0.31 / 0.11 |
| SelfTalk [21] | 53.4 | 3.396 | 0.294 | 0.14 / 0.10 | 0.14 / 0.16 | 0.17 / 0.22 | 0.15 / 0.27 |
| + MEAD-3D | 54.2 | 1.238 | 0.216 | 0.16 / 0.08 | 0.28 / 0.02 | 0.32 / 0.07 | 0.31 / 0.11 |
| + Ours rep. | 52.7 | 1.192 | 0.230 | 0.17 / 0.07 | 0.29 / 0.01 | 0.34 / 0.05 | 0.33 / 0.09 |
🔼 This table presents a quantitative analysis of lip synchronization performance on the MEAD-3D test set. It evaluates three state-of-the-art 3D talking head generation models (FaceFormer, CodeTalker, and SelfTalk) using several metrics: Mean Temporal Misalignment (MTM) to measure temporal synchronization, Lip Vertex Error (LVE) and Perceptual Lip Readability Score (PLRS) to assess lip readability, and Speech-Lip Intensity Correlation Coefficient (SLCC) to evaluate expressiveness. The table compares the performance of the base models with and without a proposed perceptual loss, and also shows level-wise SLCC to further analyze the expressive capability of the models across different intensity levels of speech.
read the caption
Table 4: Quantitative results of lip synchronization on MEAD-3D test set. We evaluate the base models on the MEAD-3D test set. We also compute the level-wise SLCC to evaluate the expressive capability of the models.
| Stage | Module | Input Output | Layer Operation |
| 1 | Speech Tokenizer | Conv2D | |
| Speech Encoder | MHSA FFN LN | ||
| Speech Decoder | ConcatLinear PE, PE | ||
| MHSA FFN | |||
| MHSA MHCA FFN | |||
| LN Linear Slice | |||
| Video Tokenizer | Conv3D | ||
| Video Encoder | MHSA FFN LN | ||
| Video Decoder | Concat(Linear PE, PE | ||
| MHSA FFN | |||
| MHSA MHCA FFN | |||
| LN Linear Slice | |||
| Fusion Encoder | MHSA MHCA FFN | ||
| MHSA MHCA FFN | |||
| 2 | Mesh Tokenizer | Linear | |
| Mesh Encoder | MHSA FFN LN |
🔼 Table S1 provides detailed specifications of the network architecture used in the research. It outlines the layers, their functions, and the parameters used in each. For instance, it defines the types of convolutional and attention layers used (2D convolutional, multi-head self-attention, and multi-head cross-attention), along with their input and output dimensions and hyperparameters. It also clarifies other components like position embeddings, feed-forward networks, layer normalization, and the slice operation. This comprehensive description helps in understanding the model’s structure and its workings.
read the caption
Table S1: Architecture details. The parameters of network architectures. Conv2D(k,s,n)𝑘𝑠𝑛(k,s,n)( italic_k , italic_s , italic_n ) denotes a 2D Convolutional layer with kernel size k𝑘kitalic_k, stride size s𝑠sitalic_s, and output channel of n𝑛nitalic_n. MHSA(d,nhead)𝑑𝑛ℎ𝑒𝑎𝑑(d,nhead)( italic_d , italic_n italic_h italic_e italic_a italic_d ) denotes a multi-head self-attention layer with the input channels d𝑑ditalic_d and the number of heads in multi-head attention nhead𝑛ℎ𝑒𝑎𝑑nheaditalic_n italic_h italic_e italic_a italic_d. MHCA(ca,d,nhead)𝑐𝑎𝑑𝑛ℎ𝑒𝑎𝑑(ca,d,nhead)( italic_c italic_a , italic_d , italic_n italic_h italic_e italic_a italic_d ) denotes a multi-head cross-attention layer with additional cross-attention input ca𝑐𝑎caitalic_c italic_a. PE(a)𝑎(a)( italic_a ) is a position embedding layer where a𝑎aitalic_a denotes the length of the position vector. FFN(d)𝑑(d)( italic_d ) is a feed-forward layer. Linear(n)𝑛(n)( italic_n ) denotes a linear layer with output channels of n𝑛nitalic_n. LN denotes layer normalization and Slice[s:][s:][ italic_s : ] denotes slice operation.
| Dataset | Vertex clips | Speaker IDs | Total hours | FPS | |
| VOCASET | 475 | 12 | 0.5 | 30 | |
| BIWI | 1109 | 14 | 1.4 | 25 | |
| LRS3-3D | 17752 | 788 | 61.1 | 25 | |
| MEAD-3D | 8765 | 15 | 10.2 | 30 |
🔼 Table S2 presents a comparison of four datasets used for speech-driven 3D talking head generation research. Two of these datasets, VOCASET and BIWI, are pre-existing, smaller datasets with limited variations in speech and facial movements. The other two, LRS3-3D and MEAD-3D, were created by the authors using monocular face reconstruction methods to enhance the available data with more diverse speech and facial movements, creating significantly larger datasets more suitable for training sophisticated models.
read the caption
Table S2: Statistics of speech-mesh paired benchmark. We use VOCASET, LRS3-3D and MEAD-3D speech-mesh paired datasets in our experiments. We construct two large-scale speech-mesh benchmark datasets, LRS3-3D and MEAD-3D, using monocular face reconstruction methods.
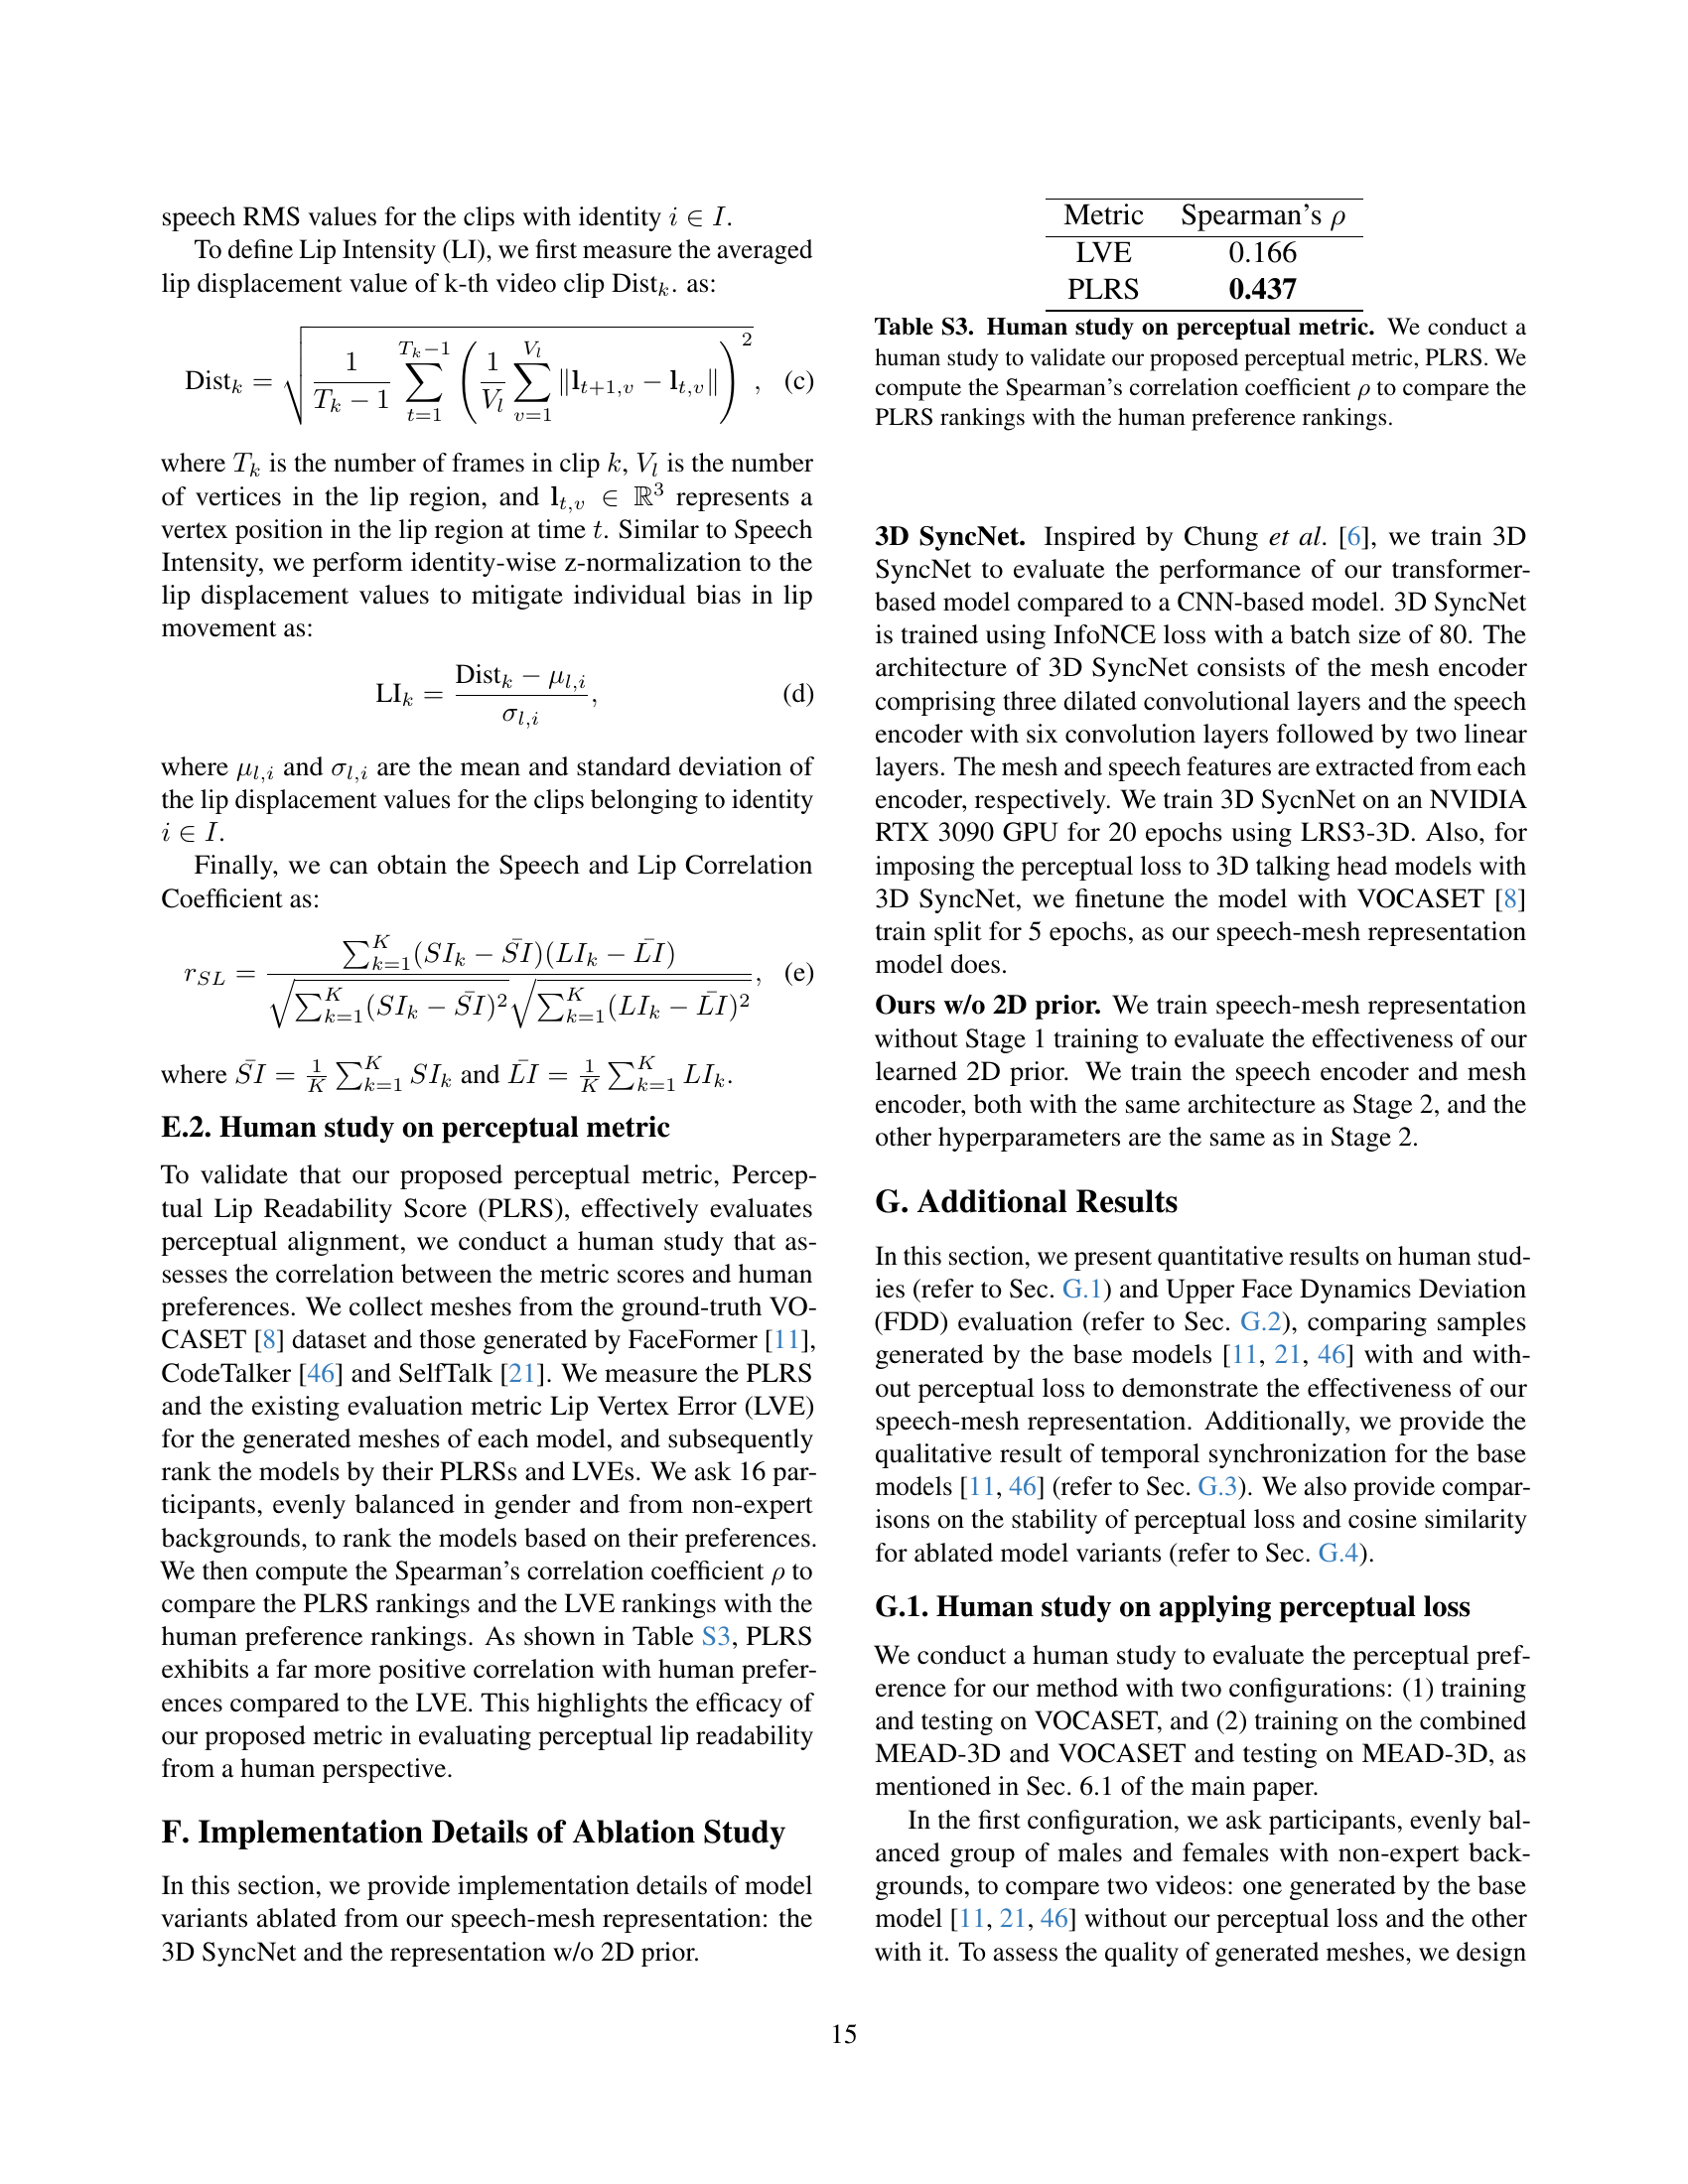
| Metric | Spearman’s |
| LVE | 0.166 |
| PLRS | 0.437 |
🔼 This table presents the results of a human study designed to evaluate the Perceptual Lip Readability Score (PLRS), a new metric proposed in the paper. The study compared human rankings of 3D talking head models based on perceived lip synchronization quality with the rankings generated by the PLRS metric. Spearman’s rank correlation coefficient (ρ) was calculated to quantify the strength and direction of the association between human judgments and the PLRS scores, assessing the metric’s ability to reflect human perception of lip synchronization accuracy.
read the caption
Table S3: Human study on perceptual metric. We conduct a human study to validate our proposed perceptual metric, PLRS. We compute the Spearman’s correlation coefficient ρ𝜌\rhoitalic_ρ to compare the PLRS rankings with the human preference rankings.
| Model | w/o Our rep. | w/ Our rep. |
| FaceFormer | 13.7% | 86.3% |
| CodeTalker | 32.4% | 67.6% |
| SelfTalk | 35.3% | 64.7% |
| Overall | 27.1% | 72.9% |
🔼 This table presents the results of a human preference study comparing 3D talking head models with and without the authors’ proposed perceptual loss. The study used an A/B test, where participants chose between a model using the perceptual loss (A) and one without (B). The models were evaluated on lip synchronization quality. The table reports the percentage of participants who preferred the model with the perceptual loss for each model tested (FaceFormer, CodeTalker, SelfTalk), as well as an overall percentage across all models.
read the caption
Table S4: Human study results on lip synchronization in configuration 1. We adopt A/B test and report the percentage (%) of preferences for A (Ours) over B, assessing the generated meshes on lip sync. Participants significantly favor the models incorporating our perceptual loss by in overall 72.9%.
| Model | w/o Our rep. | w/ Our rep. |
| FaceFormer | 14.4% | 85.6% |
| CodeTalker | 27.8% | 72.2% |
| SelfTalk | 37.8% | 62.2% |
| Overall | 26.7% | 73.3% |
🔼 This table presents the results of a human evaluation comparing the overall quality of 3D-generated meshes. Two groups of 3D meshes are compared: one group generated by models without the proposed perceptual loss, and another group generated by models incorporating this loss. A/B testing was used, where participants chose between a sample from each group. The results show a strong preference (73.3%) for the models using the perceptual loss, demonstrating the positive impact of this loss on the overall quality of the generated meshes.
read the caption
Table S5: Human study results on overall quality in configuration 1. We adopt A/B test and report the percentage (%) of preferences for A (Ours) over B, assessing the generated meshes on overall quality. Participants show a strong preference for the models applying our perceptual loss, with an overall preference rate of 73.3%.
| Model | (a) | (b) | (c) | |||
| Original | Original + MEAD-3D | Original + MEAD-3D | Original + MEAD-3D + Our rep. | Original | Original + MEAD-3D + Our rep. | |
| FaceFormer | 33.3% | 66.7% | 32.1% | 67.9% | 19.2% | 80.8% |
| CodeTalker | 17.9% | 82.1% | 34.6% | 65.4% | 19.0% | 91.0% |
| SelfTalk | 17.9% | 82.1% | 29.5% | 70.5% | 17.9% | 82.1% |
| Overall | 23.1% | 76.9% | 32.1% | 67.9% | 15.4% | 84.6% |
🔼 This table presents the results of a human study comparing three different 3D talking head generation model configurations: a baseline model trained only on VOCASET, a model trained on both VOCASET and MEAD-3D datasets, and a model trained on both datasets and incorporating the authors’ proposed perceptual loss. Participants rated the lip synchronization quality of videos generated by each model. The results show a significant preference for the model incorporating the perceptual loss and the MEAD-3D dataset (84.6% of participants).
read the caption
Table S6: Human study results on lip synchronization in configuration 2. We report the percentage (%) of preferences for A over B, assessing the generated meshes on lip sync. Overall 84.6% of participants prefer the model with MEAD-3D and our perceptual loss.
| FDD | |
| () | |
| FaceFormer | 3.789 |
| + Ours rep. | 3.325 |
| CodeTalker | 3.414 |
| + Ours rep. | 3.259 |
| SelfTalk | 3.319 |
| + Ours rep. | 3.424 |
🔼 Table S7 presents the Upper Face Dynamics Deviation (FDD) scores, a metric evaluating variations in the upper facial dynamics. The table compares FDD scores for models trained with and without the proposed perceptual loss. While not the primary focus of the research, the results show that models trained with the perceptual loss achieve similar or even better FDD scores, indicating an overall improvement in the quality of facial animation.
read the caption
Table S7: FDD evaluation. We report Upper Face Dynamics Deviation (FDD) scores to evaluate the variation in upper facial dynamics, which is not the main focus of our work. As expected, the models trained with our perceptual loss show similar or improved FDD scores.
| Time | Mem. | |
| (sec.) | (MB) | |
| FaceFormer | 0.447 | 1461 |
| + Ours rep. | 0.537 | 1738 |
| CodeTalker | 0.138 | 3393 |
| + Ours rep. | 0.289 | 3675 |
| SelfTalk | 0.175 | 8204 |
| + Ours rep. | 0.320 | 8480 |
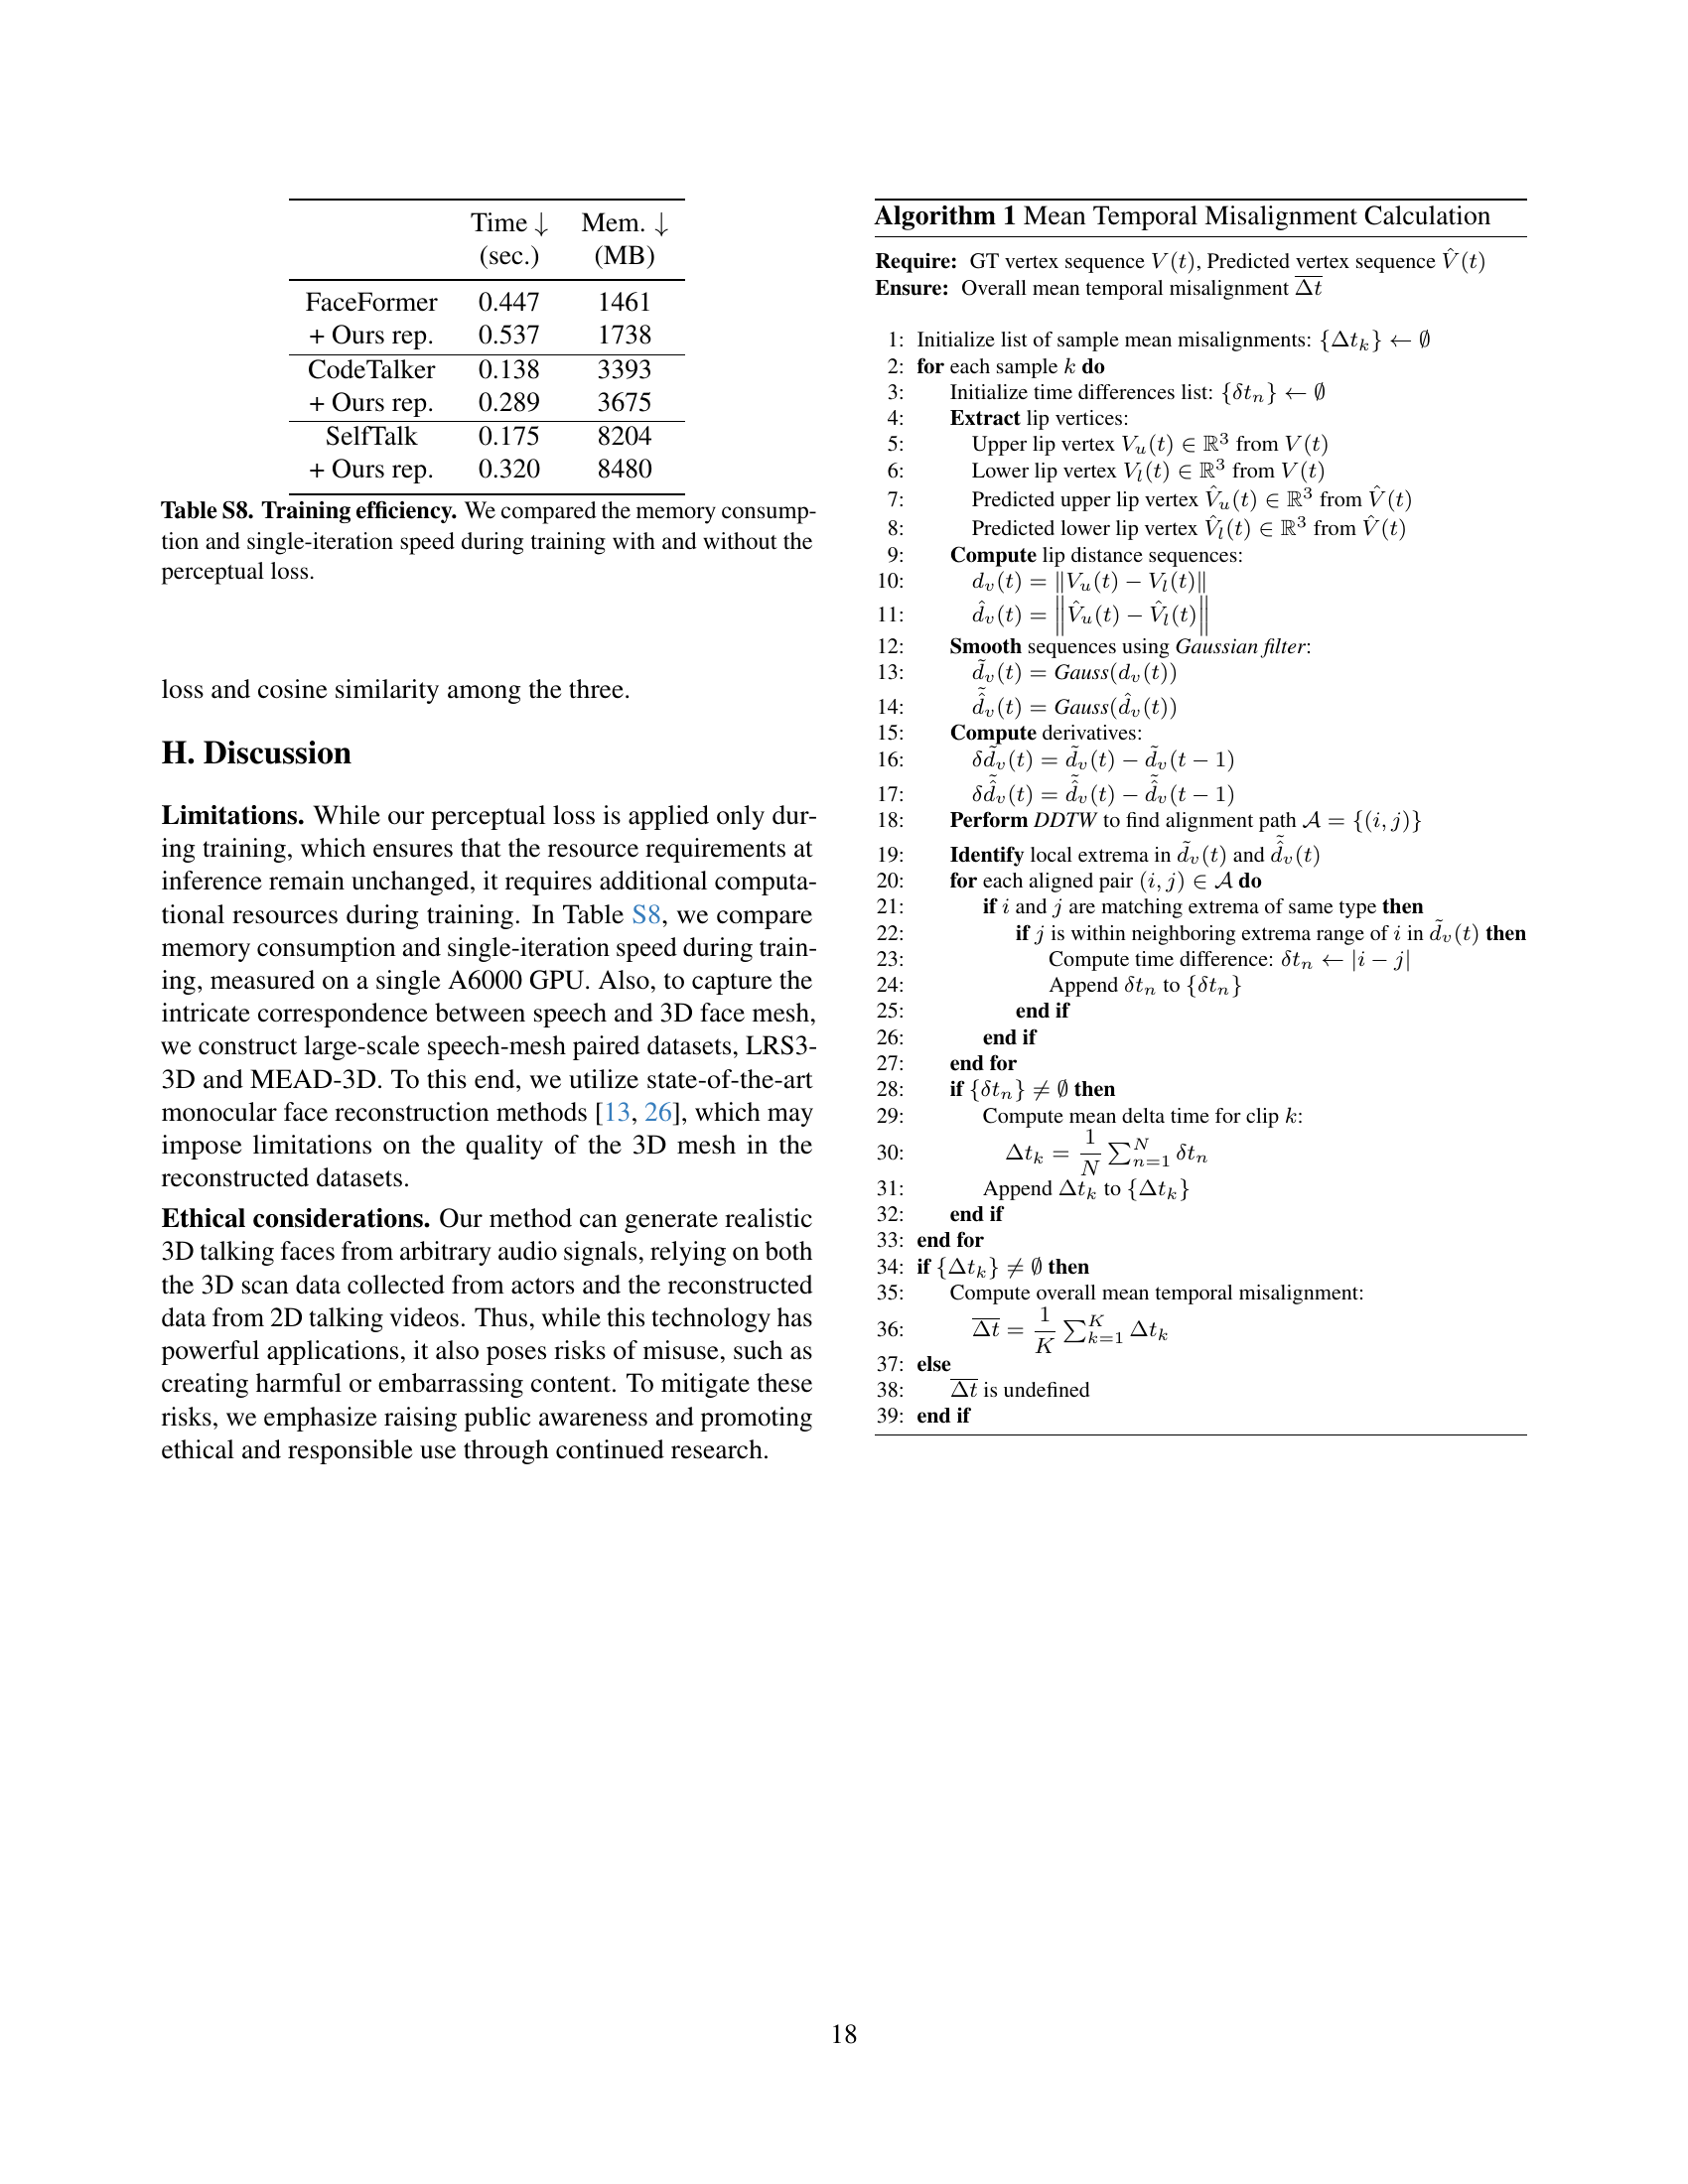
🔼 This table presents a comparison of the training efficiency of various 3D talking head generation models with and without the application of a perceptual loss. Specifically, it shows the memory consumption (in MB) and the time taken for a single training iteration (in seconds) for several models. The models are compared in their base form and after incorporating the perceptual loss, allowing for a direct assessment of the computational overhead introduced by the perceptual loss. This helps to evaluate the trade-off between improved accuracy (due to perceptual loss) and computational cost.
read the caption
Table S8: Training efficiency. We compared the memory consumption and single-iteration speed during training with and without the perceptual loss.
Full paper#