TL;DR#
Existing methods for generating 3D models from 2D images struggle with fine-grained geometric details because of domain gaps, RGB image ambiguities, and limited 3D training data. These limitations affect the realism, precision, and applicability of generated 3D models, hindering the ability to capture complex real-world geometric characteristics.
To address these challenges, the paper presents a framework that uses normal maps as an intermediate representation to bridge 2D images and 3D geometry. The method includes an image-to-normal estimator (NiRNE) with noise injection and dual-stream training for robust estimation, normal-regularized latent diffusion learning to enhance 3D geometry fidelity, and a 3D data synthesis pipeline (DetailVerse) to provide high-quality training data. This approach enhances the generation of fine geometric details and outperforms existing methods.
Key Takeaways#
Why does it matter?#
This paper introduces a novel framework that significantly enhances the fidelity of 3D geometry generation from 2D images by using normal maps, addressing limitations in current methods. It offers new research directions and benchmarks for high-fidelity 3D modeling.
Visual Insights#

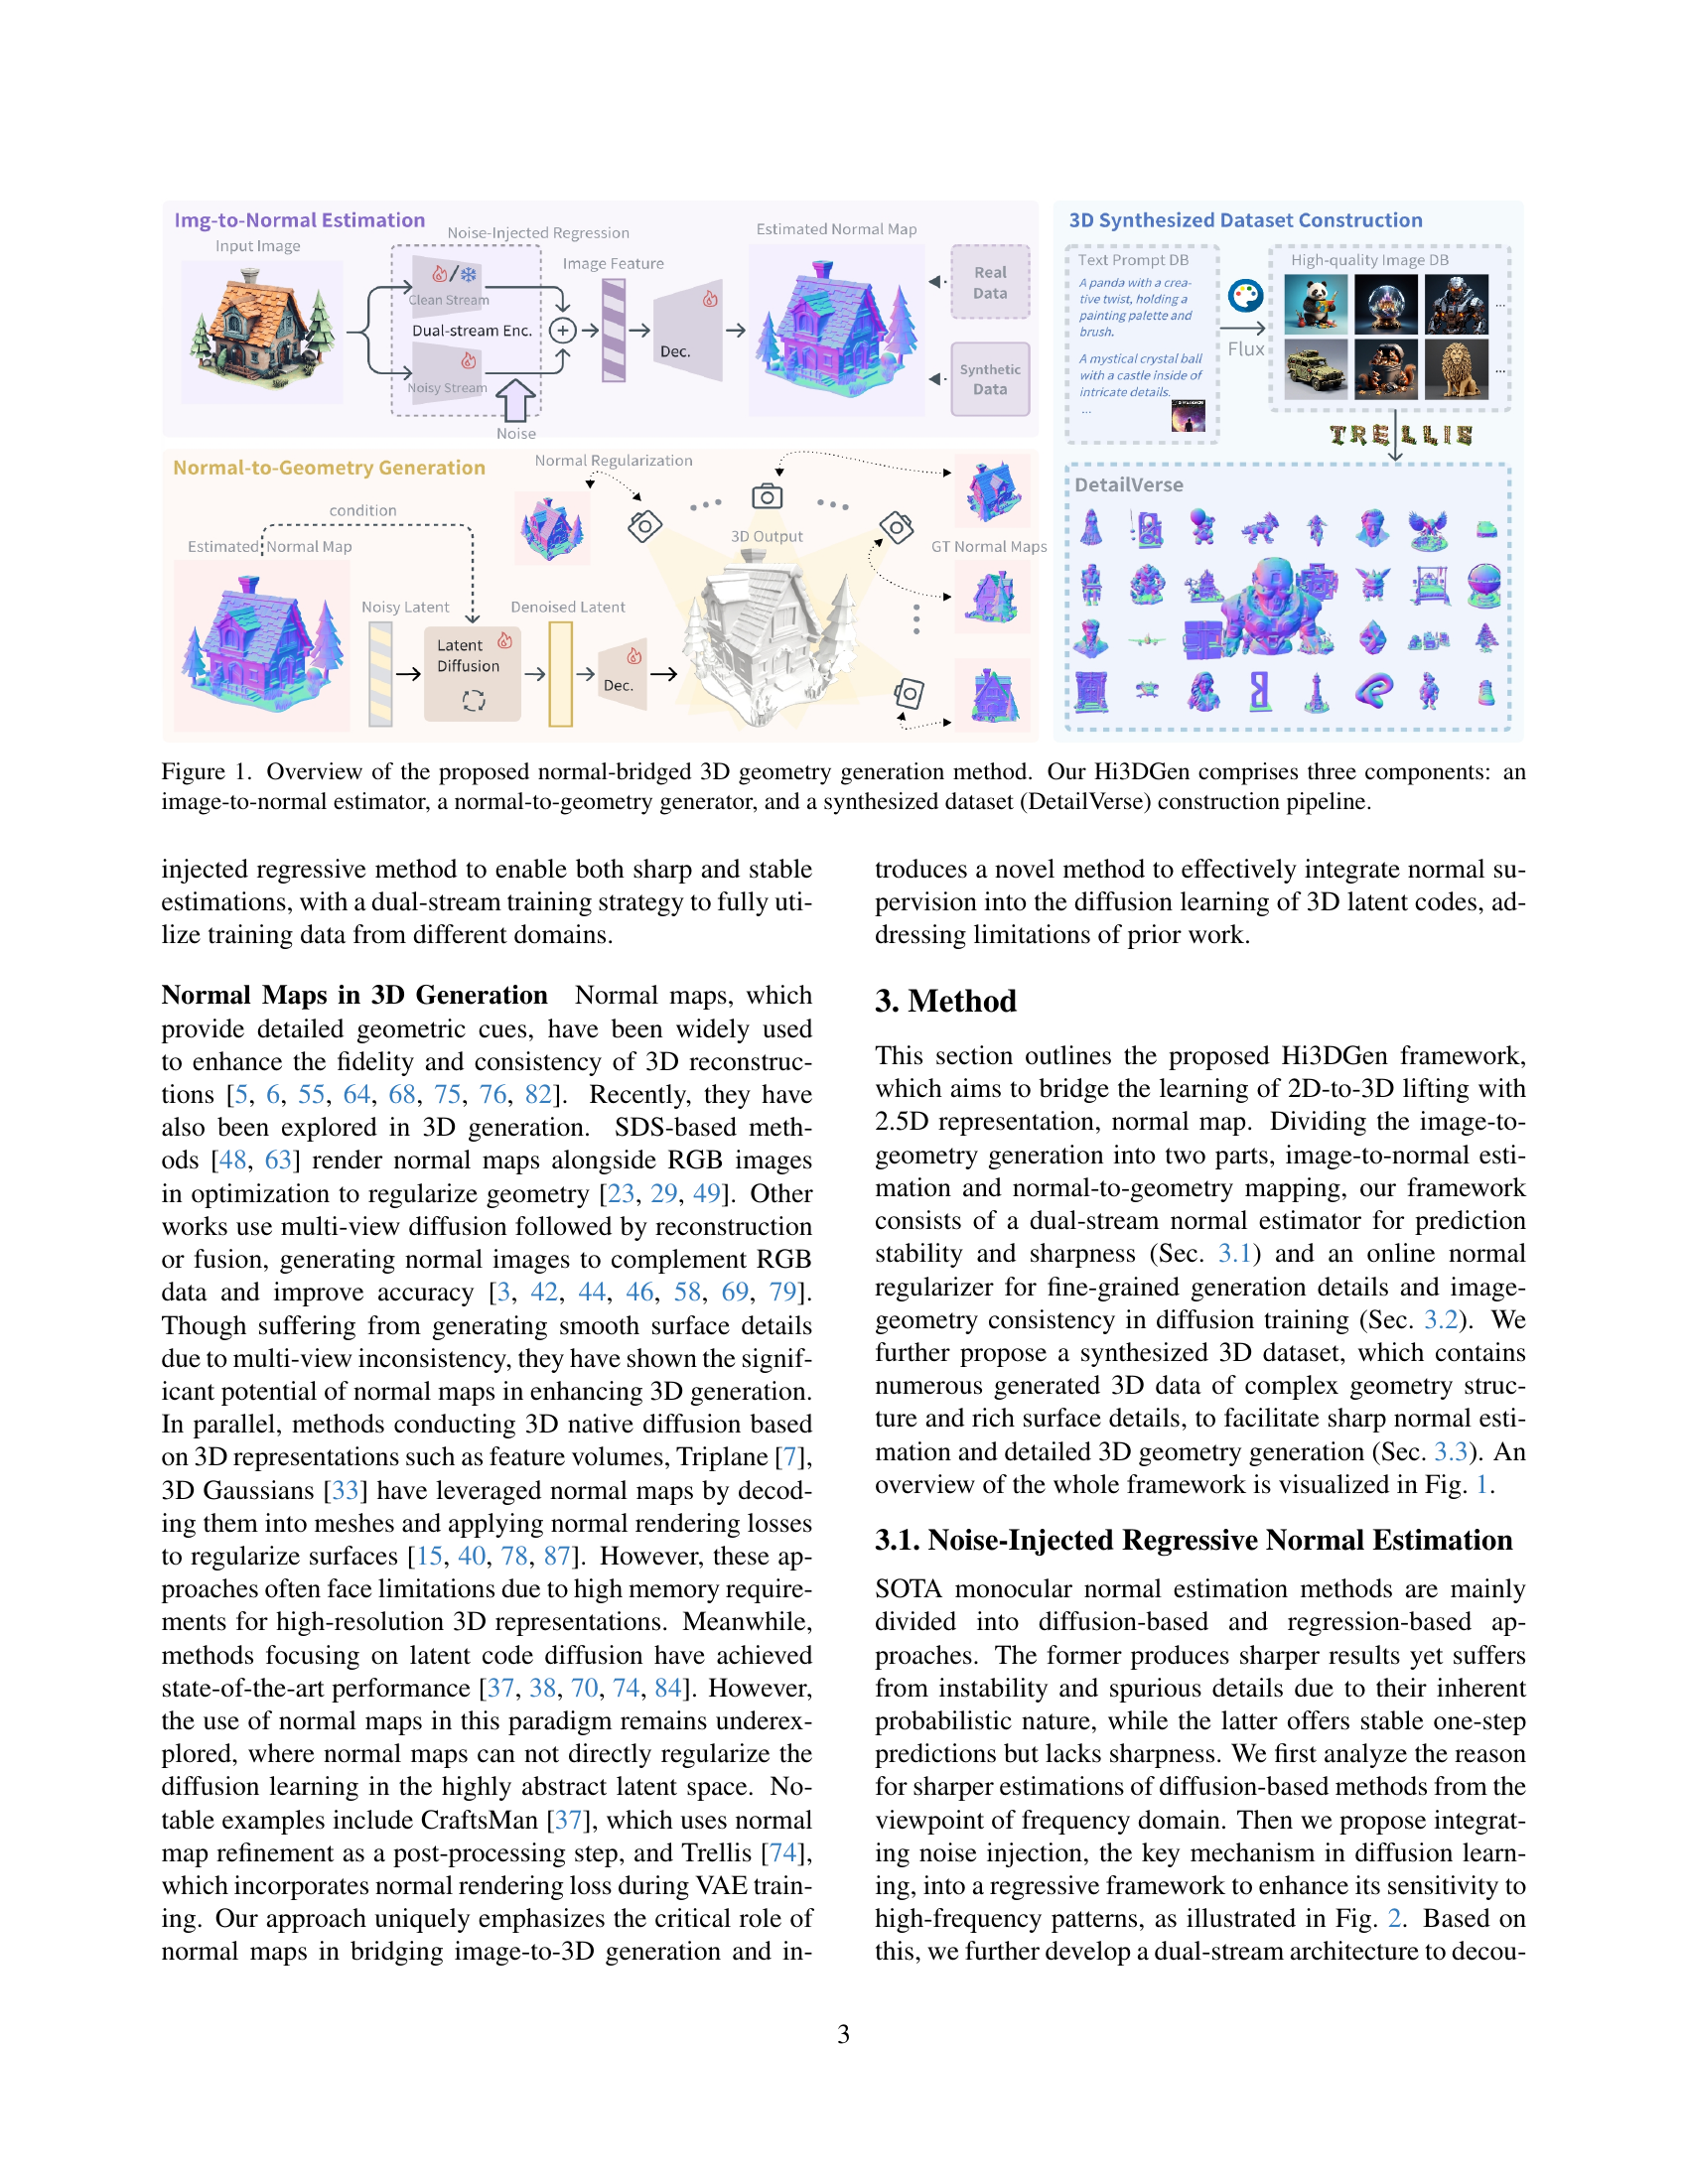
🔼 This figure provides a high-level overview of the Hi3DGen framework, which is a novel method for generating high-fidelity 3D geometry from images using normal maps as an intermediate representation. The framework consists of three main components: 1) An image-to-normal estimator (NiRNE) which takes an image as input and produces a normal map. This process is important for reducing the ambiguity in the RGB image. 2) A normal-to-geometry generator (NoRLD) that takes the normal map as input and produces a 3D mesh. 3) A data synthesis pipeline that creates the DetailVerse dataset, which contains high-quality synthetic 3D assets to support the training of the framework. The figure visually depicts the flow of information from input image to final 3D model output, highlighting the role of the normal map as a bridge between the image and 3D geometry.
read the caption
Figure 1: Overview of the proposed normal-bridged 3D geometry generation method. Our Hi3DGen comprises three components: an image-to-normal estimator, a normal-to-geometry generator, and a synthesized dataset (DetailVerse) construction pipeline.
| Dataset | Obj # | Sharp Edge # | Source |
| GSO [16] | 1K | 3,071 / 1,529 | Scanning |
| Meta [56] | 8K | 10,603 / 6,415 | Scanning |
| ABO [11] | 8K | 2,989 / 1,035 | Artists |
| 3DFuture [20] | 16K | 1,776 / 865 | Artists |
| HSSD [34] | 6K | 5,752 / 2,111 | Artists |
| ObjV-1.0 [13] | 800K | 1,520 / 452 | Mixed |
| ObjV-XL [14] | 10.2M | 1,119 / 355 | Mixed |
| DetailVerse | 700K | 45,773 / 14,521 | Synthesis |
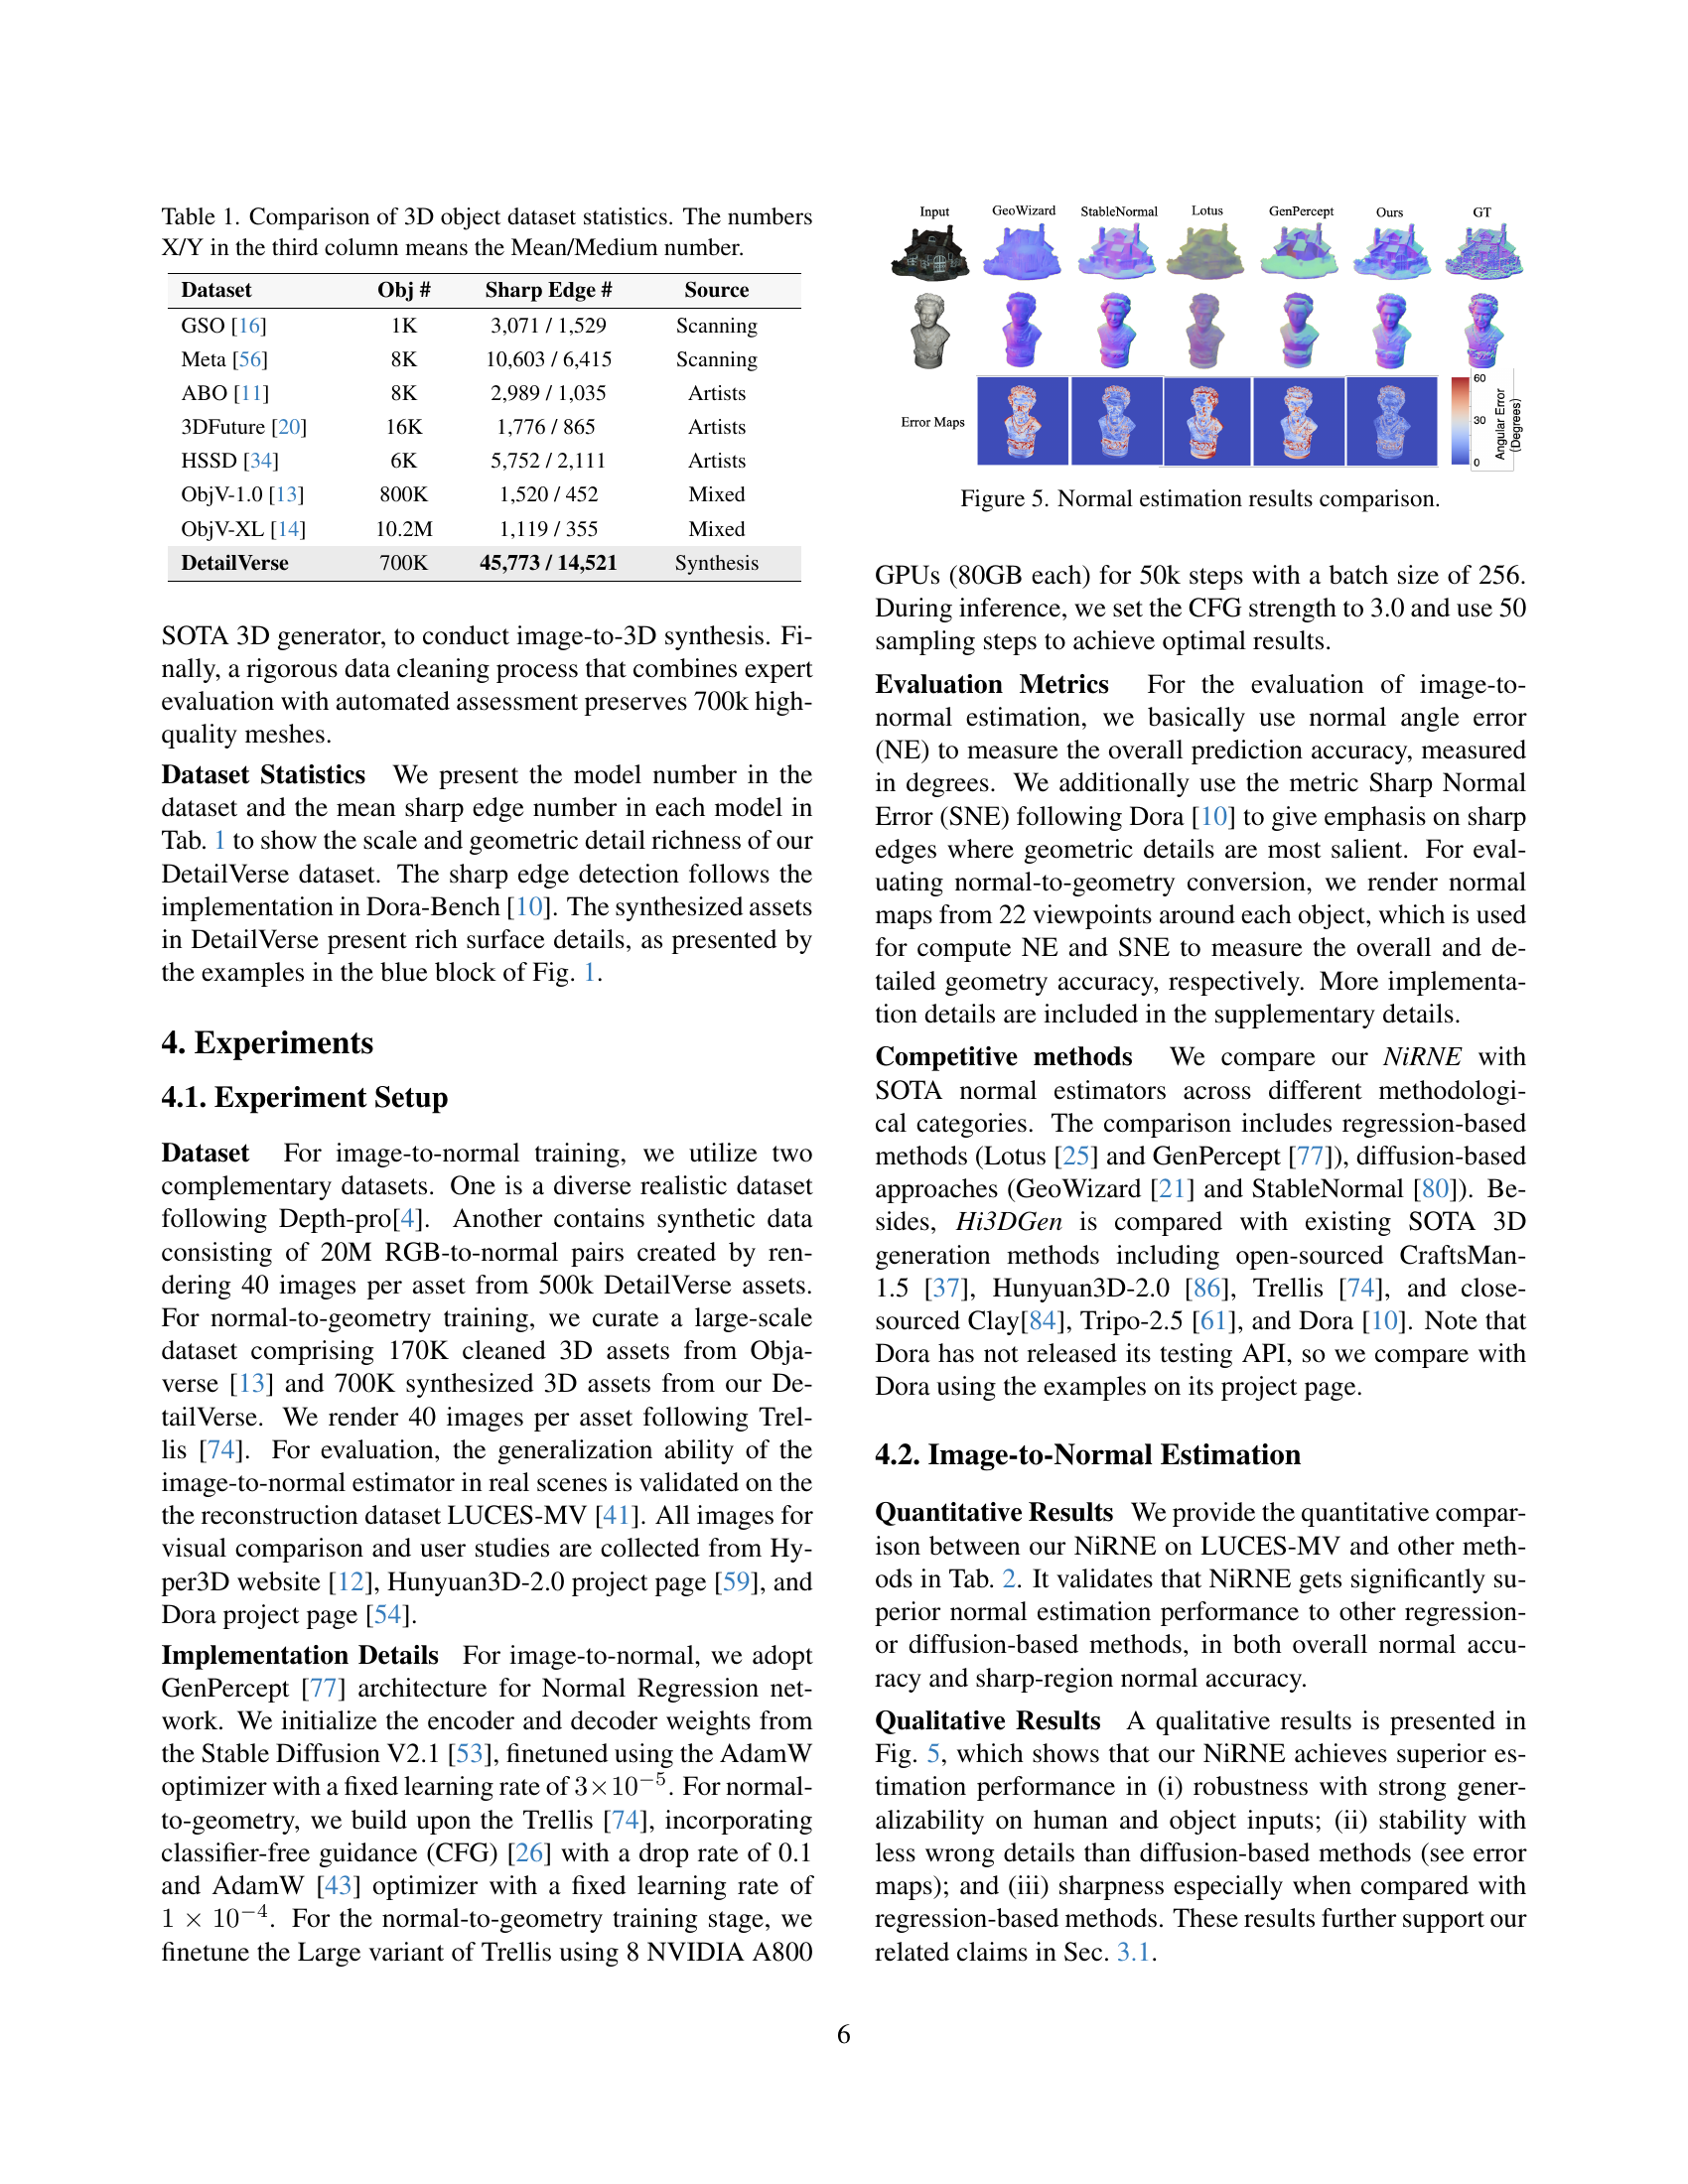
🔼 This table compares the statistics of various 3D object datasets, including the number of objects, the average and median counts of sharp edges, and the source of the data. The average and median number of sharp edges are provided to indicate the level of geometric detail present in the dataset.
read the caption
Table 1: Comparison of 3D object dataset statistics. The numbers X/Y in the third column means the Mean/Medium number.
In-depth insights#
Normal as Bridge#
The concept of ‘Normal as Bridge’ suggests leveraging surface normal information to connect 2D images and 3D geometry. This bridging approach likely aims to overcome limitations in direct 2D-to-3D mapping, where inherent ambiguities hinder accurate detail reconstruction. Normals, representing surface orientation, offer a more explicit geometric cue than raw RGB values. This helps in reducing the domain gap between synthetic training data and real-world images. Ultimately, the normals serve as an intermediate representation that guides the geometry learning process. Also, normal regularization is essential for consistent 3D structure generations.
Noise-Injected Est#
The paper addresses the challenge of generating high-fidelity 3D geometry from 2D images by introducing a novel noise-injected regression-based approach for normal estimation. Traditional regression methods struggle with generating fine-grained details, while diffusion-based methods suffer from instability. This work innovatively integrates noise injection, a key mechanism in diffusion learning, into a regressive framework. By doing so, they aim to enhance the framework’s sensitivity to high-frequency patterns typically associated with sharp geometric details like edges and cavities. The rationale is that noise injection provides stronger supervision at high-frequency regions, encouraging the model to focus on capturing and predicting sharp details. This technique effectively bridges the gap between robust, stable predictions of regression-based methods and the sharp detail generation of diffusion-based ones. The overall effect is a novel method for stable and fine-grained normal estimation.
DetailVerse Data#
DetailVerse Data, as a synthesized 3D dataset, addresses the crucial need for high-quality training data, which is often a bottleneck in 3D generation tasks. Given the prohibitive costs of manual creation, DetailVerse offers a scalable solution through a text-to-image-to-3D pipeline. A notable strength lies in its meticulous prompt engineering and data cleaning to ensure diversity and fidelity, aiming to overcome the limitations of existing datasets with simplistic geometries. The use of advanced generators further contributes to creating complex structures with rich details, crucial for high-fidelity 3D generation. By providing a diverse, high-quality dataset, DetailVerse will likely spur advancements in 3D generation, enabling models to learn finer geometric features and reducing the reliance on human-created data.
Latent Diffusion+#
The idea of latent diffusion is a powerful concept in generative modeling, especially for tasks like 3D geometry generation. It hinges on the principle of performing the diffusion and denoising processes within a lower-dimensional latent space, rather than directly manipulating the high-dimensional data space (e.g., voxel grids or meshes). This has several benefits. Computationally, it drastically reduces memory requirements and processing time, making training and inference more tractable. From a learning perspective, the latent space can be designed to capture the essential features and structure of the data, allowing the model to focus on learning the underlying distribution without being overwhelmed by irrelevant details or noise. This often leads to better generalization and sample quality. Further, it will enables the use of latent space regularizations. Such regularizations are highly useful to guide the diffusion learning in the low dimensional latent space.
Limited Details#
Research papers often face limitations in providing exhaustive details due to space constraints or focus. This can impact reproducibility, hindering other researchers from independently verifying the findings or building upon the work. Insufficient detail regarding data preprocessing steps, specific hyperparameter settings, or architectural nuances of neural networks makes it difficult to understand the exact methodology employed. Moreover, limited ablation studies might obscure the contribution of individual components of the proposed framework. A lack of discussion on failure cases and potential biases can lead to an incomplete understanding of the model’s capabilities and limitations. Addressing these points by including supplementary materials with extended explanations and code releases would improve the transparency and impact of the research.
More visual insights#
More on figures

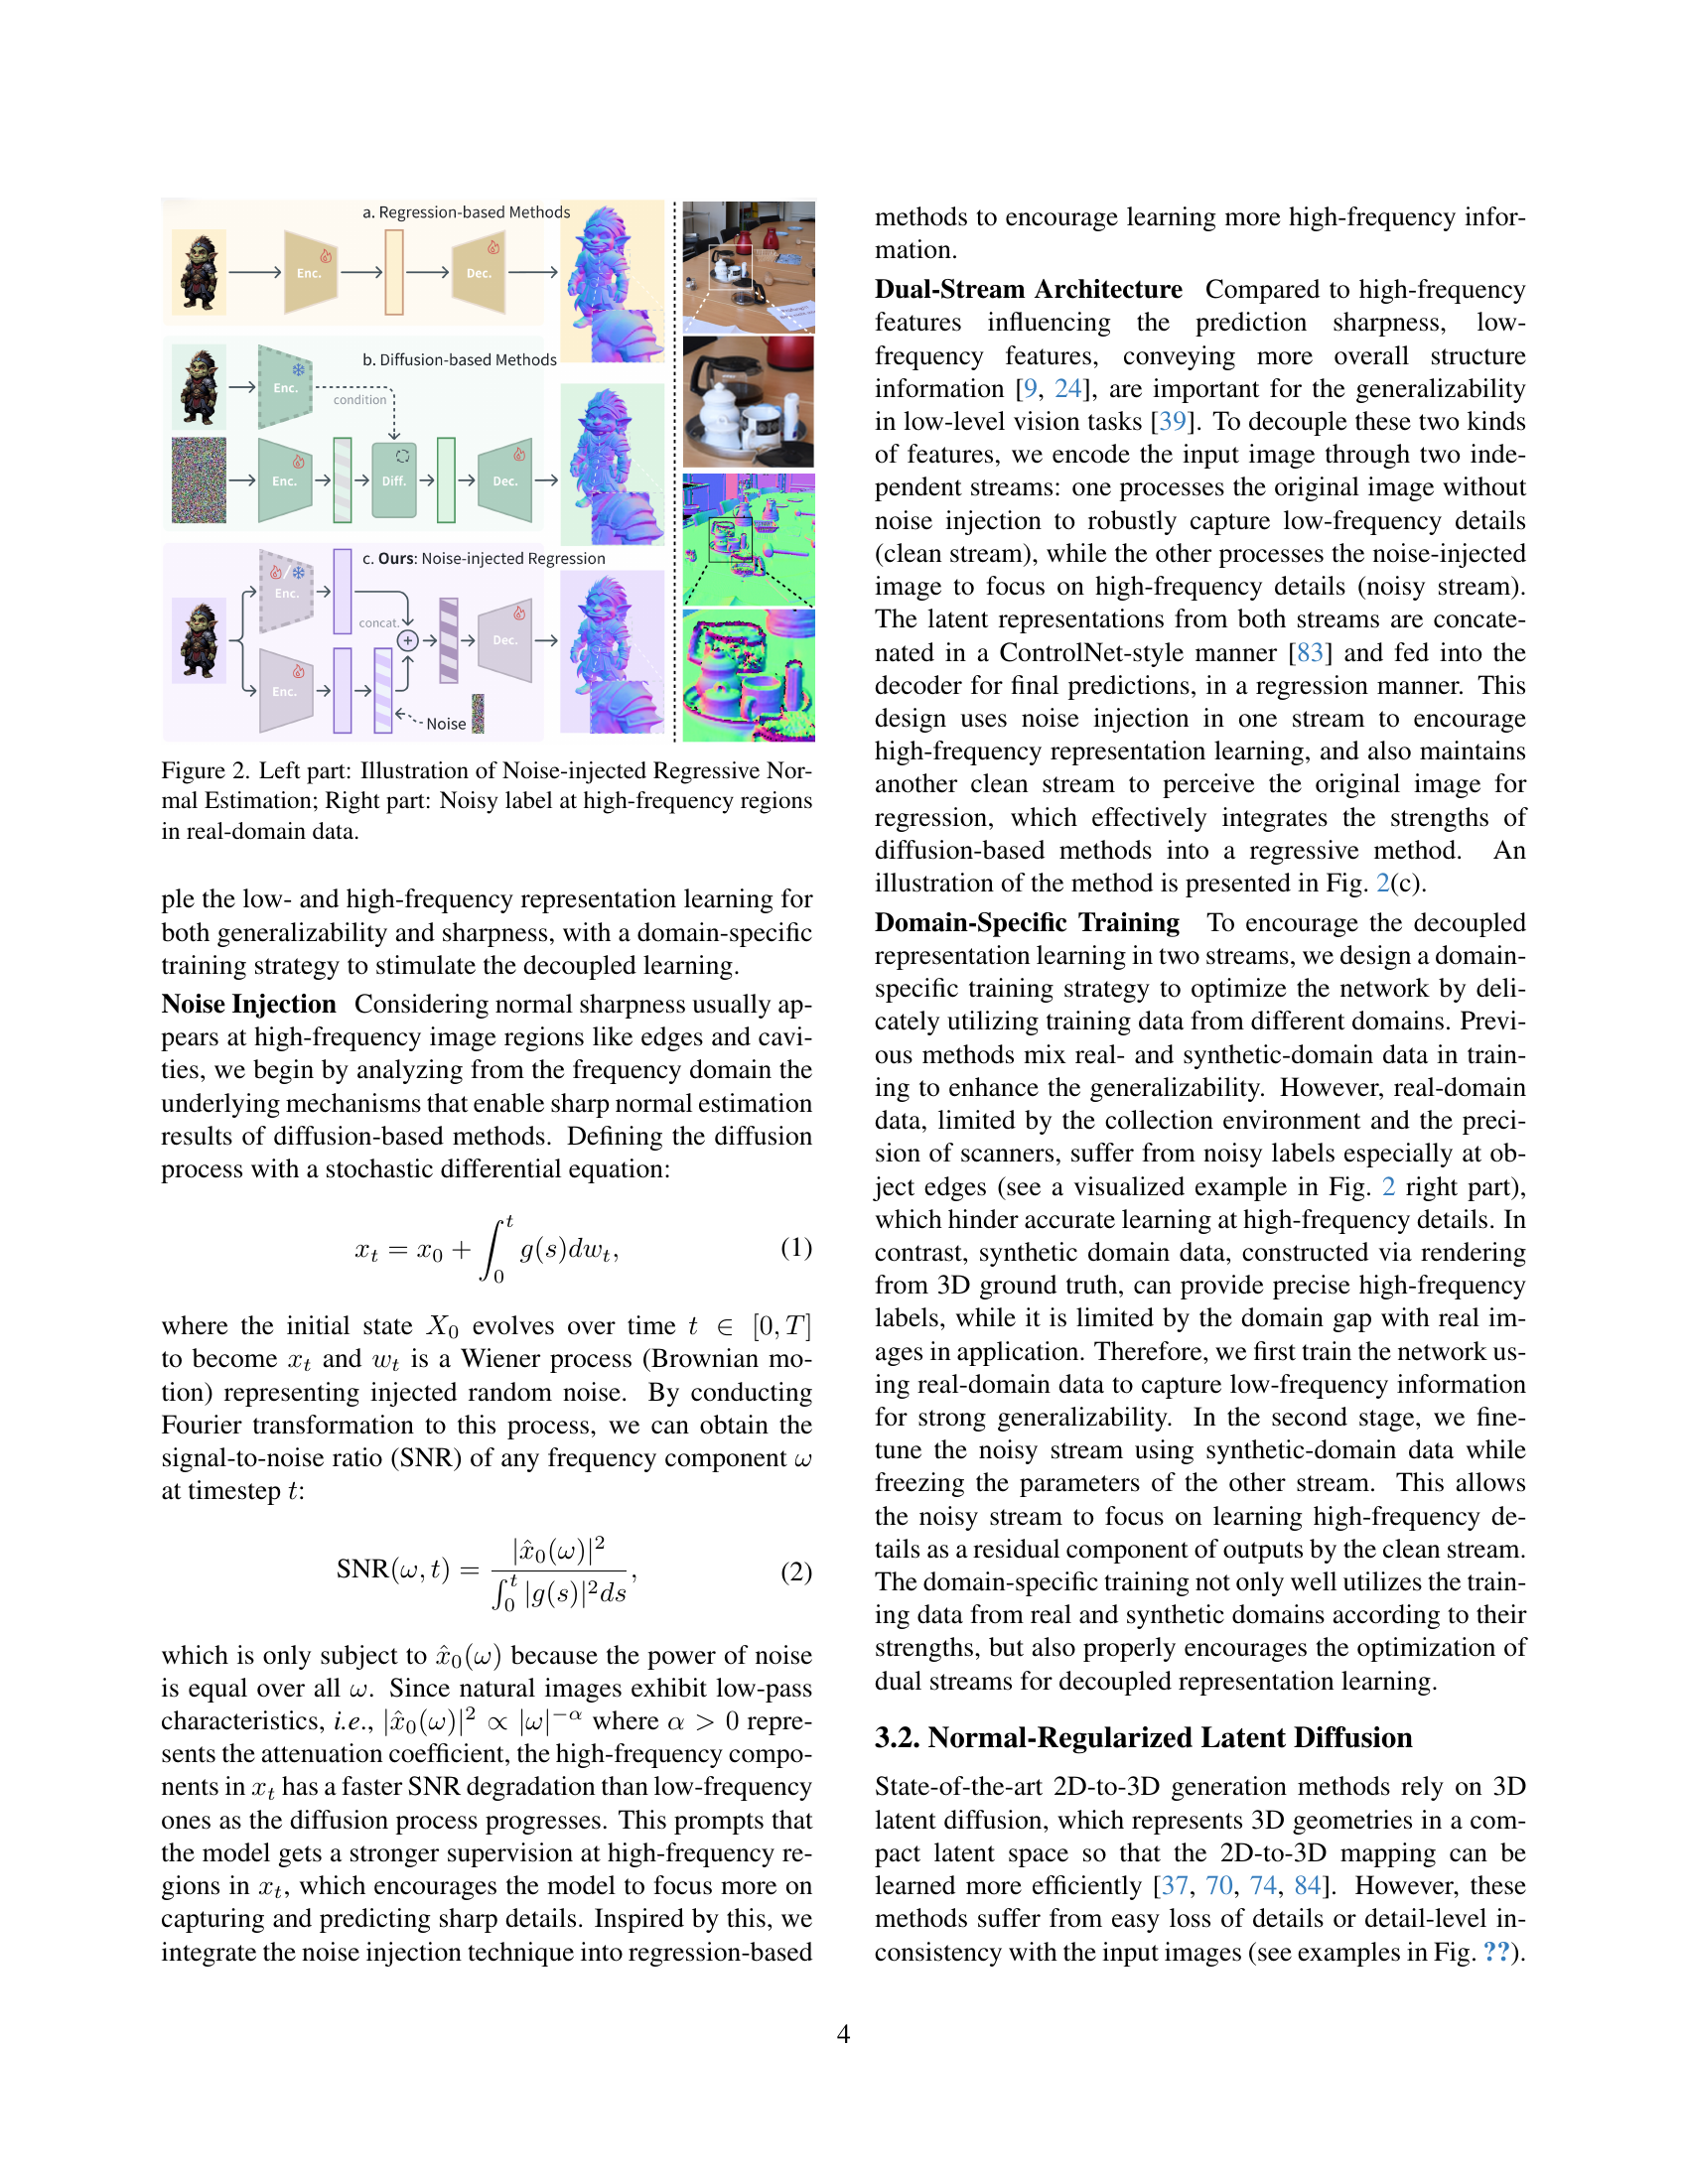
🔼 This figure illustrates the proposed Noise-injected Regressive Normal Estimation method. The left part shows the architecture, which injects noise into the regressive network to enhance its sensitivity to high-frequency patterns and improve normal map sharpness. The right part highlights the noisy labels at high-frequency regions (such as edges and corners) commonly found in real-world image data. This noise injection helps the network learn to accurately estimate normals in these challenging areas, leading to improved sharpness and detail in the generated normal maps.
read the caption
Figure 2: Left part: Illustration of Noise-injected Regressive Normal Estimation; Right part: Noisy label at high-frequency regions in real-domain data.

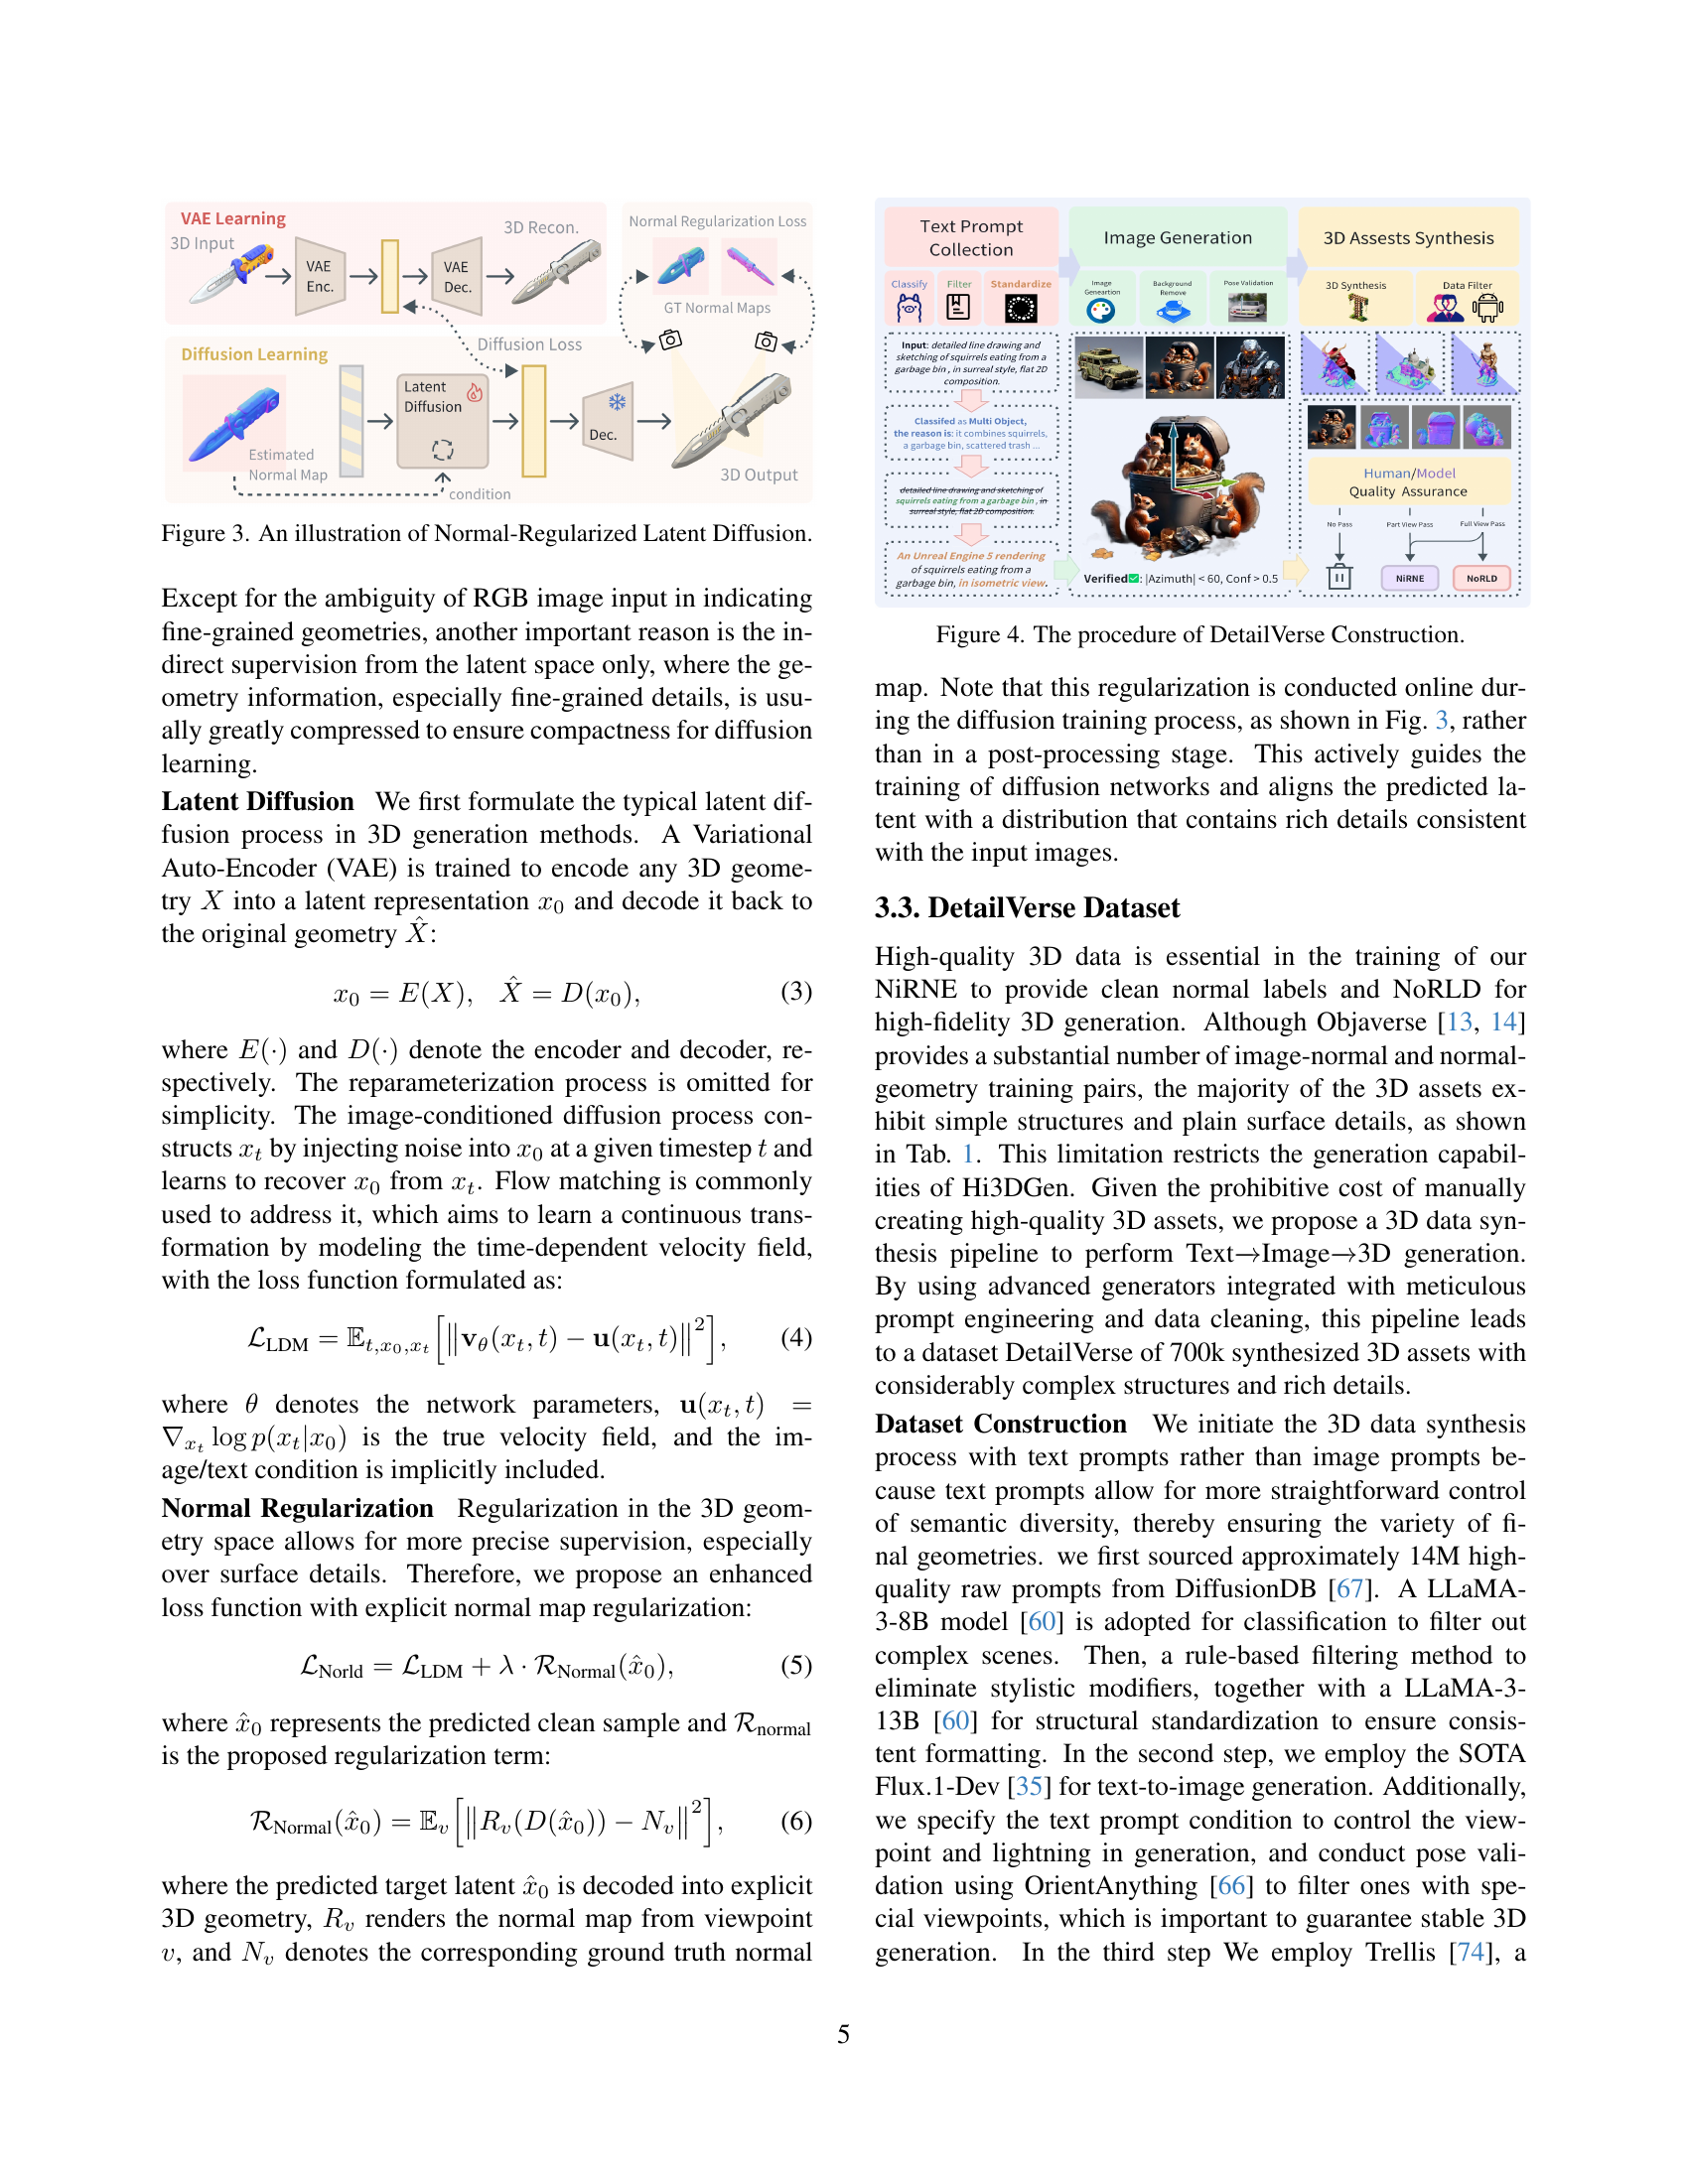
🔼 This figure illustrates the process of Normal-Regularized Latent Diffusion used in the Hi3DGen framework. It shows how a Variational Autoencoder (VAE) encodes a 3D input geometry into a latent representation. This latent representation then undergoes a diffusion process, where noise is added and subsequently removed to refine the geometry. Crucially, normal maps (representing surface orientation) are used to regularize the latent diffusion process, ensuring that the generated 3D geometry accurately reflects the surface details and fidelity of the input normal map. The figure highlights the interaction between the VAE, the diffusion process, normal map information, and the final 3D output.
read the caption
Figure 3: An illustration of Normal-Regularized Latent Diffusion.

🔼 The figure illustrates the pipeline used to create the DetailVerse dataset. It starts with a text prompt database and a high-quality image database. These are used to generate initial 3D assets. A classification step filters these assets, and further steps standardize and validate poses, leading to the final high-quality 3D assets in the DetailVerse dataset.
read the caption
Figure 4: The procedure of DetailVerse Construction.

🔼 This figure compares the performance of different normal estimation methods, including regression-based methods (Lotus and GenPercept), diffusion-based methods (GeoWizard and StableNormal), and the proposed method (Hi3DGen). The comparison is based on the angular error and sharp normal error. The results show that Hi3DGen outperforms existing methods in terms of both overall accuracy and sharpness of normal estimation.
read the caption
Figure 5: Normal estimation results comparison.

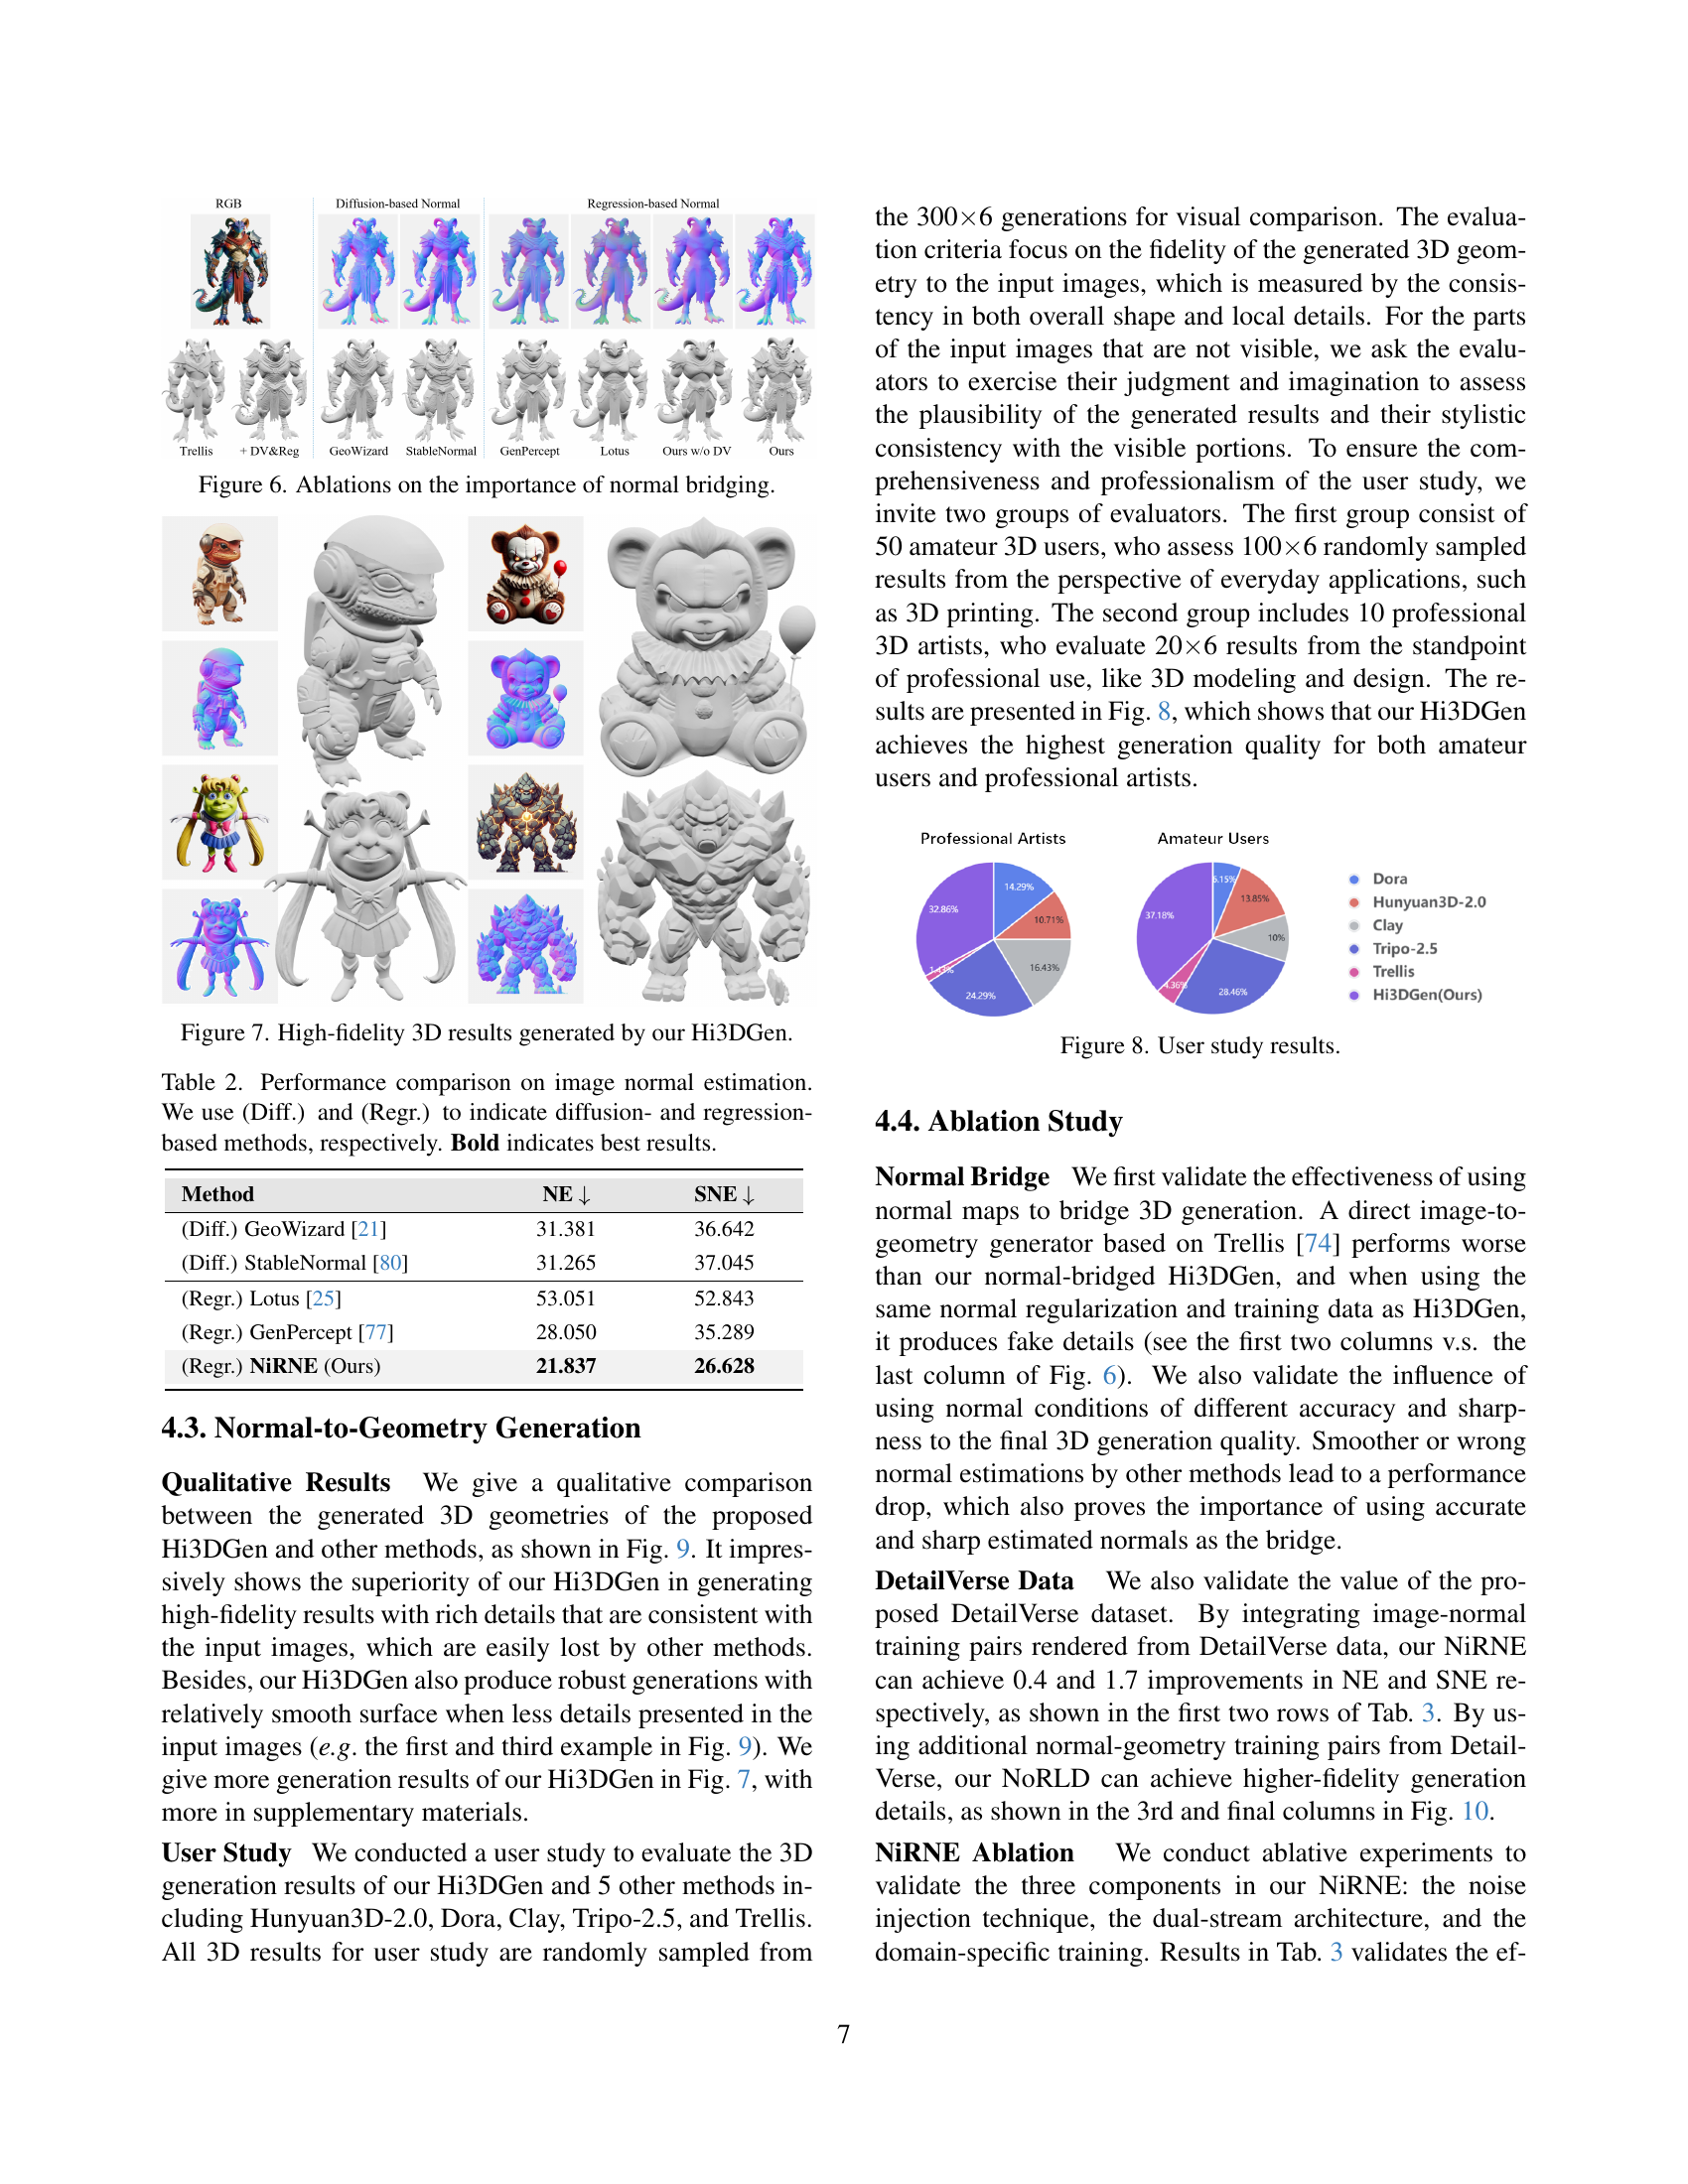
🔼 This ablation study investigates the effect of using normal maps as an intermediate representation in 3D geometry generation. It compares the results of a direct image-to-3D generation method (Trellis) against Hi3DGen, highlighting the improvements in detail and fidelity achieved by incorporating normal bridging. The figure demonstrates that Hi3DGen, which leverages normal maps, outperforms the direct approach, especially in capturing fine-grained details. The comparison also shows the impact of using different normal map estimation methods (diffusion-based and regression-based) on the final 3D model quality.
read the caption
Figure 6: Ablations on the importance of normal bridging.

🔼 This figure showcases several high-fidelity 3D models generated by the Hi3DGen model. The models demonstrate the ability of the system to accurately reconstruct detailed and complex 3D shapes from 2D images, highlighting the fine-grained geometric features that are often lost in existing techniques.
read the caption
Figure 7: High-fidelity 3D results generated by our Hi3DGen.

🔼 This figure presents the results of a user study comparing the 3D model generation quality of Hi3DGen against five other methods: Hunyuan3D-2.0, Dora, Clay, Tripo-2.5, and Trellis. Two groups of participants evaluated the generated models: 50 amateur 3D users and 10 professional 3D artists. The evaluations focused on overall quality for various applications and professional use cases, respectively. The results show that Hi3DGen significantly outperforms the other methods in terms of user preference for both amateur and professional users.
read the caption
Figure 8: User study results.

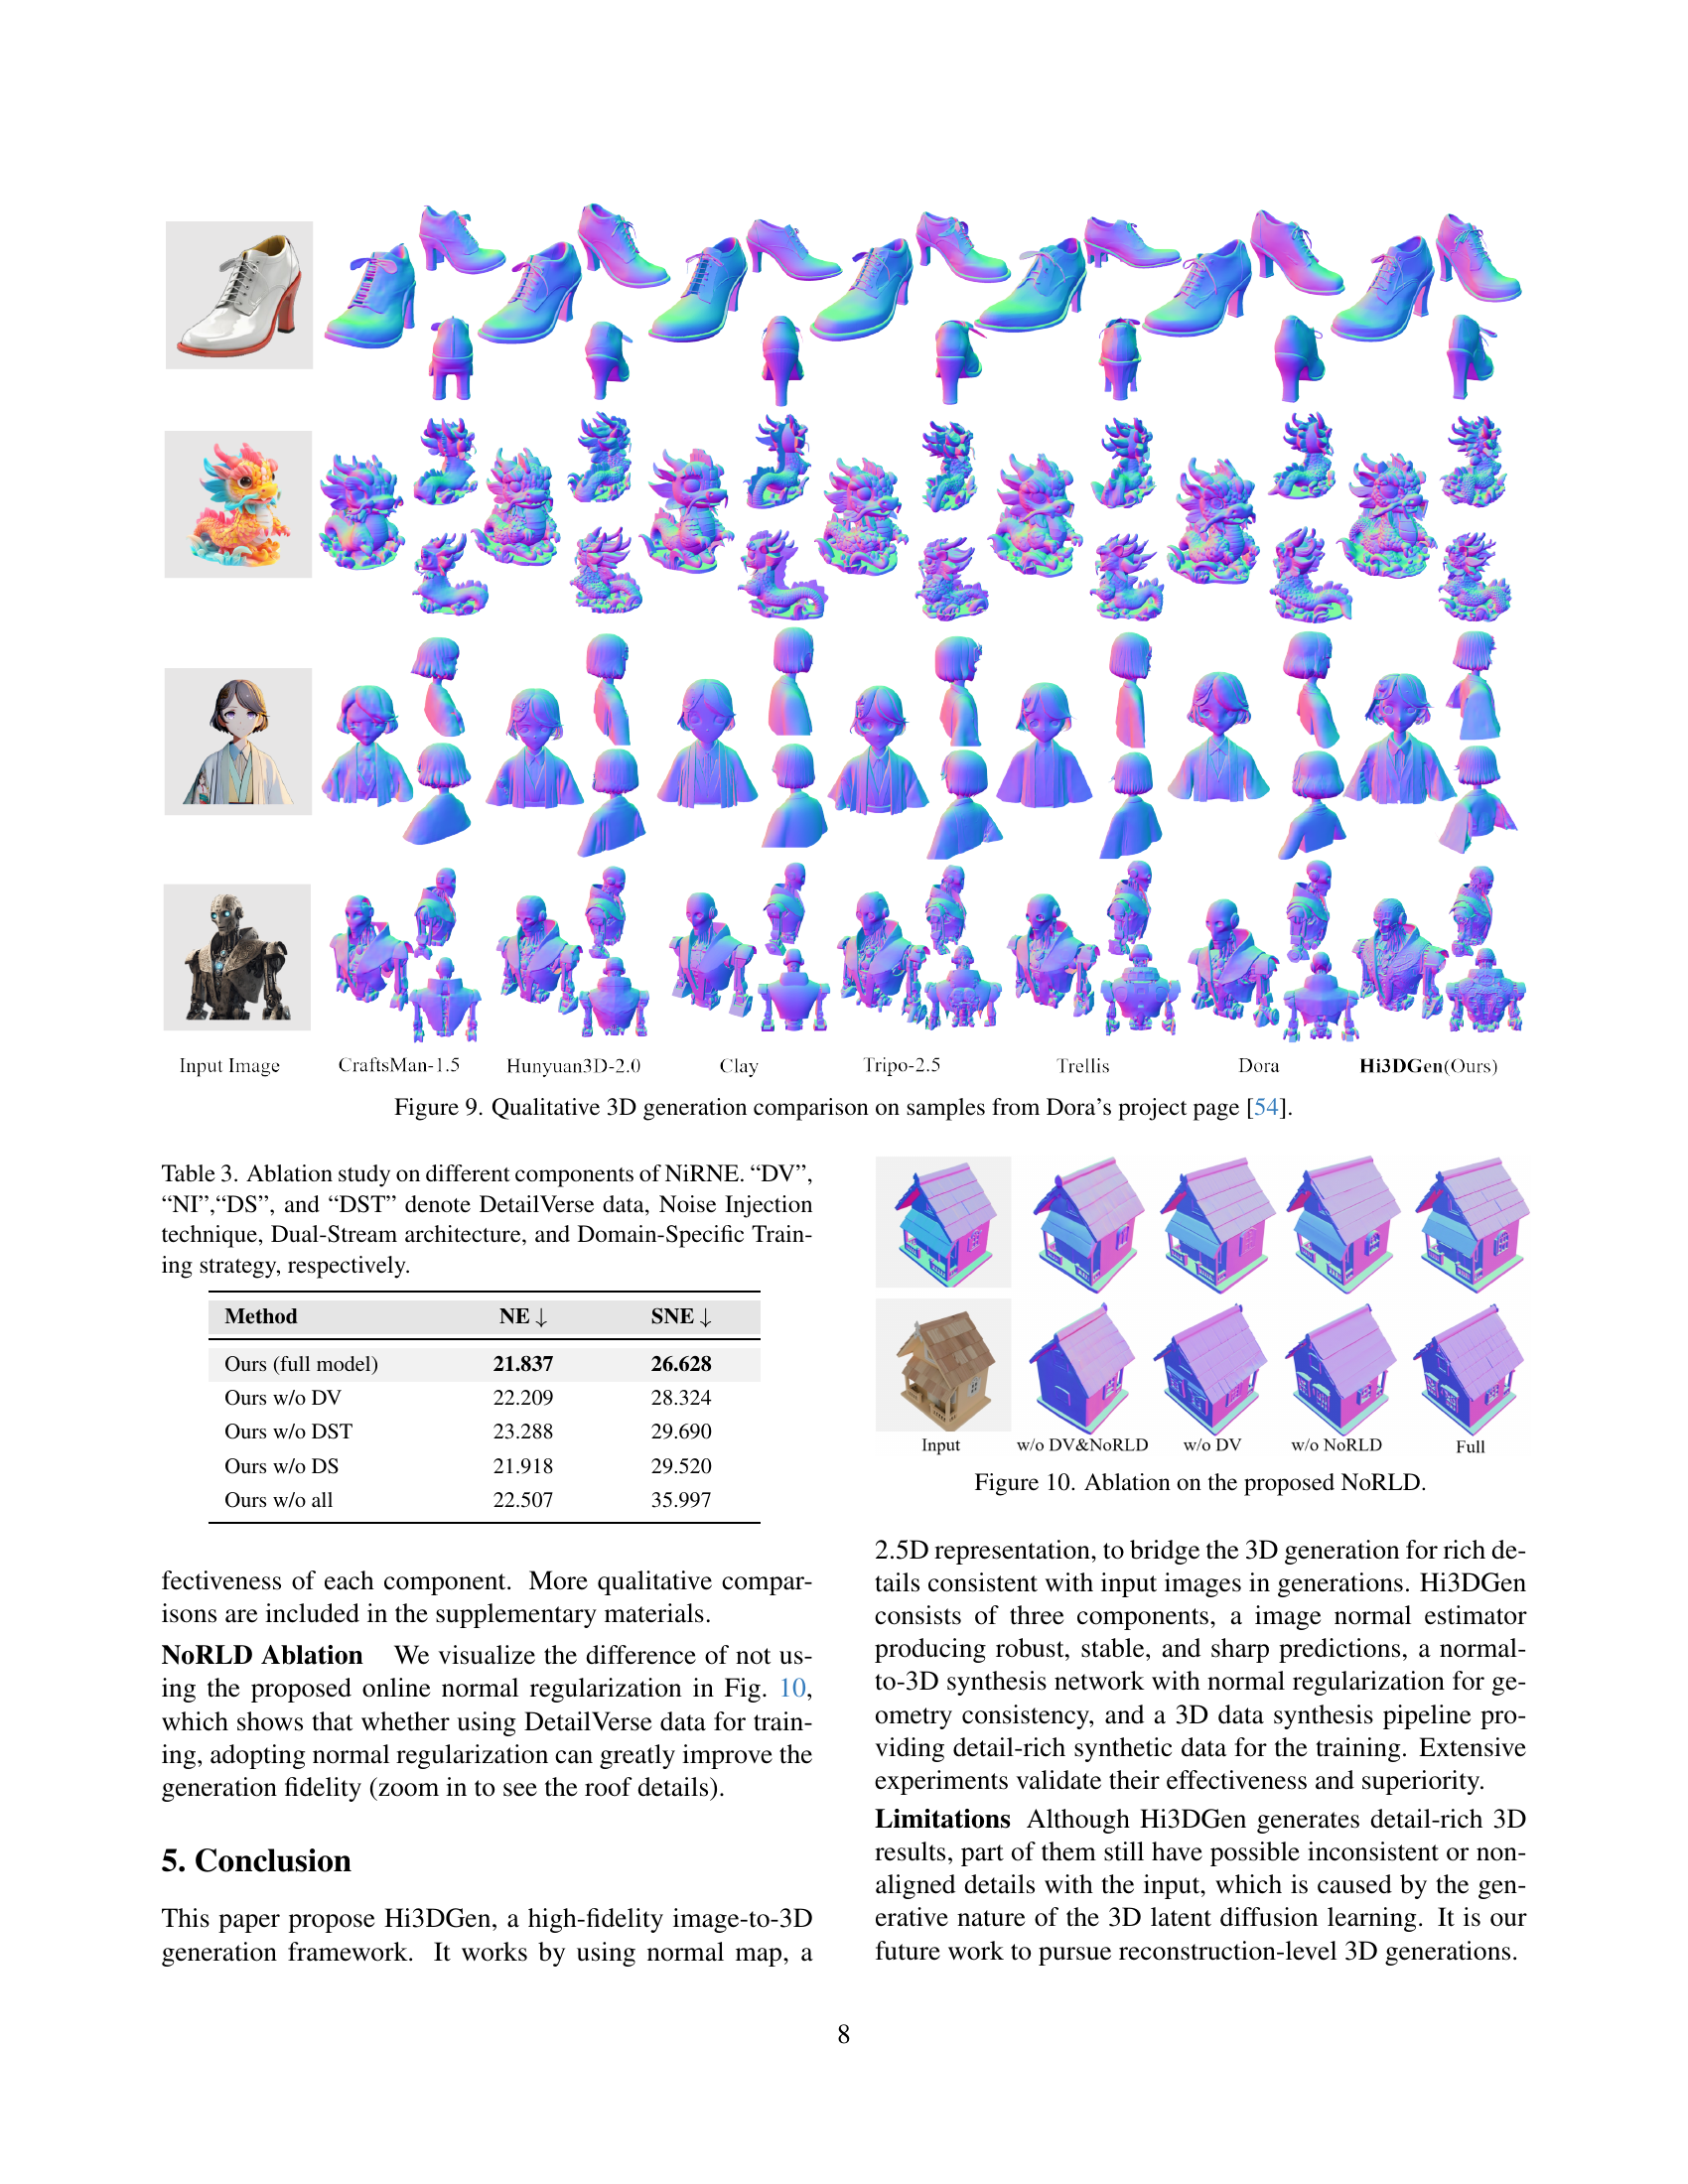
🔼 Figure 9 presents a qualitative comparison of 3D model generation results from different methods, using example images sourced from Dora’s project page [54]. It visually demonstrates the relative strengths and weaknesses of each approach in terms of generating high-fidelity 3D models with fine-grained details that accurately reflect the input 2D images. The figure showcases how well each method captures fine details, surface smoothness, and overall shape accuracy.
read the caption
Figure 9: Qualitative 3D generation comparison on samples from Dora’s project page [54].

🔼 This ablation study visualizes the impact of the proposed normal-regularized latent diffusion (NoRLD) on the 3D geometry generation. By comparing the results with and without NoRLD, the figure demonstrates the effectiveness of NoRLD in enhancing the generation of fine-grained details in 3D models. The results showcase that NoRLD leads to significantly improved detail preservation and fidelity compared to the model trained without this component.
read the caption
Figure 10: Ablation on the proposed NoRLD.

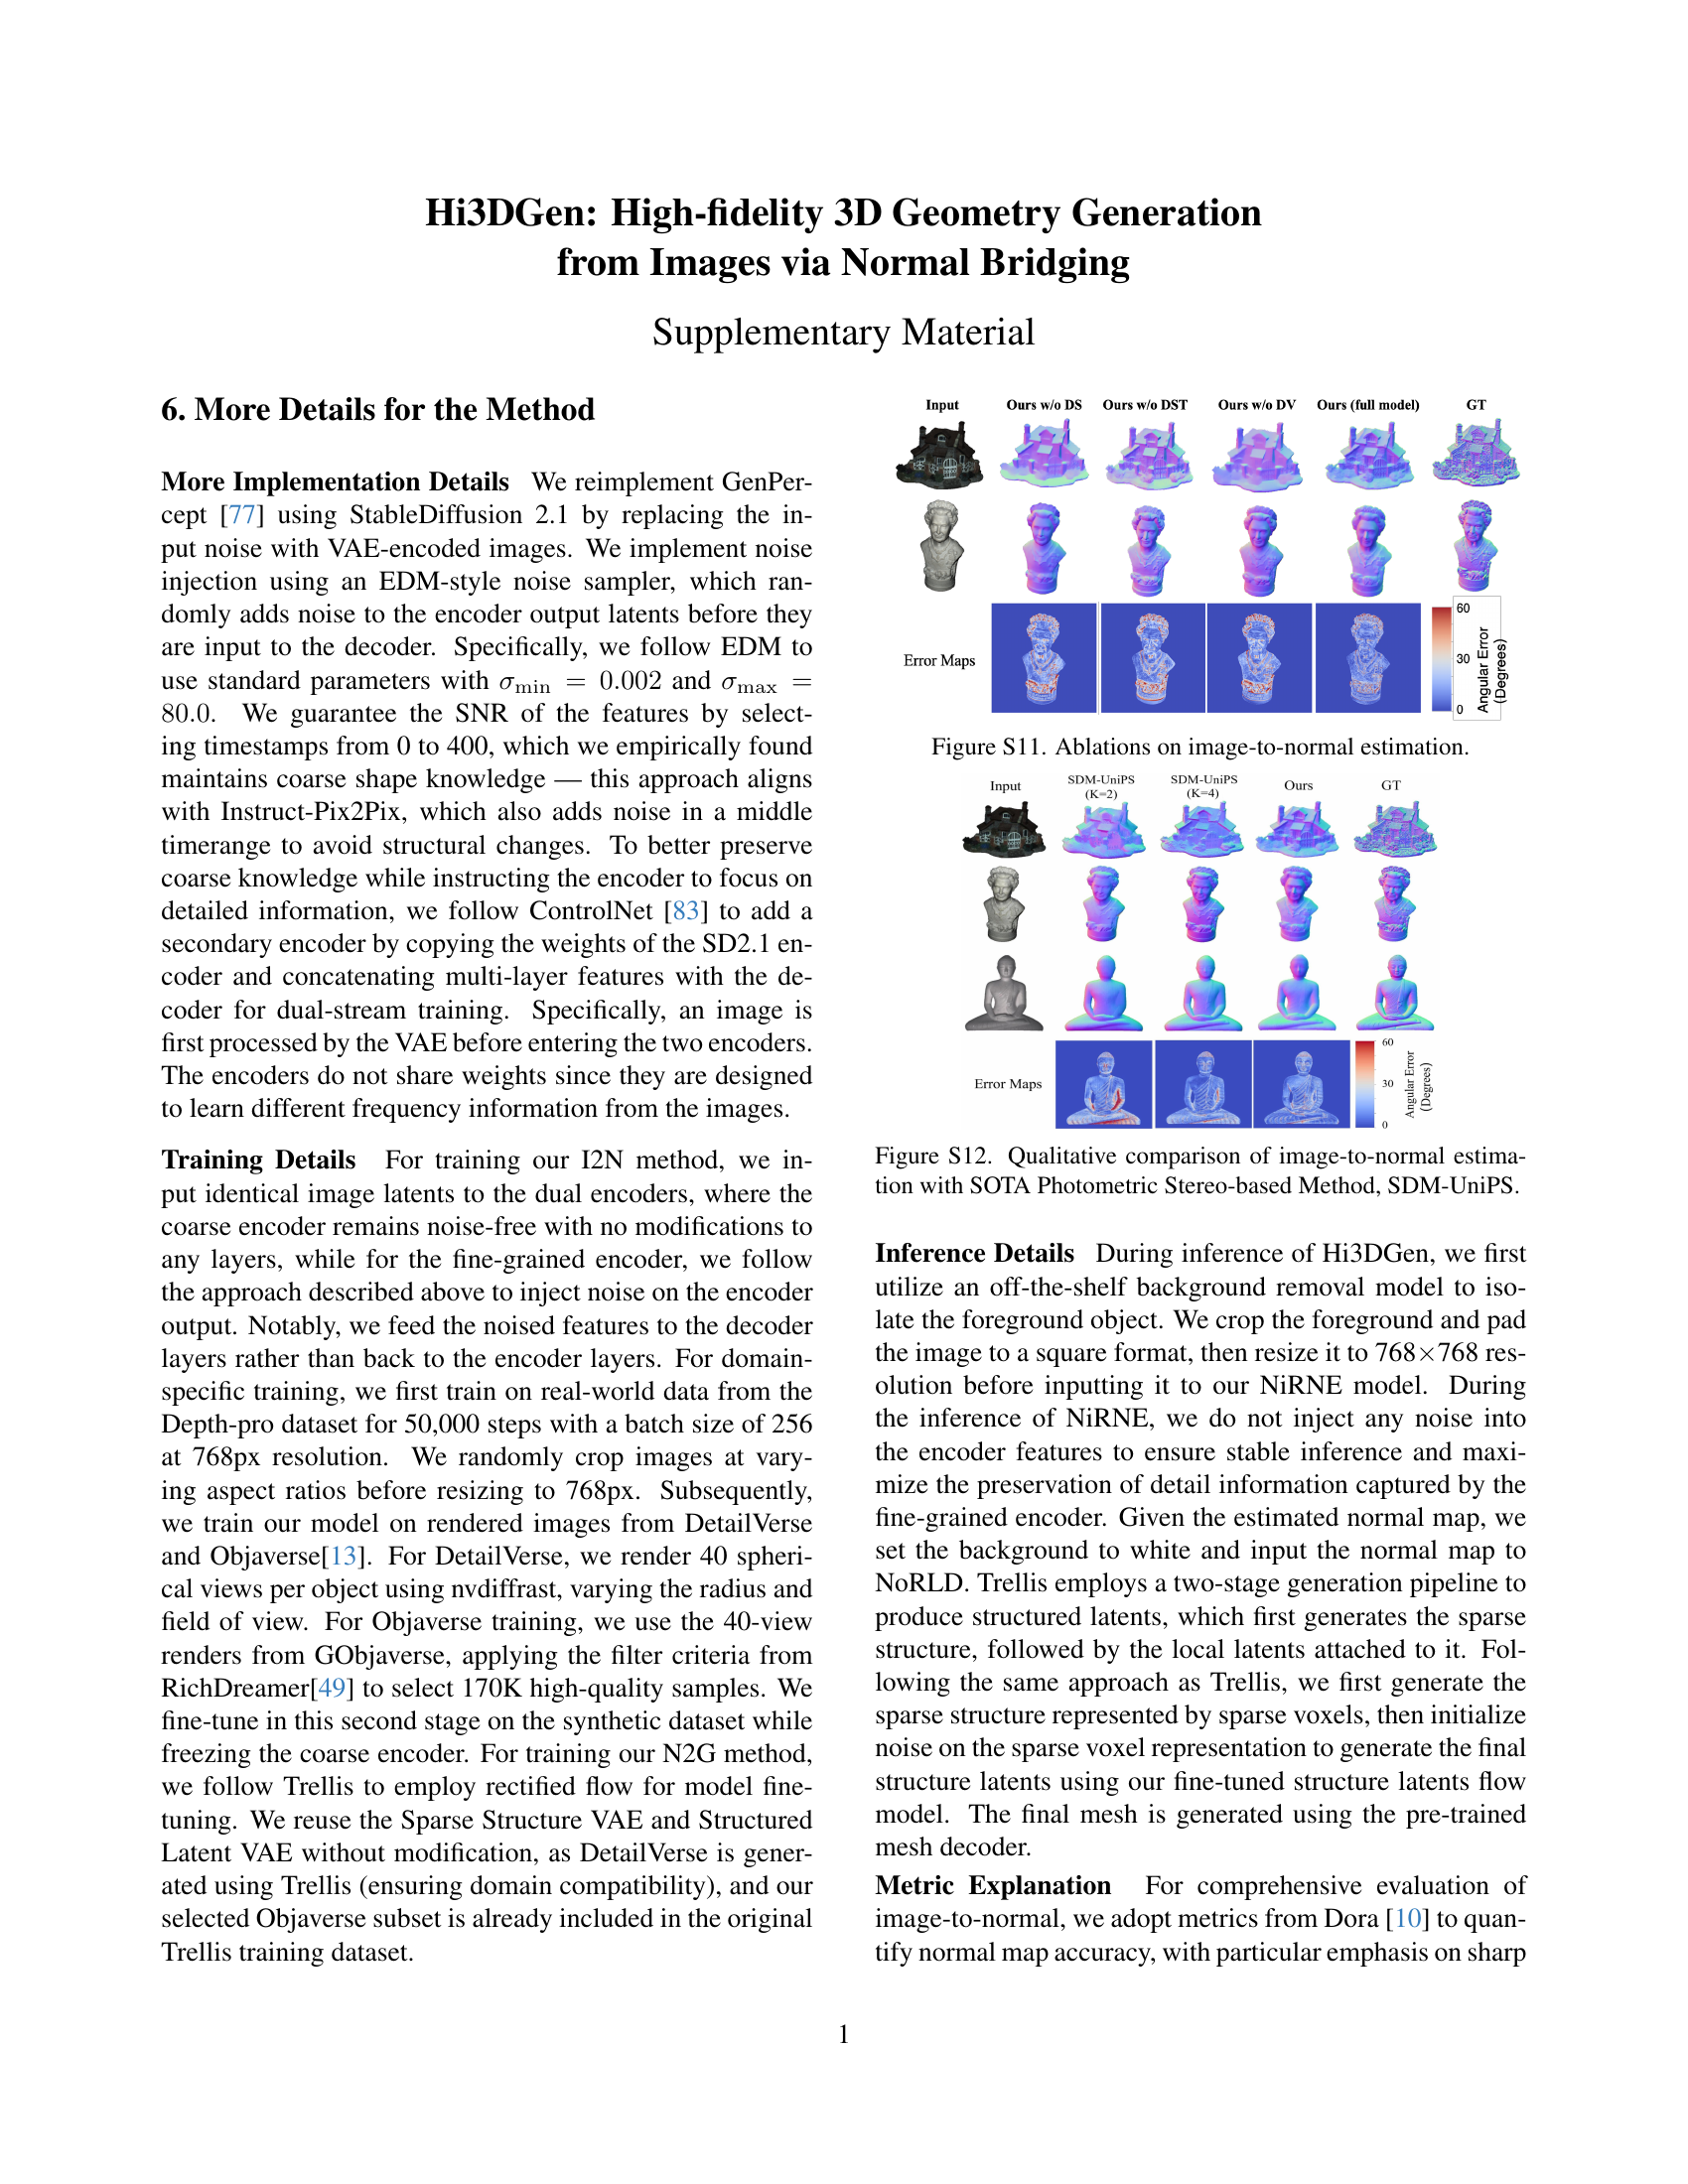
🔼 This ablation study visualizes the effects of different components of the proposed Noise-Injected Regressive Normal Estimation (NiRNE) method on the accuracy of normal map generation. It compares the performance of the full NiRNE model against versions where key components such as the DetailVerse dataset, the dual-stream architecture, the noise injection technique, and the domain-specific training strategy, are removed. The results are presented as a qualitative comparison of normal maps generated using each model variant alongside the ground truth normal map. This allows for a visual assessment of how each component contributes to the overall accuracy and sharpness of the estimated normal maps.
read the caption
Figure S11: Ablations on image-to-normal estimation.

🔼 This figure presents a qualitative comparison of the image-to-normal estimation performance between the proposed NiRNE method and the state-of-the-art (SOTA) photometric stereo method, SDM-UniPS. It visually demonstrates the accuracy and detail preservation capabilities of each method by showing the estimated normal maps alongside the ground truth normal maps. Different scenarios are included to show the generalizability of the proposed method.
read the caption
Figure S12: Qualitative comparison of image-to-normal estimation with SOTA Photometric Stereo-based Method, SDM-UniPS.

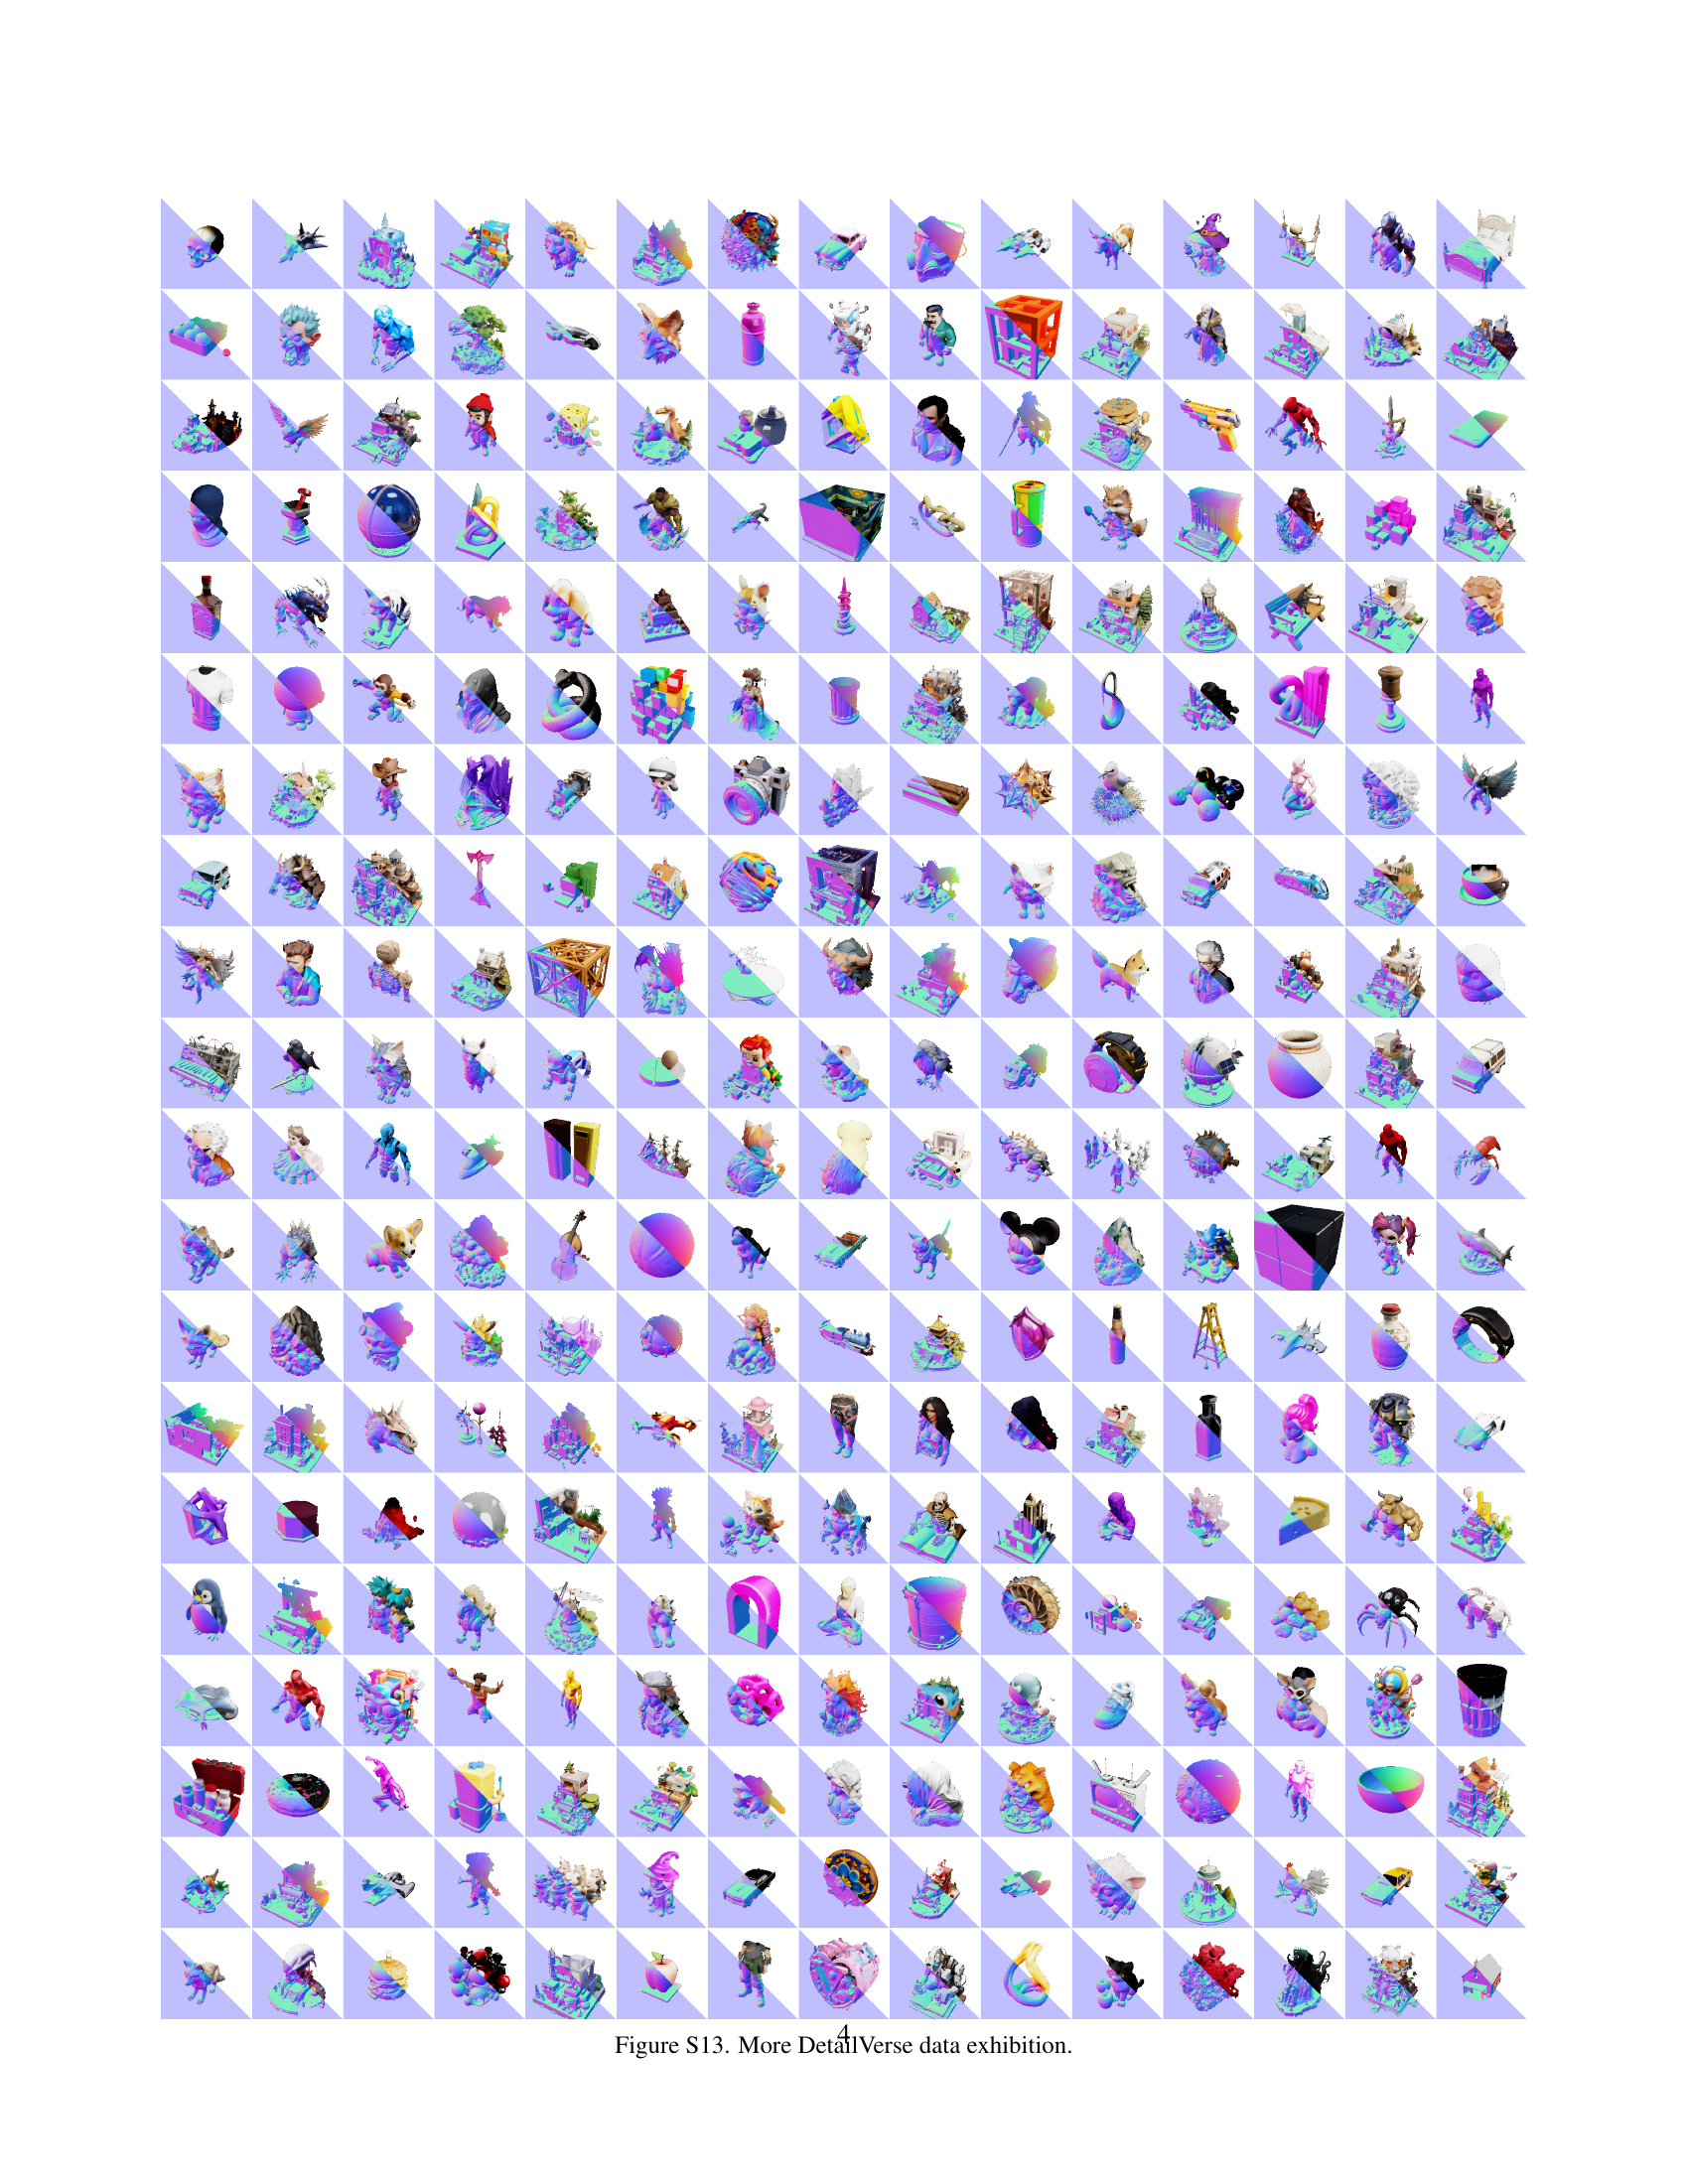
🔼 Figure S13 showcases a diverse range of 3D models from the DetailVerse dataset. These models demonstrate the dataset’s ability to generate assets with complex geometries, rich surface details, and a variety of shapes and styles. The high visual fidelity of these models underscores the effectiveness of the dataset in supporting high-fidelity 3D geometry generation.
read the caption
Figure S13: More DetailVerse data exhibition.

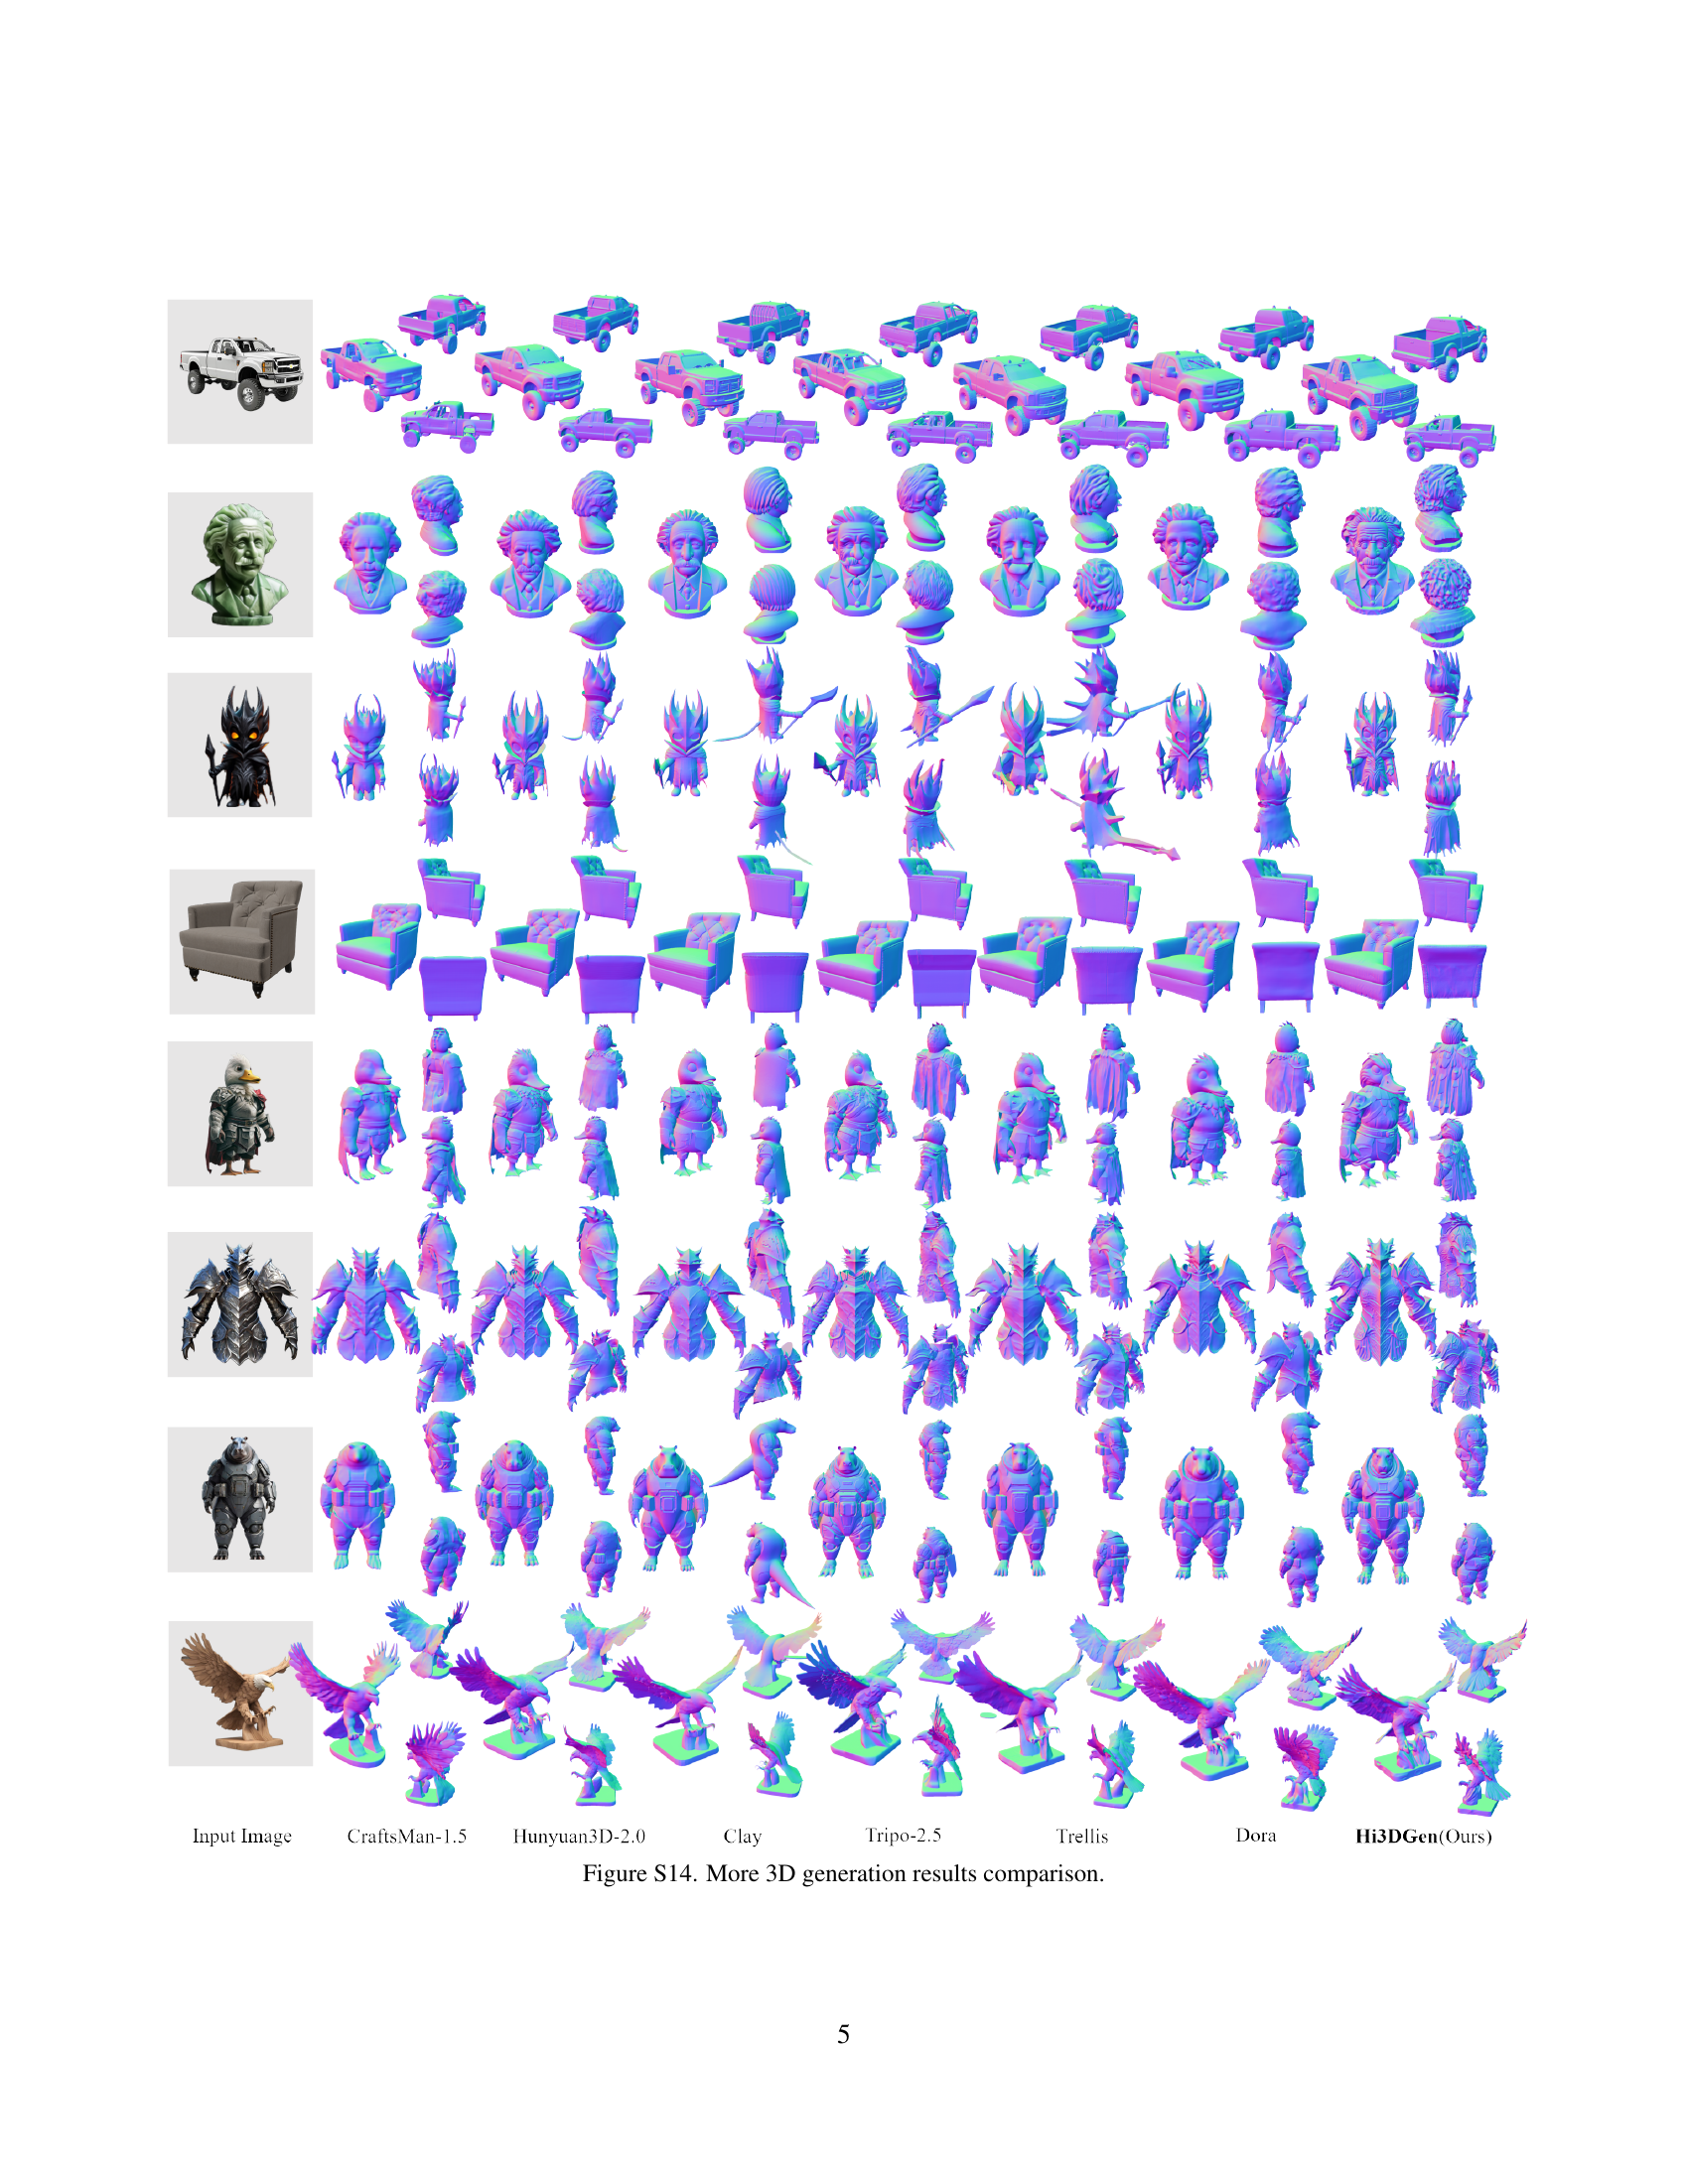
🔼 Figure S14 presents a qualitative comparison of 3D model generation results from various state-of-the-art (SOTA) methods and Hi3DGen. For several input images, the generated 3D models from Hi3DGen and other techniques (CraftsMan-1.5, Hunyuan3D-2.0, Clay, Tripo-2.5, Trellis, and Dora) are displayed side-by-side, enabling a visual assessment of the fidelity, detail preservation, and overall quality of each method’s output. This comparison highlights Hi3DGen’s ability to generate richer, more detailed 3D models that more closely match the input images.
read the caption
Figure S14: More 3D generation results comparison.
More on tables
| Method | NE | SNE |
| (Diff.) GeoWizard [21] | 31.381 | 36.642 |
| (Diff.) StableNormal [80] | 31.265 | 37.045 |
| (Regr.) Lotus [25] | 53.051 | 52.843 |
| (Regr.) GenPercept [77] | 28.050 | 35.289 |
| (Regr.) NiRNE (Ours) | 21.837 | 26.628 |
🔼 This table presents a quantitative comparison of different image normal estimation methods, categorized as diffusion-based and regression-based. The evaluation metrics used are Normal Error (NE) and Sharp Normal Error (SNE). Lower values indicate better performance. The table highlights the superior performance of the proposed NiRNE (Noise-Injected Regressive Normal Estimation) method by showing its lower NE and SNE values compared to other state-of-the-art methods.
read the caption
Table 2: Performance comparison on image normal estimation. We use (Diff.) and (Regr.) to indicate diffusion- and regression-based methods, respectively. Bold indicates best results.
| Method | NE | SNE |
| Ours (full model) | 21.837 | 26.628 |
| Ours w/o DV | 22.209 | 28.324 |
| Ours w/o DST | 23.288 | 29.690 |
| Ours w/o DS | 21.918 | 29.520 |
| Ours w/o all | 22.507 | 35.997 |
🔼 This table presents the results of an ablation study conducted on the Noise-Injected Regressive Normal Estimation (NiRNE) component of the Hi3DGen model. The study systematically removes individual components of NiRNE to assess their individual contributions to the model’s overall performance. The components evaluated are: the use of DetailVerse data (DV), the Noise Injection technique (NI), the Dual-Stream architecture (DS), and the Domain-Specific Training strategy (DST). The table shows the Normal Error (NE) and Sharp Normal Error (SNE) for each ablation configuration, allowing for a quantitative comparison of the impact of each component on the accuracy and sharpness of normal map estimation. Lower NE and SNE values indicate better performance.
read the caption
Table 3: Ablation study on different components of NiRNE. “DV”, “NI”,“DS”, and “DST” denote DetailVerse data, Noise Injection technique, Dual-Stream architecture, and Domain-Specific Training strategy, respectively.
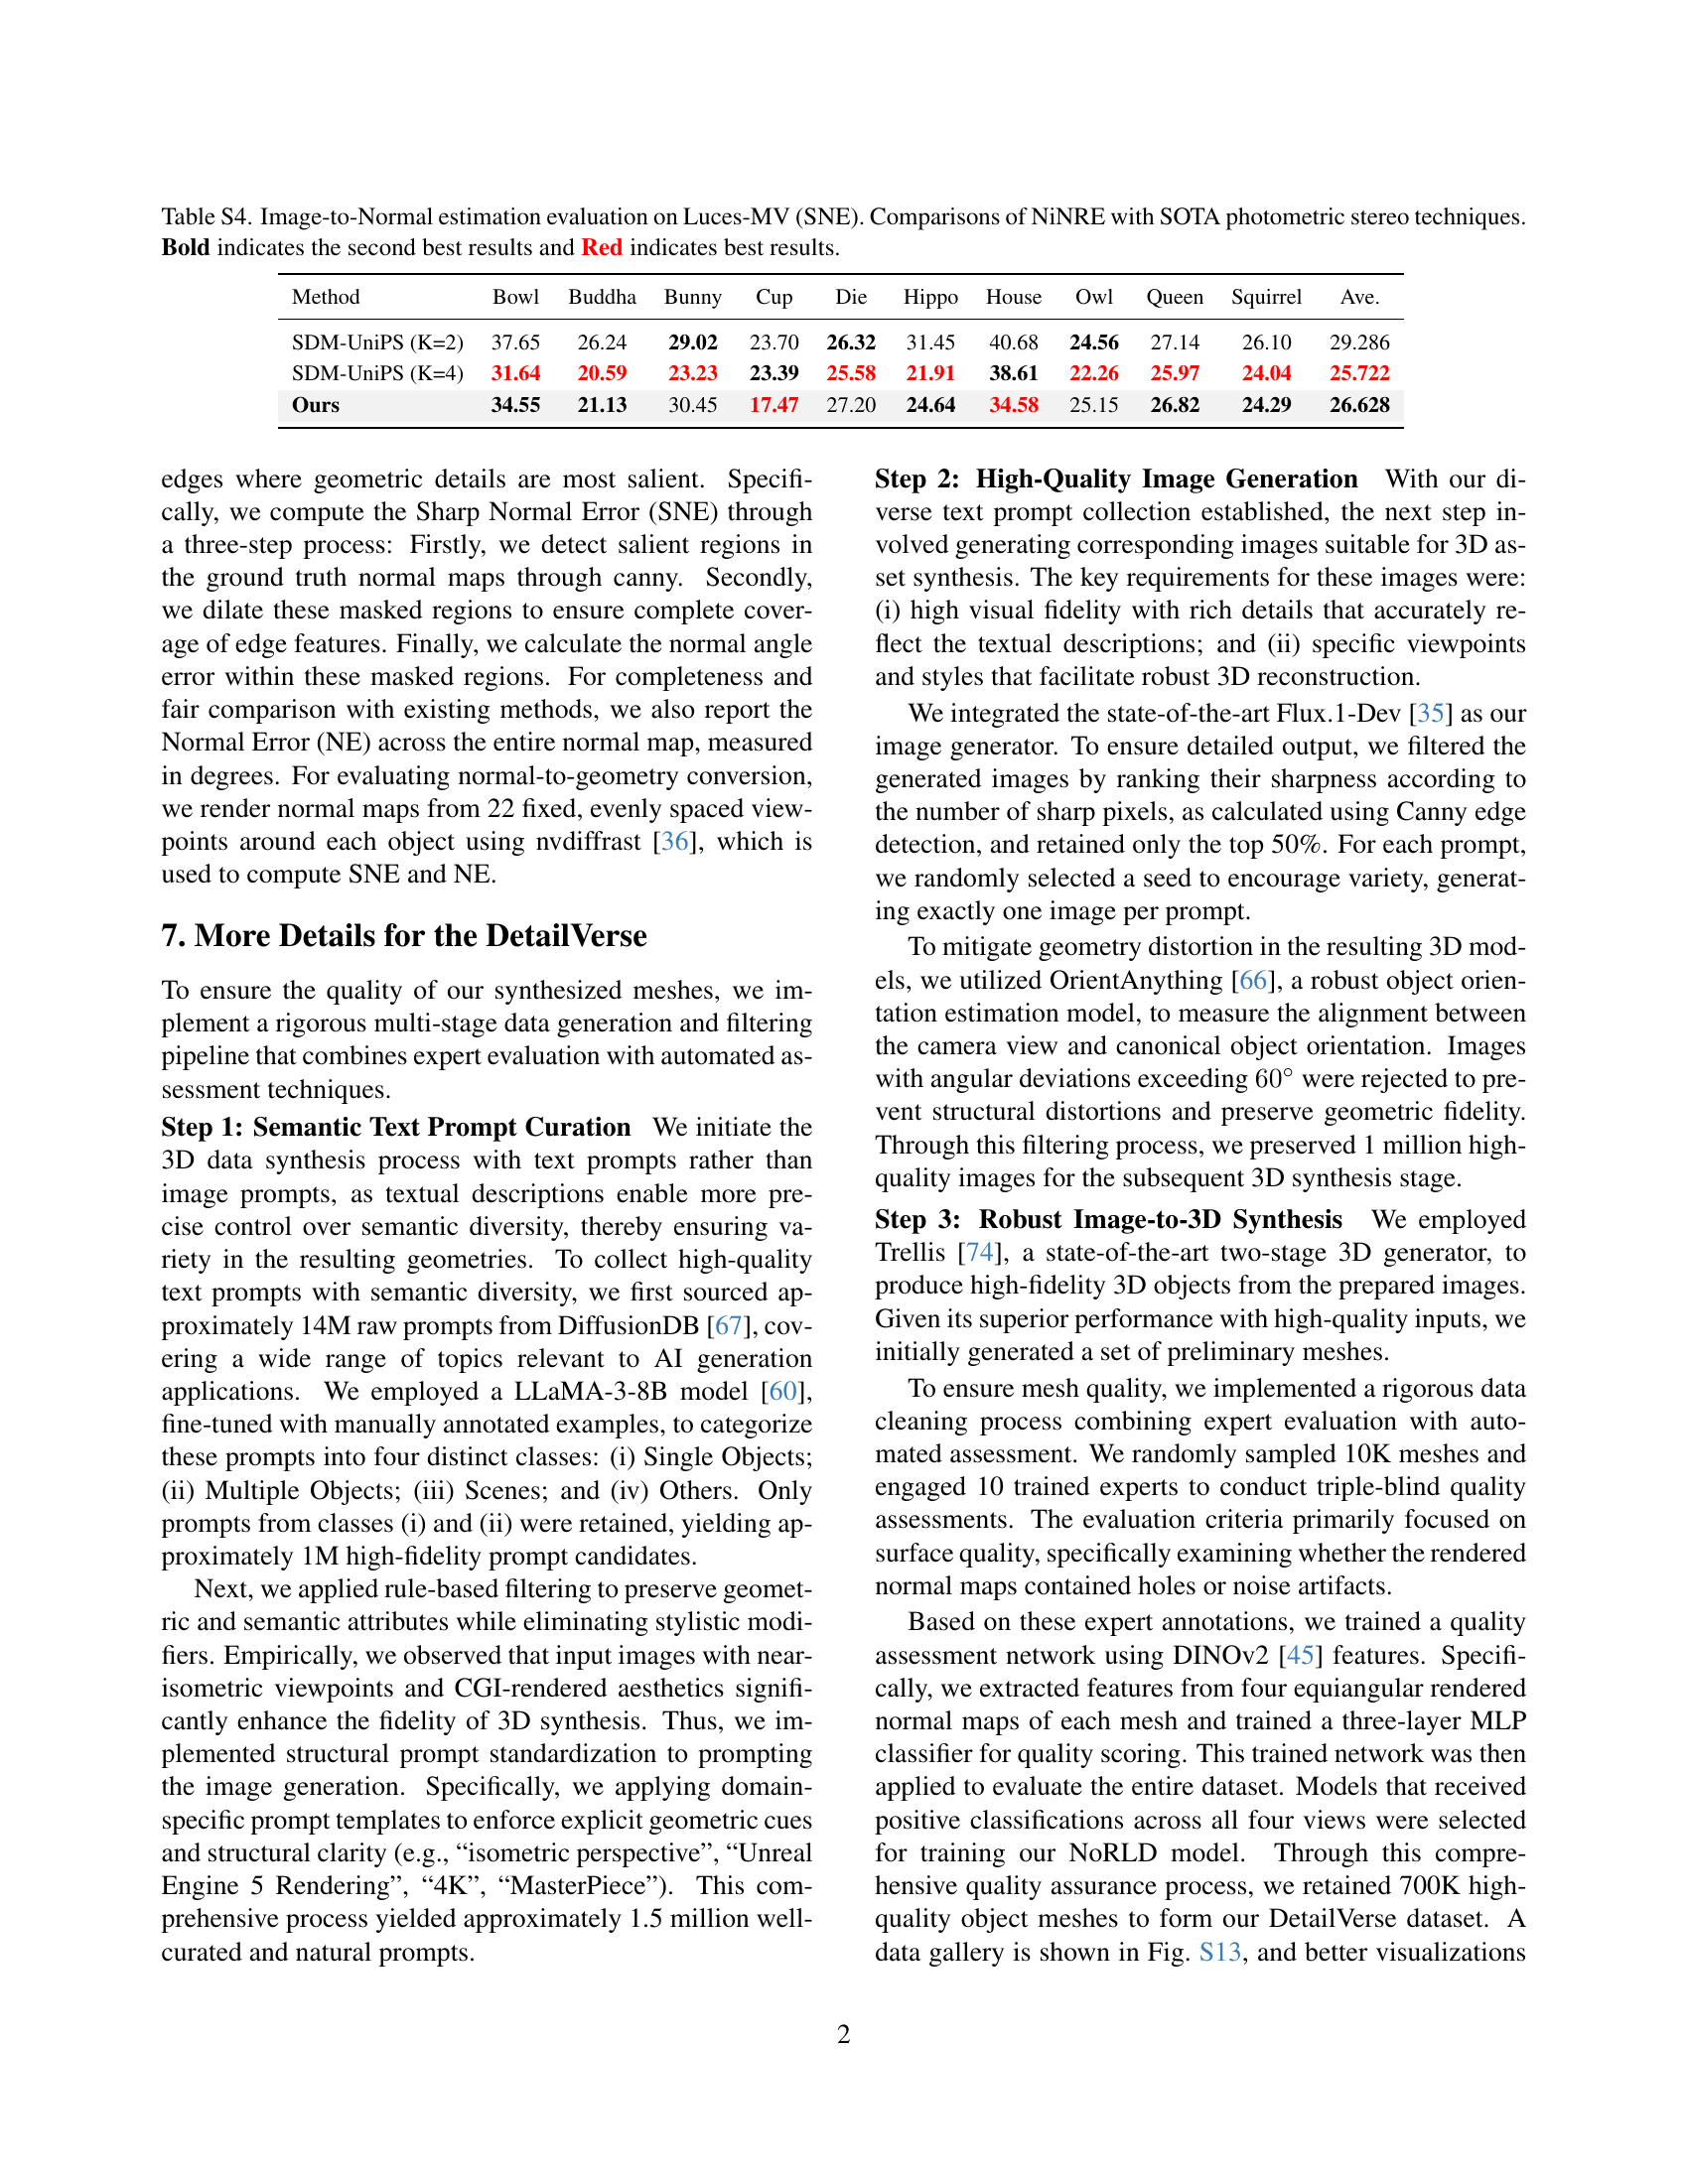
| Method | Bowl | Buddha | Bunny | Cup | Die | Hippo | House | Owl | Queen | Squirrel | Ave. |
| SDM-UniPS (K=2) | 37.65 | 26.24 | 29.02 | 23.70 | 26.32 | 31.45 | 40.68 | 24.56 | 27.14 | 26.10 | 29.286 |
| SDM-UniPS (K=4) | 31.64 | 20.59 | 23.23 | 23.39 | 25.58 | 21.91 | 38.61 | 22.26 | 25.97 | 24.04 | 25.722 |
| Ours | 34.55 | 21.13 | 30.45 | 17.47 | 27.20 | 24.64 | 34.58 | 25.15 | 26.82 | 24.29 | 26.628 |
🔼 Table S4 presents a quantitative comparison of the proposed NiRNE model’s performance on the Luces-MV dataset against state-of-the-art (SOTA) photometric stereo methods. The evaluation metric used is Sharp Normal Error (SNE), which specifically assesses the accuracy of normal estimation in sharp regions of the image, reflecting the level of detail captured. The table includes results for several different objects and displays the SNE values in degrees. Bold font highlights the second-best performance for each object, and red font indicates the best-performing method for each object. This table demonstrates the superior performance of NiRNE in accurately estimating surface normals, especially in areas with fine geometric details.
read the caption
Table S4: Image-to-Normal estimation evaluation on Luces-MV (SNE). Comparisons of NiNRE with SOTA photometric stereo techniques. Bold indicates the second best results and Red indicates best results.
Full paper#