TL;DR#
Sequential Recommendation (SeqRec) is vital for predicting user’s next item by learning from their past interactions. Current methods use a direct computation approach, where the encoder’s final hidden state represents the user. But this method needs more depth to understand complex user behaviors. It also struggles with less popular items, leading to less-than-ideal recommendations. To fix this issue, this paper has presented ReaRec framework to enhance user profiles through multi-step reasoning, using special embeddings to separate item encoding from reasoning.
To unleash the power of ReaRec, the study presents Ensemble Reasoning Learning (ERL) and Progressive Reasoning Learning (PRL), two new ways to learn. ERL uses ensemble learning to build multi-order user profiles, capturing different views of user interests, while PRL uses curriculum learning to guide the model from basic pattern learning to refining sequential patterns. Experiments on multiple datasets demonstrate the effectiveness of ReaRec. Remarkably, ReaRec improves performance across multiple setups, showing its potential for future research.
Key Takeaways#
Why does it matter?#
This paper introduces a novel inference-time computing framework that can enhance sequential recommendation models, opening up avenues for research in inference-time scaling and sequential recommendation.
Visual Insights#

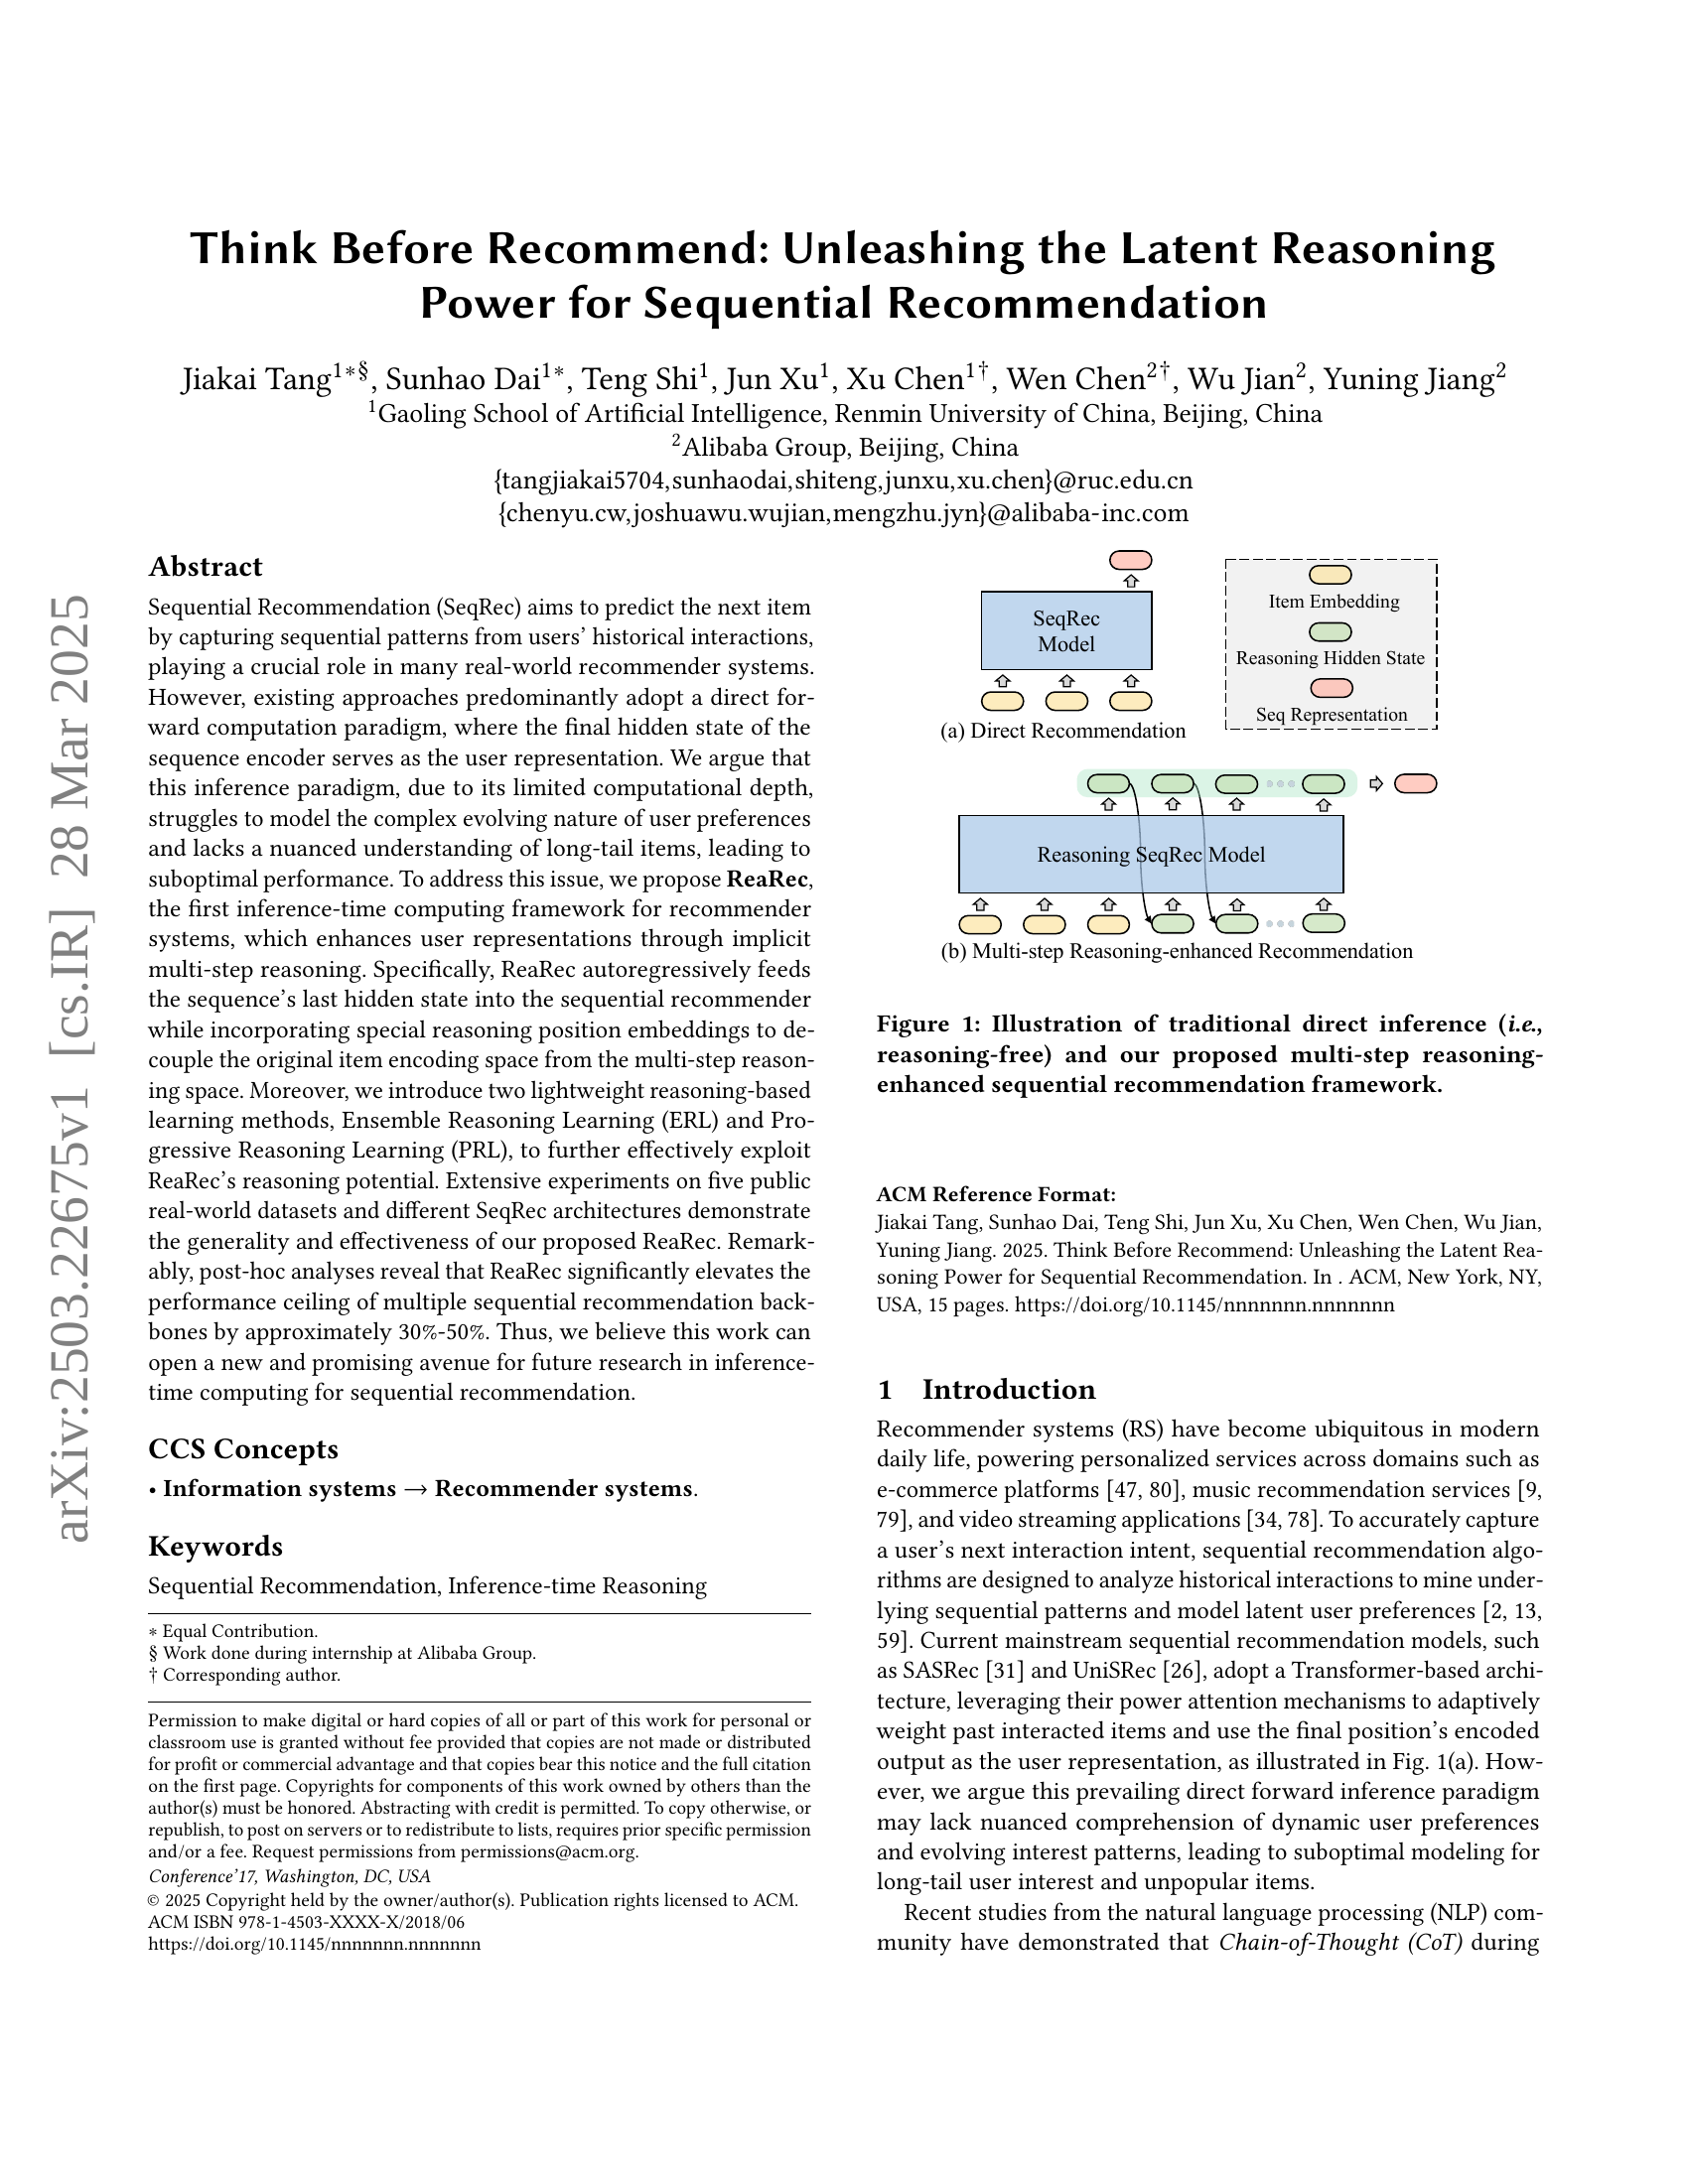
🔼 Figure 1 illustrates the difference between traditional sequential recommendation methods and the proposed ReaRec framework. Traditional methods use a direct inference approach, where the final hidden state of a sequence encoder represents the user’s preferences. In contrast, ReaRec introduces a multi-step reasoning process. The final hidden state is repeatedly fed back into the model to enhance the user representation through implicit reasoning. Special reasoning position embeddings are used to distinguish between the item encoding space and the multi-step reasoning space.
read the caption
Figure 1. Illustration of traditional direct inference (i.e., reasoning-free) and our proposed multi-step reasoning-enhanced sequential recommendation framework.
| Dataset | Yelp | Video & Games | Software | CDs & Vinyl | Baby & Products |
| #Users | 13,083 | 89,021 | 30,049 | 35,238 | 140,292 |
| #Items | 10,697 | 22,933 | 16,705 | 87,969 | 30,689 |
| #Avg. Inter. / User | 33.92 | 5.96 | 5.59 | 14.59 | 5.57 |
| #Avg. Inter. / Item | 41.49 | 23.15 | 10.06 | 5.84 | 25.44 |
| #Avg. Inter. | 443,807 | 530,989 | 168,029 | 513,991 | 780,809 |
| Sparisty | 99.68% | 99.97% | 99.97% | 99.98% | 99.98% |
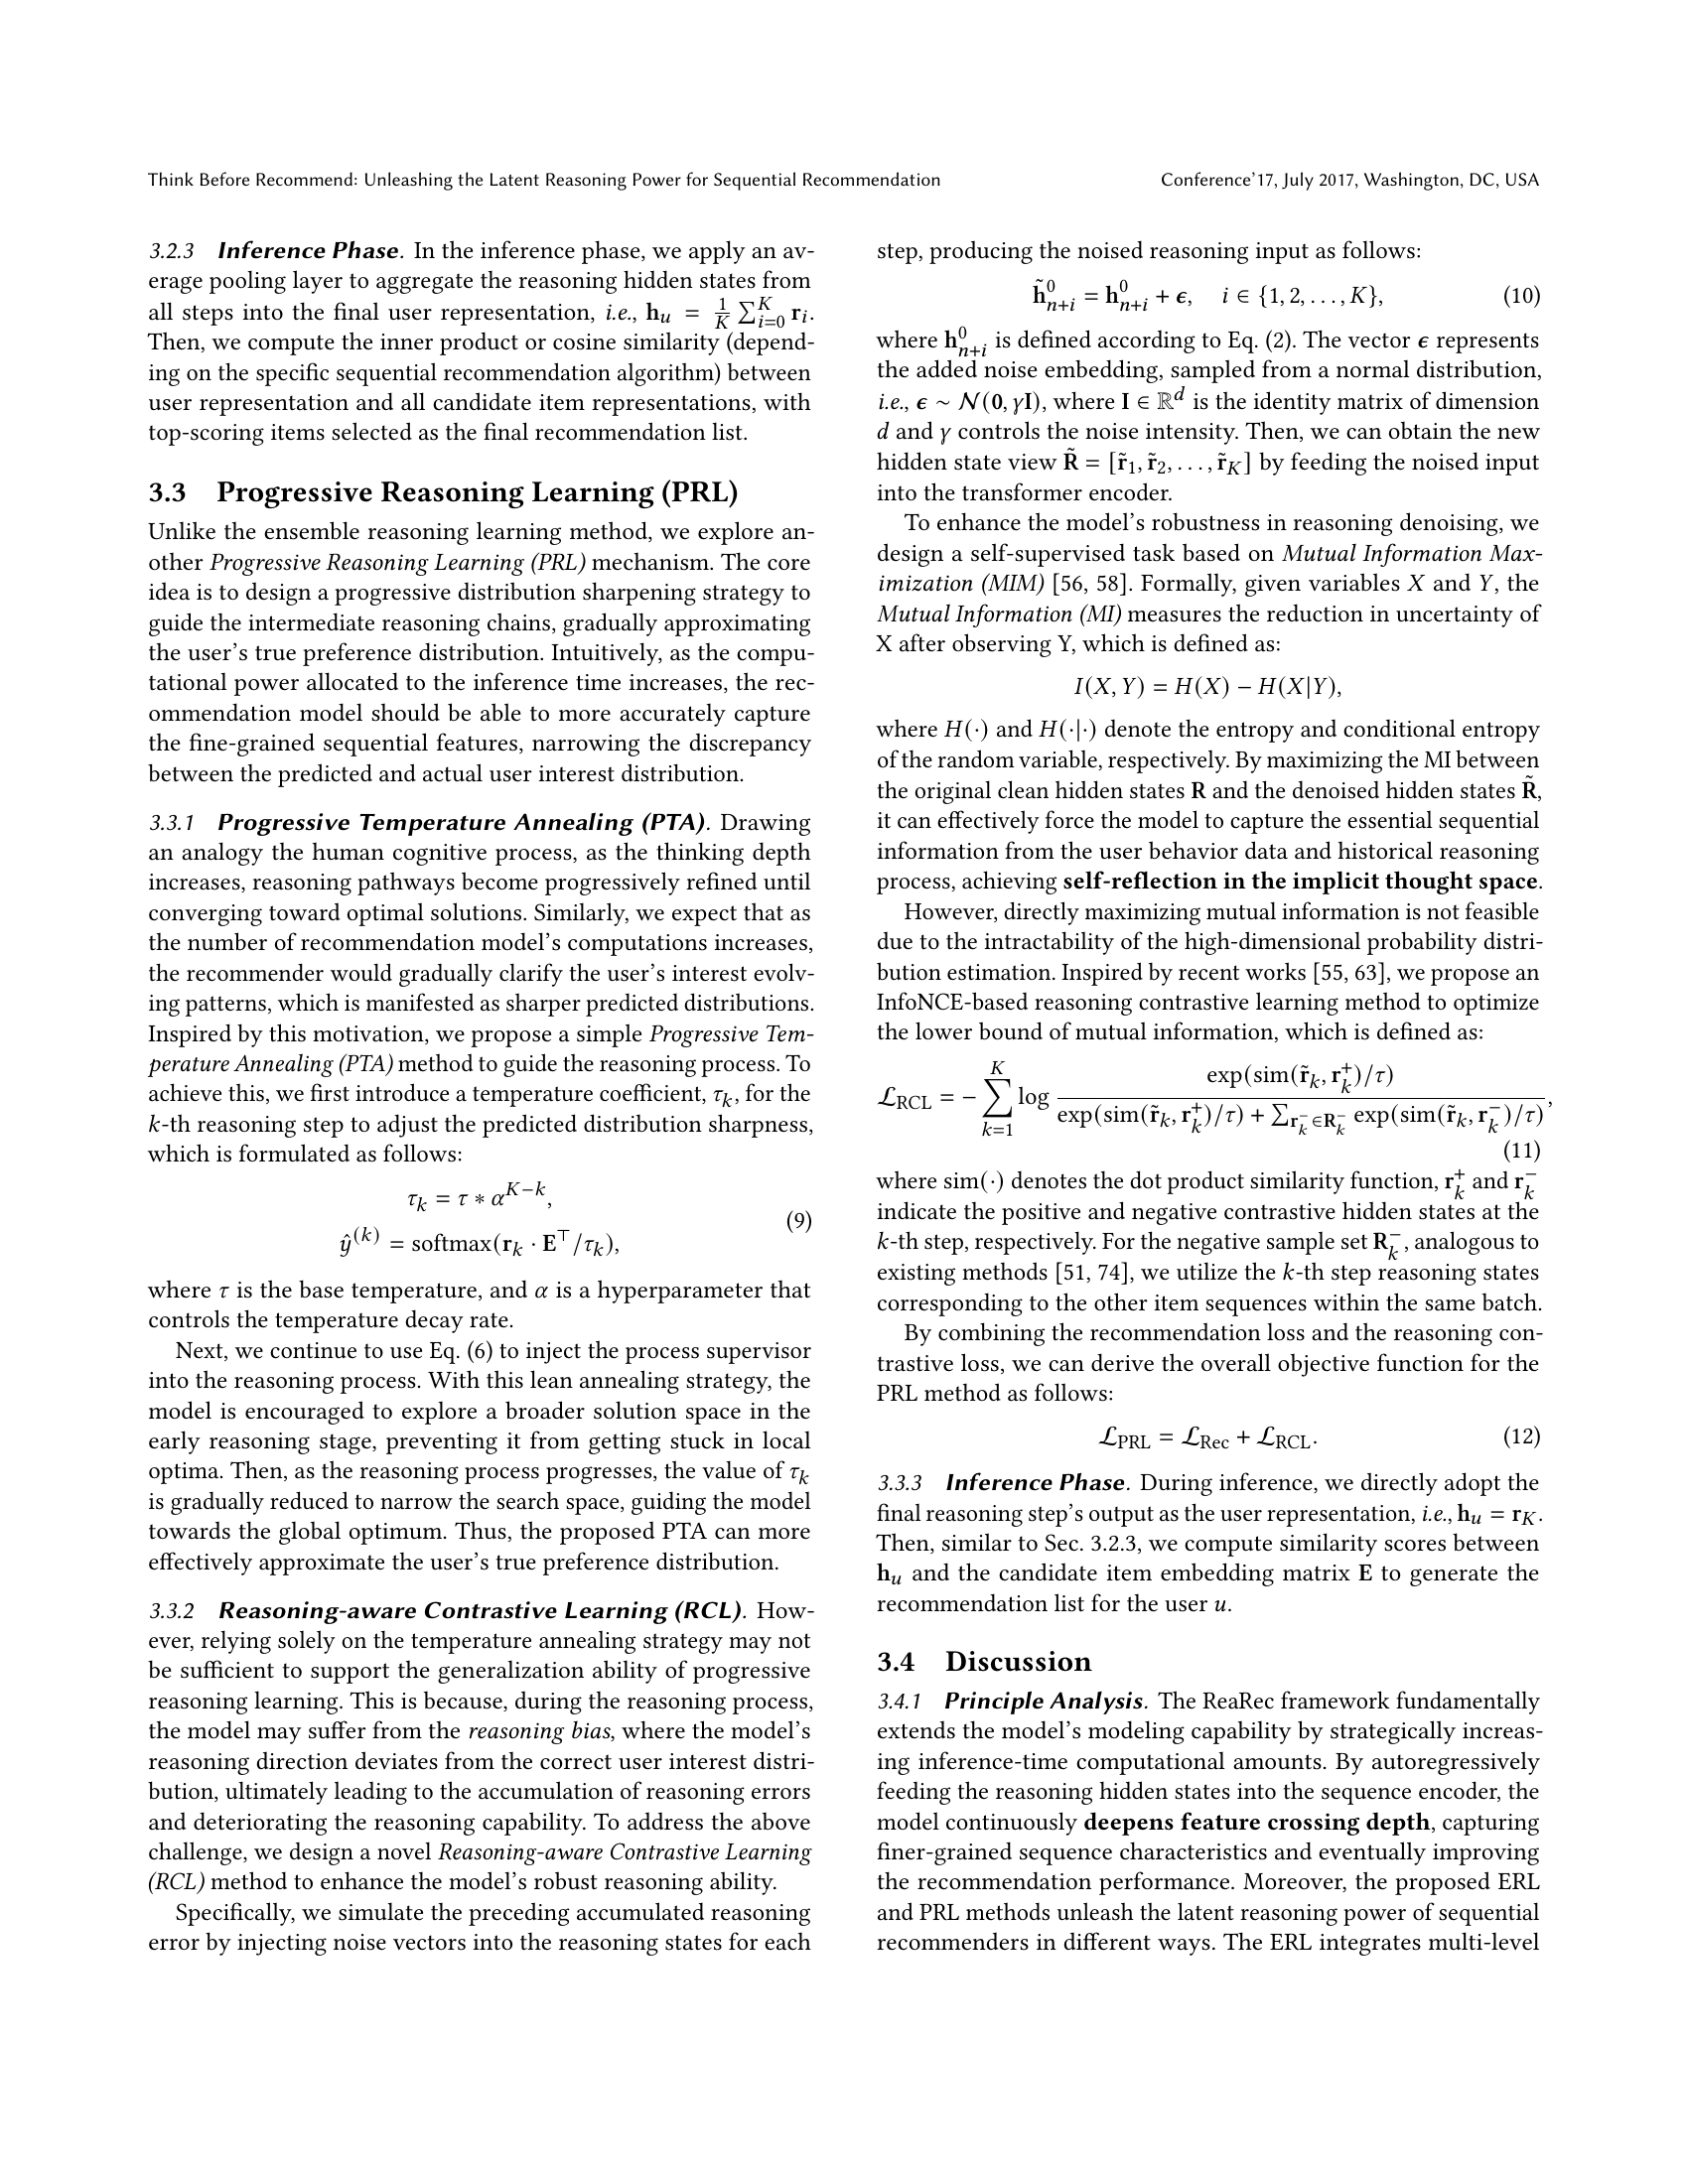
🔼 Table 1 presents a summary of the characteristics of five datasets used in the paper’s experiments on sequential recommendation. For each dataset (Yelp, Video & Games, Software, CDs & Vinyl, and Baby & Products), the table provides the number of users, the number of items, the average number of interactions per user, the average number of interactions per item, and the sparsity of the dataset. This information is crucial for understanding the scale and nature of the data used to evaluate the proposed models.
read the caption
Table 1. The statistics of datasets.
In-depth insights#
Inference ReaRec#
While “Inference ReaRec” isn’t explicitly a heading, the paper’s core contribution revolves around enhancing inference in sequential recommendation. ReaRec, the proposed framework, strategically increases inference-time computation to allow models to “think” more deeply before recommending. This is achieved through multi-step implicit reasoning, where the sequence encoder’s hidden state is fed back autoregressively. The key idea is to refine user representations through these reasoning chains, mimicking the cognitive process of deliberation. This is in contrast to traditional methods relying on a single forward pass, which may struggle with complex user preferences or long-tail items. The framework’s model-agnostic design allows it to be integrated with various SeqRec architectures, demonstrating its potential to significantly boost performance by deepening feature crossing within the latent space, especially for users with sparse data.
Reasoning Boost#
The concept of “Reasoning Boost” in sequential recommendation systems (SeqRec) signifies a paradigm shift beyond direct forward computation. Instead of solely relying on the final hidden state of a sequence encoder, Reasoning Boost entails enriching user representations through iterative, multi-step inference. This approach aims to mimic human cognitive processes, where deliberation and logical analysis precede decision-making. By autoregressively feeding the sequence’s last hidden state back into the SeqRec model, while incorporating specialized reasoning position embeddings to decouple the item encoding and reasoning spaces, the model gains enhanced computational depth to capture nuanced, evolving user preferences, particularly for long-tail items. This leads to a more refined understanding of user interests and improved recommendation accuracy. This approach has the potential to address inherent limitations of direct forward computation, unlocking latent reasoning capabilities and enabling more adaptive and personalized recommendations.
ERL & PRL Learn#
Ensemble Reasoning Learning (ERL) and Progressive Reasoning Learning (PRL) represent distinct yet complementary approaches to enhancing sequential recommendation systems. ERL leverages the power of ensemble methods by aggregating diverse reasoning results from multiple steps, mitigating suboptimal performance arising from reliance solely on the final output. This multi-view approach aims to capture a more comprehensive understanding of evolving user interests. Conversely, PRL adopts a curriculum learning strategy, progressively sharpening the model’s focus on the user’s true preference distribution. By gradually refining the reasoning pathways, PRL seeks to avoid premature convergence and better approximate complex sequential patterns. The core difference is that ERL integrates multi-level information, while PRL uncovers complex intent evolution patterns. Both aim to enhance reasoning and improve recommendation accuracy, addressing limitations of direct forward computation.
Dataset analysis#
Based on the provided research paper about sequential recommendation, the ‘Dataset analysis’ section would typically involve a detailed examination of the datasets used for evaluating the proposed model. This often includes statistics such as the number of users, items, and interactions, as well as the sparsity of the interaction data. Understanding these characteristics is crucial because they directly influence the performance of recommendation algorithms. For instance, a highly sparse dataset might necessitate techniques like data augmentation or transfer learning to improve model generalization. Additionally, the analysis might delve into the distribution of item popularity and user activity, identifying potential biases that could affect the fairness and accuracy of the recommendations. It would also be important to describe how the datasets were preprocessed, including any filtering steps (e.g., removing inactive users or unpopular items) and how the data was split into training, validation, and test sets. The choice of evaluation metrics should align with the dataset properties and the research goals, with common metrics including precision, recall, NDCG, and MAP.
Future Scaling#
Future scaling of recommendation systems presents exciting opportunities, particularly through inference-time computation. Adaptive inference depth could optimize resource allocation, applying deeper reasoning only when needed, avoiding overthinking for simple patterns. Parameter disentanglement between encoding and reasoning phases can reduce task ambiguity, leading to specialized, efficient modules. Exploring the inference-time scaling law in recommendation systems could uncover design principles for better reasoning capabilities. Theoretical analysis of multi-step reasoning promises improved accuracy and understanding. Efficient inference mechanisms, such as linear attention and model quantization, are crucial to address the computational demands of scaling and real-world deployment.
More visual insights#
More on figures

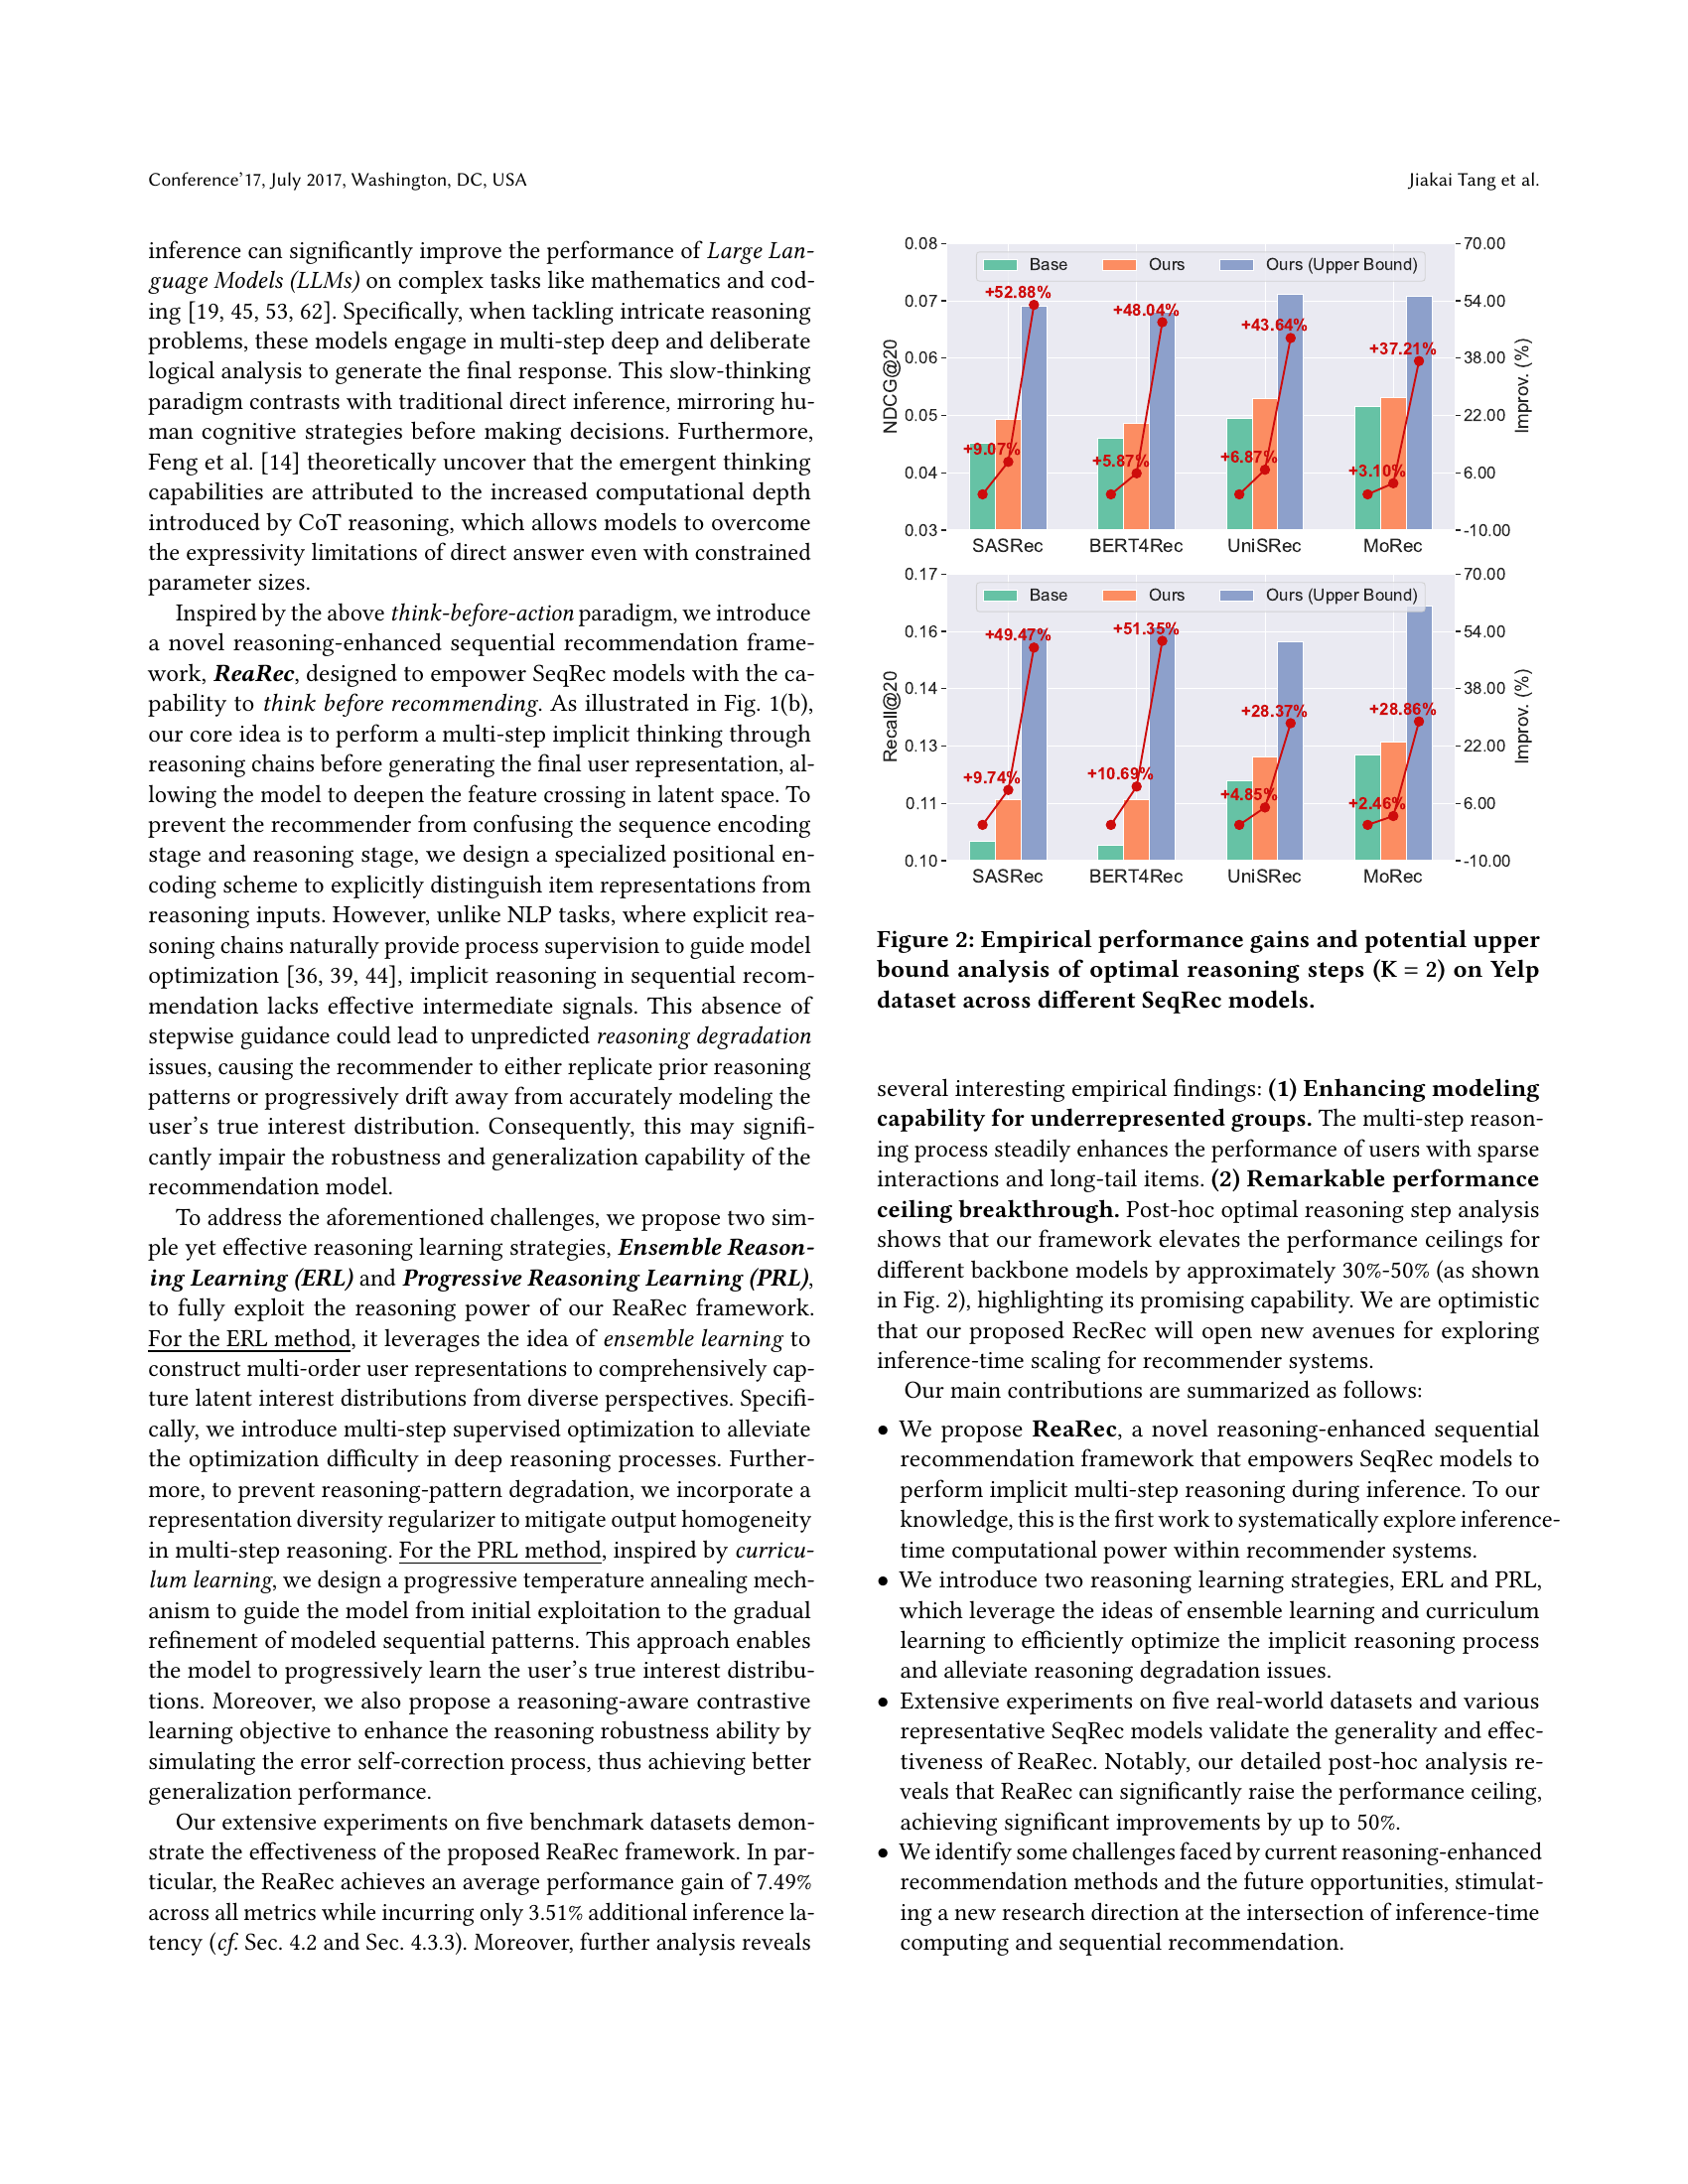
🔼 This figure displays the performance improvement achieved by incorporating multi-step reasoning into various sequential recommendation models. Specifically, it shows the gains in performance metrics (likely NDCG and Recall) when using two reasoning steps (K=2) on the Yelp dataset, compared to baseline models without reasoning. The bars represent the improvement percentage, and error bars (likely standard deviation) illustrate the variability in performance. Different colored bars indicate different sequential recommendation models (e.g., SASRec, BERT4Rec, etc.), allowing comparison of the method’s effectiveness across various architectures.
read the caption
Figure 2. Empirical performance gains and potential upper bound analysis of optimal reasoning steps (𝐊=𝟐𝐊2\mathbf{K=2}bold_K = bold_2) on Yelp dataset across different SeqRec models.
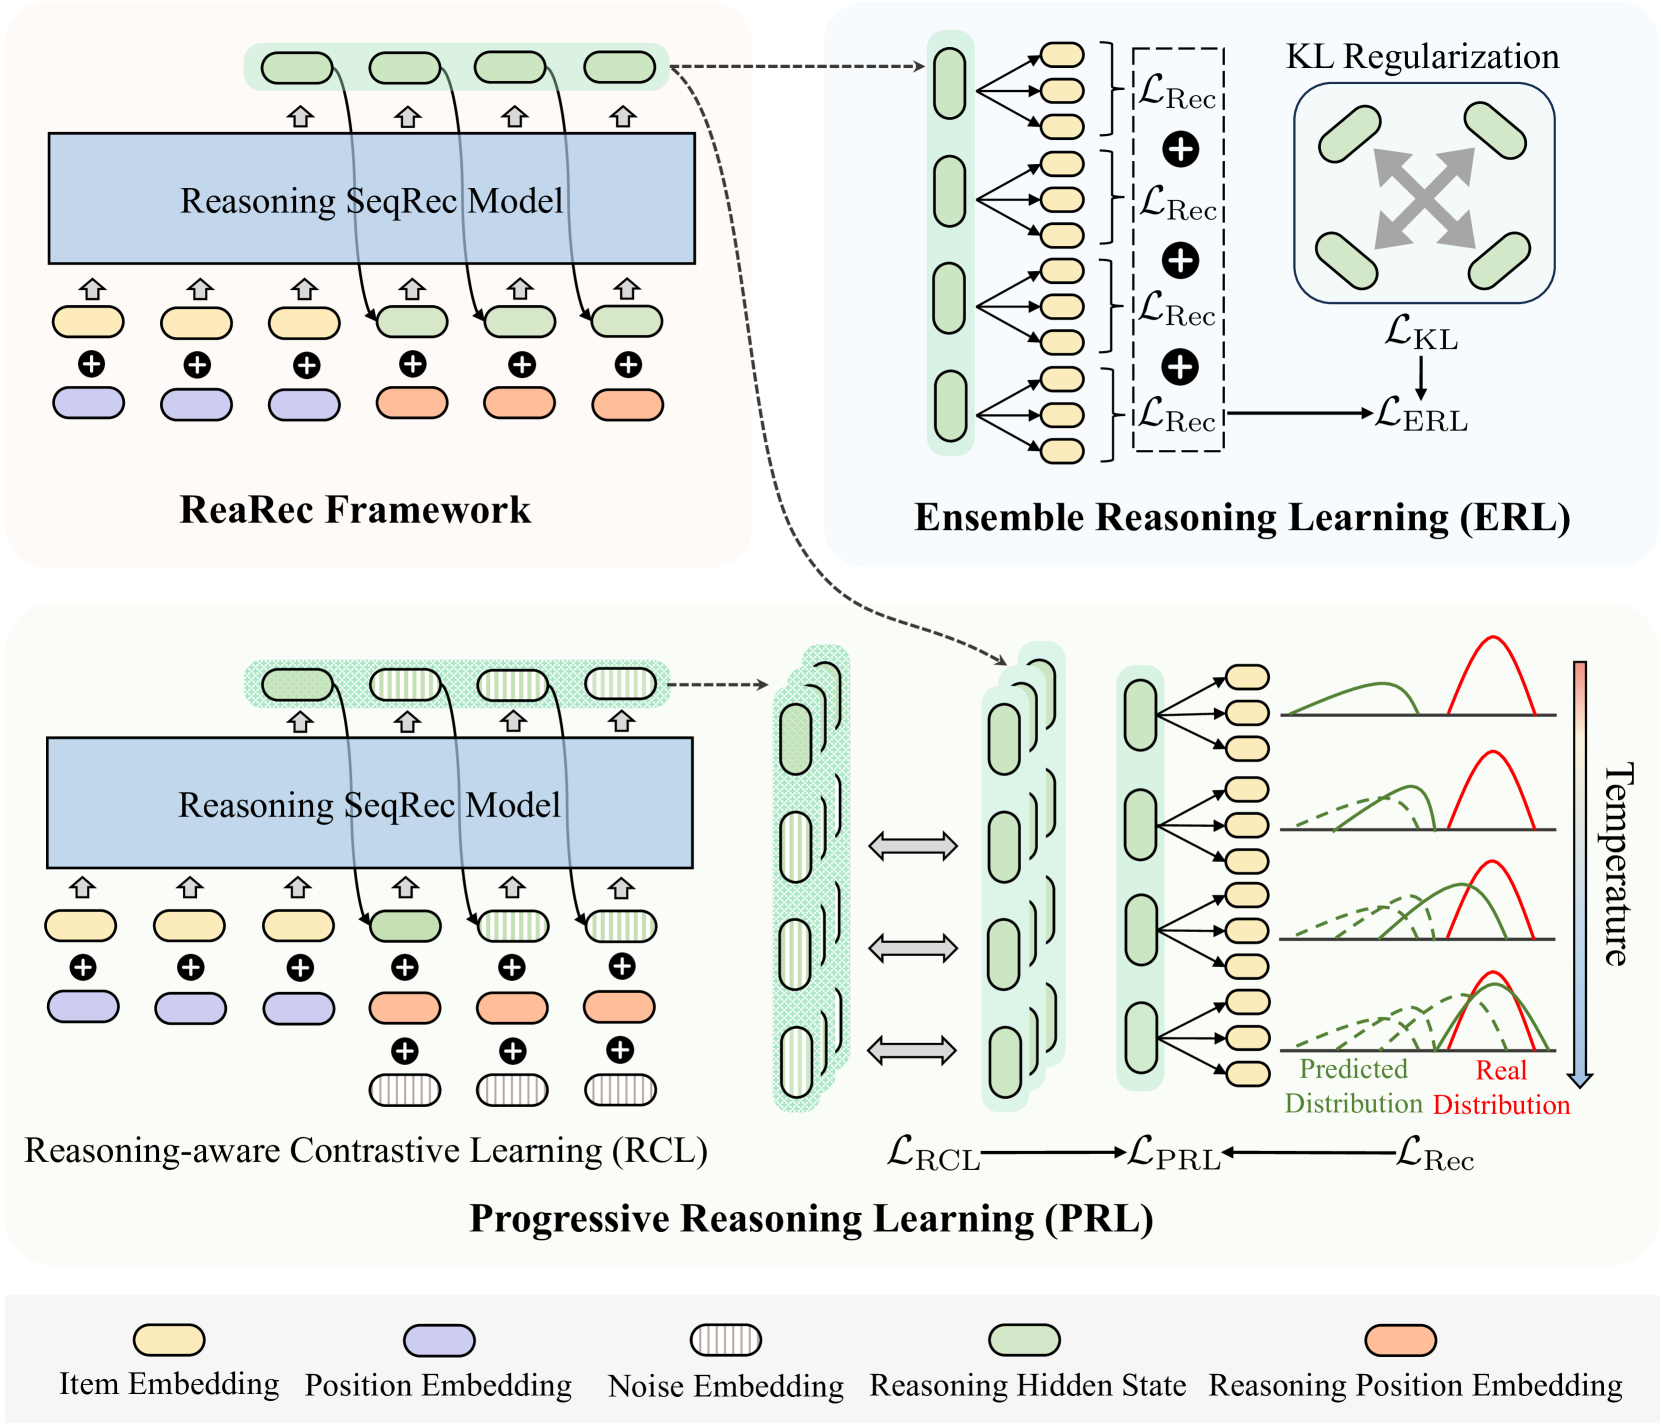
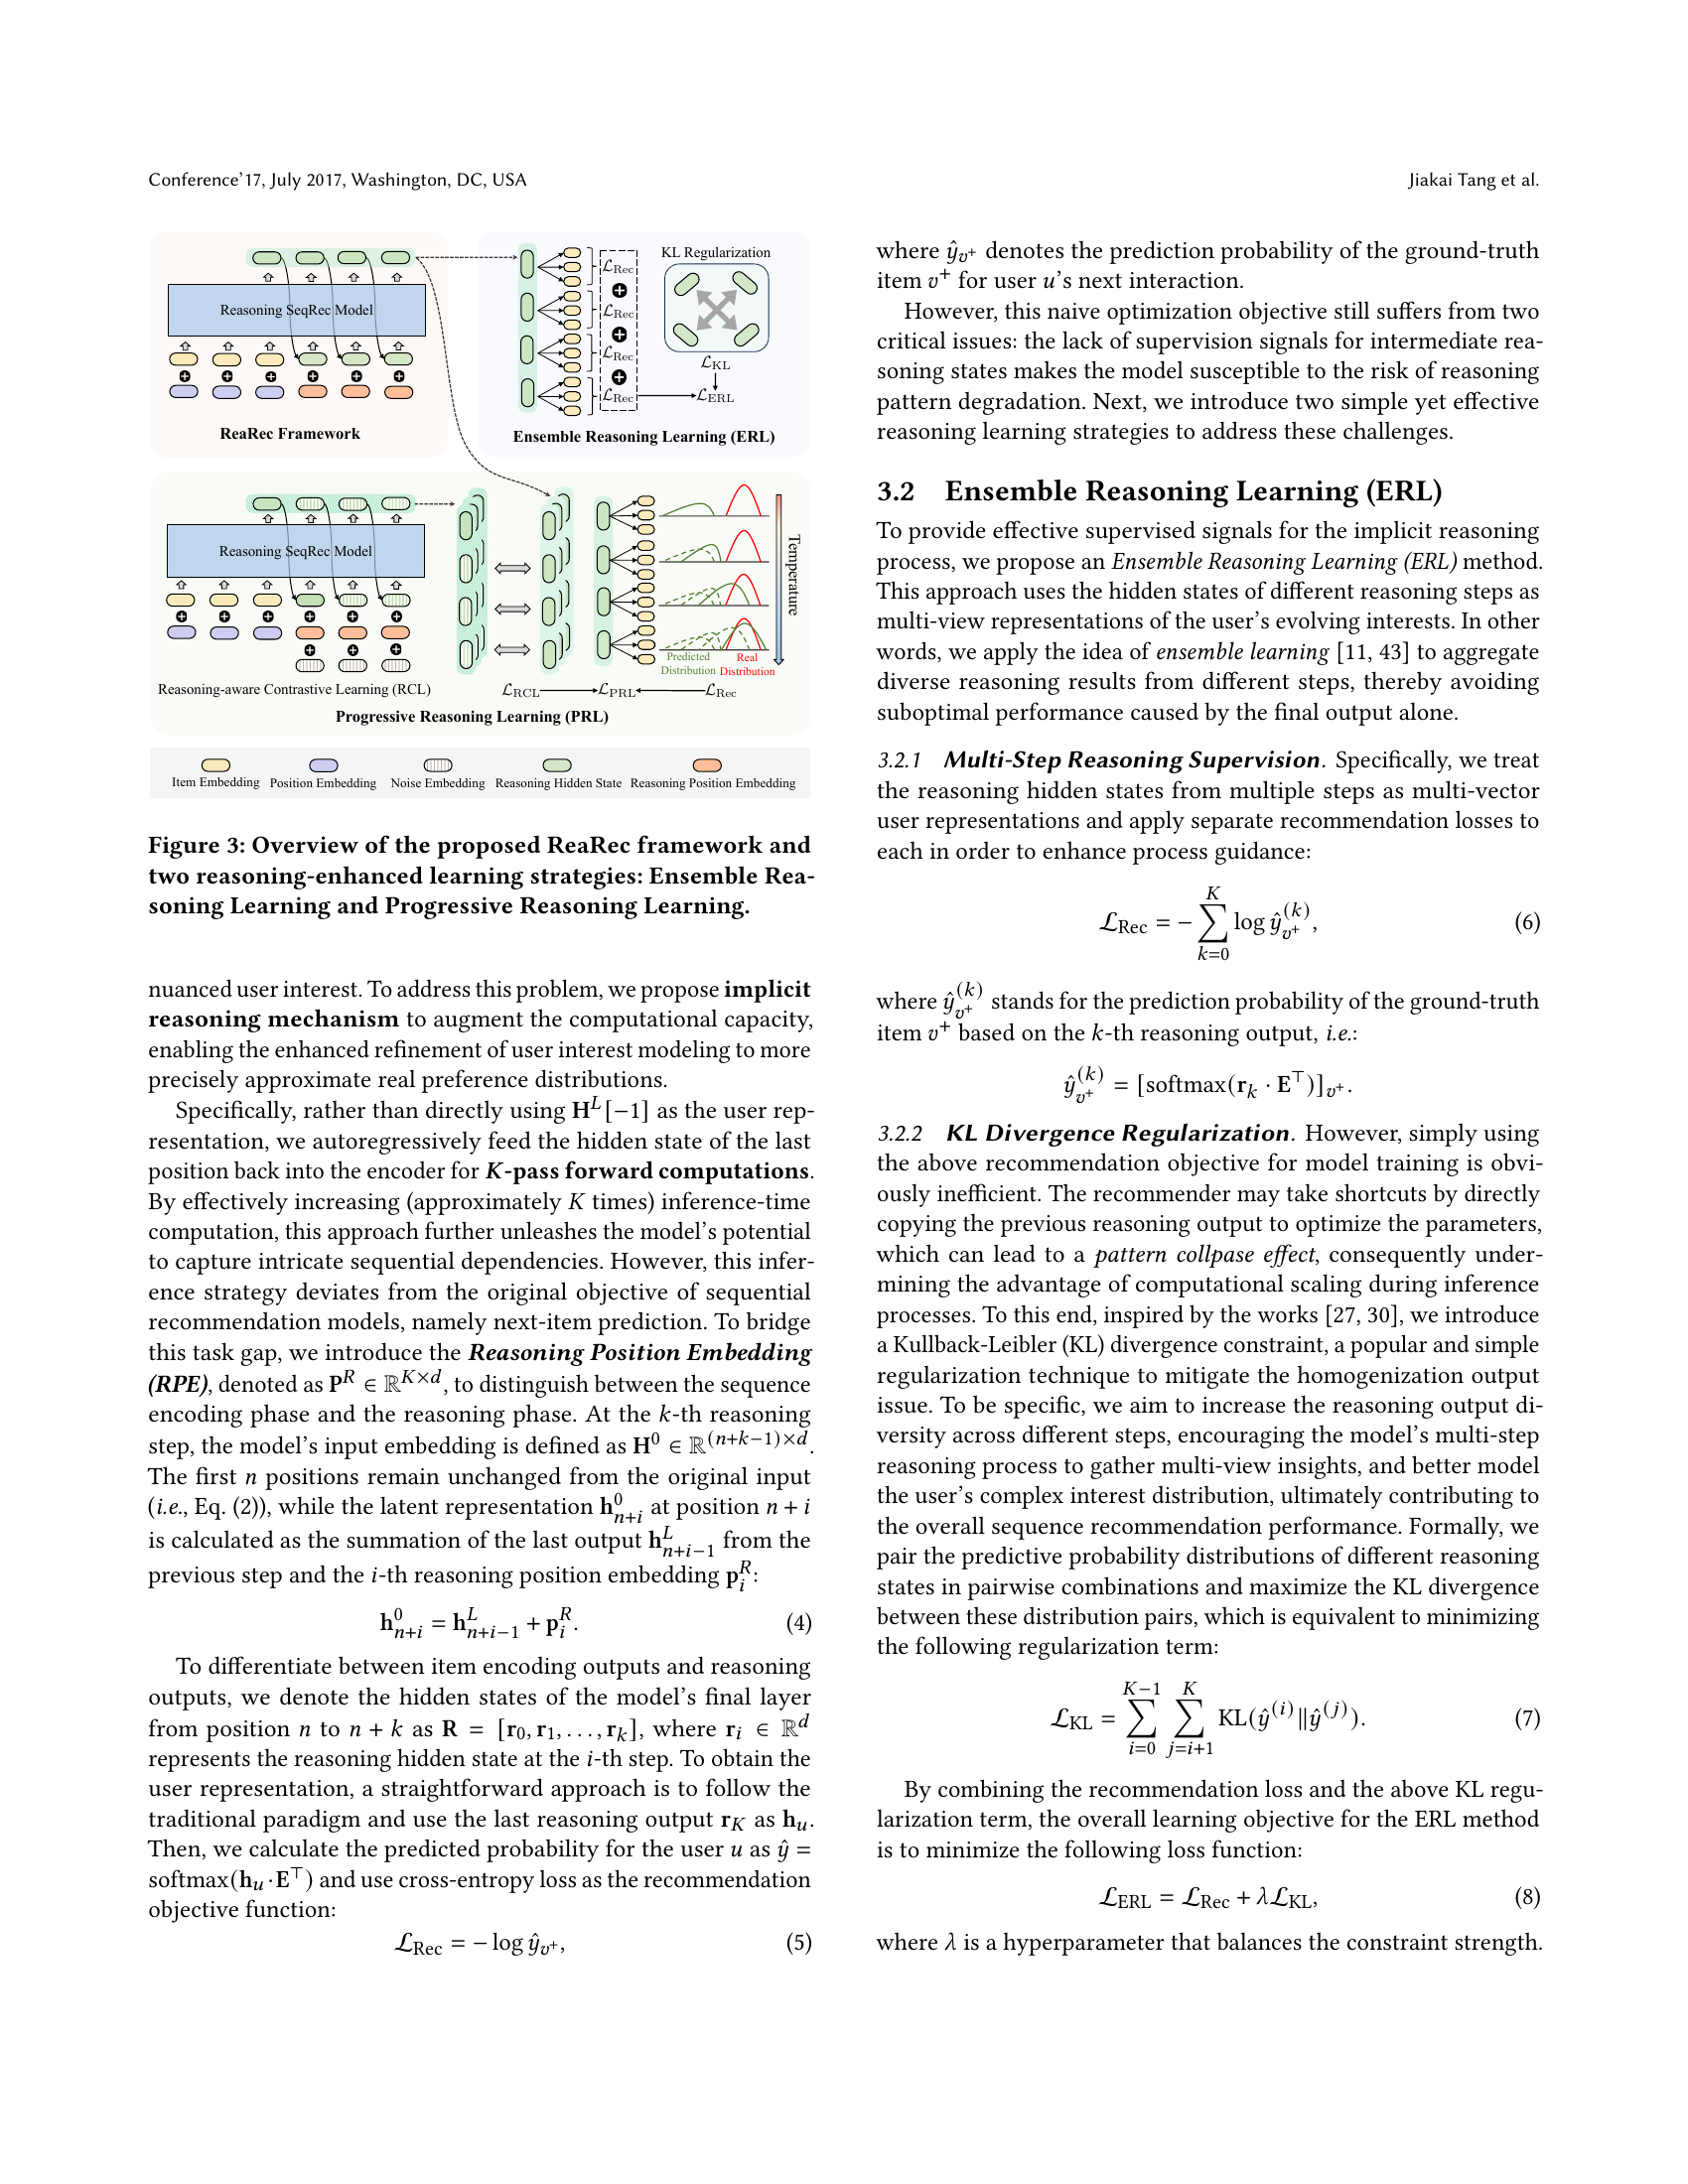
🔼 Figure 3 provides a detailed illustration of the ReaRec framework, a novel sequential recommendation model that incorporates multi-step reasoning. It shows the main components, including item embeddings, positional embeddings, reasoning hidden states, reasoning position embeddings, and the two proposed learning methods: Ensemble Reasoning Learning (ERL) and Progressive Reasoning Learning (PRL). ERL uses multi-order user representations from different reasoning steps to prevent reasoning degradation, while PRL guides the reasoning process through a progressive temperature annealing mechanism and contrastive learning, ultimately leading to a more robust and accurate modeling of user preferences. The diagram visually depicts how these components interact to generate enhanced user representations and improve recommendation accuracy.
read the caption
Figure 3. Overview of the proposed ReaRec framework and two reasoning-enhanced learning strategies: Ensemble Reasoning Learning and Progressive Reasoning Learning.

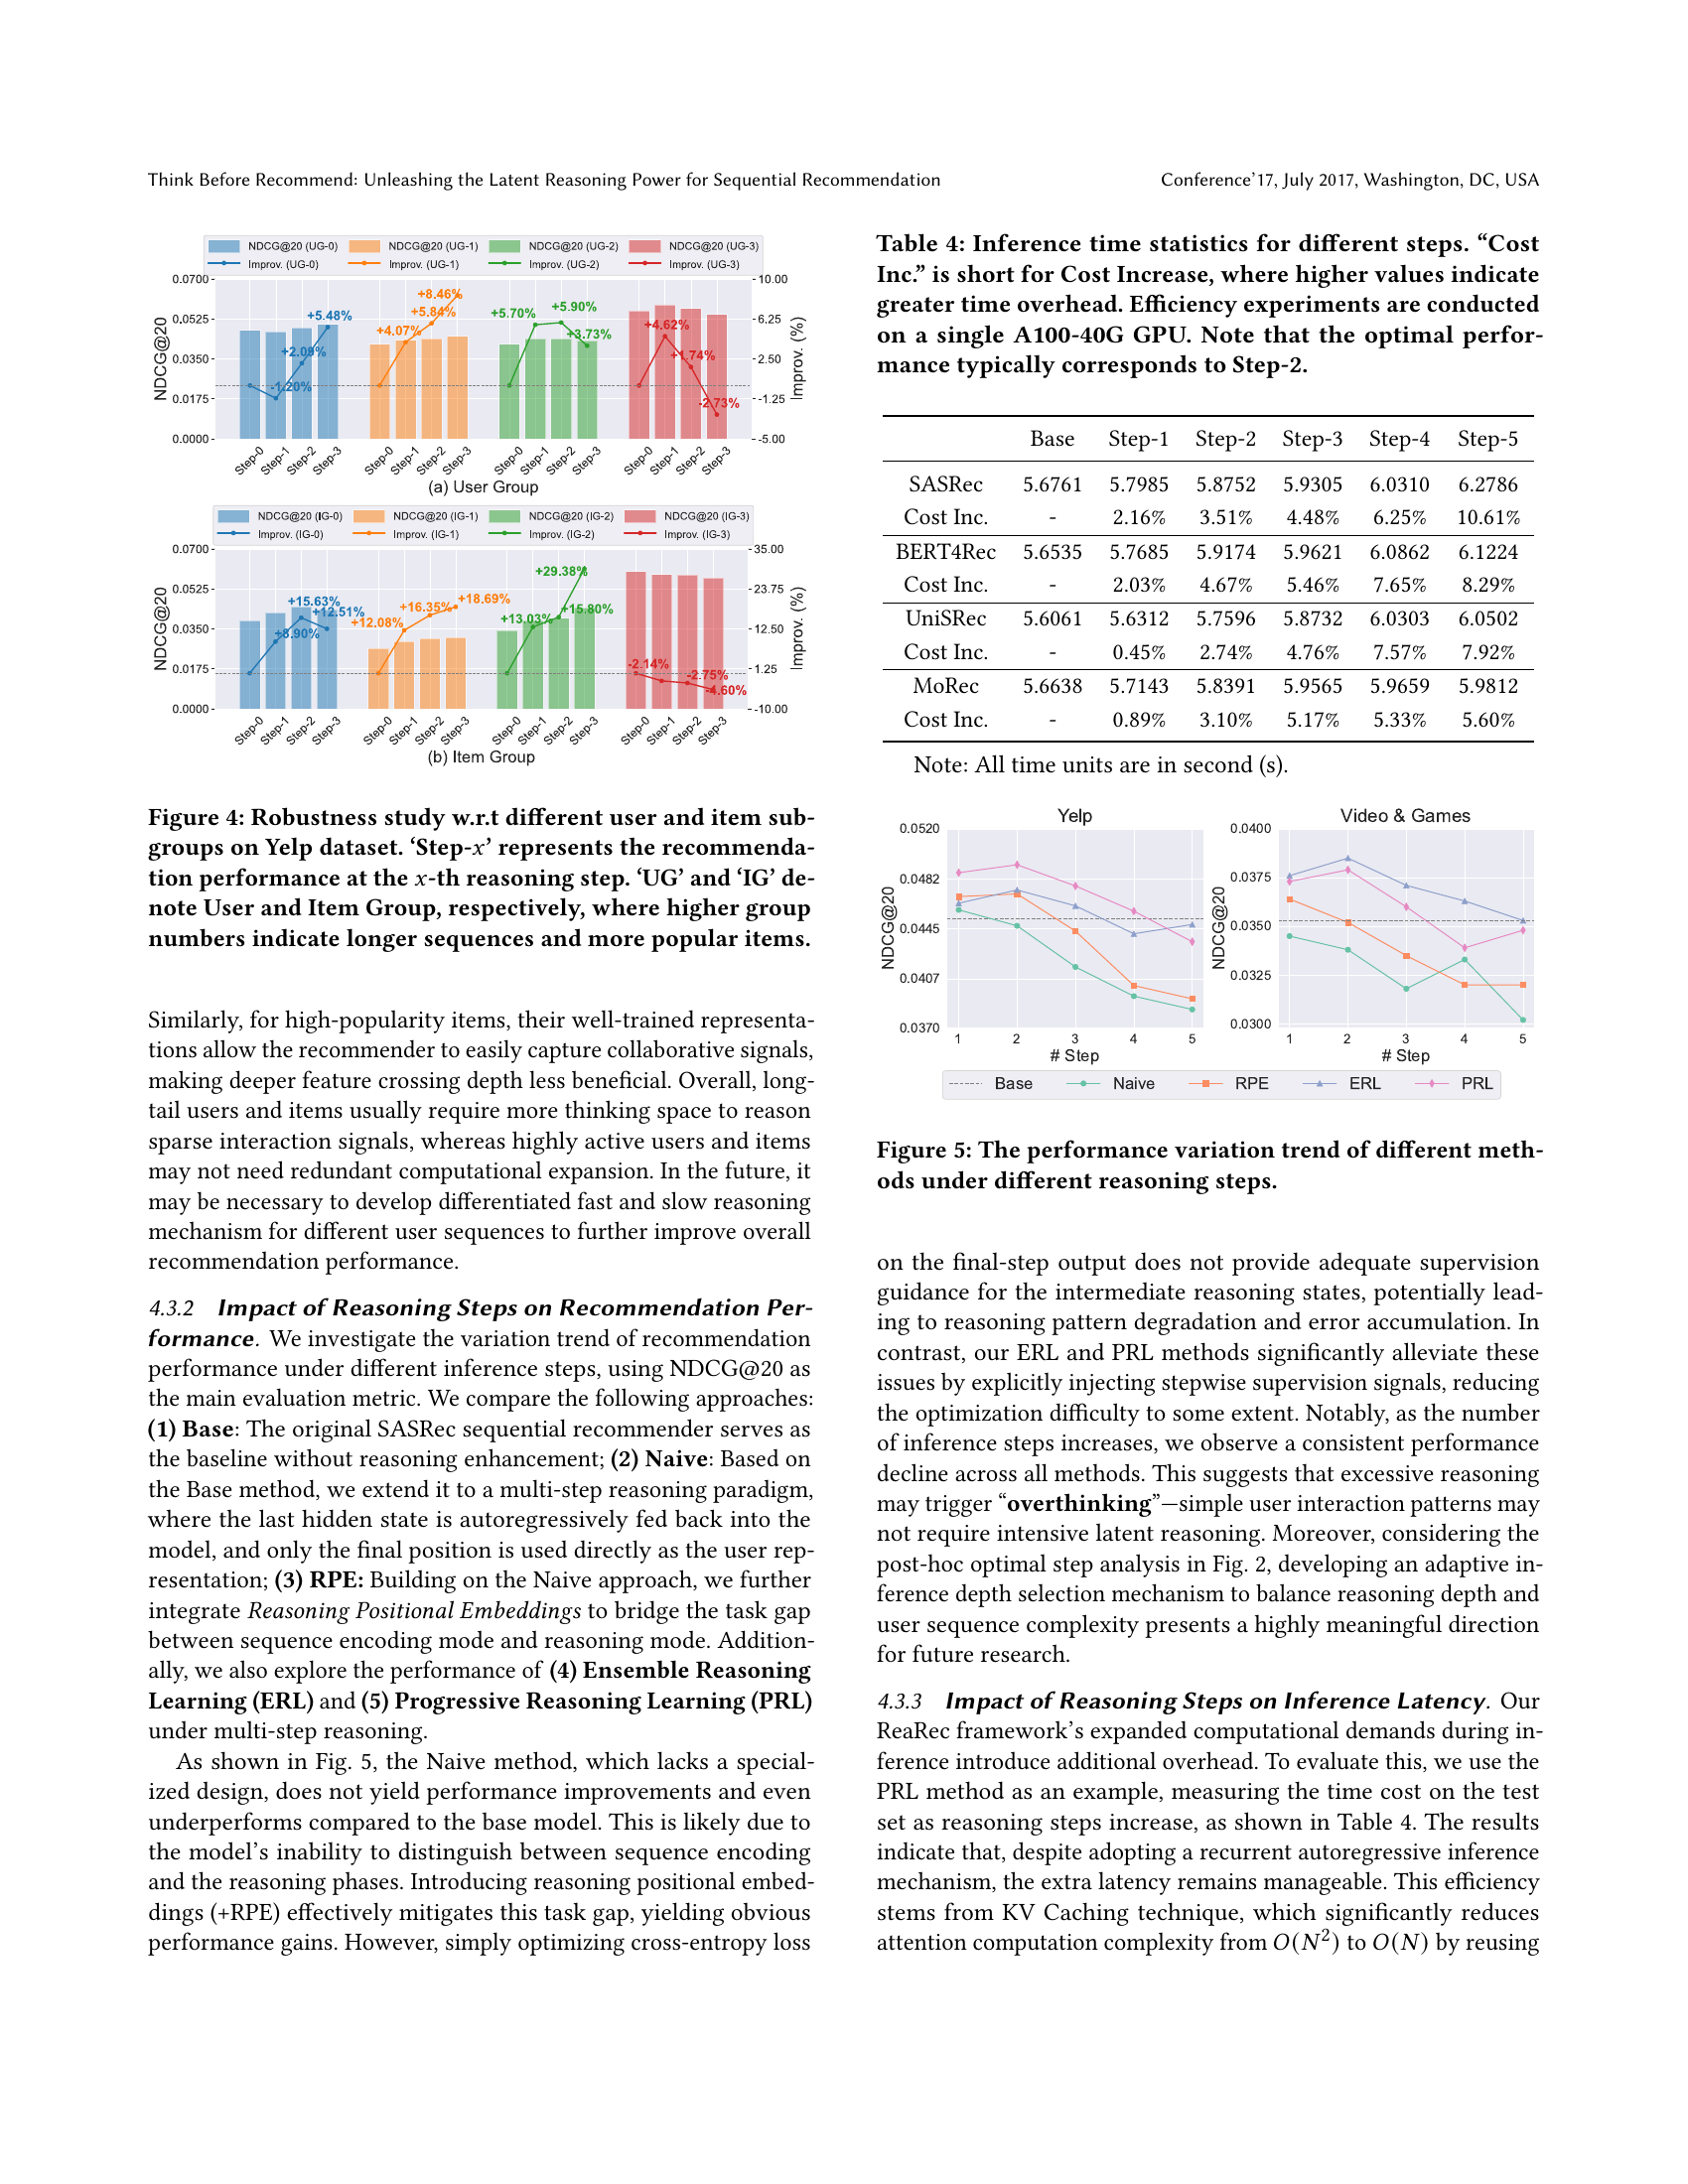
🔼 This figure presents a robustness analysis of the ReaRec model on the Yelp dataset, examining its performance across different user and item subgroups. Users are grouped into four categories (UG-0 to UG-3) based on the length of their interaction sequences, with higher numbers representing longer sequences. Similarly, items are categorized into four groups (IG-0 to IG-3) based on their popularity, with higher numbers indicating more popular items. The chart shows how the recommendation performance (measured by NDCG@20) changes as the number of reasoning steps (‘Step-x’) increases for each subgroup. This visualization allows assessment of ReaRec’s stability and effectiveness across diverse user and item characteristics.
read the caption
Figure 4. Robustness study w.r.t different user and item subgroups on Yelp dataset. ‘Step-x𝑥xitalic_x’ represents the recommendation performance at the x𝑥xitalic_x-th reasoning step. ‘UG’ and ‘IG’ denote User and Item Group, respectively, where higher group numbers indicate longer sequences and more popular items.

🔼 This figure compares the performance of several sequential recommendation methods across varying numbers of reasoning steps. It illustrates the impact of adding inference-time reasoning to standard sequential recommendation models, showing how performance changes as the model engages in more iterative reasoning. The different methods include a baseline without reasoning, a naive multi-step reasoning approach, a refined approach incorporating reasoning position embeddings, and methods using the proposed ensemble reasoning and progressive reasoning learning techniques. The performance metric used is NDCG@20, a measure of the ranking quality of top-20 recommendations.
read the caption
Figure 5. The performance variation trend of different methods under different reasoning steps.

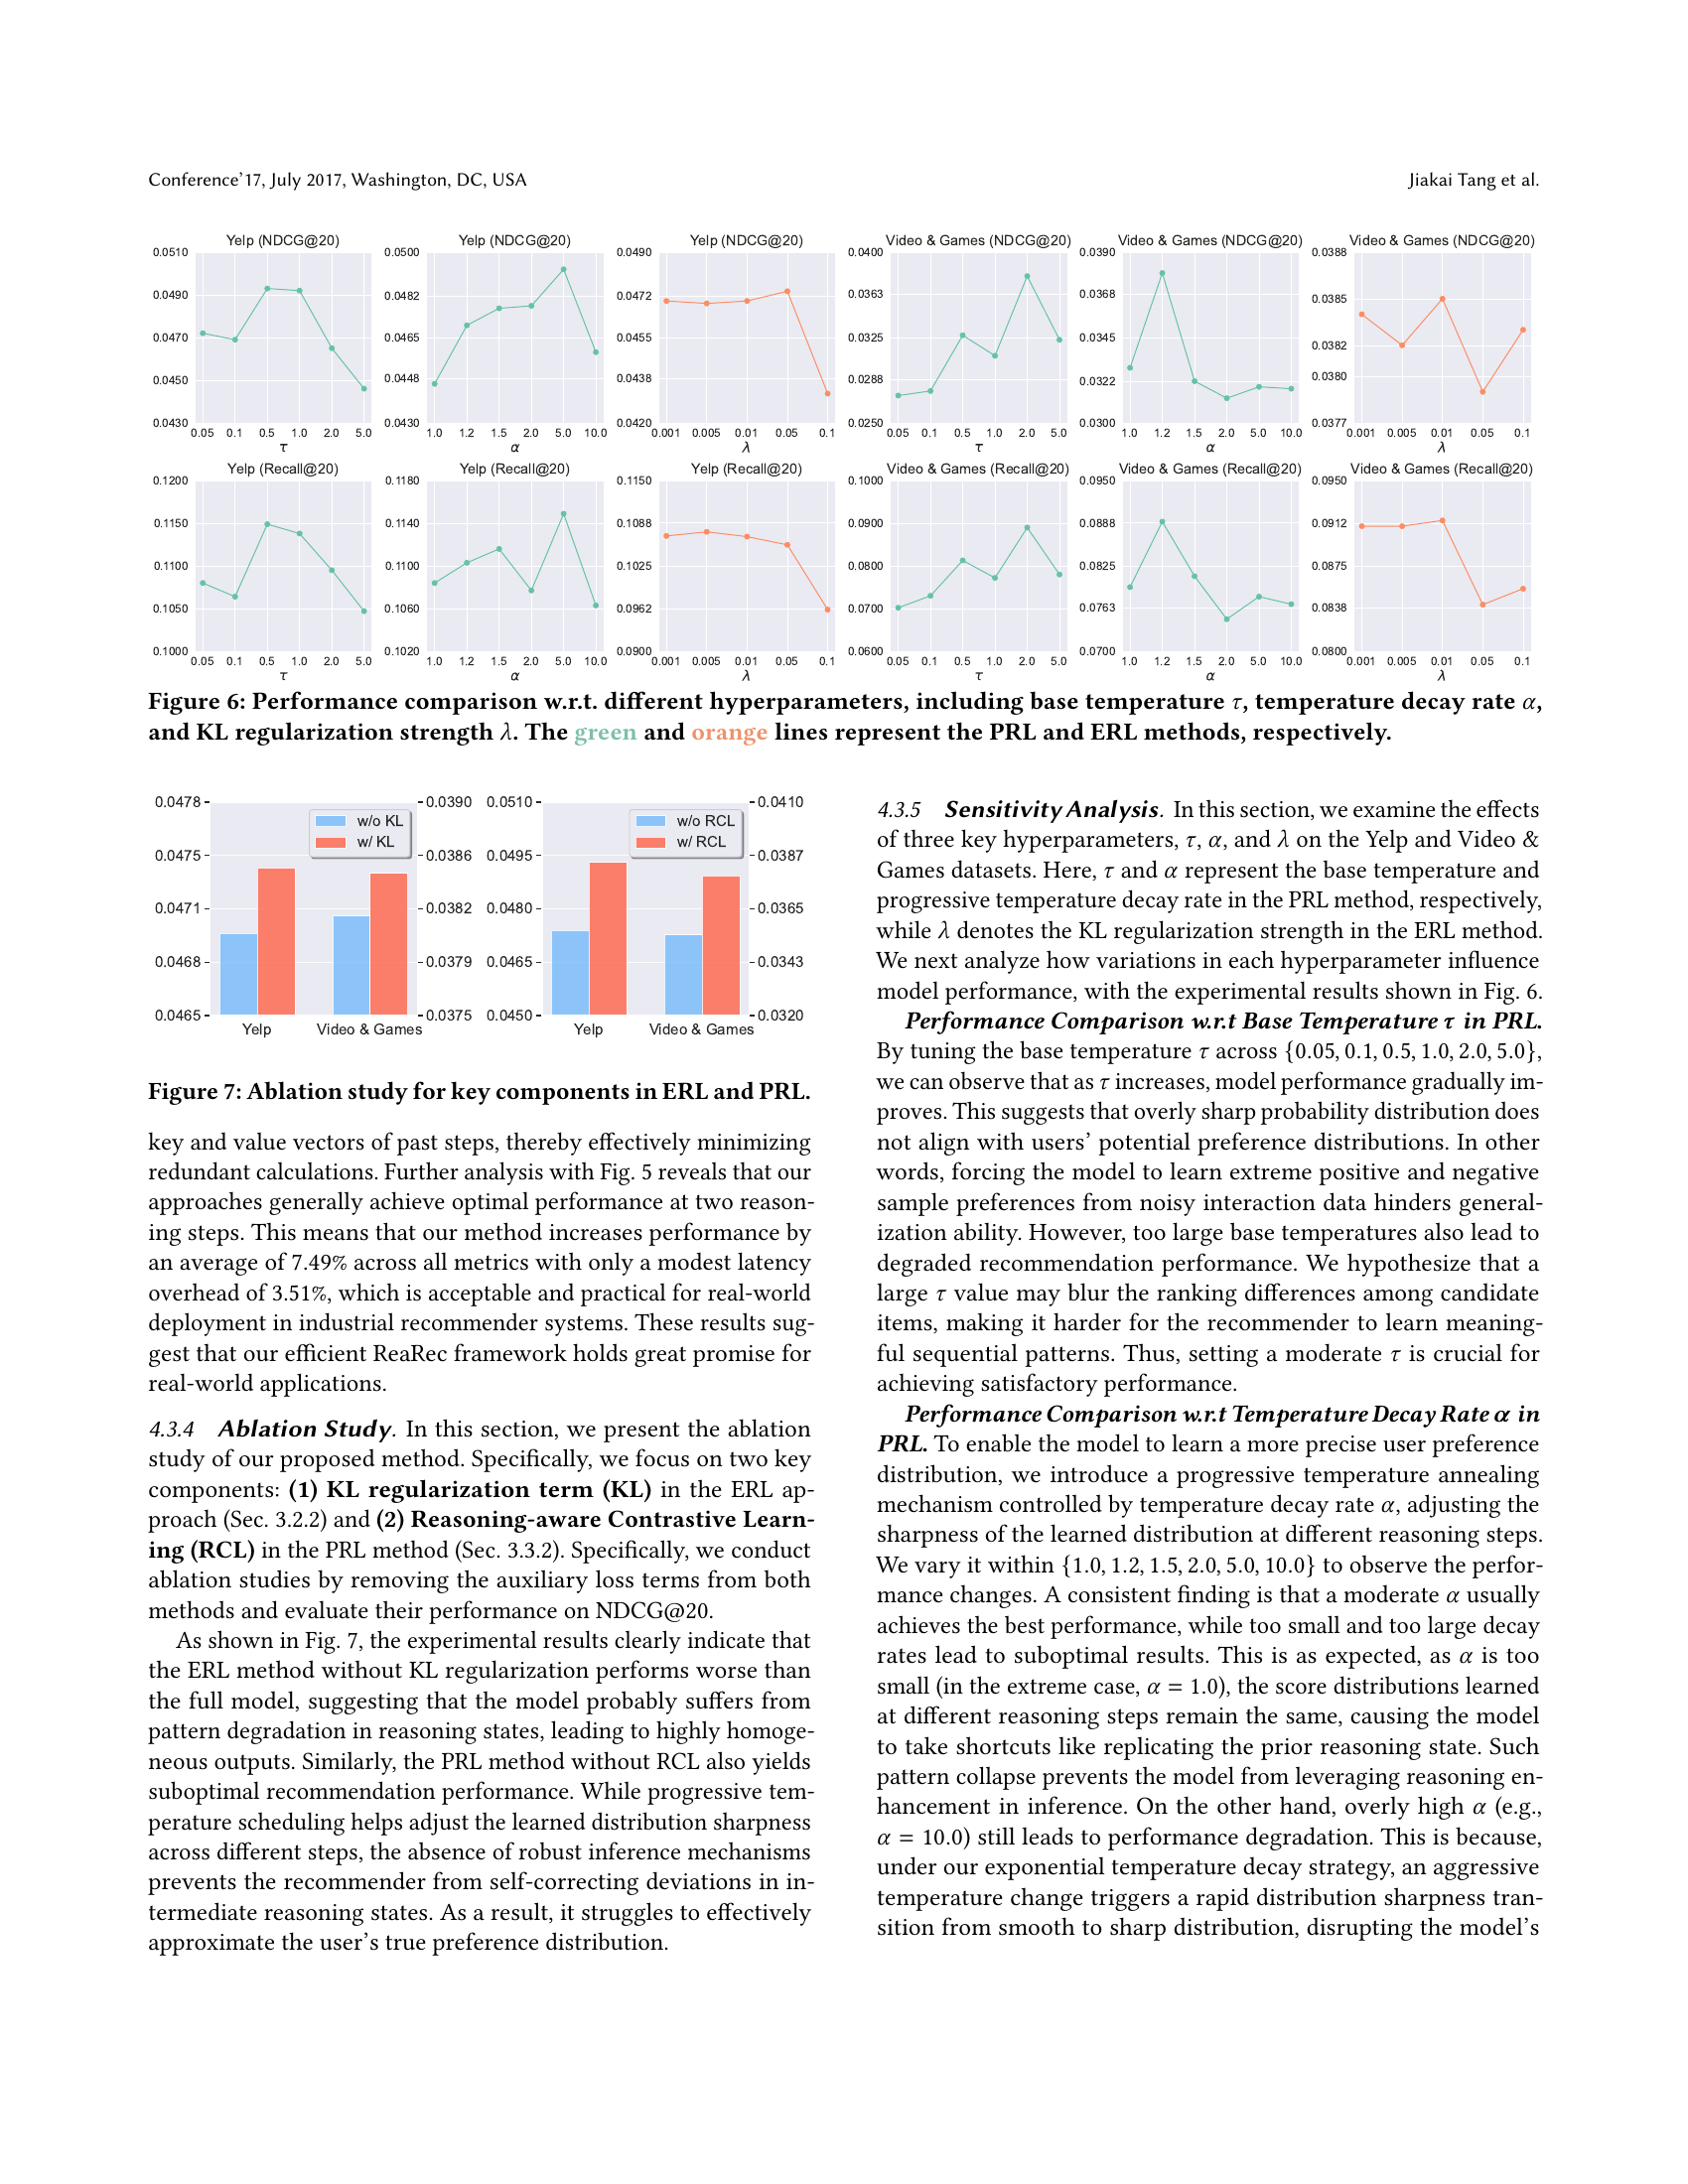
🔼 Figure 6 shows the effect of different hyperparameters on the performance of the PRL and ERL methods. It displays NDCG@20 and Recall@20 metrics for the Yelp and Video & Games datasets, varying the base temperature (τ), temperature decay rate (α), and KL regularization strength (λ). The plots illustrate how changes in these hyperparameters affect the models’ ability to capture user preferences and balance exploration and exploitation in the multi-step reasoning process. The green line represents results for the Progressive Reasoning Learning (PRL) method, while the orange line shows results for the Ensemble Reasoning Learning (ERL) method.
read the caption
Figure 6. Performance comparison w.r.t. different hyperparameters, including base temperature τ𝜏\tauitalic_τ, temperature decay rate α𝛼\alphaitalic_α, and KL regularization strength λ𝜆\lambdaitalic_λ. The green and orange lines represent the PRL and ERL methods, respectively.
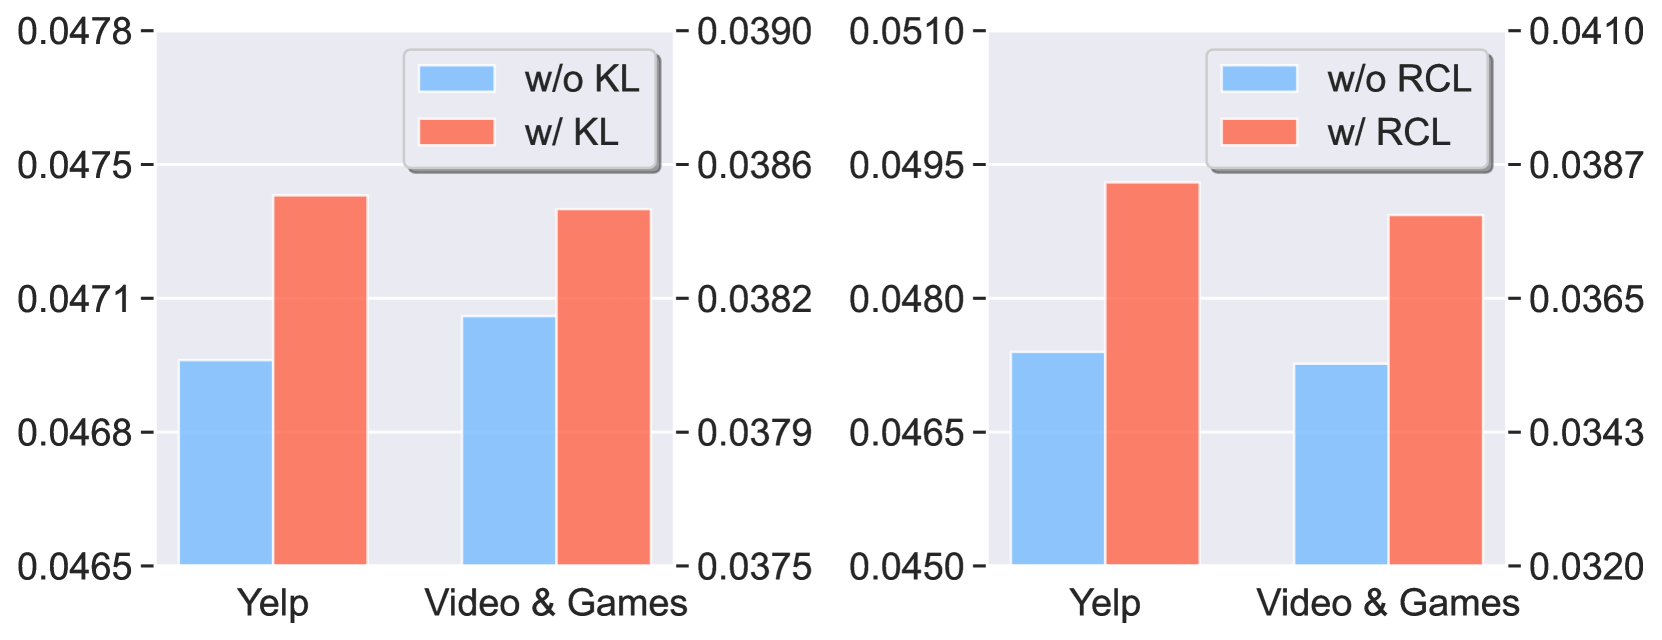
🔼 This ablation study analyzes the impact of removing key components from the Ensemble Reasoning Learning (ERL) and Progressive Reasoning Learning (PRL) methods on the model’s performance. Specifically, it investigates the effect of removing the KL regularization term from ERL and the Reasoning-aware Contrastive Learning (RCL) from PRL. The results demonstrate the importance of these components for achieving optimal performance, highlighting their role in preventing pattern degradation and enabling effective multi-step reasoning.
read the caption
Figure 7. Ablation study for key components in ERL and PRL.

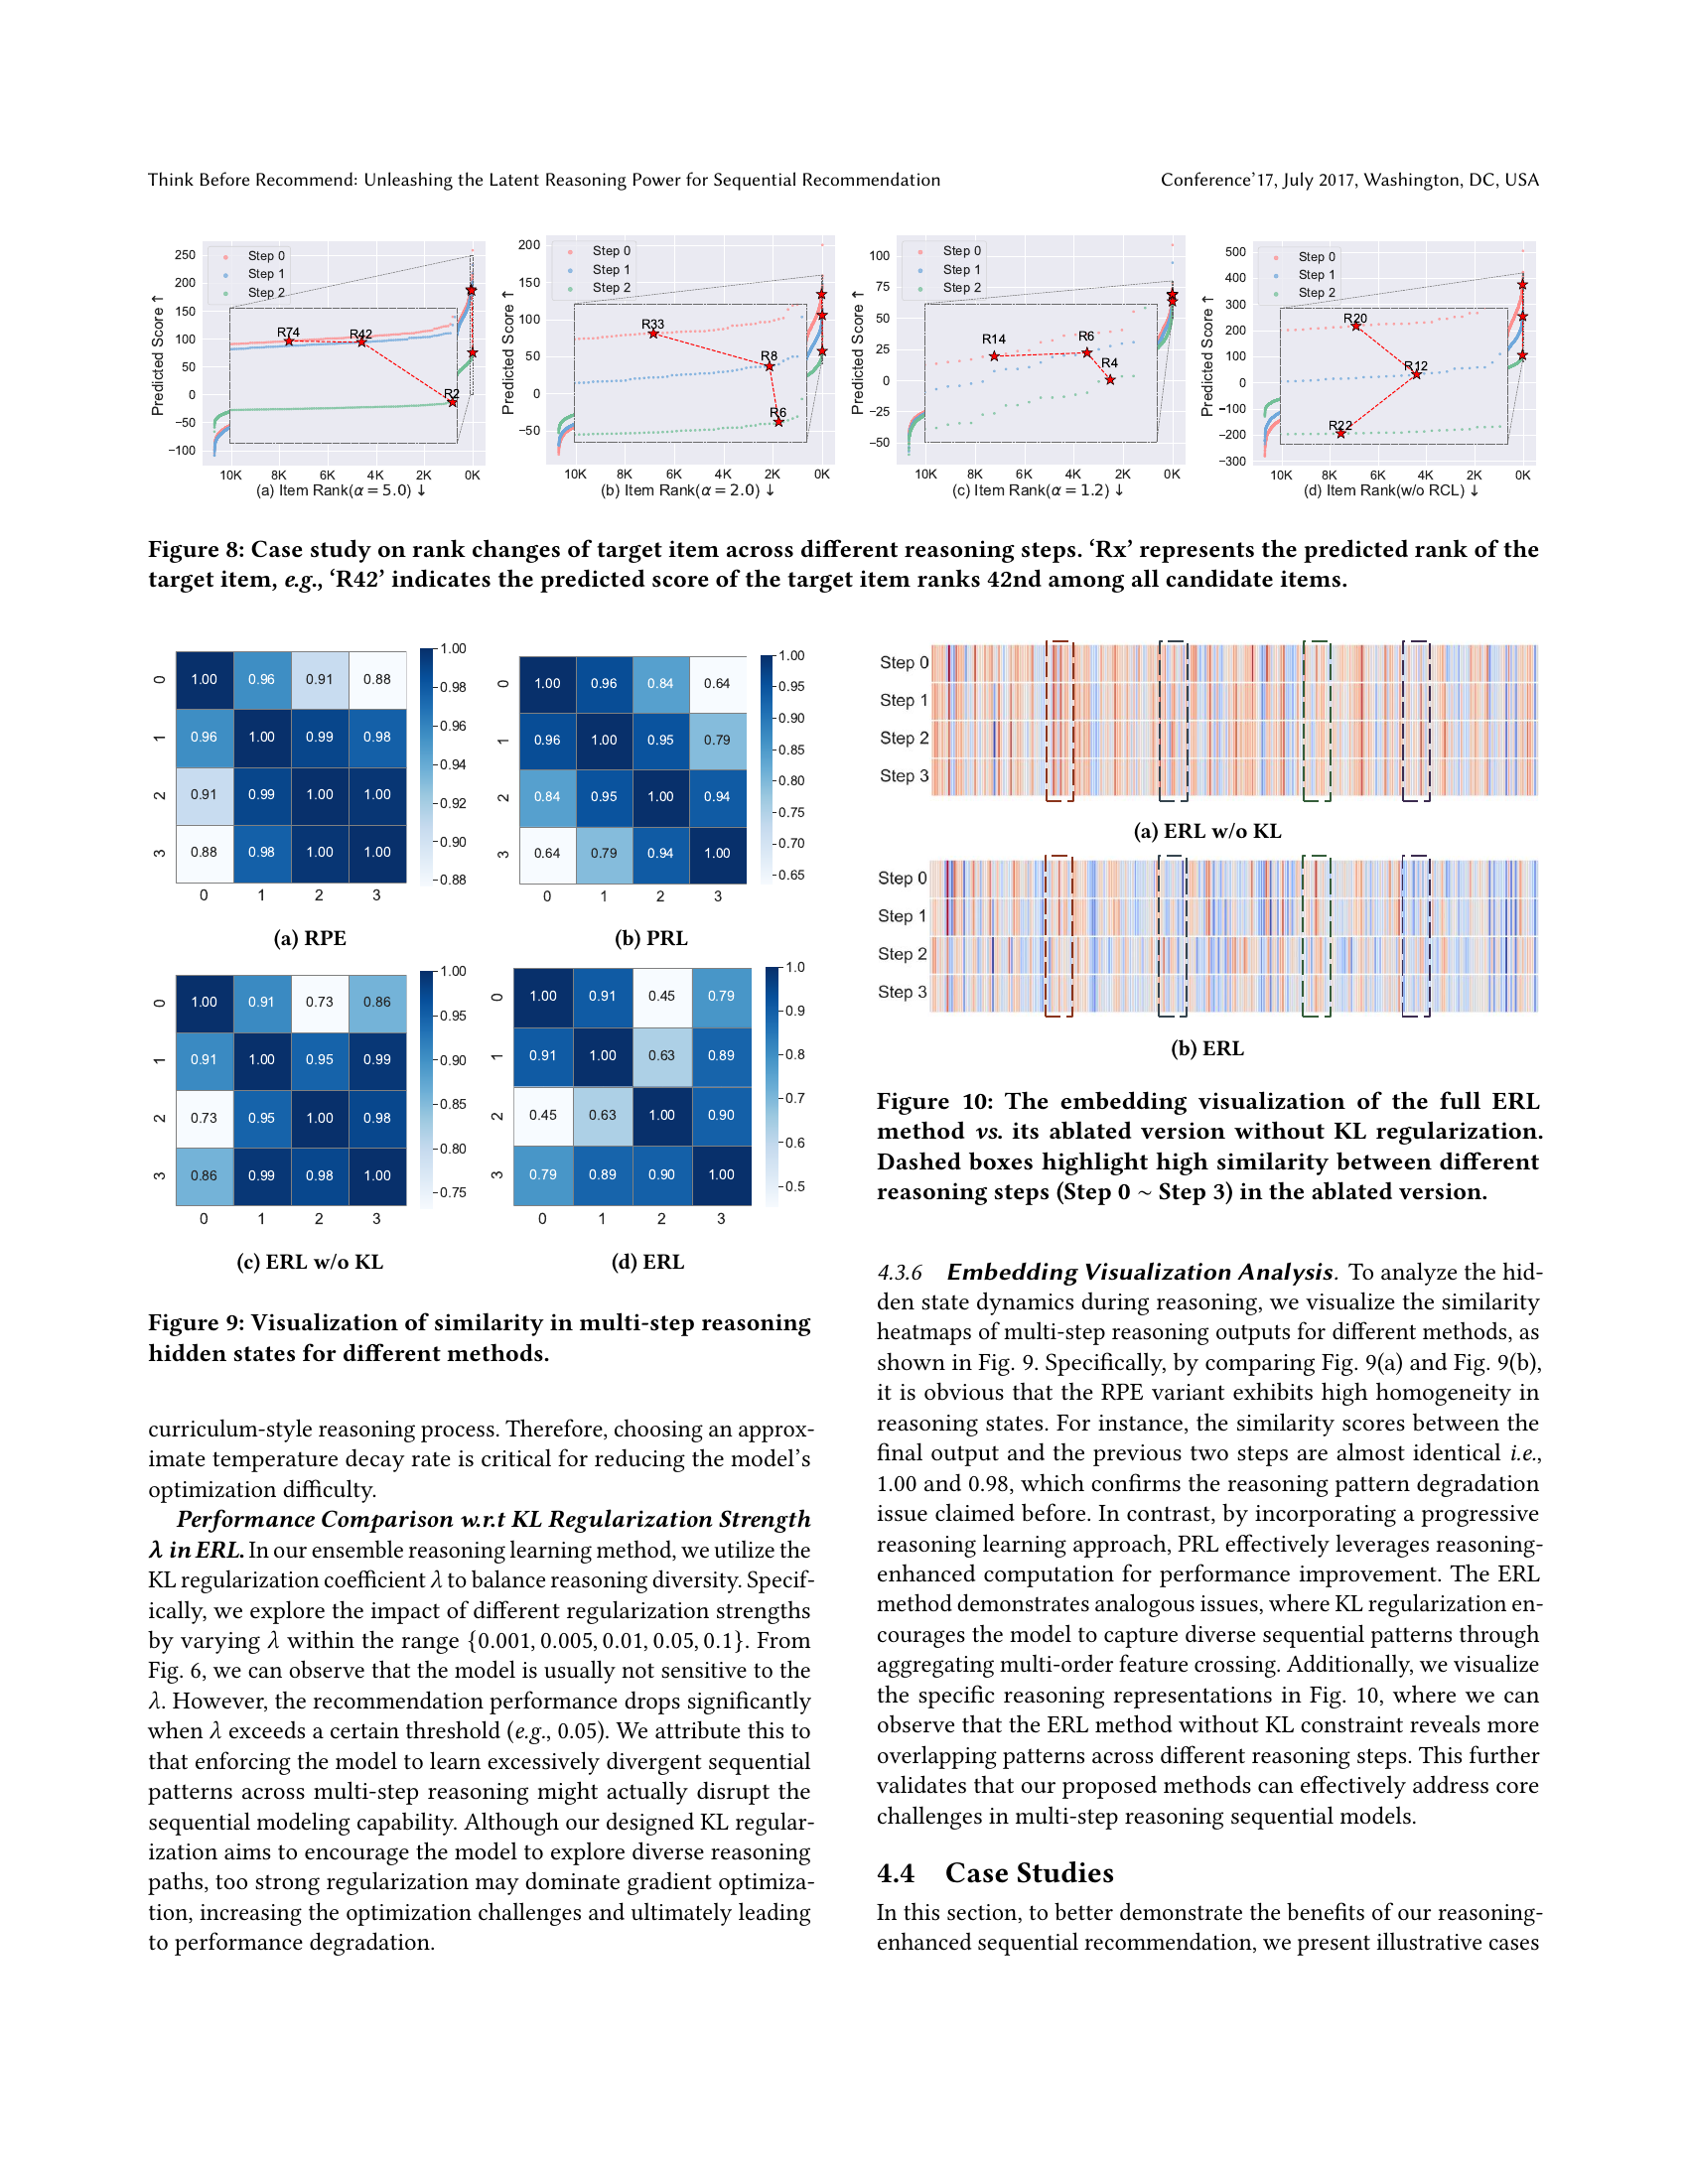
🔼 This figure presents a case study illustrating how the predicted rank of a target item changes across multiple reasoning steps within the ReaRec framework. Each subfigure shows the rank of the same target item (‘Rx’, where ‘x’ is the rank) across different reasoning steps (Step 0, Step 1, Step 2) under various conditions. These conditions include variations in the temperature decay rate (α) within the Progressive Reasoning Learning (PRL) method and an ablation study removing the Reasoning-aware Contrastive Learning (RCL) component from the PRL method. The changes in rank across steps visually demonstrate the impact of the multi-step reasoning process on refining the model’s recommendations.
read the caption
Figure 8. Case study on rank changes of target item across different reasoning steps. ‘Rx’ represents the predicted rank of the target item, e.g., ‘R42’ indicates the predicted score of the target item ranks 42nd among all candidate items.

🔼 This figure visualizes the similarity of hidden states across different reasoning steps (Step 0 to Step 3) for the ReaRec model with Reasoning Positional Embeddings (RPE). The heatmap shows the cosine similarity between the hidden states of each step. High similarity indicates that the hidden states are similar across different steps, which suggests the model’s reasoning process is well-guided and consistent. Lower similarity suggests the reasoning states are more diverse, indicating a richer reasoning process. This figure helps illustrate one aspect of how RPE affects the model’s reasoning process.
read the caption
(a) RPE

🔼 This figure visualizes the similarity between the reasoning hidden states across different steps (Step 0 to Step 3) for the Progressive Reasoning Learning (PRL) method. The heatmap shows the pairwise similarity scores, where darker colors represent higher similarity. This visualization helps to understand how the reasoning process evolves and whether the hidden states retain consistent information or diverge over multiple steps. This analysis is used to evaluate the effectiveness of the PRL’s multi-step reasoning strategy.
read the caption
(b) PRL

🔼 This figure visualizes the similarity between the multi-step reasoning hidden states for the ERL method without KL regularization. It’s a heatmap showing the cosine similarity between the hidden states at different reasoning steps (Step 0 to Step 3). High similarity indicates the model’s reasoning pattern may be degrading, potentially replicating previous reasoning outputs instead of generating diverse and informative representations.
read the caption
(c) ERL w/o KL

🔼 This figure visualizes the similarity between the hidden states of different reasoning steps (Step 0 to Step 3) for the Ensemble Reasoning Learning (ERL) method. It uses a heatmap to show the similarity scores between the hidden states. High similarity scores (closer to 1.00) indicate that the hidden states are similar, while lower scores (closer to 0.00) indicate more dissimilar hidden states. This visualization helps to understand the impact of KL regularization on the diversity of the reasoning process and whether the model is able to generate distinct representations at each step.
read the caption
(d) ERL

🔼 This figure visualizes the similarity between hidden states generated during multi-step reasoning across different methods. Each heatmap represents a method (ERL with and without KL regularization, PRL with and without RCL, and RPE), and each cell shows the cosine similarity between reasoning states of two different steps. Darker colors indicate higher similarity, revealing patterns in how the methods utilize information across reasoning steps. The figure aids in understanding the impact of each method’s design on the consistency and diversity of reasoning patterns.
read the caption
Figure 9. Visualization of similarity in multi-step reasoning hidden states for different methods.

🔼 This figure visualizes the similarity between hidden states across different reasoning steps when the KL regularization is not used in the Ensemble Reasoning Learning (ERL) method. Each cell represents the cosine similarity between hidden states of two steps. The darker the color, the higher the similarity. It shows that without KL regularization, the similarity between the hidden states across different steps is high, suggesting that the model is not effectively exploring diverse reasoning patterns and is likely replicating previous reasoning outputs.
read the caption
(a) ERL w/o KL

🔼 This figure visualizes the similarity of hidden states across multiple reasoning steps in the Ensemble Reasoning Learning (ERL) method. Each cell represents the similarity (cosine similarity) between the hidden states of two reasoning steps, allowing for an understanding of how these states evolve and relate to each other. The visualization helps to illustrate the impact of the KL regularization in ERL, showing how it promotes diversity in reasoning representations across different steps.
read the caption
(b) ERL

🔼 This figure visualizes the embedding similarity between different reasoning steps using heatmaps. The left shows the results of the full ERL method, while the right shows the results of ERL without KL regularization. Dashed boxes highlight highly similar reasoning steps (Step 0 to Step 3) in the ablated version. This visualization demonstrates that the KL regularization in the ERL method helps to enhance diversity and prevent the model from repeating similar reasoning patterns across multiple steps.
read the caption
Figure 10. The embedding visualization of the full ERL method vs. its ablated version without KL regularization. Dashed boxes highlight high similarity between different reasoning steps (Step 0 ∼similar-to\sim∼ Step 3) in the ablated version.

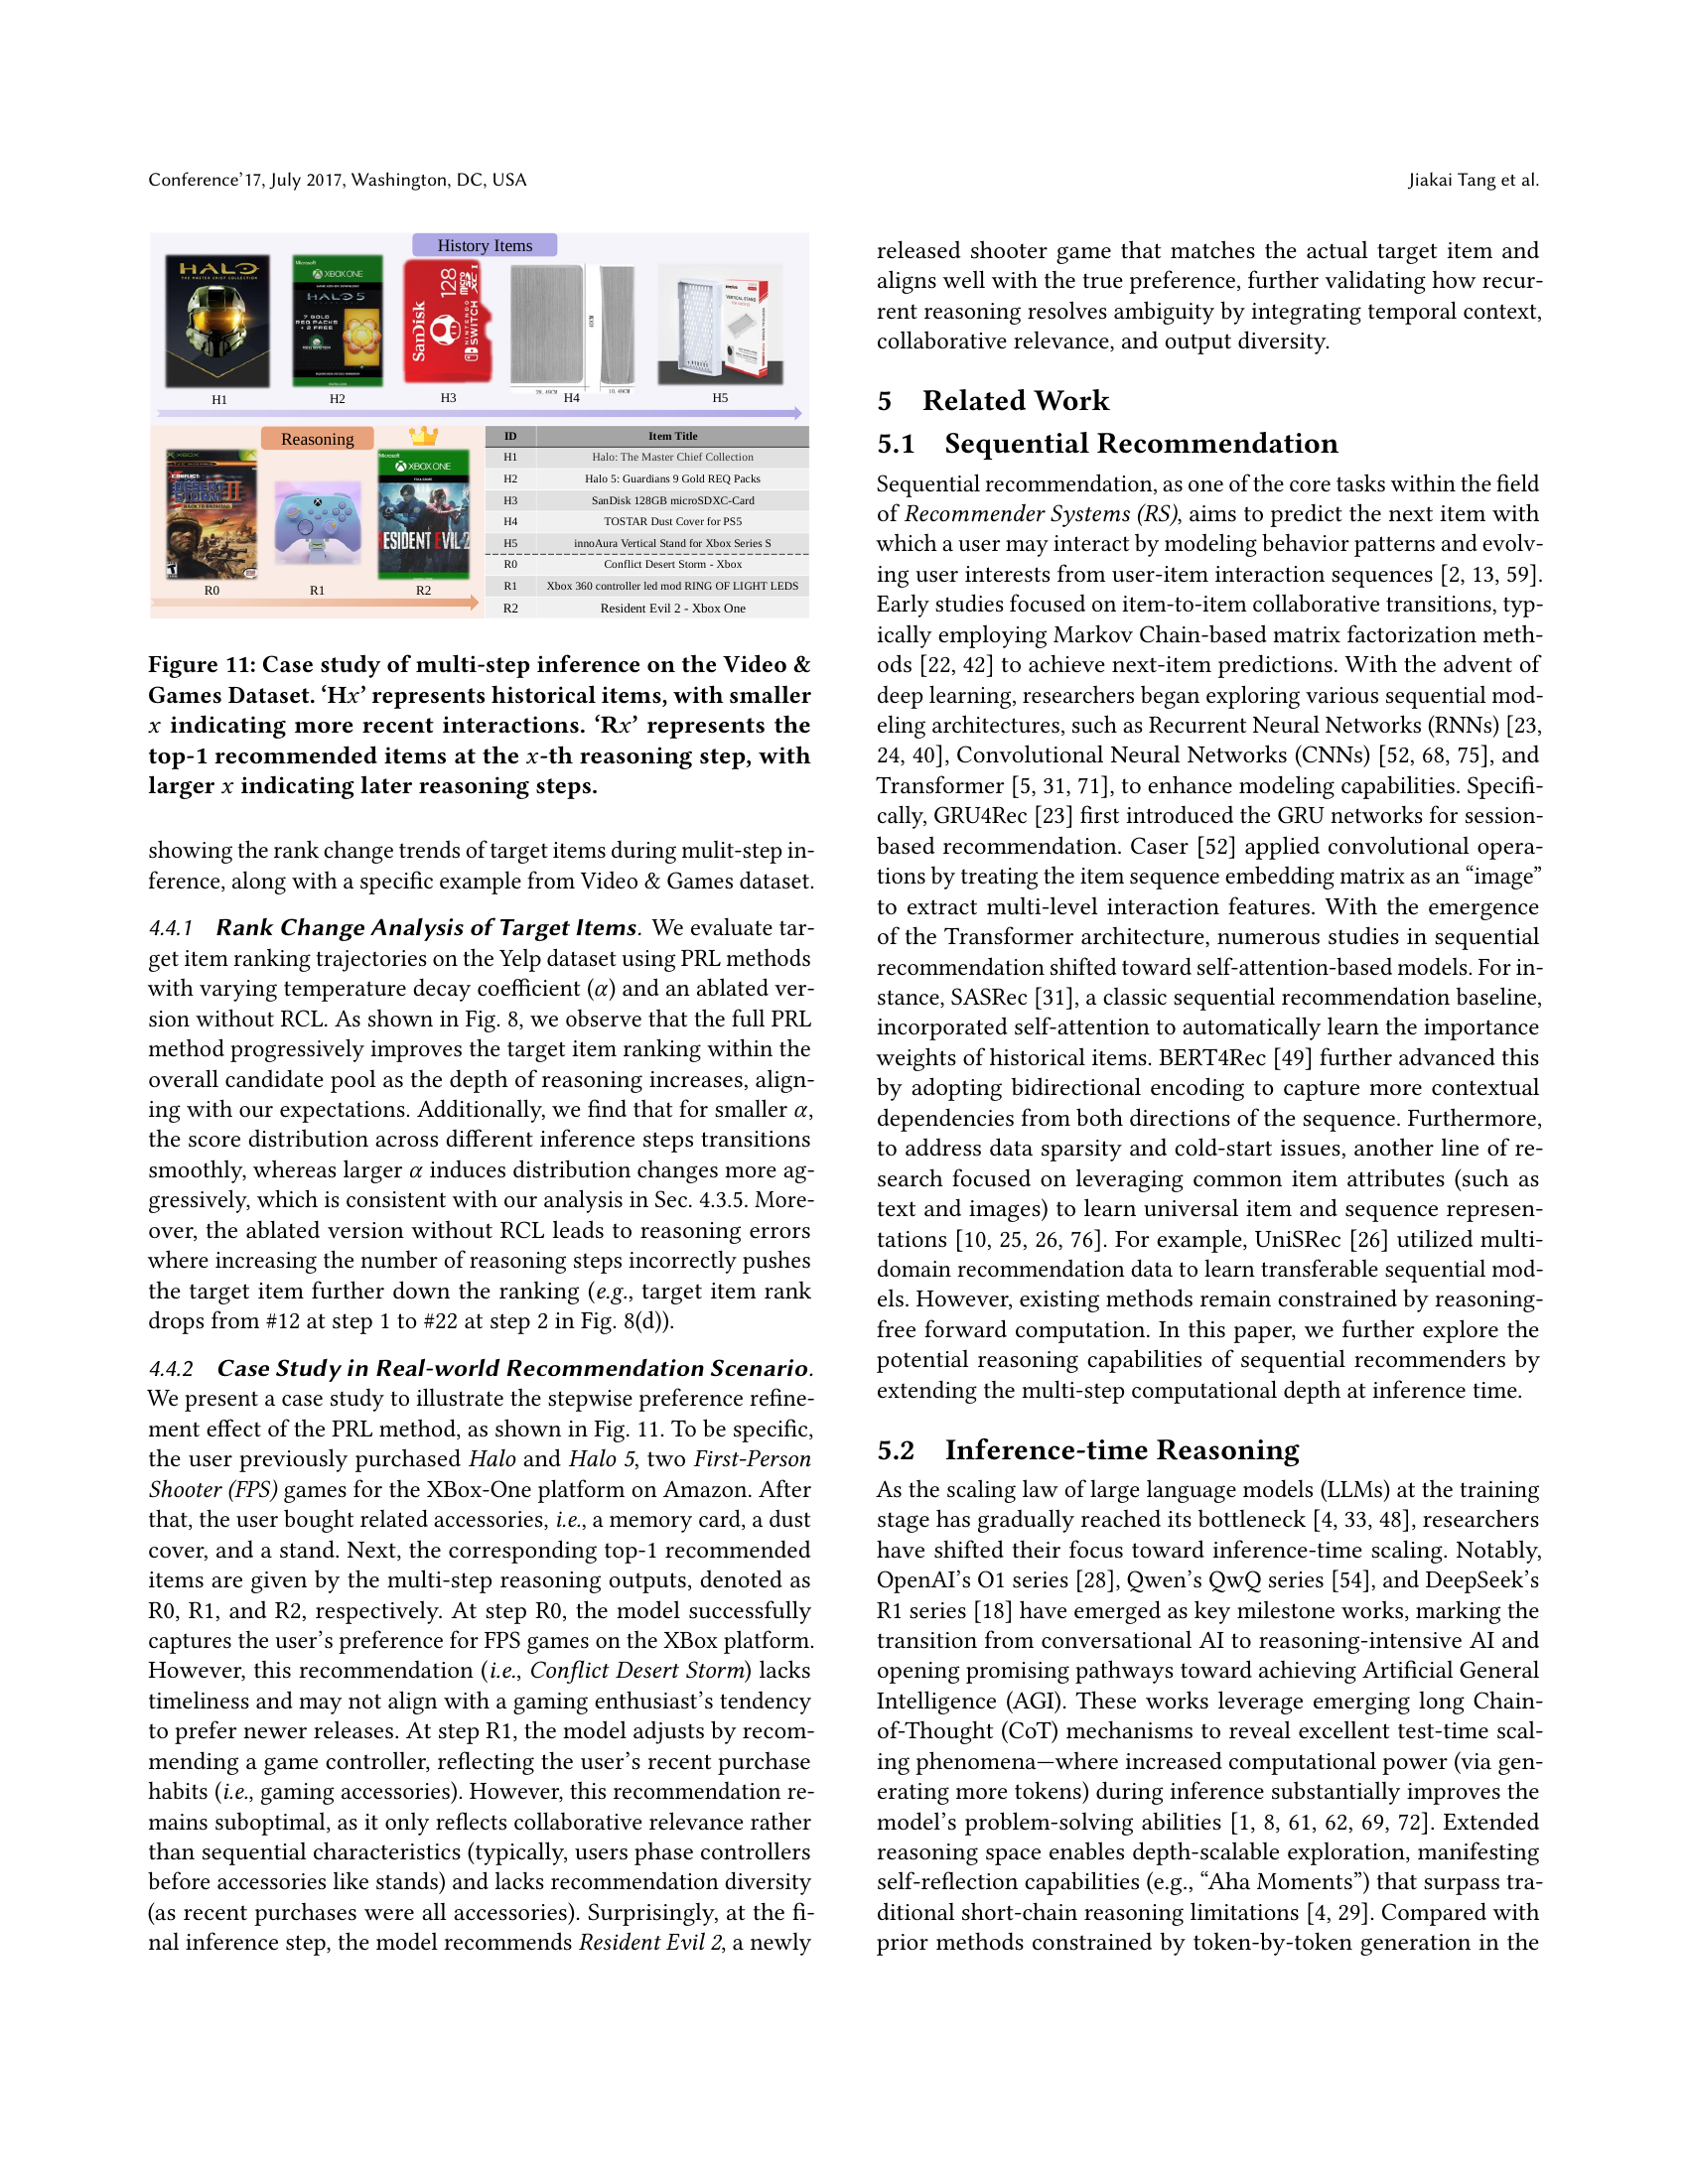
🔼 This figure presents a case study illustrating the multi-step reasoning process of the ReaRec model on a user’s interaction sequence from the Video & Games dataset. The ‘Hx’ items represent the user’s historical interactions, ordered chronologically with smaller ‘x’ values indicating more recent interactions. The model then iteratively reasons through the sequence, generating a top-1 recommendation at each reasoning step, represented by ‘Rx’. As ‘x’ increases (later reasoning steps), the recommendations evolve, showing how the model refines its understanding of user preferences and context over multiple reasoning steps. The example shows the model’s recommendation shifting from a game thematically similar to the user’s history (but possibly older) toward more current and relevant titles within the same genre as the reasoning progresses. This visual illustrates the model’s ability to improve recommendations through iterative, multi-step reasoning.
read the caption
Figure 11. Case study of multi-step inference on the Video & Games Dataset. ‘Hx𝑥xitalic_x’ represents historical items, with smaller x𝑥xitalic_x indicating more recent interactions. ‘Rx𝑥xitalic_x’ represents the top-1 recommended items at the x𝑥xitalic_x-th reasoning step, with larger x𝑥xitalic_x indicating later reasoning steps.
More on tables
| Dataset | Method | SASRec | BERT4Rec | |||||||||
| N@10 | N@20 | R@10 | R@20 | Avg. | N@10 | N@20 | R@10 | R@20 | Avg. | |||
| Yelp | Base | 0.0347 | 0.0452 | 0.0626 | 0.1047 | - | 0.0364 | 0.046 | 0.0653 | 0.1038 | - | |
| +ERL (Improv.) | 0.0383 (10.37%) | 0.0474 (4.87%) | 0.0691 (10.38%) | 0.1056 (0.86%) | 6.62% | 0.0371 (1.92%) | 0.0476 (3.48%) | 0.0661 (1.23%) | 0.1077 (3.76%) | 2.60% | ||
| +PRL (Improv.) | 0.0388 (11.82%) | 0.0493 (9.07%) | 0.073 (16.61%) | 0.1149 (9.74%) | 11.81% | 0.0377 (3.57%) | 0.0487 (5.87%) | 0.0708 (8.42%) | 0.1149 (10.69%) | 7.14% | ||
| Video & Games | Base | 0.0284 | 0.0353 | 0.0542 | 0.0816 | - | 0.0289 | 0.0355 | 0.0548 | 0.0810 | - | |
| +ERL (Improv.) | 0.0301 (5.99%) | 0.0385 (9.07%) | 0.0581 (7.20%) | 0.0915 (12.13%) | 8.59% | 0.0311 (7.61%) | 0.0375 (5.63%) | 0.0578 (5.47%) | 0.0832 (2.72%) | 5.36% | ||
| +PRL (Improv.) | 0.0299 (5.28%) | 0.0379 (7.37%) | 0.0572 (5.54%) | 0.0890 (9.07%) | 6.81% | 0.0306 (5.88%) | 0.0380 (7.04%) | 0.0584 (6.57%) | 0.0879 (8.52%) | 7.00% | ||
| Software | Base | 0.0696 | 0.0895 | 0.1468 | 0.2264 | - | 0.0710 | 0.0893 | 0.1530 | 0.2258 | - | |
| +ERL (Improv.) | 0.0743 (6.75%) | 0.0935 (4.47%) | 0.1456 (0.82%) | 0.2224 (1.77%) | 2.16% | 0.0769 (8.31%) | 0.0964 (7.95%) | 0.1554 (1.57%) | 0.2328 (3.10%) | 5.23% | ||
| +PRL (Improv.) | 0.0739 (6.18%) | 0.0949 (6.03%) | 0.1488 (1.36%) | 0.2324 (2.65%) | 4.06% | 0.0762 (7.32%) | 0.0976 (9.29%) | 0.1500 (1.96%) | 0.2350 (4.07%) | 4.68% | ||
| CDs & Vinyl | Base | 0.0148 | 0.0174 | 0.0317 | 0.0419 | - | 0.0149 | 0.0185 | 0.0326 | 0.0468 | - | |
| +ERL (Improv.) | 0.0182 (22.97%) | 0.0212 (21.84%) | 0.0363 (14.51%) | 0.0482 (15.04%) | 18.59% | 0.0165 (10.74%) | 0.0208 (12.43%) | 0.0354 (8.59%) | 0.0524 (11.97%) | 10.93% | ||
| +PRL (Improv.) | 0.0155 (4.73%) | 0.0195 (12.07%) | 0.0315 (0.63%) | 0.0470 (12.17%) | 7.08% | 0.0162 (8.72%) | 0.0202 (9.19%) | 0.0334 (2.45%) | 0.0496 (5.98%) | 6.59% | ||
| Baby & Products | Base | 0.0112 | 0.0157 | 0.0260 | 0.0437 | - | 0.0109 | 0.0154 | 0.0257 | 0.0439 | - | |
| +ERL (Improv.) | 0.0116 (3.57%) | 0.0164 (4.46%) | 0.0228 (12.31%) | 0.0418 (4.35%) | 2.16% | 0.0148 (35.78%) | 0.0195 (26.62%) | 0.0293 (9.57%) | 0.0481 (14.01%) | 21.49% | ||
| +PRL (Improv.) | 0.0135 (20.54%) | 0.0178 (13.38%) | 0.0281 (8.08%) | 0.0451 (3.20%) | 11.30% | 0.0140 (28.44%) | 0.0185 (20.13%) | 0.0291 (6.15%) | 0.0466 (13.23%) | 16.99% | ||
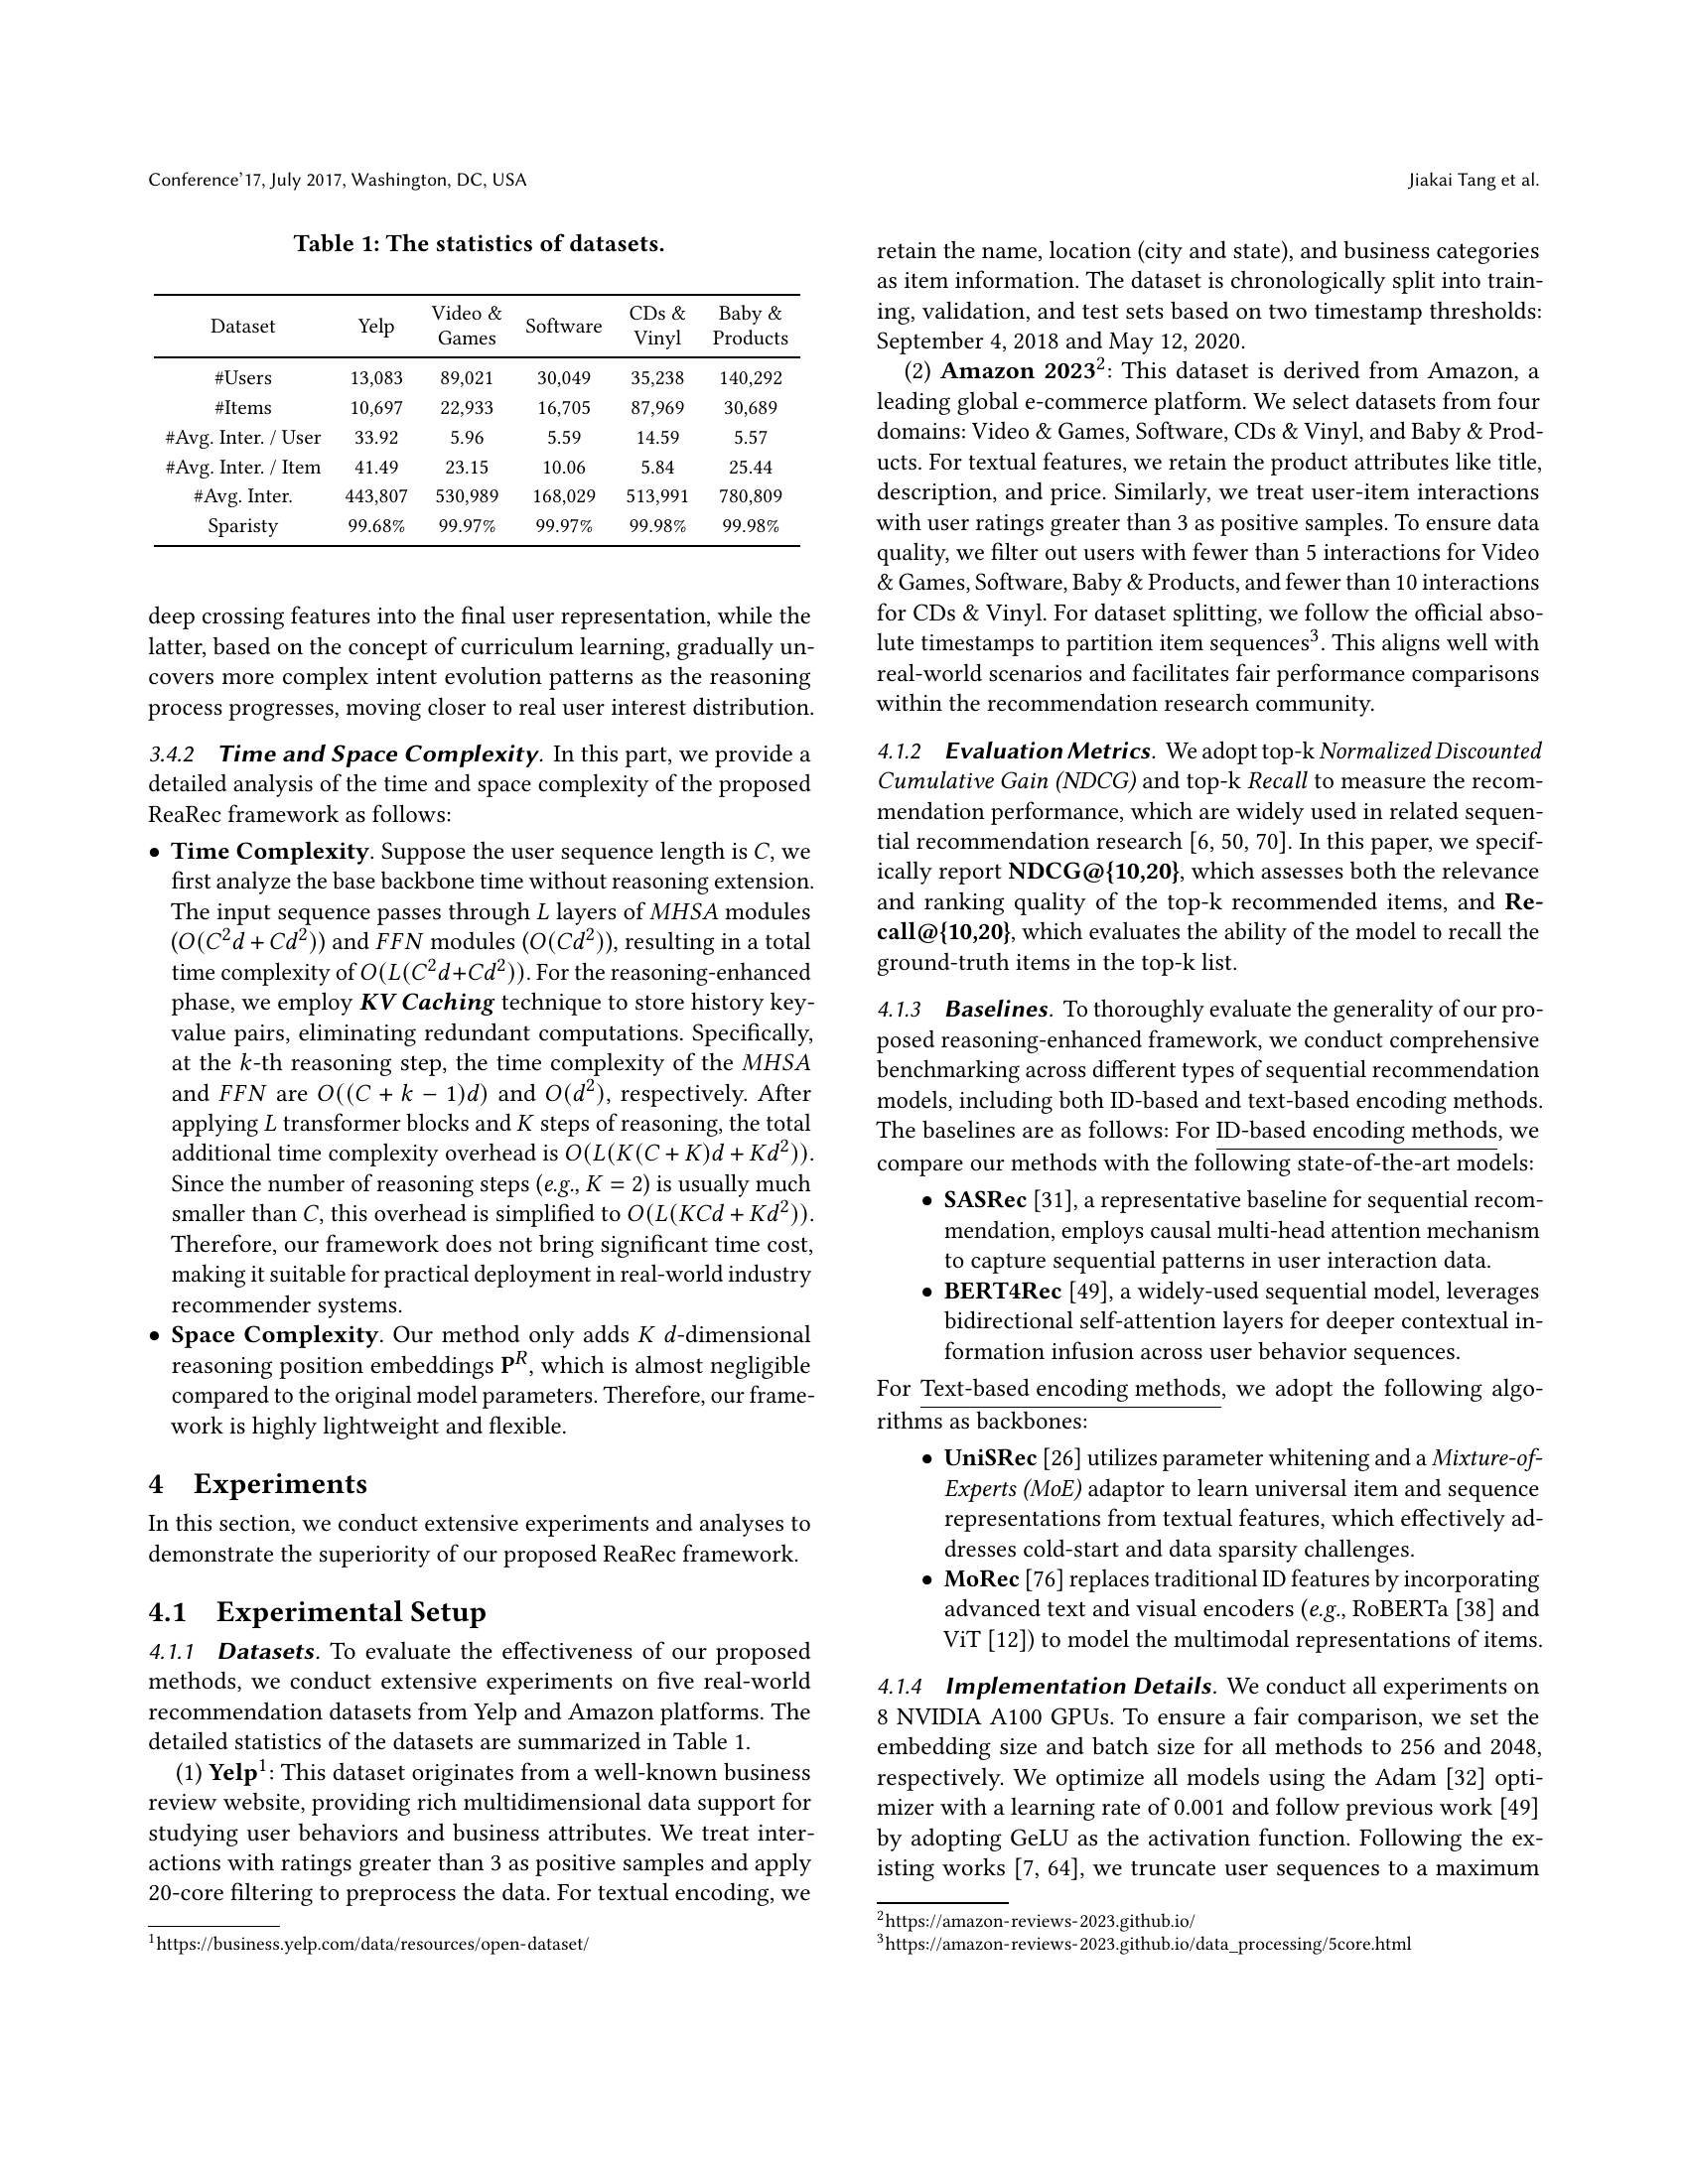
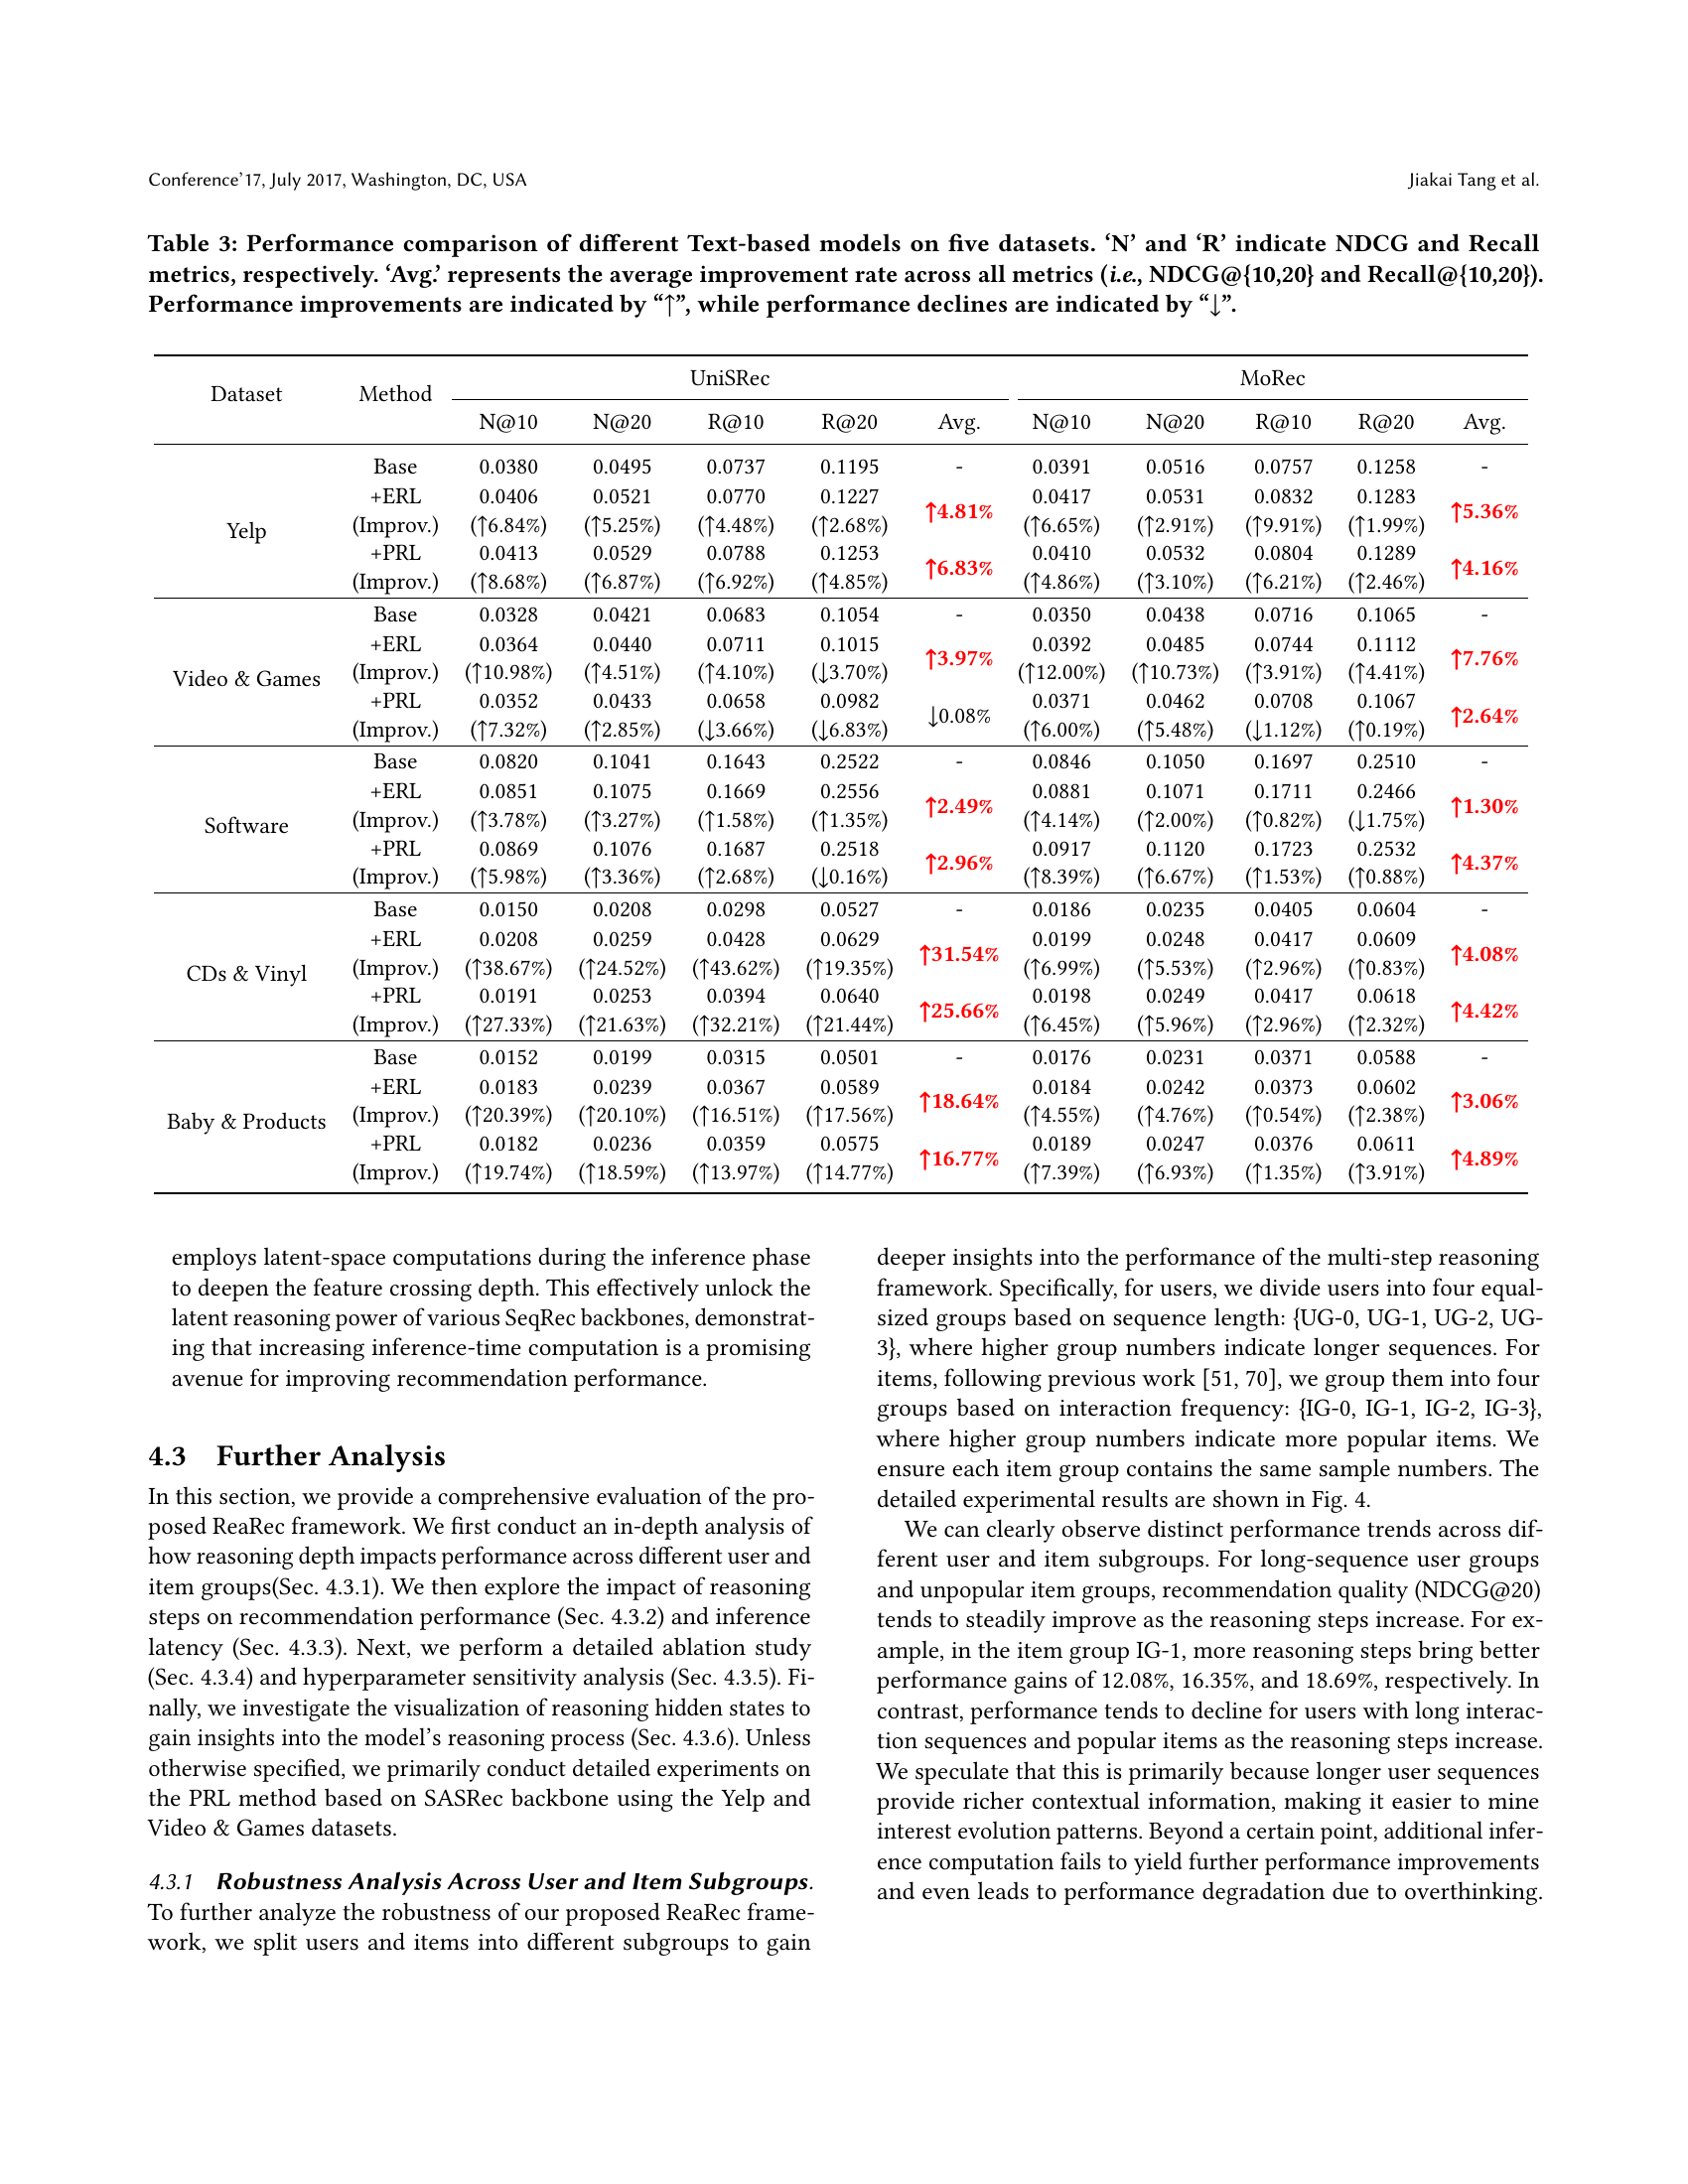
🔼 Table 2 presents a comprehensive comparison of the performance of various ID-based sequential recommendation models across five different datasets. The models are evaluated using two key metrics: Normalized Discounted Cumulative Gain (NDCG) at cutoff ranks of 10 and 20 (NDCG@10, NDCG@20), and Recall at cutoff ranks of 10 and 20 (Recall@10, Recall@20). The table shows the baseline performance of each model and then the improvement achieved by incorporating two proposed reasoning methods, Ensemble Reasoning Learning (ERL) and Progressive Reasoning Learning (PRL). The ‘Avg.’ column displays the average improvement or decline across all four metrics for each model and reasoning approach. Positive values indicate improvement, while negative values indicate a decrease in performance compared to the baseline.
read the caption
Table 2. Performance comparison of different ID-based models on five datasets. ‘N’ and ‘R’ indicate NDCG and Recall metrics, respectively. ‘Avg.’ represents the average improvement rate across all metrics (i.e., NDCG@{10,20} and Recall@{10,20}). Performance improvements are indicated by “↑↑\uparrow↑”, while performance declines are indicated by “↓↓\downarrow↓”.
| Dataset | Method | UniSRec | MoRec | |||||||||
| N@10 | N@20 | R@10 | R@20 | Avg. | N@10 | N@20 | R@10 | R@20 | Avg. | |||
| Yelp | Base | 0.0380 | 0.0495 | 0.0737 | 0.1195 | - | 0.0391 | 0.0516 | 0.0757 | 0.1258 | - | |
| +ERL (Improv.) | 0.0406 (6.84%) | 0.0521 (5.25%) | 0.0770 (4.48%) | 0.1227 (2.68%) | 4.81% | 0.0417 (6.65%) | 0.0531 (2.91%) | 0.0832 (9.91%) | 0.1283 (1.99%) | 5.36% | ||
| +PRL (Improv.) | 0.0413 (8.68%) | 0.0529 (6.87%) | 0.0788 (6.92%) | 0.1253 (4.85%) | 6.83% | 0.0410 (4.86%) | 0.0532 (3.10%) | 0.0804 (6.21%) | 0.1289 (2.46%) | 4.16% | ||
| Video & Games | Base | 0.0328 | 0.0421 | 0.0683 | 0.1054 | - | 0.0350 | 0.0438 | 0.0716 | 0.1065 | - | |
| +ERL (Improv.) | 0.0364 (10.98%) | 0.0440 (4.51%) | 0.0711 (4.10%) | 0.1015 (3.70%) | 3.97% | 0.0392 (12.00%) | 0.0485 (10.73%) | 0.0744 (3.91%) | 0.1112 (4.41%) | 7.76% | ||
| +PRL (Improv.) | 0.0352 (7.32%) | 0.0433 (2.85%) | 0.0658 (3.66%) | 0.0982 (6.83%) | 0.08% | 0.0371 (6.00%) | 0.0462 (5.48%) | 0.0708 (1.12%) | 0.1067 (0.19%) | 2.64% | ||
| Software | Base | 0.0820 | 0.1041 | 0.1643 | 0.2522 | - | 0.0846 | 0.1050 | 0.1697 | 0.2510 | - | |
| +ERL (Improv.) | 0.0851 (3.78%) | 0.1075 (3.27%) | 0.1669 (1.58%) | 0.2556 (1.35%) | 2.49% | 0.0881 (4.14%) | 0.1071 (2.00%) | 0.1711 (0.82%) | 0.2466 (1.75%) | 1.30% | ||
| +PRL (Improv.) | 0.0869 (5.98%) | 0.1076 (3.36%) | 0.1687 (2.68%) | 0.2518 (0.16%) | 2.96% | 0.0917 (8.39%) | 0.1120 (6.67%) | 0.1723 (1.53%) | 0.2532 (0.88%) | 4.37% | ||
| CDs & Vinyl | Base | 0.0150 | 0.0208 | 0.0298 | 0.0527 | - | 0.0186 | 0.0235 | 0.0405 | 0.0604 | - | |
| +ERL (Improv.) | 0.0208 (38.67%) | 0.0259 (24.52%) | 0.0428 (43.62%) | 0.0629 (19.35%) | 31.54% | 0.0199 (6.99%) | 0.0248 (5.53%) | 0.0417 (2.96%) | 0.0609 (0.83%) | 4.08% | ||
| +PRL (Improv.) | 0.0191 (27.33%) | 0.0253 (21.63%) | 0.0394 (32.21%) | 0.0640 (21.44%) | 25.66% | 0.0198 (6.45%) | 0.0249 (5.96%) | 0.0417 (2.96%) | 0.0618 (2.32%) | 4.42% | ||
| Baby & Products | Base | 0.0152 | 0.0199 | 0.0315 | 0.0501 | - | 0.0176 | 0.0231 | 0.0371 | 0.0588 | - | |
| +ERL (Improv.) | 0.0183 (20.39%) | 0.0239 (20.10%) | 0.0367 (16.51%) | 0.0589 (17.56%) | 18.64% | 0.0184 (4.55%) | 0.0242 (4.76%) | 0.0373 (0.54%) | 0.0602 (2.38%) | 3.06% | ||
| +PRL (Improv.) | 0.0182 (19.74%) | 0.0236 (18.59%) | 0.0359 (13.97%) | 0.0575 (14.77%) | 16.77% | 0.0189 (7.39%) | 0.0247 (6.93%) | 0.0376 (1.35%) | 0.0611 (3.91%) | 4.89% | ||
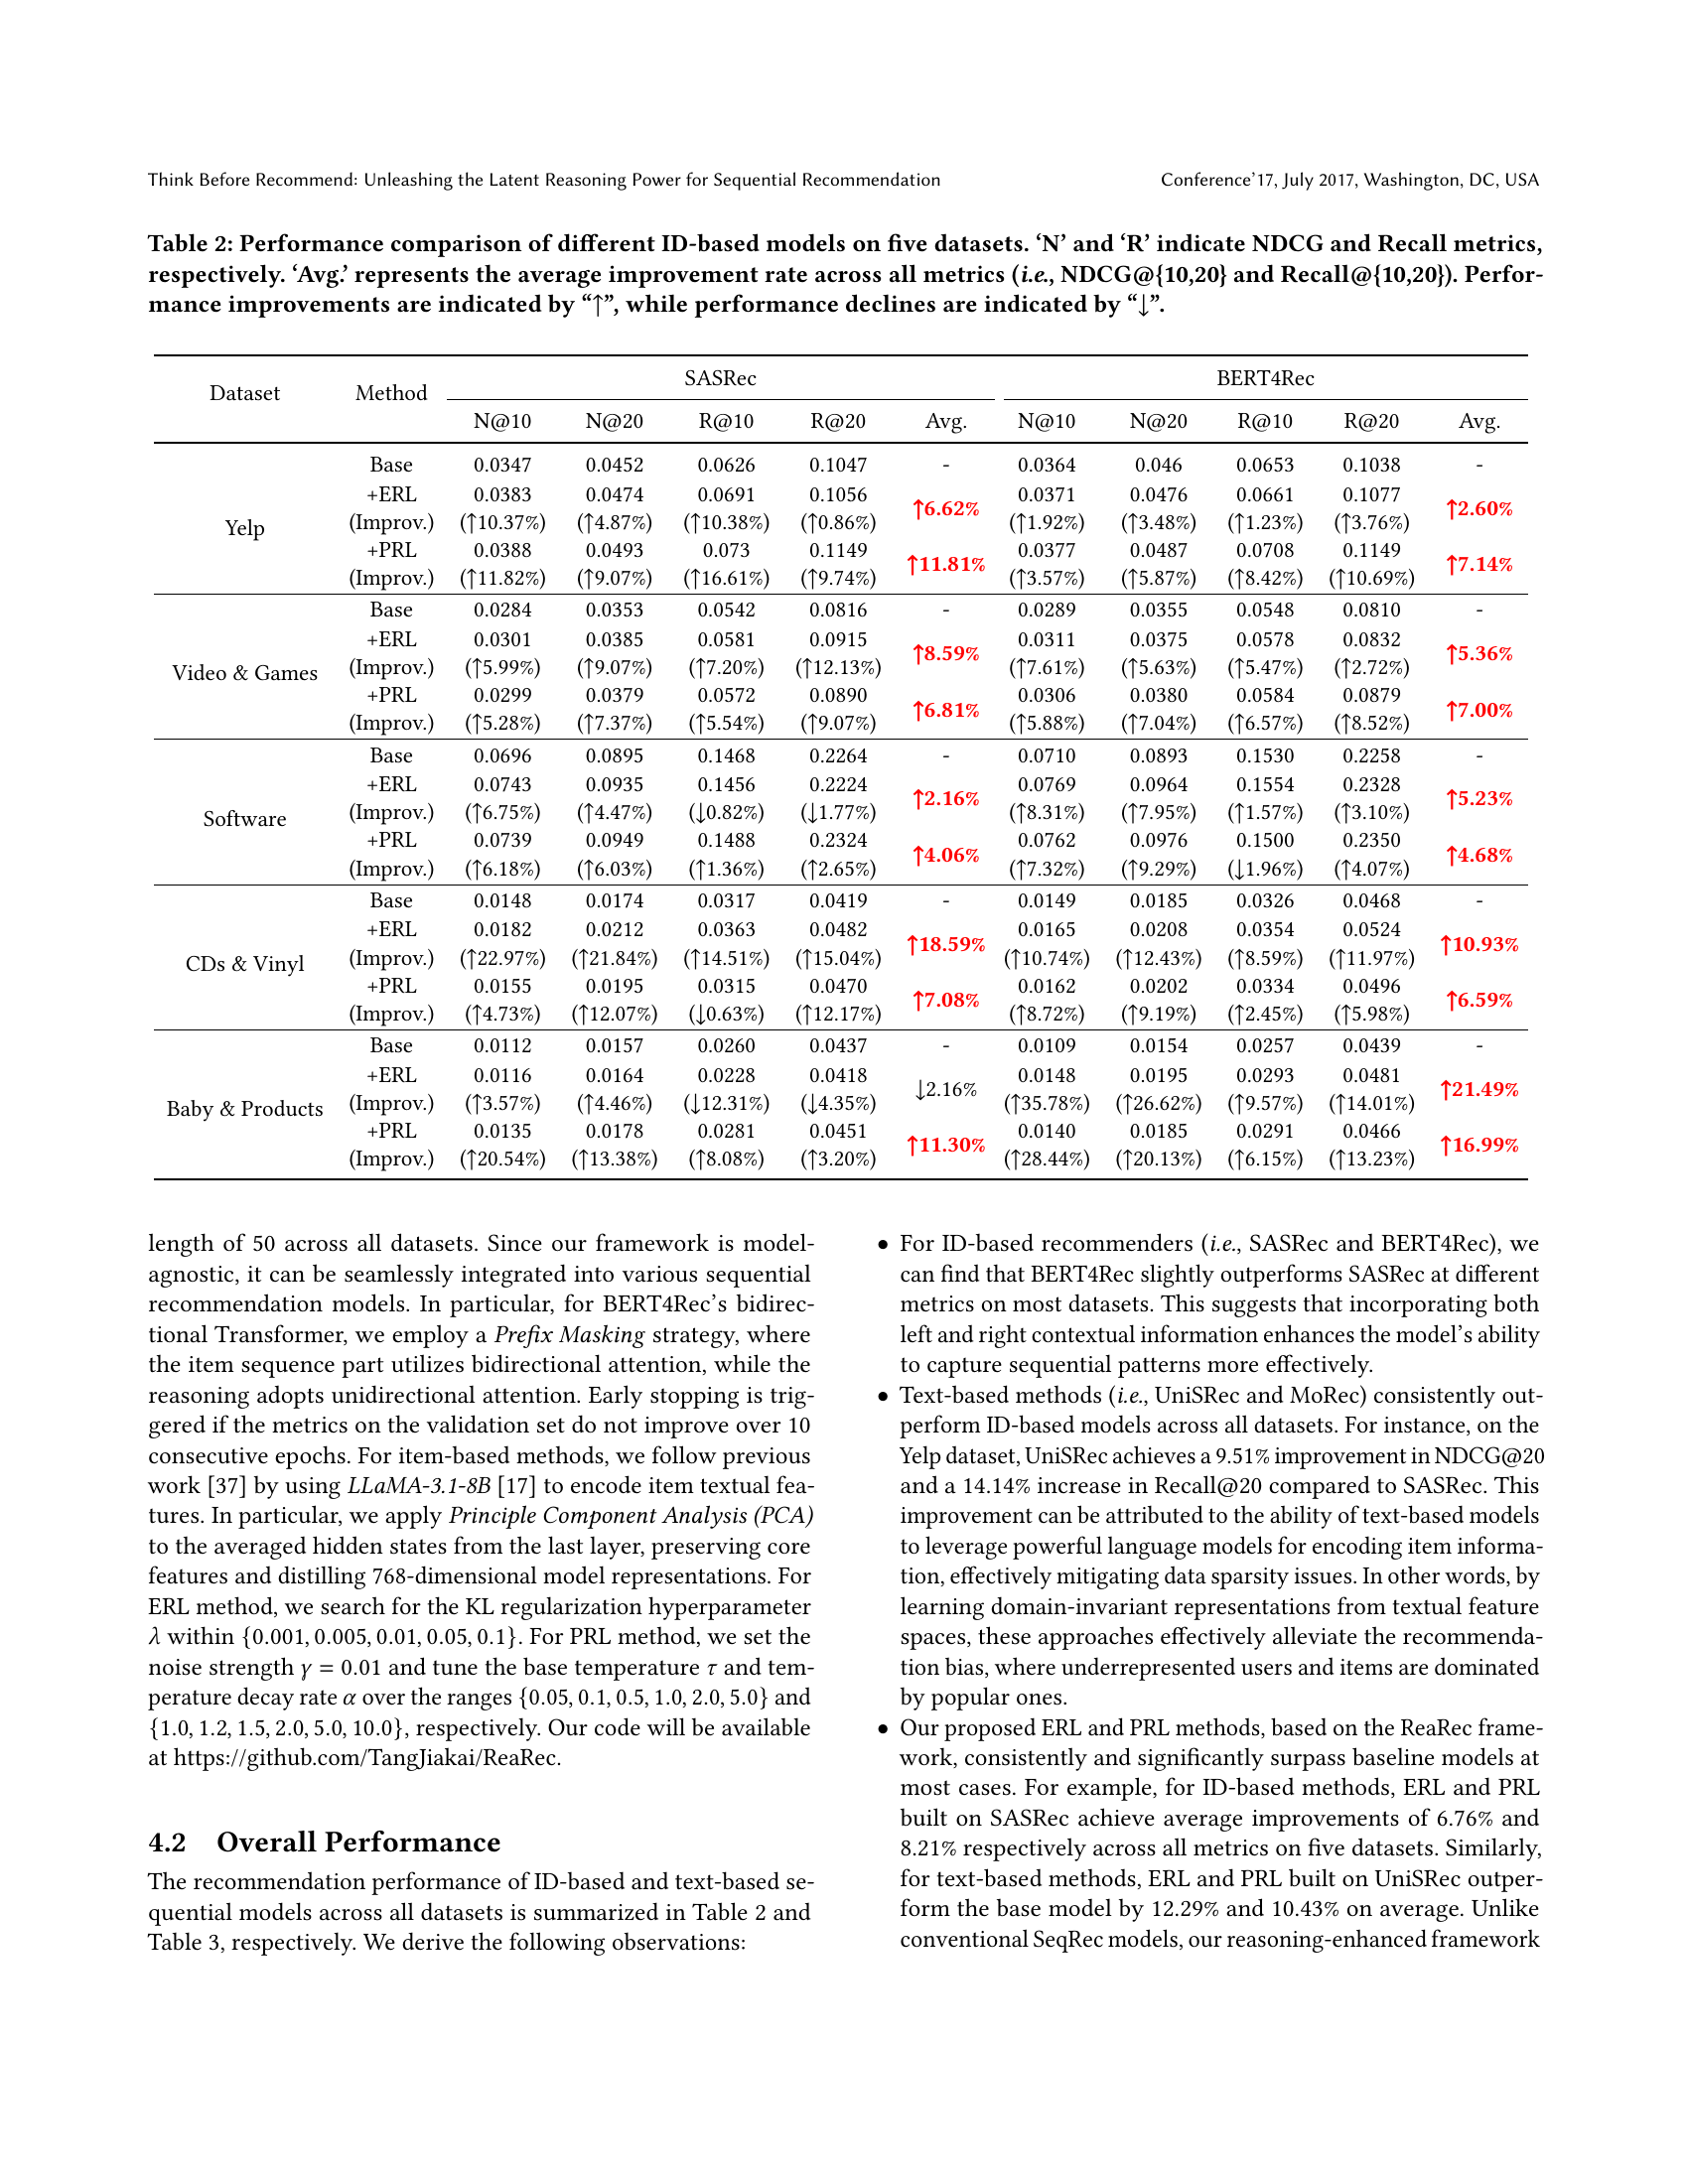
🔼 This table presents a performance comparison of different text-based sequential recommendation models on five datasets. For each model (UniSRec and MoRec with and without ERL and PRL enhancements), the table shows the NDCG@10, NDCG@20, Recall@10, and Recall@20 metrics. The ‘Avg’ column provides the average performance improvement across all four metrics. Upward-pointing arrows (↑↑) indicate performance improvements compared to the baseline model, while downward-pointing arrows (↓↓) denote performance decreases.
read the caption
Table 3. Performance comparison of different Text-based models on five datasets. ‘N’ and ‘R’ indicate NDCG and Recall metrics, respectively. ‘Avg.’ represents the average improvement rate across all metrics (i.e., NDCG@{10,20} and Recall@{10,20}). Performance improvements are indicated by “↑↑\uparrow↑”, while performance declines are indicated by “↓↓\downarrow↓”.
| Base | Step-1 | Step-2 | Step-3 | Step-4 | Step-5 | |
| SASRec | 5.6761 | 5.7985 | 5.8752 | 5.9305 | 6.0310 | 6.2786 |
| Cost Inc. | - | 2.16% | 3.51% | 4.48% | 6.25% | 10.61% |
| BERT4Rec | 5.6535 | 5.7685 | 5.9174 | 5.9621 | 6.0862 | 6.1224 |
| Cost Inc. | - | 2.03% | 4.67% | 5.46% | 7.65% | 8.29% |
| UniSRec | 5.6061 | 5.6312 | 5.7596 | 5.8732 | 6.0303 | 6.0502 |
| Cost Inc. | - | 0.45% | 2.74% | 4.76% | 7.57% | 7.92% |
| MoRec | 5.6638 | 5.7143 | 5.8391 | 5.9565 | 5.9659 | 5.9812 |
| Cost Inc. | - | 0.89% | 3.10% | 5.17% | 5.33% | 5.60% |
🔼 This table presents the inference time for different numbers of reasoning steps (Step 0 to Step 5) used in the ReaRec model. It shows the increase in computation cost for each step compared to the baseline (Step 0). The experiments were conducted using a single NVIDIA A100-40G GPU. The table helps to illustrate the trade-off between increased computational cost and improved model performance. Step 2 typically shows the best balance between performance gains and additional computation time.
read the caption
Table 4. Inference time statistics for different steps. “Cost Inc.” is short for Cost Increase, where higher values indicate greater time overhead. Efficiency experiments are conducted on a single A100-40G GPU. Note that the optimal performance typically corresponds to Step-2.
Full paper#