↗ arXiv ↗ Hugging Face ↗ Papers with Code
TL;DR#
Current methods for creating geospatial QA datasets for Large Language Models (LLMs) are slow and prone to errors due to manual data collection. This limits progress in developing and evaluating LLMs for geospatial reasoning tasks.
MAPQATOR solves this by offering a user-friendly web application with a plug-and-play architecture. This allows researchers to easily integrate with various map APIs, gather and visualize data, and annotate it efficiently. The platform caches API responses to ensure data consistency and reproducibility, drastically reducing annotation time. The evaluation shows MAPQATOR is at least 30 times faster than manual methods, making it a crucial tool for advancing geospatial LLM research.
Key Takeaways#
Why does it matter?#
This paper is important because it introduces MAPQATOR, a novel tool that significantly accelerates the creation of high-quality geospatial QA datasets. This addresses a critical bottleneck in LLM research, enabling faster evaluation and advancement of geospatial reasoning capabilities. The plug-and-play architecture and focus on reproducibility make it highly valuable for researchers working with various map APIs and LLMs. It opens new avenues for creating more comprehensive and reliable geospatial datasets, ultimately benefiting the wider field of geographic information science and AI.
Visual Insights#

🔼 This figure illustrates the workflow of the MapQaTor platform, starting from selecting a map API to exporting the annotated dataset. Users choose a map API, submit queries through provided tools, visualize the fetched data on an embedded map, and then create and annotate question-answer pairs based on the visualized data and API calls. The platform utilizes a plug-and-play architecture for seamless API integration, incorporates a caching mechanism for consistent ground truth, and offers visualization tools to enhance the annotation process.
read the caption
Figure 1: Overview of the annotation and visualization process of MapQaTor .
| Tool | API Provider | API Endpoint |
|---|---|---|
| Text Search | Google Maps | [Text Search (New) |
| [Text Search | ||
| OpenStreetMap | [Search queries | |
| Mapbox | [Suggest | |
| TomTom | Point of Interest Search | |
| HERE | [Discover | |
| Azure Maps | Search - Get Search Fuzzy | |
| Place Details | Google Maps | [Place Details (New) |
| OpenStreetMap | [Place details | |
| Mapbox | [Retrieve | |
| TomTom | Place by ID | |
| HERE | [Lookup | |
| Azure Maps | Search - Get Search Fuzzy | |
| Nearby Search | Google Maps | [Nearby Search (New) |
| TomTom | Nearby Search | |
| Compute Routes | Google Maps | [Get a route |
| OpenStreetMap | [Routing API | |
| TomTom | Calculate Route | |
| Search Along Route | Google Maps | Search along route |
| TomTom | Along Search Route |
🔼 This table details the specific APIs supported by each data collection tool within the MAPQATOR platform. For each tool (Text Search, Place Details, Nearby Search, Compute Routes, Search Along Route), it lists the API providers (e.g., Google Maps, OpenStreetMap, Mapbox) and the corresponding API endpoints used for data retrieval. This shows the flexibility and broad compatibility of MAPQATOR with various map services.
read the caption
Table 1: Current API Support for Data Collection Tools in MapQaTor
In-depth insights#
Geo-QA Dataset Creation#
Creating a high-quality Geo-QA dataset is crucial for advancing research in geospatial question answering. Manual annotation is slow and prone to inconsistencies, making it unsuitable for large-scale datasets. Therefore, automated methods and tools, like the system described in this paper, are necessary. The key focus is on efficient data acquisition and annotation, combining automated API calls with a user-friendly interface. Reproducibility is paramount; consistent ground truth is essential, which is achieved through API response caching. This approach streamlines the process and offers a scalable solution for building large, reliable Geo-QA datasets suitable for training and evaluating sophisticated Large Language Models (LLMs) in geospatial reasoning tasks. The plug-and-play architecture of the described system allows easy integration with various map APIs, enhancing dataset diversity and robustness. Ultimately, such systems are vital for developing the next generation of geospatial LLMs.
LLM Geo-Reasoning#
LLM Geo-Reasoning represents a significant advancement in the field of geospatial AI. By leveraging the power of Large Language Models (LLMs), we can move beyond simple keyword-based searches and enable systems to understand and reason about complex geospatial queries expressed in natural language. This opens doors to more intuitive and user-friendly map services that better cater to complex location-based needs. However, the success of LLM geo-reasoning hinges upon high-quality training datasets. Creating these datasets is time-consuming and labor-intensive; therefore, the development of efficient annotation tools, like MAPQATOR, is crucial. These tools help streamline data collection, ensure data consistency and accelerate research progress. Challenges remain in addressing the inherent complexities of geospatial data and natural language understanding. Ensuring that LLMs accurately capture the nuances of spatial relationships and handle ambiguities in user queries remains an active area of research. Future efforts need to focus on developing LLM architectures specifically designed for geospatial reasoning and improving the robustness of the models in handling noisy or incomplete data.
MAPQATOR Architecture#
The MAPQATOR architecture is designed for efficient and reproducible creation of map-based question-answering datasets. Its plug-and-play architecture allows seamless integration with various map APIs, making it adaptable and versatile. The system employs an adapter layer to standardize API requests and responses, ensuring compatibility across different map services. A crucial component is the caching mechanism, using a PostgreSQL database to store API responses, which ensures data consistency and reduces redundant API calls. This contributes to both efficiency and reliability. Furthermore, the architecture incorporates visualization tools based on Google Maps JavaScript API, enabling users to easily visualize the gathered data, improving annotation accuracy and understanding. The combination of these elements allows for a streamlined workflow for efficient geospatial dataset creation, ideal for evaluating LLMs and advancing geospatial reasoning.
Evaluation & Metrics#
A robust evaluation methodology is crucial for assessing the effectiveness of any system. For a system like MAPQATOR, which focuses on creating and annotating geospatial datasets, the evaluation should go beyond simple metrics. Quantitative metrics such as annotation time reduction compared to manual methods are important but don’t capture the entire picture. Qualitative aspects also need careful consideration. This includes assessing the reproducibility and traceability of the datasets generated, ensuring consistency and reliability over time. The evaluation should also address the quality of annotations produced, considering factors like accuracy and consistency among annotators. Finally, the evaluation should examine the usefulness of the generated dataset. This involves analyzing its suitability for training and evaluating Large Language Models (LLMs) in geospatial reasoning tasks. The metrics used should reflect how well the dataset supports these tasks and how effective it is in revealing the strengths and weaknesses of different LLMs.
Future Work & Limits#
Future work could explore expanding MAPQATOR’s functionality to support a wider range of geospatial tasks and data sources, including incorporating diverse map APIs and integrating with other location-based services. Addressing the limitations of reliance on paid APIs is crucial, perhaps by investigating methods to use open-source alternatives or exploring collaborations with map providers to secure sustainable access. A key area for improvement is enhancing the platform’s user experience and capabilities for collaborative annotation, potentially leveraging machine learning to automate aspects of the annotation process. Evaluating the robustness and scalability of the system under heavy usage conditions is important, as well as conducting thorough assessments of its performance against different large language models and on a more diverse range of tasks and datasets. Finally, it’s vital to thoroughly examine and mitigate the potential biases present in the data, ensuring that the datasets created by MAPQATOR are both representative and fair.
More visual insights#
More on figures
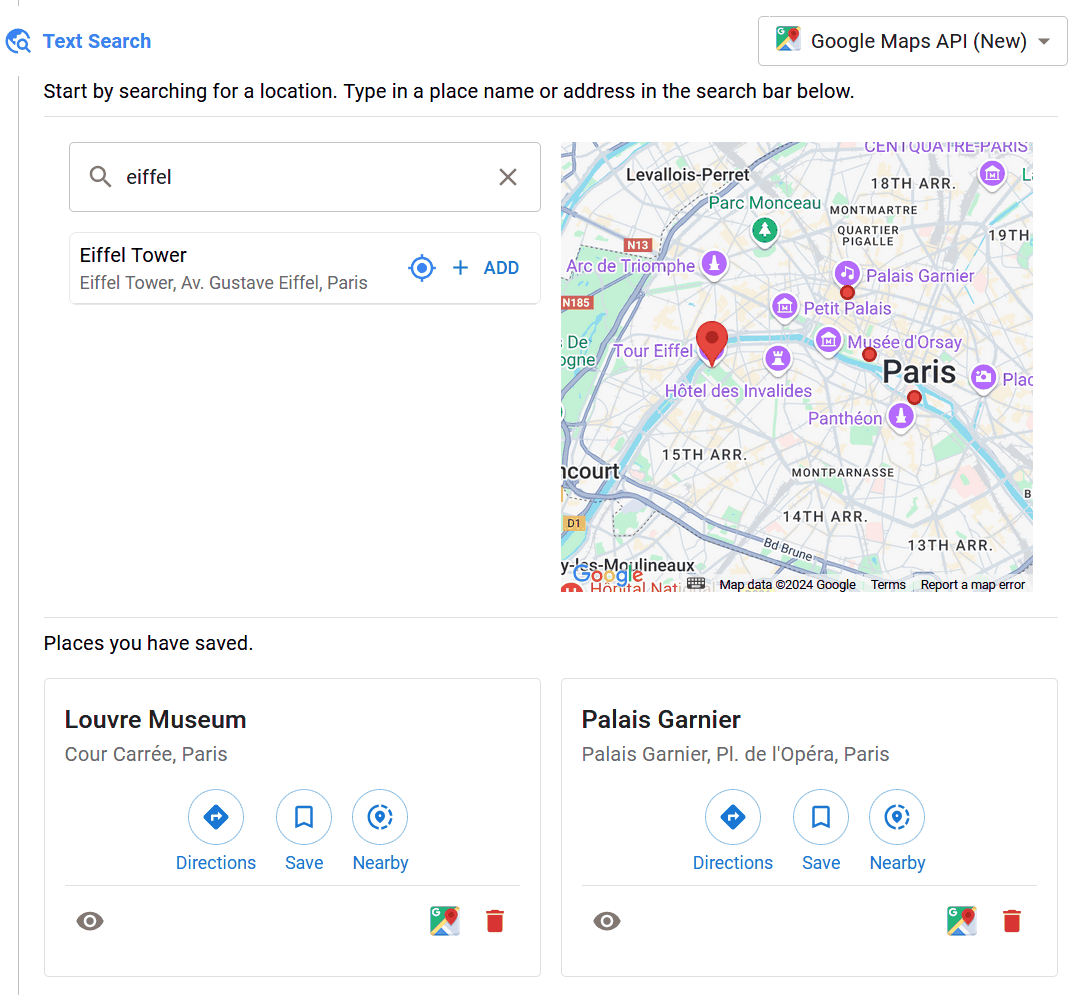
🔼 The figure displays the interface for searching a place using MAPQATOR. A search bar is prominent, allowing users to input place names or addresses. Below the search bar, previously saved places are listed for quick selection. The user can search either through the map view or list view. Once a location is selected, relevant details are displayed, supporting efficient data collection and annotation for creating map-based question-answering datasets.
read the caption
Figure 2: Search for a place
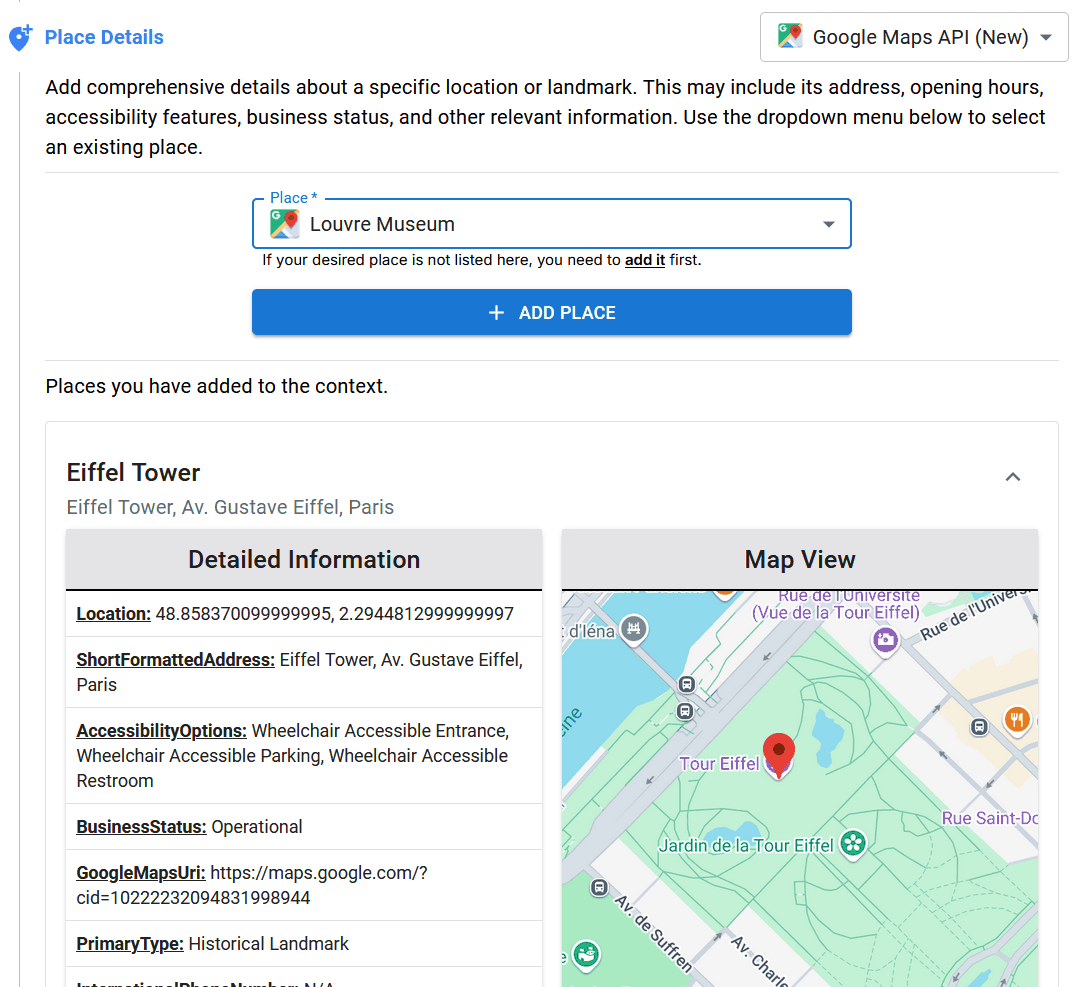
🔼 This figure displays the functionality of the Place Details tool in MAPQATOR. It shows how users can obtain detailed information about a specific location by selecting it from a dropdown menu. The displayed information includes the location’s address, opening hours, accessibility features, and reviews. This detailed information is crucial for creating accurate and context-rich question-answer pairs for evaluating large language models (LLMs) in geospatial reasoning tasks.
read the caption
Figure 3: Fetch full details of a place

🔼 This figure shows the interface for the ‘Nearby Search’ tool in MAPQATOR. Users select a location from a dropdown menu or by adding a new location. Then they choose a type of point of interest (POI), such as restaurants, shops, or landmarks. Options to filter results by minimum rating, price range, and to sort by relevance or distance are also shown. The map displays the chosen location and the nearby POIs found by the system, allowing users to review the results visually before using them to create question-answer pairs for their geospatial datasets.
read the caption
Figure 4: Search Nearby Places
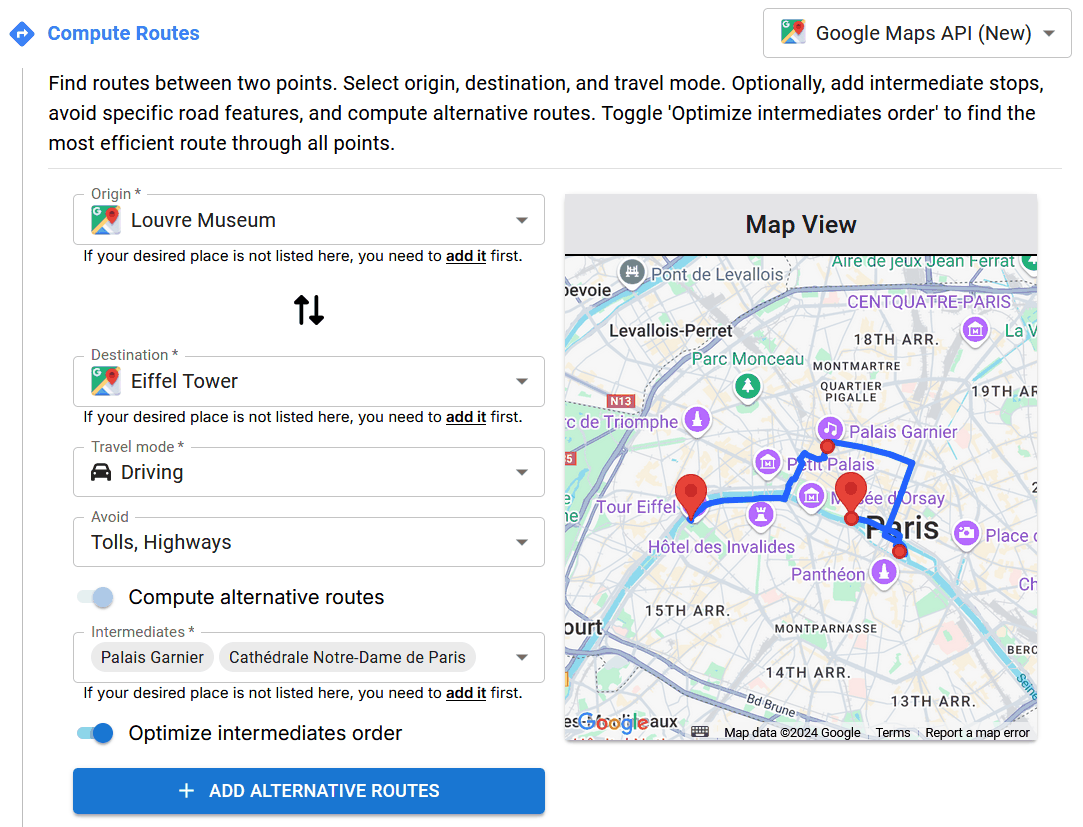
🔼 This figure shows the interface for the Compute Routes tool in MAPQATOR. Users can input an origin and destination, select a travel mode (driving, walking, cycling, etc.), and optionally add intermediate stops or specify constraints like avoiding tolls or highways. The system then computes routes between the specified locations and displays them on an embedded map. The visualization includes the route path, travel time, and distance for each route. Users can also select options to compute alternative routes and optimize the order of intermediate stops for the most efficient route.
read the caption
Figure 5: Find routes between places
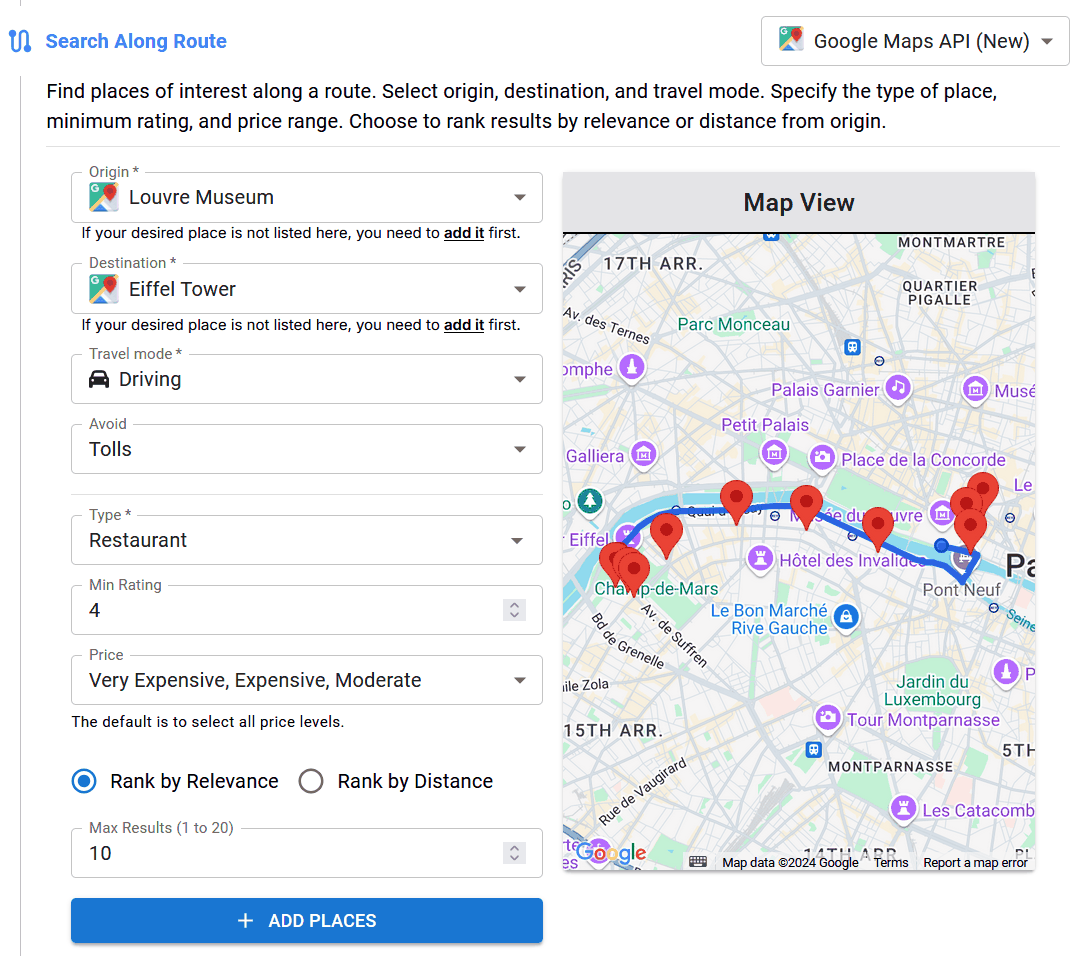
🔼 This figure demonstrates the ‘Search Along Route’ tool in MAPQATOR. Users define an origin and destination, specify travel mode (e.g., driving), and optionally add filters like POI type, minimum rating, and price range. The map displays the route, and markers indicate points of interest along that route that match the specified criteria. The tool allows efficient discovery of relevant locations situated along a chosen route, enriching the dataset with contextually relevant information.
read the caption
Figure 6: Search places along a route
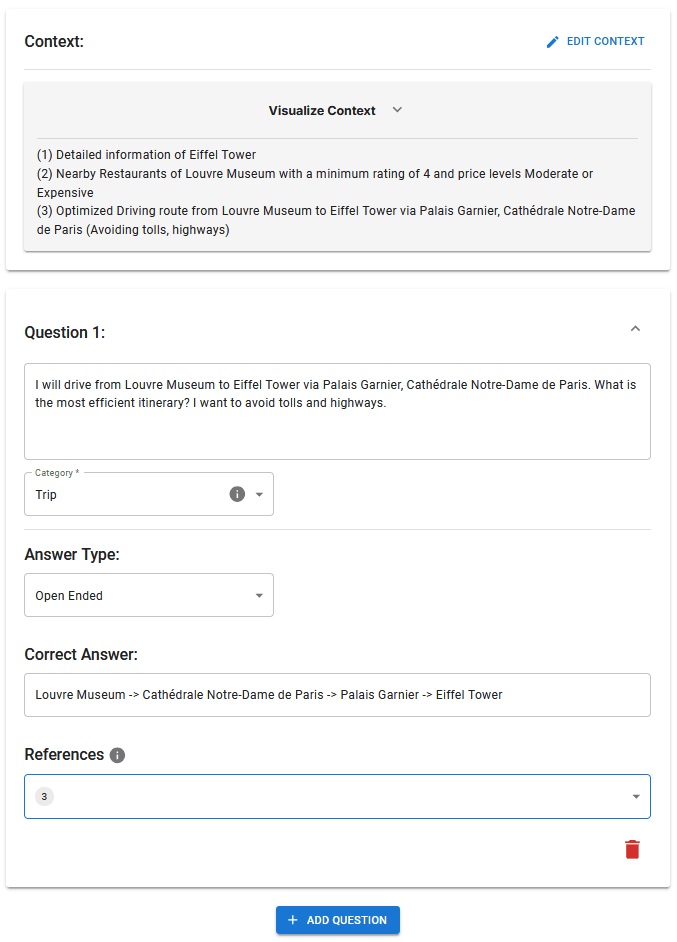
🔼 This figure shows the interface for creating and annotating questions within the MAPQATOR platform. Users input a question, define the answer type (e.g., open-ended, yes/no, multiple choice, single choice), provide options if necessary, and then specify the correct answer. This process is crucial for building a high-quality, well-structured dataset for evaluating large language models (LLMs) on geospatial reasoning tasks.
read the caption
Figure 7: Create a question, provide options, and annotate the correct answer.

🔼 This figure shows how to implement the TomTom API adapter for the Text Search tool within the MapQaTor platform. It demonstrates extending the TextSearch base class to include a TomTom-specific implementation using the methods ‘convertRequest’ and ‘convertResponse’. This ensures consistent interaction between different APIs and maintain standardized request and response formats across the platform. The example highlights the use of environment variables for security, preventing exposure of API keys on the frontend.
read the caption
Figure 8: Implementing the TomTom API Adapter for Text Search in MapQaTor
🔼 This algorithm decodes a polyline string, a common format for encoding a series of geographical coordinates, into an array of latitude and longitude pairs. It iterates through the encoded string, interpreting each character to extract the changes in latitude and longitude. These changes are then cumulatively added to the initial values to obtain the final coordinates. The algorithm efficiently handles the variable-length encoding scheme of polylines, making it suitable for processing geographical data efficiently.
read the caption
Figure 9: Polyline Decoding Algorithm
🔼 This figure displays a map view with multiple markers, each representing a different place or point of interest. The markers are color-coded or visually distinct to aid in differentiating them. This visualization likely demonstrates the capability of the MAPQATOR system to accurately display and locate points of interest on an interactive map using data gathered from various map APIs.
read the caption
Figure 10: Set of markers indicating different places
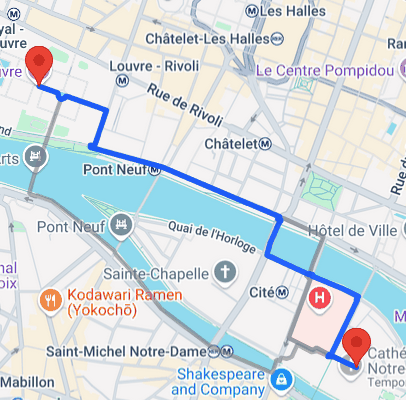
🔼 This figure displays the visualization of routes between places using MAPQATOR. It shows how the platform allows users to visualize computed routes on an embedded map, providing an intuitive understanding of the spatial relationships between different locations. The routes are shown as lines connecting different markers representing places. This visualization aids in the creation and annotation of geospatial data for question-answering tasks.
read the caption
Figure 11: Visualizing routes between places
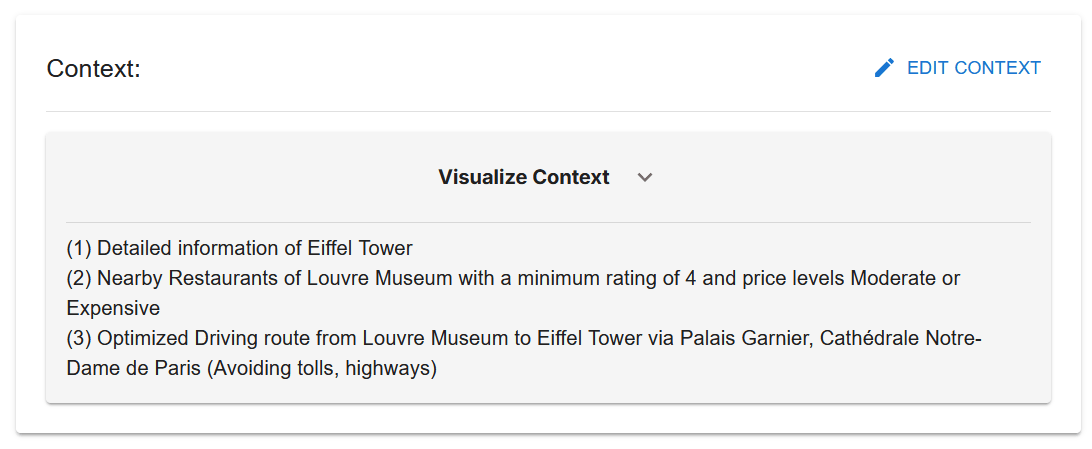
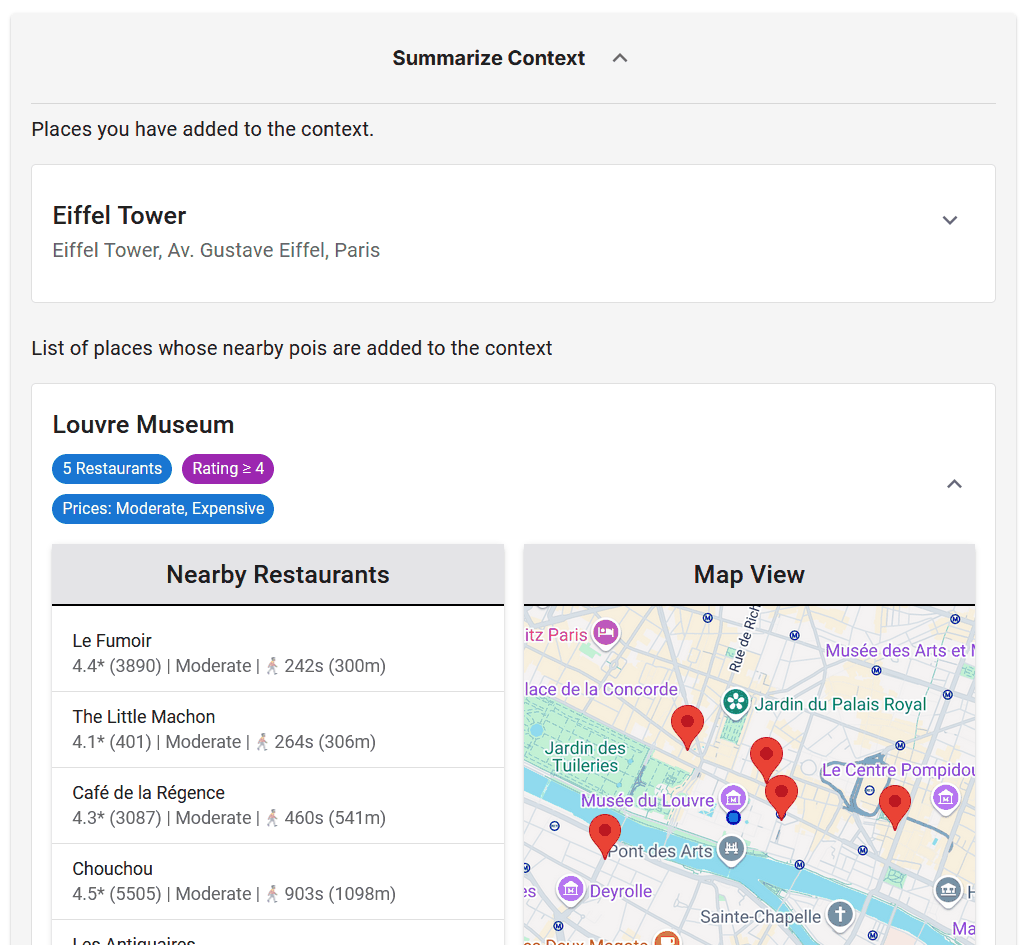
🔼 This figure shows a summarized view of the context created by the user in the MAPQATOR platform. The context includes various pieces of information gathered from different map APIs, such as detailed information about the Eiffel Tower, nearby restaurants around the Louvre Museum with specific rating and price filters, and an optimized driving route between the Louvre Museum and the Eiffel Tower (avoiding tolls and highways). This summary provides a concise overview of the data used to generate the question-answer pairs, aiding in the traceability and reproducibility of the dataset.
read the caption
Figure 12: Summarized Context
🔼 This figure shows the visual representation of the context created by the user in MAPQATOR. It provides a detailed view of the information gathered from various Map APIs, including place details, nearby search results, and computed routes. This visual context helps users understand the spatial relationships between different locations and facilitates the creation of accurate and contextually relevant questions for geospatial QA tasks.
read the caption
Figure 13: Visual Context

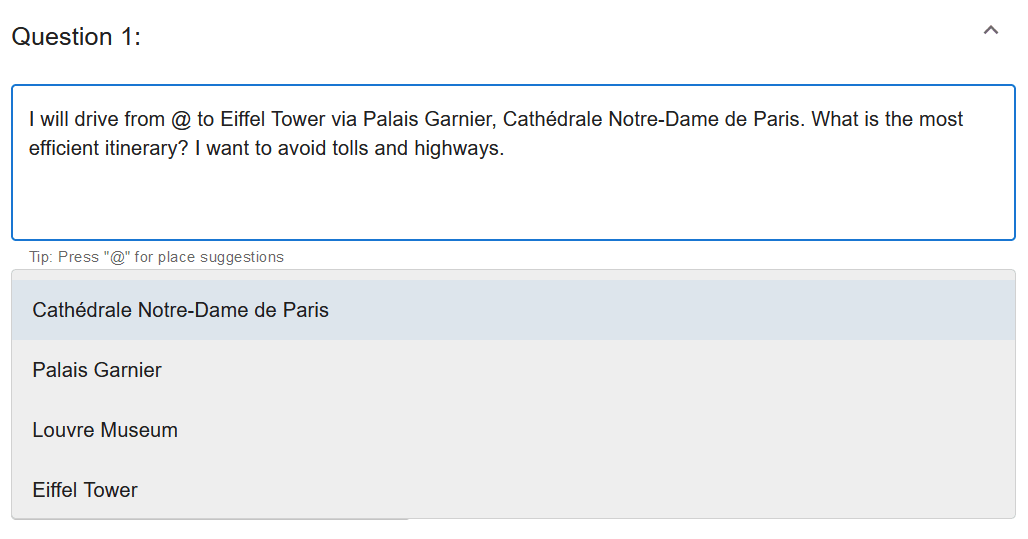
🔼 This figure shows a screenshot of the MAPQATOR interface. The user is in the process of creating a question. A text box displays ‘@’ to indicate that the system is suggesting available places from the previously created context. This feature helps ensure consistency and efficiency in question creation by providing readily available place names relevant to the current task. The user can simply type ‘@’ and then select a suggested place name from the dropdown list, directly inserting it into the text field.
read the caption
Figure 14: Suggesting available places from the context

🔼 This figure shows one of the four distinct answer formats used in the MAPQATOR platform for creating question-answering datasets. The ‘Open Ended’ format allows for free-text, detailed answers, assessing a model’s ability to provide contextually rich and nuanced responses, particularly useful for complex questions demanding more than a simple yes/no or single-choice response.
read the caption
Figure 15: Answer format: Open Ended
🔼 This figure demonstrates the Yes/No answer format used in the MAPQATOR platform for creating question-answer pairs. The Yes/No format is designed for questions that require a simple yes or no answer, allowing for the assessment of the model’s ability to handle straightforward factual questions requiring definitive responses. The example in the figure shows a question posed to the model, the ‘Yes’ or ‘No’ answer options, and space for annotating the correct answer.
read the caption
Figure 16: Answer format: Yes/No
🔼 This figure shows the Multiple Choice answer format used in the MAPQATOR platform. Users can select one or more options from a predefined set of choices. This format is designed to assess a model’s ability to identify the most suitable answer(s) from a given set of alternatives, testing its ability to distinguish correct answers from incorrect ones.
read the caption
Figure 17: Answer format: Multiple Choice
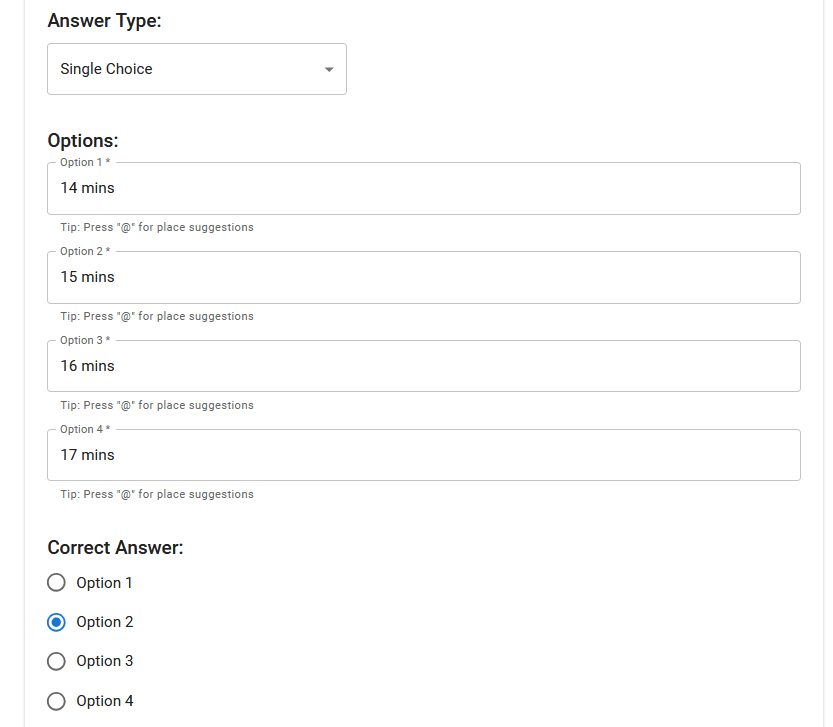
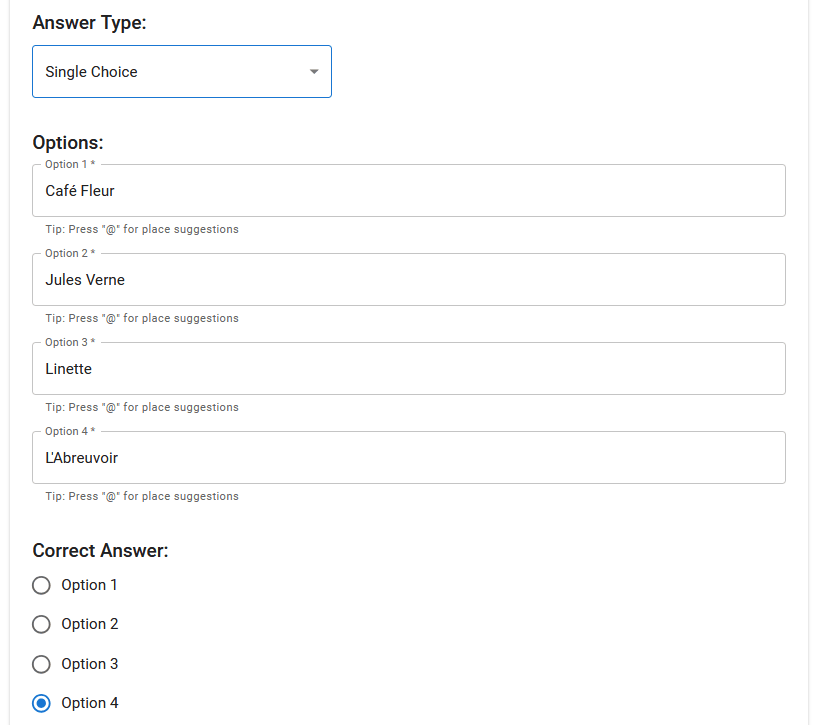
🔼 This figure shows the single-choice question format used in the MAPQATOR platform. This format presents a question with multiple options, but only one correct answer. It is designed to assess the model’s ability to select the single best answer from a set of alternatives, testing its decision-making and accuracy in selecting the correct response.
read the caption
Figure 18: Answer format: Single Choice
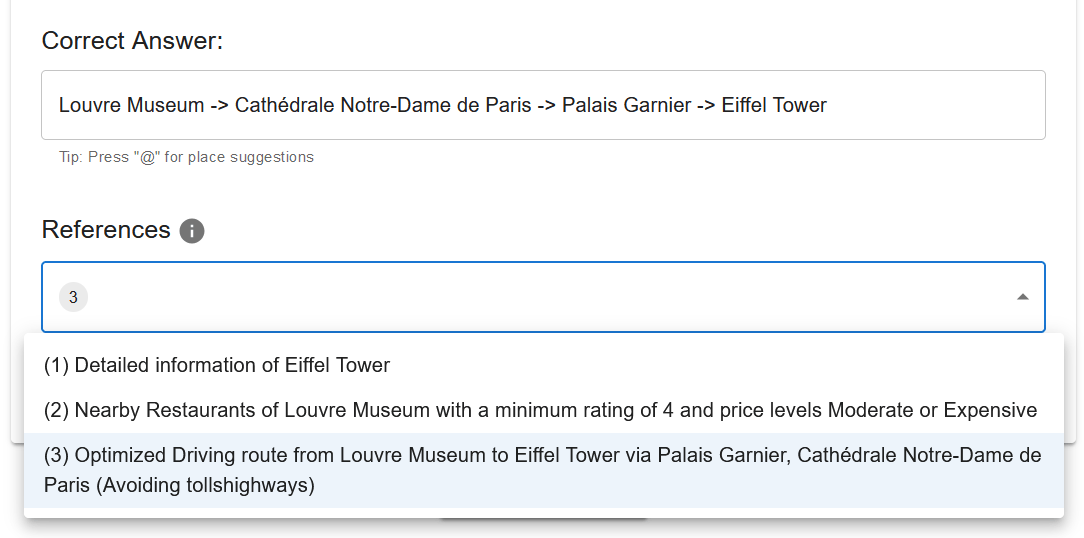
🔼 This figure shows the interface where users select the relevant information from the context to answer a question. The context contains various pieces of data gathered from different map APIs (e.g., place details, nearby places, routes). The user must choose which pieces of information in the context are specifically needed to correctly answer the question. This step ensures the traceability and reliability of the dataset by explicitly linking the questions to the appropriate data sources.
read the caption
Figure 19: Choosing relevant informations to provide the correct answer.
🔼 MAPQATOR’s workflow is divided into three main stages: context design, question-answer pair creation, and dataset review and saving. The context design phase involves using MAPQATOR’s data collection tools to gather relevant geospatial information, which serves as the foundation for creating question-answer pairs. Next, researchers generate question-answer pairs, choosing appropriate question types and answer formats based on the context. Finally, the platform enables users to review the generated dataset before saving it for subsequent analysis or use.
read the caption
Figure 20: Major steps of MapQaTor
🔼 MapQator offers five core tools for efficient data collection: Text Search, Place Details, Nearby Search, Compute Routes, and Search Along Route. Each tool seamlessly integrates with various map APIs (Google Maps, OpenStreetMap, Mapbox, TomTom, HERE, and Azure Maps are shown as examples in Table 1 of the paper) to fetch relevant geospatial data. This figure provides a visual overview of how these tools are integrated within the MapQator platform and used to gather information for creating high-quality question-answer pairs for geospatial reasoning tasks.
read the caption
Figure 21: Overview of data collection tools integrated into MapQaTor, showcasing essential functionalities.
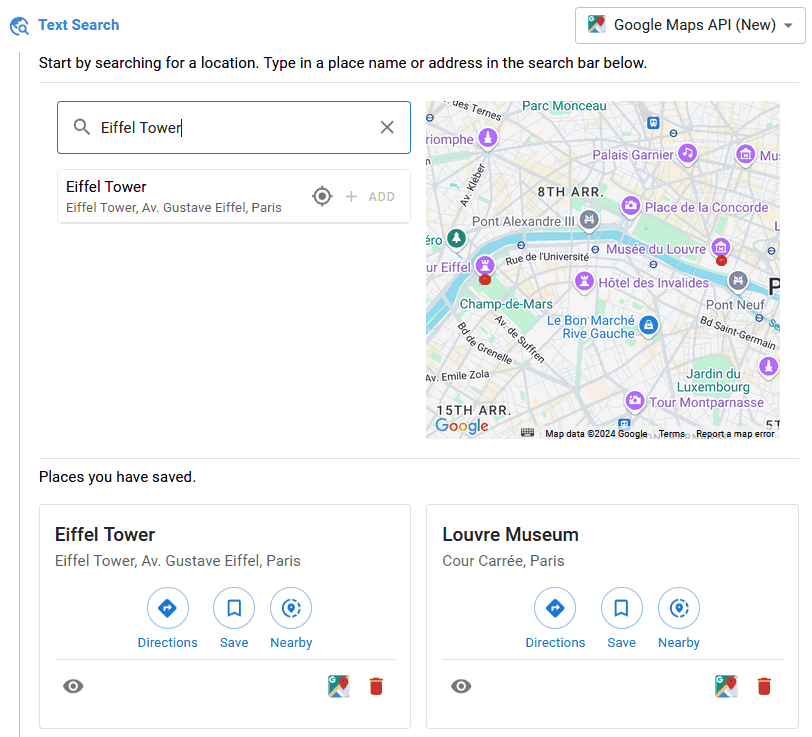
🔼 This figure shows a screenshot of the TextSearch tool in the MAPQATOR platform. The user is searching for ‘Eiffel Tower’ using the Google Maps API. The interface displays the search bar, a map showing the search results (the Eiffel Tower and surrounding area), and a list of saved places. The image illustrates the tool’s functionality in allowing users to search for locations, display them on a map, and save relevant places for later use in creating QA pairs within the platform.
read the caption
Figure 22: Example use of TextSearch tool

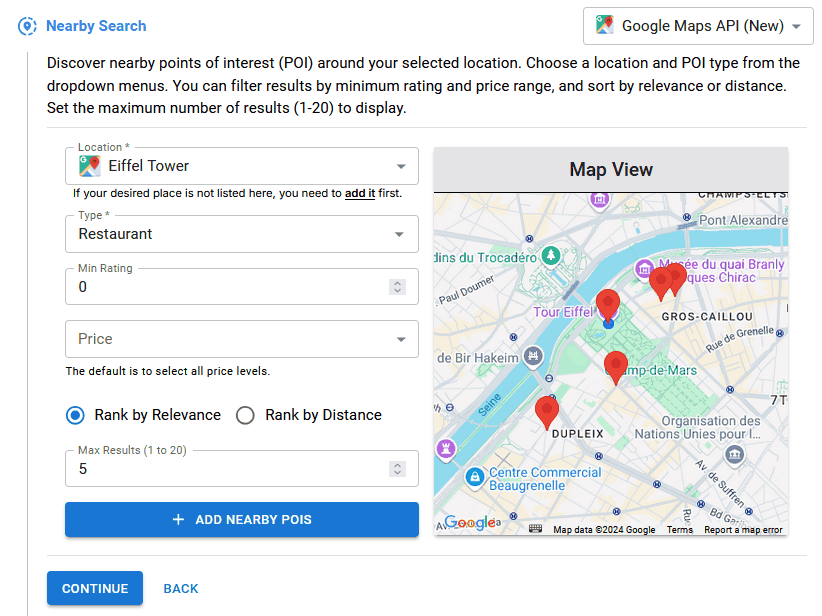
🔼 This figure demonstrates how to use the Nearby Search tool in MAPQATOR. The user selects a location (in this case, the Eiffel Tower) and specifies the type of point of interest (POI) they are looking for (restaurants). They can also set parameters like minimum rating and price range to filter results. The map then displays the nearby restaurants matching the specified criteria, along with information like rating and distance, helping users create question-answer pairs for their geospatial dataset.
read the caption
Figure 23: Example use of NearbySearch tool
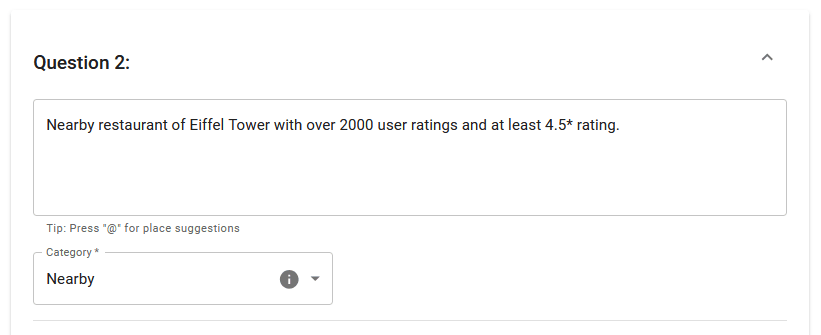
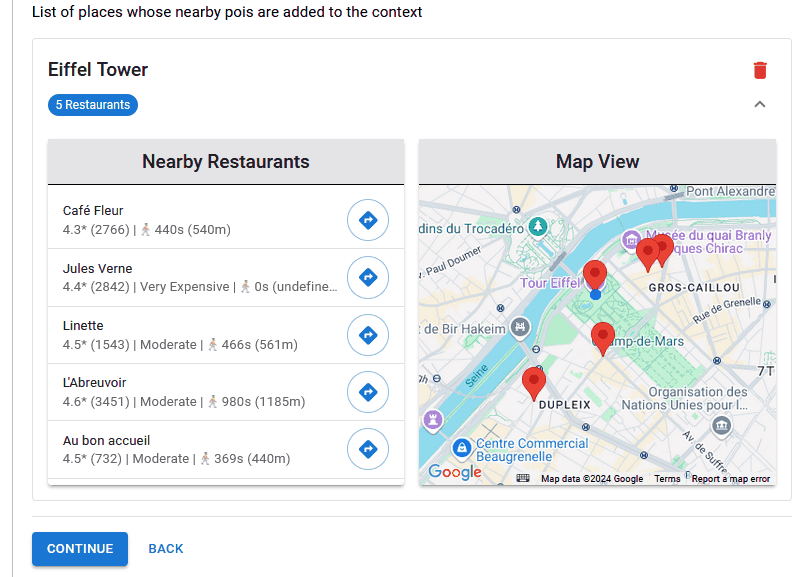
🔼 This figure displays a screenshot of the MAPQATOR application showing the results of a nearby search for restaurants around the Eiffel Tower. The results include the name of each restaurant, its rating (out of 5 stars), price range, and the estimated travel time from the Eiffel Tower to each restaurant. The map visually shows the locations of the restaurants relative to the Eiffel Tower.
read the caption
Figure 24: Nearby restaurants of Eiffel Tower
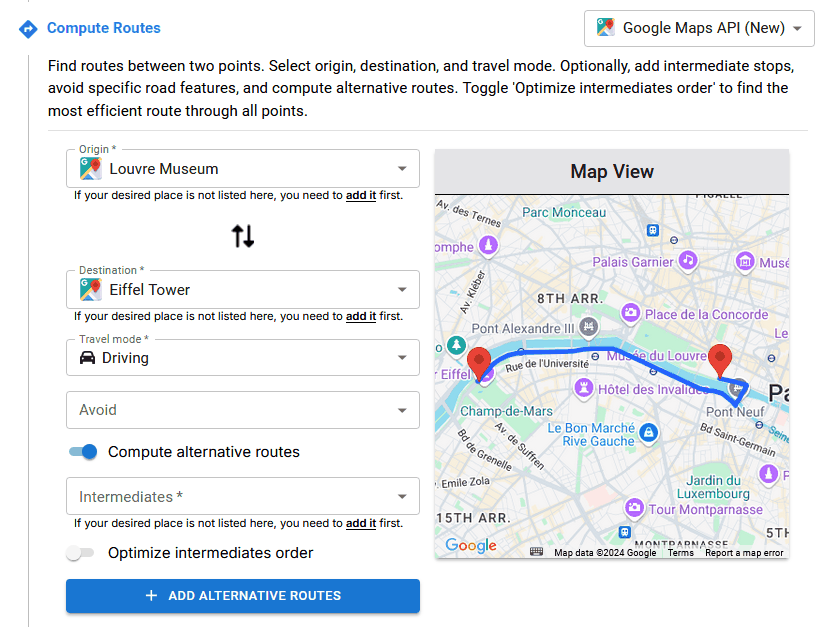
🔼 This figure shows a screenshot of the ComputeRoutes tool in MAPQATOR. The tool allows users to compute routes between two points, optionally including intermediate stops and avoiding specific road features. The screenshot displays the tool’s interface with input fields for origin, destination, travel mode, optional intermediate stops, and avoidance options. It showcases the user’s ability to specify travel preferences and obtain multiple route options, facilitating the creation of more complex and realistic geospatial questions for the dataset.
read the caption
Figure 25: Example use of ComputeRoutes tool

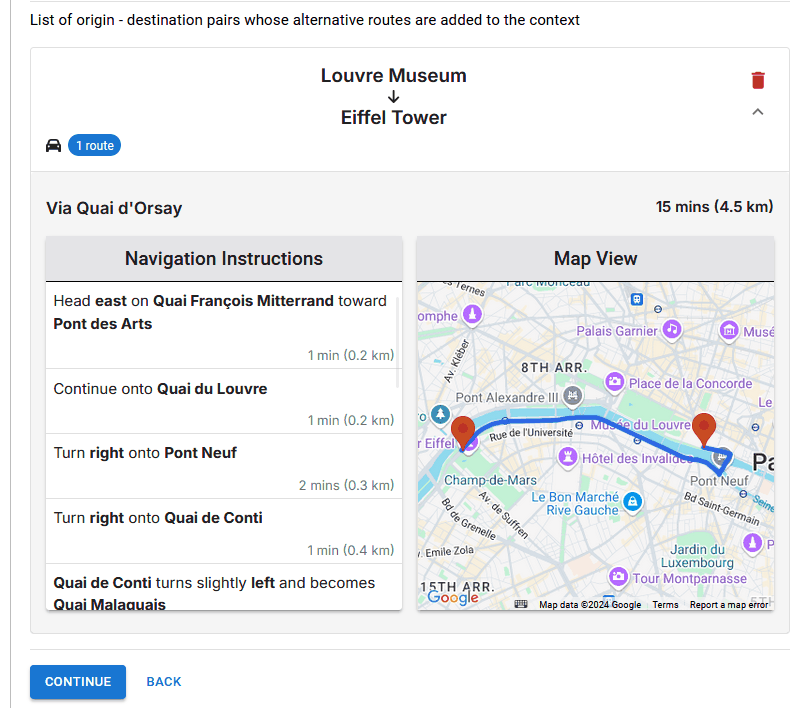
🔼 This figure displays a screenshot of the MAPQATOR application showing the available routes calculated between the Louvre Museum and the Eiffel Tower in Paris. The screenshot shows the available route options, each with its associated travel time and distance, providing a visual representation of the route computation capabilities of the platform. The results presented are likely derived using a mapping API integrated into MAPQATOR, illustrating the visualization of routes obtained via API calls. The user can choose from different route options, optimizing potential paths based on criteria such as travel time.
read the caption
Figure 26: Available routes from Louvre museum to Eiffel tower by car
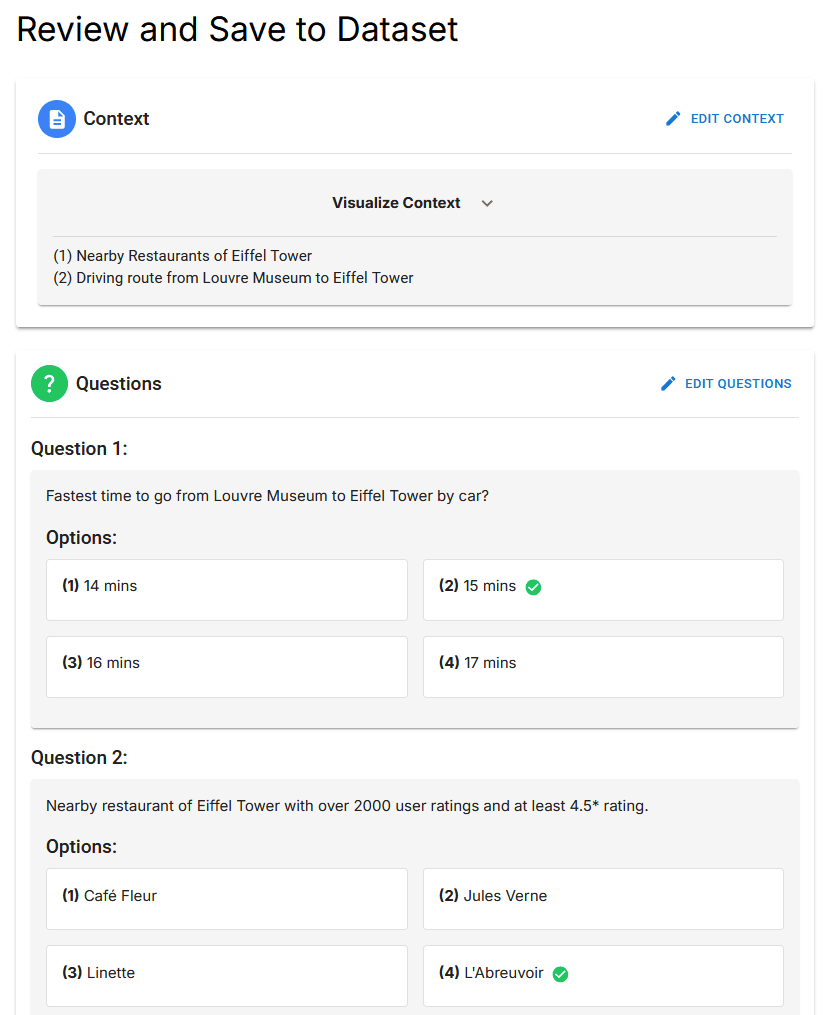
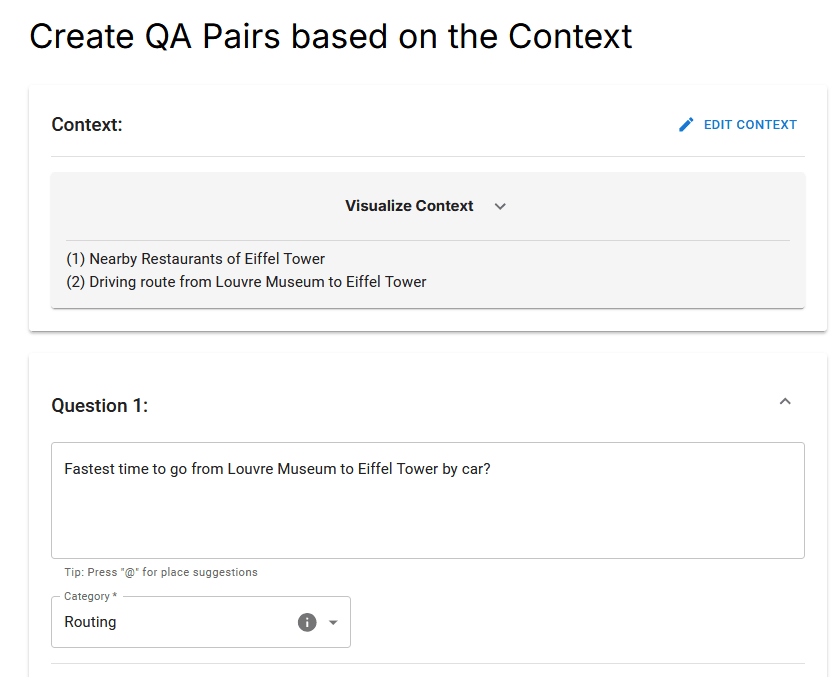
🔼 This figure shows a screenshot of the MAPQATOR interface where a user is in the process of creating a question. The user has selected the question type (Routing) and is in the process of entering the question text. This is one step in the creation of a question-answer pair to be included in a geospatial question-answering dataset. The screenshot highlights the tools provided by MAPQATOR to facilitate question creation.
read the caption
Figure 27: Example question creation (1)
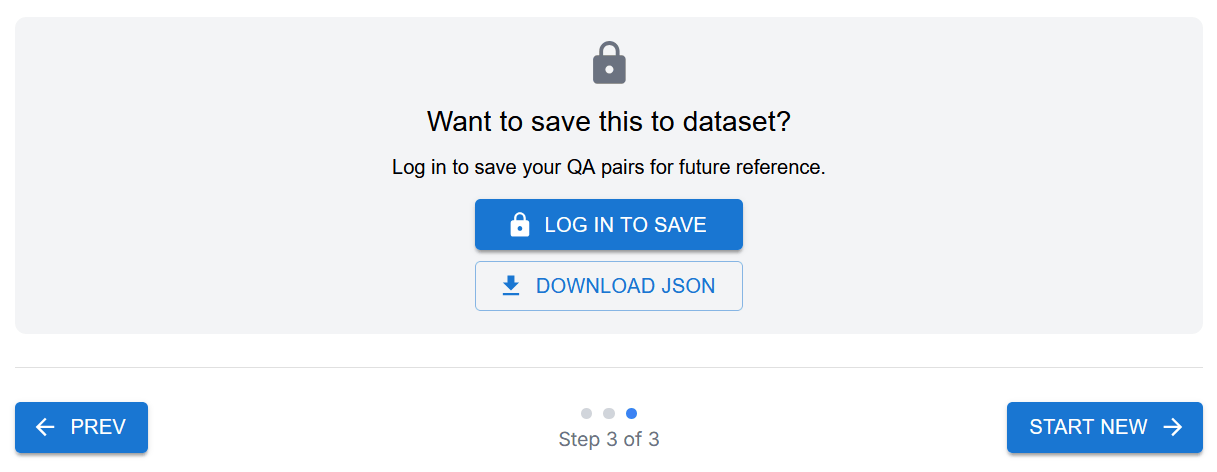
🔼 This figure shows the interface for creating an answer for a question. The user selects the answer type (in this case, single choice), inputs the correct answer, and then specifies which part(s) of the previously established context are relevant to justifying the answer. This step ensures traceability and reproducibility in the dataset.
read the caption
Figure 28: Example answer creation (1)
Full paper#


