TL;DR#
Large language models (LLMs) often generate outputs misaligned with human preferences, requiring retraining to adjust. Existing methods for real-time alignment have limitations, such as requiring iterative retraining that hinders swift adaptation. This is problematic since there is a growing need for LLMs that can quickly adapt to evolving data distributions and requirements.
This research proposes Test-Time Preference Optimization (TPO) to address these issues. TPO aligns LLMs with human preferences during inference, without retraining. It achieves this by translating reward signals into textual critiques, which are iteratively used to refine LLM responses. Evaluations demonstrate that TPO progressively improves alignment, surpassing even aligned counterparts after just a few iterations. TPO proves scalable and offers a practical alternative to traditional methods.
Key Takeaways#
Why does it matter?#
This paper is important for researchers because it introduces a novel and efficient method for aligning large language models (LLMs) with human preferences during inference. This addresses the limitation of existing methods that require time-consuming retraining. The proposed technique, Test-time Preference Optimization (TPO), is particularly relevant given the increasing demand for adaptable and quickly deployable LLMs across various applications. TPO opens new avenues for research in test-time optimization and could significantly impact the development and deployment of more versatile LLMs.
Visual Insights#

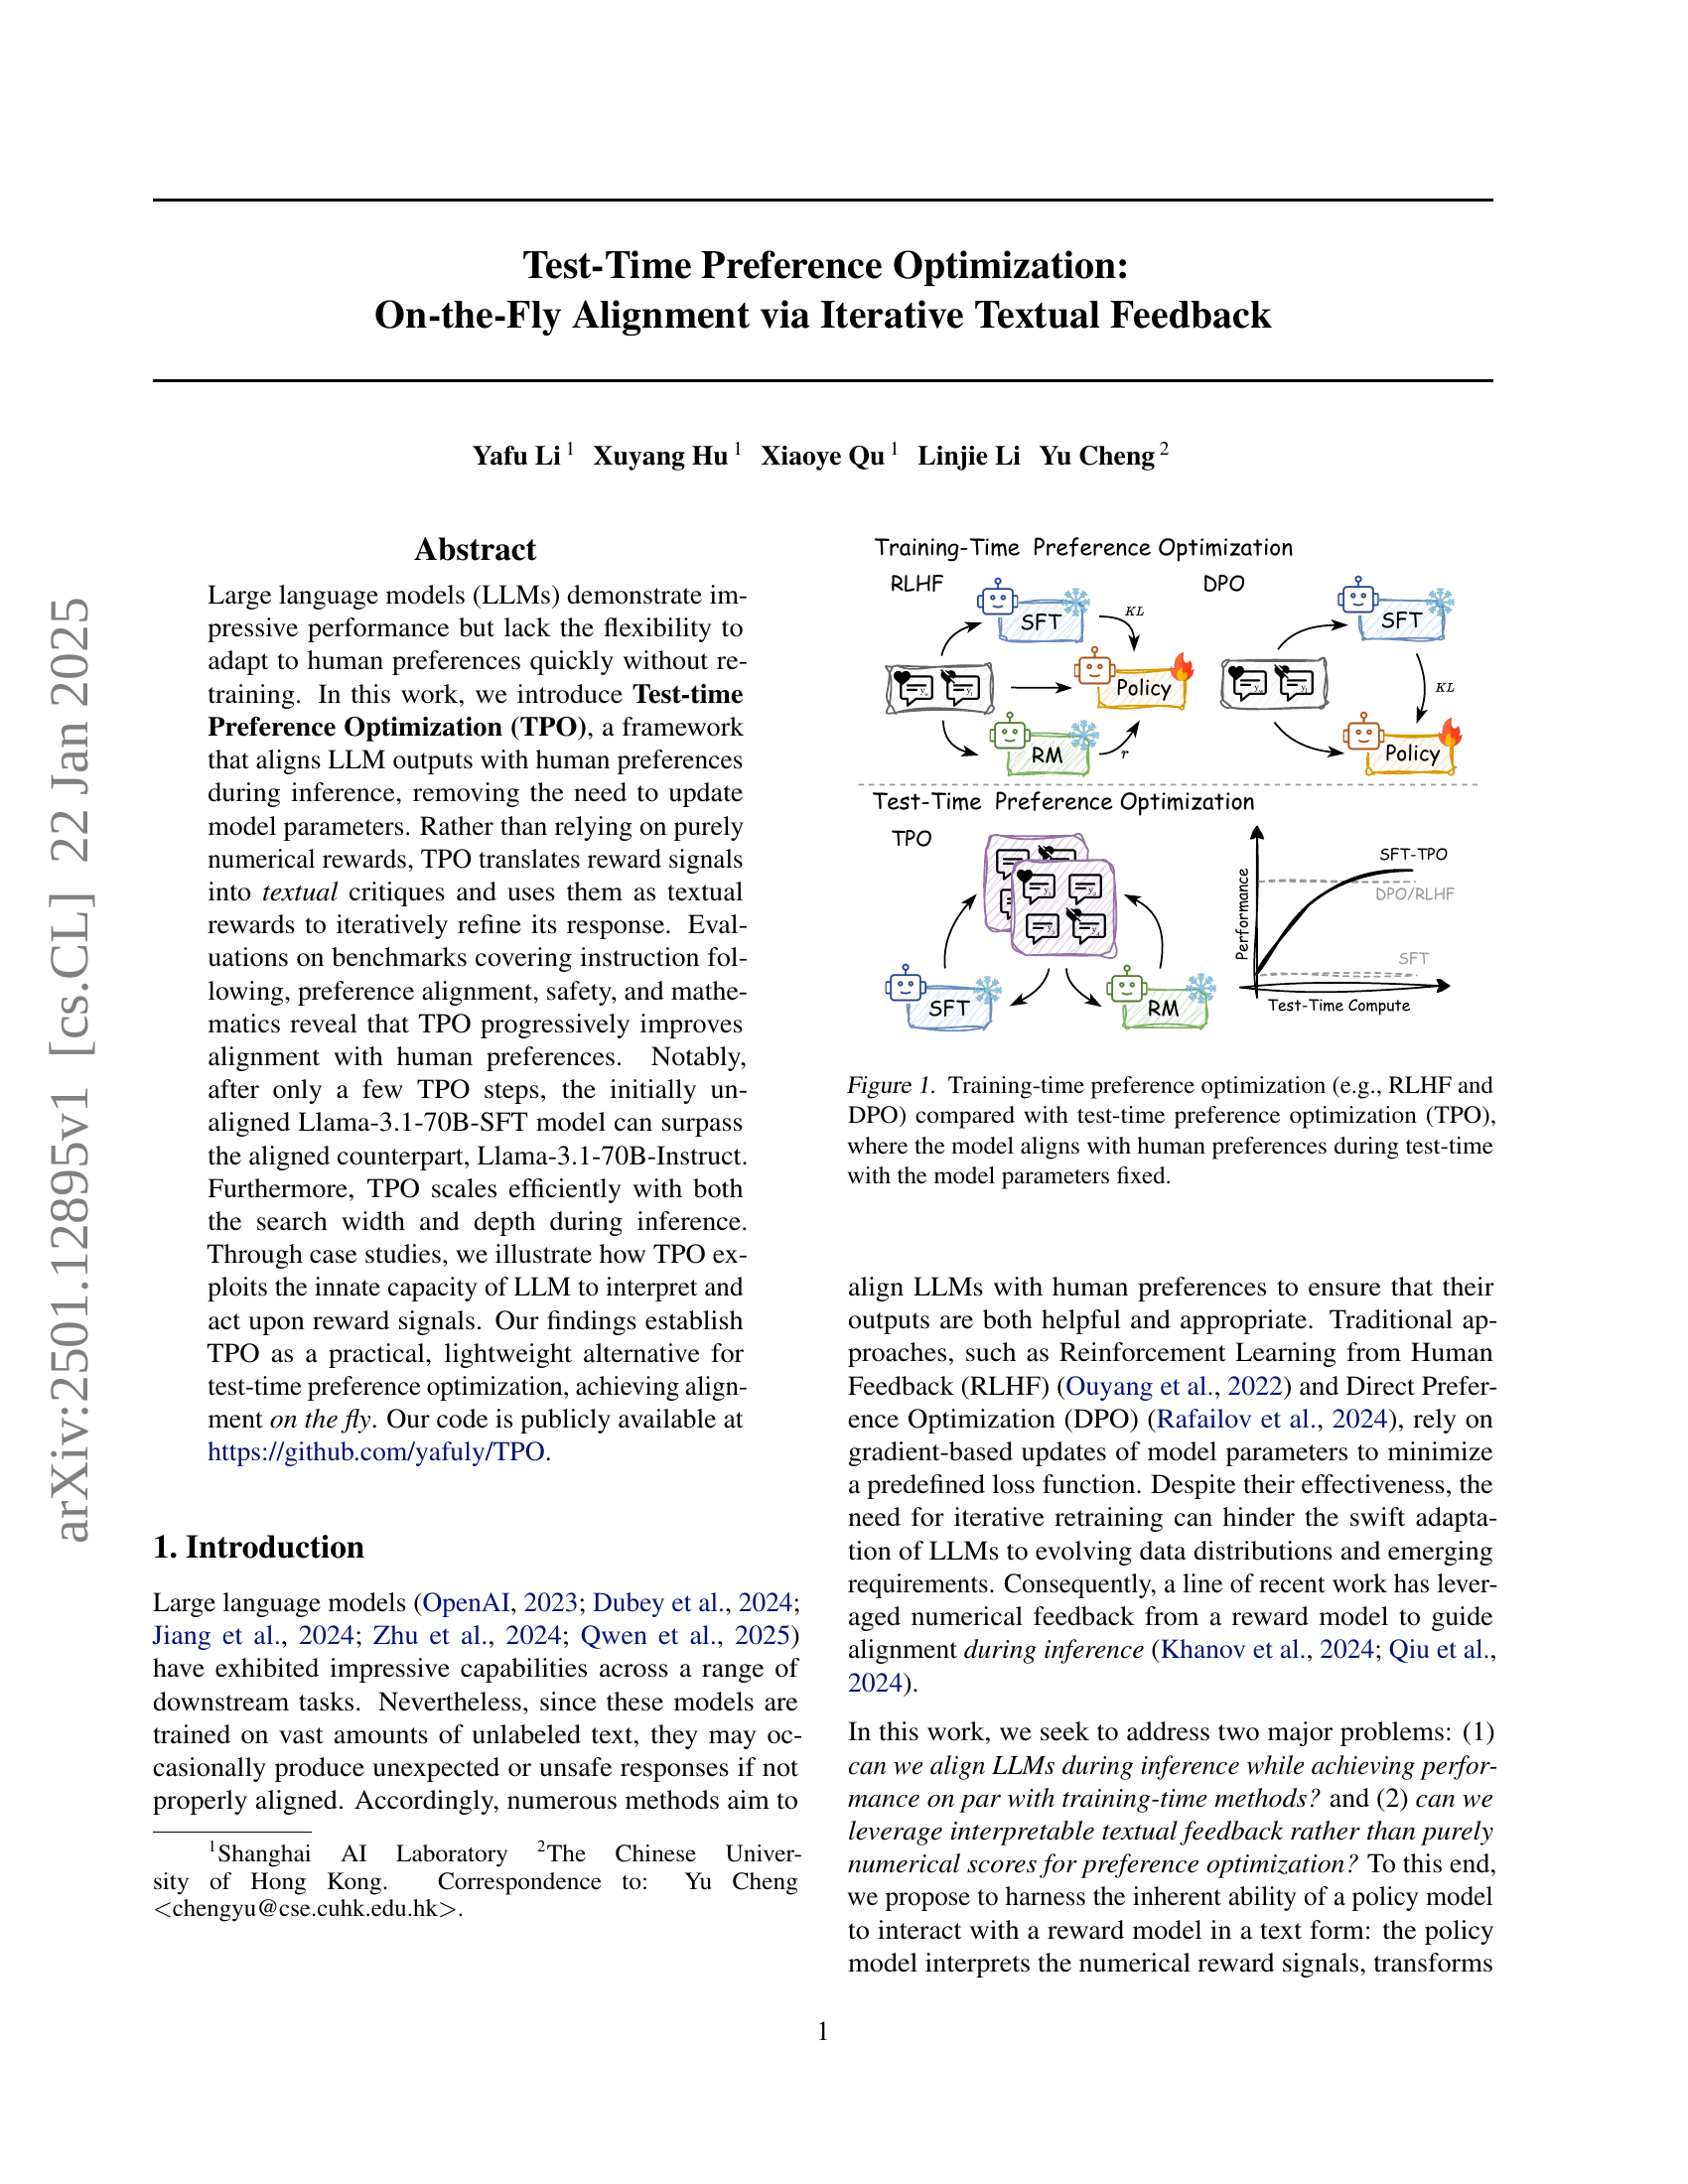
🔼 This figure compares and contrasts training-time and test-time preference optimization methods for large language models (LLMs). Training-time methods, such as Reinforcement Learning from Human Feedback (RLHF) and Direct Preference Optimization (DPO), involve updating the model’s parameters during training to align its outputs with human preferences. This requires iterative retraining and is computationally expensive. In contrast, test-time preference optimization (TPO), introduced in this paper, aligns the LLM’s output with human preferences during inference without changing the model parameters. It achieves this by iteratively refining the LLM’s response based on textual feedback from a reward model. The figure visually represents the key differences in the process and computational cost between these two approaches.
read the caption
Figure 1: Training-time preference optimization (e.g., RLHF and DPO) compared with test-time preference optimization (TPO), where the model aligns with human preferences during test-time with the model parameters fixed.
| Model | AlpacaEval 2 | Arena-Hard | HH-RLHF | BeaverTails | XSTest | MATH-500 | |
|---|---|---|---|---|---|---|---|
| LC(%) | WR(%) | ||||||
| Llama-3.1-70B-DPO | 32.3 | 23.1 | 50.4 | -2.8 | -6.7 | 89.8 | 63.4 |
| Llama-3.1-70B-Instruct | 36.9 | 34.9 | 59.0 | -0.5 | -6.4 | 88.7 | 66.4 |
| \hdashline Llama-3.1-70B-SFT | 27.8 | 16.8 | 44.1 | -4.1 | -7.2 | 87.8 | 61.8 |
| w/ TPO (D2-N5) | 33.2 | 39.5 | 70.5 | 0.1 | -4.1 | 89.8 | 70.0 |
| w/ TPO (D2-N5) | 33.0 | 40.5 | 69.7 | -0.6 | -4.8 | 90.4 | 71.2 |
| w/ TPO (D5-N20) | 37.8 | 55.7 | 77.5 | 0.4 | -4.1 | 89.6 | 71.8 |
🔼 Table 1 presents a comparison of the performance of an unaligned language model (Llama-3.1-70B-SFT) on several benchmark tasks, before and after applying Test-Time Preference Optimization (TPO). It also includes the performance of two training-time aligned baselines (Llama-3.1-70B-DPO and Llama-3.1-70B-Instruct) for comparison. The results show the improvements gained by using TPO in terms of win rates and length-controlled win rates across different tasks and benchmark datasets. The table highlights the best and second-best performances achieved for each metric and shows results for both the default TPO settings (2 iterations, 5 samples) and an ‘ultra’ setting (5 iterations, 20 samples) to demonstrate the scalability of TPO. Two different reward models were used for evaluation, denoted by ⋆ and †.
read the caption
Table 1: Benchmark performance of the unaligned model (Llama-3.1-70B-SFT) with TPO, compared against training-time aligned baselines (Llama-3.1-70B-DPO and Llama-3.1-70B-Instruct). The bold and underlined numbers indicate the best and second-best performances, respectively. By default, the maximum number of iterations D𝐷Ditalic_D is set to 2, and the number of samples N𝑁Nitalic_N is set to 5. To showcase the potential of TPO, we present an ultra setting, in which the number of iterations is increased to 5 and the number of samples to 20. ⋆⋆\star⋆ denotes the models optimized with TPO using the reward model FsfairX-LLaMA3-RM-v0.1, while ††\dagger† denotes Llama-3.1-Tulu-3-8B-RM.
In-depth insights#
Test-Time Alignment#
Test-time alignment presents a compelling paradigm shift in how we approach large language model (LLM) adaptation. Traditional methods heavily rely on pre-training and fine-tuning, processes that are computationally expensive and time-consuming. Test-time alignment offers a more efficient and flexible alternative by modifying model behavior during inference, without altering model parameters. This approach is particularly valuable when dealing with evolving data distributions or newly emerging requirements where retraining would be impractical. Key to success is leveraging the inherent reasoning and interpretation capabilities of LLMs to process feedback signals, which may be numerical rewards or more nuanced textual critiques. The iterative refinement inherent in many test-time alignment techniques facilitates progressive improvement and allows the model to adapt dynamically. Interpretability is often enhanced by using textual feedback, making the adaptation process more transparent and understandable. While the effectiveness varies depending on LLM architecture and the quality of feedback mechanisms, test-time alignment shows significant promise as a lightweight yet effective technique for on-the-fly model adaptation.
TPO Framework#
A hypothetical “TPO Framework” in a research paper would likely detail the architecture and operational mechanisms of Test-Time Preference Optimization. It would likely describe the iterative process, starting with initial response generation by the Language Model (LM). The framework would then explain how the LM interacts with a reward model, receiving numerical feedback that’s translated into interpretable textual critiques. These critiques act as textual gradients, guiding the LM to refine its response in subsequent iterations. Crucially, the framework should specify methods for choosing and rejecting responses, defining the loss function used to measure alignment with preferences, and describing how this iterative feedback loop converges towards an aligned output. It might also cover how the framework handles parameter optimization (or the lack thereof, as TPO works at inference time), addresses different optimization strategies, and discusses the computational efficiency of the process compared to conventional training-time methods. Finally, the framework’s effectiveness would be evaluated with respect to different LM models, tasks, and benchmarks, demonstrating the practical applicability of the TPO approach.
Iterative Refinement#
Iterative refinement, in the context of large language models (LLMs) and AI, signifies a process of repeated improvement through successive cycles of feedback and modification. Instead of a one-shot generation, iterative refinement approaches utilize an initial output as a starting point, obtaining feedback (either human-provided or from a secondary model), and then utilizing that feedback to generate revised and enhanced outputs. This process is often characterized by cyclical steps involving generation, evaluation, and modification, leading to incrementally better results. The effectiveness of iterative refinement hinges on high-quality feedback, enabling the model to learn from its mistakes and incorporate improvements directly. This method presents several advantages, including the potential for improved accuracy, coherence, and alignment with desired goals compared to single-pass methods. However, it also involves increased computational cost and complexity due to the multiple iterations required. Careful design of the feedback mechanism is crucial, as poorly designed feedback can lead to suboptimal results or even to the model becoming trapped in undesirable local optima.
Benchmark Results#
A dedicated ‘Benchmark Results’ section in a research paper would systematically evaluate the proposed method’s performance against existing state-of-the-art techniques. It should present quantitative results across multiple established benchmarks, demonstrating improvements in key metrics. A thoughtful analysis would highlight not only the performance gains but also their statistical significance, considering factors like variance and sample size. Crucially, the choice of benchmarks themselves is vital, reflecting the paper’s scope and addressing its specific contribution. The analysis should be paired with a qualitative discussion explaining any unexpected findings, limitations, or potential biases. Robust benchmarking builds credibility and showcases the practical applicability of the research. A well-written section would visually present the results (e.g., graphs, tables), enabling easy understanding and comparison of different models and approaches. Overall, the benchmark results section is key for demonstrating the practical impact and reliability of a new method, informing future research, and positioning the paper within the broader scientific community.
Future of TPO#
The future of Test-Time Preference Optimization (TPO) appears bright, given its potential to revolutionize how we align large language models (LLMs). Improved efficiency and scalability are key areas for future development. Current methods can be computationally expensive, and optimizing for speed and resource efficiency will be vital for broader adoption. Exploring more sophisticated reward models and reward functions will significantly enhance TPO’s ability to reflect nuanced human preferences. Further research into adapting TPO to different model architectures and deployment scenarios will expand its applicability. Enhanced interpretability of TPO’s internal processes would boost trust and enable deeper analysis of its effectiveness. Finally, combining TPO with other alignment techniques could unlock new synergistic improvements, leading to even more robust and reliable LLM alignment.
More visual insights#
More on figures

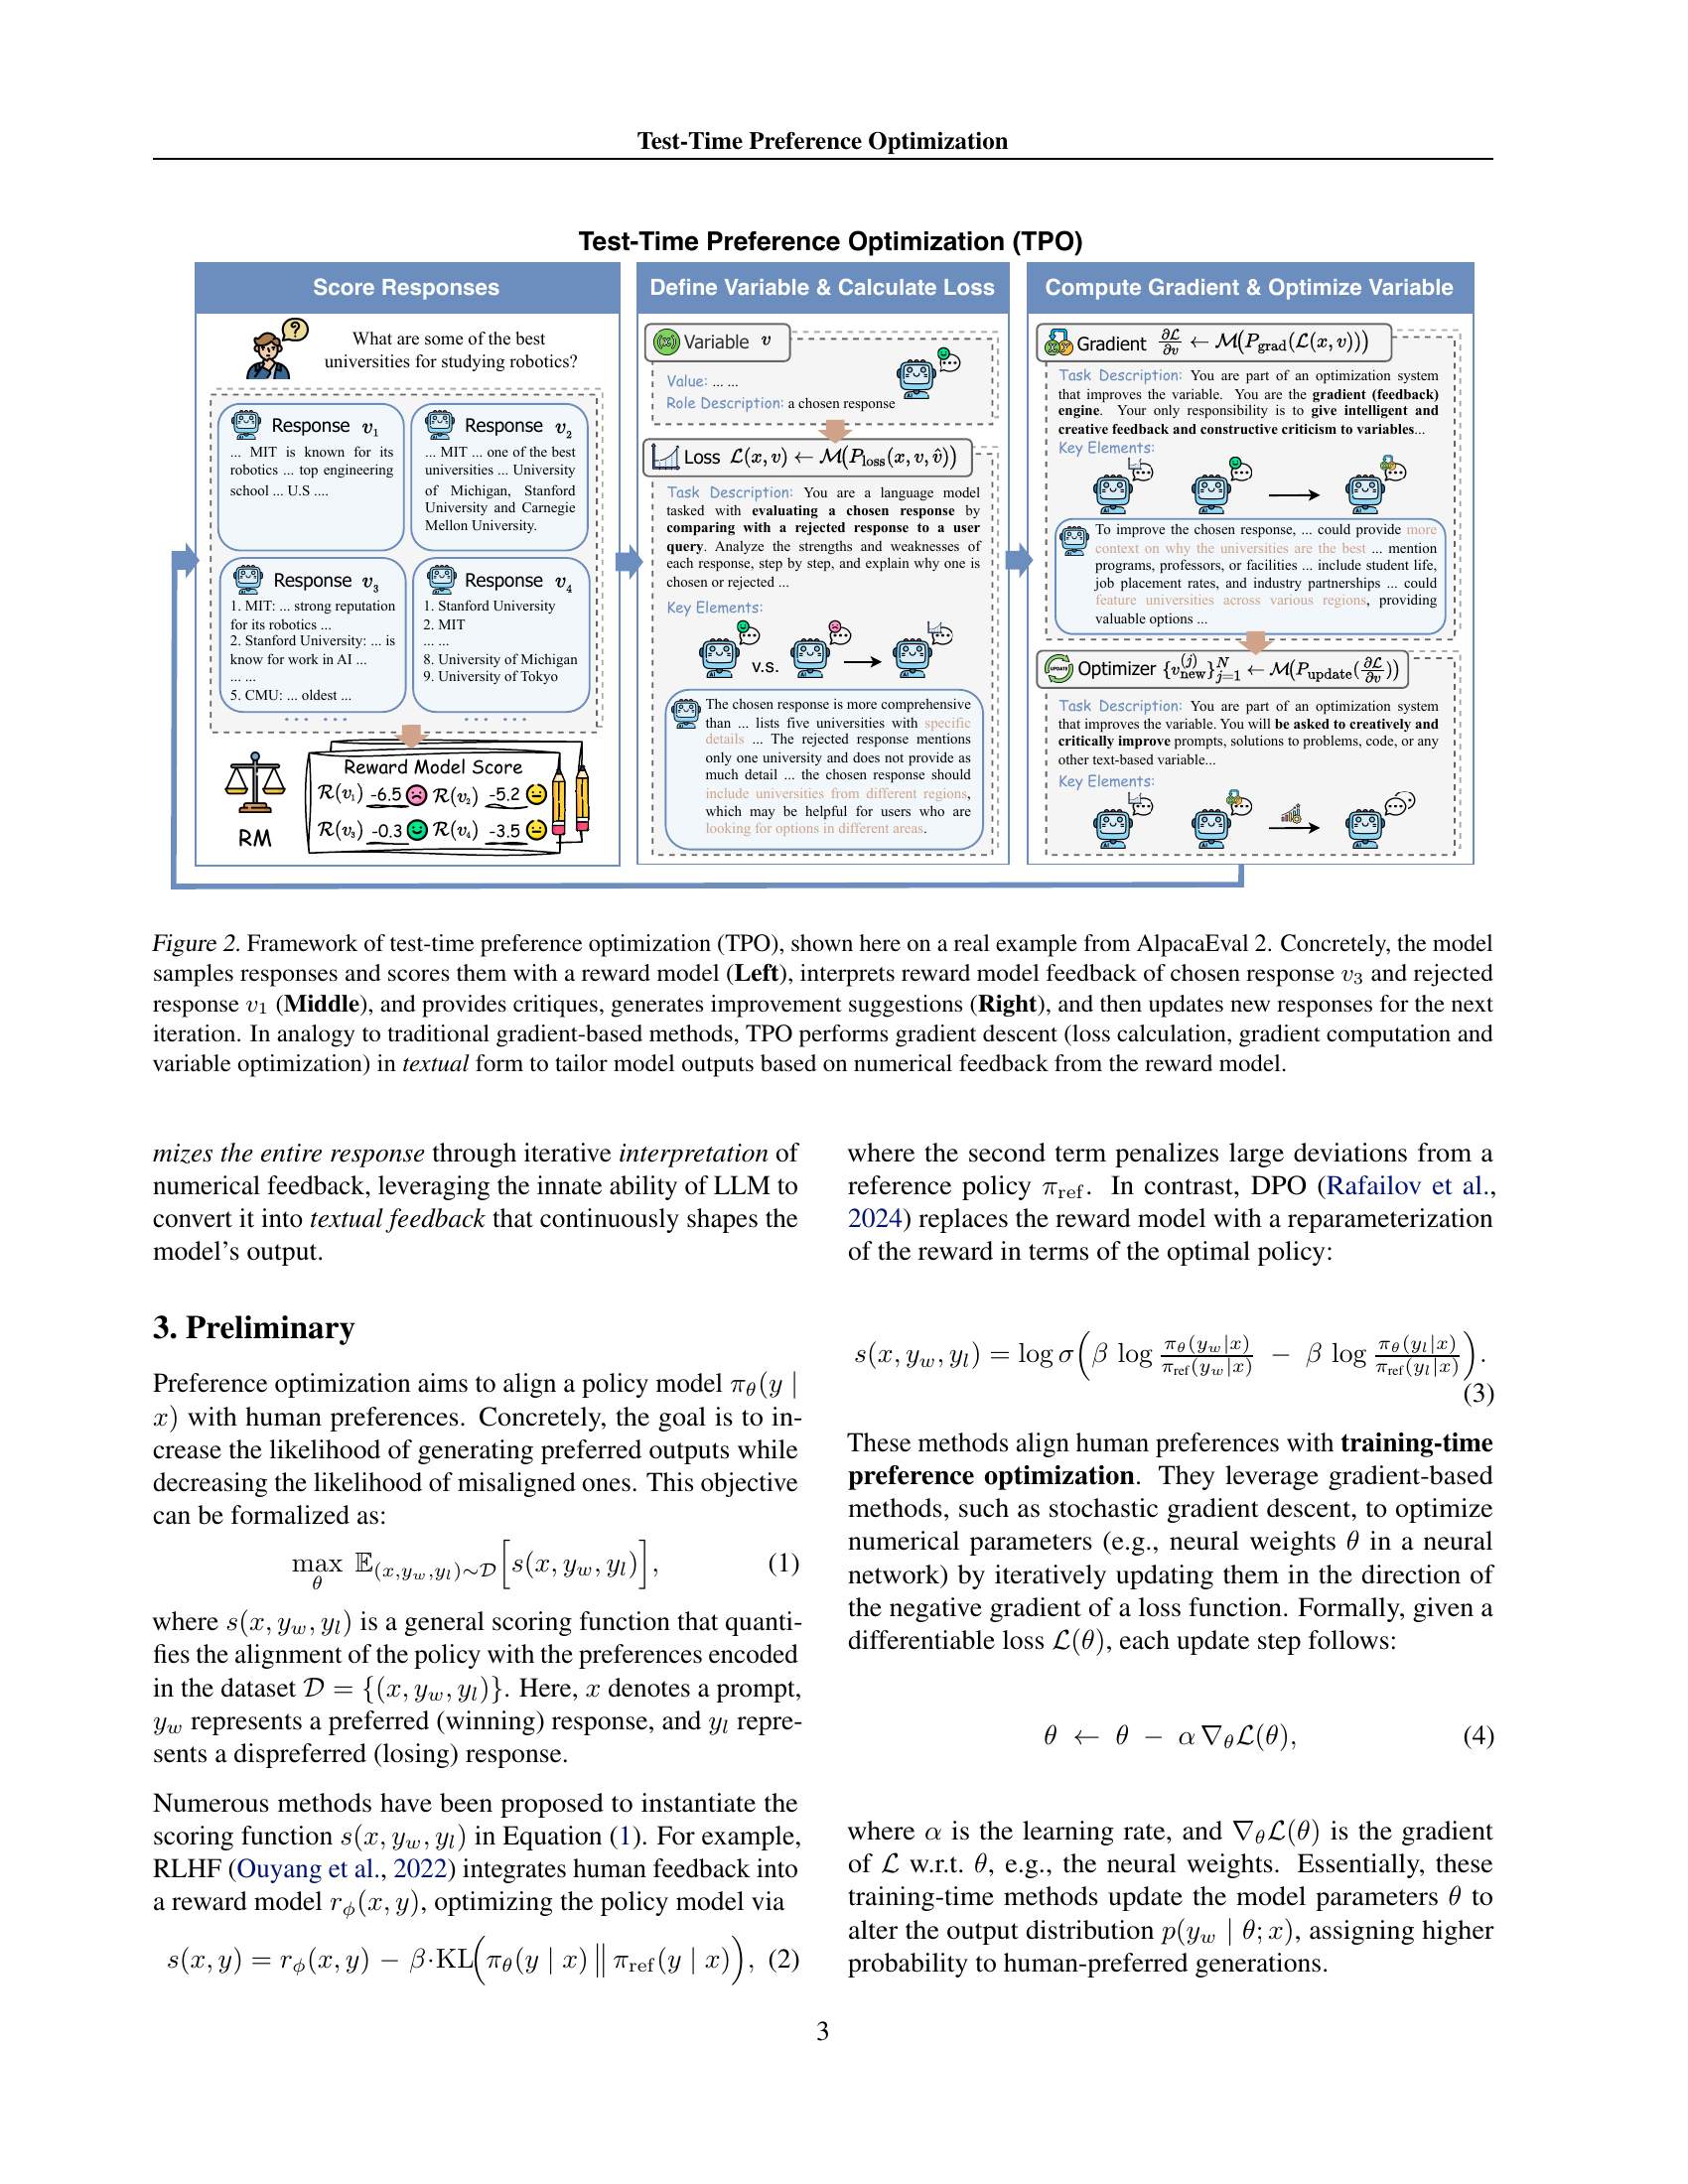
🔼 Figure 2 illustrates the Test-Time Preference Optimization (TPO) framework using an example from the AlpacaEval 2 benchmark. The process begins (left) with the model generating multiple responses and receiving scores from a reward model. The highest and lowest-scoring responses are selected for analysis (middle). The system analyzes these responses to identify strengths and weaknesses, translating this into textual feedback (critiques and suggestions). This feedback then guides the model in generating improved responses for the next iteration (right), similar to gradient descent in traditional machine learning, but operating entirely within a text-based format.
read the caption
Figure 2: Framework of test-time preference optimization (TPO), shown here on a real example from AlpacaEval 2. Concretely, the model samples responses and scores them with a reward model (Left), interprets reward model feedback of chosen response v3subscript𝑣3v_{3}italic_v start_POSTSUBSCRIPT 3 end_POSTSUBSCRIPT and rejected response v1subscript𝑣1v_{1}italic_v start_POSTSUBSCRIPT 1 end_POSTSUBSCRIPT (Middle), and provides critiques, generates improvement suggestions (Right), and then updates new responses for the next iteration. In analogy to traditional gradient-based methods, TPO performs gradient descent (loss calculation, gradient computation and variable optimization) in textual form to tailor model outputs based on numerical feedback from the reward model.

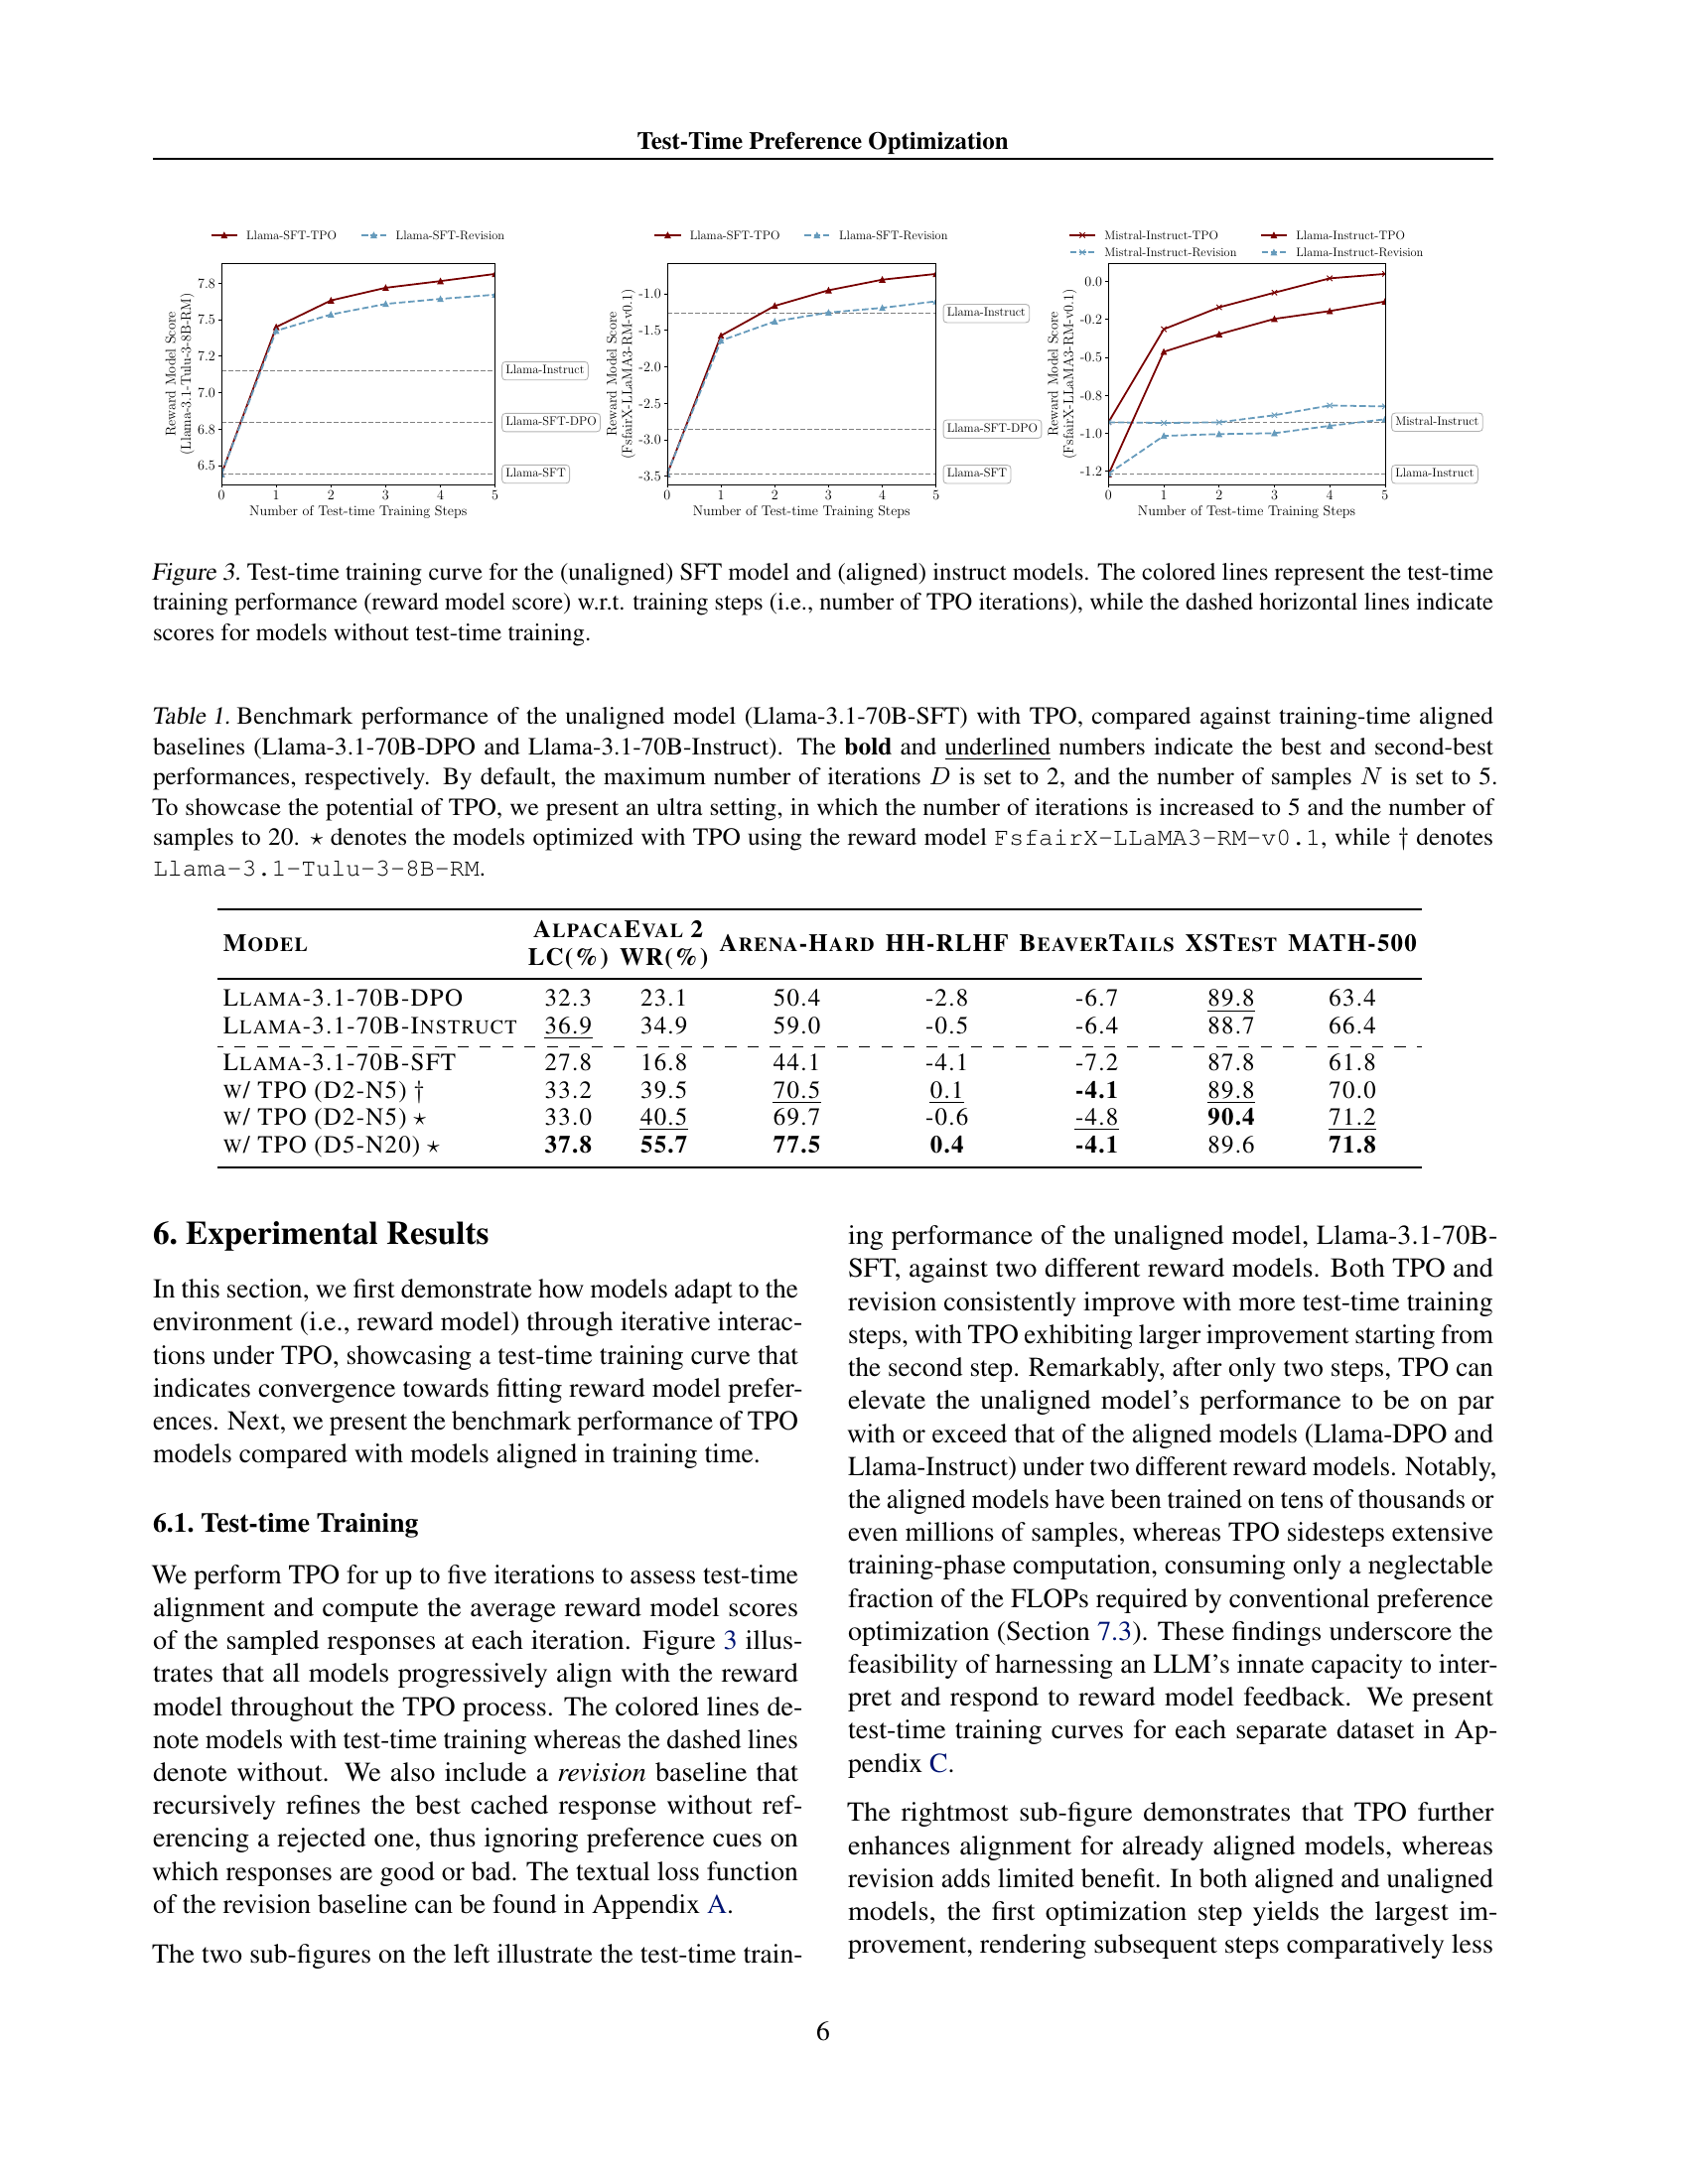
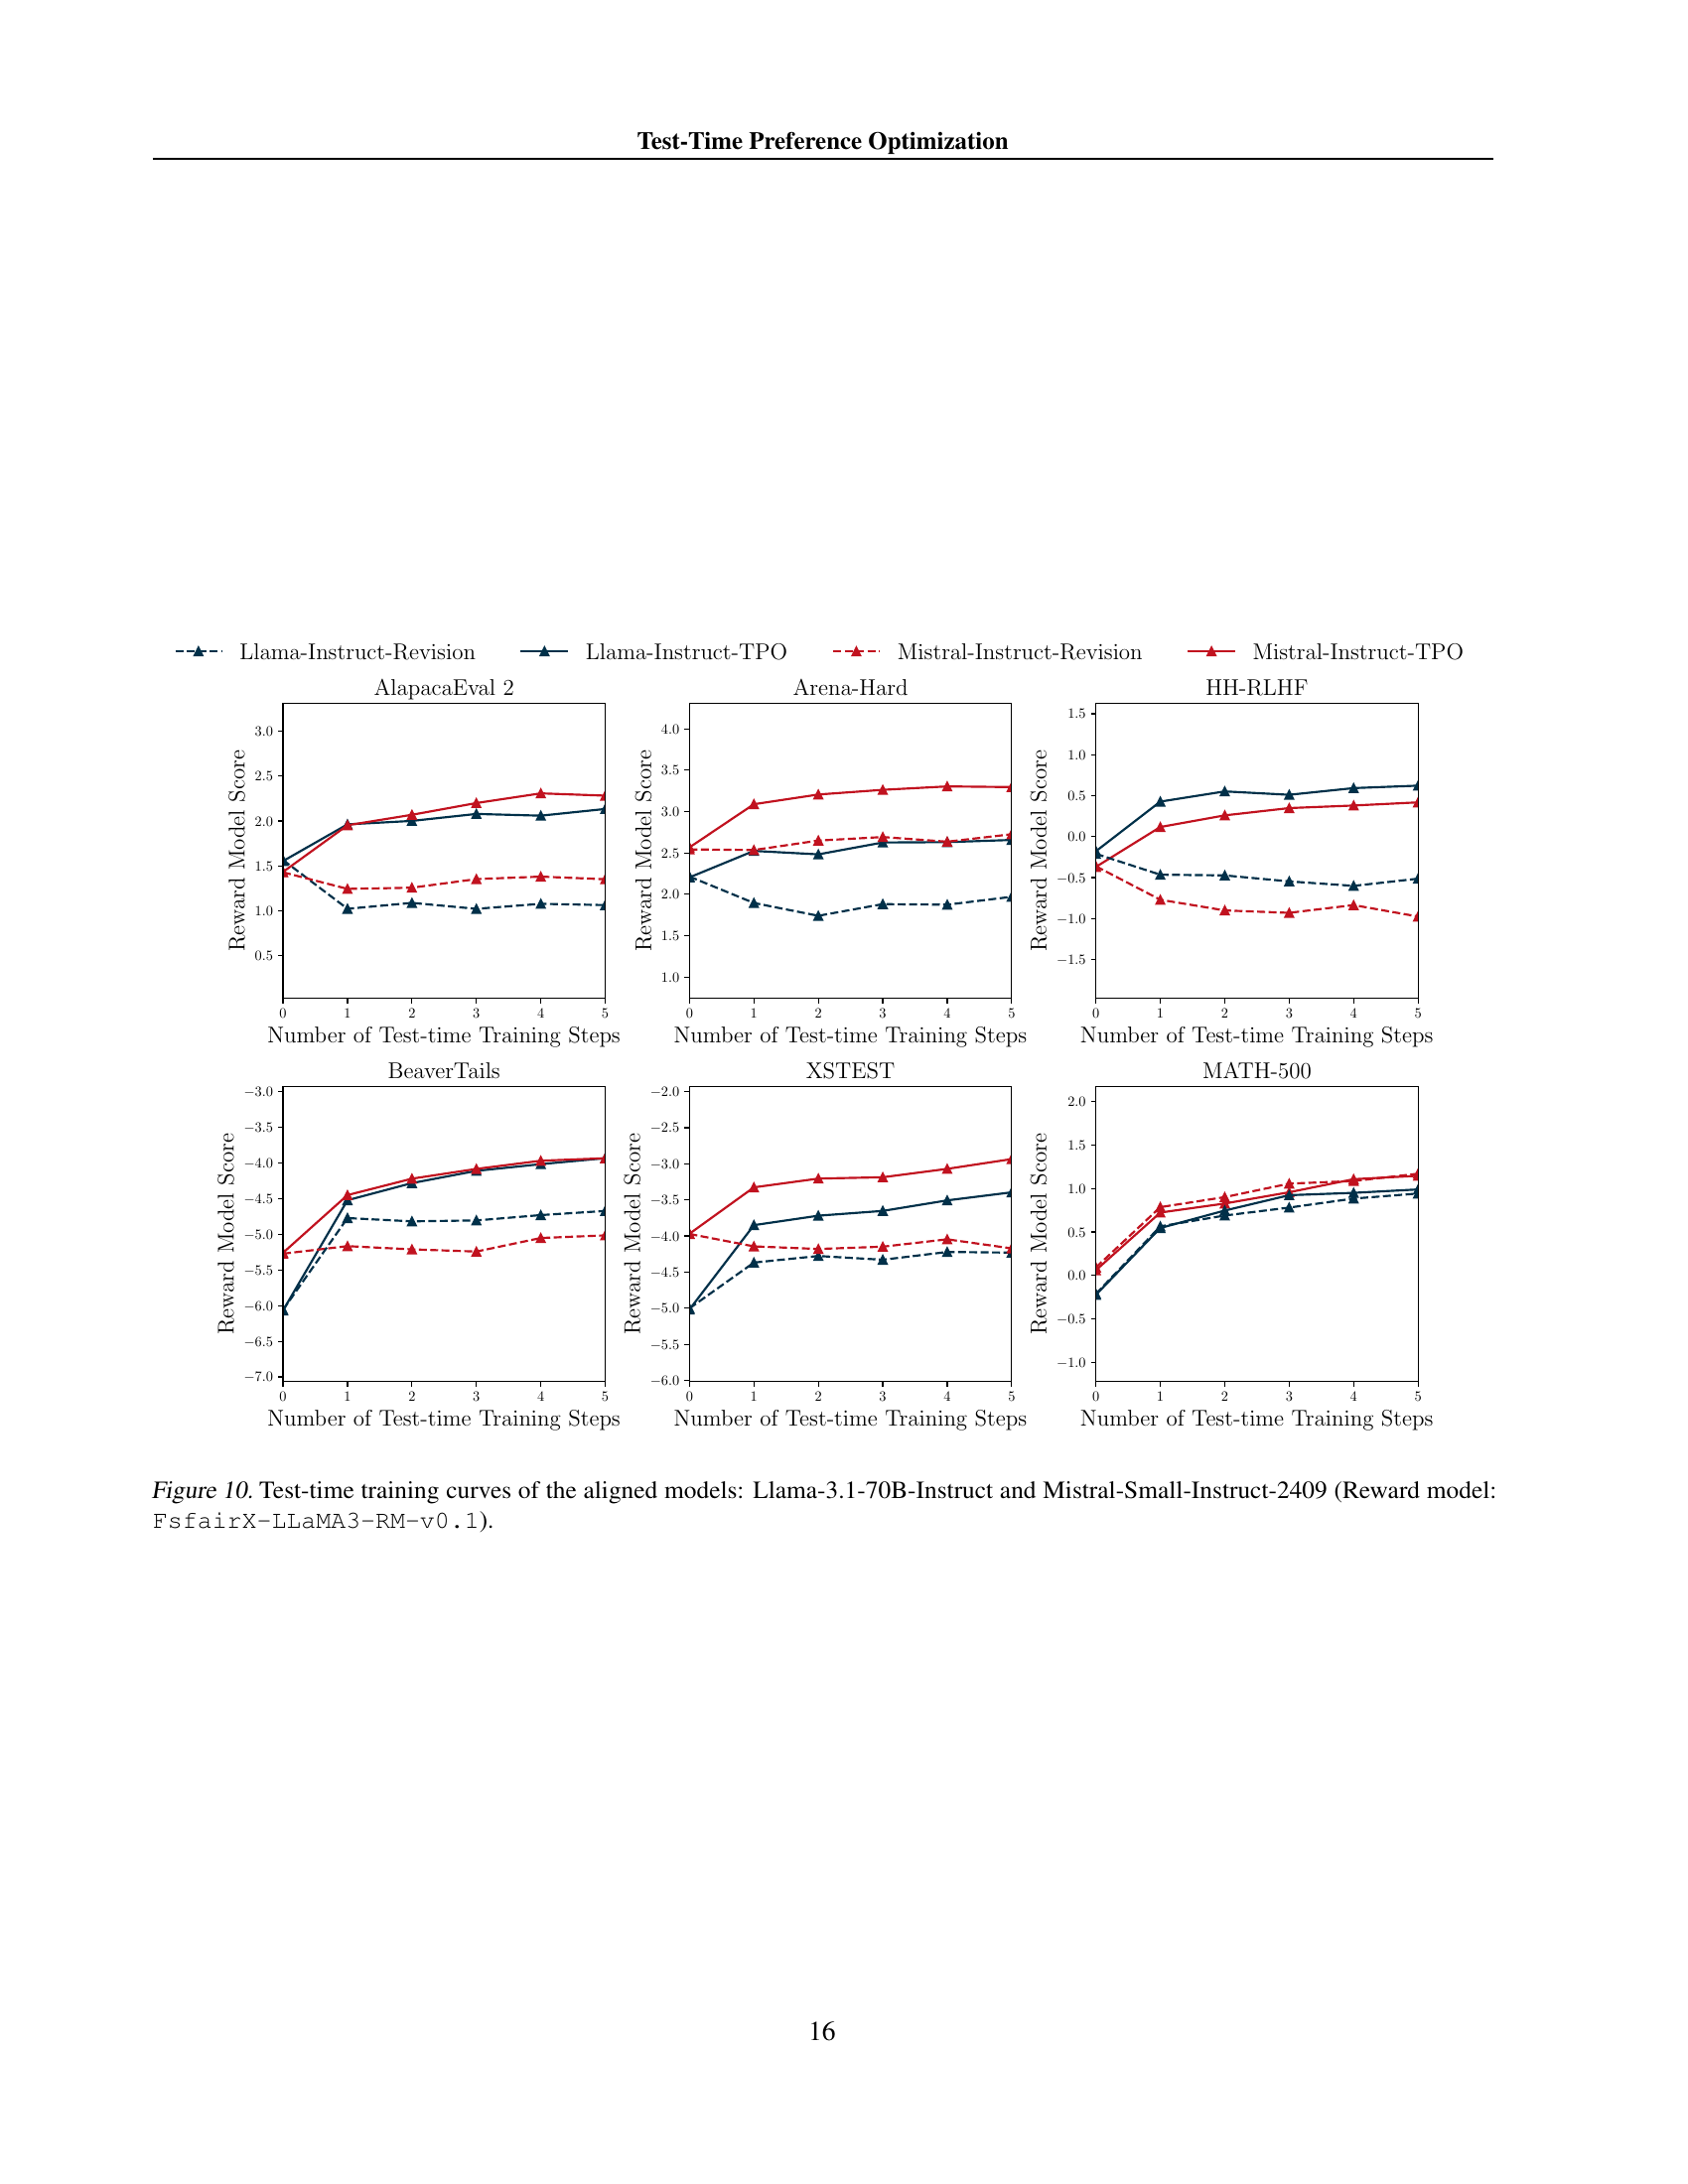
🔼 This figure displays the performance of different language models during test-time preference optimization (TPO). It shows the reward model score (a measure of how well the model aligns with human preferences) over the number of TPO iterations. The colored lines show models undergoing TPO, demonstrating how their alignment improves with each iteration. Dashed lines represent the initial scores of these models before TPO, providing a benchmark for comparison. The figure includes both unaligned (SFT) and aligned (Instruct) models, allowing for a direct comparison of how well TPO works on different model types.
read the caption
Figure 3: Test-time training curve for the (unaligned) SFT model and (aligned) instruct models. The colored lines represent the test-time training performance (reward model score) w.r.t. training steps (i.e., number of TPO iterations), while the dashed horizontal lines indicate scores for models without test-time training.

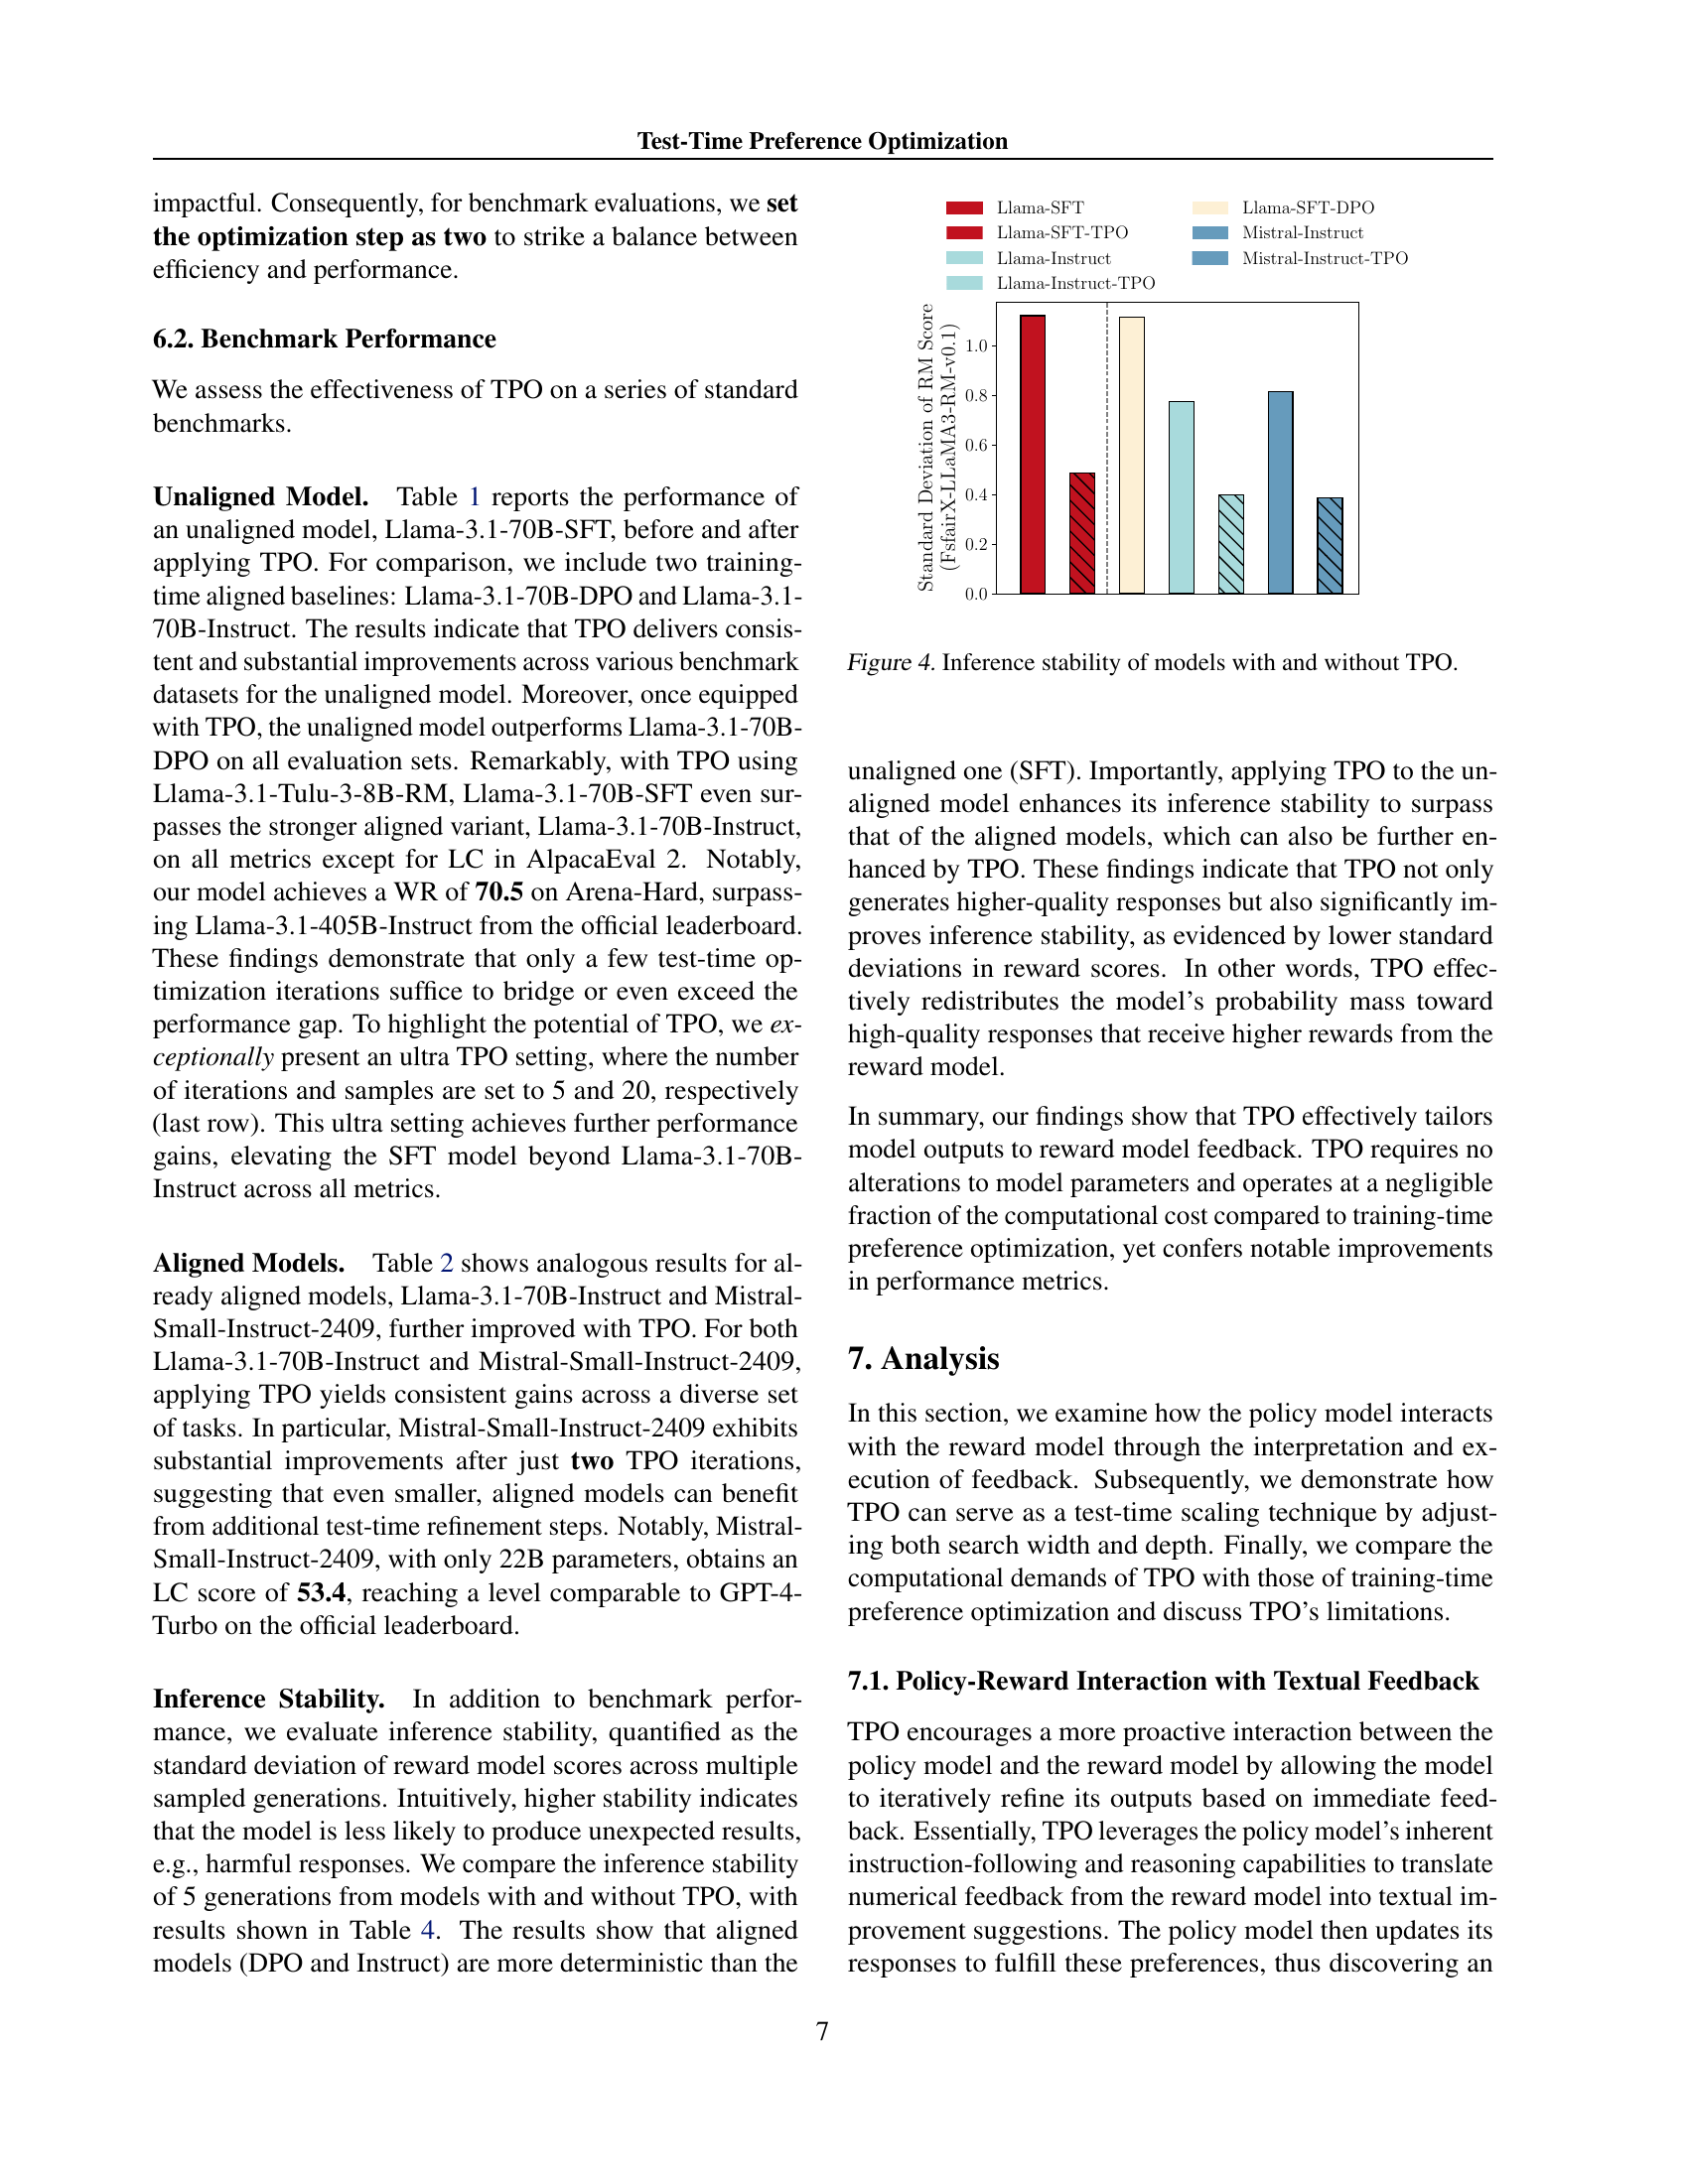
🔼 Figure 4 illustrates the impact of test-time preference optimization (TPO) on the stability of large language model (LLM) inferences. It compares the standard deviation of reward model scores across five generated outputs from LLMs with and without TPO applied. Lower standard deviation indicates higher stability and less susceptibility to producing unexpected or undesirable outputs. The figure showcases that applying TPO enhances the stability of an unaligned LLM, surpassing the stability levels of aligned LLMs. This is achieved by concentrating the probability mass toward high-quality outputs, leading to more deterministic behavior.
read the caption
Figure 4: Inference stability of models with and without TPO.

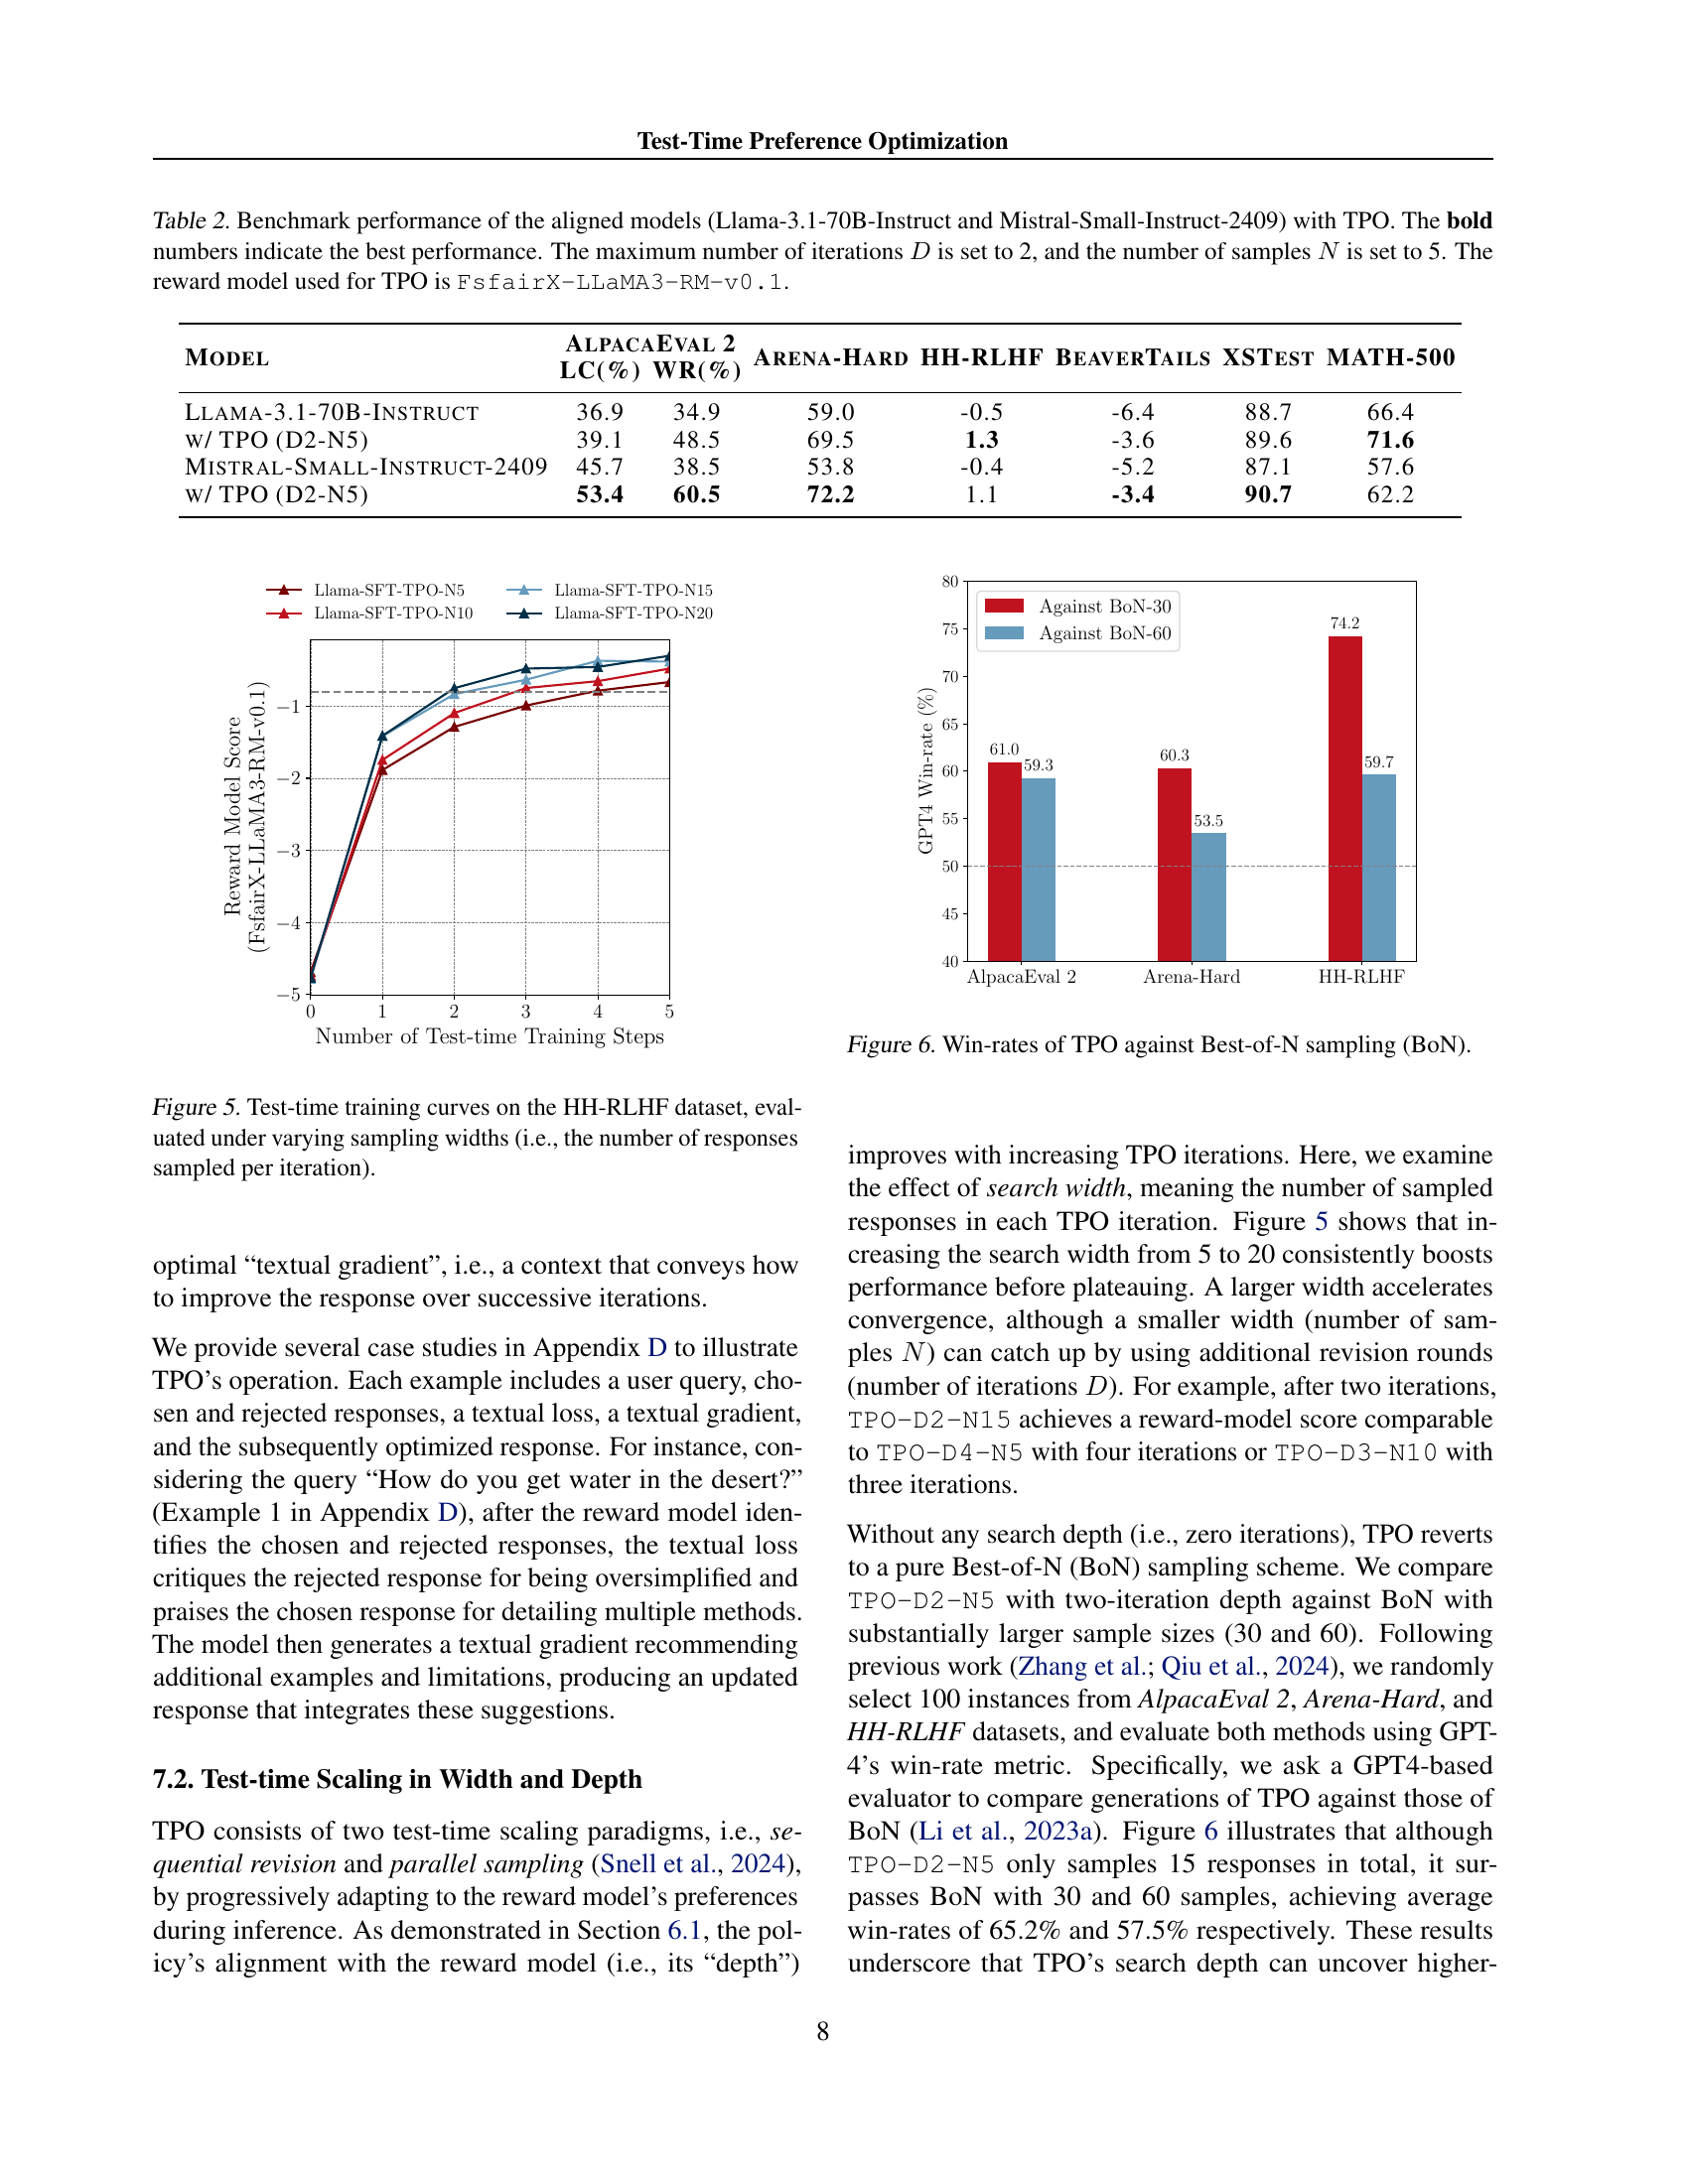
🔼 This figure shows the results of test-time training using the TPO method on the HH-RLHF dataset. The x-axis represents the number of test-time training steps (iterations of TPO), and the y-axis represents the average reward score obtained from the reward model. Multiple lines are plotted, each representing a different number of responses sampled per TPO iteration (sampling width). This illustrates how the alignment with the reward model changes depending on the number of responses considered at each step.
read the caption
Figure 5: Test-time training curves on the HH-RLHF dataset, evaluated under varying sampling widths (i.e., the number of responses sampled per iteration).

🔼 This figure compares the performance of Test-Time Preference Optimization (TPO) against the Best-of-N (BoN) sampling method on three benchmark datasets: AlpacaEval 2, Arena-Hard, and HH-RLHF. The bar chart shows win rates for both TPO and BoN with different sample sizes (BoN-30 and BoN-60). It demonstrates that even with a smaller number of total samples, the iterative refinement of TPO leads to a higher win rate compared to simply selecting the best response out of a larger number of candidates.
read the caption
Figure 6: Win-rates of TPO against Best-of-N sampling (BoN).

🔼 This figure displays the performance of the Llama-3.1-8B-Instruct model on the HH-RLHF dataset during test-time training. The test-time training involves iteratively refining the model’s output using the TPO method. The x-axis represents the number of TPO iterations, while the y-axis shows the reward model score, indicating the model’s alignment with human preferences. The red line shows that the Llama-3.1-8B-Instruct model fails to improve its alignment with the reward model during the test-time training process. The flat trend of the red line indicates that the test-time optimization does not bring any improvements on this model.
read the caption
Figure 7: Test-time training curve of Llama-3.1-8B-Instruct (red line) on the HH-RLHF dataset.

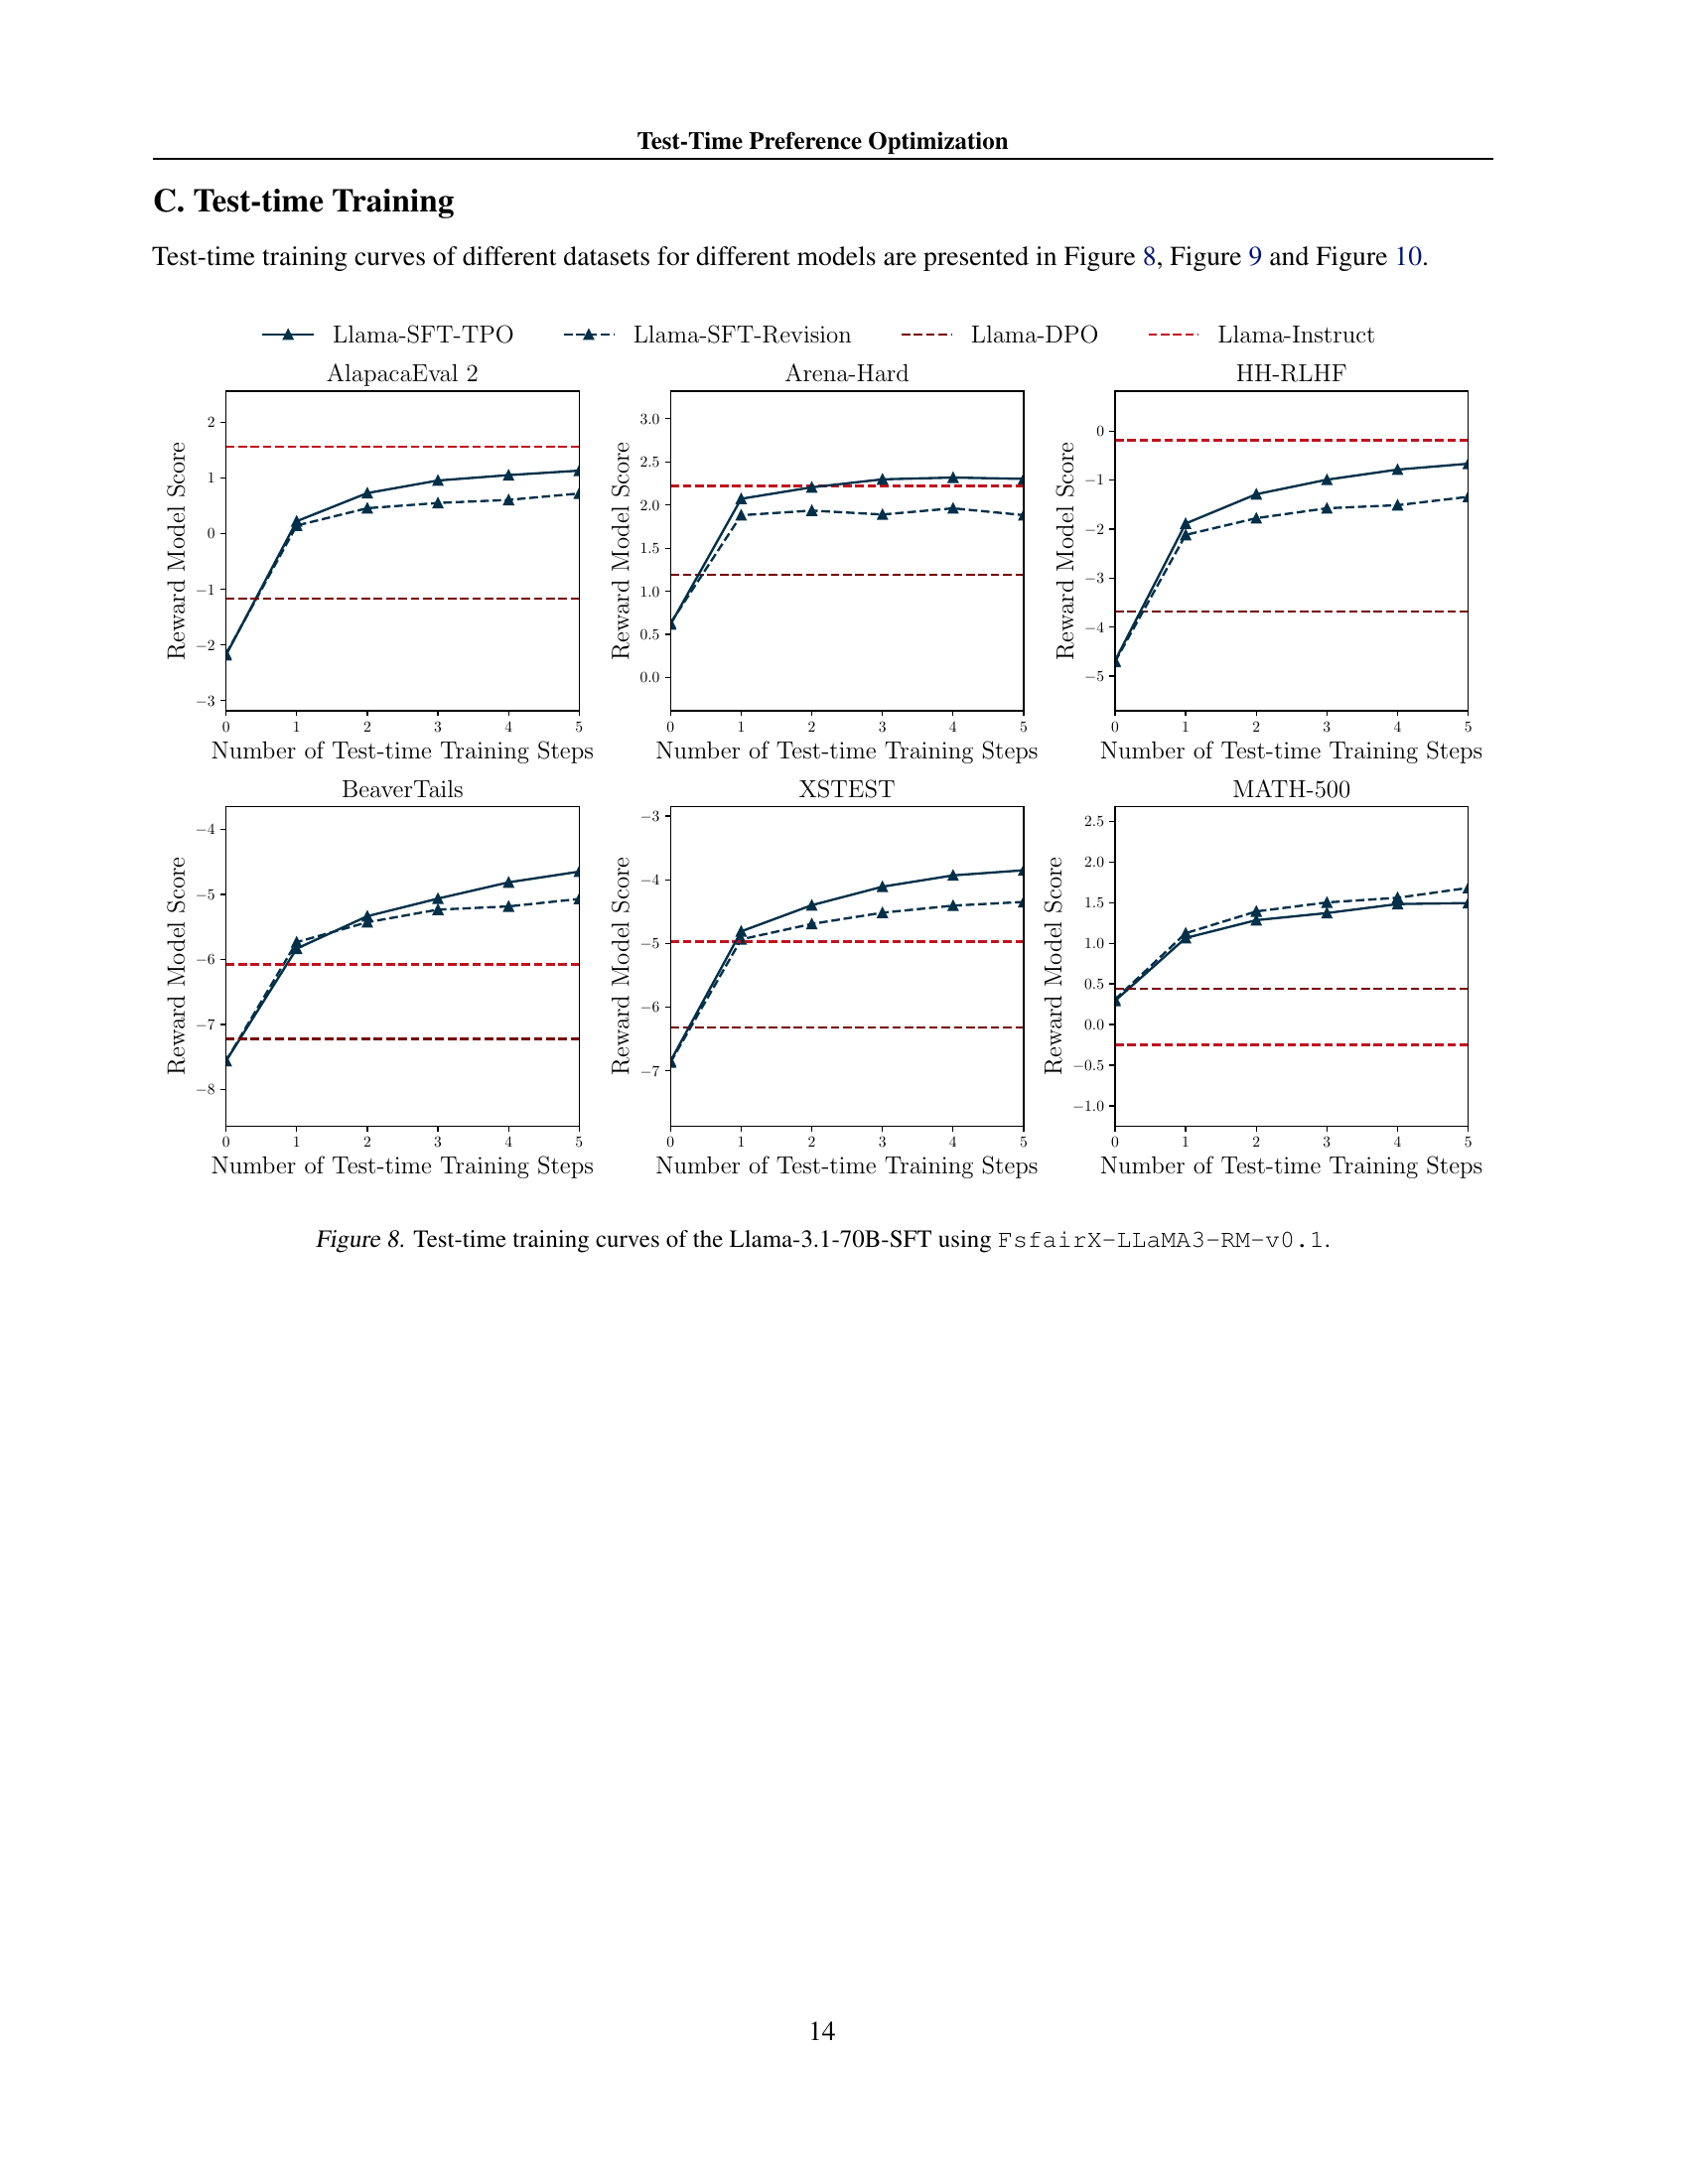
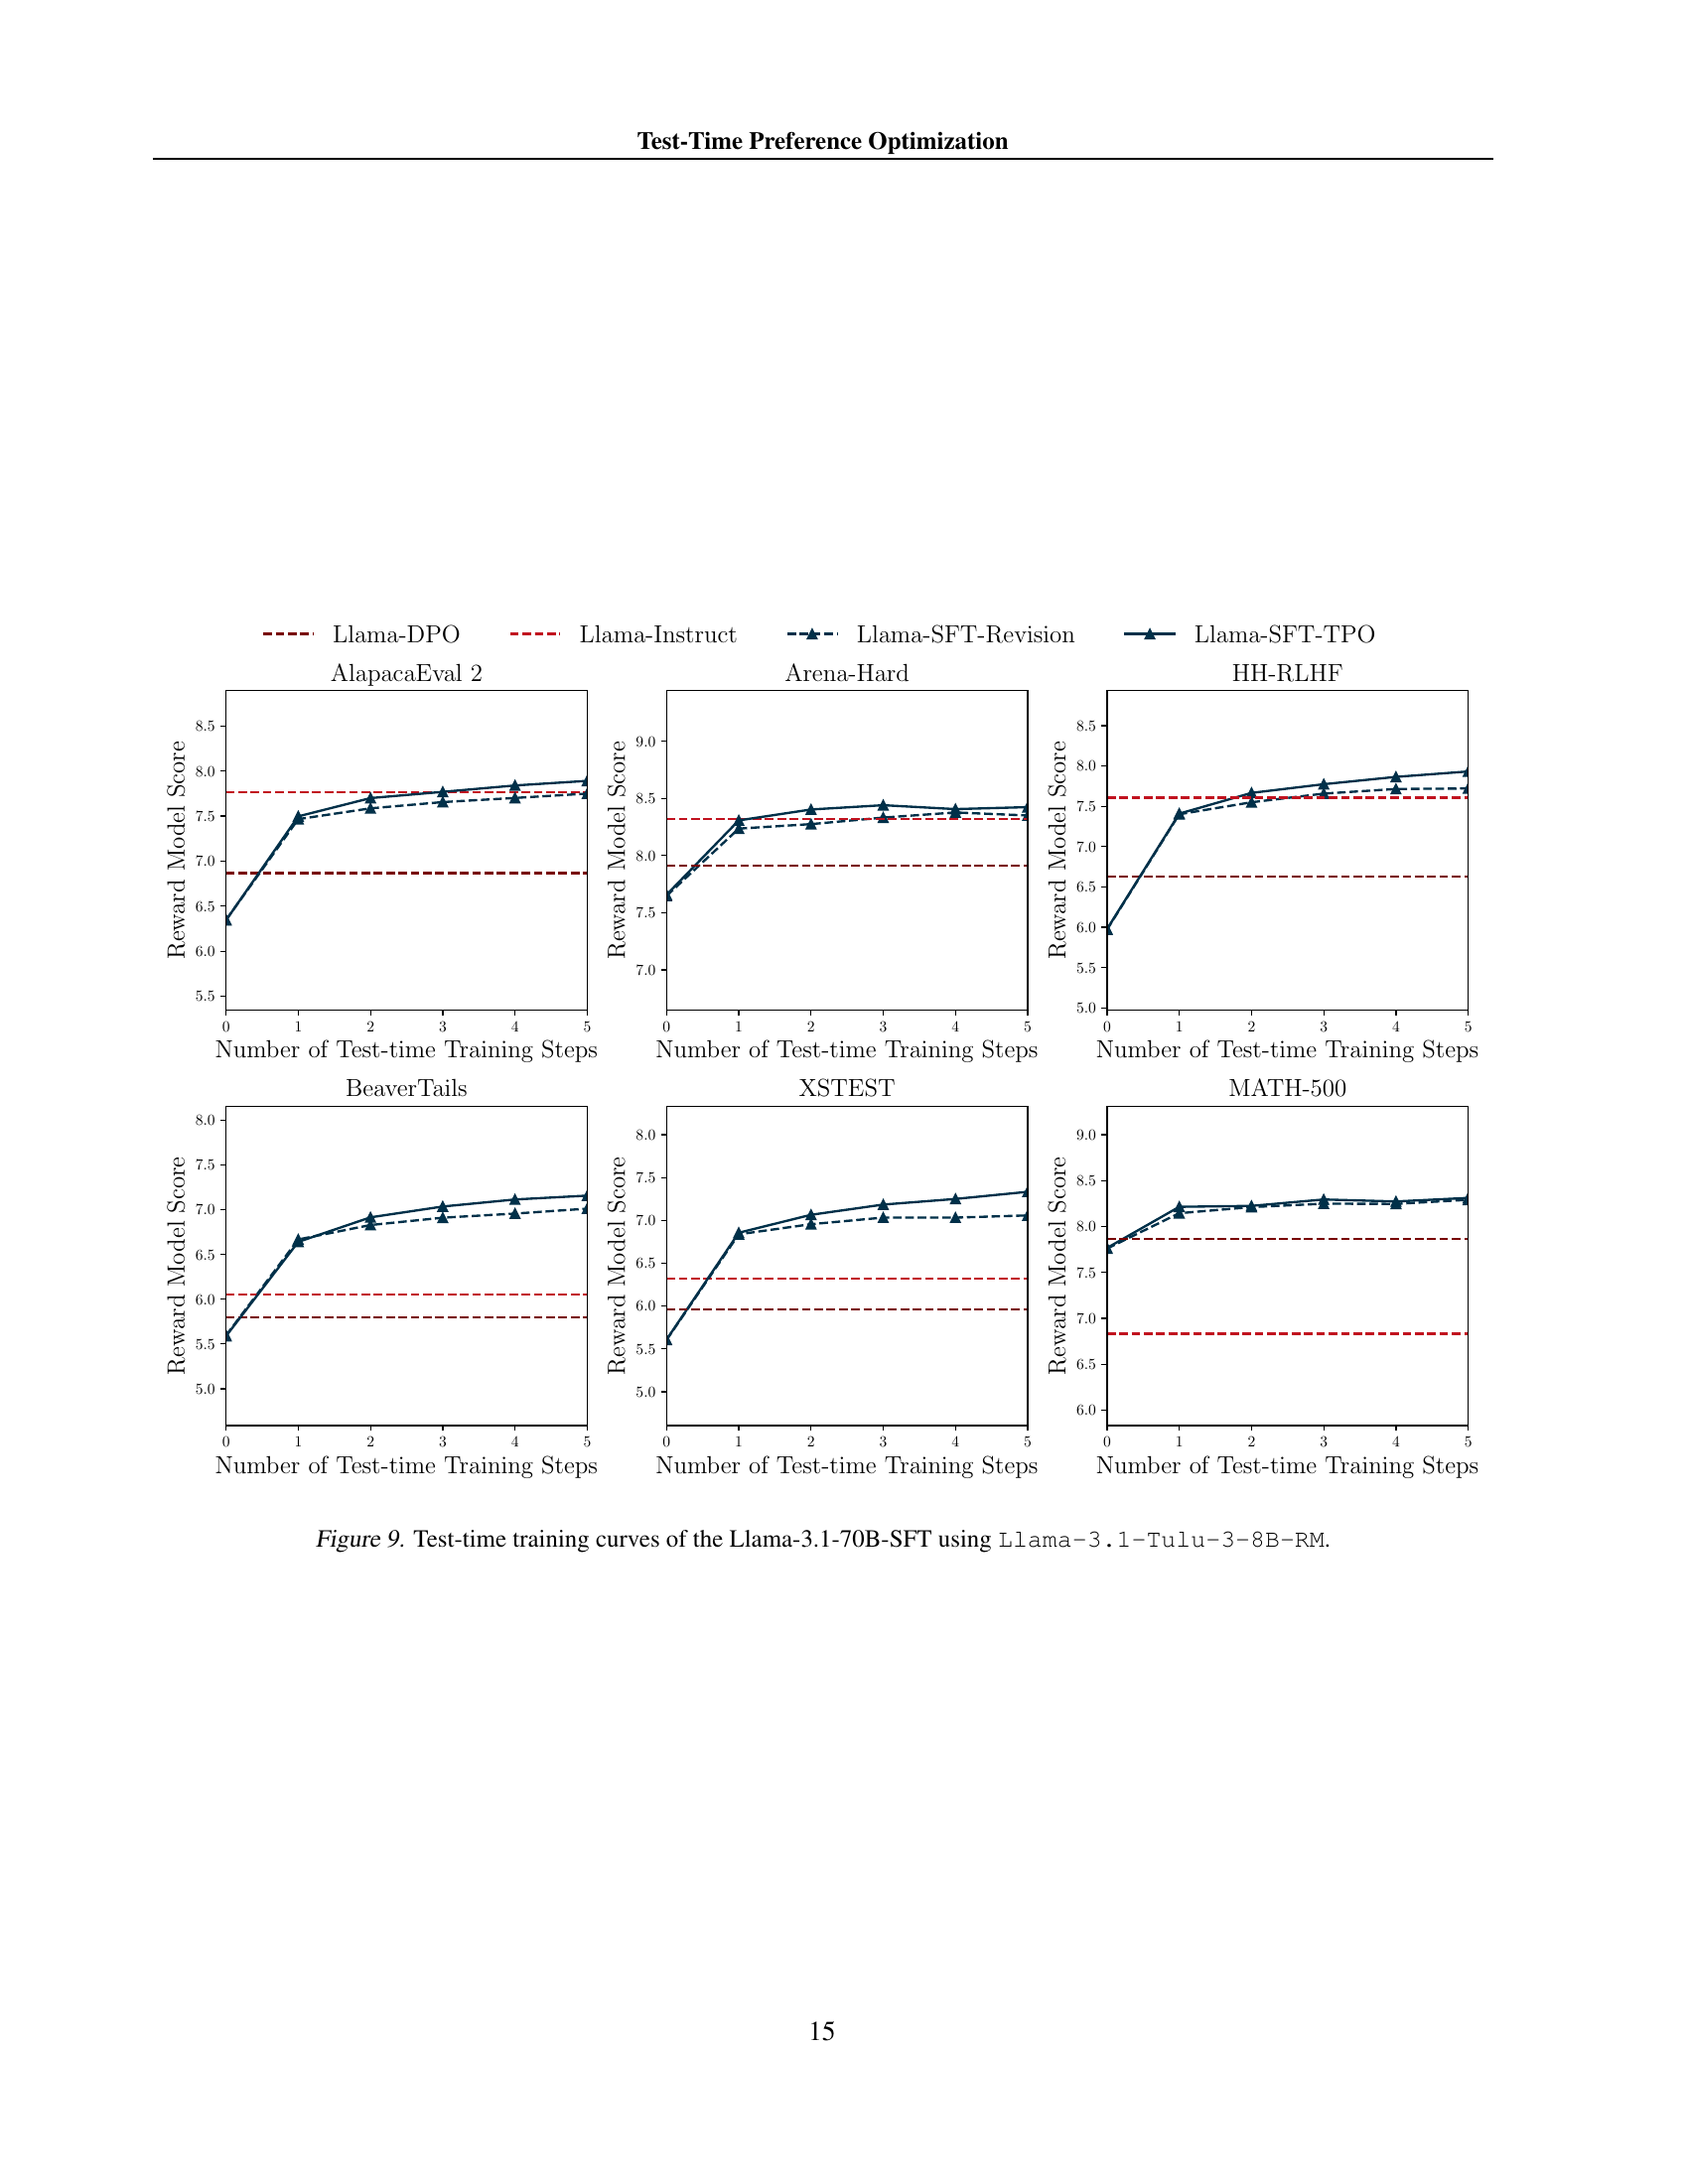
🔼 This figure displays the performance of the Llama-3.1-70B-SFT model over multiple iterations of test-time preference optimization (TPO) using FsfairX-LLaMA3-RM-v0.1 as the reward model. The x-axis represents the number of TPO steps, and the y-axis shows the reward model score. Separate plots are shown for different benchmark datasets: AlpacaEval 2, Arena-Hard, BeaverTails, XSTest, HH-RLHF, and MATH-500. The figure illustrates the progressive alignment of the model with the reward model’s preferences during the test-time optimization process. Dashed lines indicate the reward scores before test-time training.
read the caption
Figure 8: Test-time training curves of the Llama-3.1-70B-SFT using FsfairX-LLaMA3-RM-v0.1.
More on tables
| Model | AlpacaEval 2 | Arena-Hard | HH-RLHF | BeaverTails | XSTest | MATH-500 | |
|---|---|---|---|---|---|---|---|
| LC(%) | WR(%) | ||||||
| Llama-3.1-70B-Instruct | 36.9 | 34.9 | 59.0 | -0.5 | -6.4 | 88.7 | 66.4 |
| w/ TPO (D2-N5) | 39.1 | 48.5 | 69.5 | 1.3 | -3.6 | 89.6 | 71.6 |
| Mistral-Small-Instruct-2409 | 45.7 | 38.5 | 53.8 | -0.4 | -5.2 | 87.1 | 57.6 |
| w/ TPO (D2-N5) | 53.4 | 60.5 | 72.2 | 1.1 | -3.4 | 90.7 | 62.2 |
🔼 This table presents the results of benchmark evaluations performed on two pre-trained language models that have been fine-tuned using reinforcement learning techniques. The models are Llama-3.1-70B-Instruct and Mistral-Small-Instruct-2409. The benchmark evaluations assess performance on a variety of tasks after applying the Test-Time Preference Optimization (TPO) method. The table shows the performance metrics (e.g., win rate, accuracy score) for each model on different benchmarks, before and after applying TPO for two iterations with five samples per iteration. The FsfairX-LLaMA3-RM-v0.1 reward model is used. Bold numbers highlight the best performance for each benchmark.
read the caption
Table 2: Benchmark performance of the aligned models (Llama-3.1-70B-Instruct and Mistral-Small-Instruct-2409) with TPO. The bold numbers indicate the best performance. The maximum number of iterations D𝐷Ditalic_D is set to 2, and the number of samples N𝑁Nitalic_N is set to 5. The reward model used for TPO is FsfairX-LLaMA3-RM-v0.1.
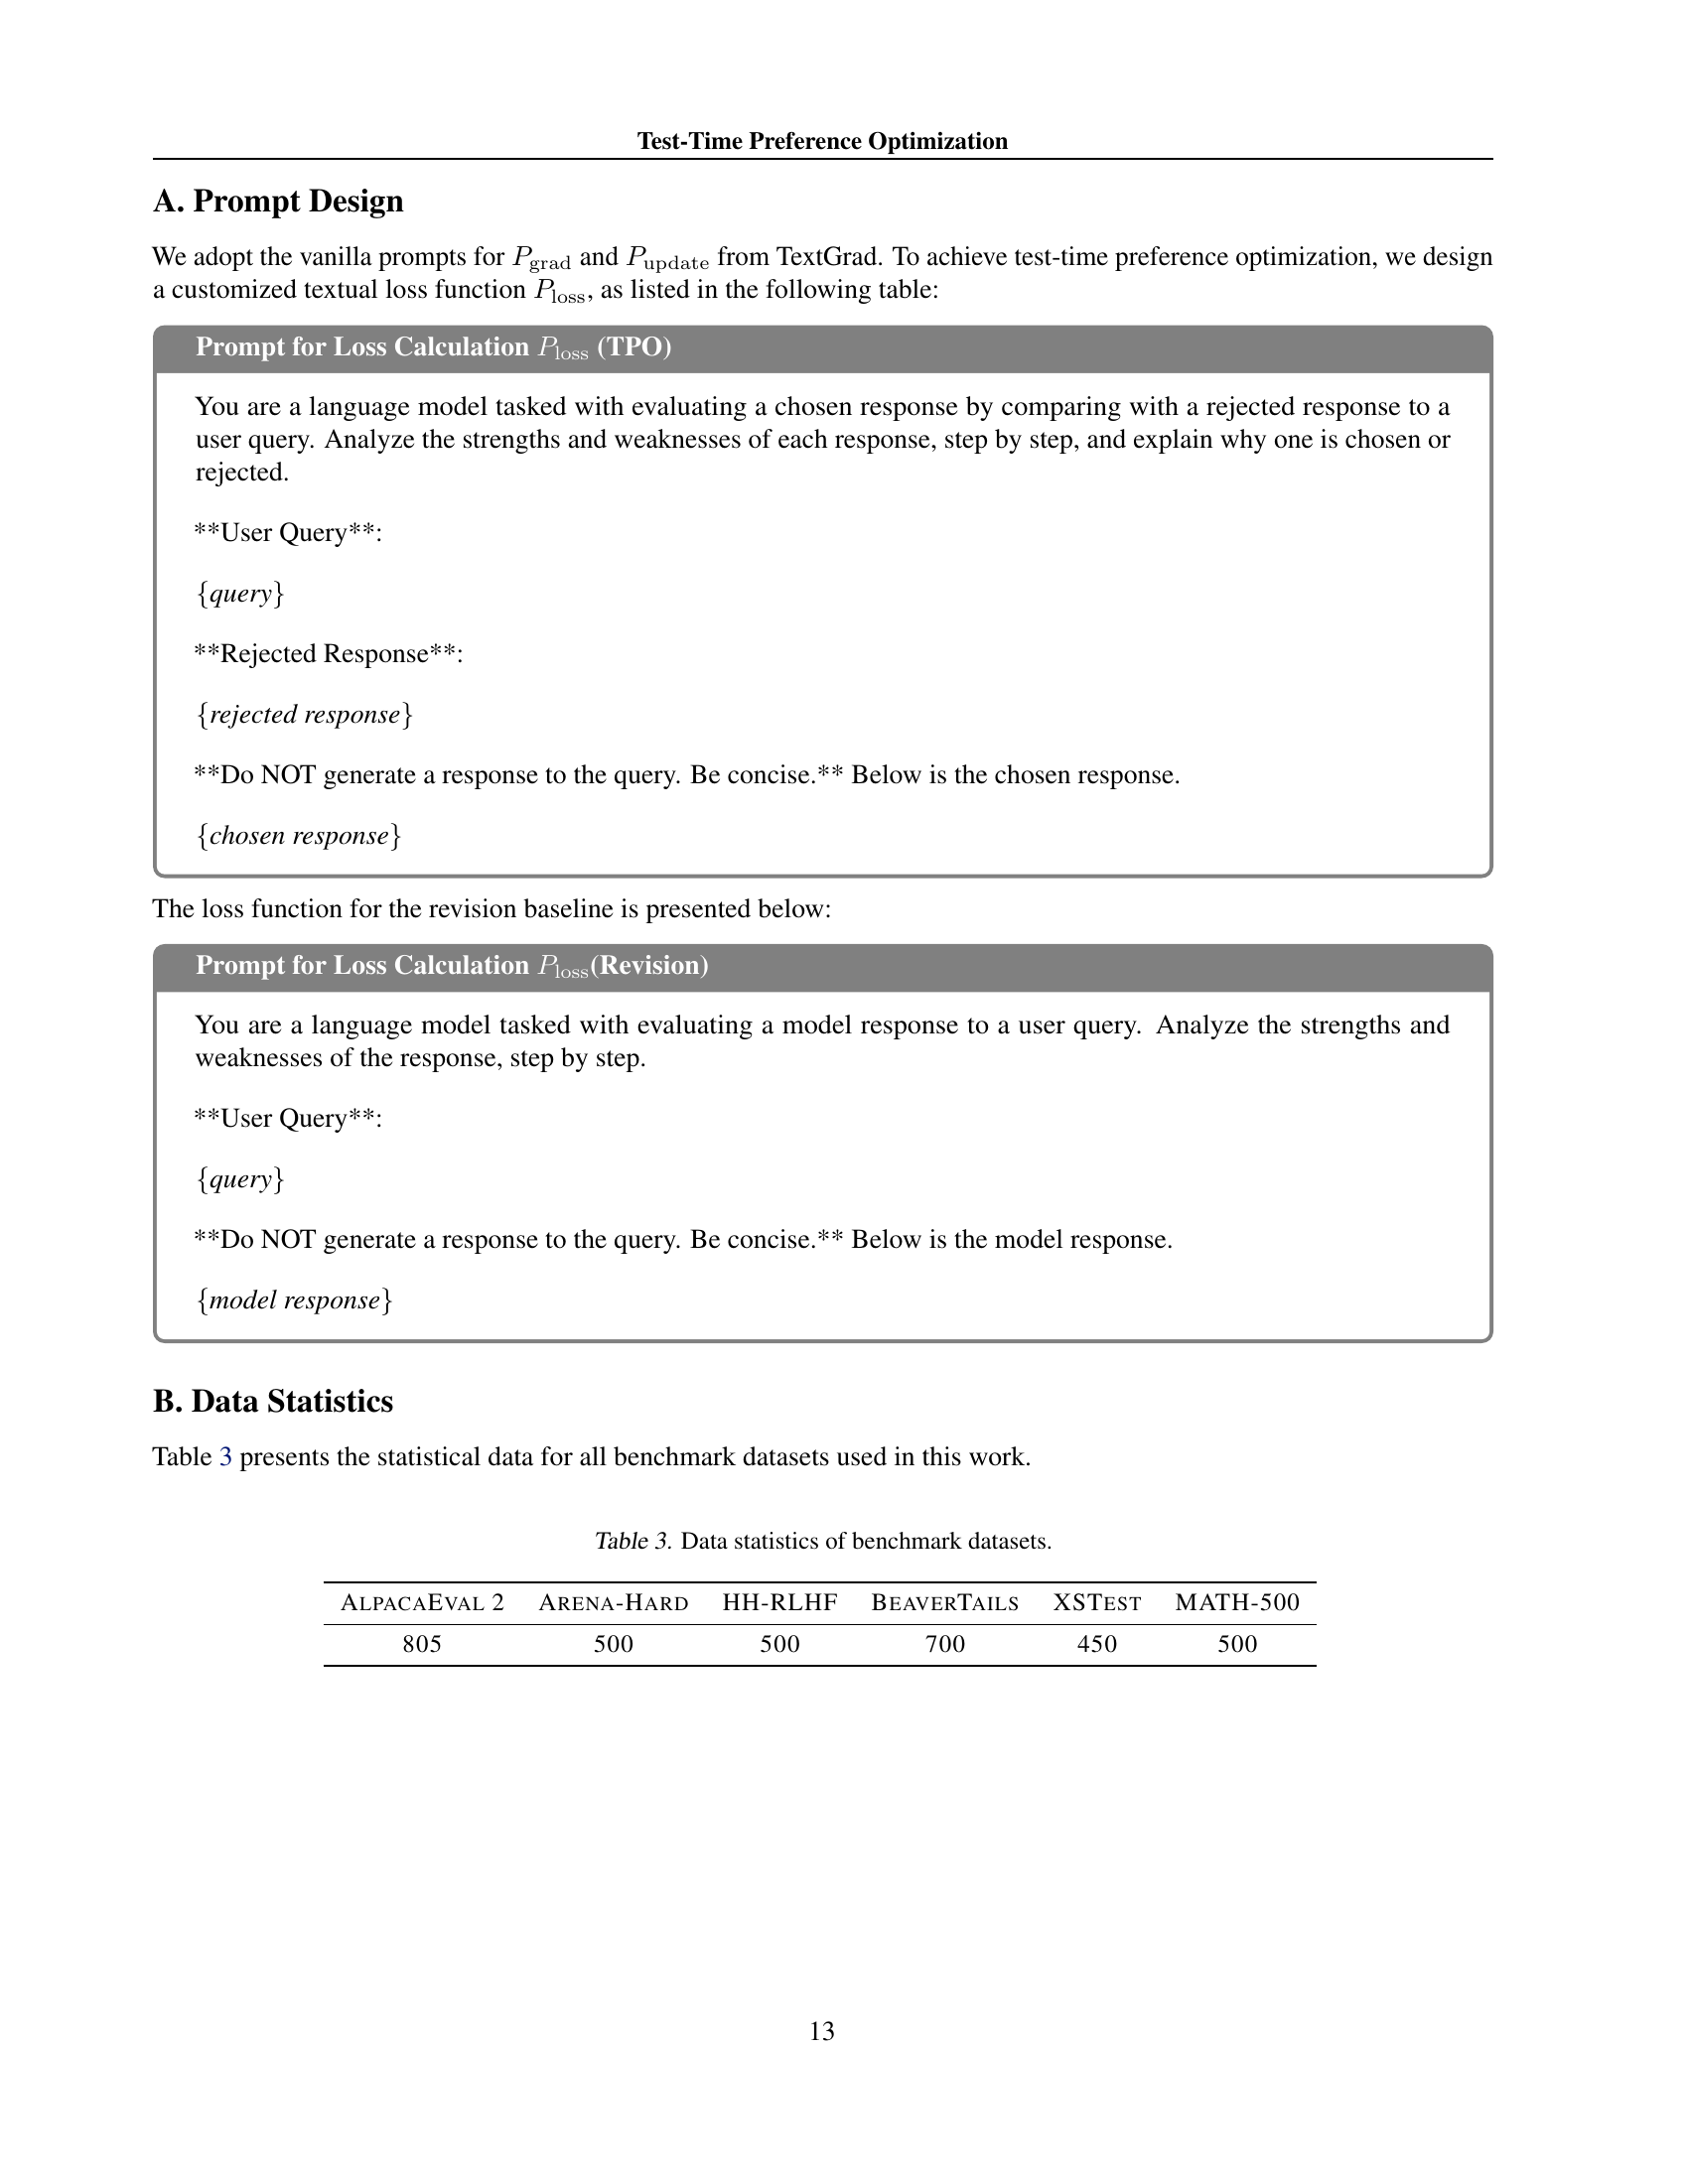
| AlpacaEval 2 | Arena-Hard | HH-RLHF | BeaverTails | XSTest | MATH-500 |
|---|---|---|---|---|---|
| 805 | 500 | 500 | 700 | 450 | 500 |
🔼 This table presents the number of instances in each benchmark dataset used in the paper’s experiments. The benchmarks cover various aspects of large language model (LLM) performance, including instruction following, preference alignment, safety, and mathematical reasoning. The datasets are AlpacaEval 2, Arena-Hard, HH-RLHF, BeaverTails, XSTest, and MATH-500. This information is crucial for understanding the scope and scale of the experimental evaluation.
read the caption
Table 3: Data statistics of benchmark datasets.
Full paper#