TL;DR#
The rapid growth of Multi-modal Large Language Models (MLLMs) has led to a surge in the number of benchmarks, resulting in significant redundancy. This paper identifies three key types of redundancy: within benchmark dimensions, across instances within a benchmark, and across benchmarks in the same domain. These redundancies hinder efficient model evaluation and distort research priorities.
This research responds by introducing a framework to quantify redundancy using correlation metrics applied to MLLM performance rankings. The framework was tested on hundreds of MLLMs across multiple benchmarks. The study revealed high redundancy in instances and benchmark dimensions, particularly for lower performing models. The authors propose design principles for more effective benchmarks which promote independence, optimal instance counts, and representativeness and offer strategies to refine and address redundancy effectively.
Key Takeaways#
Why does it matter?#
This paper is crucial for researchers in the field of Multi-modal Large Language Models (MLLMs) because it addresses the growing problem of redundancy in MLLM benchmarks. By providing a framework for quantifying and reducing redundancy, this research helps optimize benchmark design, enhances the efficiency of model evaluation, and ultimately guides future research directions within the field. This ensures that resources are used effectively, that research efforts are focused on genuinely novel contributions, and that MLLM development progresses efficiently and meaningfully.
Visual Insights#

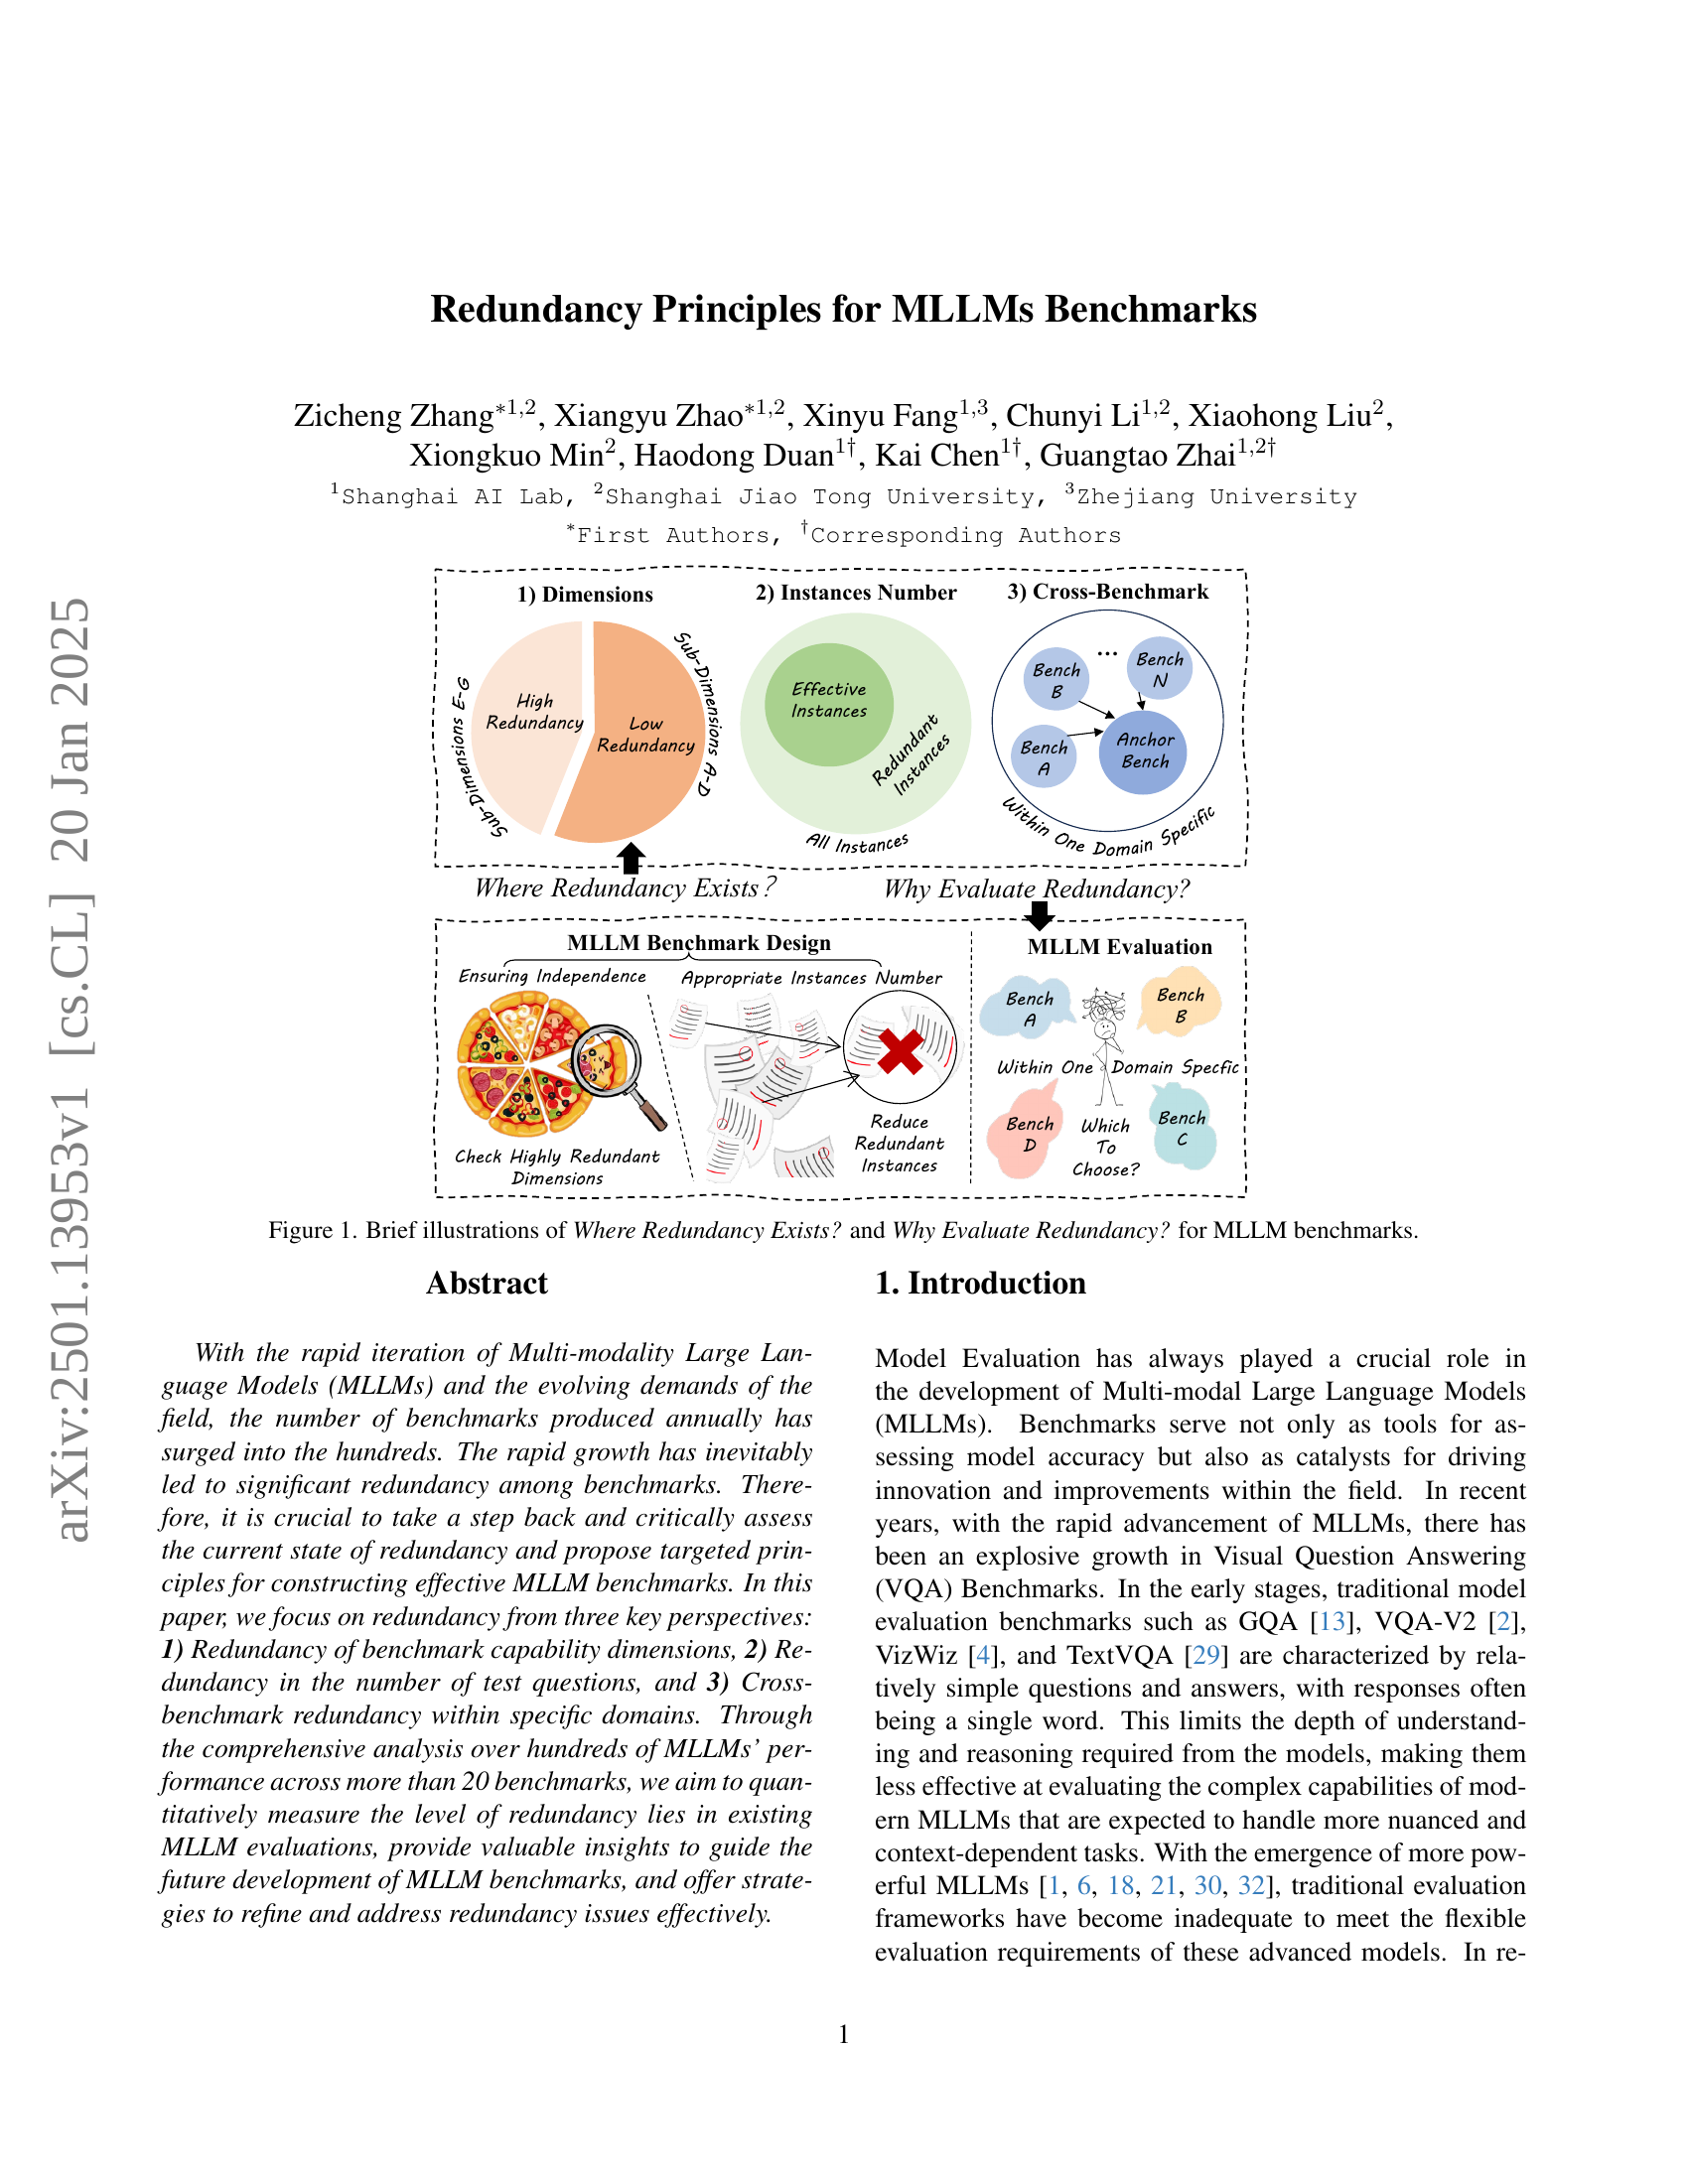
🔼 This figure illustrates the concept of redundancy in Multi-modal Large Language Model (MLLM) benchmarks from two perspectives. The left side (‘Where Redundancy Exists?’) shows how redundancy can manifest in different aspects of benchmark design: overlapping capabilities across different dimensions within a benchmark (e.g., multiple dimensions measure similar aspects of an MLLM), redundant instances (repeated or very similar questions/tasks), and redundancy across multiple benchmarks targeting the same domain (different benchmarks covering similar ground). The right side (‘Why Evaluate Redundancy?’) highlights the problems caused by redundancy in benchmarks: lack of independence between evaluations (results are not truly independent), inefficiencies (repeated assessments of similar capabilities), and a potentially biased view of MLLM progress (overemphasis on certain capabilities due to frequent evaluation). The figure uses a visual metaphor of overlapping circles and a red ‘X’ to represent the issues of redundancy.
read the caption
Figure 1: Brief illustrations of Where Redundancy Exists? and Why Evaluate Redundancy? for MLLM benchmarks.
In-depth insights#
Benchmark Redundancy#
Benchmark redundancy, a critical issue in evaluating multi-modal large language models (MLLMs), arises from the proliferation of benchmarks assessing overlapping capabilities. This redundancy leads to inefficient use of resources and potentially skewed research priorities. The paper systematically analyzes this redundancy across three key aspects: dimensions (intra-benchmark overlap in what is measured), instances (repetitive questions or tasks), and cross-benchmark redundancy (overlapping objectives across different benchmarks). A key finding is that redundancy is more prominent among lower-performing models, suggesting that higher-performing models demonstrate greater differentiation in their capabilities and therefore show less redundancy in their assessment. The study proposes a framework to quantify redundancy across these three aspects, recommending strategies to optimize benchmark design by fostering independence of dimensions, achieving optimal instance counts, and ensuring domain representativeness. By addressing benchmark redundancy, researchers can promote efficiency, enhance the evaluation of MLLMs, and avoid misinterpretations stemming from overemphasis on certain tasks. The principles and framework presented offer valuable guidance for the development of more effective and meaningful benchmarks for MLLM evaluation.
Redundancy Framework#
The Redundancy Framework section likely details a systematic approach to quantifying and addressing redundancy in Multi-modal Large Language Model (MLLM) benchmarks. It probably introduces metrics to measure redundancy across three key aspects: dimensions (intra-benchmark), instances (intra-benchmark), and cross-benchmark redundancy. The framework might use correlation coefficients (Spearman’s Rank Correlation, Pearson’s Linear Correlation, and R-squared) to assess the similarity of model performance rankings across different dimensions or instances. A high correlation suggests substantial redundancy, indicating potential areas for streamlining or refinement. The framework likely discusses how to interpret these metrics and uses them to guide benchmark design. Crucially, it would likely cover methods for identifying redundant dimensions or instances and propose strategies for mitigating these issues such as reducing the number of instances or consolidating overlapping dimensions. The overall goal is to develop more efficient and effective benchmarks by minimizing redundant evaluations and maximizing the insights gained.
MMBench Case Study#
A hypothetical ‘MMBench Case Study’ within a research paper would likely involve a detailed analysis of the MMBench benchmark’s properties and performance. This would require a thorough examination of MMBench’s design, including its constituent dimensions, to assess the extent of redundancy present. The study would probably segment MLLMs into performance tiers (e.g., top-performing vs. bottom-performing models), exploring how redundancy manifests differently across these groups. Key findings might reveal that redundancy is more prevalent among lower-performing models, indicating that higher-performing models demonstrate greater diversity in their capabilities. The case study would likely analyze the correlations between different MMBench dimensions, using metrics like Spearman’s Rank Correlation Coefficient (SRCC) to quantify the level of overlap. Visualizations, such as heatmaps, might be used to illustrate the relationships between dimensions, making it easier to identify highly correlated task clusters within the benchmark. Furthermore, the study might discuss implications for benchmark design, suggesting strategies to refine MMBench and reduce redundancy in future iterations. Recommendations might include consolidating redundant dimensions, optimizing the number of instances in the benchmark, and ensuring that the benchmark adequately covers the entire range of MLLM capabilities. Ultimately, a well-executed MMBench case study would provide valuable insights into the current state of MLLM benchmarks, offering practical guidance for developing more efficient and effective evaluation tools.
Redundancy Analysis#
Redundancy analysis in the context of Multi-modal Large Language Model (MLLM) benchmarks is crucial for efficient evaluation. The core idea is to identify and mitigate overlaps in benchmark capabilities, test instances, and evaluations across different benchmarks. The analysis focuses on three key aspects: redundancy across dimensions (intra-benchmark), redundancy across instances (intra-benchmark), and cross-benchmark redundancy. The proposed framework uses correlation metrics such as SRCC, PLCC, and R-squared to quantify redundancy. A key finding highlights the difference in redundancy levels between top-performing and bottom-performing MLLMs. Top-performing models reveal less redundancy as they demonstrate more distinct capabilities and performance variations across tasks. Addressing redundancy improves efficiency by reducing duplicated effort and offers insights into optimal benchmark design, ensuring adequate coverage of MLLM capabilities without unnecessary overlaps. The framework suggests strategies for optimizing benchmark design including instance count and dimension selection, promoting independence while maintaining evaluation validity. Ultimately, redundancy analysis contributes to the creation of more efficient and representative MLLM benchmarks that truly capture model capabilities and drive future progress.
Future Directions#
Future research could explore more nuanced forms of redundancy, moving beyond simple correlation analysis to investigate the underlying cognitive processes assessed by different benchmark tasks. A deeper understanding of task decomposition and inter-task dependencies would enable the creation of benchmarks that are both efficient and comprehensive, capturing the full spectrum of MLLM capabilities without unnecessary repetition. Furthermore, developing standardized metrics and evaluation frameworks for redundancy across various benchmark types and domains is crucial. This would ensure the consistency and reliability of redundancy analysis, fostering greater comparability and facilitating more meaningful progress in the field. Finally, future work should investigate how benchmark redundancy affects various downstream applications of MLLMs, such as in real-world deployment and societal impact assessments, to gain a more holistic understanding of the implications of redundancy in MLLM evaluation.
More visual insights#
More on figures

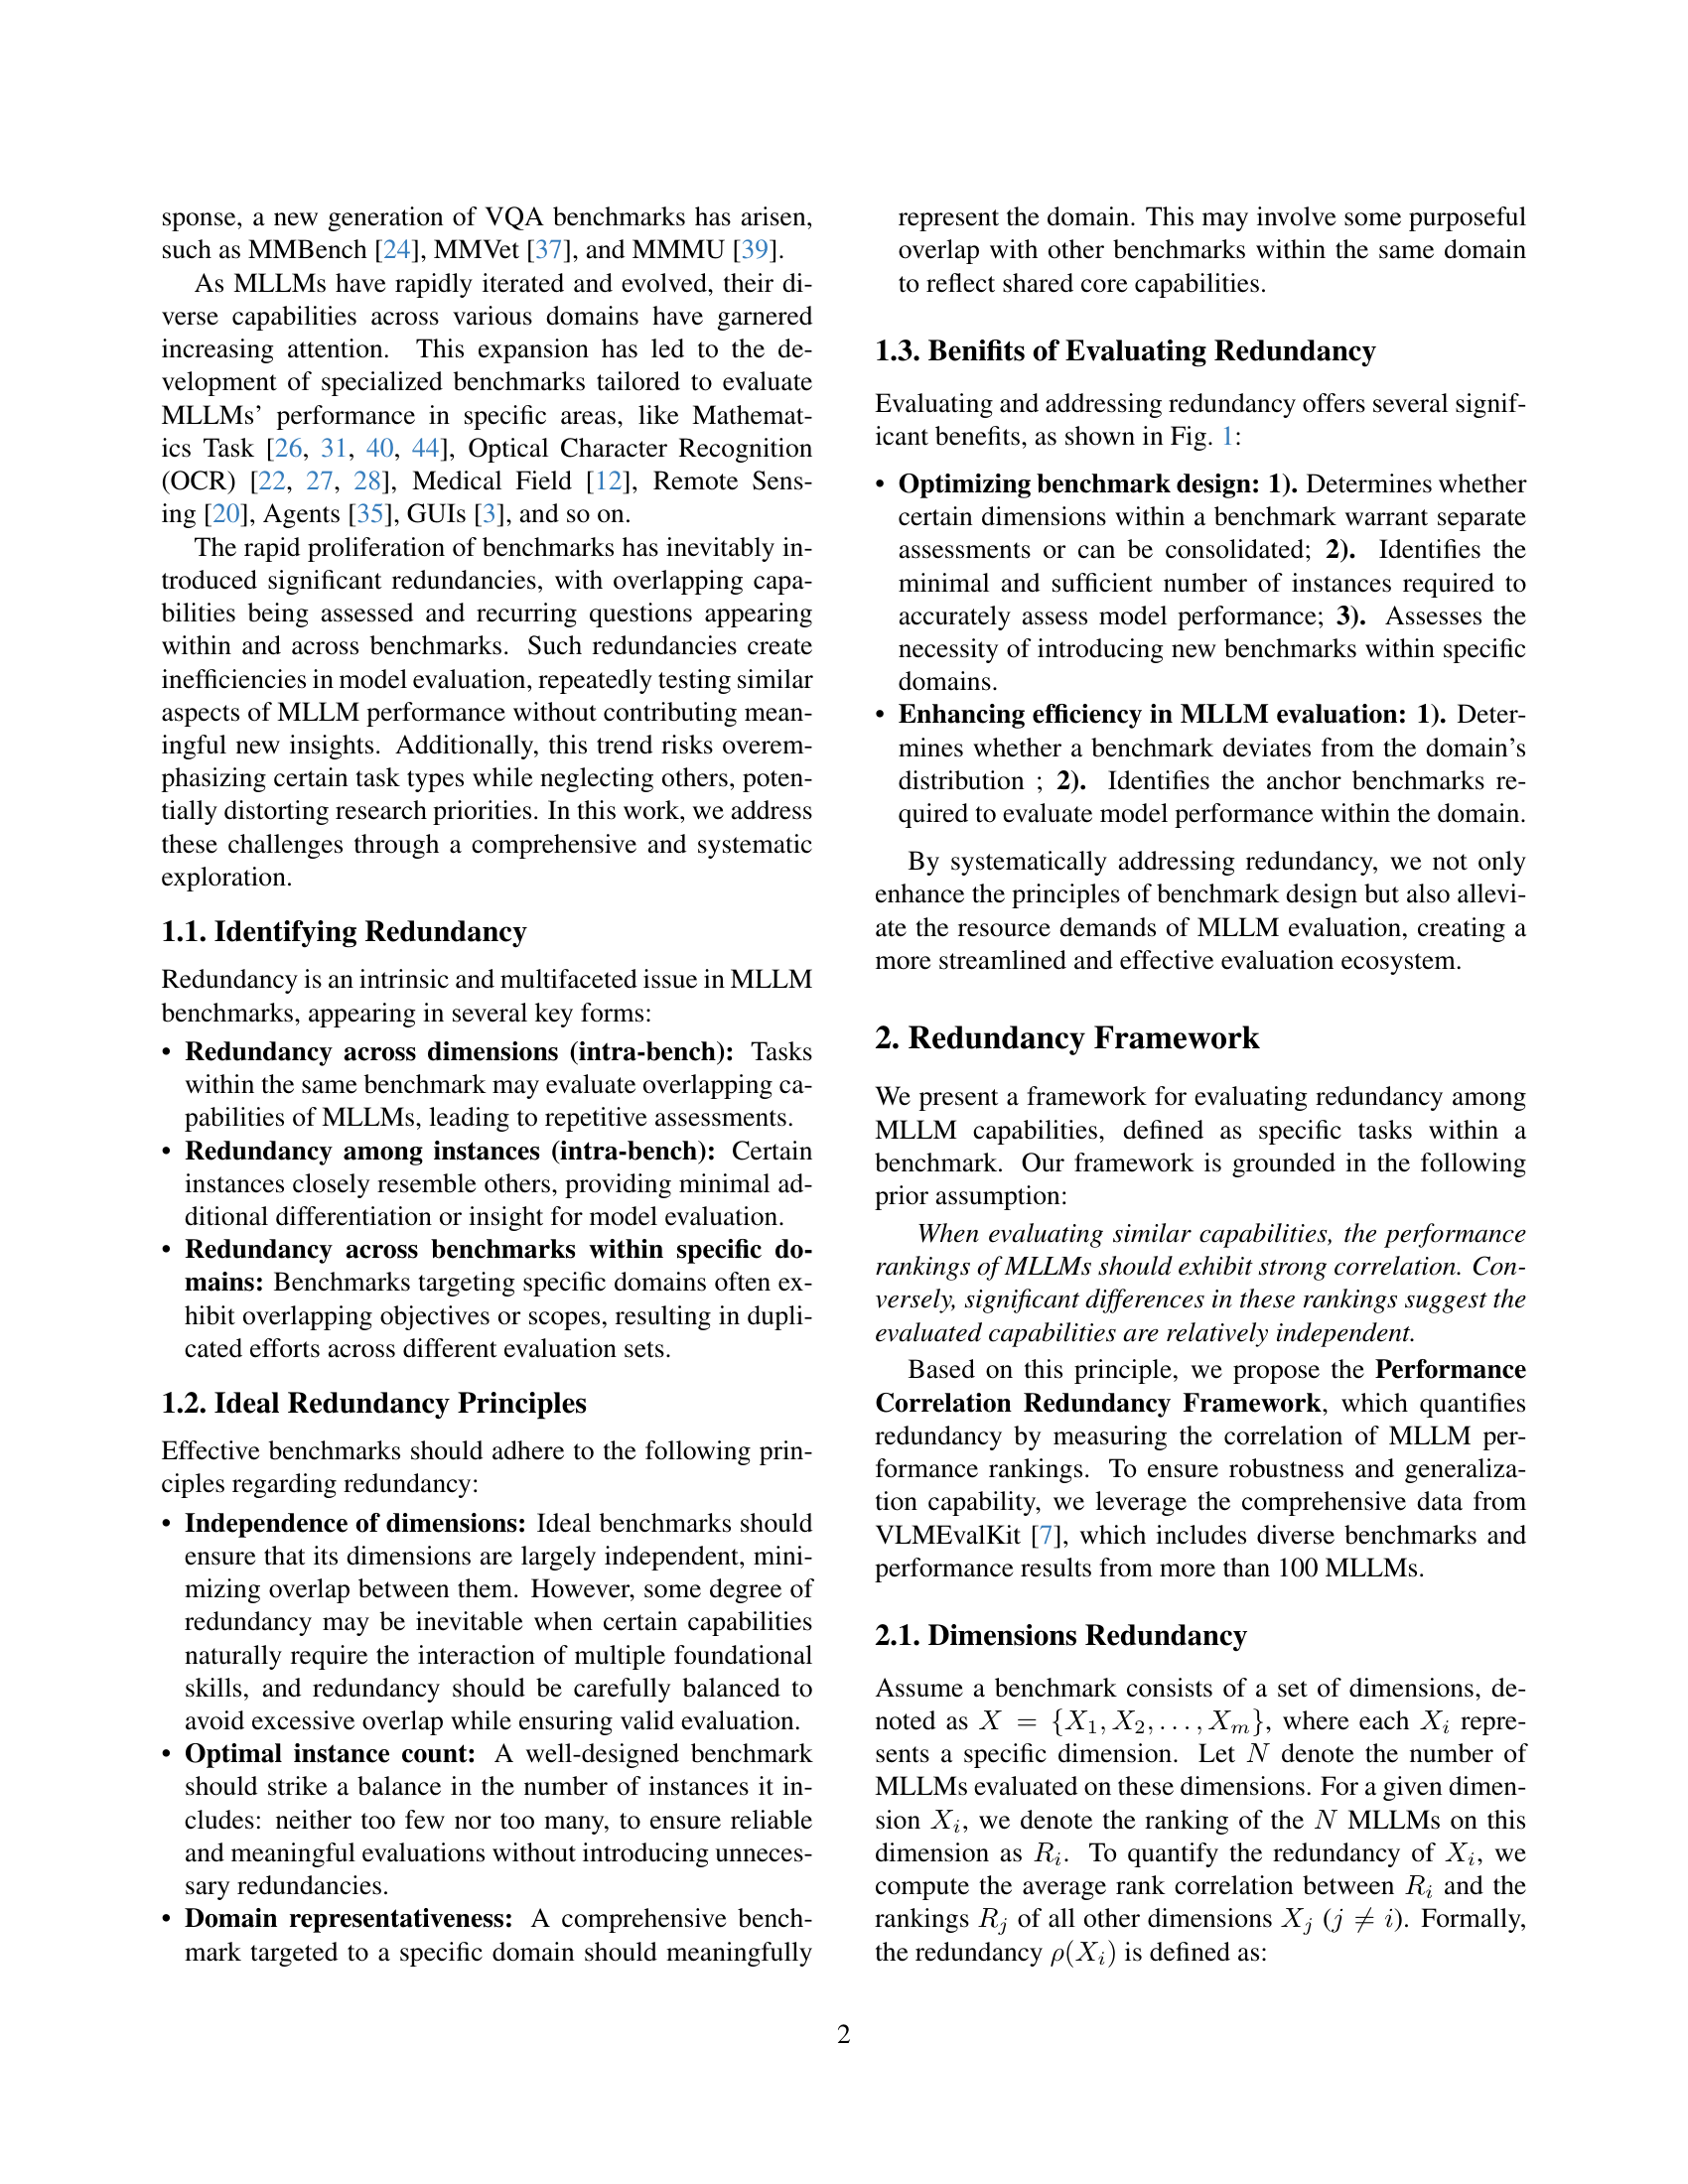
🔼 Figure 2 illustrates the framework used to assess redundancy in Multimodal Large Language Model (MLLM) benchmarks. It breaks down redundancy analysis into three key aspects: dimensions redundancy (panel a), which analyzes the correlation between different dimensions within a benchmark; instances redundancy (panel b), which examines the level of redundancy between different instances or tasks within the same benchmark, and finally, cross-benchmark redundancy (panel c) which explores the redundancy levels between benchmarks within a specific domain. The figure visually guides how performance correlation is leveraged to quantify redundancy across these three perspectives.
read the caption
Figure 2: A quick look at the redundancy framework, where (a), (b), and (c) show the general process of computing dimensions redundancy, instances redundancy, and cross-benchmark redundancy respectively.

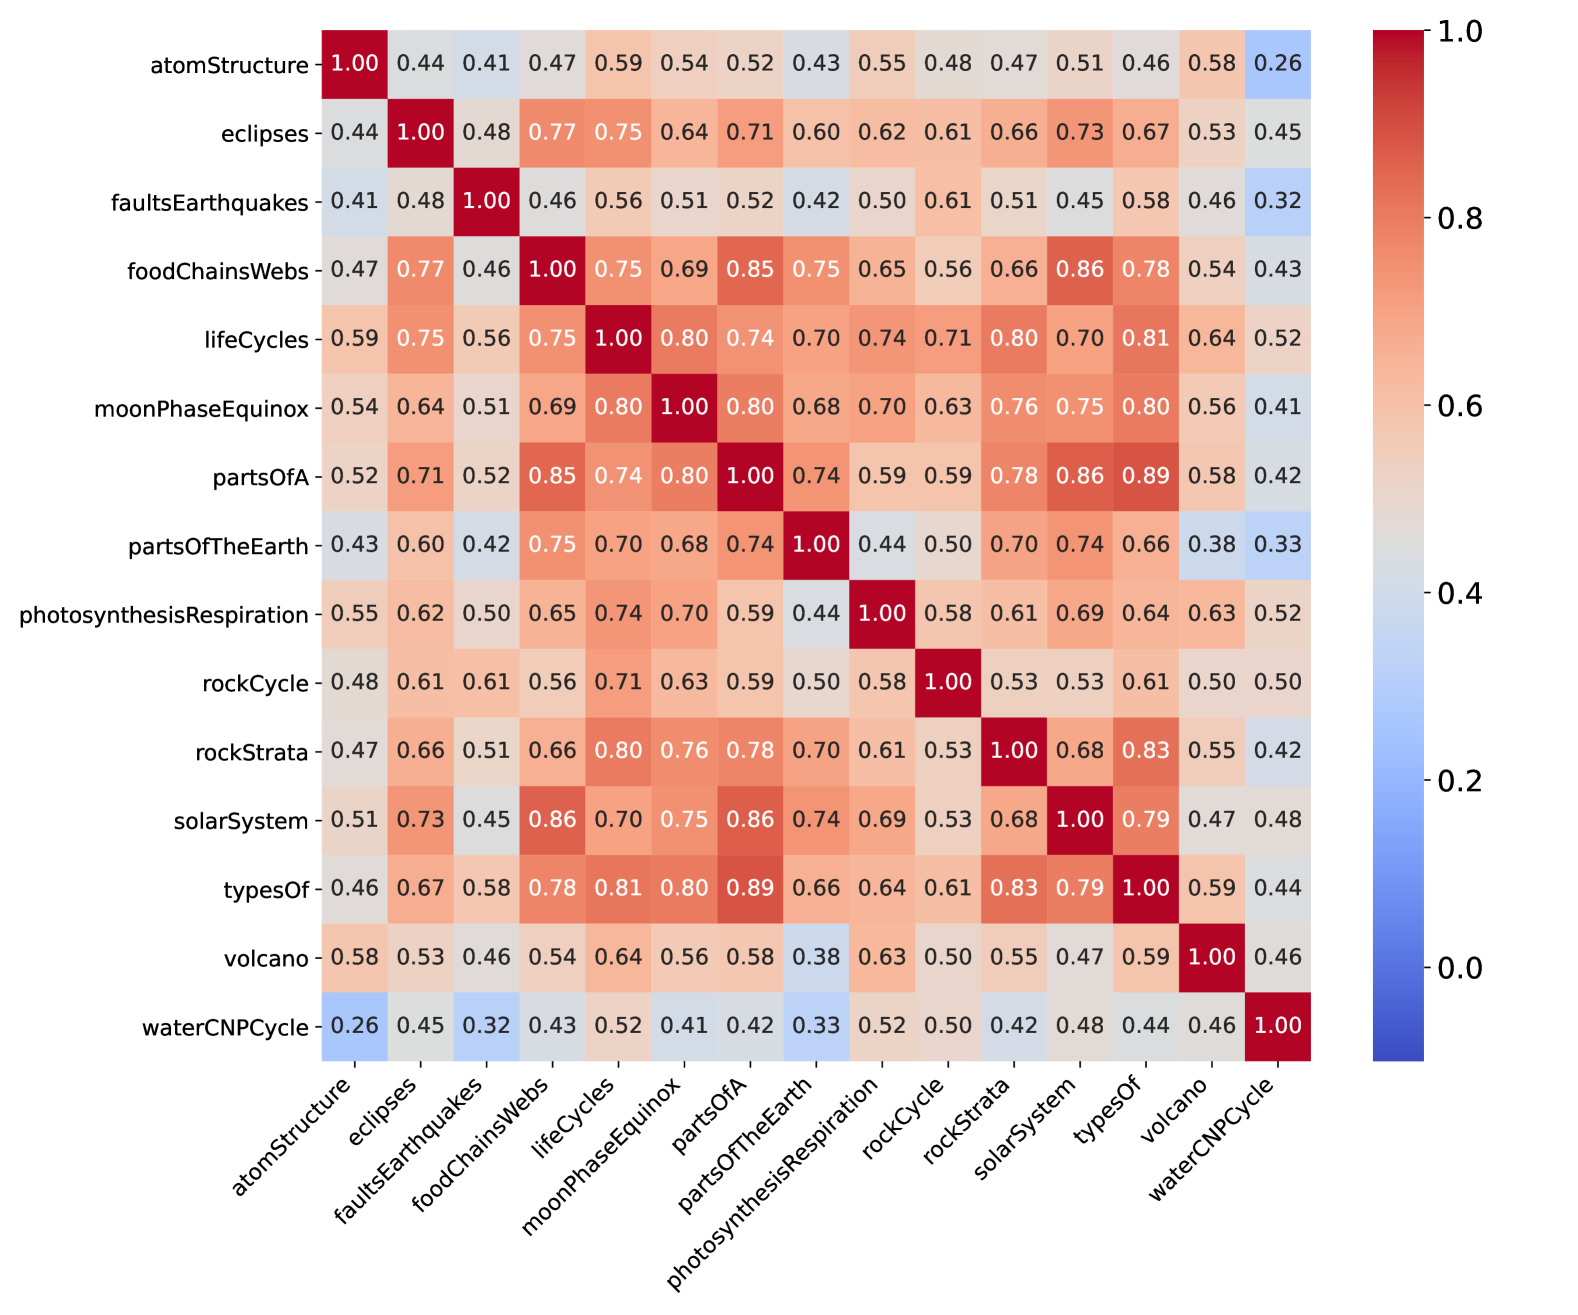
🔼 This figure visualizes the redundancy of dimensions within the MMBench benchmark using the Spearman Rank Correlation Coefficient (SRCC) for the top 50 performing Multi-modal Large Language Models (MLLMs). The heatmap shows the correlation between different dimension pairs. Warmer colors (red) indicate higher correlation, suggesting greater redundancy, while cooler colors (blue) indicate lower correlation and less redundancy between dimensions. This analysis helps identify which dimensions in the MMBench may be measuring overlapping capabilities.
read the caption
(a) Top-50 SRCC dimensions redundancy map.

🔼 This heatmap visualizes the redundancy among the top 50 performing Multi-modal Large Language Models (MLLMs) using the Pearson Linear Correlation Coefficient (PLCC). Each cell represents the PLCC between two dimensions of the MMBench benchmark, indicating the level of correlation in MLLM performance across different dimensions. Darker red colors signify higher redundancy, suggesting that the models’ performance on those two dimensions is highly correlated, implying that they may be assessing similar capabilities. Lighter colors show less redundancy.
read the caption
(b) Top-50 PLCC dimensions redundancy map.
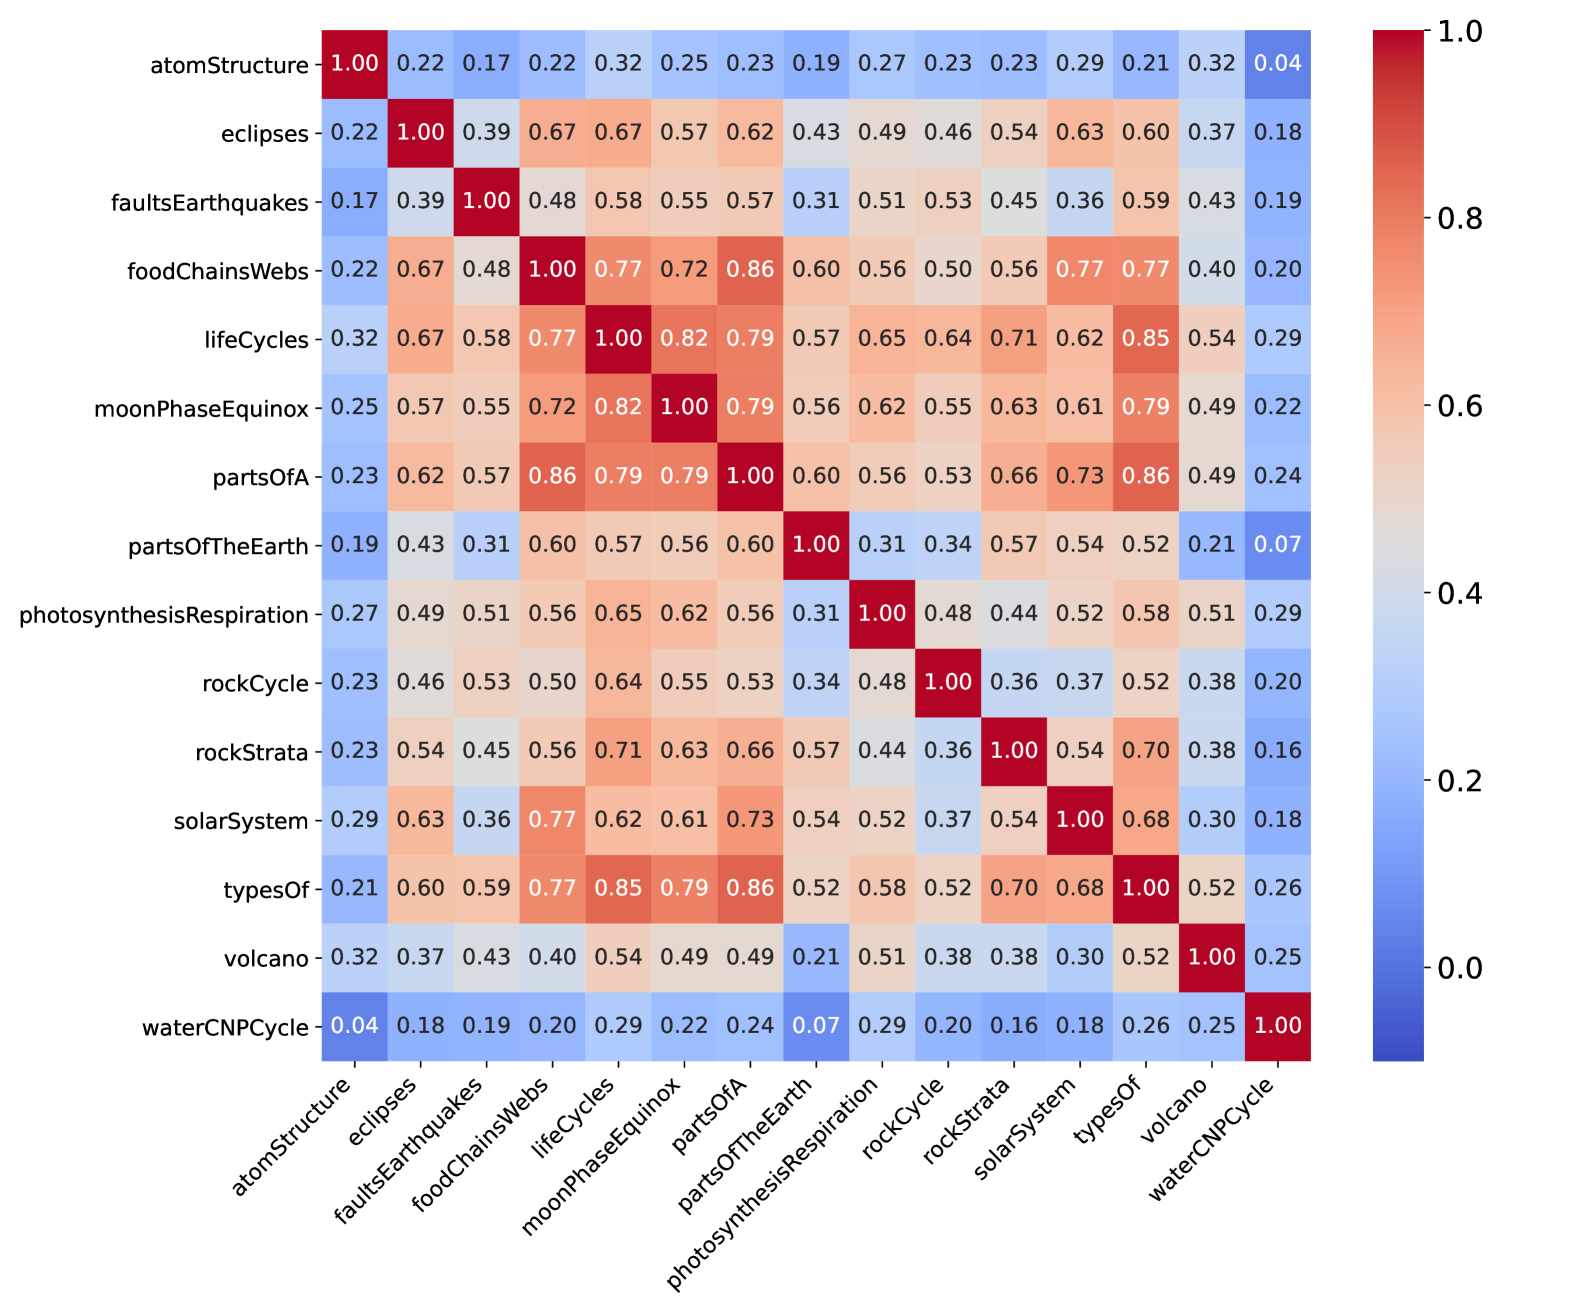
🔼 This heatmap visualizes the redundancy of the top 50 dimensions in the MMBench benchmark, specifically focusing on the R-squared (R2) correlation coefficient. Each cell represents the correlation between two dimensions, indicating the degree of overlap in the capabilities they assess. Warmer colors (red) signify higher redundancy (strong correlation between dimension pairs), implying that the dimensions may be evaluating similar capabilities of the MLLMs. Cooler colors (blue) indicate lower redundancy (weak correlation), suggesting the dimensions assess more distinct aspects of the MLLMs’ capabilities.
read the caption
(c) Top-50 R2 dimensions redundancy map.

🔼 This heatmap visualizes the redundancy among the bottom-performing 50 Multimodal Large Language Models (MLLMs) across different dimensions within the MMBench benchmark. Each cell represents the Spearman Rank Correlation Coefficient (SRCC) between the performance rankings of two dimensions. Darker red indicates higher redundancy (stronger correlation), suggesting the two dimensions assess similar capabilities. Lighter colors represent less redundancy. This analysis helps to identify dimensions that are largely redundant and could be consolidated in future benchmark design.
read the caption
(d) Bottom-50 SRCC dimensions redundancy map.

🔼 This heatmap visualizes the redundancy among the dimensions of the MMBench benchmark when evaluated using the bottom-performing 50 multi-modal large language models (MLLMs). Each cell represents the Pearson Linear Correlation Coefficient (PLCC) between two dimensions, indicating the level of redundancy. Warmer colors (red) show high redundancy, signifying that the dimensions assess similar capabilities, while cooler colors (blue) suggest lower redundancy, indicating that they measure distinct capabilities. This analysis helps in identifying and addressing redundant dimensions in the benchmark design.
read the caption
(e) Bottom-50 PLCC dimensions redundancy map.

🔼 This heatmap visualizes the redundancy among the bottom-performing 50 Multi-modal Large Language Models (MLLMs) across different dimensions within the MMBench benchmark. Each cell represents the R-squared correlation coefficient between two dimensions. Warmer colors (red) indicate higher redundancy, meaning those dimensions tend to be evaluated similarly by the MLLMs, while cooler colors (blue) represent less redundancy.
read the caption
(f) Bottom-50 R2 dimensions redundancy map.

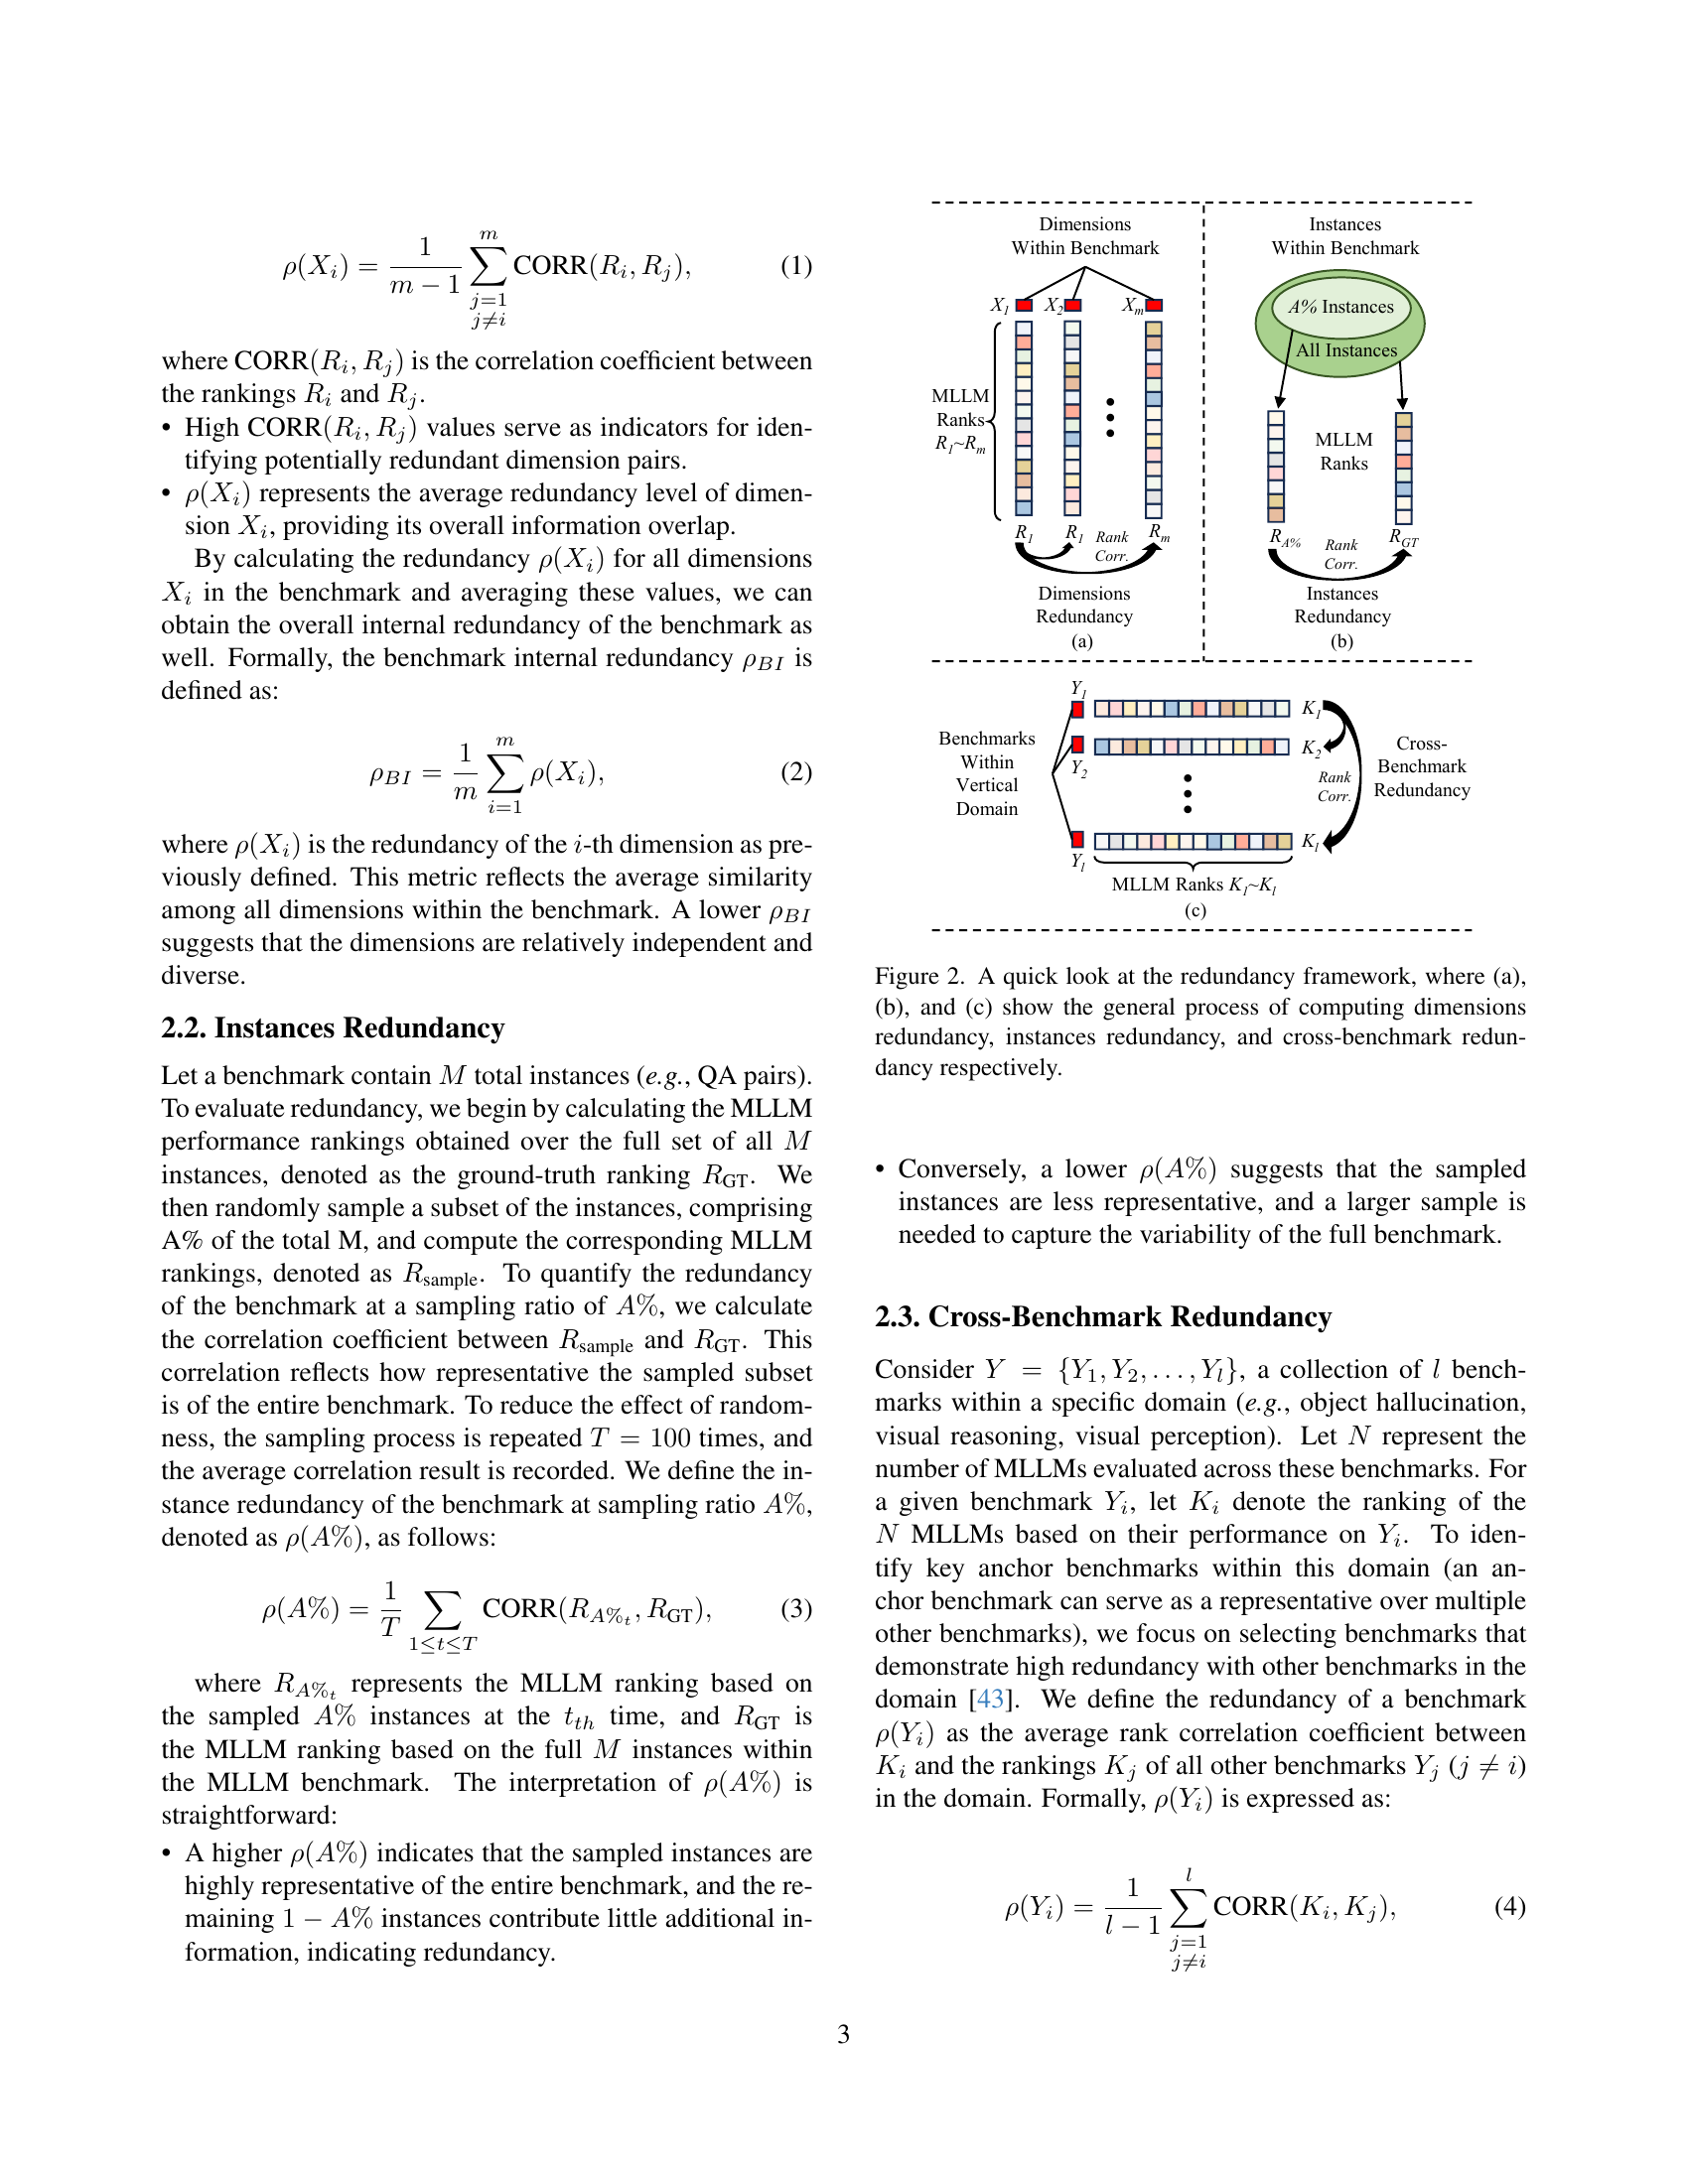
🔼 This figure displays the redundancy of different dimensions within the MMBench benchmark for two groups of Multi-modal Large Language Models (MLLMs): the top-performing 50 models (Top-50) and the bottom-performing 50 models (Bottom-50). It uses heatmaps to visualize the correlation between different dimensions’ performance rankings for both groups. This provides a visual representation of how much the different dimensions measure similar or overlapping aspects of MLLM capabilities, separately for high- and low-performing models. The visualizations use three correlation coefficients (SRCC, PLCC, and R2) to provide a comprehensive analysis from different perspectives.
read the caption
Figure 3: Visualizations of dimensions redundancy for MMBench [24] on Top-50 and Bottom-50 MLLMs.

🔼 This figure shows the redundancy of dimensions within the MMBench benchmark when evaluated using the top 50 performing Multi-modal Large Language Models (MLLMs). Specifically, it displays a heatmap representing the Spearman Rank Correlation Coefficient (SRCC) values between pairs of dimensions. The heatmap visually depicts the level of redundancy among different dimensions of MMBench. Higher SRCC values indicate stronger correlations and therefore higher redundancy between the two dimensions being compared.
read the caption
(a) Top-50 SRCC redundancy.

🔼 This heatmap visualizes the redundancy of the top 50 performing Multi-modal Large Language Models (MLLMs) across different dimensions within the MMBench benchmark using the Pearson Linear Correlation Coefficient (PLCC). Warmer colors (red) indicate higher correlation, suggesting greater redundancy between dimensions, while cooler colors (blue) show lower correlation, implying more independent capabilities.
read the caption
(b) Top-50 PLCC redundancy.

🔼 This heatmap visualizes the redundancy among the top 50 performing Multi-modal Large Language Models (MLLMs) across different dimensions within the MMBench benchmark using the R-squared (R2) correlation coefficient. Warmer colors (red) indicate higher redundancy, meaning that the rankings of MLLMs across those dimensions are highly correlated, suggesting that they may be assessing similar capabilities. Cooler colors (blue) indicate lower redundancy, suggesting the dimensions assess more independent capabilities.
read the caption
(c) Top-50 R2 redundancy.

🔼 This figure shows the redundancy map for the bottom 50 multi-modal large language models (MLLMs) using the Spearman Rank Correlation Coefficient (SRCC). The color intensity represents the level of redundancy between different dimensions of the benchmark. Darker colors indicate higher redundancy, meaning the dimensions are measuring similar aspects of MLLM capabilities. This visualization helps identify potential areas for improvement in benchmark design by showing which dimensions are highly correlated and might be redundant.
read the caption
(d) Bottom-50 SRCC redundancy.
🔼 This figure displays the redundancy map for the bottom-performing 50 multi-modal large language models (MLLMs) using the Pearson Linear Correlation Coefficient (PLCC). It visualizes the correlation between different dimensions within the MMBench benchmark, revealing the extent to which these dimensions assess overlapping capabilities for this lower-performing group of models. Higher correlation indicates greater redundancy, suggesting that those dimensions may be measuring similar aspects of MLLM performance, possibly leading to inefficiencies in evaluation.
read the caption
(e) Bottom-50 PLCC redundancy.

🔼 This figure shows the Bottom-50 MLLMs’ R2 dimensions redundancy map for MMBench. The R2 score measures the proportion of variance in the ground truth values that is explained by the predictions. Darker red colors represent stronger correlations, indicating higher redundancy between dimensions. This visualization helps to identify sets of dimensions within MMBench that may be highly correlated in their assessment of the Bottom-50 performing MLLMs, suggesting potential redundancy in evaluation.
read the caption
(f) Bottom-50 R2 redundancy.

🔼 This figure displays bar plots visualizing the redundancy of different dimensions within the MMBench benchmark. It compares the redundancy for two groups of Multi-modal Large Language Models (MLLMs): the top-performing 50 (Top-50) and the bottom-performing 50 (Bottom-50). The redundancy value for each dimension is calculated by averaging its correlation with all other dimensions. This shows how much each dimension’s performance overlaps with that of other dimensions, indicating the degree of redundancy. The plots help to understand whether some dimensions are measuring similar capabilities, suggesting potential improvements in benchmark design.
read the caption
Figure 4: Bar plots of dimensions redundancy for MMBench [24] on Top-50 and Bottom-50 MLLMs. The redundancy values are computed by averaging the redundancy of each dimension with the redundancy of all other dimensions.

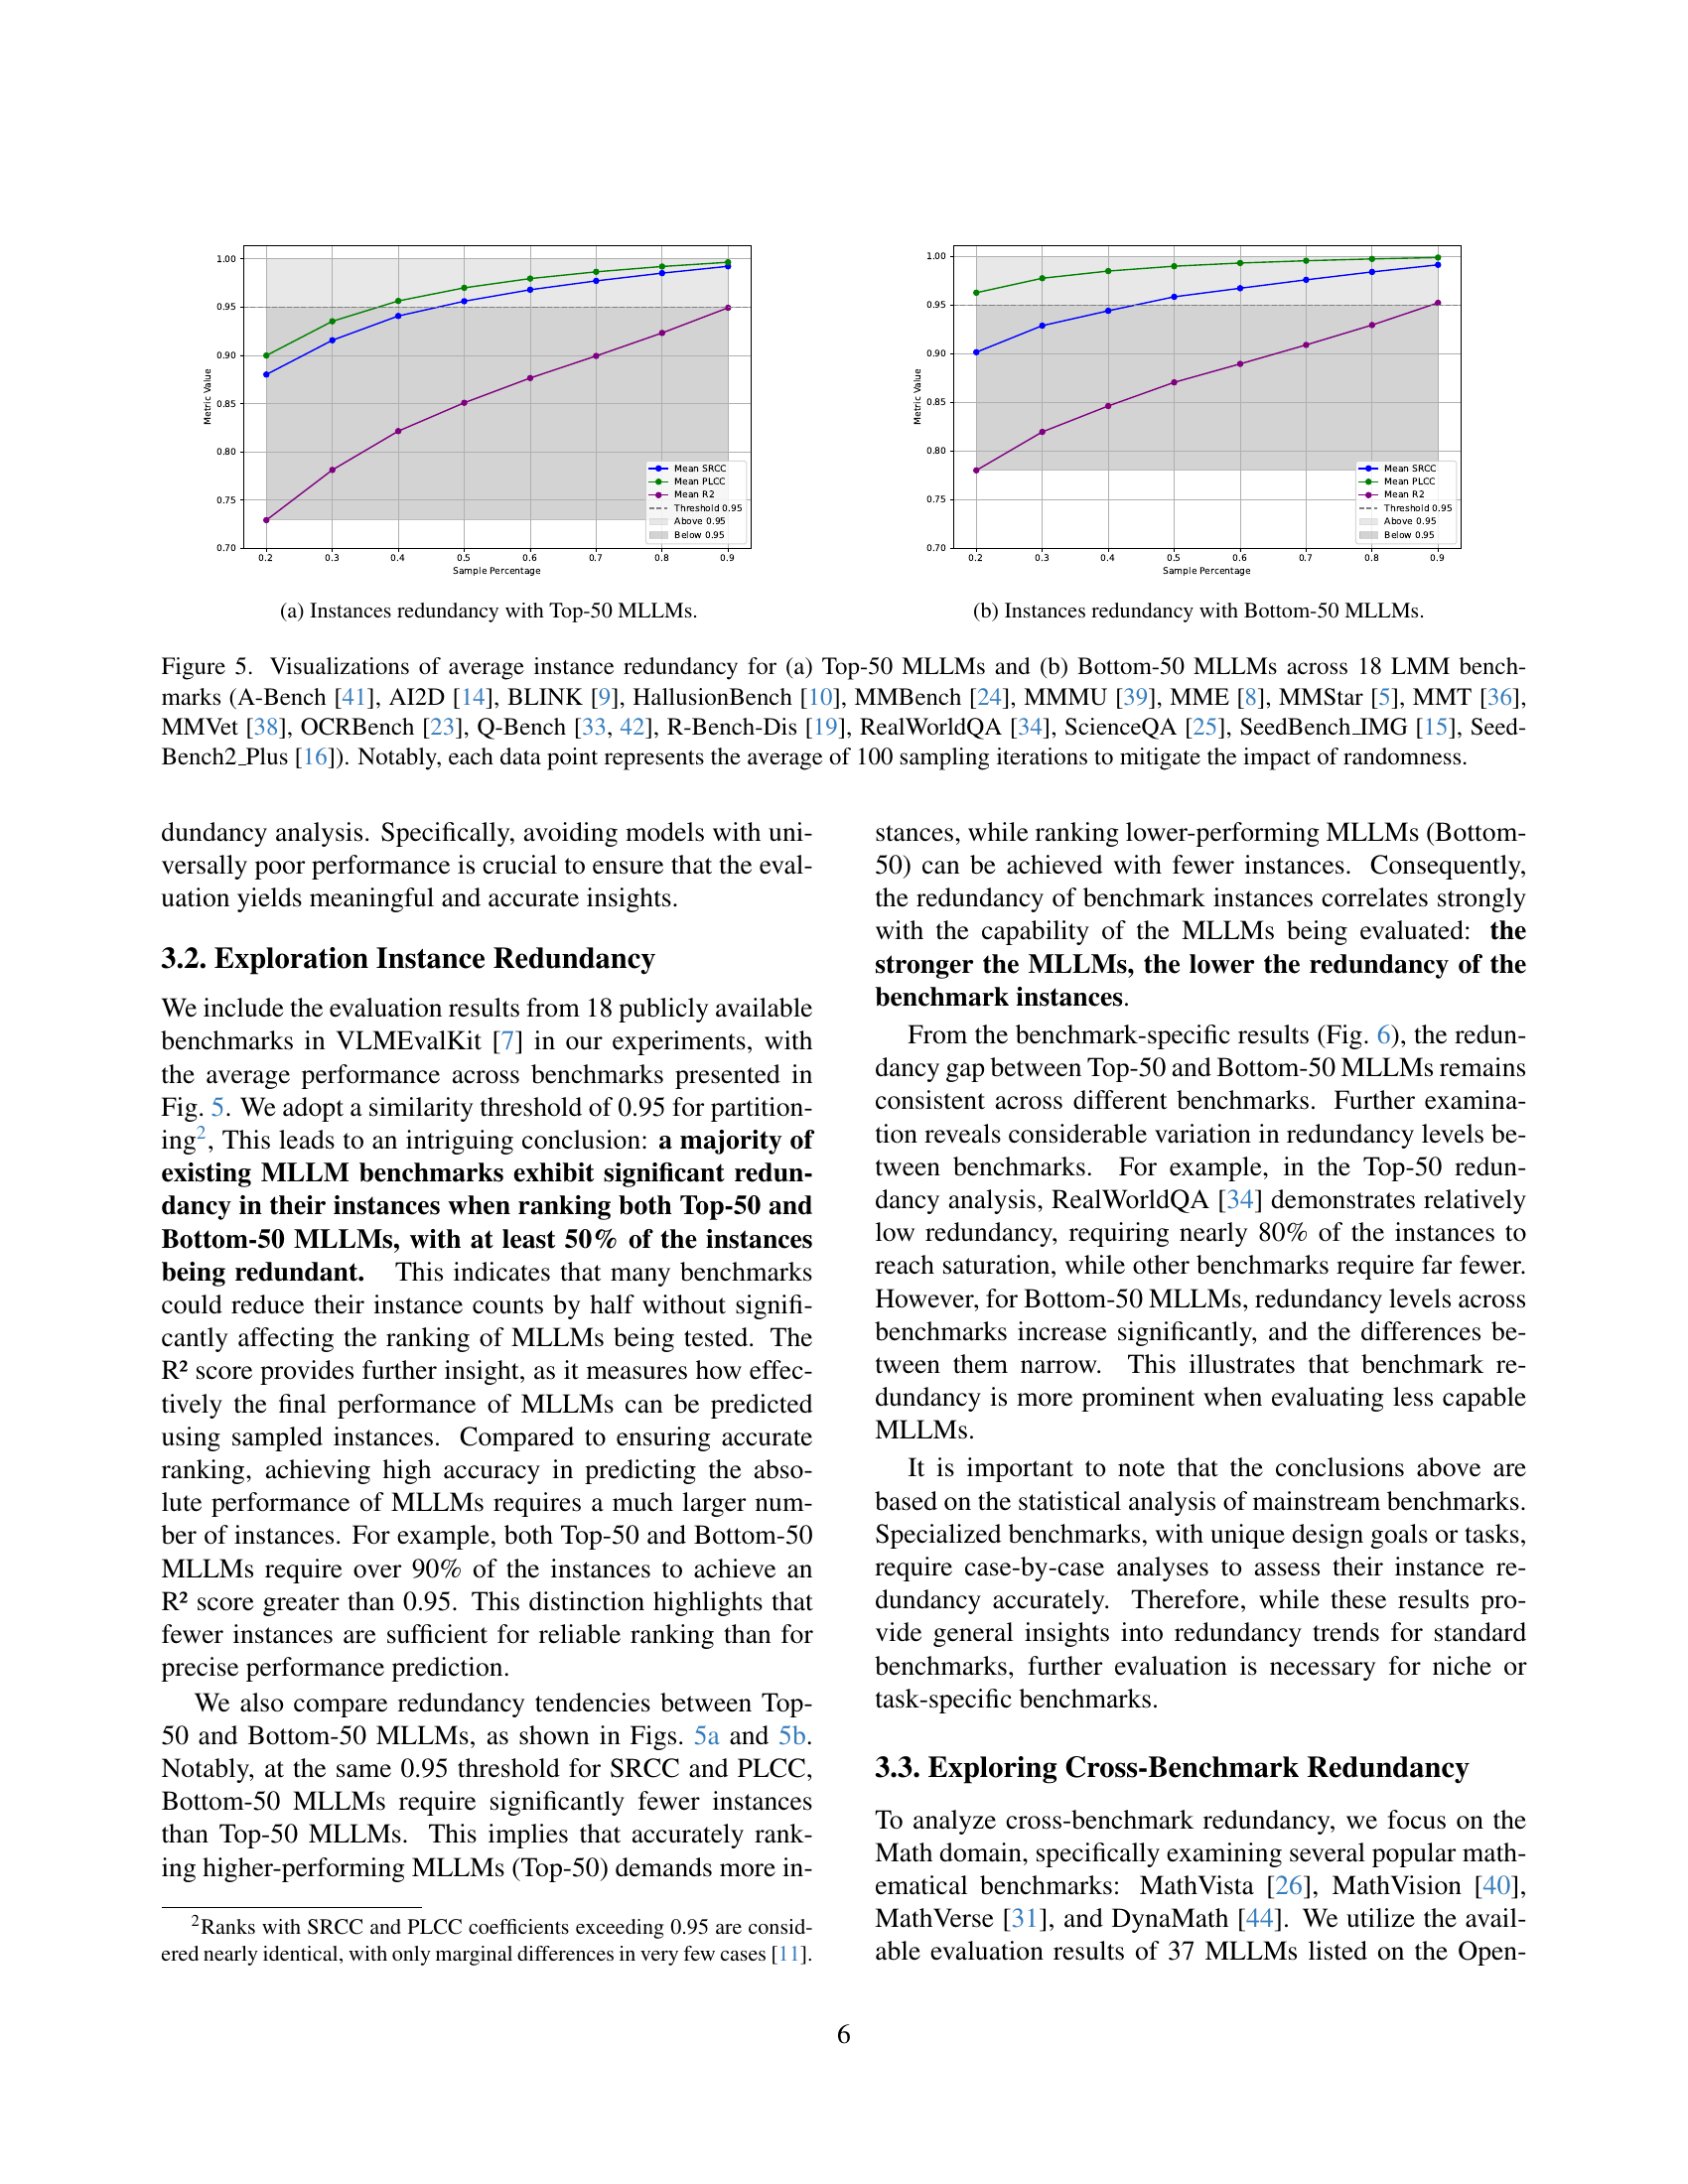
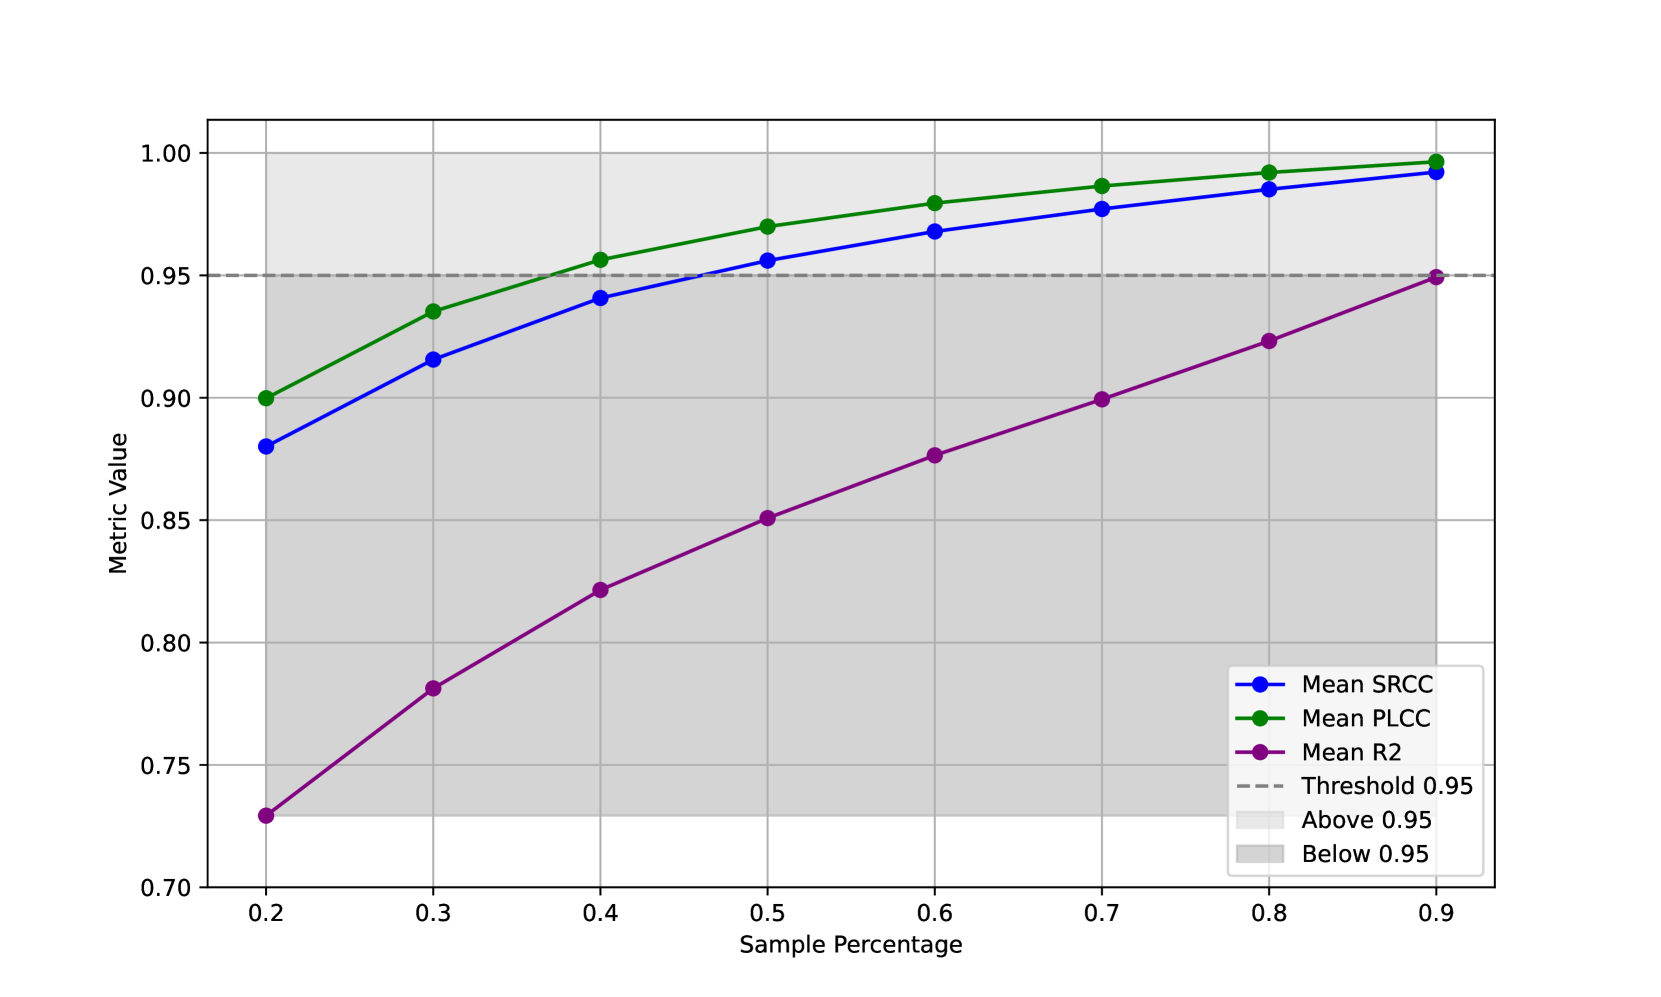
🔼 This figure shows two sub-figures visualizing the average instance redundancy for different groups of Multi-modal Large Language Models (MLLMs). The left sub-figure (a) displays the redundancy for the top-performing 50 MLLMs (Top-50), while the right sub-figure (b) shows the redundancy for the bottom-performing 50 MLLMs (Bottom-50). Each sub-figure plots the average correlation between the ranking of MLLMs on the complete benchmark’s instances and the ranking when only a subset of instances (indicated by the sample percentage on the x-axis) are used. Different metrics (SRCC, PLCC, R-squared) are used to measure this correlation. This analysis helps to determine if a smaller subset of instances within each benchmark can produce similar MLLM rankings, thereby indicating redundancy.
read the caption
(a) Instances redundancy with Top-50 MLLMs.

🔼 This figure shows the relationship between the number of instances (e.g., question-answer pairs) used in a benchmark and how well the performance rankings of the bottom-performing 50 large multimodal language models (MLLMs) are preserved when only a subset of those instances is used. The x-axis represents the percentage of instances sampled, while the y-axis displays the average correlation coefficient (using Spearman Rank Correlation, Pearson Linear Correlation, and R-squared) between the rankings based on the full set of instances and the rankings obtained using the sampled instances. The higher the correlation, the more representative the smaller sample is of the entire benchmark. This analysis helps determine the optimal number of instances for reliably evaluating MLLMs without introducing unnecessary redundancy. The use of three correlation metrics provides a comprehensive measure of the redundancy.
read the caption
(b) Instances redundancy with Bottom-50 MLLMs.

🔼 Figure 5 shows the average instance redundancy across 18 large language model (LLM) benchmarks for two groups of models: the top 50 performing models and the bottom 50 performing models. Instance redundancy measures how representative a subset of the benchmark’s instances is of the whole benchmark. A higher average correlation between the rankings of models on the full set of instances and on a sampled subset indicates higher redundancy (less information is added by additional instances). The figure visualizes this redundancy across different sampling percentages (from 20% to 90%), using three correlation metrics: Spearman Rank Correlation Coefficient (SRCC), Pearson Linear Correlation Coefficient (PLCC), and R-squared (R2). The error bars represent the standard deviation across 100 sampling iterations to account for randomness.
read the caption
Figure 5: Visualizations of average instance redundancy for (a) Top-50 MLLMs and (b) Bottom-50 MLLMs across 18 LMM benchmarks (A-Bench [41], AI2D [14], BLINK [9], HallusionBench [10], MMBench [24], MMMU [39], MME [8], MMStar [5], MMT [36], MMVet [38], OCRBench [23], Q-Bench [33, 42], R-Bench-Dis [19], RealWorldQA [34], ScienceQA [25], SeedBench_IMG [15], SeedBench2_Plus [16]). Notably, each data point represents the average of 100 sampling iterations to mitigate the impact of randomness.

🔼 This figure shows the redundancy of dimensions for MMBench benchmark when evaluated on the top 50 performing Multi-modal Large Language Models (MLLMs). The Spearman Rank Correlation Coefficient (SRCC) is used to measure the correlation between each dimension and all other dimensions in the benchmark. A higher correlation suggests that the two dimensions measure similar capabilities, and therefore are redundant. The figure visualizes this redundancy using a heatmap, allowing for a quick identification of highly correlated dimensions.
read the caption
(a) Top-50 SRCC redundancy.

🔼 This figure displays a heatmap visualization of the Top 50 Pearson Linear Correlation Coefficient (PLCC) dimension redundancy for the MMBench benchmark. It shows the correlation between different dimensions within the benchmark, with darker colors indicating higher correlation and potential redundancy. This helps to identify groups of highly correlated dimensions, suggesting that they might be assessing similar aspects of model capabilities and could potentially be consolidated.
read the caption
(b) Top-50 PLCC redundancy.

🔼 This heatmap visualizes the redundancy of the top 50 dimensions in the MMBench benchmark, specifically focusing on the R-squared (R2) correlation coefficient. Each cell represents the correlation between two dimensions, with darker red indicating higher redundancy (stronger correlation) and darker blue indicating lower redundancy (weaker correlation). This visualization helps identify which dimensions in the benchmark measure similar capabilities, highlighting potential areas for improvement in benchmark design to minimize redundancy.
read the caption
(c) Top-50 R2 redundancy.

🔼 This figure shows a heatmap visualization of the redundancy among dimensions in the MMBench benchmark, specifically focusing on the Bottom-50 performing Multi-modal Large Language Models (MLLMs). The Spearman Rank Correlation Coefficient (SRCC) is used to measure the correlation between different dimensions’ performance rankings. Warmer colors (red) indicate higher correlation, suggesting redundancy because similar skills are being assessed repeatedly. Cooler colors (blue) indicate less correlation, suggesting independence and a broader skill coverage.
read the caption
(d) Bottom-50 SRCC redundancy.

🔼 This figure shows the redundancy of the dimensions within the MMBench benchmark for the bottom-performing 50 multi-modal large language models (MLLMs), using the Pearson Linear Correlation Coefficient (PLCC). The heatmap visualizes the correlation between different dimensions. High correlation (red) indicates that dimensions are highly redundant and measure similar capabilities, while low correlation (blue) suggests greater independence. This analysis helps identify redundant dimensions within the benchmark and inform improvements to its design.
read the caption
(e) Bottom-50 PLCC redundancy.

🔼 This figure is a bar plot visualizing the instance redundancy for the bottom-performing 50 multi-modal large language models (MLLMs) across various benchmarks, using the R-squared (R2) correlation coefficient as a measure of redundancy. Each bar represents the average R2 value across multiple sampling iterations, showing the correlation between the ranking of MLLMs on a full set of instances and their ranking on a randomly sampled subset of instances. The plot displays the redundancy level at various sampling percentages, revealing how representative a smaller number of instances is compared to the full set.
read the caption
(f) Bottom-50 R2 redundancy.

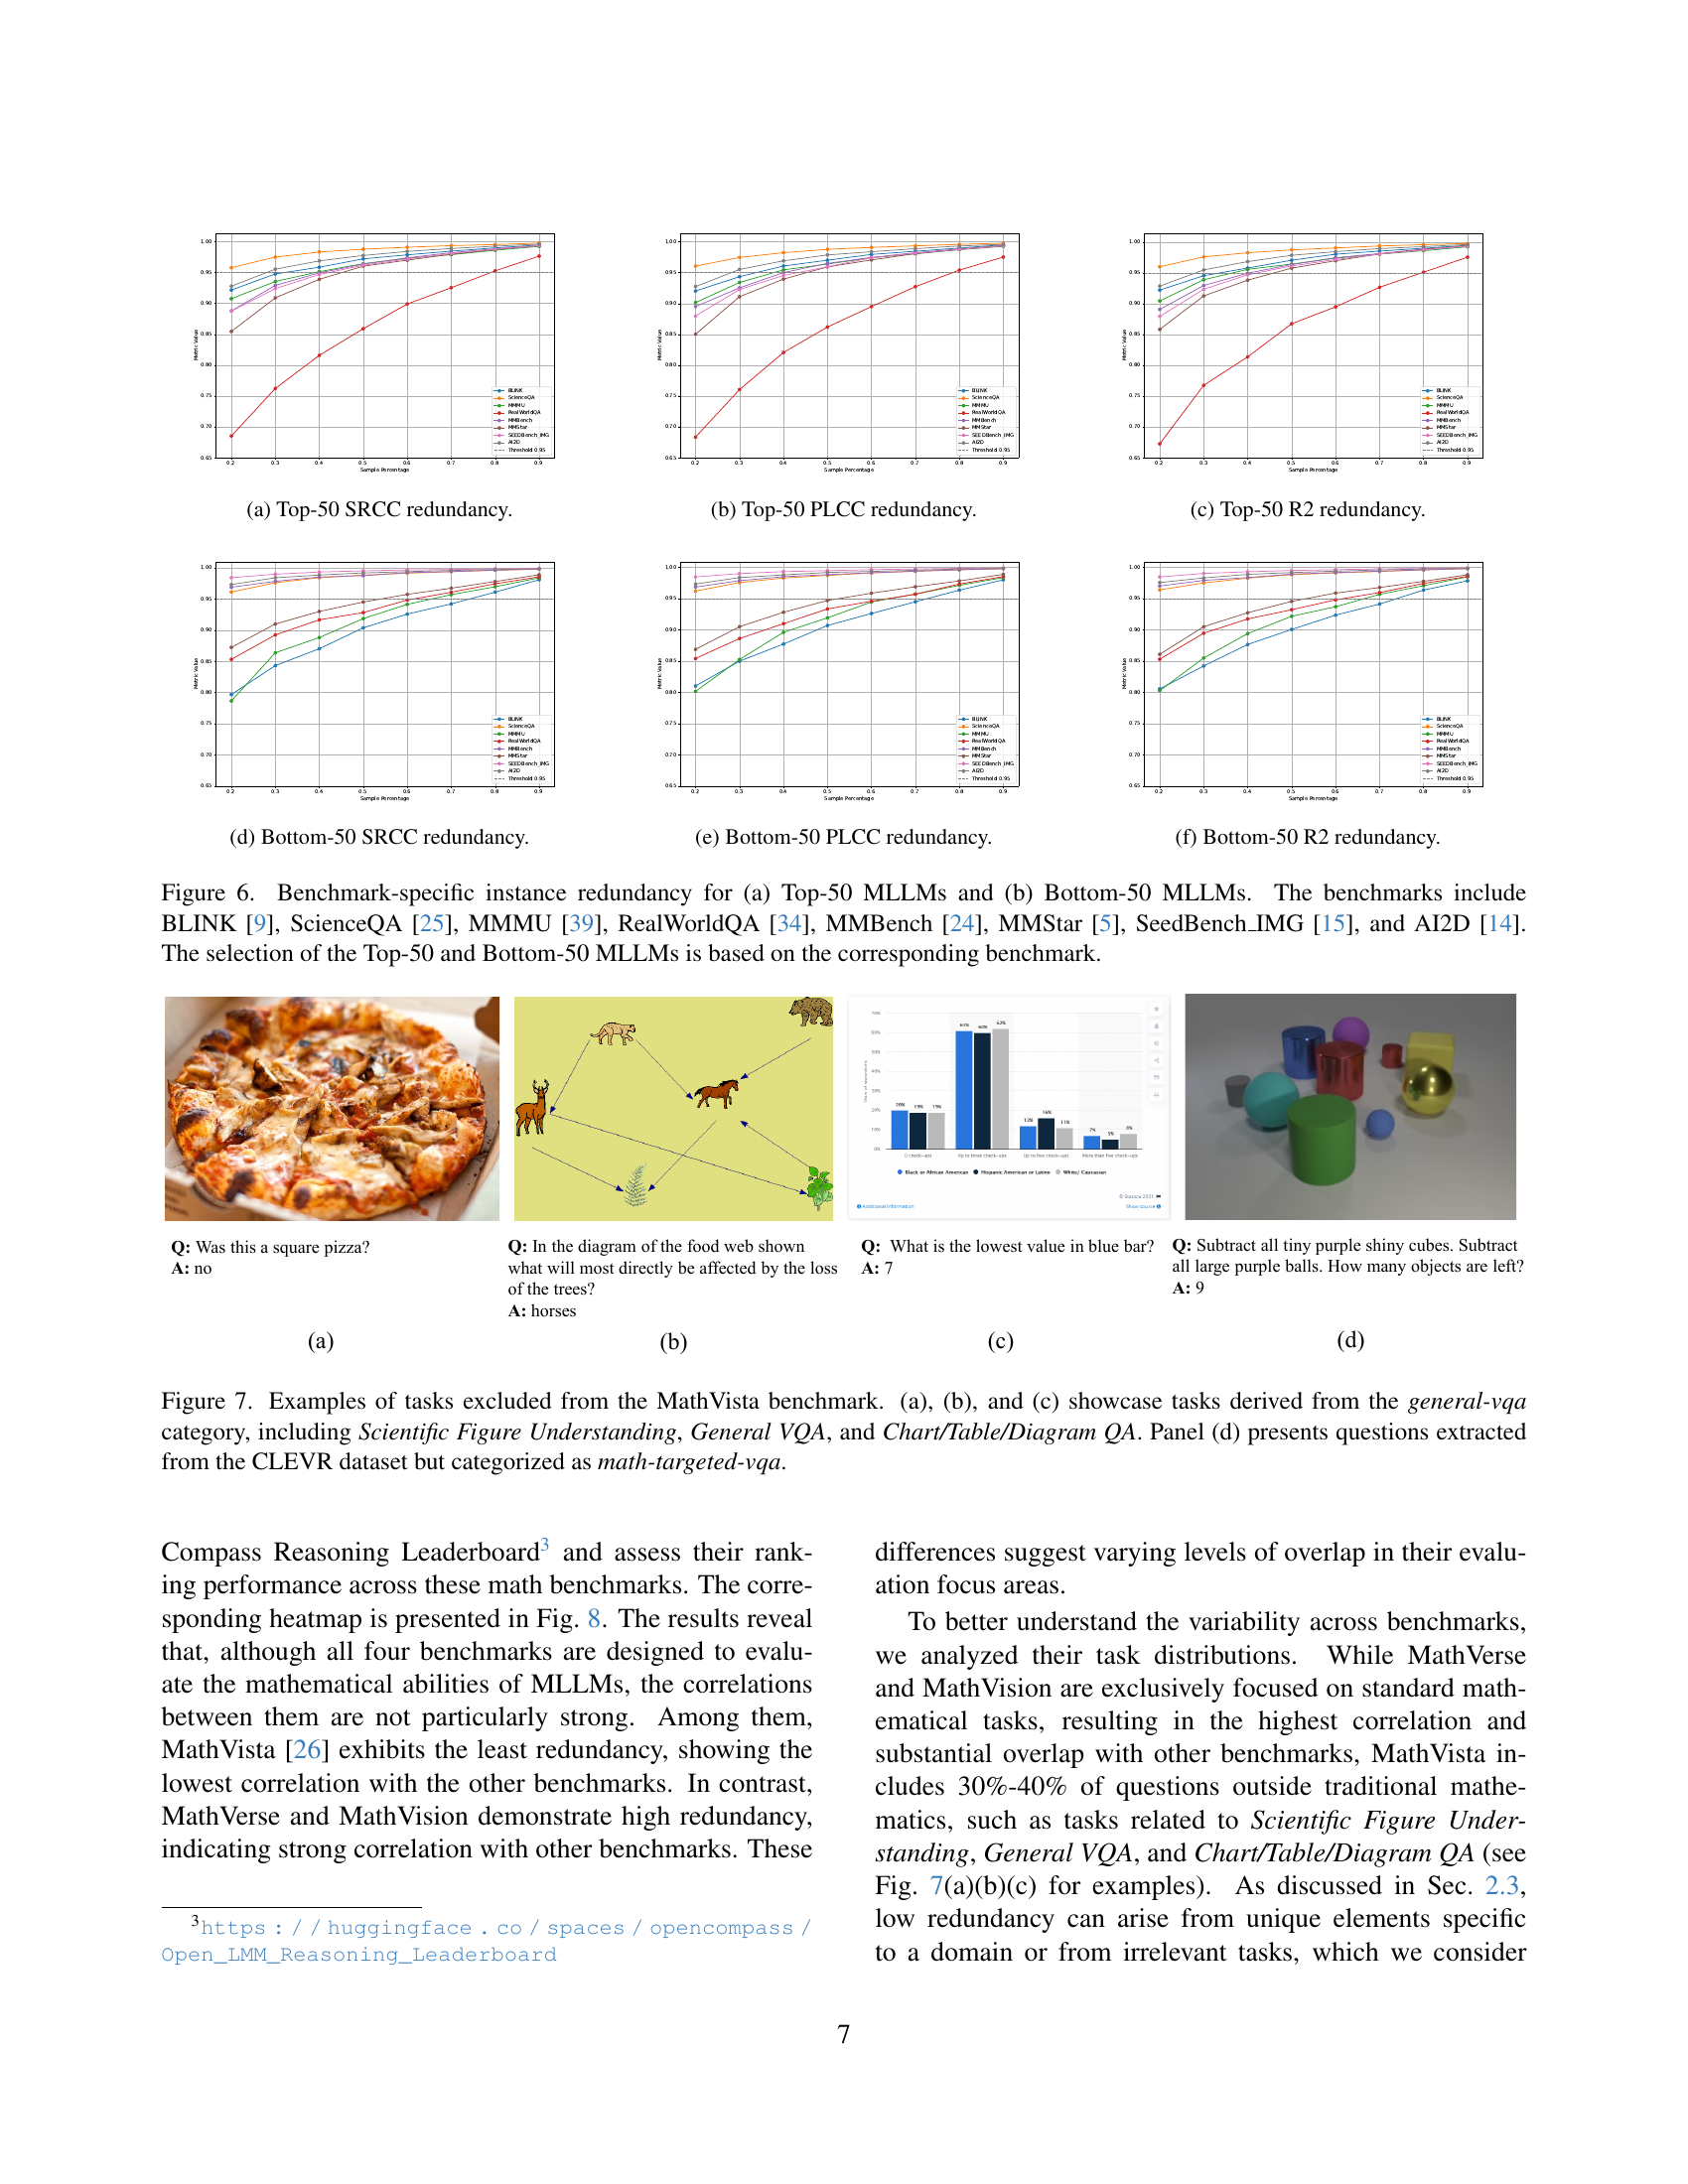
🔼 This figure visualizes the instance redundancy for two groups of Multi-modal Large Language Models (MLLMs) across various benchmarks. The x-axis represents the percentage of instances sampled from each benchmark, and the y-axis shows the average correlation (SRCC, PLCC, R2) between the rankings of the sampled instances and the full set of instances. The Top-50 group includes the 50 best performing MLLMs on each benchmark and the Bottom-50 group includes the remaining 50 MLLMs. The benchmarks used are: BLINK [9], ScienceQA [25], MMMU [39], RealWorldQA [34], MMBench [24], MMStar [5], SeedBench_IMG [15], and AI2D [14]. This visualization helps determine the redundancy of instances within each benchmark and whether a smaller subset could be used without losing much information regarding the models’ relative performance.
read the caption
Figure 6: Benchmark-specific instance redundancy for (a) Top-50 MLLMs and (b) Bottom-50 MLLMs. The benchmarks include BLINK [9], ScienceQA [25], MMMU [39], RealWorldQA [34], MMBench [24], MMStar [5], SeedBench_IMG [15], and AI2D [14]. The selection of the Top-50 and Bottom-50 MLLMs is based on the corresponding benchmark.
🔼 Figure 7 shows examples of question types excluded from the MathVista benchmark because they don’t focus on core mathematical reasoning. Panels (a), (b), and (c) present questions from the general visual question answering (VQA) category, including those involving scientific figure interpretation, general VQA, and chart/table/diagram analysis. These question types assess broader reasoning capabilities beyond pure mathematical skills. In contrast, panel (d) displays examples of math-related questions taken from the CLEVR dataset, yet these too were excluded from MathVista, indicating that MathVista maintains a stricter focus on specific mathematical reasoning tasks.
read the caption
Figure 7: Examples of tasks excluded from the MathVista benchmark. (a), (b), and (c) showcase tasks derived from the general-vqa category, including Scientific Figure Understanding, General VQA, and Chart/Table/Diagram QA. Panel (d) presents questions extracted from the CLEVR dataset but categorized as math-targeted-vqa.

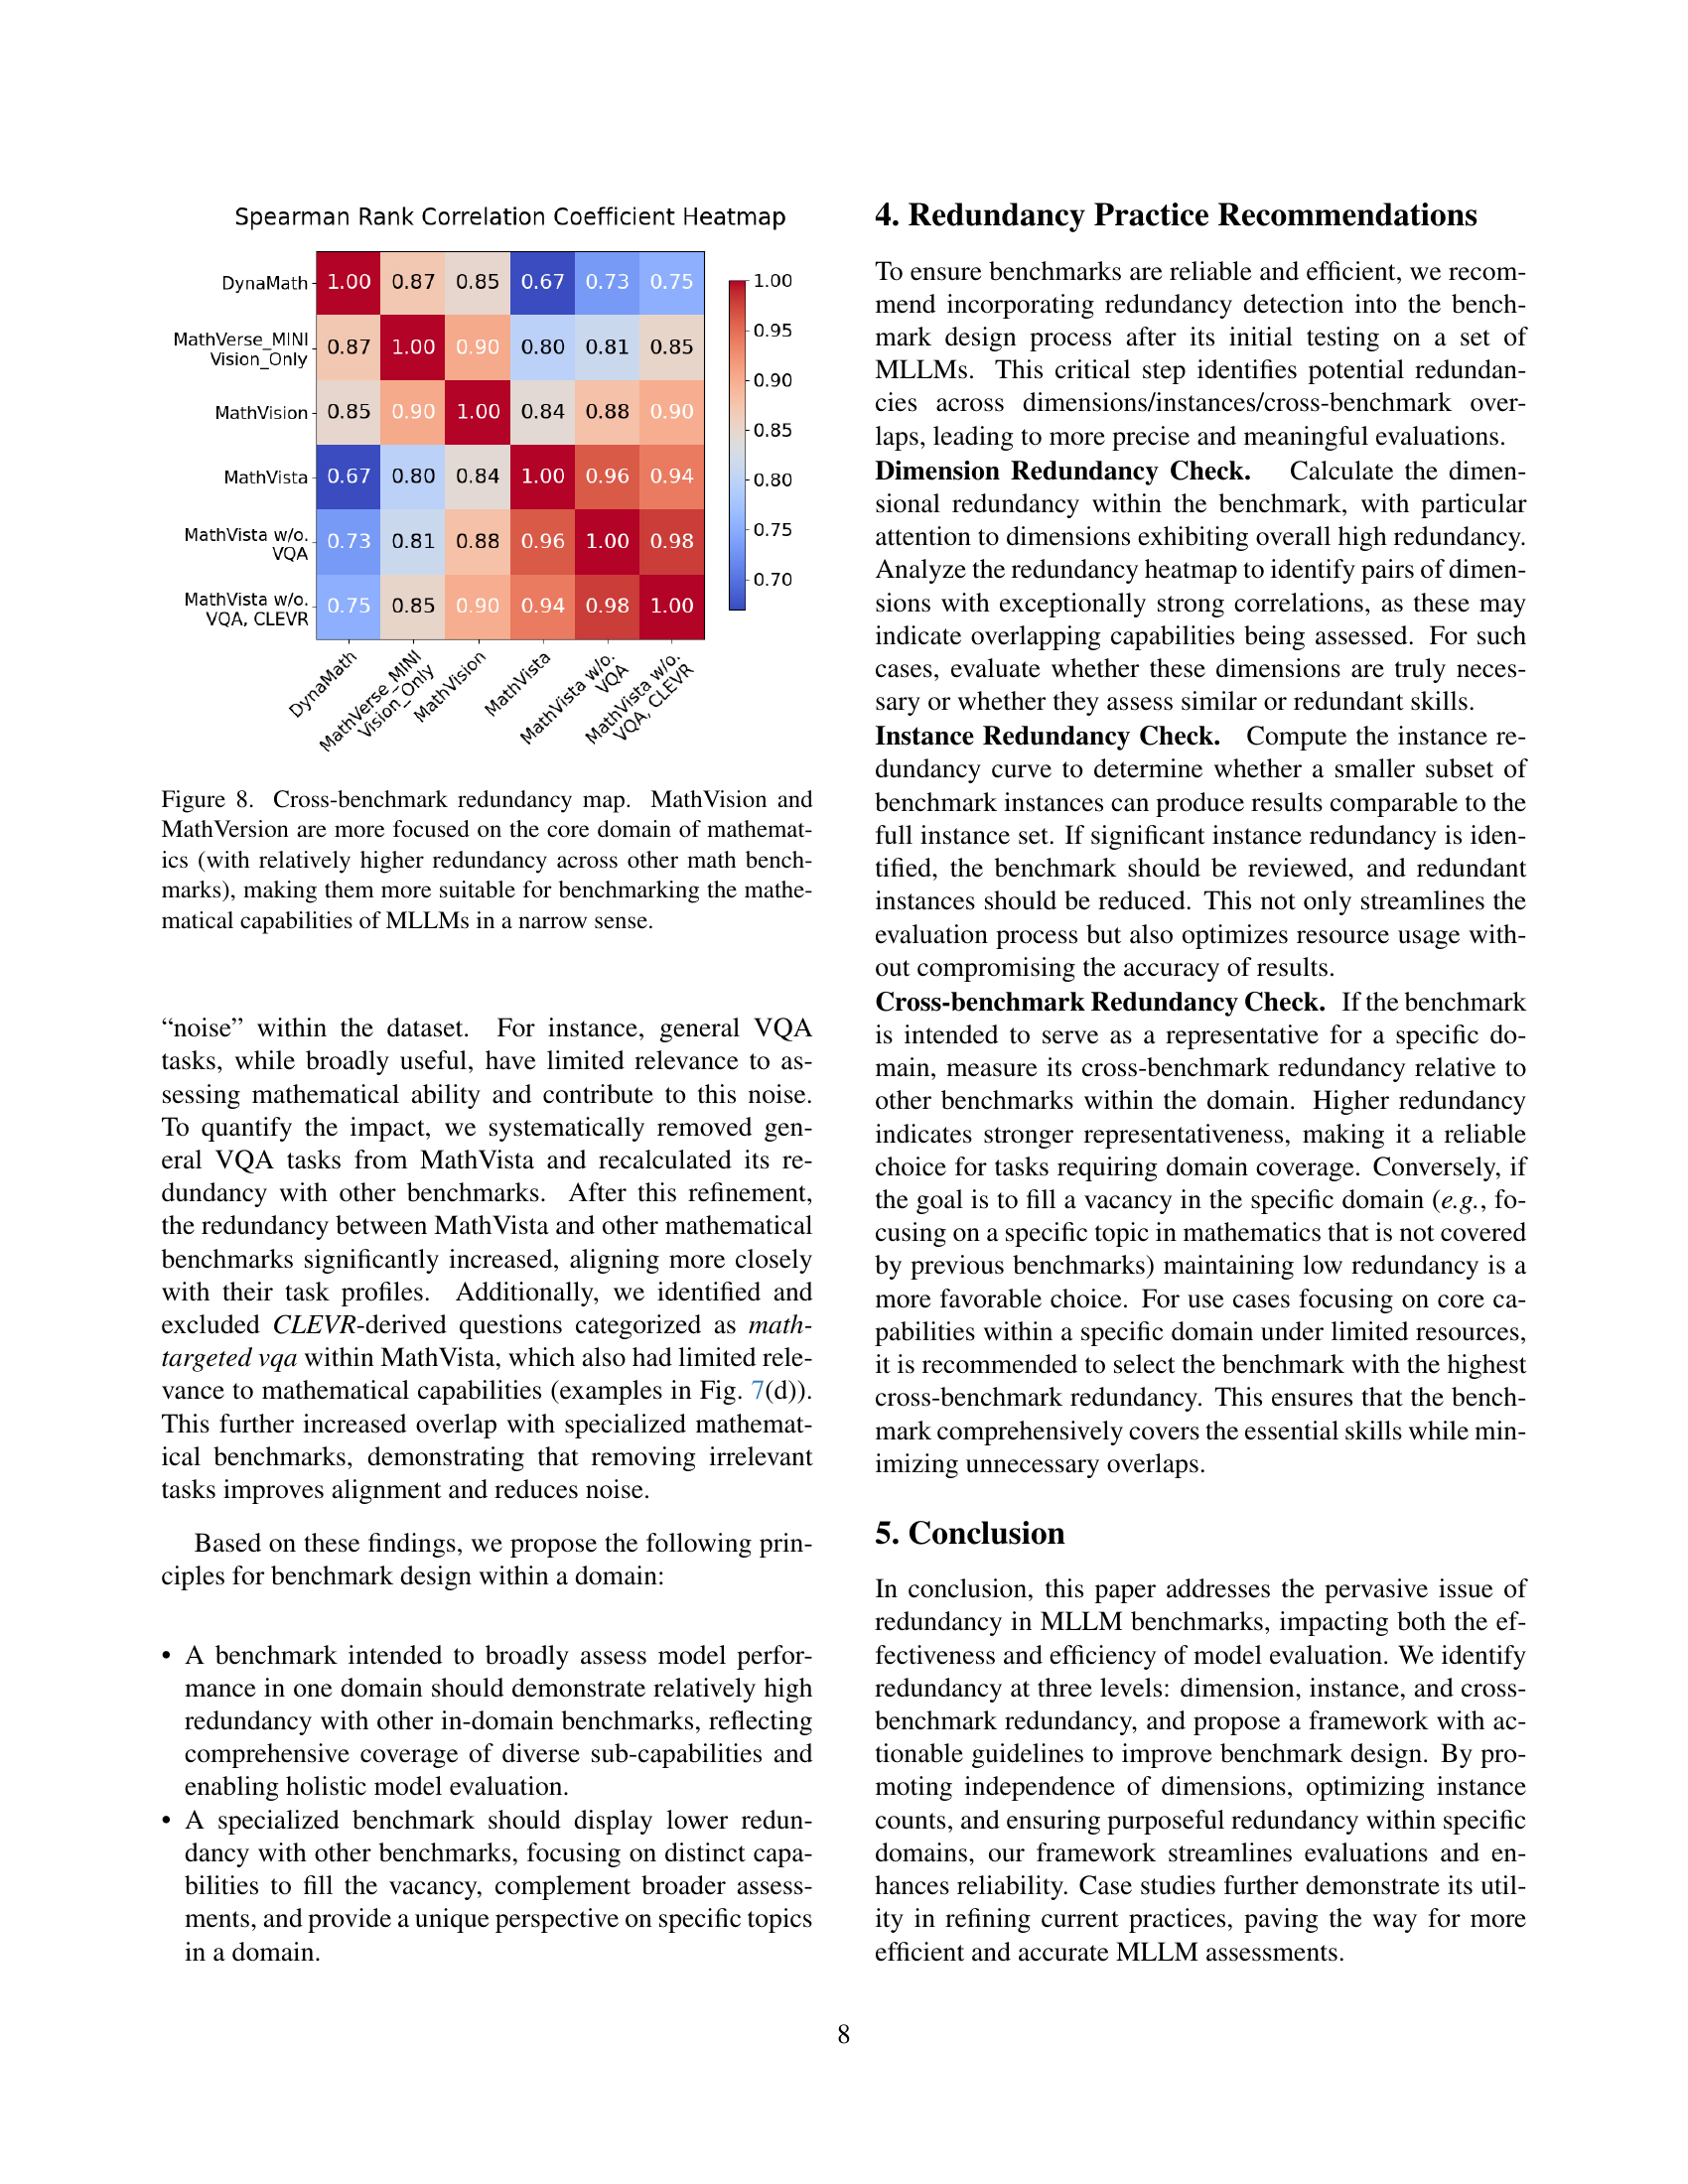
🔼 This figure displays a heatmap illustrating the redundancy among several mathematical benchmarks: MathVista, MathVision, MathVerse, and DynaMath. The heatmap shows the correlation of performance rankings across these benchmarks for a set of 37 Multi-modal Large Language Models (MLLMs). Warmer colors (red) indicate higher redundancy, signifying that the benchmarks assess similar mathematical capabilities. Cooler colors (blue) represent lower redundancy, suggesting the benchmarks evaluate distinct aspects of mathematical reasoning. The caption highlights that MathVision and MathVerse exhibit greater redundancy with other mathematical benchmarks, indicating that they may be more suitable for evaluating core mathematical capabilities of MLLMs compared to MathVista, which shows lower redundancy and thus broader mathematical skill assessment.
read the caption
Figure 8: Cross-benchmark redundancy map. MathVision and MathVersion are more focused on the core domain of mathematics (with relatively higher redundancy across other math benchmarks), making them more suitable for benchmarking the mathematical capabilities of MLLMs in a narrow sense.
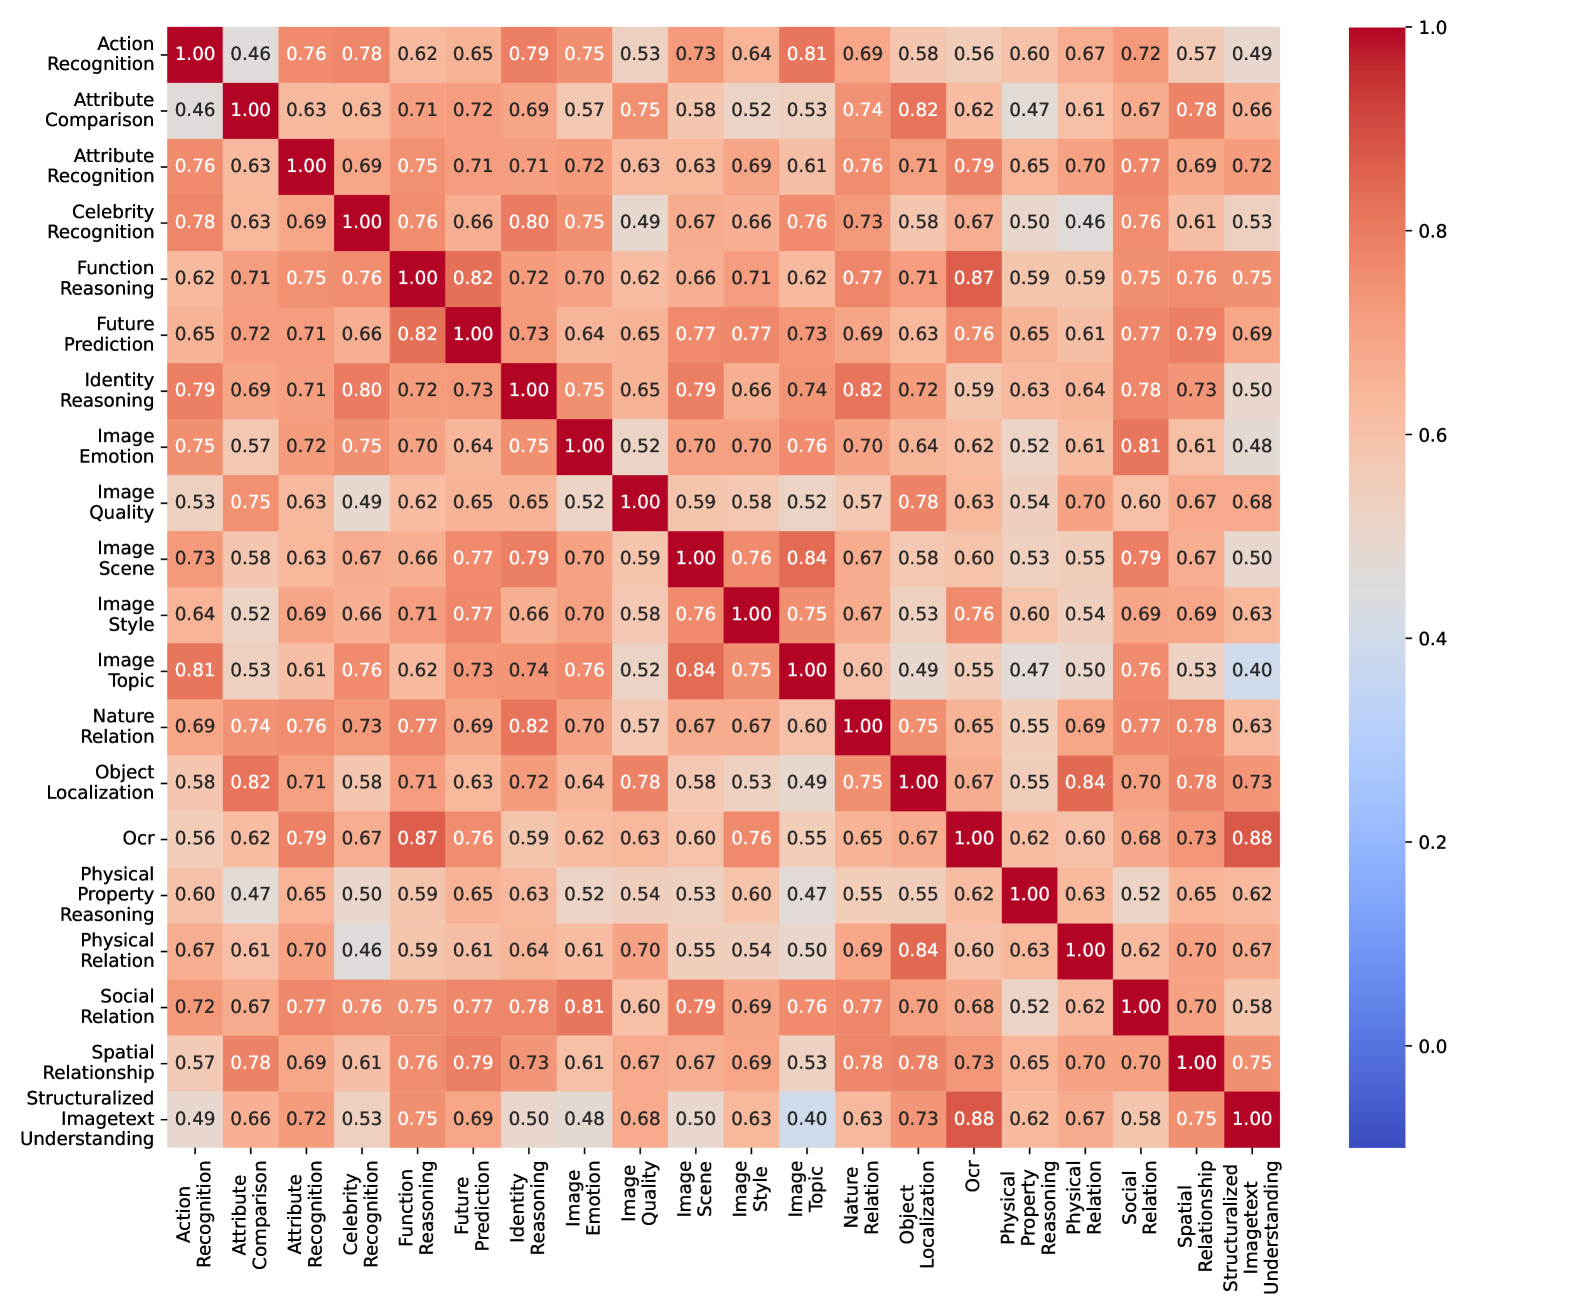
🔼 This figure visualizes the redundancy of dimensions within the MMBench benchmark for the top 50 performing Multi-modal Large Language Models (MLLMs). It shows a heatmap representing the Spearman Rank Correlation Coefficient (SRCC) between different dimensions. Darker colors indicate higher correlation, suggesting a higher degree of redundancy where multiple dimensions assess similar capabilities.
read the caption
(a) Top-50 SRCC dimensions redundancy map.

🔼 This heatmap visualizes the redundancy among the top 50 dimensions in the MMBench benchmark using the Pearson Linear Correlation Coefficient (PLCC). Each cell represents the PLCC between two dimensions, indicating the level of redundancy. Darker red cells denote higher redundancy, suggesting strong correlation in MLLM performance rankings across those dimensions, whereas lighter blue cells represent lower redundancy and less correlated performance. This visualization helps identify sets of dimensions that may be evaluating similar capabilities of MLLMs, potentially pointing towards areas for optimization and refinement of the benchmark.
read the caption
(b) Top-50 PLCC dimensions redundancy map.

🔼 This heatmap visualizes the redundancy among the top 50 performing dimensions of the MMBench benchmark, specifically focusing on the R-squared (R2) correlation metric. Each cell represents the R2 correlation coefficient between two dimensions, indicating the extent to which their performance rankings across various multimodal language models (MLLMs) are correlated. Warmer colors (red) show higher correlation signifying greater redundancy (i.e., the two dimensions measure similar capabilities) and cooler colors (blue) represent lower correlation and less redundancy.
read the caption
(c) Top-50 R2 dimensions redundancy map.

🔼 This heatmap visualizes the redundancy among the bottom-performing 50 Multimodal Large Language Models (MLLMs) across various dimensions within the MMBench benchmark. Each cell represents the Spearman Rank Correlation Coefficient (SRCC) between two dimensions, indicating the degree of overlap in their assessment of MLLM capabilities. Warmer colors (red) represent higher redundancy, suggesting that the dimensions evaluate similar capabilities, while cooler colors (blue) indicate lower redundancy and more distinct capabilities.
read the caption
(d) Bottom-50 SRCC dimensions redundancy map.

🔼 This heatmap visualizes the redundancy among the bottom 50 performing Multi-modal Large Language Models (MLLMs) in terms of their Pearson Linear Correlation Coefficient (PLCC) scores across different dimensions of the MMBench benchmark. Each cell’s color intensity represents the PLCC between two dimensions, indicating their level of redundancy. Darker colors signify higher redundancy, implying that the models’ performance across those two dimensions is strongly correlated. Lighter colors represent lower redundancy. This visualization helps understand which dimensions measure similar aspects of MLLM capabilities, highlighting potential areas for improvement in benchmark design.
read the caption
(e) Bottom-50 PLCC dimensions redundancy map.

🔼 This heatmap visualizes the redundancy of dimensions in the MMBench benchmark for the bottom-performing 50 multi-modal large language models (MLLMs) using the R-squared (R2) correlation coefficient. Each cell represents the correlation between two dimensions, with darker colors indicating higher redundancy (stronger correlation). It helps identify dimensions which are highly correlated, meaning that they measure similar aspects of MLLM capabilities and might be redundant.
read the caption
(f) Bottom-50 R2 dimensions redundancy map.

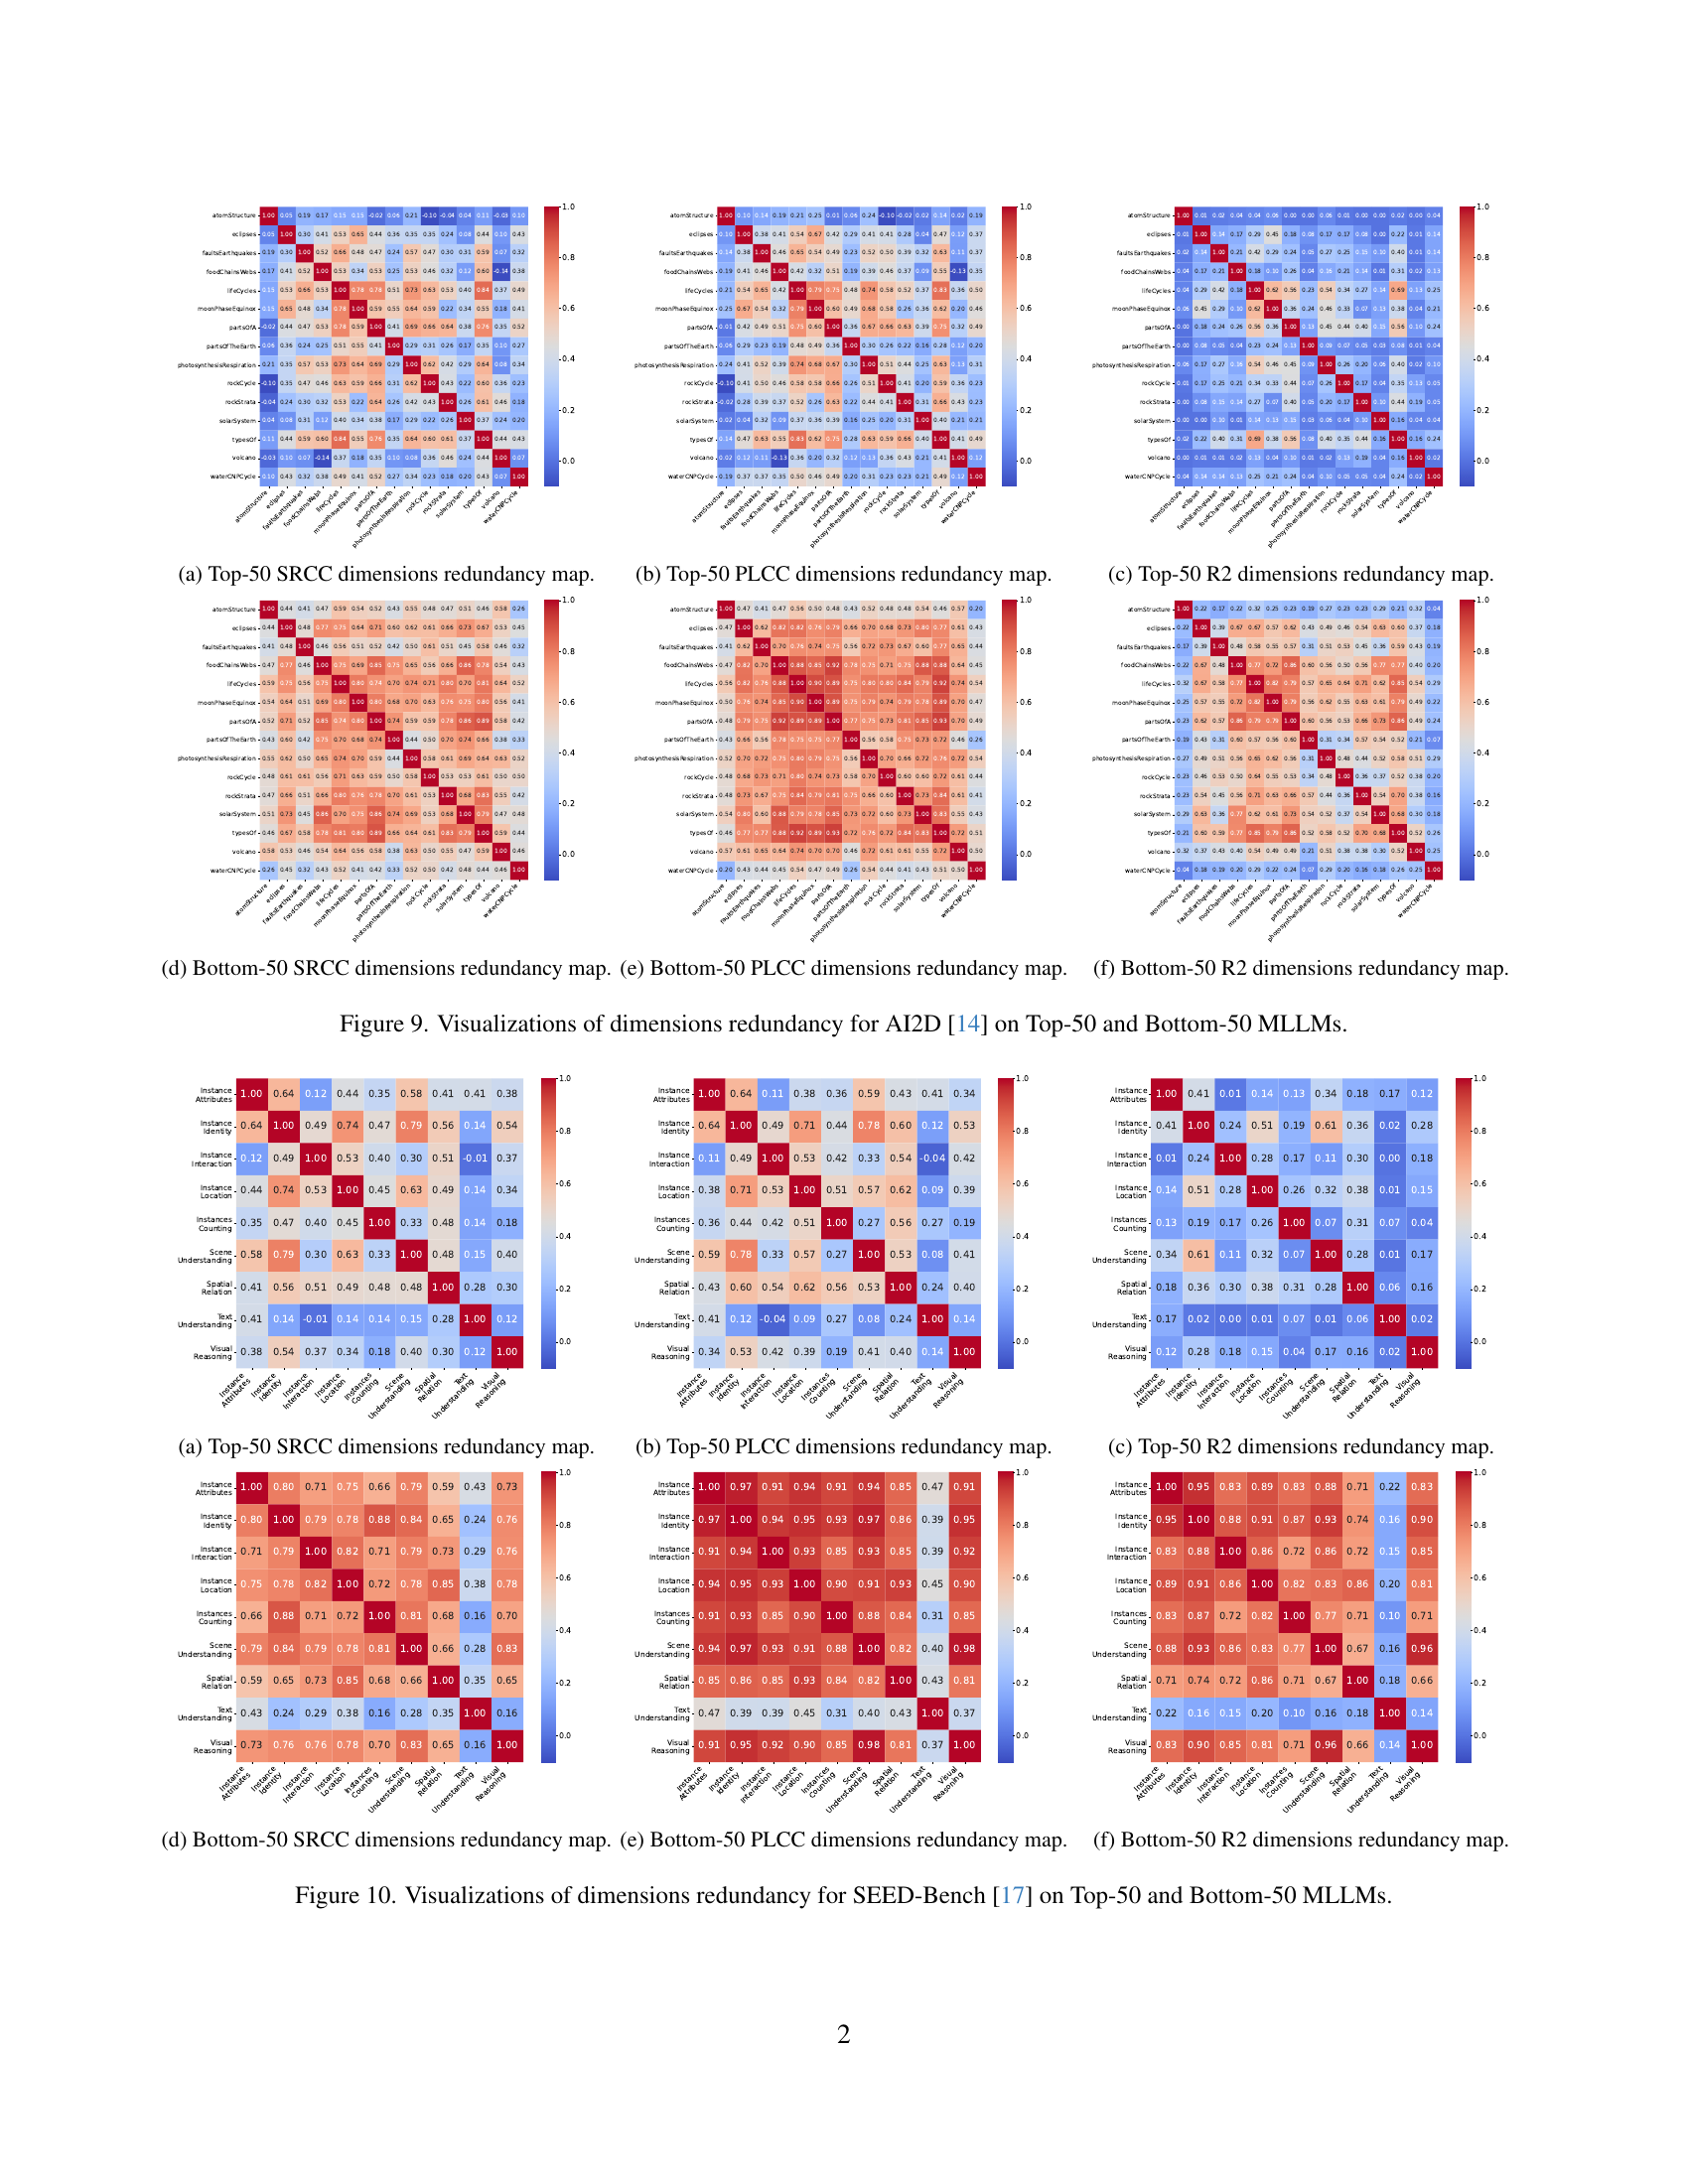
🔼 This figure displays heatmaps and bar plots illustrating the redundancy among dimensions within the AI2D benchmark, separately analyzed for the top-performing 50 and bottom-performing 50 Multimodal Large Language Models (MLLMs). The heatmaps visualize the correlation between different dimensions, indicating the degree of overlap in the capabilities they assess. The bar plots summarize the overall redundancy for each dimension. The analysis helps to identify redundant dimensions that could be consolidated or removed to improve benchmark efficiency and provide more independent insights into MLLM capabilities.
read the caption
Figure 9: Visualizations of dimensions redundancy for AI2D [14] on Top-50 and Bottom-50 MLLMs.
Full paper#