TL;DR#
Diffusion models generate data by aligning a learned distribution with a real data distribution. However, limitations in data, models, and training methods lead to a gap between generated and real data. This paper addresses this issue by introducing a novel framework called Weak-to-Strong Diffusion (W2SD). W2SD utilizes the difference between existing weak and strong models to estimate the gap between the strong model and an ideal model.
W2SD employs a reflective operation that iteratively refines latent variables during the sampling process. By strategically alternating between denoising and inversion, W2SD effectively steers sampling trajectories toward regions of higher density in the real data distribution. Experiments show that W2SD substantially enhances human preference, aesthetic quality, and adherence to prompts, surpassing state-of-the-art results across multiple modalities and benchmarks. W2SD’s flexibility allows for strategic selection of model pairs to achieve diverse improvements, demonstrating its broad applicability and practical utility.
Key Takeaways#
Why does it matter?#
This paper is important because it introduces a novel framework, W2SD, that significantly improves the quality of diffusion models. W2SD leverages the difference between weak and strong models to approximate the gap between the strong model and an ideal model, leading to substantial improvements across various metrics and modalities. This offers a new perspective on improving diffusion models and has the potential to advance research in various related fields. The framework’s flexibility and broad applicability also makes it valuable for researchers working with different model architectures and datasets.
Visual Insights#

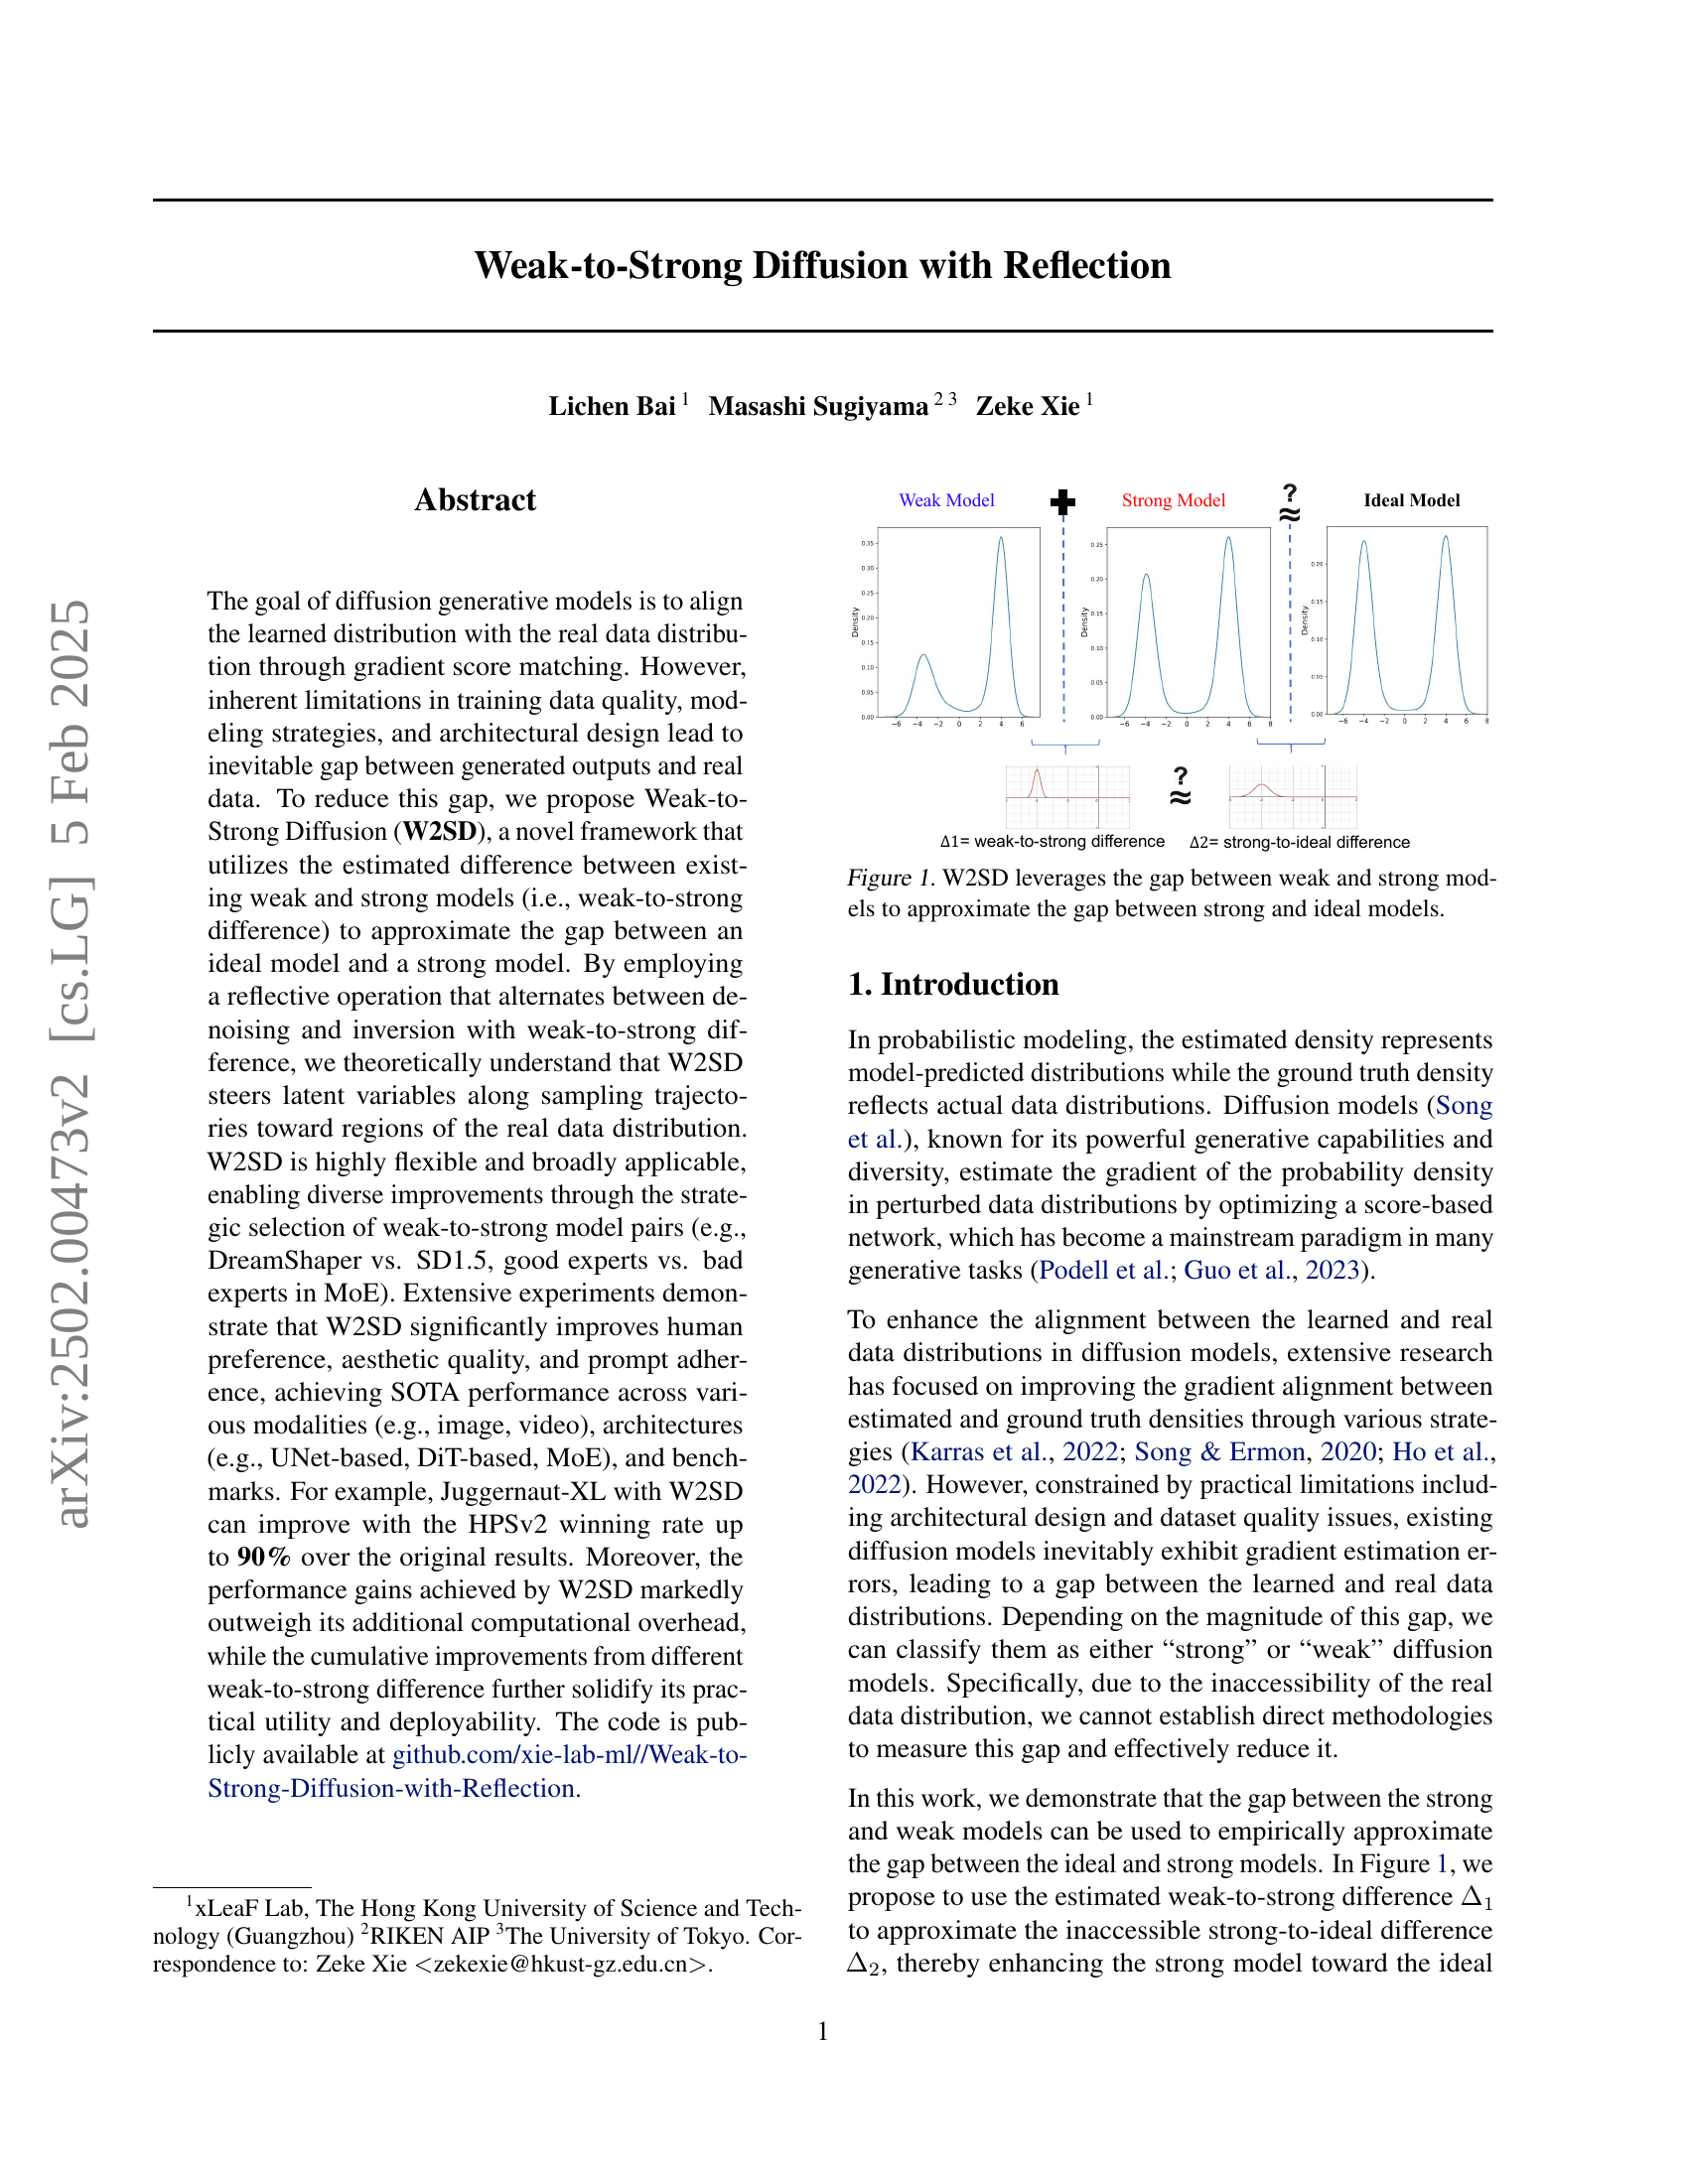
🔼 This figure illustrates the core concept of the Weak-to-Strong Diffusion with Reflection (W2SD) method. It shows that the difference in probability density between a ‘weak’ diffusion model and a ‘strong’ diffusion model can be used as a proxy for the difference between the strong model and an ‘ideal’ model (perfectly aligned with the true data distribution). W2SD uses this approximation to iteratively refine the strong model’s outputs, moving them closer to the ideal distribution. The graphic displays three probability density functions: one representing a weak model, one representing a strong model, and one representing an ideal model. The arrows highlight how the weak-to-strong difference informs the adjustments made to the strong model towards the ideal model.
read the caption
Figure 1: W2SD leverages the gap between weak and strong models to approximate the gap between strong and ideal models.
| Method | HPS v2 | AES | PickScore | MPS |
|---|---|---|---|---|
| SD1.5 | 24.9558 | 5.5003 | 20.1368 | - |
| DreamShaper | 30.1477 | 6.1155 | 21.5035 | 46.8705 |
| W2SD | 30.4924 | 6.2478 | 21.5727 | 53.1304 |
| SDXL | 29.8701 | 6.0939 | 21.6487 | - |
| Juggernaut-XL | 31.6412 | 5.9790 | 22.1903 | 45.7397 |
| W2SD | 32.0992 | 6.0712 | 22.2434 | 54.2634 |
🔼 This table presents a quantitative comparison of different methods on the Pick-a-Pic dataset, focusing on the impact of using the Weak-to-Strong Diffusion with Reflection (W2SD) method. It shows the improvements achieved by W2SD in terms of human preference, as measured by several metrics including HPSv2, AES, PickScore and MPS. The table compares the performance of W2SD against standard diffusion models (SD1.5 and DreamShaper) and a more advanced model (SDXL) to highlight the consistent improvements across different base models, and showcases the significant performance gains obtained by leveraging W2SD for improved image generation quality.
read the caption
Table 1: Quantitative results of W2SD based on a full parameter fine-tuning strategy. Our method generates results better aligned with human preferences. Datasets: Pick-a-Pic.
In-depth insights#
Weak-to-Strong Diff#
The concept of “Weak-to-Strong Diff” presents a novel approach to enhance diffusion models. It leverages the difference in density gradients between a weaker and stronger model to approximate the gap between a strong model and an ideal model. This difference is used to guide the sampling process, effectively steering latent variables towards regions representing the true data distribution. The method’s strength lies in its flexibility and broad applicability, allowing diverse improvements by strategically selecting model pairs. This approach offers a theoretical understanding of how the weak-to-strong difference can enhance sampling trajectories, improving results in various modalities, architectures, and benchmarks. The reflective operation employed further enhances the effectiveness, as it iteratively refines the latent variables. Computational overhead appears minimal, suggesting a practical and impactful approach to improving generative models.
Reflection’s Role#
The concept of ‘Reflection’s Role’ in the context of a research paper likely revolves around iterative refinement and feedback mechanisms. It suggests a process where generated outputs are evaluated against a benchmark (potentially an ideal model or a stronger model), and the discrepancies are used to adjust subsequent iterations. This implies that reflection is not a passive process but an active feedback loop. The effectiveness hinges on the choice of what constitutes the reflection benchmark (strong vs. weak model comparison). This choice critically determines the direction and magnitude of improvement, with mismatched benchmarks potentially leading to detrimental effects. The iterative nature suggests that successive refinements can accumulate into substantial overall improvement, but also highlights the importance of careful design and the selection of appropriate comparison models to maximize the benefits of this feedback loop.
W2SD Algorithm#
The W2SD algorithm is a novel framework for enhancing diffusion model inference. It leverages the concept of weak-to-strong model differences to approximate the inaccessible gap between a strong model and an ideal model. The core innovation lies in its reflective operation, which alternates between denoising using a strong model and inversion using a weak model guided by the estimated weak-to-strong difference. This iterative process theoretically steers latent variables towards the true data distribution, refining the generated samples. The algorithm’s flexibility is highlighted by its adaptability to various model pairs and its capacity to combine with existing inference enhancement methods, further amplifying its effectiveness. The effectiveness hinges on how well the weak-to-strong difference approximates the strong-to-ideal difference, demonstrating a theoretical understanding of its mechanism. Empirical results across different modalities, architectures, and datasets underscore its significant improvements in multiple evaluation metrics, showcasing its broad applicability and practical utility.
Empirical Analyses#
An Empirical Analysis section in a research paper would rigorously evaluate the proposed method’s performance. It would likely present quantitative results, comparing the novel approach against existing state-of-the-art methods across multiple metrics and datasets. Key aspects would include the statistical significance of any performance gains, demonstrating the method’s reliability and not just random chance. The analysis should also explore the method’s efficiency and scalability, considering computational cost and resource usage. A thorough empirical analysis would explore potential limitations of the approach, presenting scenarios where the method underperforms and offering potential explanations. Visualizations such as graphs and charts are crucial for effectively communicating the results. Finally, an insightful discussion would interpret the findings, relating them back to the method’s underlying principles and theoretical framework, potentially suggesting future research directions.
Future of W2SD#
The future of Weak-to-Strong Diffusion with Reflection (W2SD) appears bright, given its strong empirical performance and theoretical foundation. Further research could explore more sophisticated methods for estimating the weak-to-strong difference, perhaps leveraging advanced techniques from density estimation or optimal transport. Investigating the impact of different weak-strong model pairings on various downstream tasks is crucial to unlock W2SD’s full potential across diverse applications. Extending W2SD to other generative models beyond diffusion models is a promising avenue for broader impact. For example, applying the reflective mechanism to GANs or VAEs could lead to novel architectures and improved generation quality. Finally, a more in-depth theoretical analysis could help clarify the underlying mechanisms of W2SD and guide future improvements. Specifically, rigorously analyzing the conditions under which the weak-to-strong difference accurately approximates the strong-to-ideal difference would strengthen the theoretical justification of the method. Addressing these research questions will further solidify W2SD’s position as a powerful tool in the field of generative modeling.
More visual insights#
More on figures

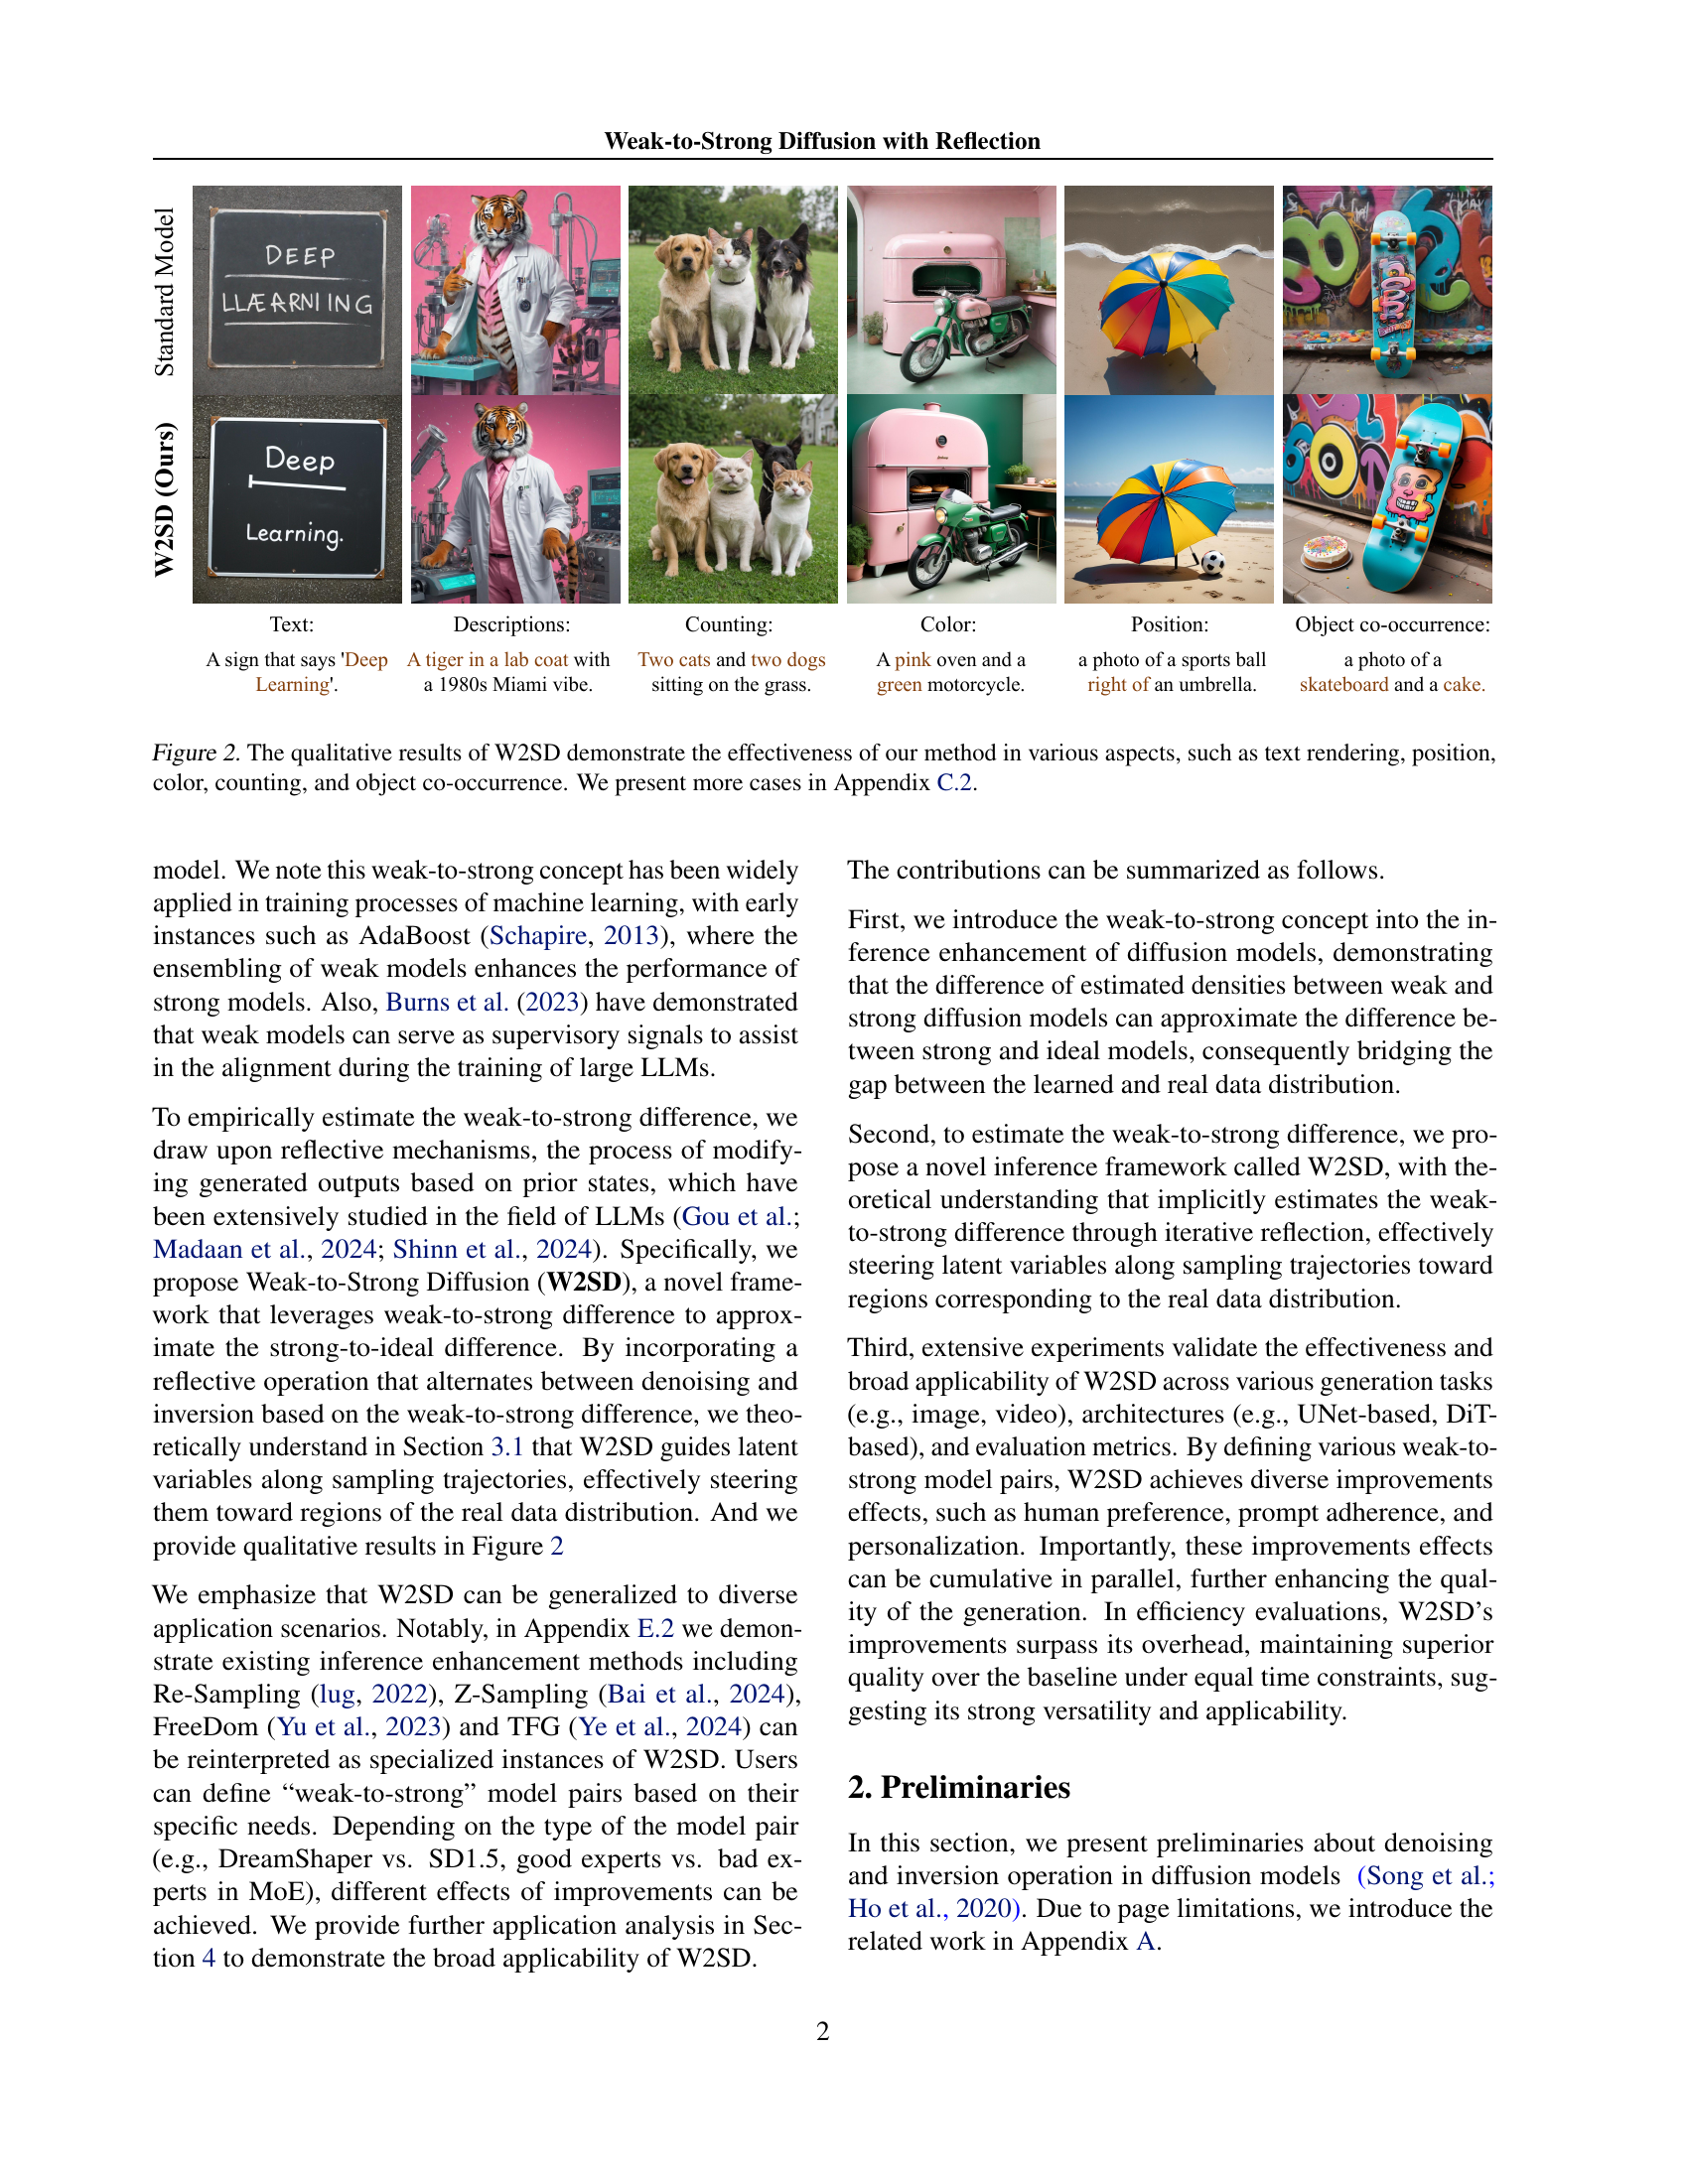
🔼 Figure 2 presents a qualitative comparison of image generation results between a standard diffusion model and the proposed Weak-to-Strong Diffusion with Reflection (W2SD) method. The figure showcases examples highlighting W2SD’s improvements across multiple aspects of image generation. These aspects include accurate text rendering within images, precise object positioning, correct color representation, accurate counting of objects, and appropriate co-occurrence of objects within a scene. The results suggest that W2SD enhances the overall quality and coherence of generated images. More examples are available in Appendix C.2.
read the caption
Figure 2: The qualitative results of W2SD demonstrate the effectiveness of our method in various aspects, such as text rendering, position, color, counting, and object co-occurrence. We present more cases in Appendix C.2.

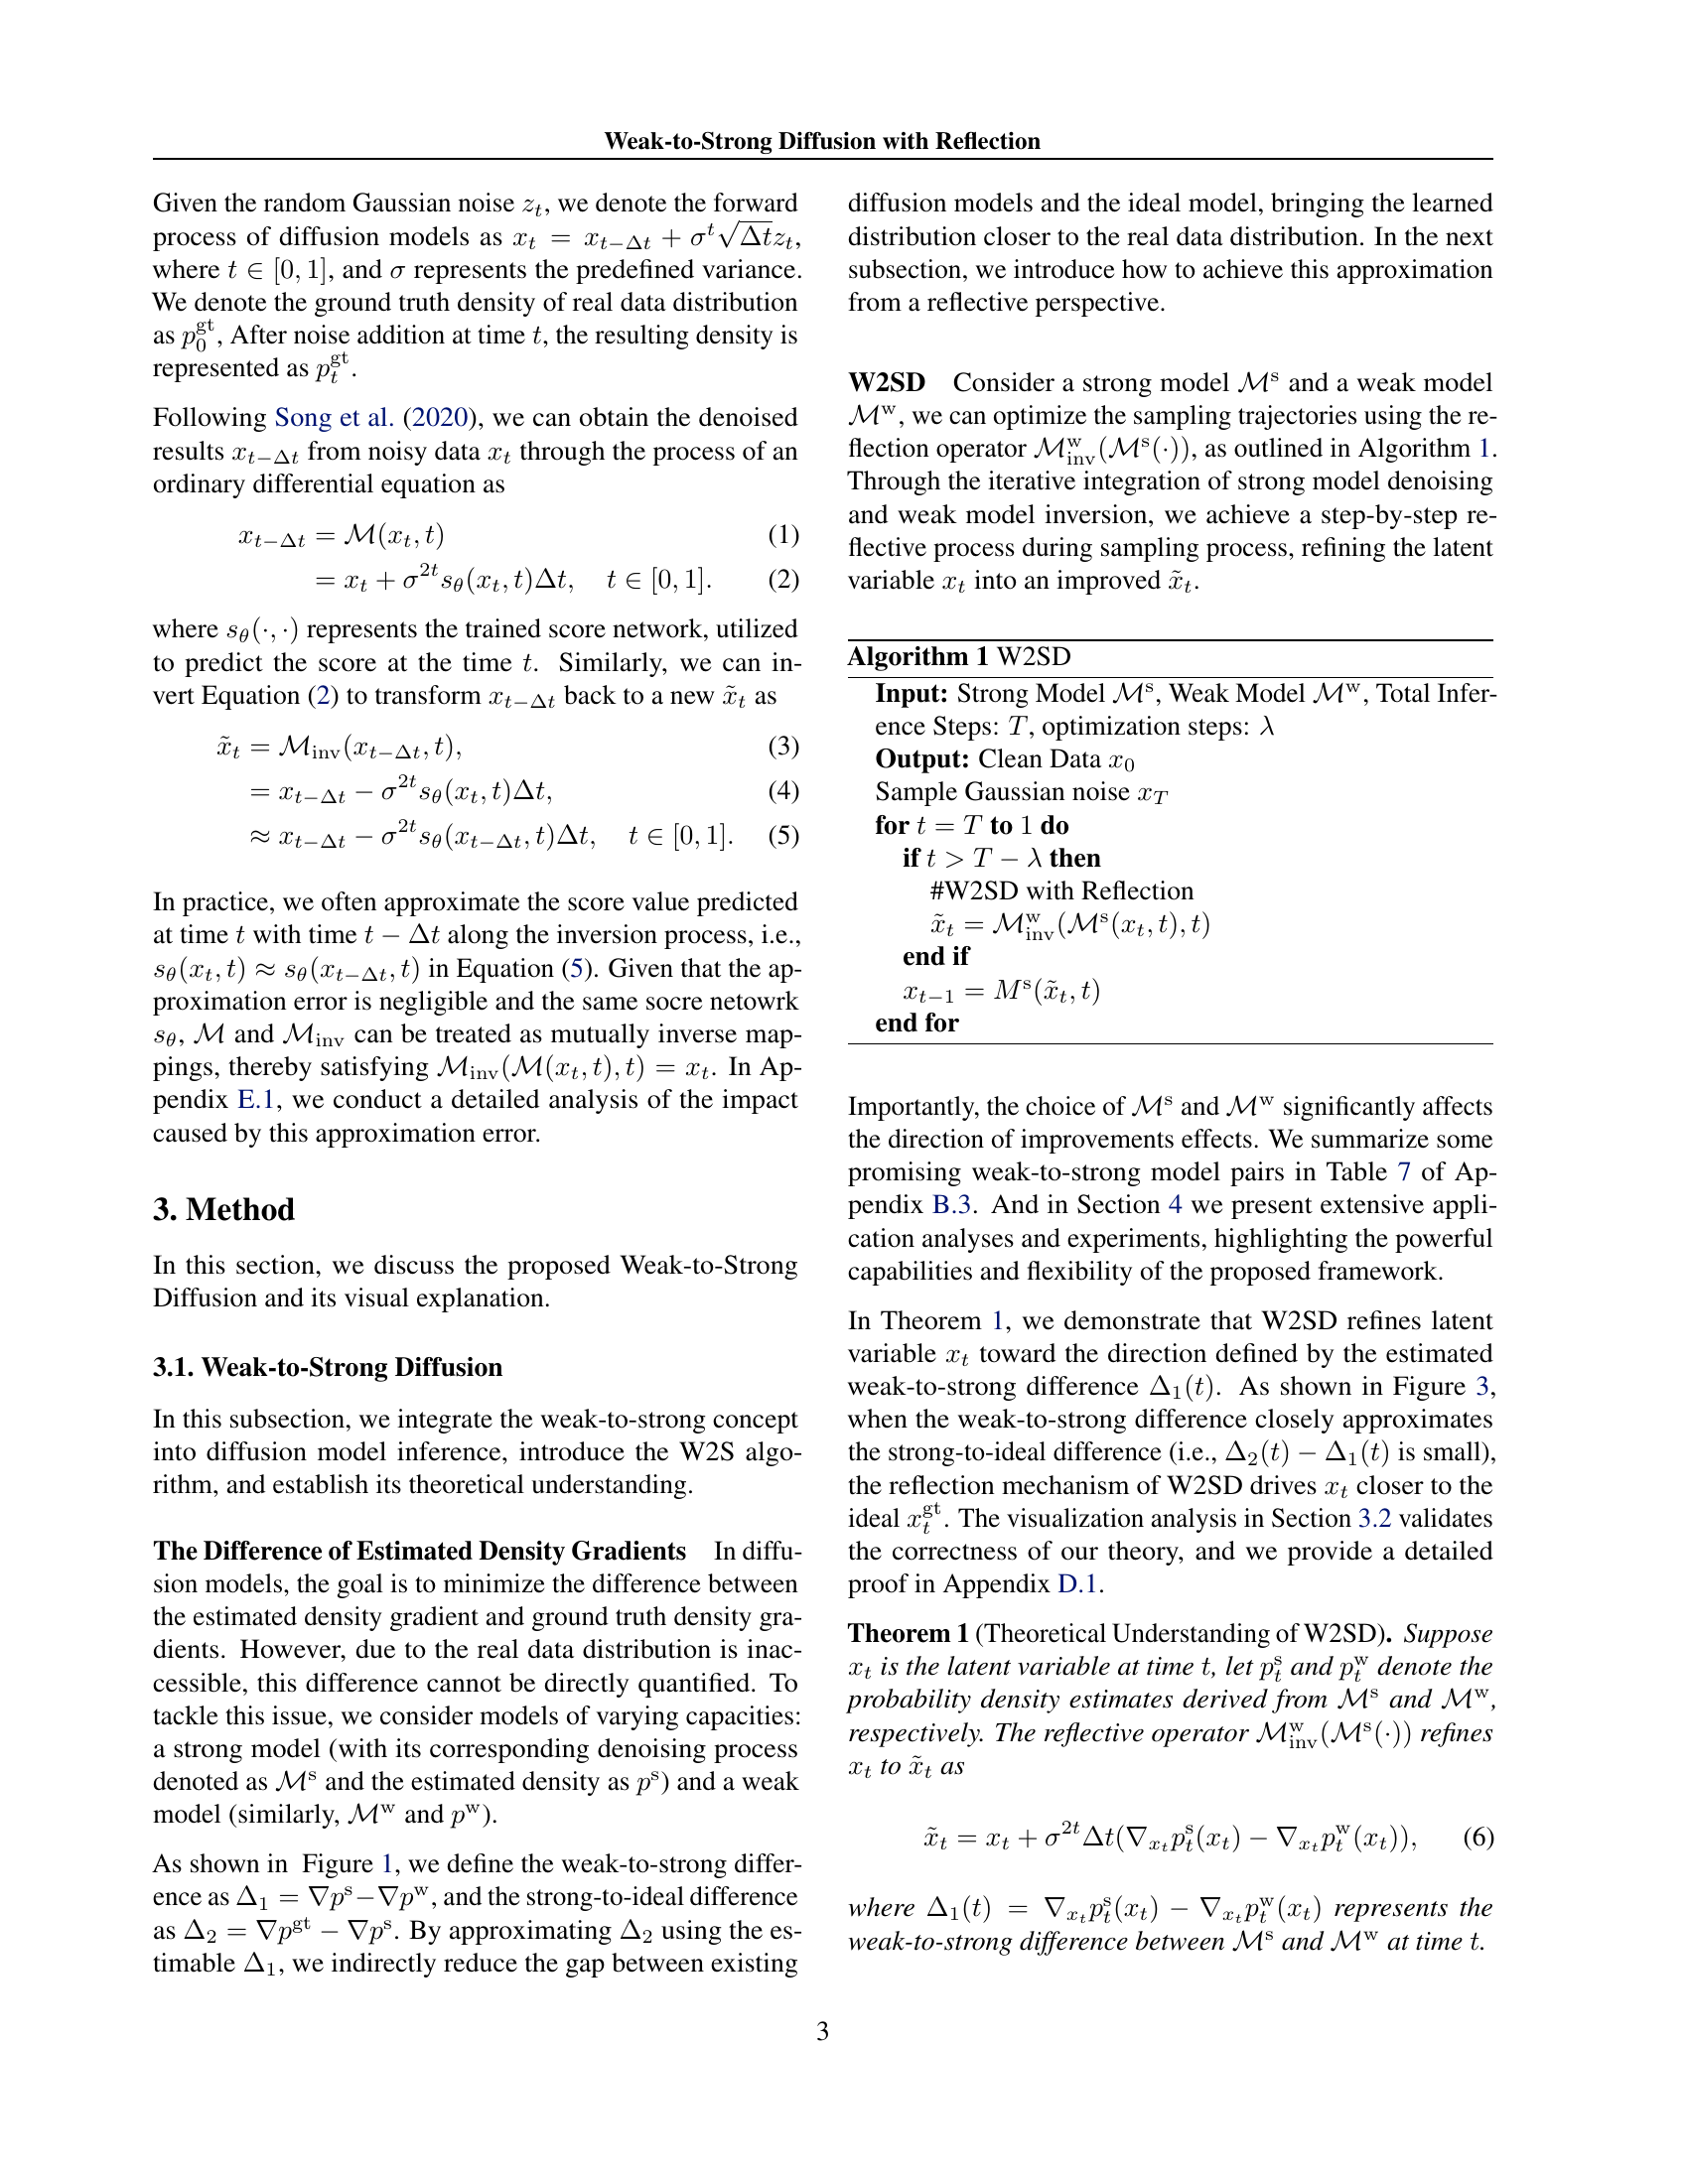
🔼 This figure illustrates the core concept of Weak-to-Strong Diffusion with Reflection (W2SD). It shows how W2SD uses the difference between a weak and a strong diffusion model to approximate the gap between the strong model and an ideal model that perfectly represents the real data distribution. The figure visually demonstrates that by iteratively applying a reflective operation that uses the weak-to-strong difference (Δ₁), the latent variable (x̃t) is guided towards the ideal latent variable (xgt). When the weak-to-strong difference is a good approximation of the strong-to-ideal difference (Δ₂ - Δ₁ is small), the refined latent variable converges to the ideal latent variable, thereby improving the quality of the generated samples.
read the caption
Figure 3: Visualizing the effectiveness of W2SD. When the weak-to-strong difference closely approximates the strong-to-ideal difference (e.g., Δ2(t)−Δ1(t)subscriptΔ2𝑡subscriptΔ1𝑡\Delta_{2}(t)-\Delta_{1}(t)roman_Δ start_POSTSUBSCRIPT 2 end_POSTSUBSCRIPT ( italic_t ) - roman_Δ start_POSTSUBSCRIPT 1 end_POSTSUBSCRIPT ( italic_t ) is small), the refined latent variable x~tsubscript~𝑥𝑡\tilde{x}_{t}over~ start_ARG italic_x end_ARG start_POSTSUBSCRIPT italic_t end_POSTSUBSCRIPT converges to the ideal latent variable xtgtsuperscriptsubscript𝑥𝑡gtx_{t}^{\mathrm{gt}}italic_x start_POSTSUBSCRIPT italic_t end_POSTSUBSCRIPT start_POSTSUPERSCRIPT roman_gt end_POSTSUPERSCRIPT.

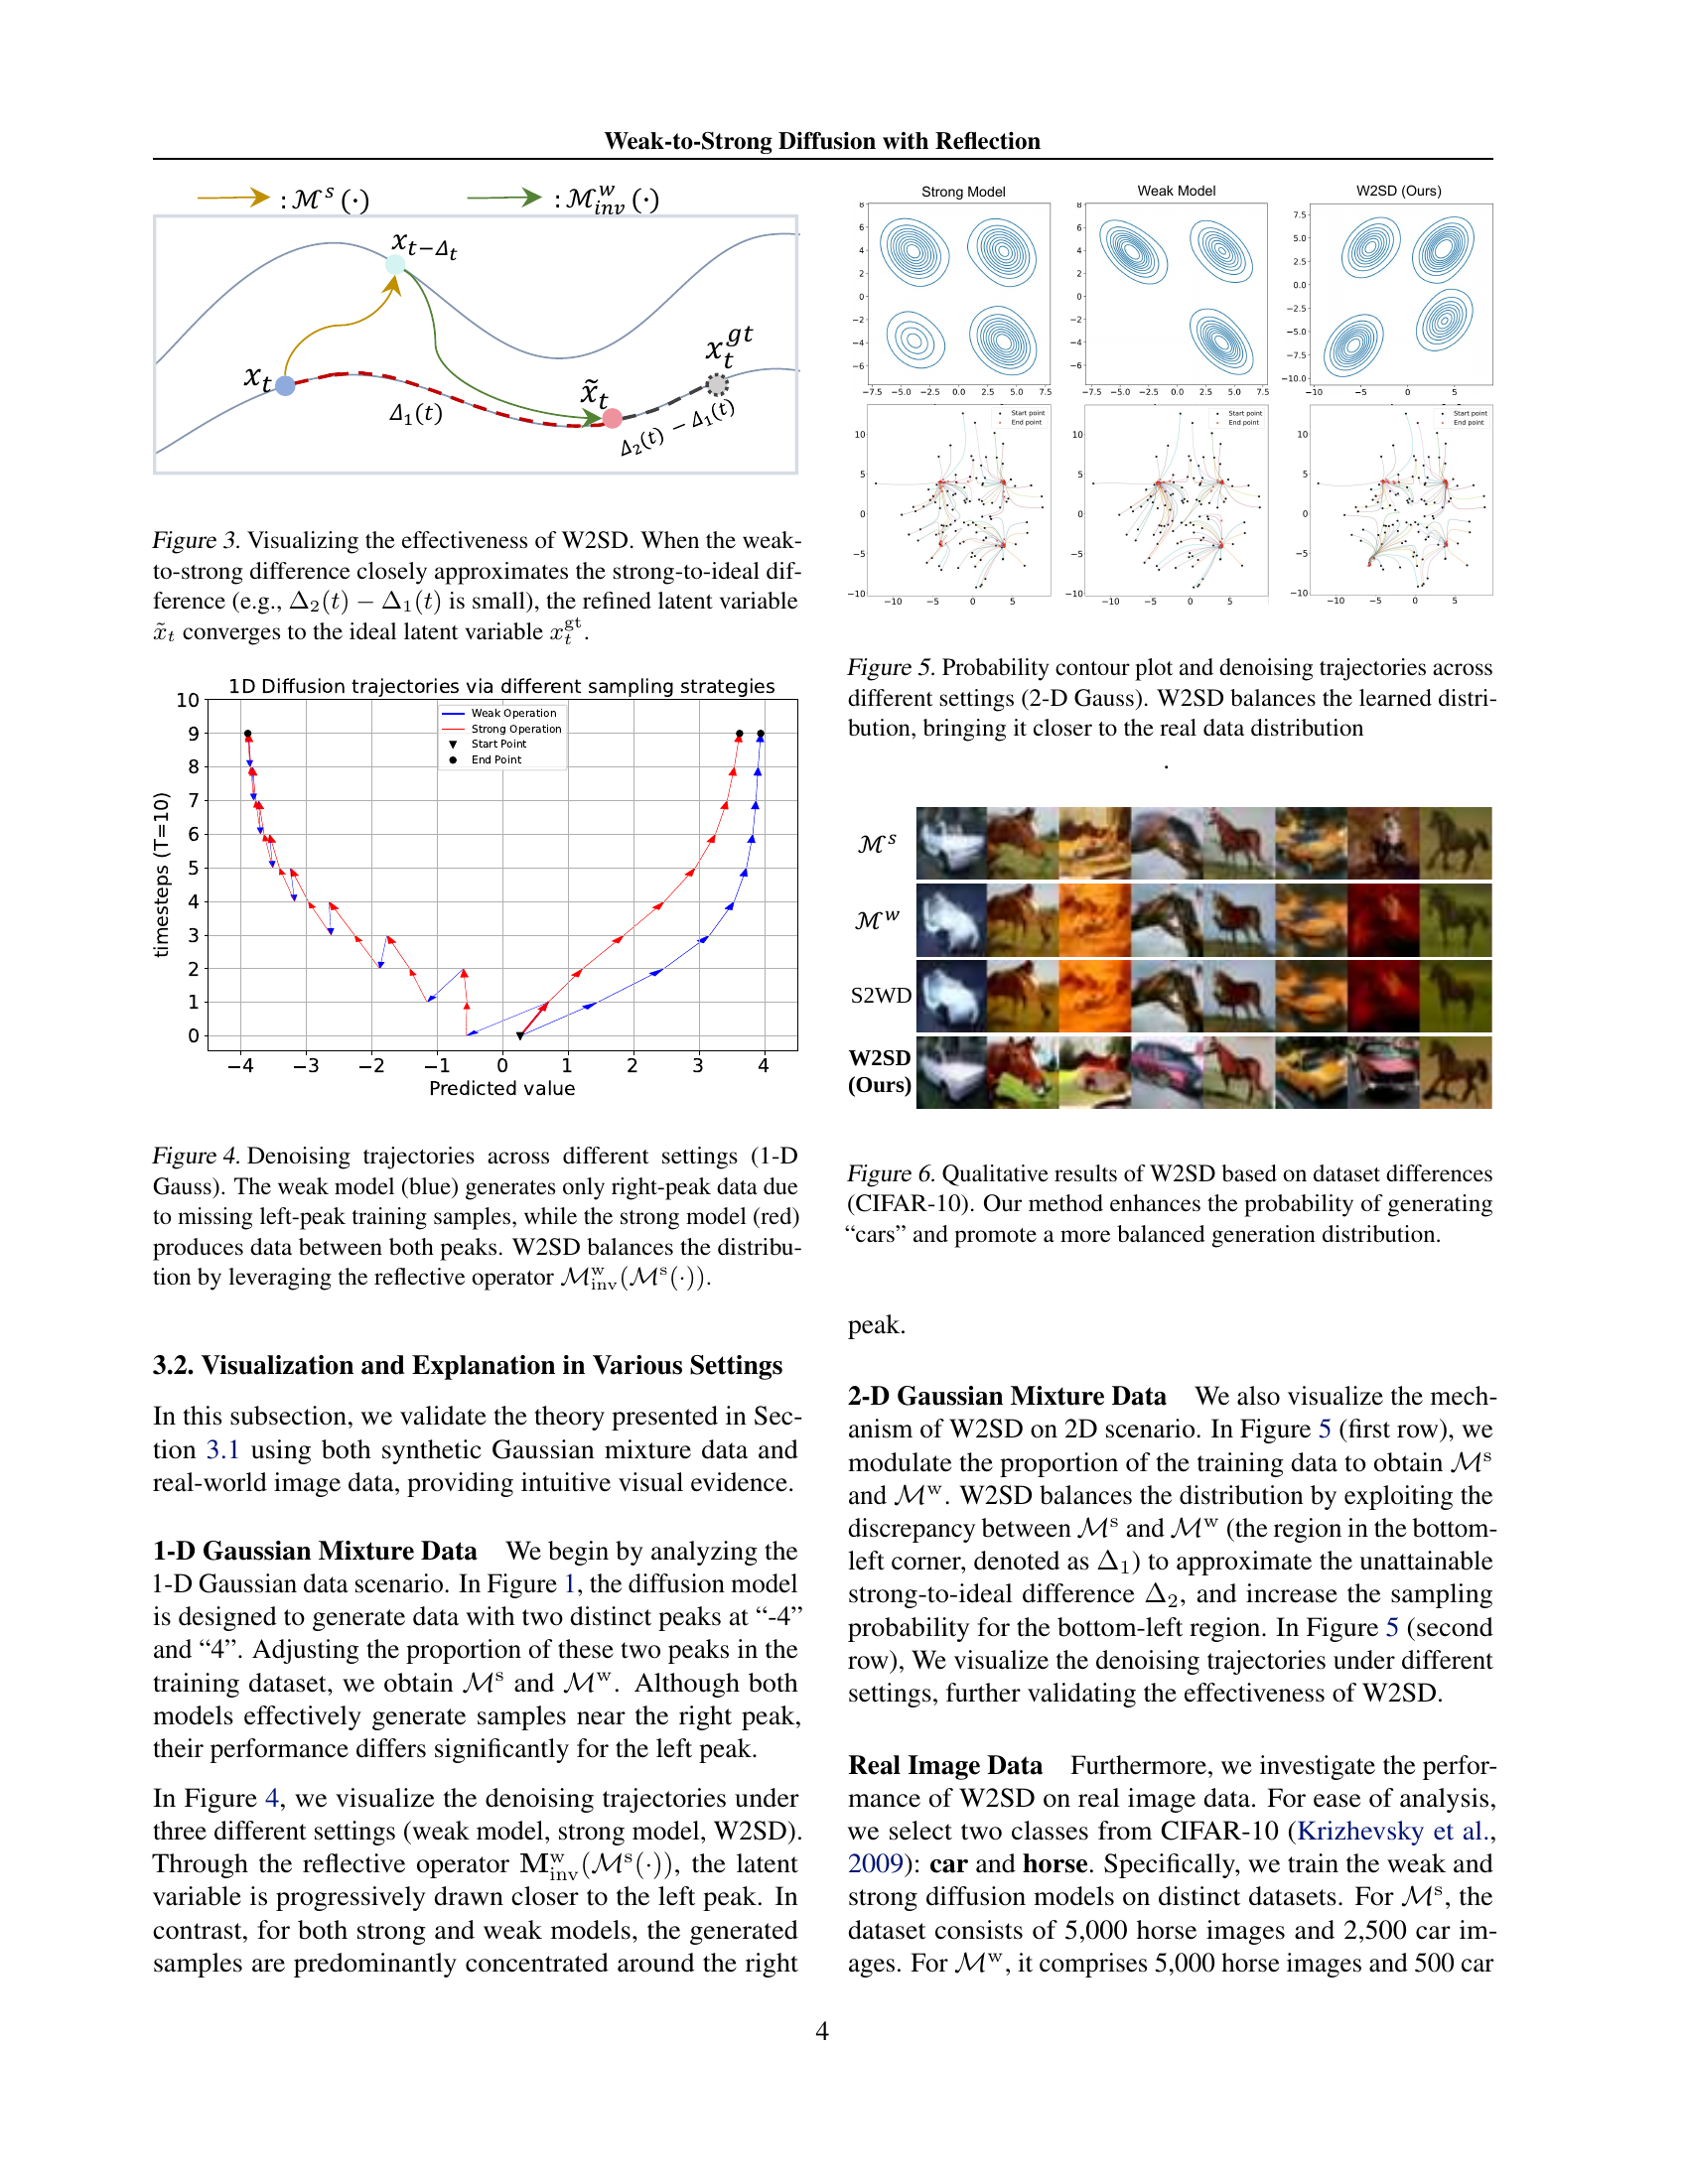
🔼 Figure 4 illustrates the denoising process of a 1D Gaussian distribution with two peaks. A weak model, trained on data lacking samples from the left peak, only generates data around the right peak (blue line). A stronger model, trained on a more complete dataset, generates data covering both peaks (red line). The proposed Weak-to-Strong Diffusion with Reflection (W2SD) method, using a reflective operator that combines the weak and strong models, effectively balances the generated distribution, producing samples from both peaks (purple line). This demonstrates W2SD’s ability to correct for deficiencies in model training data.
read the caption
Figure 4: Denoising trajectories across different settings (1-D Gauss). The weak model (blue) generates only right-peak data due to missing left-peak training samples, while the strong model (red) produces data between both peaks. W2SD balances the distribution by leveraging the reflective operator ℳinvw(ℳs(⋅))superscriptsubscriptℳinvwsuperscriptℳs⋅\mathcal{M}_{\mathrm{inv}}^{\mathrm{w}}(\mathcal{M}^{\mathrm{s}}(\cdot))caligraphic_M start_POSTSUBSCRIPT roman_inv end_POSTSUBSCRIPT start_POSTSUPERSCRIPT roman_w end_POSTSUPERSCRIPT ( caligraphic_M start_POSTSUPERSCRIPT roman_s end_POSTSUPERSCRIPT ( ⋅ ) ).

🔼 This figure visualizes the effectiveness of Weak-to-Strong Diffusion with Reflection (W2SD) on a 2-dimensional Gaussian mixture dataset. It shows probability contour plots and sampling trajectories for three different methods: a strong model (trained on a biased dataset), a weak model (trained on another biased dataset), and W2SD. The contour plots illustrate the learned data distributions of each method, with the ideal distribution represented by the real data distribution. The trajectories show how the latent variable evolves during the sampling process. The results demonstrate that W2SD effectively balances the learned distribution, bringing it closer to the true underlying distribution of the data, showcasing its ability to bridge the gap between weak and strong models and improve the quality of generated samples.
read the caption
Figure 5: Probability contour plot and denoising trajectories across different settings (2-D Gauss). W2SD balances the learned distribution, bringing it closer to the real data distribution

🔼 This figure displays a comparison of image generation results from a strong model, a weak model, and the proposed W2SD method, all trained on subsets of the CIFAR-10 dataset. The strong model shows a bias towards generating horse images, while the weak model struggles to generate either cars or horses effectively. The W2SD method mitigates this bias, resulting in a more balanced distribution with a higher likelihood of generating car images, showcasing the method’s ability to improve the diversity and quality of image generation by addressing imbalances in training data.
read the caption
Figure 6: Qualitative results of W2SD based on dataset differences (CIFAR-10). Our method enhances the probability of generating “cars” and promote a more balanced generation distribution.

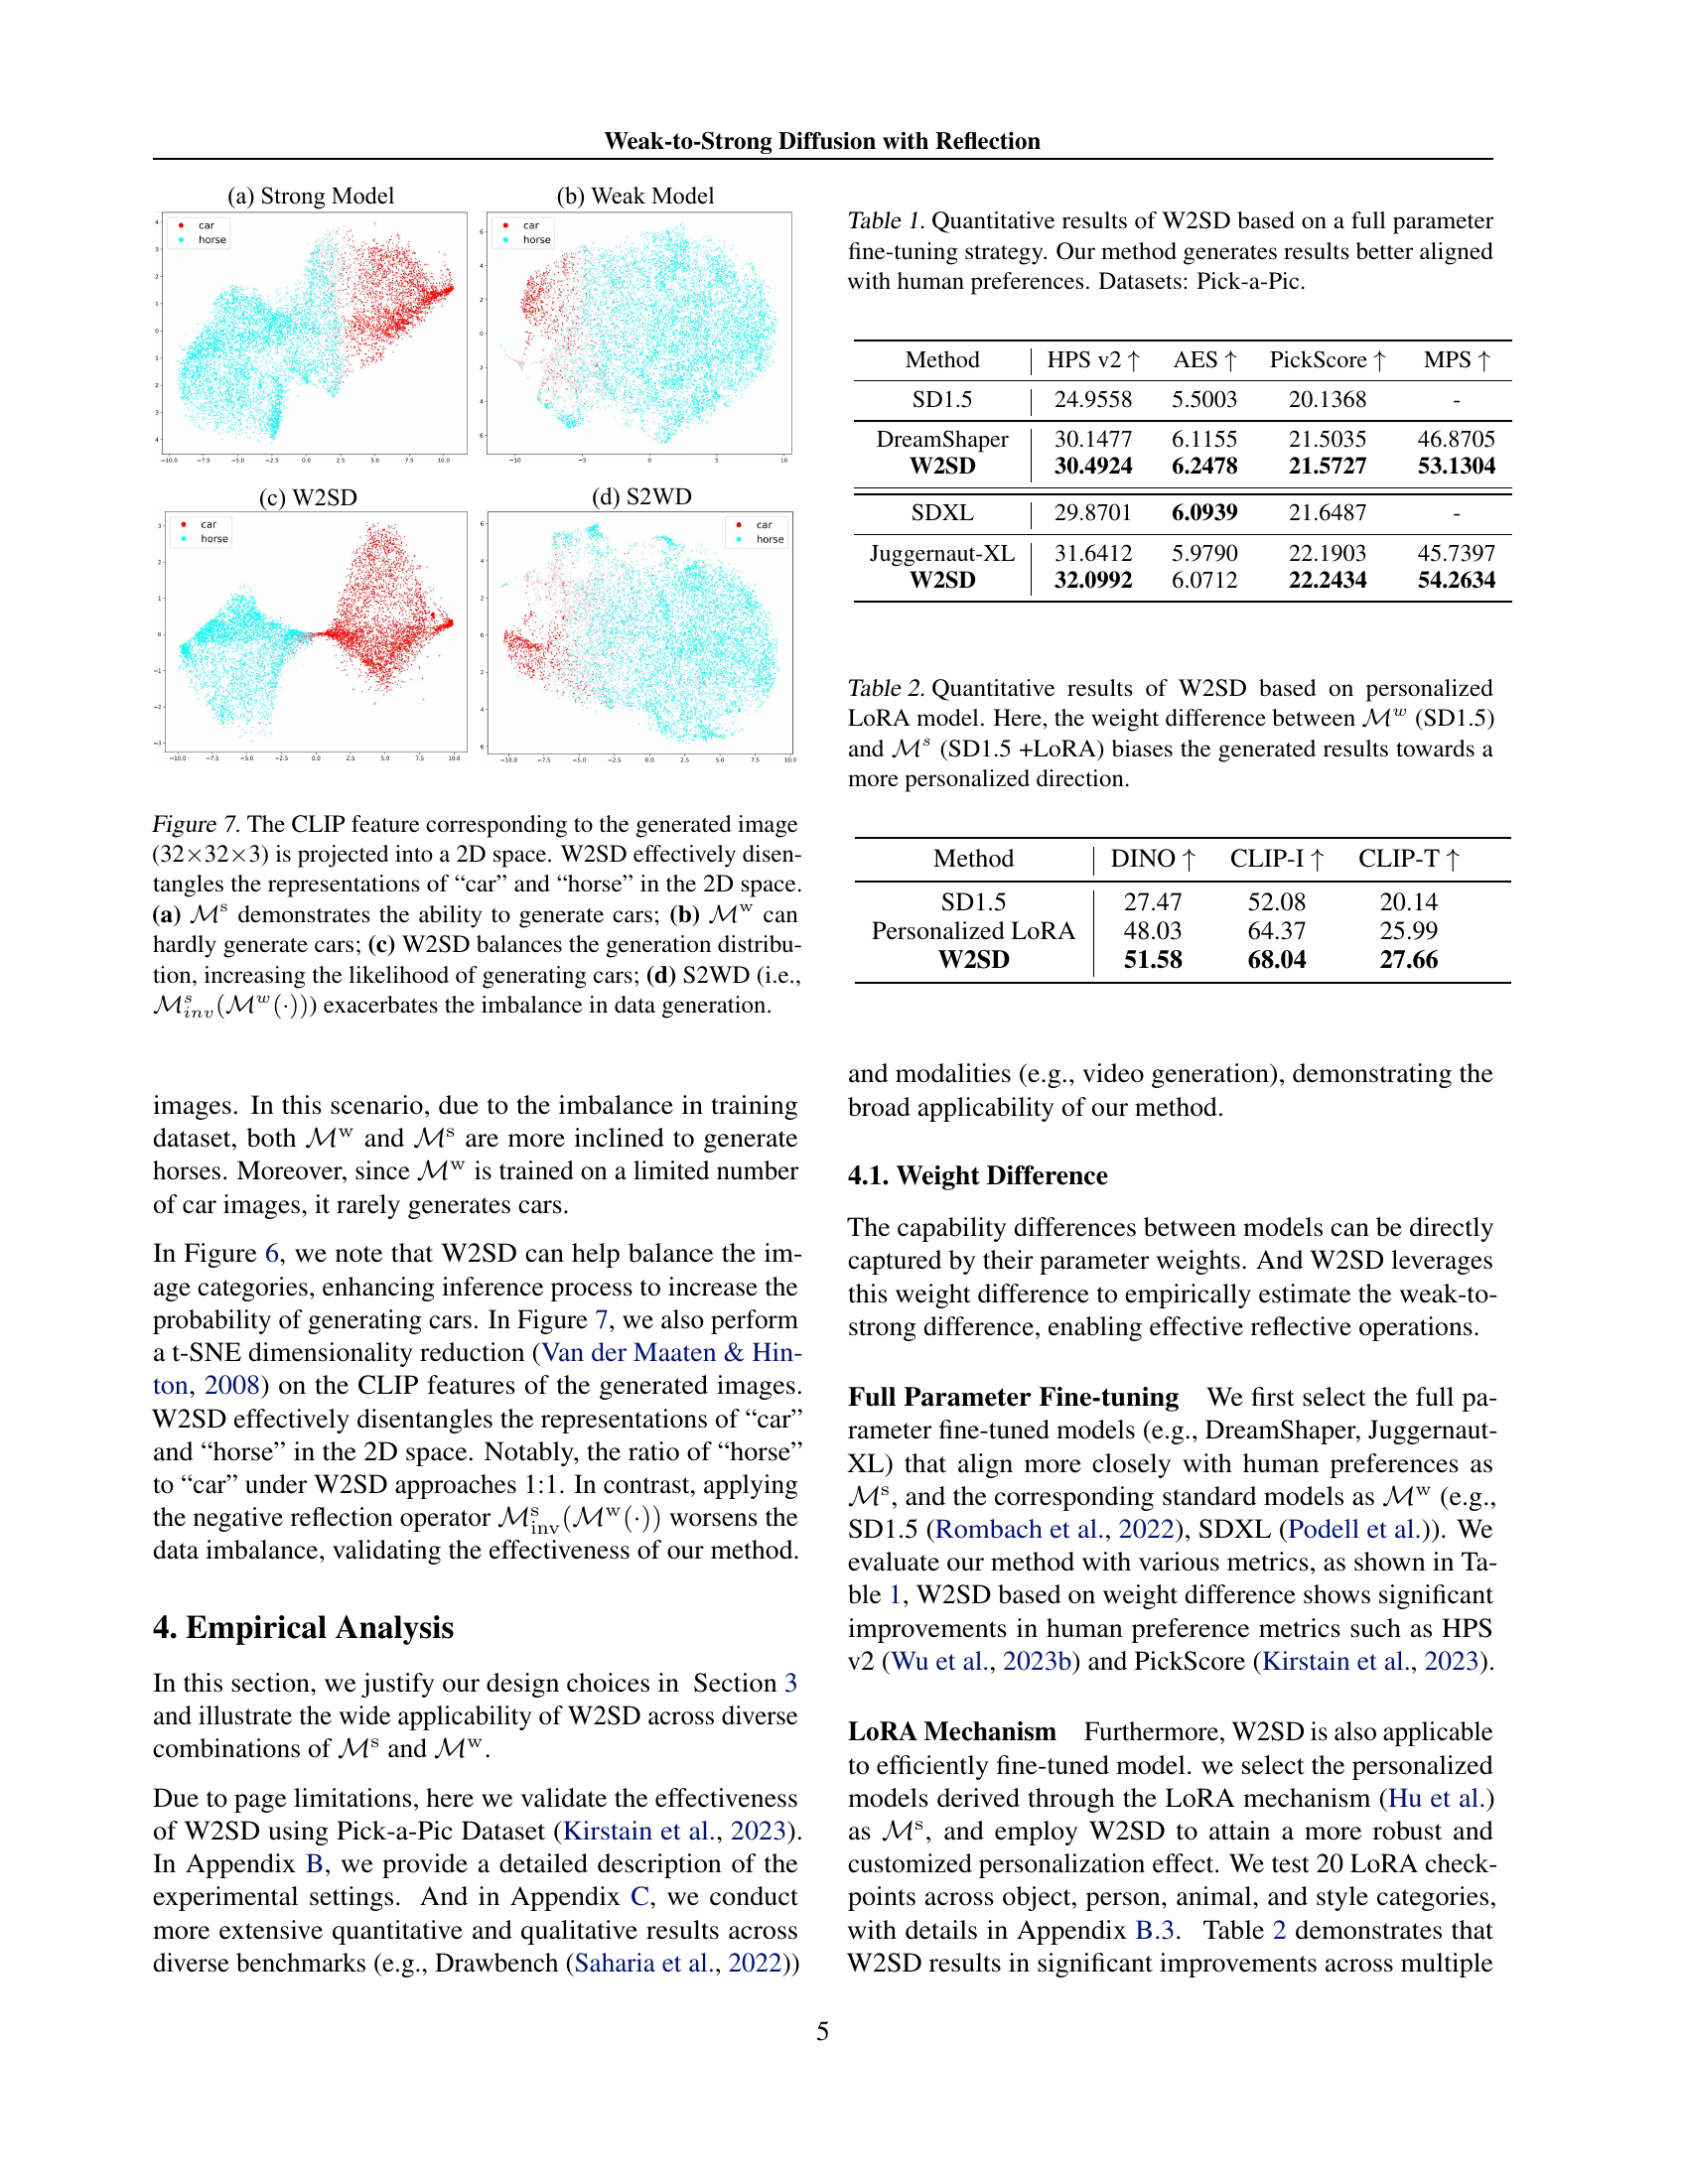
🔼 This figure visualizes the impact of W2SD on data generation balance using t-SNE to project 32x32x3 CLIP features into a 2D space. It compares four scenarios: (a) a strong model (Ms) effectively generates cars; (b) a weak model (Mw) struggles to generate cars; (c) W2SD balances car and horse generation; and (d) applying the inverse weak model (Minv(Mw)) exacerbates the imbalance, showcasing W2SD’s ability to improve data generation balance.
read the caption
Figure 7: The CLIP feature corresponding to the generated image (32×\times×32×\times×3) is projected into a 2D space. W2SD effectively disentangles the representations of “car” and “horse” in the 2D space. (a) ℳssuperscriptℳs\mathcal{M}^{\mathrm{s}}caligraphic_M start_POSTSUPERSCRIPT roman_s end_POSTSUPERSCRIPT demonstrates the ability to generate cars; (b) ℳwsuperscriptℳw\mathcal{M}^{\mathrm{w}}caligraphic_M start_POSTSUPERSCRIPT roman_w end_POSTSUPERSCRIPT can hardly generate cars; (c) W2SD balances the generation distribution, increasing the likelihood of generating cars; (d) S2WD (i.e., ℳinvs(ℳw(⋅))superscriptsubscriptℳ𝑖𝑛𝑣𝑠superscriptℳ𝑤⋅\mathcal{M}_{inv}^{s}(\mathcal{M}^{w}(\cdot))caligraphic_M start_POSTSUBSCRIPT italic_i italic_n italic_v end_POSTSUBSCRIPT start_POSTSUPERSCRIPT italic_s end_POSTSUPERSCRIPT ( caligraphic_M start_POSTSUPERSCRIPT italic_w end_POSTSUPERSCRIPT ( ⋅ ) )) exacerbates the imbalance in data generation.

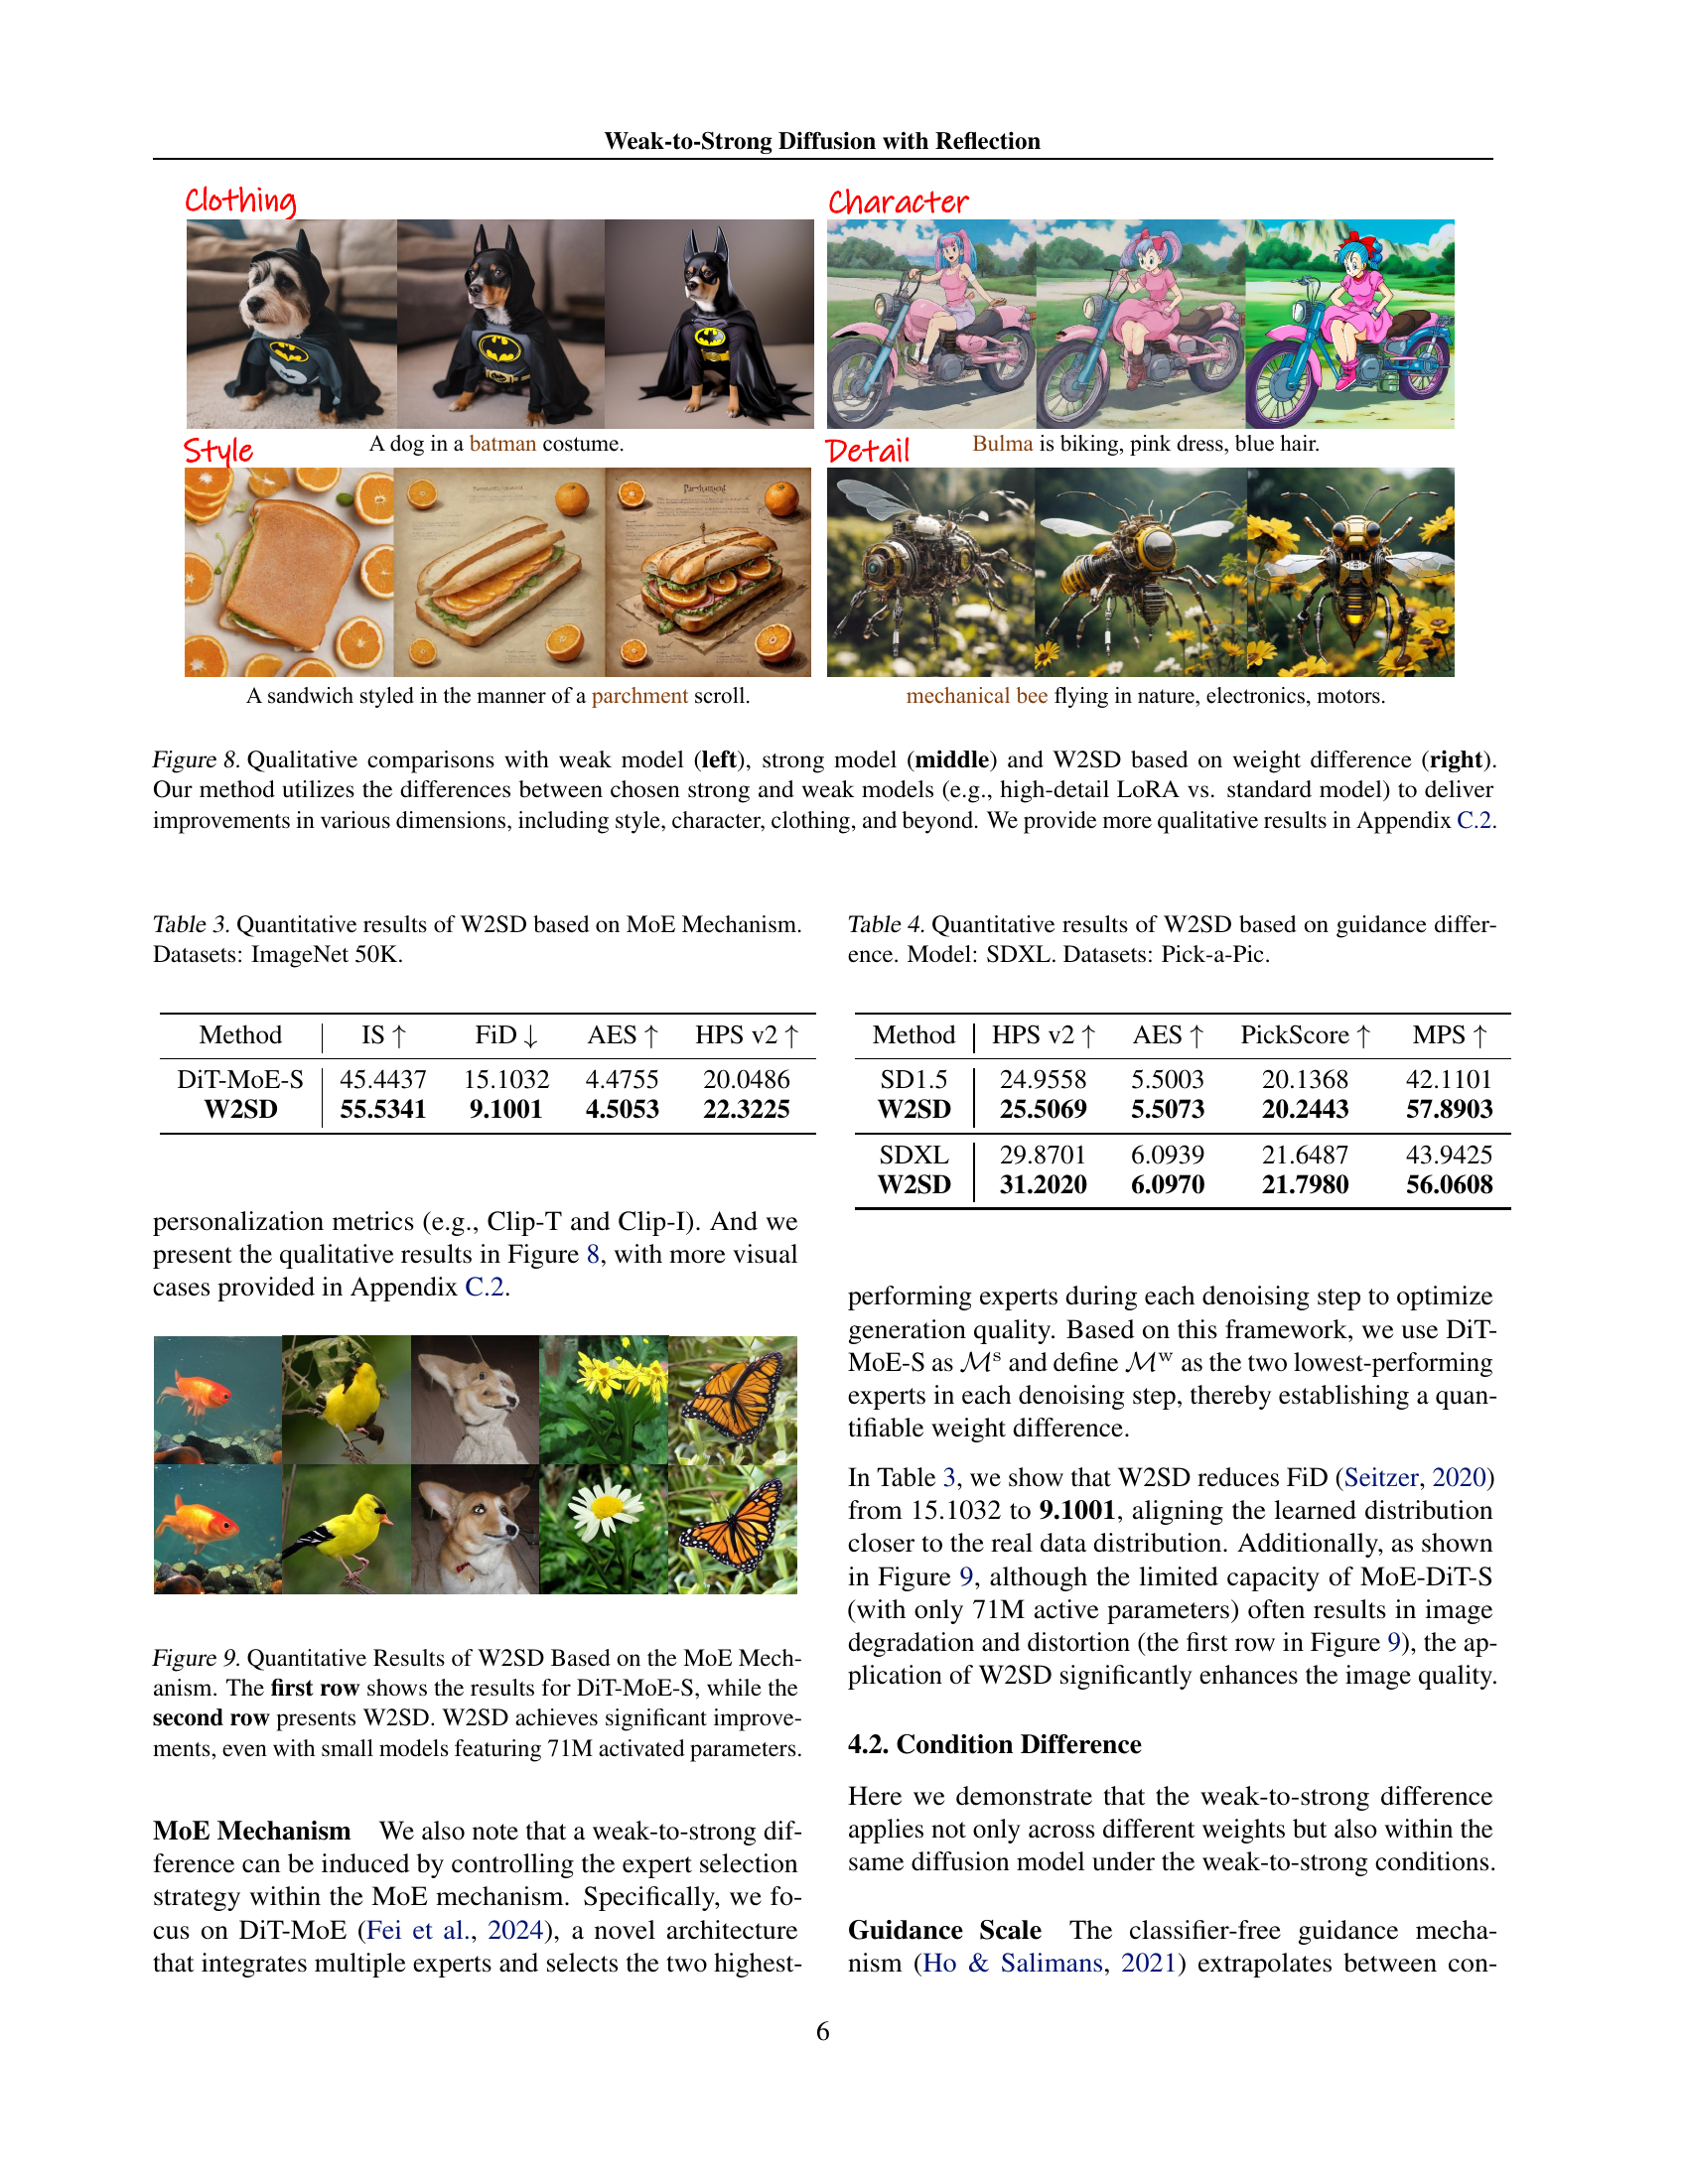
🔼 Figure 8 displays a qualitative comparison of image generation results from three different methods: a weak model, a strong model, and the proposed Weak-to-Strong Diffusion with Reflection (W2SD) method. The weak model produces lower quality results, while the strong model generates images with improved quality but still exhibits certain limitations. The W2SD method leverages the differences between these models to produce improved results across various dimensions including style, character, and clothing detail. The images demonstrate W2SD’s ability to refine the generated output, resulting in more visually appealing results. More examples are shown in Section C.2 of the paper.
read the caption
Figure 8: Qualitative comparisons with weak model (left), strong model (middle) and W2SD based on weight difference (right). Our method utilizes the differences between chosen strong and weak models (e.g., high-detail LoRA vs. standard model) to deliver improvements in various dimensions, including style, character, clothing, and beyond. We provide more qualitative results in Section C.2.

🔼 This figure displays a comparison of image generation results using DiT-MoE-S (a Mixture-of-Experts model) with and without the Weak-to-Strong Diffusion with Reflection (W2SD) method. The top row shows samples generated by the DiT-MoE-S model alone, demonstrating its limitations, especially given its relatively small size (71 million activated parameters). The bottom row presents results obtained after applying the W2SD technique to the same model. The visual difference showcases the significant improvements in image quality achieved by W2SD, highlighting its ability to enhance performance even in resource-constrained models.
read the caption
Figure 9: Quantitative Results of W2SD Based on the MoE Mechanism. The first row shows the results for DiT-MoE-S, while the second row presents W2SD. W2SD achieves significant improvements, even with small models featuring 71M activated parameters.

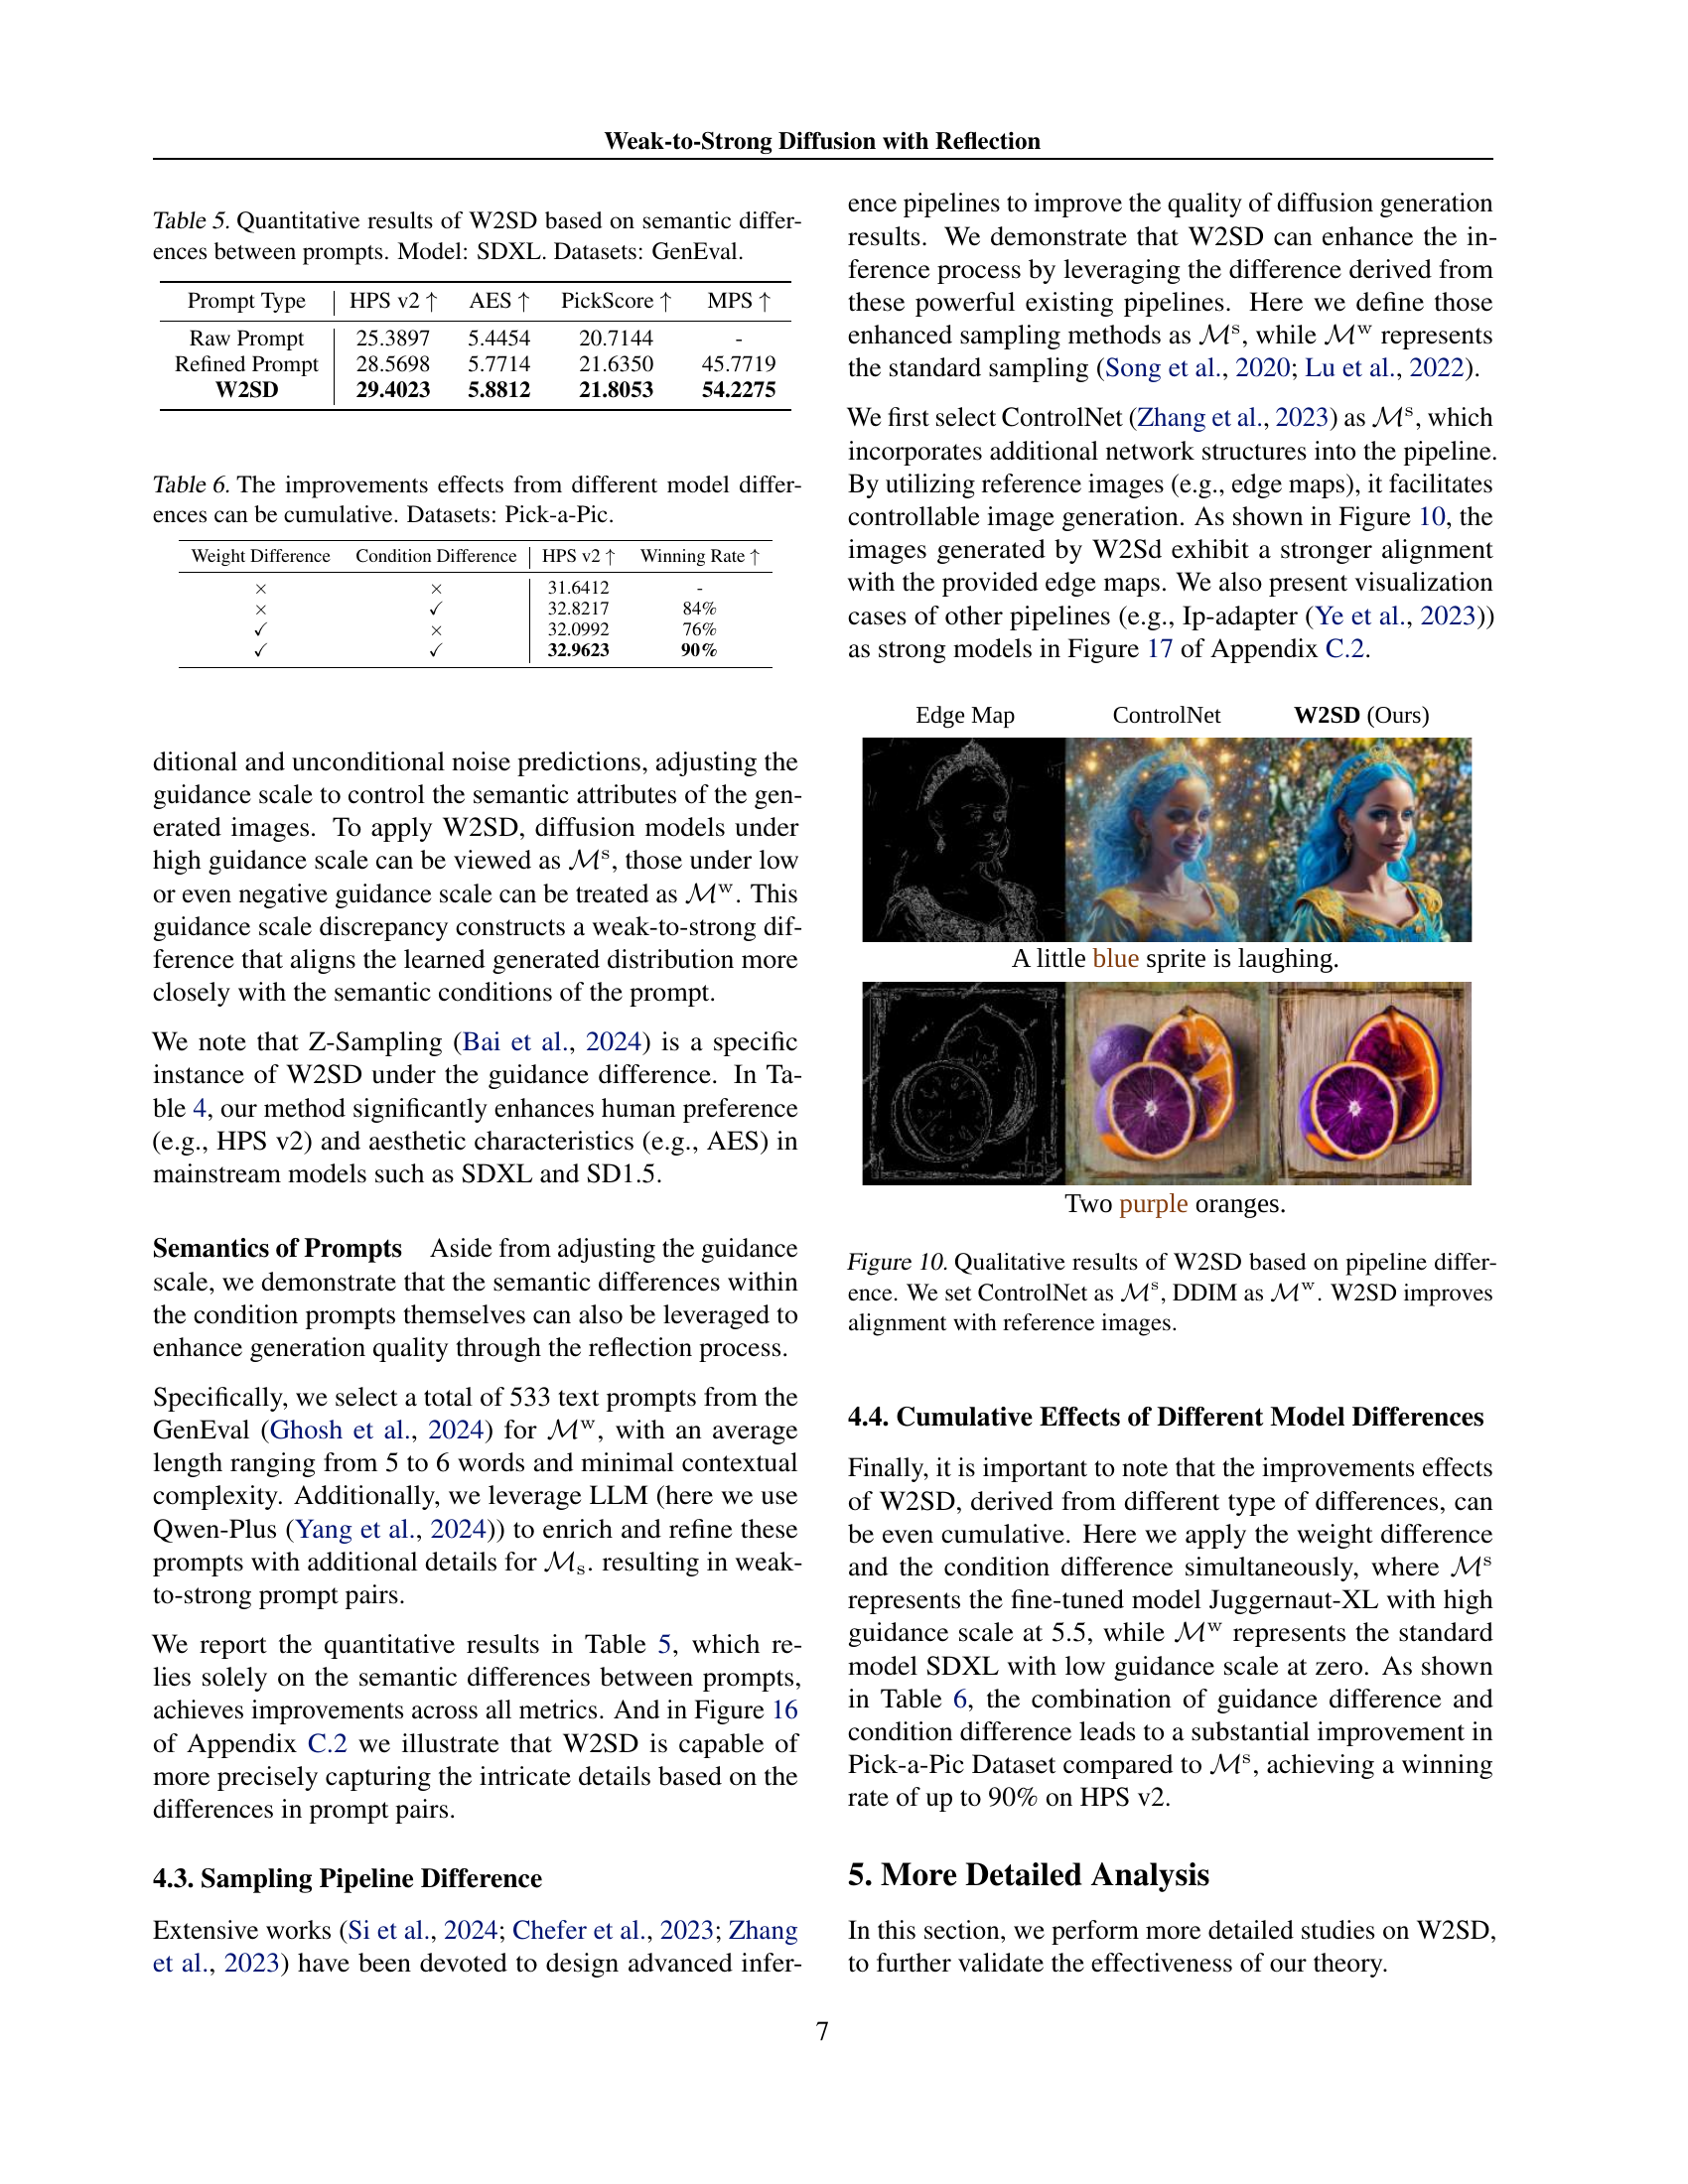
🔼 This figure demonstrates the effectiveness of Weak-to-Strong Diffusion with Reflection (W2SD) when using different sampling pipelines. ControlNet, a pipeline that incorporates additional network structures to allow for controllable image generation based on reference images (like edge maps), is used as the strong model (ℳs). The standard DDIM sampling pipeline is used as the weak model (ℳw). The figure shows that by employing W2SD, the generated images exhibit significantly improved alignment with the provided reference images, highlighting the method’s ability to enhance generation quality across diverse sampling methodologies.
read the caption
Figure 10: Qualitative results of W2SD based on pipeline difference. We set ControlNet as ℳssuperscriptℳs\mathcal{M}^{\mathrm{s}}caligraphic_M start_POSTSUPERSCRIPT roman_s end_POSTSUPERSCRIPT, DDIM as ℳwsuperscriptℳw\mathcal{M}^{\mathrm{w}}caligraphic_M start_POSTSUPERSCRIPT roman_w end_POSTSUPERSCRIPT. W2SD improves alignment with reference images.

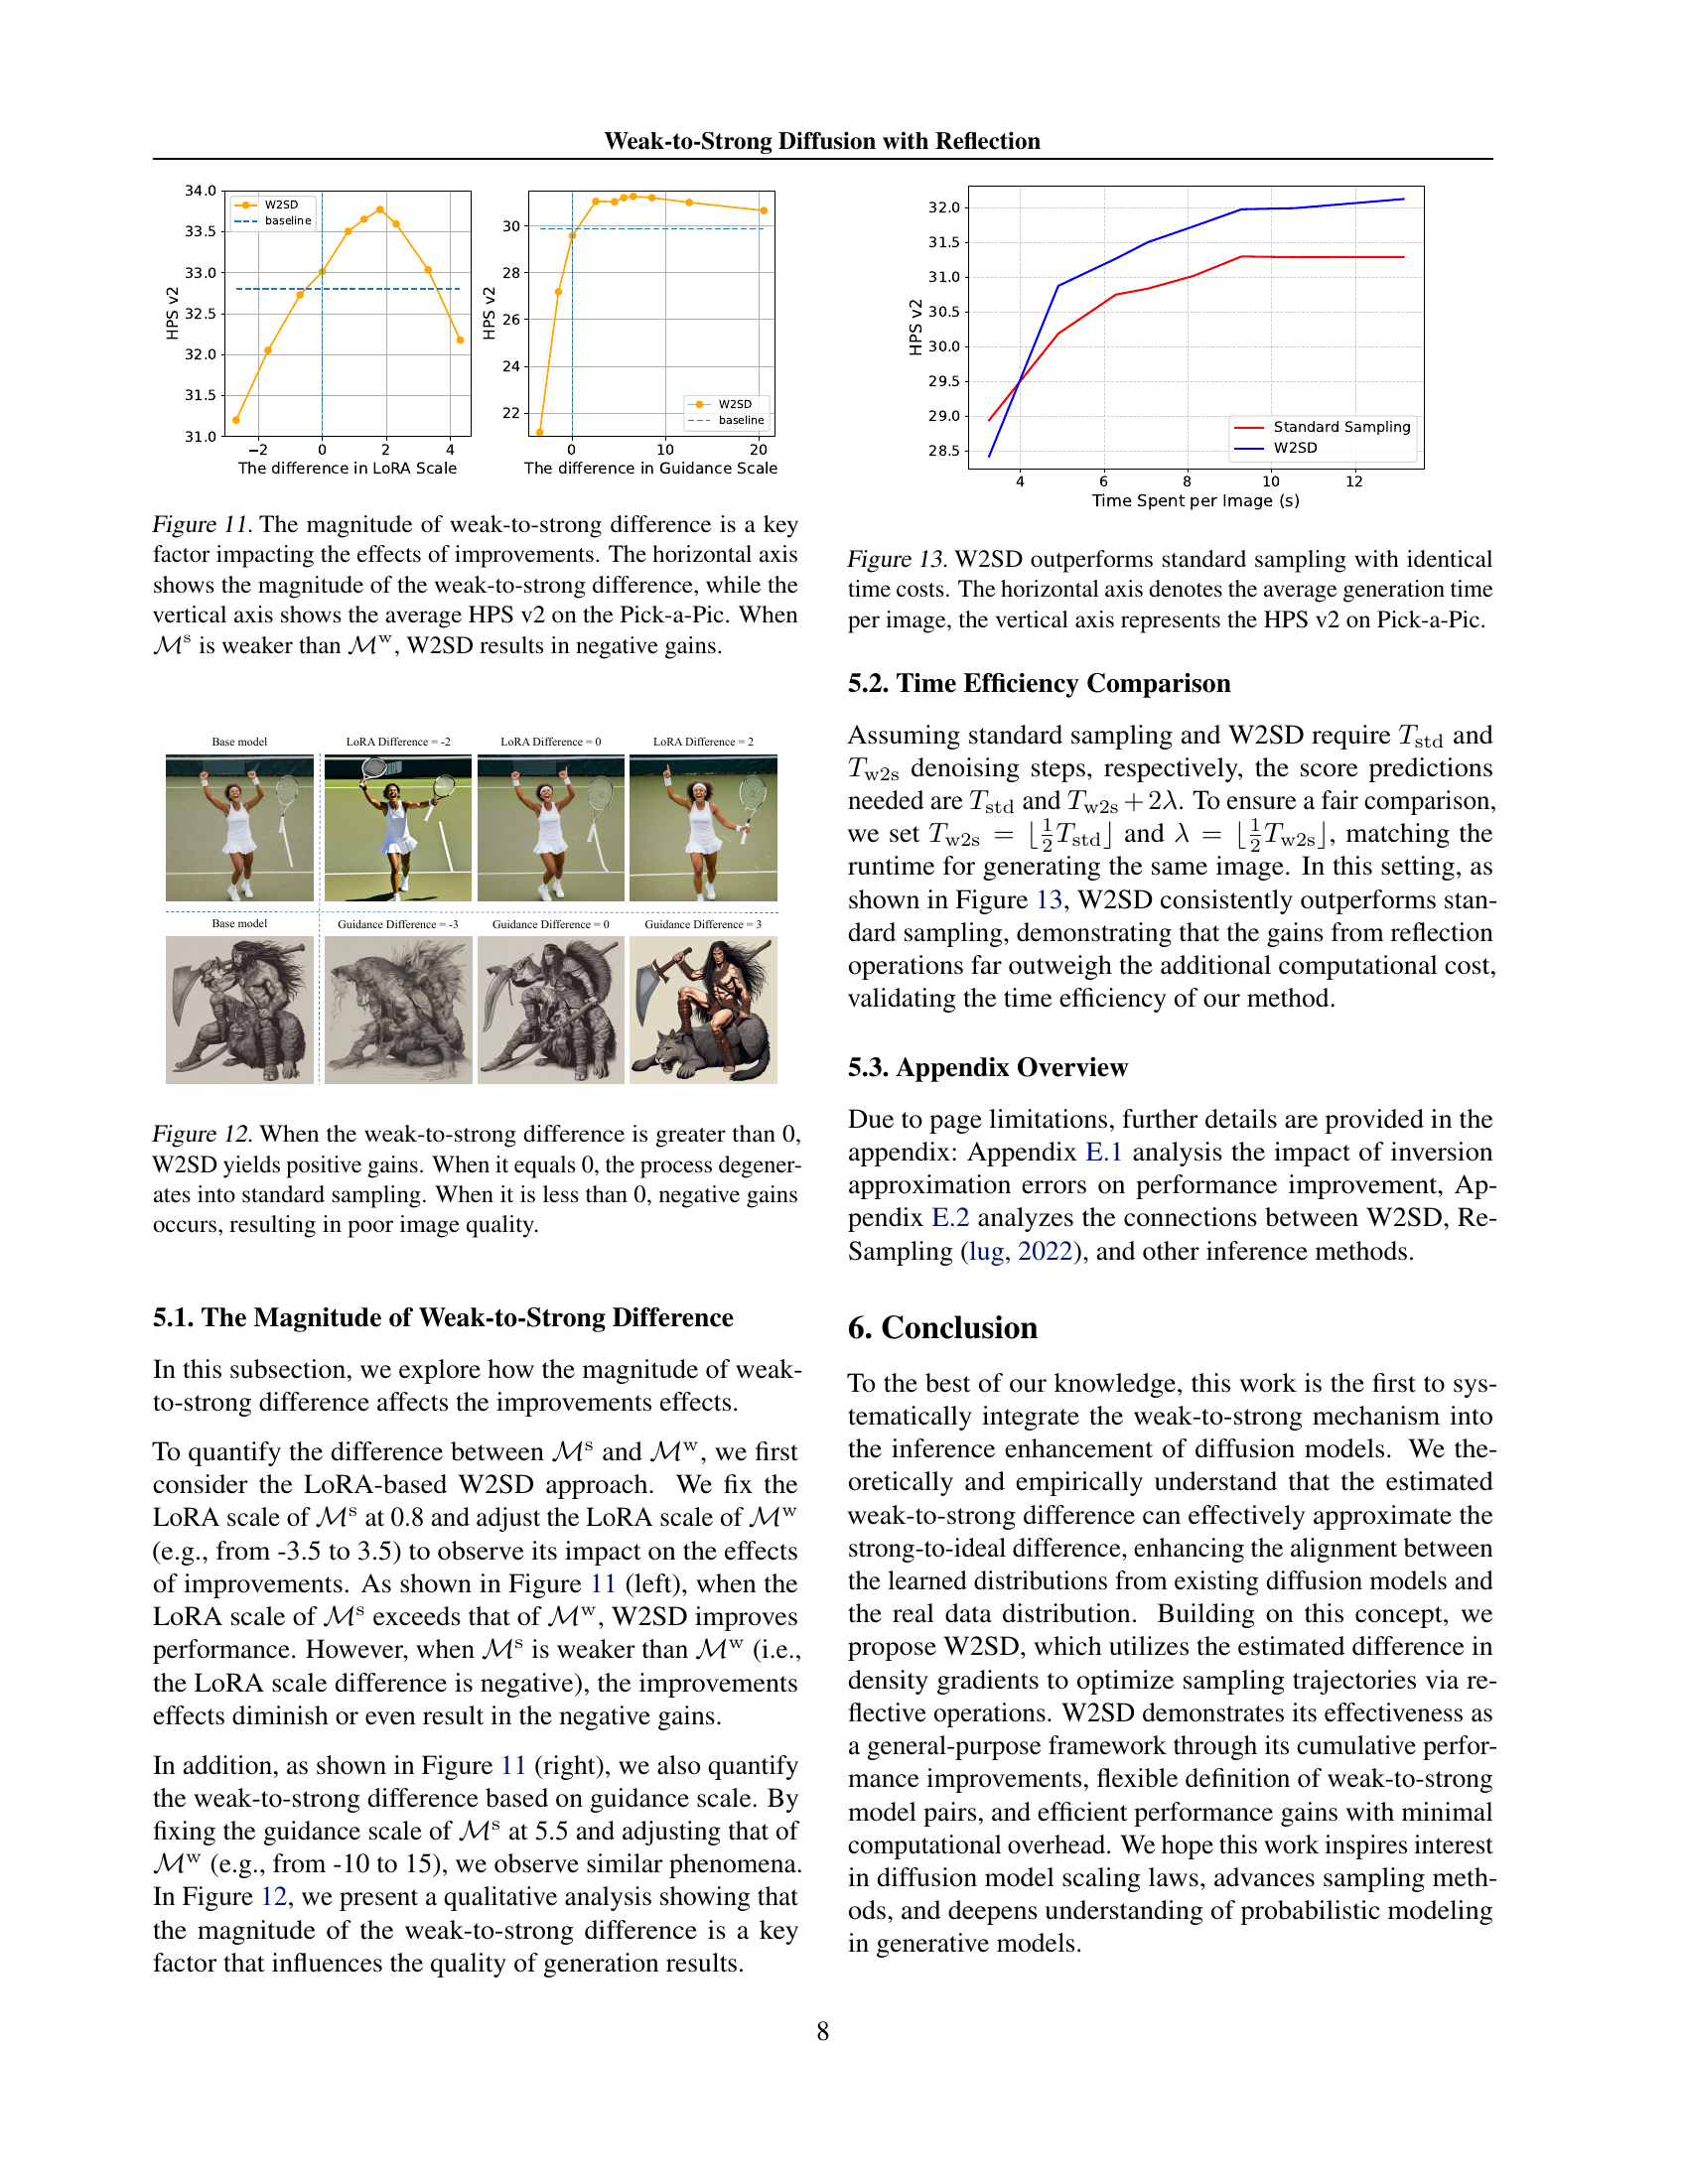
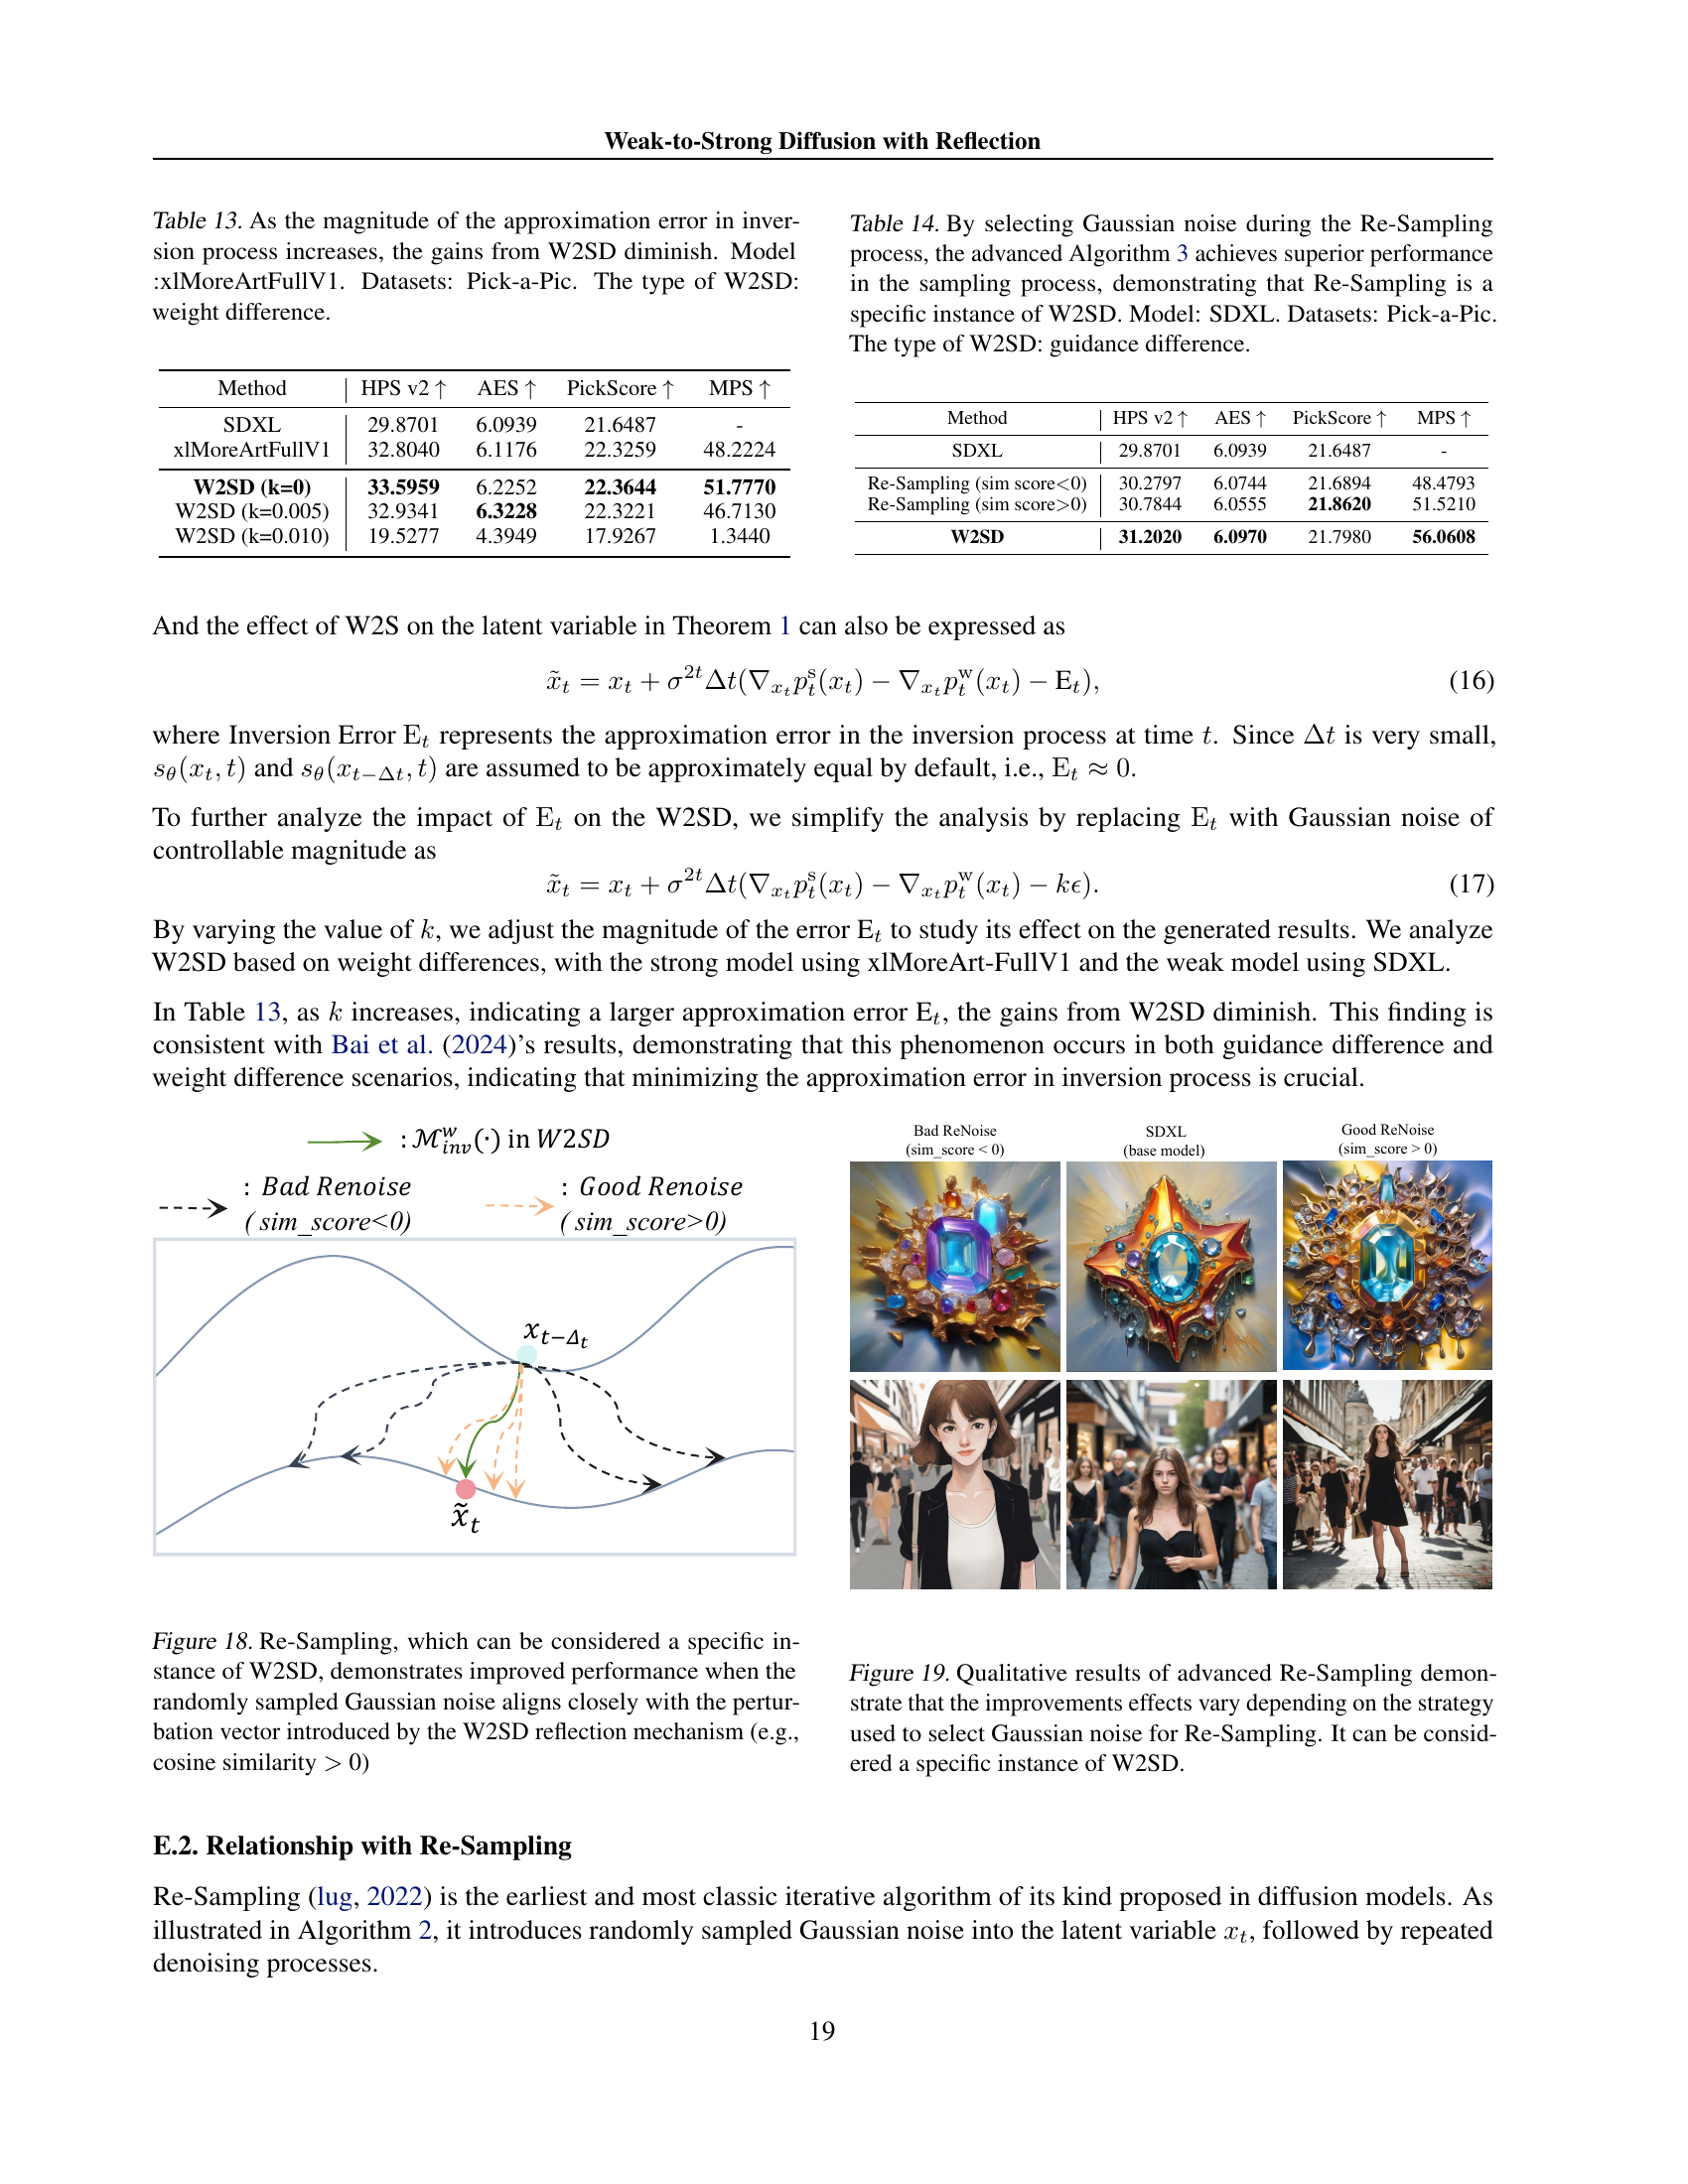
🔼 This figure analyzes the relationship between the magnitude of the difference between a strong and a weak diffusion model and the improvement in image quality achieved by the Weak-to-Strong Diffusion with Reflection (W2SD) method. The x-axis represents the magnitude of this difference, while the y-axis shows the average HPS v2 score (a metric measuring human preference for generated images) on the Pick-a-Pic dataset. The graph reveals that when the strong model is significantly better than the weak model (large positive difference), W2SD leads to substantial improvements in the HPS v2 score. Conversely, if the strong model is weaker or comparable to the weak model (small or negative difference), W2SD may even yield negative gains, indicating a reduction in image quality compared to using the strong model alone.
read the caption
Figure 11: The magnitude of weak-to-strong difference is a key factor impacting the effects of improvements. The horizontal axis shows the magnitude of the weak-to-strong difference, while the vertical axis shows the average HPS v2 on the Pick-a-Pic. When ℳssuperscriptℳs\mathcal{M}^{\mathrm{s}}caligraphic_M start_POSTSUPERSCRIPT roman_s end_POSTSUPERSCRIPT is weaker than ℳwsuperscriptℳw\mathcal{M}^{\mathrm{w}}caligraphic_M start_POSTSUPERSCRIPT roman_w end_POSTSUPERSCRIPT, W2SD results in negative gains.

🔼 This figure demonstrates the impact of the magnitude of the weak-to-strong difference on the performance of the Weak-to-Strong Diffusion with Reflection (W2SD) method. The x-axis represents the difference between a strong and weak model, while the y-axis shows the improvement in the Human Preference Score v2 (HPSv2) metric. When the weak-to-strong difference is positive (strong model is significantly better than weak model), W2SD improves the results. If the difference is zero (models have similar performance), W2SD performs identically to standard sampling. If the difference is negative (weak model performs better than strong model), the results degrade, indicating that a strong model is crucial for the effectiveness of W2SD. The plots show both the results using LoRA-based methods and using different guidance scales to illustrate the versatility of this finding across different methods of establishing the weak-to-strong model pair.
read the caption
Figure 12: When the weak-to-strong difference is greater than 0, W2SD yields positive gains. When it equals 0, the process degenerates into standard sampling. When it is less than 0, negative gains occurs, resulting in poor image quality.

🔼 This figure compares the performance of W2SD against standard sampling methods in terms of generation time and image quality. The x-axis represents the average time taken to generate a single image, while the y-axis shows the HPS v2 score (a metric evaluating human preference for image quality) achieved on the Pick-a-Pic dataset. The results demonstrate that W2SD achieves a higher HPS v2 score than standard sampling while maintaining the same average generation time per image, highlighting its efficiency in improving image quality without increasing computational costs.
read the caption
Figure 13: W2SD outperforms standard sampling with identical time costs. The horizontal axis denotes the average generation time per image, the vertical axis represents the HPS v2 on Pick-a-Pic.

🔼 Table 8 presents a quantitative comparison of image generation results using a standard model and the W2SD method. The evaluation was conducted on the Drawbench dataset, which assesses various aspects of image quality relevant to human preferences. The table shows that W2SD, using a full parameter fine-tuning strategy, leads to improvements in multiple metrics, indicating better alignment with human aesthetic preferences compared to the standard model.
read the caption
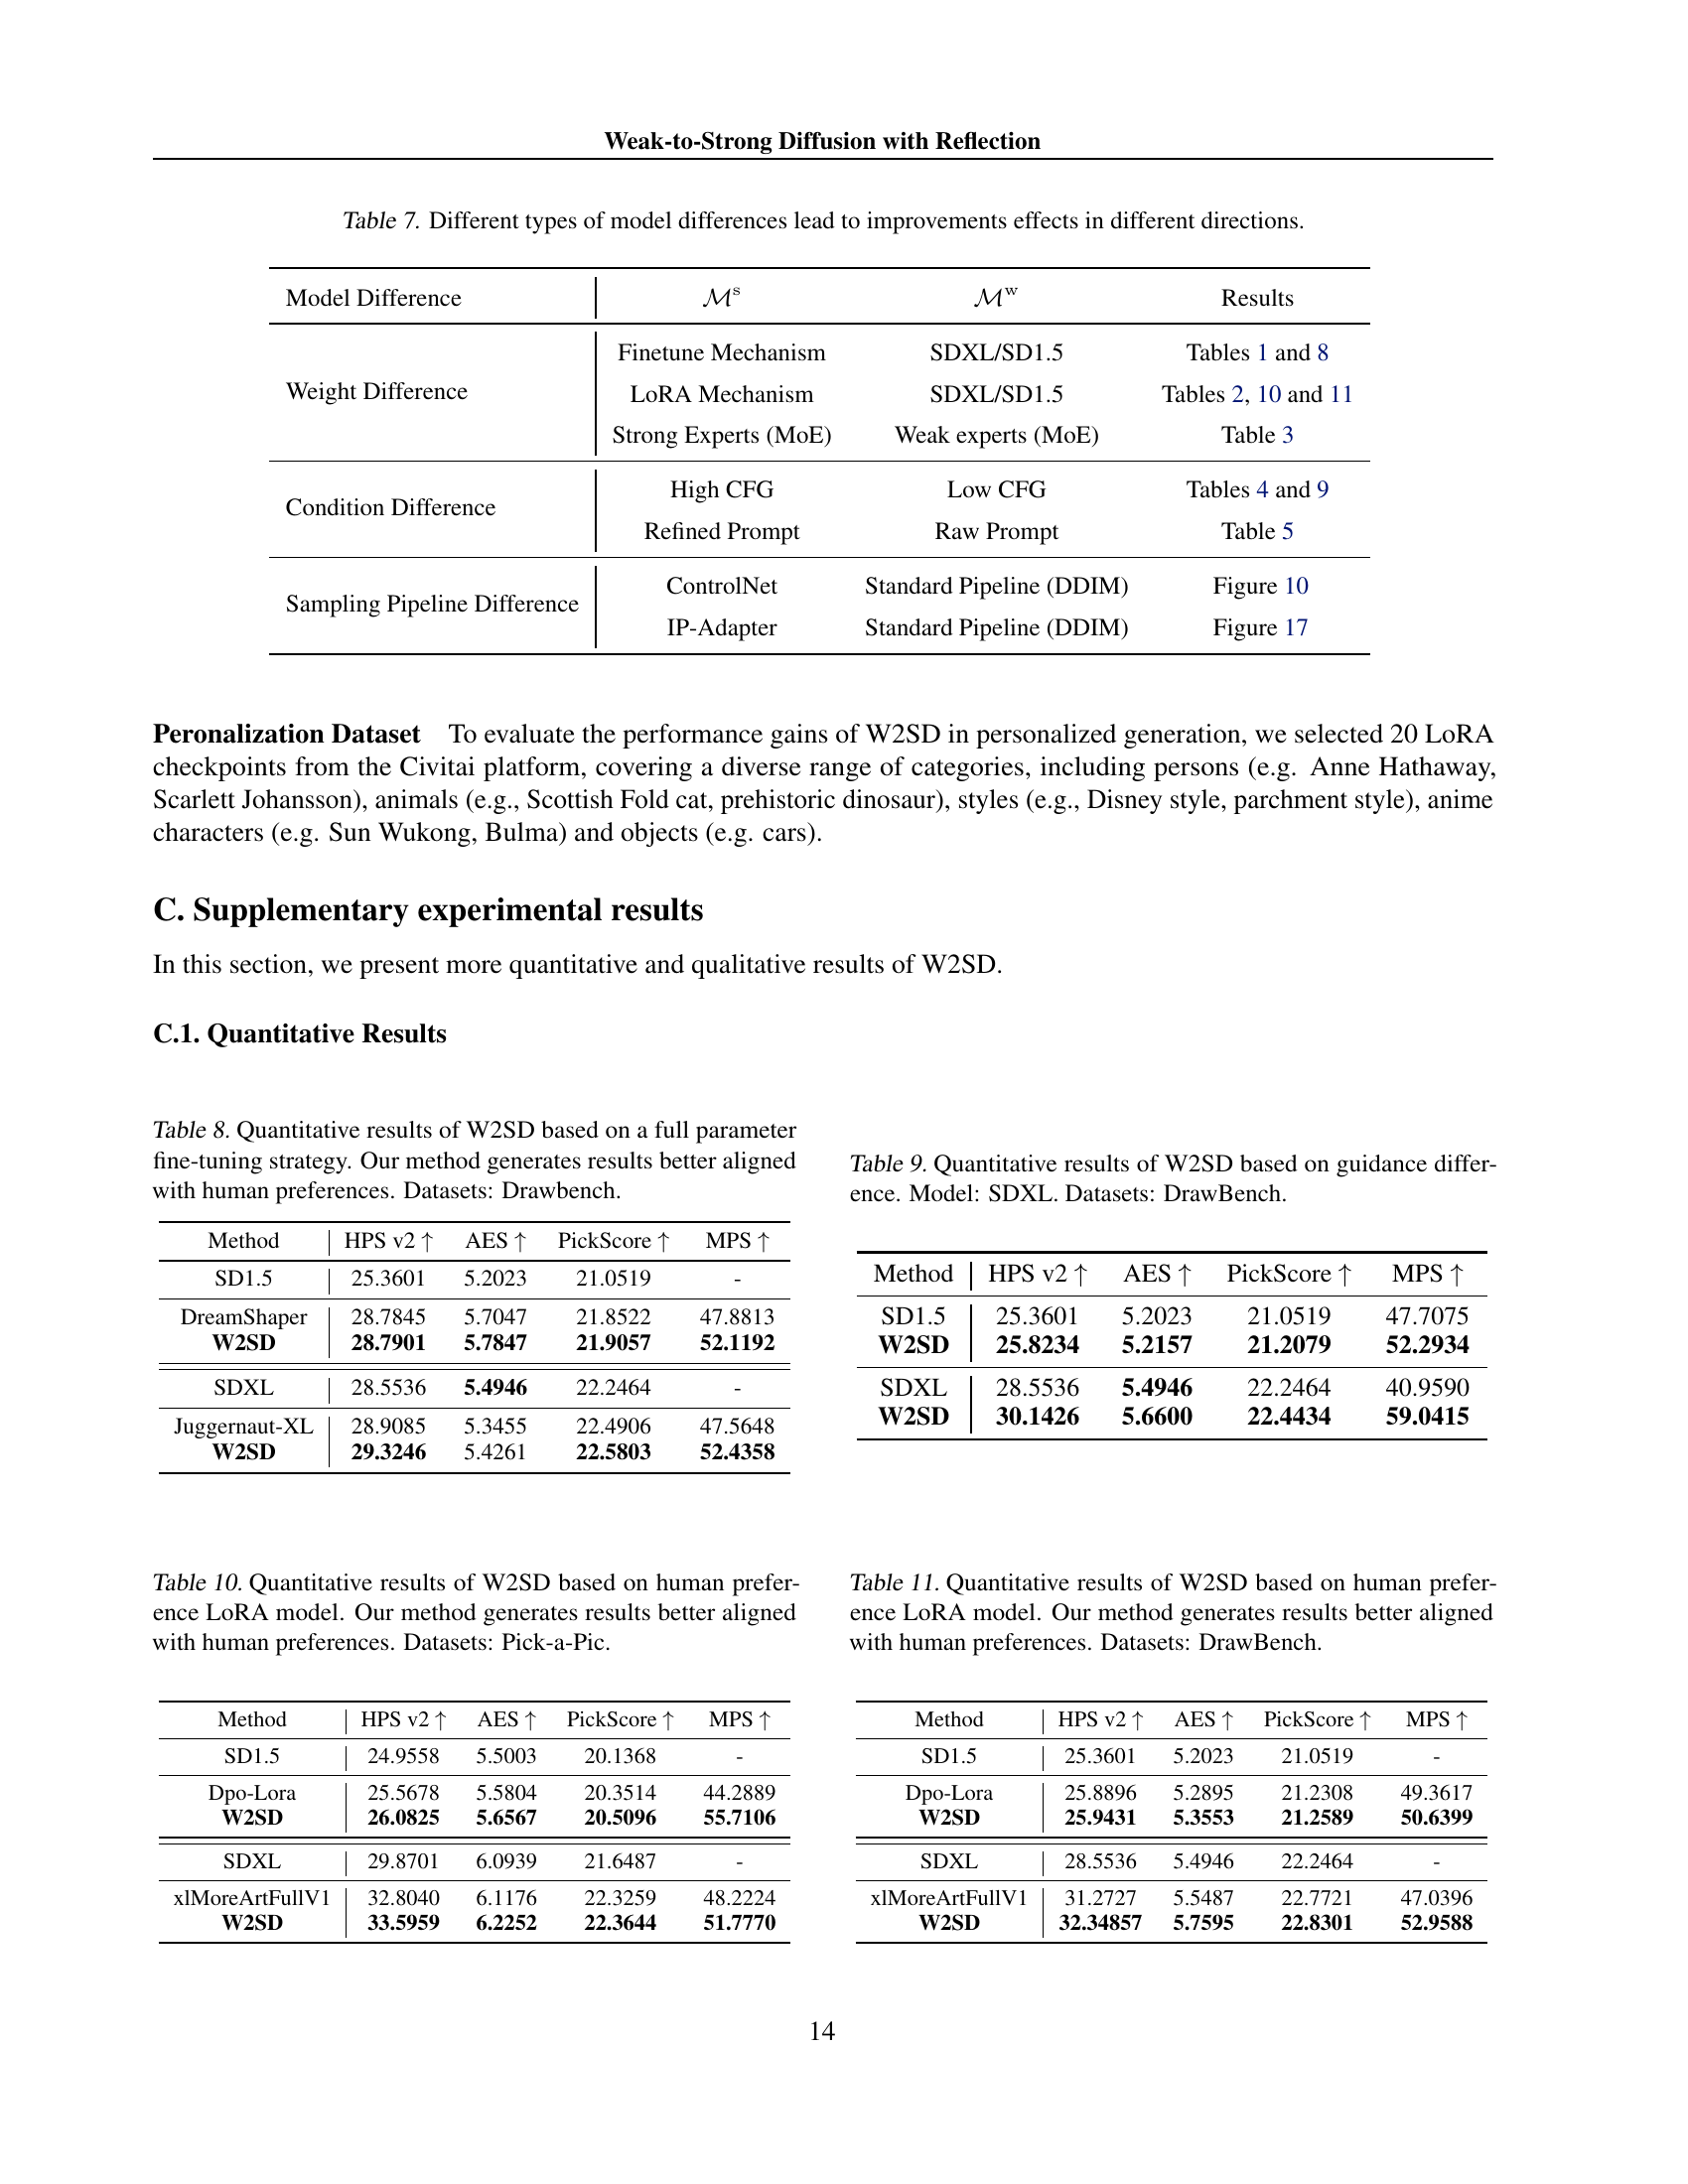
Table 8: Quantitative results of W2SD based on a full parameter fine-tuning strategy. Our method generates results better aligned with human preferences. Datasets: Drawbench.
🔼 Table 9 presents a quantitative analysis of the Weak-to-Strong Diffusion with Reflection (W2SD) method. Specifically, it shows the performance improvements achieved by W2SD when leveraging differences in guidance scales between a strong and weak model. The model used is SDXL, and the results are evaluated using the DrawBench dataset. The table likely includes metrics such as FID, Inception Score, Precision, Recall, and potentially others to comprehensively assess the impact of W2SD on image generation quality under varying guidance levels.
read the caption
Table 9: Quantitative results of W2SD based on guidance difference. Model: SDXL. Datasets: DrawBench.

🔼 This table presents a quantitative analysis of the Weak-to-Strong Diffusion with Reflection (W2SD) method. The method is evaluated using a human preference LoRA model, specifically assessing its ability to generate results that are better aligned with human preferences. The results are compared against baseline models without W2SD on the Pick-a-Pic dataset. Metrics such as HPSv2, AES, PickScore, and MPS are used to evaluate different aspects of image quality and user preference, allowing for a comprehensive assessment of the method’s effectiveness.
read the caption
Table 10: Quantitative results of W2SD based on human preference LoRA model. Our method generates results better aligned with human preferences. Datasets: Pick-a-Pic.

🔼 Table 11 presents a quantitative analysis of the Weak-to-Strong Diffusion with Reflection (W2SD) method. The study focuses on how W2SD, using a human preference LoRA model, improves the alignment of generated results with human preferences. The results are evaluated using the DrawBench dataset, a comprehensive benchmark for evaluating image generation models. The table likely compares W2SD’s performance to other baseline models across various metrics relevant to image quality and human perception, showcasing the effectiveness of the W2SD technique.
read the caption
Table 11: Quantitative results of W2SD based on human preference LoRA model. Our method generates results better aligned with human preferences. Datasets: DrawBench.

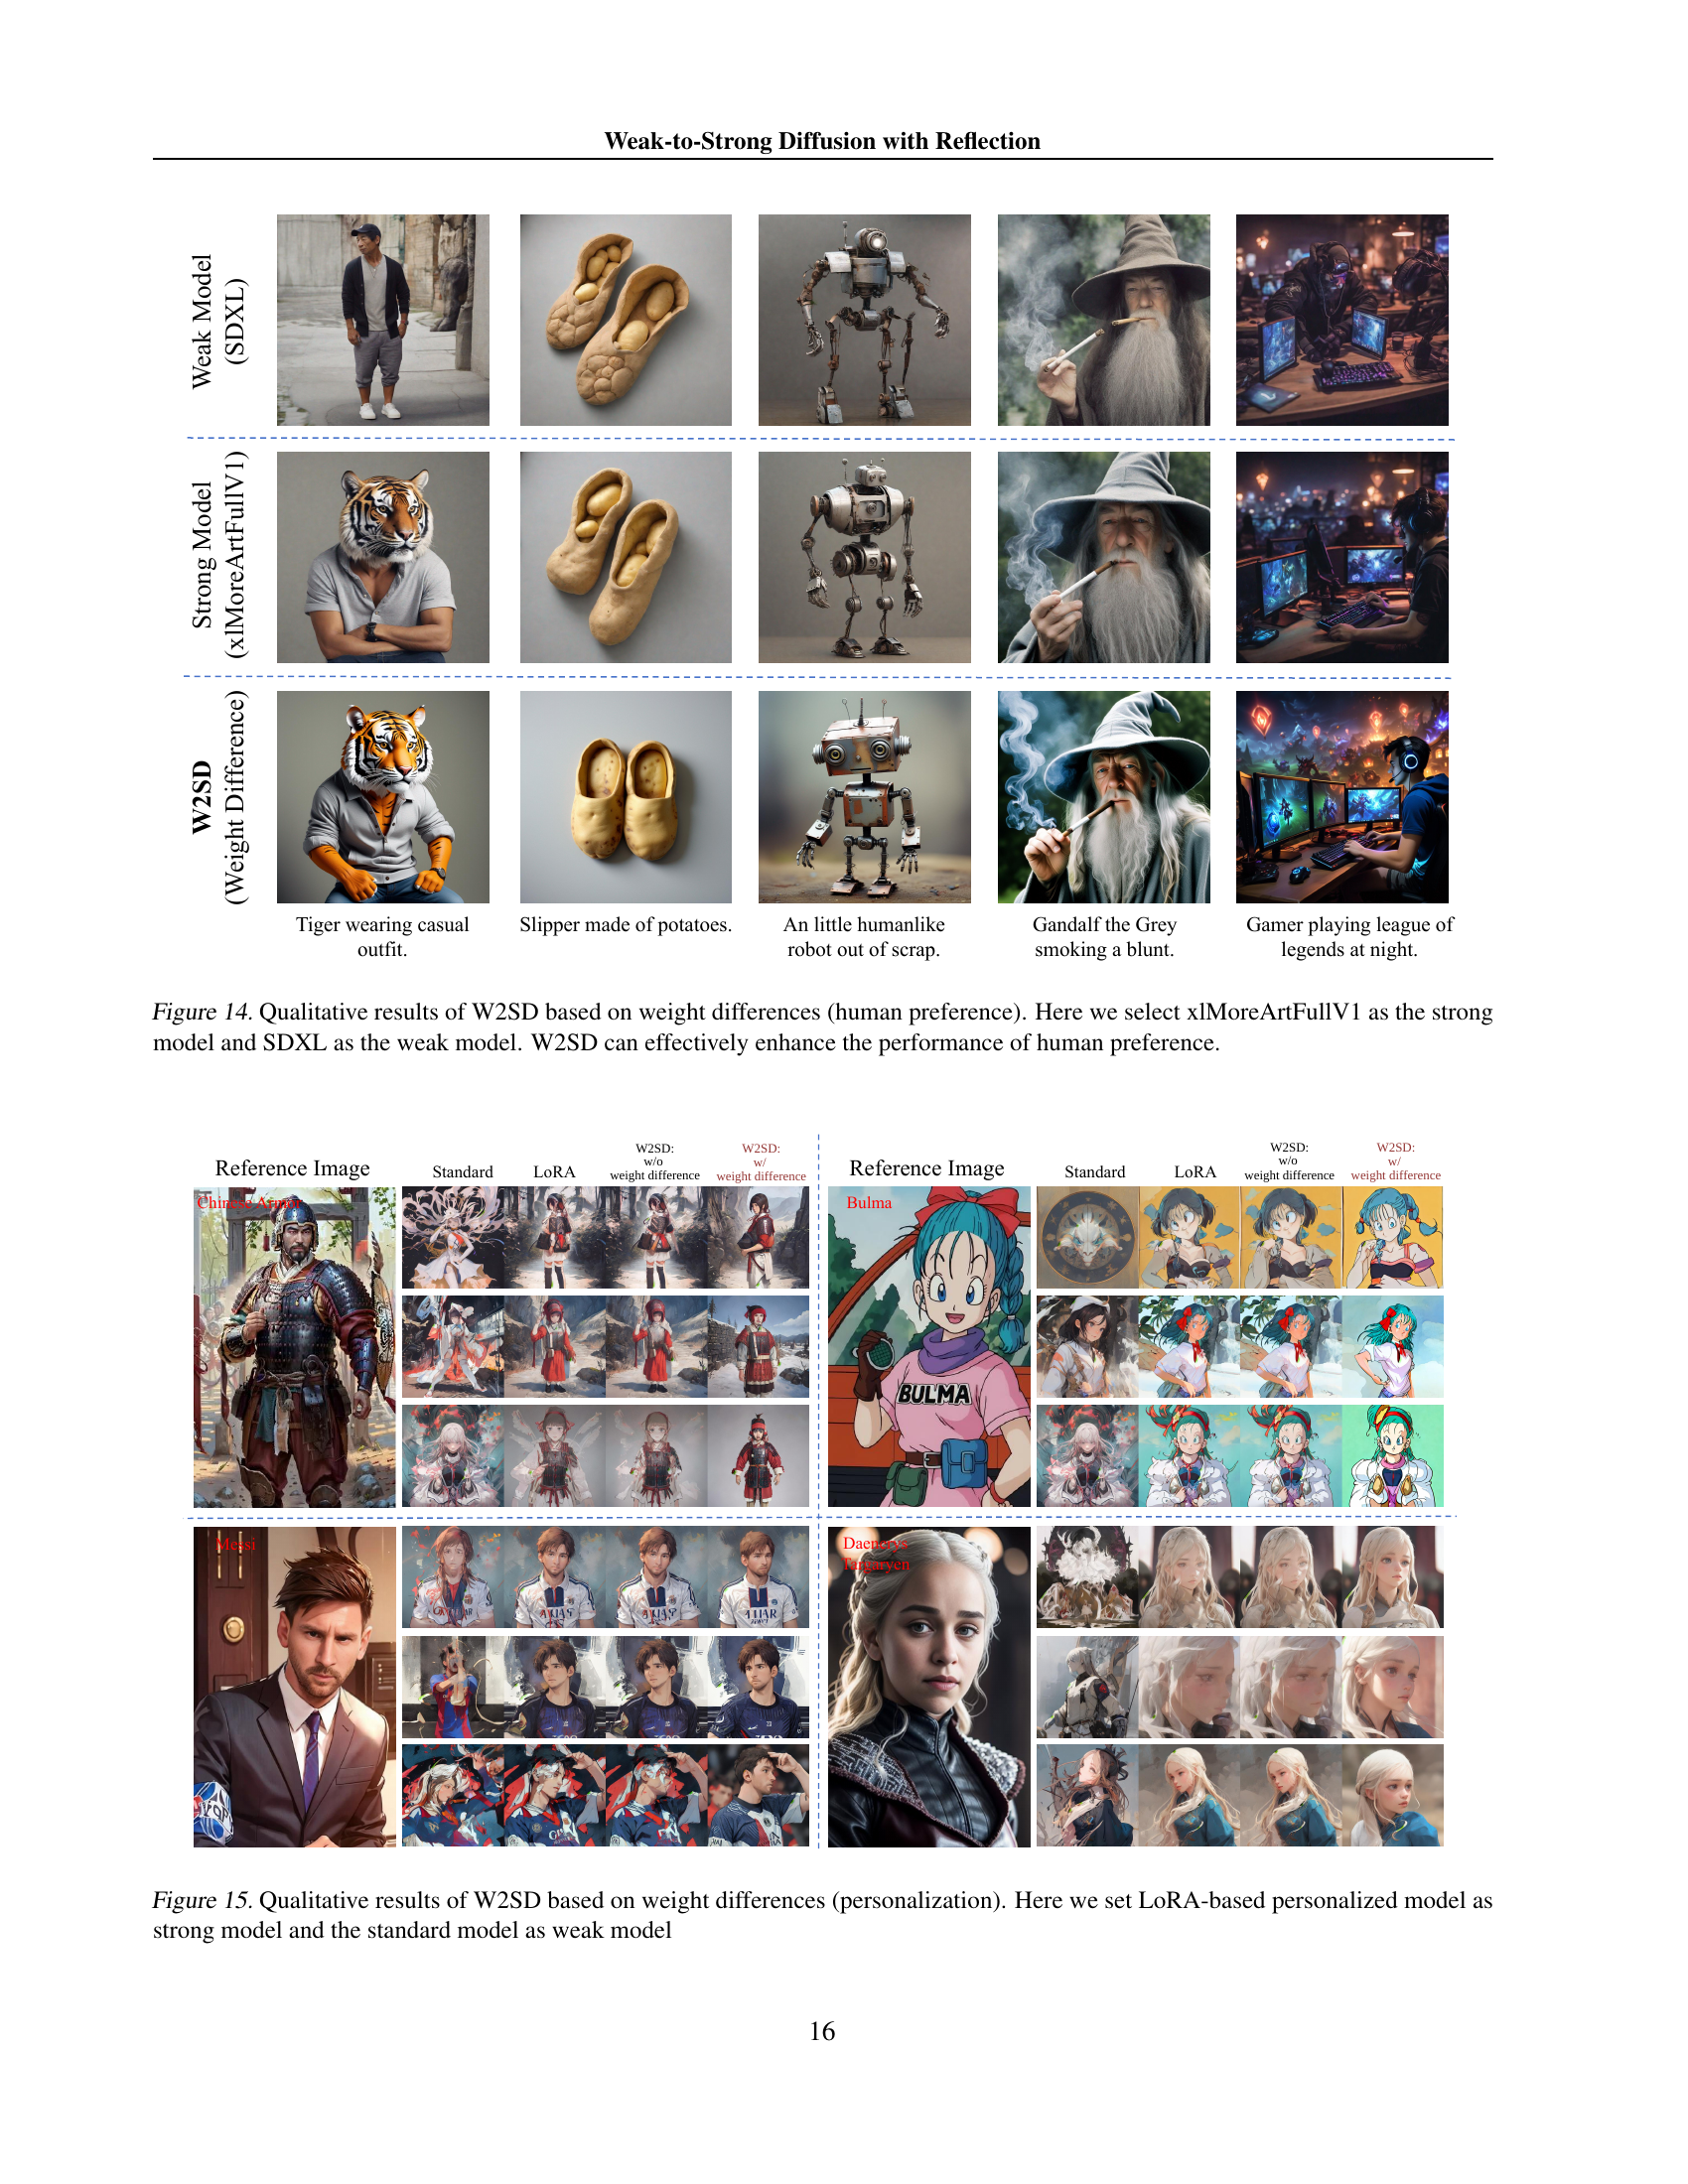
🔼 This figure displays a qualitative comparison of image generation results using three different models: a weak model (SDXL), a strong model (xlMoreArtFullV1), and the proposed W2SD method. Each row shows the same prompt’s output for the three models. The images generated by the weak model alone often lack detail or deviate significantly from the prompt’s intent. The strong model generally produces more aesthetically pleasing and accurate results. W2SD, combining elements of both weak and strong models, produces images that are closer to the strong model’s quality but often contain more accurate and prompt-relevant details than the strong model alone. This demonstrates W2SD’s capability to enhance human preference by balancing the strengths of weaker and stronger models.
read the caption
Figure 14: Qualitative results of W2SD based on weight differences (human preference). Here we select xlMoreArtFullV1 as the strong model and SDXL as the weak model. W2SD can effectively enhance the performance of human preference.
More on tables
| Method | DINO | CLIP-I | CLIP-T | |
|---|---|---|---|---|
| SD1.5 | 27.47 | 52.08 | 20.14 | |
| Personalized LoRA | 48.03 | 64.37 | 25.99 | |
| W2SD | 51.58 | 68.04 | 27.66 |
🔼 Table 2 presents a quantitative comparison of the performance of the Weak-to-Strong Diffusion with Reflection (W2SD) method, using a personalized LoRA (Low-Rank Adaptation) model. The experiment focuses on measuring the impact of W2SD when the difference in model weights between a base model (SD1.5) and a LoRA-tuned version (SD1.5 + LoRA) is used to steer generation towards more personalized outputs. The table likely shows various metrics to evaluate this personalization, such as metrics measuring image quality, alignment with prompts, and possibly others. The results demonstrate how W2SD leverages this weight difference to enhance the results, showcasing the efficacy of the method in achieving personalized generation.
read the caption
Table 2: Quantitative results of W2SD based on personalized LoRA model. Here, the weight difference between ℳwsuperscriptℳ𝑤\mathcal{M}^{w}caligraphic_M start_POSTSUPERSCRIPT italic_w end_POSTSUPERSCRIPT (SD1.5) and ℳssuperscriptℳ𝑠\mathcal{M}^{s}caligraphic_M start_POSTSUPERSCRIPT italic_s end_POSTSUPERSCRIPT (SD1.5 +LoRA) biases the generated results towards a more personalized direction.
| Method | IS | FiD | AES | HPS v2 |
|---|---|---|---|---|
| DiT-MoE-S | 45.4437 | 15.1032 | 4.4755 | 20.0486 |
| W2SD | 55.5341 | 9.1001 | 4.5053 | 22.3225 |
🔼 This table presents a quantitative analysis of the Weak-to-Strong Diffusion with Reflection (W2SD) method when applied to Mixture of Experts (MoE) models, using the ImageNet 50K dataset. It shows the improvements achieved by W2SD compared to a standard DiT-MoE-S model across several metrics, including Inception Score (IS), Fréchet Inception Distance (FID), Average Expert Selection (AES), and Human Preference Score version 2 (HPSv2). These metrics assess different aspects of image quality and generation, helping to demonstrate the effectiveness of W2SD in enhancing image generation performance within the MoE framework.
read the caption
Table 3: Quantitative results of W2SD based on MoE Mechanism. Datasets: ImageNet 50K.
| Method | HPS v2 | AES | PickScore | MPS |
|---|---|---|---|---|
| SD1.5 | 24.9558 | 5.5003 | 20.1368 | 42.1101 |
| W2SD | 25.5069 | 5.5073 | 20.2443 | 57.8903 |
| SDXL | 29.8701 | 6.0939 | 21.6487 | 43.9425 |
| W2SD | 31.2020 | 6.0970 | 21.7980 | 56.0608 |
🔼 This table presents a quantitative comparison of the performance of the Weak-to-Strong Diffusion with Reflection (W2SD) method against a standard SDXL model, using the Pick-a-Pic dataset. The comparison focuses specifically on the impact of varying the guidance scale, a parameter that influences the balance between the input prompt and the model’s own generation tendencies. The results are evaluated across four metrics: HPS v2 (Human Preference Score v2), AES (Aesthetic Quality), PickScore, and MPS (multi-perspective score). These metrics offer a comprehensive assessment of the generated images’ quality, aligning with human preferences and covering various aspects of image quality. The table helps illustrate how leveraging the differences in guidance scales (as a proxy for a weak-strong model difference) improves image generation by W2SD.
read the caption
Table 4: Quantitative results of W2SD based on guidance difference. Model: SDXL. Datasets: Pick-a-Pic.
| Prompt Type | HPS v2 | AES | PickScore | MPS |
|---|---|---|---|---|
| Raw Prompt | 25.3897 | 5.4454 | 20.7144 | - |
| Refined Prompt | 28.5698 | 5.7714 | 21.6350 | 45.7719 |
| W2SD | 29.4023 | 5.8812 | 21.8053 | 54.2275 |
🔼 This table presents a quantitative analysis of the Weak-to-Strong Diffusion with Reflection (W2SD) method. Specifically, it evaluates the performance improvements achieved by W2SD when leveraging semantic differences between prompts. The model used is SDXL, and the dataset is GenEval. The table likely shows various metrics (e.g., HPS v2, AES, PickScore, MPS) to assess the quality of generated images, comparing the results obtained with W2SD against a baseline method (likely the SDXL model without W2SD). The results demonstrate the effectiveness of W2SD in enhancing the image generation quality by utilizing nuanced prompt variations.
read the caption
Table 5: Quantitative results of W2SD based on semantic differences between prompts. Model: SDXL. Datasets: GenEval.
| Weight Difference | Condition Difference | HPS v2 | Winning Rate |
|---|---|---|---|
| 31.6412 | - | ||
| 32.8217 | 84% | ||
| 32.0992 | 76% | ||
| 32.9623 | 90% |
🔼 This table demonstrates that the improvements from different types of model differences (weight difference and condition difference) in W2SD can be cumulative. It shows that combining these differences leads to better results than using either one alone. The Pick-a-Pic dataset is used for evaluation, and the specific metric shown is the HPSv2 score, which reflects human preference.
read the caption
Table 6: The improvements effects from different model differences can be cumulative. Datasets: Pick-a-Pic.
| Model Difference | Results | ||
| Weight Difference | Finetune Mechanism | SDXL/SD1.5 | Tables 1 and 9 |
| LoRA Mechanism | SDXL/SD1.5 | Tables 2, 11 and 11 | |
| Strong Experts (MoE) | Weak experts (MoE) | Table 3 | |
| Condition Difference | High CFG | Low CFG | Tables 4 and 9 |
| Refined Prompt | Raw Prompt | Table 5 | |
| Sampling Pipeline Difference | ControlNet | Standard Pipeline (DDIM) | Figure 10 |
| IP-Adapter | Standard Pipeline (DDIM) | Figure 17 |
🔼 This table shows different ways to create a ‘weak-to-strong’ model difference for improving diffusion models. Each row represents a different method of creating this difference, along with the specific models or techniques used, and a reference to the section in the paper where the results are discussed. The types of model differences explored include variations in model weights (full finetuning, LoRA, Mixture of Experts), differences in conditioning (guidance scale, prompt semantics), and differences in sampling pipelines.
read the caption
Table 7: Different types of model differences lead to improvements effects in different directions.
| Method | HPS v2 | AES | PickScore | MPS |
|---|---|---|---|---|
| SD1.5 | 25.3601 | 5.2023 | 21.0519 | - |
| DreamShaper | 28.7845 | 5.7047 | 21.8522 | 47.8813 |
| W2SD | 28.7901 | 5.7847 | 21.9057 | 52.1192 |
| SDXL | 28.5536 | 5.4946 | 22.2464 | - |
| Juggernaut-XL | 28.9085 | 5.3455 | 22.4906 | 47.5648 |
| W2SD | 29.3246 | 5.4261 | 22.5803 | 52.4358 |
🔼 Table 12 presents a quantitative analysis of the Weak-to-Strong Diffusion with Reflection (W2SD) method on video generation tasks. The model used is AnimateDiff, and the evaluation is performed using the VBench dataset. The table shows the performance improvements achieved by W2SD across various metrics relevant to video quality. These metrics likely include aspects such as subject consistency, background consistency, motion smoothness, dynamic range, and overall aesthetic and image quality. By comparing the results obtained with W2SD to those obtained with the standard AnimateDiff model, the table demonstrates the efficacy of W2SD in enhancing the quality of generated videos.
read the caption
Table 12: Quantitative results of W2SD on the video generation task. Model: AnimateDiff. Datasets: VBench.
Full paper#