TL;DR#
Large Language Models (LLMs) are increasingly used for various tasks, including logical reasoning. However, their ability to handle complex reasoning problems remains a challenge. This paper investigates the scaling limits of LLMs in complex, non-monotonic reasoning using logic grid puzzles. Existing benchmarks often lack precise control over problem complexity, hindering a systematic understanding of LLM capabilities. This limits the ability to identify and address the root causes of poor performance.
To tackle this, the researchers introduce ZebraLogic, a novel evaluation framework that generates logic puzzles with quantifiable complexity. Using ZebraLogic, they evaluate several LLMs, finding a significant drop in accuracy as puzzle complexity increases – a phenomenon they term the “curse of complexity.” This persists even with larger models, suggesting inherent limitations in current LLM architectures. The study also explores strategies to improve performance such as Best-of-N sampling, but these offer only limited improvement. The findings highlight the need for new approaches to enhance LLM reasoning capabilities.
Key Takeaways#
Why does it matter?#
This paper is crucial for researchers working with LLMs for reasoning. It introduces a novel benchmark, ZebraLogic, which enables systematic study of LLM scaling limits in logical reasoning, revealing a significant decline in accuracy with increasing complexity. This identifies inherent limitations of current LLMs and opens new avenues for research, including investigating improved reasoning strategies and training methods.
Visual Insights#

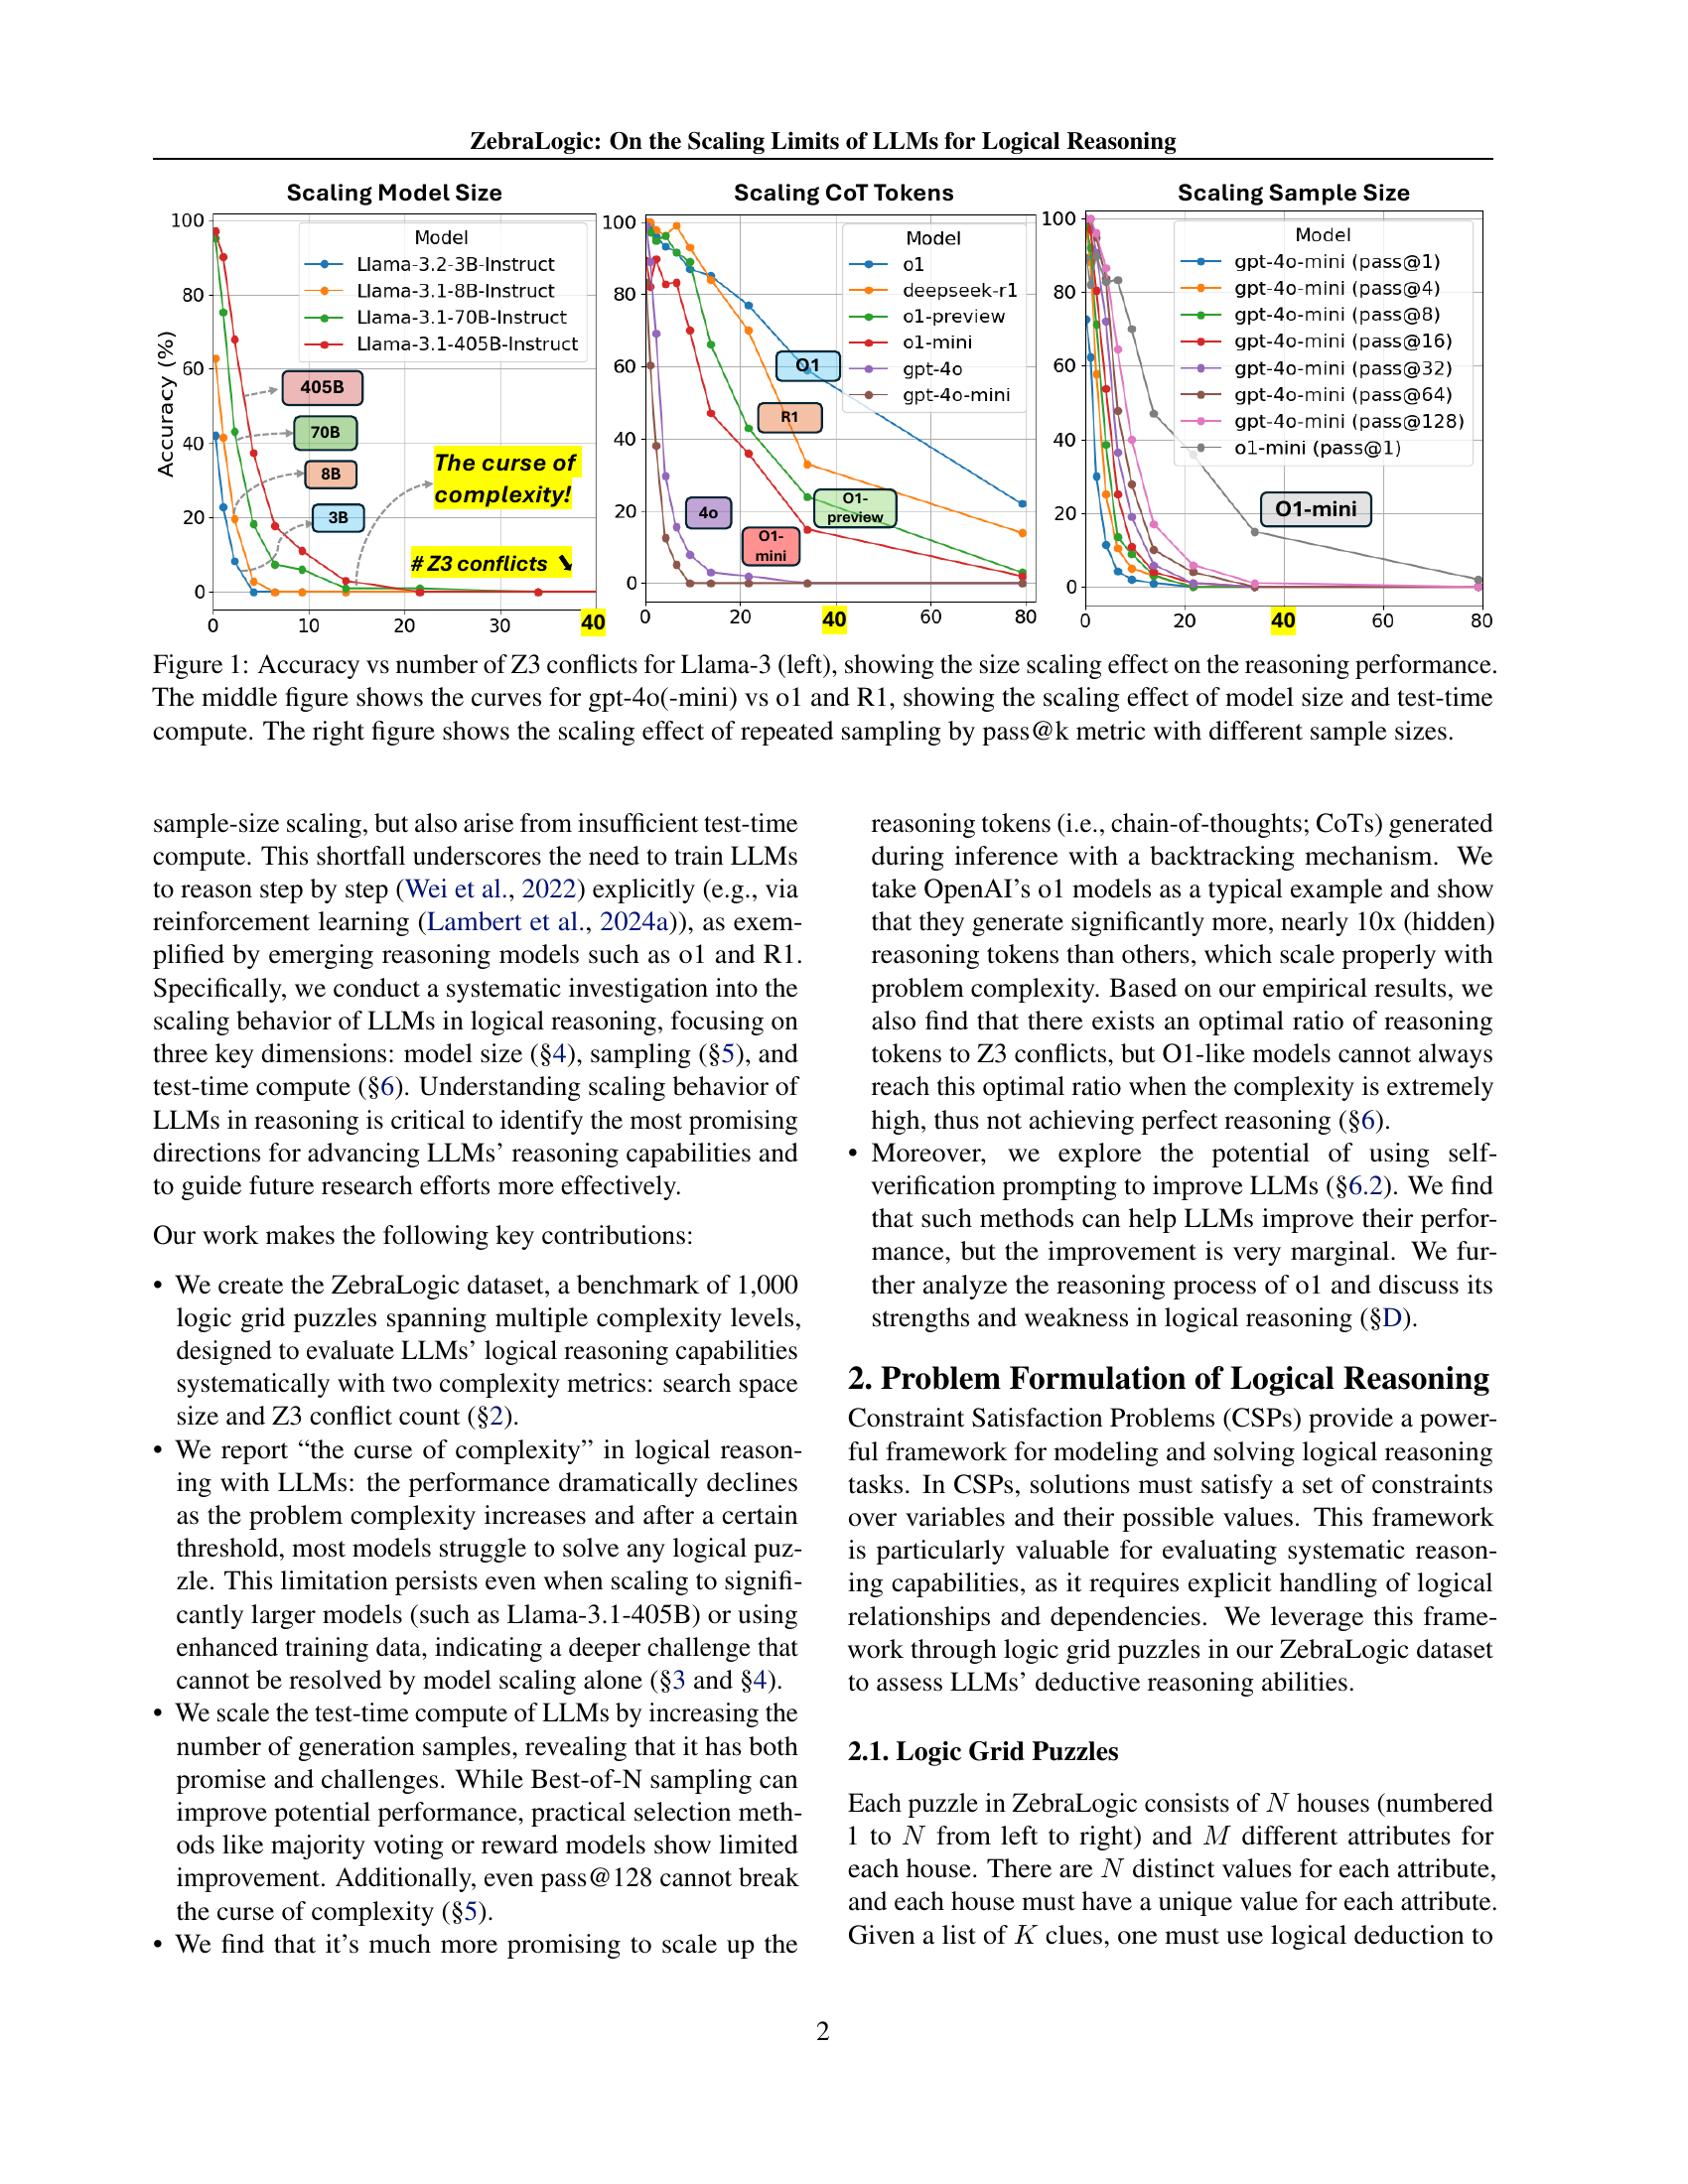
🔼 This figure shows three subplots illustrating different aspects of scaling in large language model (LLM) logical reasoning performance. The left subplot displays Llama-3’s accuracy against the number of Z3 conflicts (a measure of problem complexity), demonstrating how accuracy decreases as complexity increases. The middle subplot compares the accuracy of several models (gpt-40, gpt-40-mini, o1, R1) across varying problem complexities and model sizes, illustrating the impact of model scaling and test-time compute. The right subplot shows the scaling effect of repeated sampling using the pass@k metric, where accuracy is measured by taking the best result from k samples.
read the caption
Figure 1: Accuracy vs number of Z3 conflicts for Llama-3 (left), showing the size scaling effect on the reasoning performance. The middle figure shows the curves for gpt-4o(-mini) vs o1 and R1, showing the scaling effect of model size and test-time compute. The right figure shows the scaling effect of repeated sampling by pass@k metric with different sample sizes.
| Model Names | Overall Grid-level acc. | Small | Medium | Large | X-Large | Cell-level Acc. |
| o1-full \faLock | ||||||
| DeepSeek-R1 \faKey | ||||||
| o1-preview \faLock | ||||||
| o1-mini \faLock | ||||||
| Claude Sonnet 3.5 \faLock | ||||||
| Llama-3.1-405B \faKey | ||||||
| GPT-4o \faLock | ||||||
| Gemini-1.5-Pro \faLock | ||||||
| Mistral-Large-2 \faKey | ||||||
| Qwen2.5-72B \faKey | ||||||
| Gemini-1.5-Flash \faLock | ||||||
| Llama-3.1-70B \faKey | ||||||
| DeepSeek-v2.5 \faKey | ||||||
| GPT-4o-mini \faLock | ||||||
| Gemma-2-27B \faKey | ||||||
| Llama-3.1-8B \faKey | ||||||
| Phi-3.5-4B \faKey |
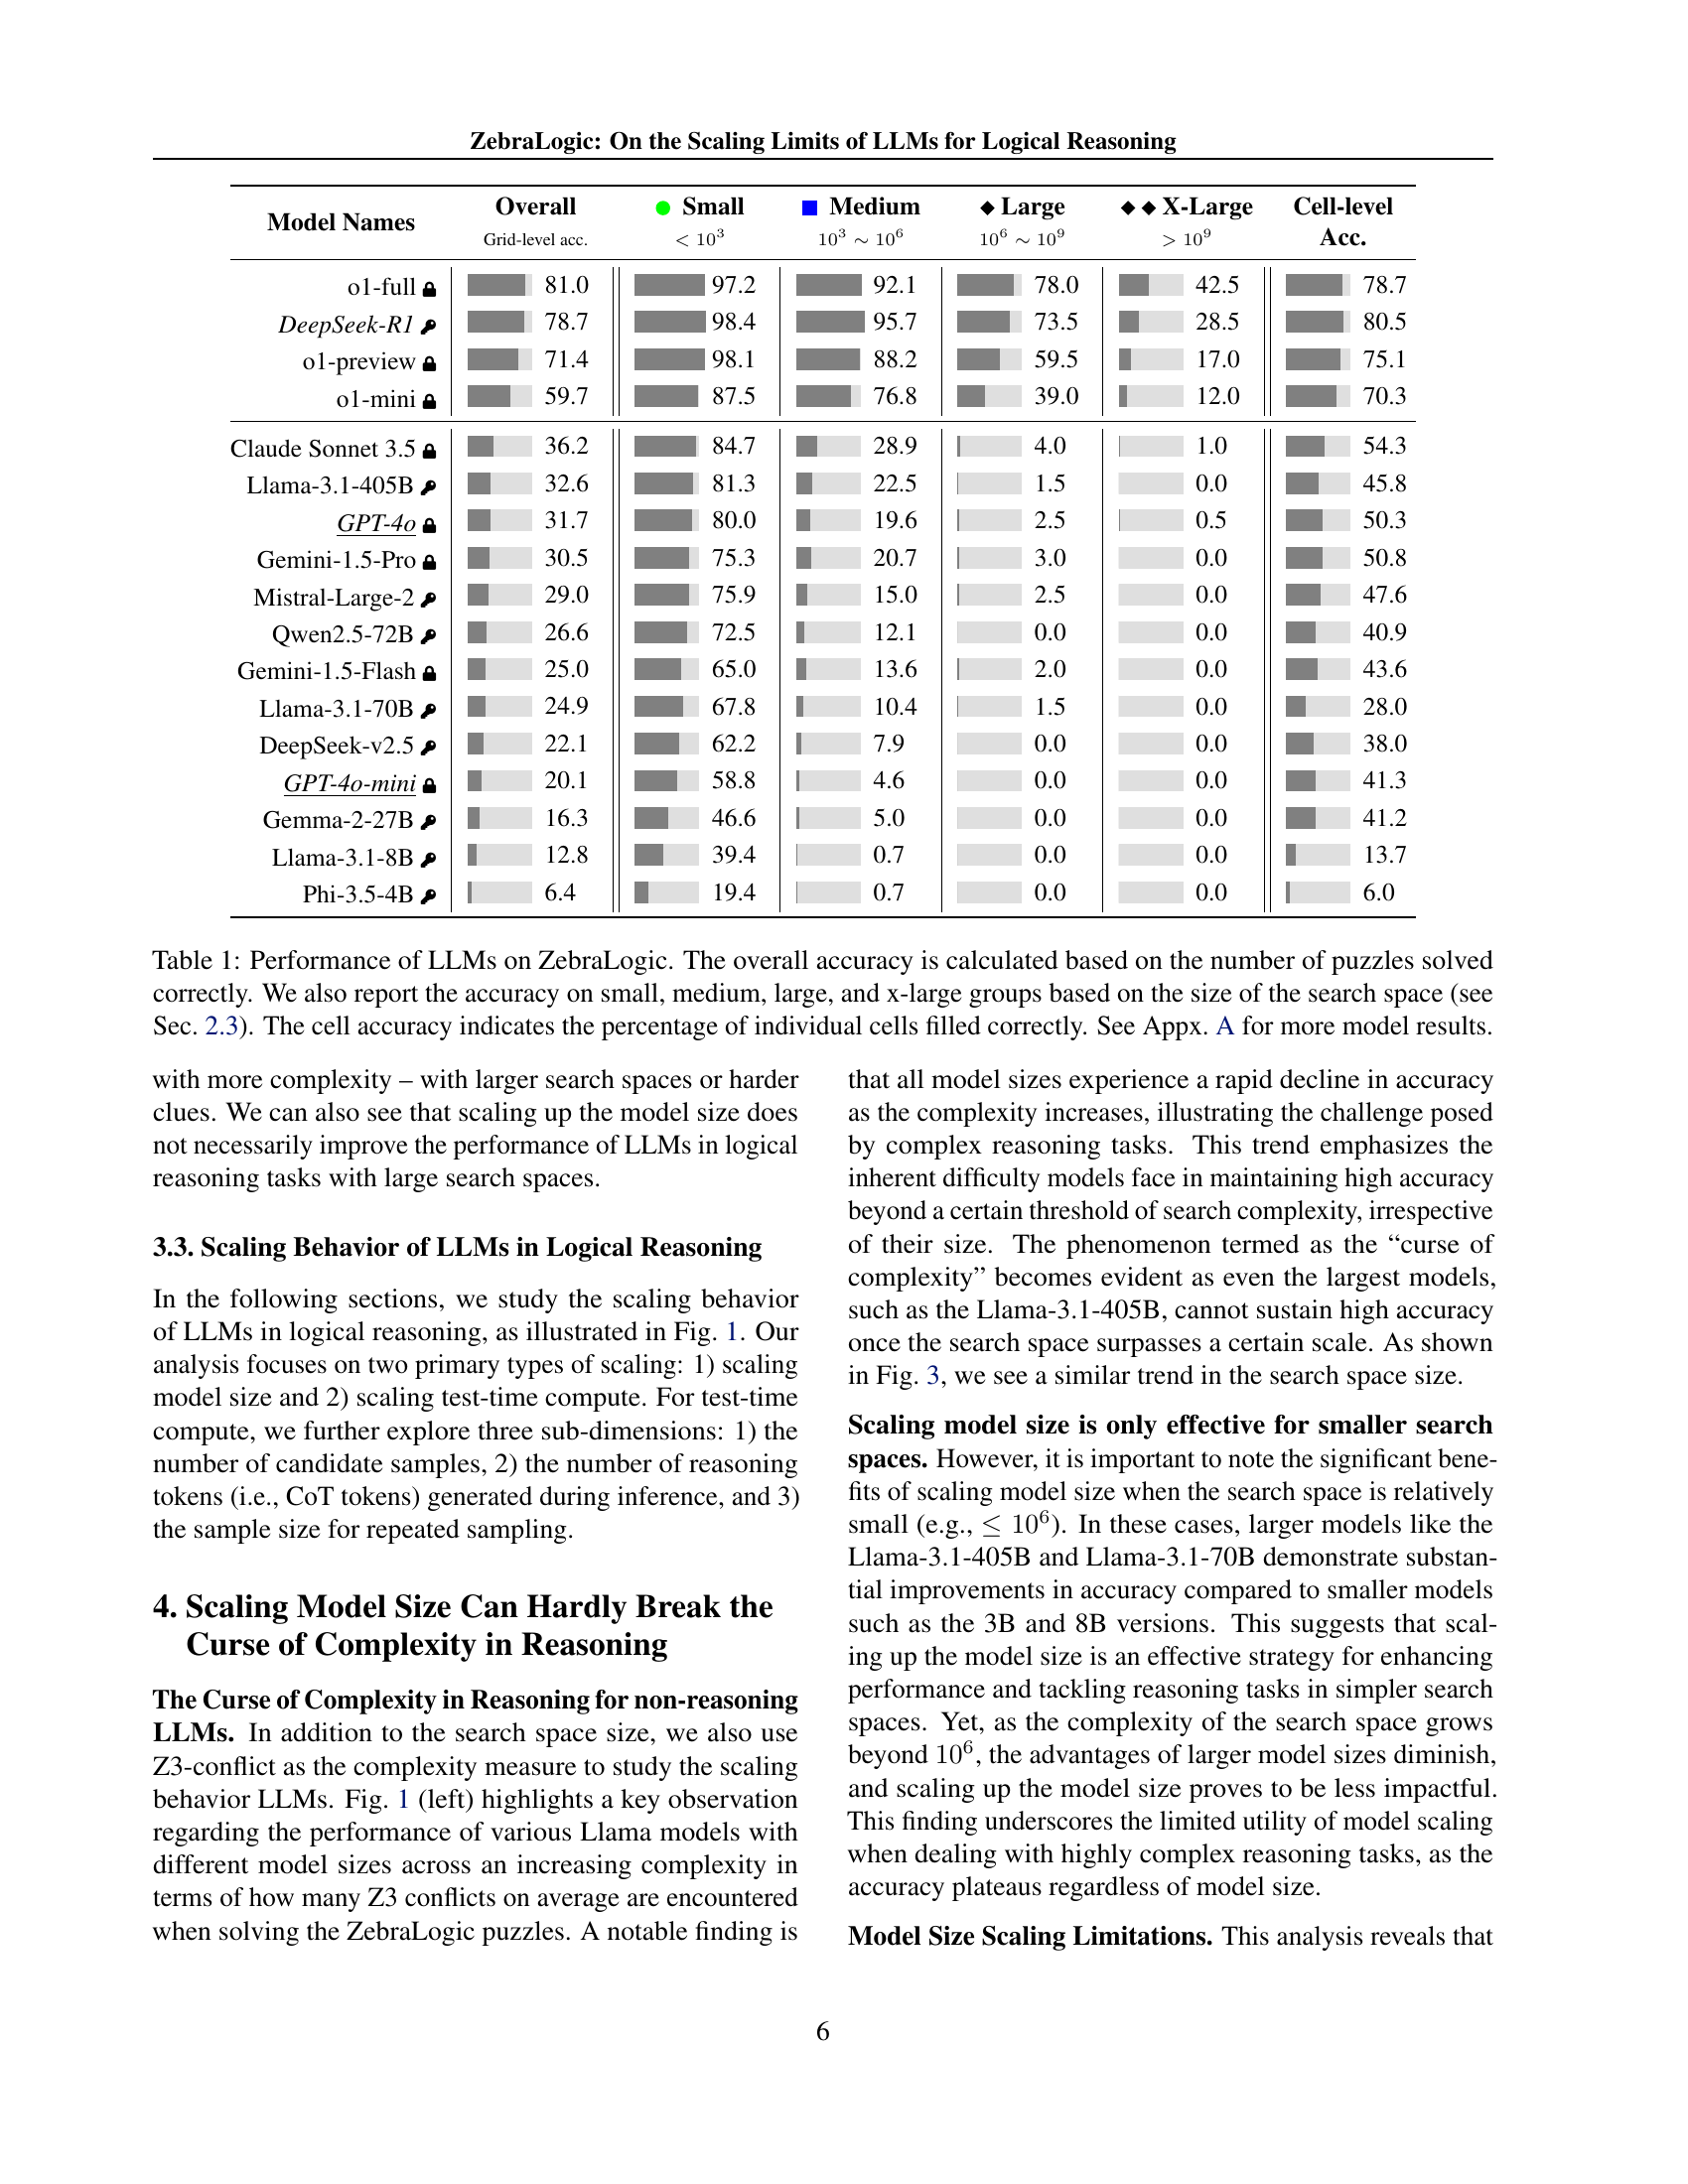
🔼 This table presents the performance of various Large Language Models (LLMs) on the ZebraLogic benchmark. It shows the overall accuracy of each model in solving logic grid puzzles, broken down by puzzle complexity (small, medium, large, x-large, categorized by search space size). Additionally, it provides the cell accuracy, which is the percentage of individual cells correctly filled in the solution grids. For a more comprehensive view of the model results, refer to Appendix A.
read the caption
Table 1: Performance of LLMs on ZebraLogic. The overall accuracy is calculated based on the number of puzzles solved correctly. We also report the accuracy on small, medium, large, and x-large groups based on the size of the search space (see Sec. 2.3). The cell accuracy indicates the percentage of individual cells filled correctly. See Appx. A for more model results.
In-depth insights#
LLM Reasoning Limits#
The study of Large Language Models (LLMs) reveals inherent limitations in their logical reasoning capabilities. Scaling model size alone does not guarantee improved performance, especially when faced with complex problems. This is evidenced by the observed “curse of complexity,” where accuracy dramatically decreases as problem difficulty increases, regardless of model size. The research highlights the need to explore alternative strategies such as improving test-time computation through repeated sampling or enhancing chain-of-thought reasoning. While these strategies offer some potential improvements, they do not completely overcome the inherent limitations of current LLMs. The results underscore that solving complex logical problems requires more than simply increasing model parameters and necessitates a deeper understanding of how LLMs reason and strategize to improve their performance in such tasks. Ultimately, a combination of architectural advancements and novel training paradigms will be necessary to unlock the full potential of LLMs in logical reasoning.
ZebraLogic Dataset#
The ZebraLogic dataset represents a novel benchmark designed for rigorously evaluating Large Language Models’ (LLMs) logical reasoning capabilities. Its core strength lies in its systematic generation of logic grid puzzles, derived from Constraint Satisfaction Problems (CSPs), which allows for precise control and quantification of puzzle complexity. This contrasts with many existing benchmarks which lack this level of granularity, making it difficult to isolate inherent LLM reasoning limitations from issues stemming from knowledge gaps or dataset biases. The dataset’s structure enables the researchers to systematically study the scaling limits of LLMs by manipulating problem difficulty via metrics such as search space size and number of Z3 conflicts, leading to the discovery of a “curse of complexity.” This feature makes ZebraLogic particularly useful for understanding the true capabilities and shortcomings of current LLMs in complex deductive reasoning, guiding future research and development towards more robust and scalable reasoning models.
Complexity’s Curse#
The paper’s exploration of “Complexity’s Curse” reveals a critical limitation in Large Language Models (LLMs) for logical reasoning. As problem complexity increases (measured by search space size and Z3 conflict count), LLM accuracy dramatically declines. This isn’t simply a matter of insufficient computational resources; even larger models with increased inference time struggle. This suggests inherent limitations in current LLM architectures, potentially stemming from their reliance on statistical correlations rather than true logical deduction. The findings highlight a need for architectural innovations that move beyond scaling, potentially incorporating symbolic reasoning techniques or more explicit training to improve step-by-step reasoning capabilities. The “curse” isn’t just a performance bottleneck; it points to a fundamental challenge in enabling LLMs to reliably solve complex deductive problems. Further research focusing on enhancing LLM reasoning capabilities, such as employing backtracking mechanisms or self-verification prompts, is crucial to overcome this fundamental constraint.
Scaling Strategies#
The research explores scaling strategies for Large Language Models (LLMs) in logical reasoning, focusing on three key dimensions: model size, sampling, and test-time compute. Increasing model size showed diminishing returns beyond a certain complexity threshold, highlighting the limitations of simply scaling up parameters. The ‘curse of complexity’ was observed, where performance sharply declined as problem complexity grew, irrespective of model size. Strategies like Best-of-N sampling demonstrated improvement, but their effectiveness was limited. Extensive chain-of-thought reasoning, as exemplified by the o1 model’s generation of numerous hidden reasoning tokens, showed more promise, indicating that enhancing the reasoning process itself is a more effective scaling strategy than simply increasing model parameters or sampling. Self-verification prompting offered modest improvements, suggesting that this is an avenue worthy of further exploration to improve LLM reasoning capabilities.
Future Directions#
Future research should prioritize improving LLMs’ reasoning capabilities by focusing on more effective training methodologies. Techniques like reinforcement learning with better reward models and curriculum learning could significantly enhance performance on complex logical tasks. Exploring neuro-symbolic AI approaches, which combine the strengths of neural networks and symbolic reasoning, holds immense potential for overcoming current limitations. Developing more comprehensive and diverse benchmark datasets is crucial for evaluating progress in logical reasoning and pushing the boundaries of LLM capabilities. Finally, a deeper understanding of the underlying mechanisms of LLM reasoning, particularly the role of hidden reasoning tokens and attention mechanisms, is needed to guide the development of more robust and scalable reasoning models. Addressing the “curse of complexity” will require innovative techniques that go beyond simply scaling model size or increasing computation. This might involve exploring novel architectural designs or incorporating more efficient search algorithms.
More visual insights#
More on figures

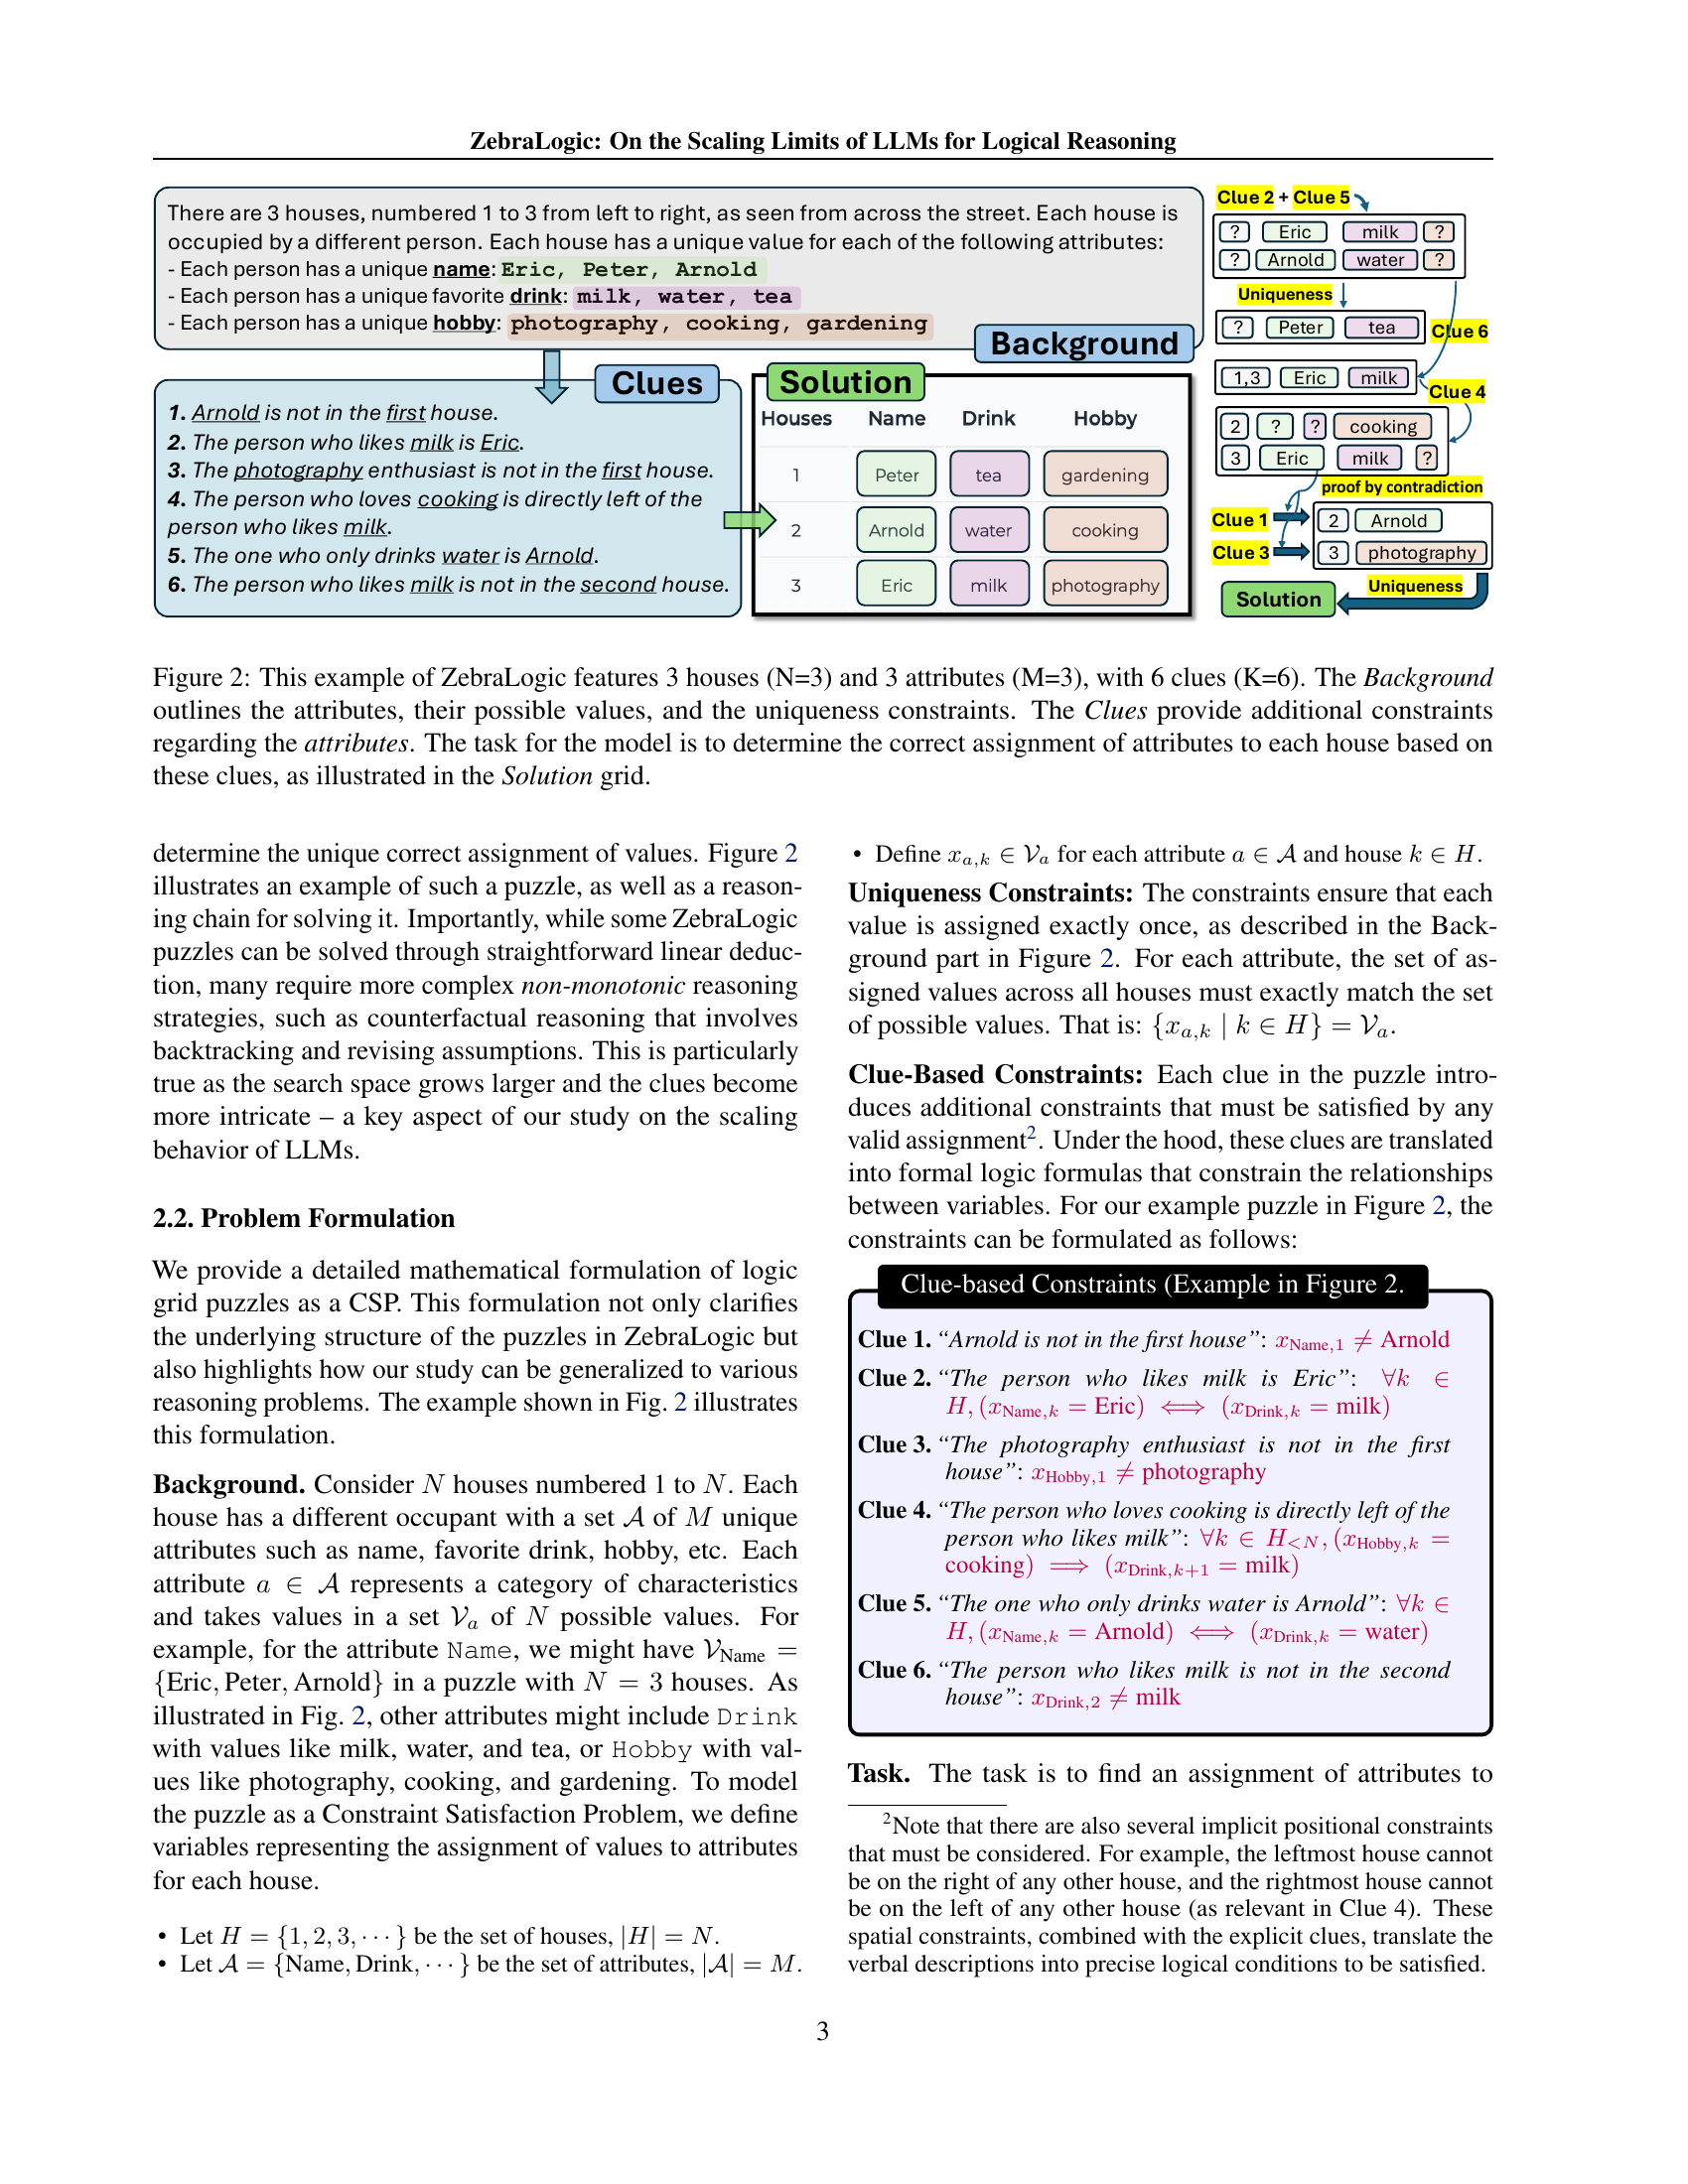
🔼 Figure 2 illustrates a ZebraLogic puzzle. It demonstrates a simplified example with 3 houses, each having 3 attributes (name, drink, hobby). Six clues are provided to constrain the possible assignments of attribute values to houses. The background section provides the attributes and their possible values, along with the inherent uniqueness constraint stating each attribute must have a different value per house. The clues add further constraints, and the model’s task is to deduce the correct assignment of values to each house, as displayed in the ‘solution’ grid.
read the caption
Figure 2: This example of ZebraLogic features 3 houses (N=3) and 3 attributes (M=3), with 6 clues (K=6). The Background outlines the attributes, their possible values, and the uniqueness constraints. The Clues provide additional constraints regarding the attributes. The task for the model is to determine the correct assignment of attributes to each house based on these clues, as illustrated in the Solution grid.

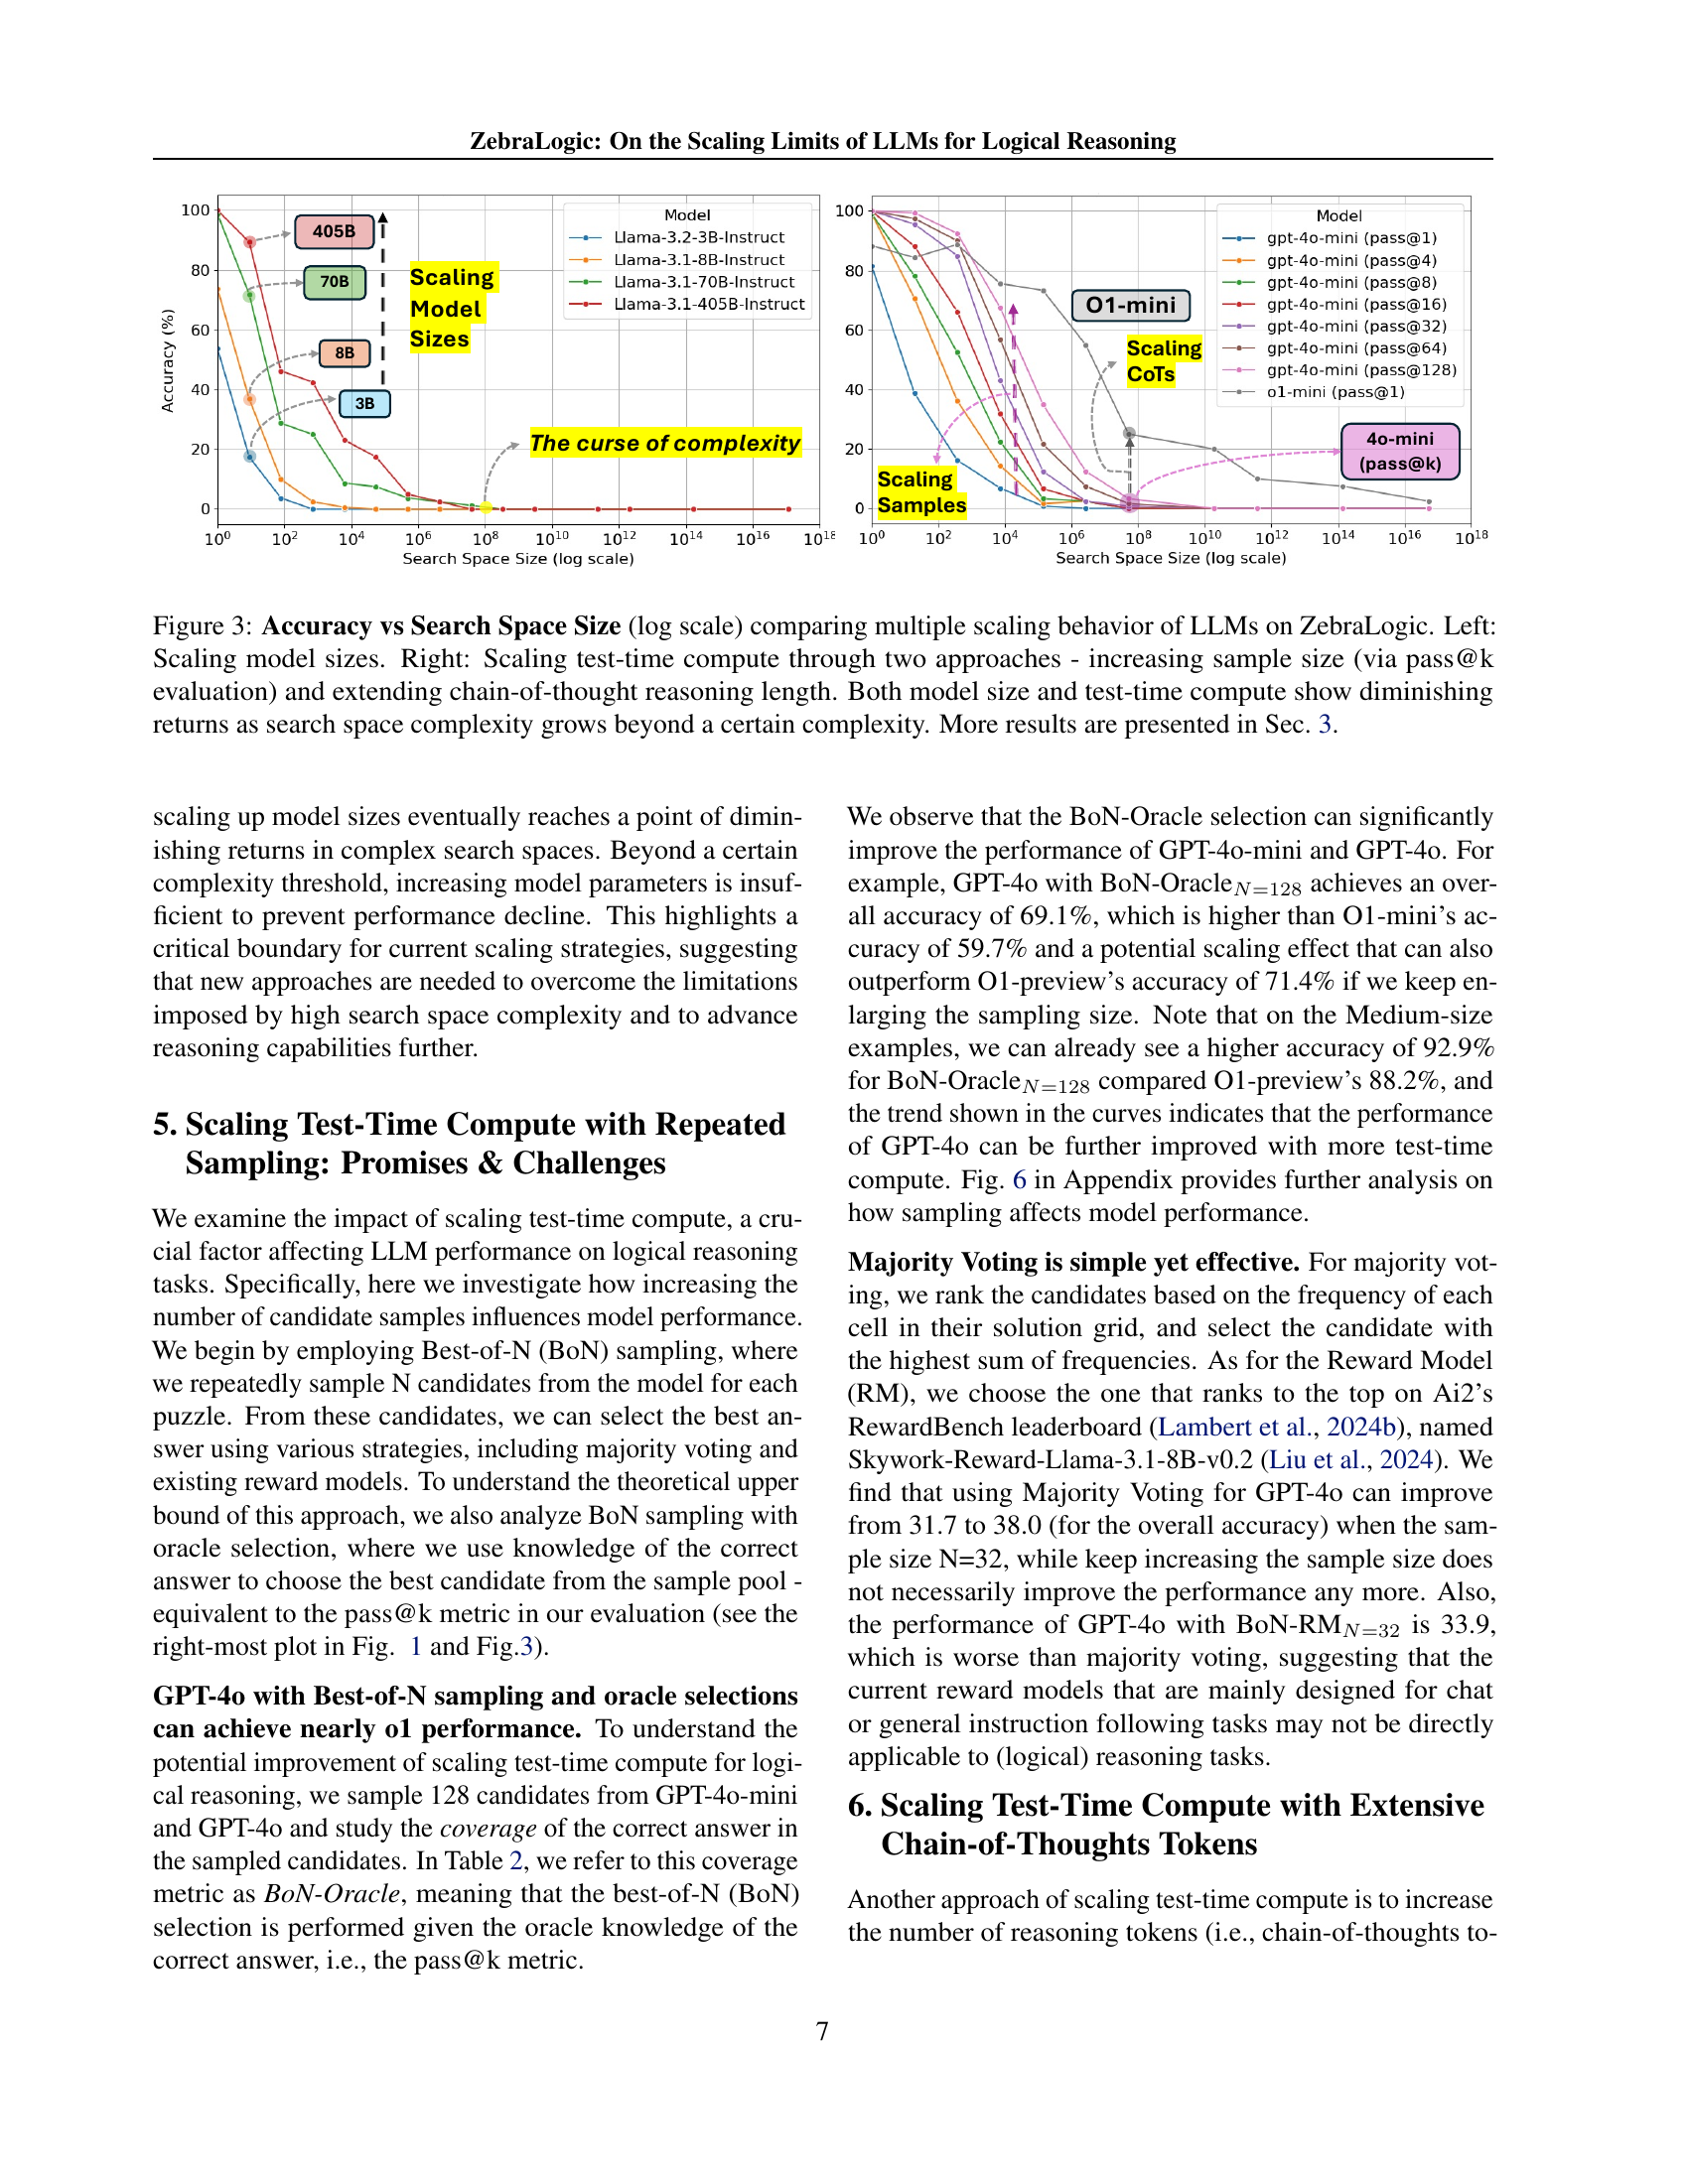
🔼 Figure 3 presents a comparative analysis of Large Language Model (LLM) performance on ZebraLogic, a novel dataset designed to evaluate logical reasoning capabilities. The figure shows how accuracy changes with increasing search space complexity using two different scaling approaches. The left panel shows the impact of scaling the model size (number of parameters) on accuracy. The right panel demonstrates how scaling test-time computation affects accuracy, using two methods: increasing the number of samples (pass@k) and increasing the length of chain-of-thought reasoning. The overall trend shows diminishing returns in accuracy for both model size and test-time computation as the complexity of the reasoning task (measured by search space size) grows beyond a certain threshold.
read the caption
Figure 3: Accuracy vs Search Space Size (log scale) comparing multiple scaling behavior of LLMs on ZebraLogic. Left: Scaling model sizes. Right: Scaling test-time compute through two approaches - increasing sample size (via pass@k evaluation) and extending chain-of-thought reasoning length. Both model size and test-time compute show diminishing returns as search space complexity grows beyond a certain complexity. More results are presented in Sec. 3.

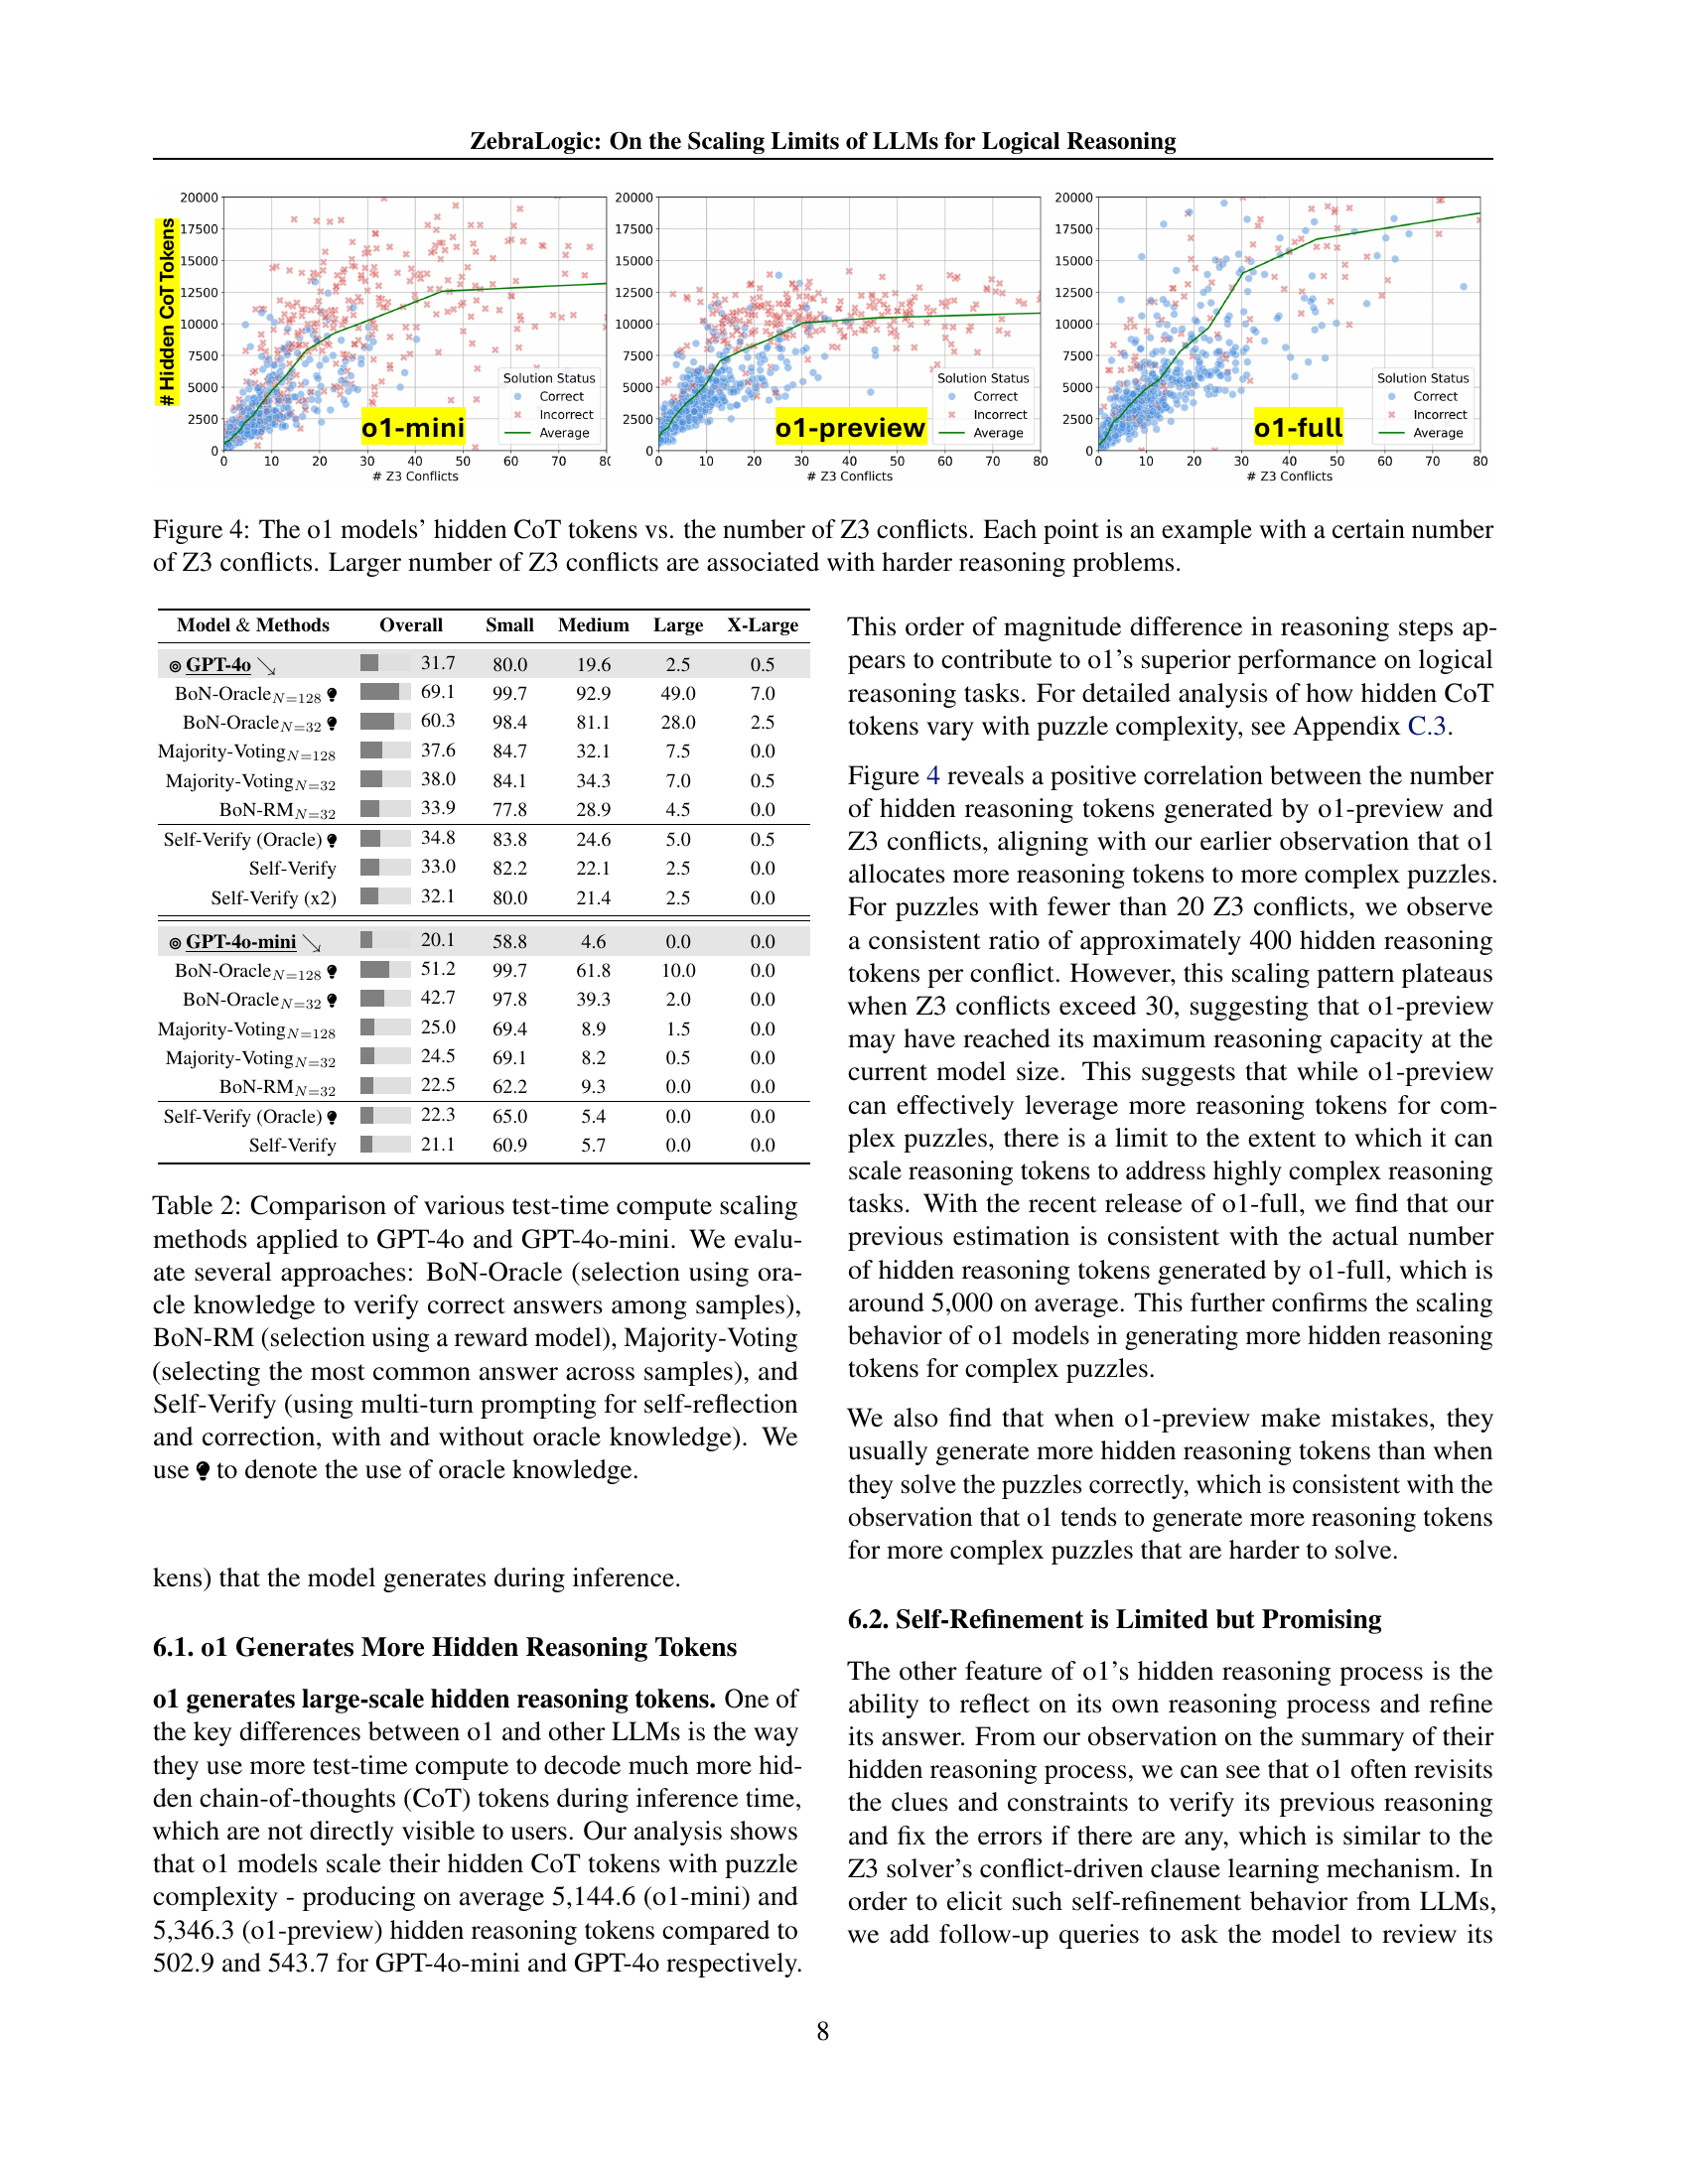
🔼 This figure illustrates the relationship between the number of hidden chain-of-thought (CoT) tokens generated by the OpenAI’s o1 models and the number of Z3 conflicts encountered during the solving process of logic grid puzzles. Each point in the scatter plot represents a single puzzle, with its x-coordinate indicating the number of Z3 conflicts (a measure of puzzle complexity) and its y-coordinate showing the number of hidden CoT tokens generated by the model during solving. A larger number of Z3 conflicts signifies a more complex reasoning problem. The figure shows how o1 models dynamically adjust the number of hidden CoT tokens used based on puzzle complexity.
read the caption
Figure 4: The o1 models’ hidden CoT tokens vs. the number of Z3 conflicts. Each point is an example with a certain number of Z3 conflicts. Larger number of Z3 conflicts are associated with harder reasoning problems.
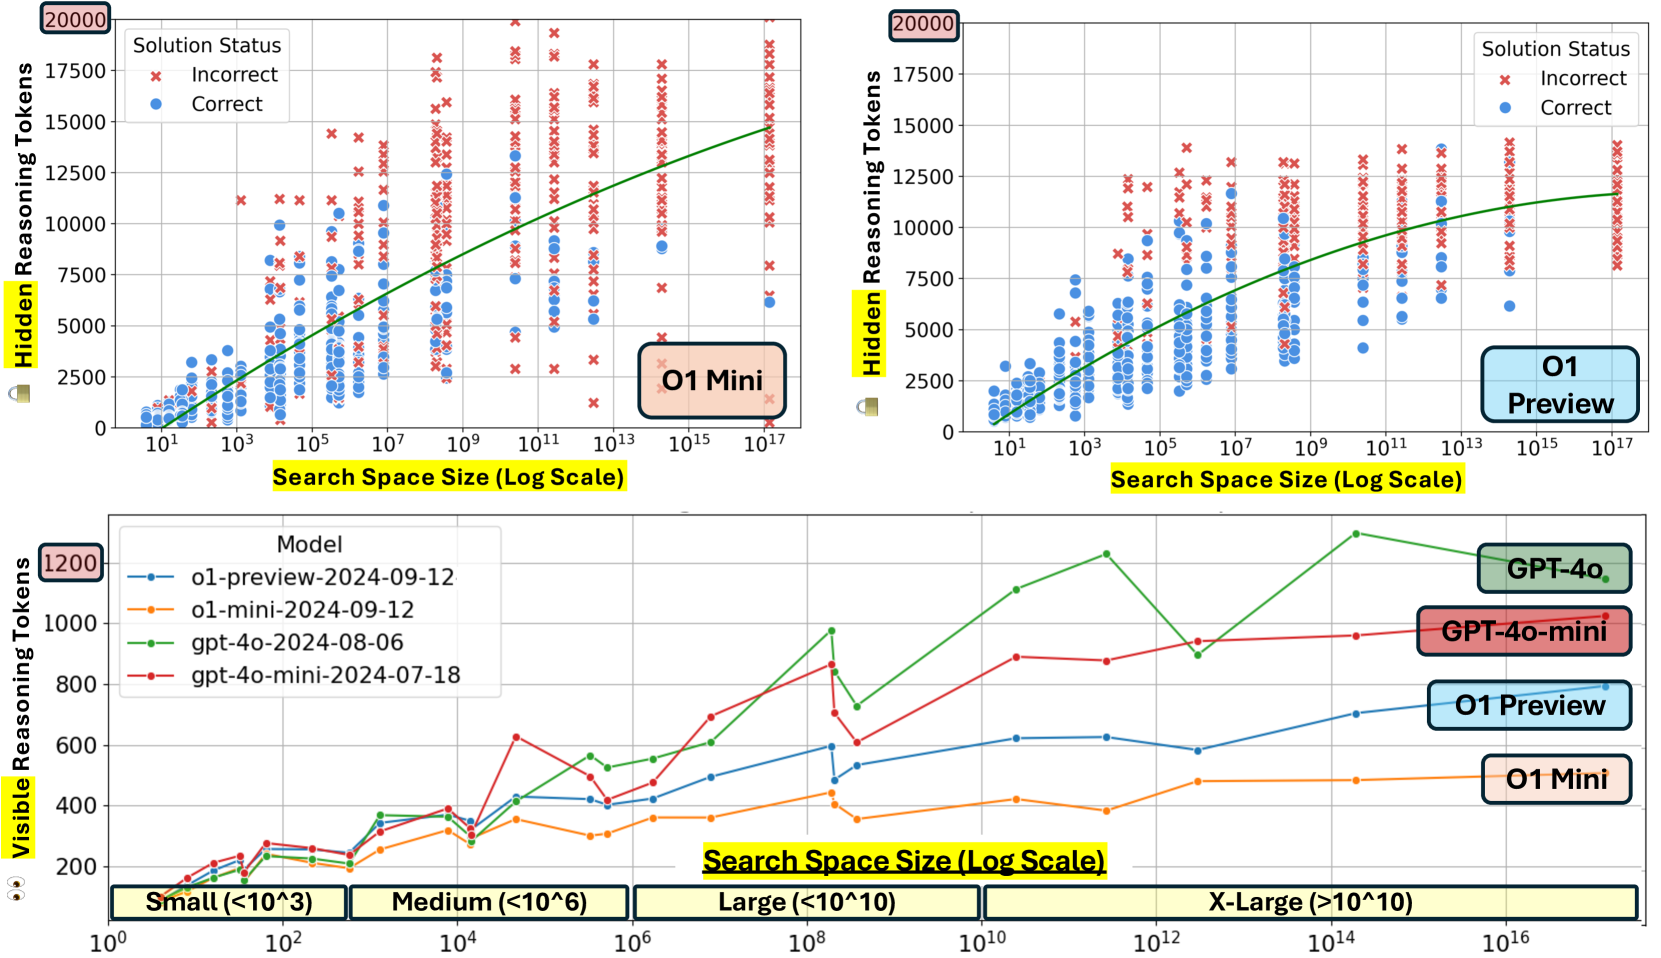
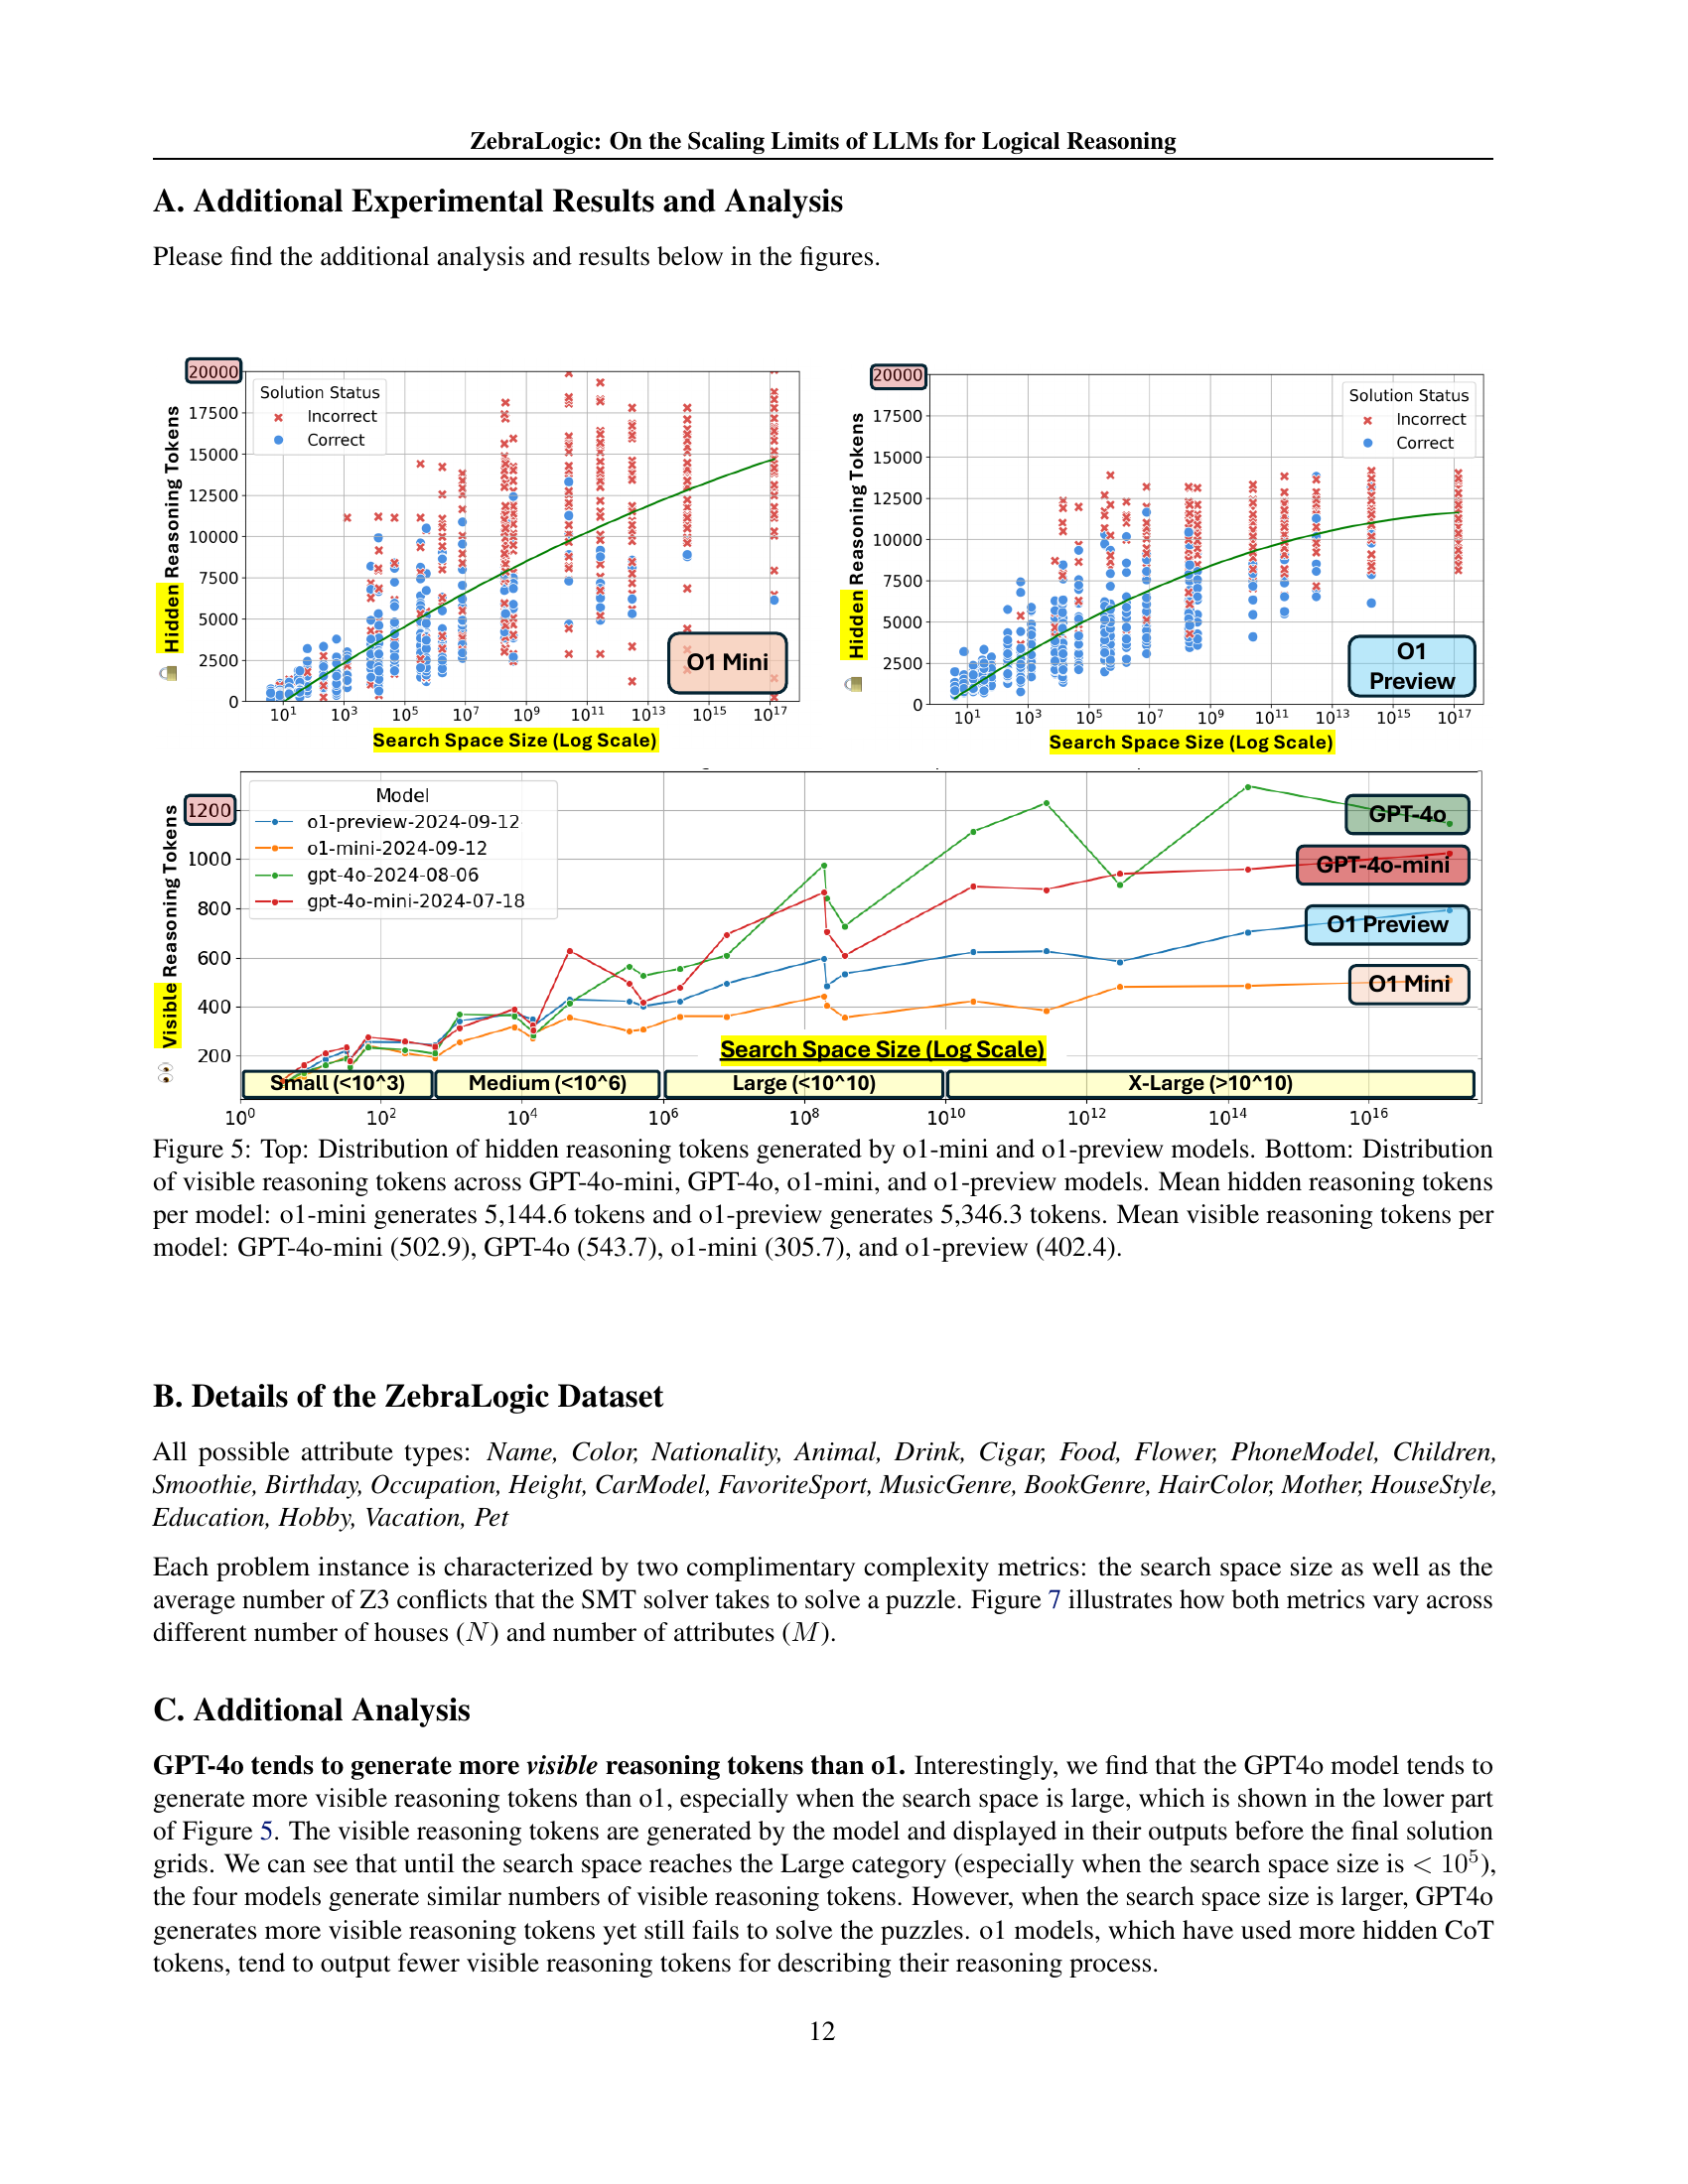
🔼 Figure 5 presents a comparative analysis of hidden and visible reasoning tokens generated by different large language models (LLMs). The top panel displays the distribution of hidden reasoning tokens produced by the o1-mini and o1-preview models. The bottom panel shows the distribution of visible reasoning tokens for GPT-4o-mini, GPT-4o, o1-mini, and o1-preview. Key findings include the significantly higher number of hidden tokens generated by the o1 models (5,144.6 for o1-mini and 5,346.3 for o1-preview) compared to the GPT models (502.9 and 543.7 respectively). This difference highlights a key architectural distinction between the models, suggesting a more extensive internal reasoning process within the o1 models.
read the caption
Figure 5: Top: Distribution of hidden reasoning tokens generated by o1-mini and o1-preview models. Bottom: Distribution of visible reasoning tokens across GPT-4o-mini, GPT-4o, o1-mini, and o1-preview models. Mean hidden reasoning tokens per model: o1-mini generates 5,144.6 tokens and o1-preview generates 5,346.3 tokens. Mean visible reasoning tokens per model: GPT-4o-mini (502.9), GPT-4o (543.7), o1-mini (305.7), and o1-preview (402.4).

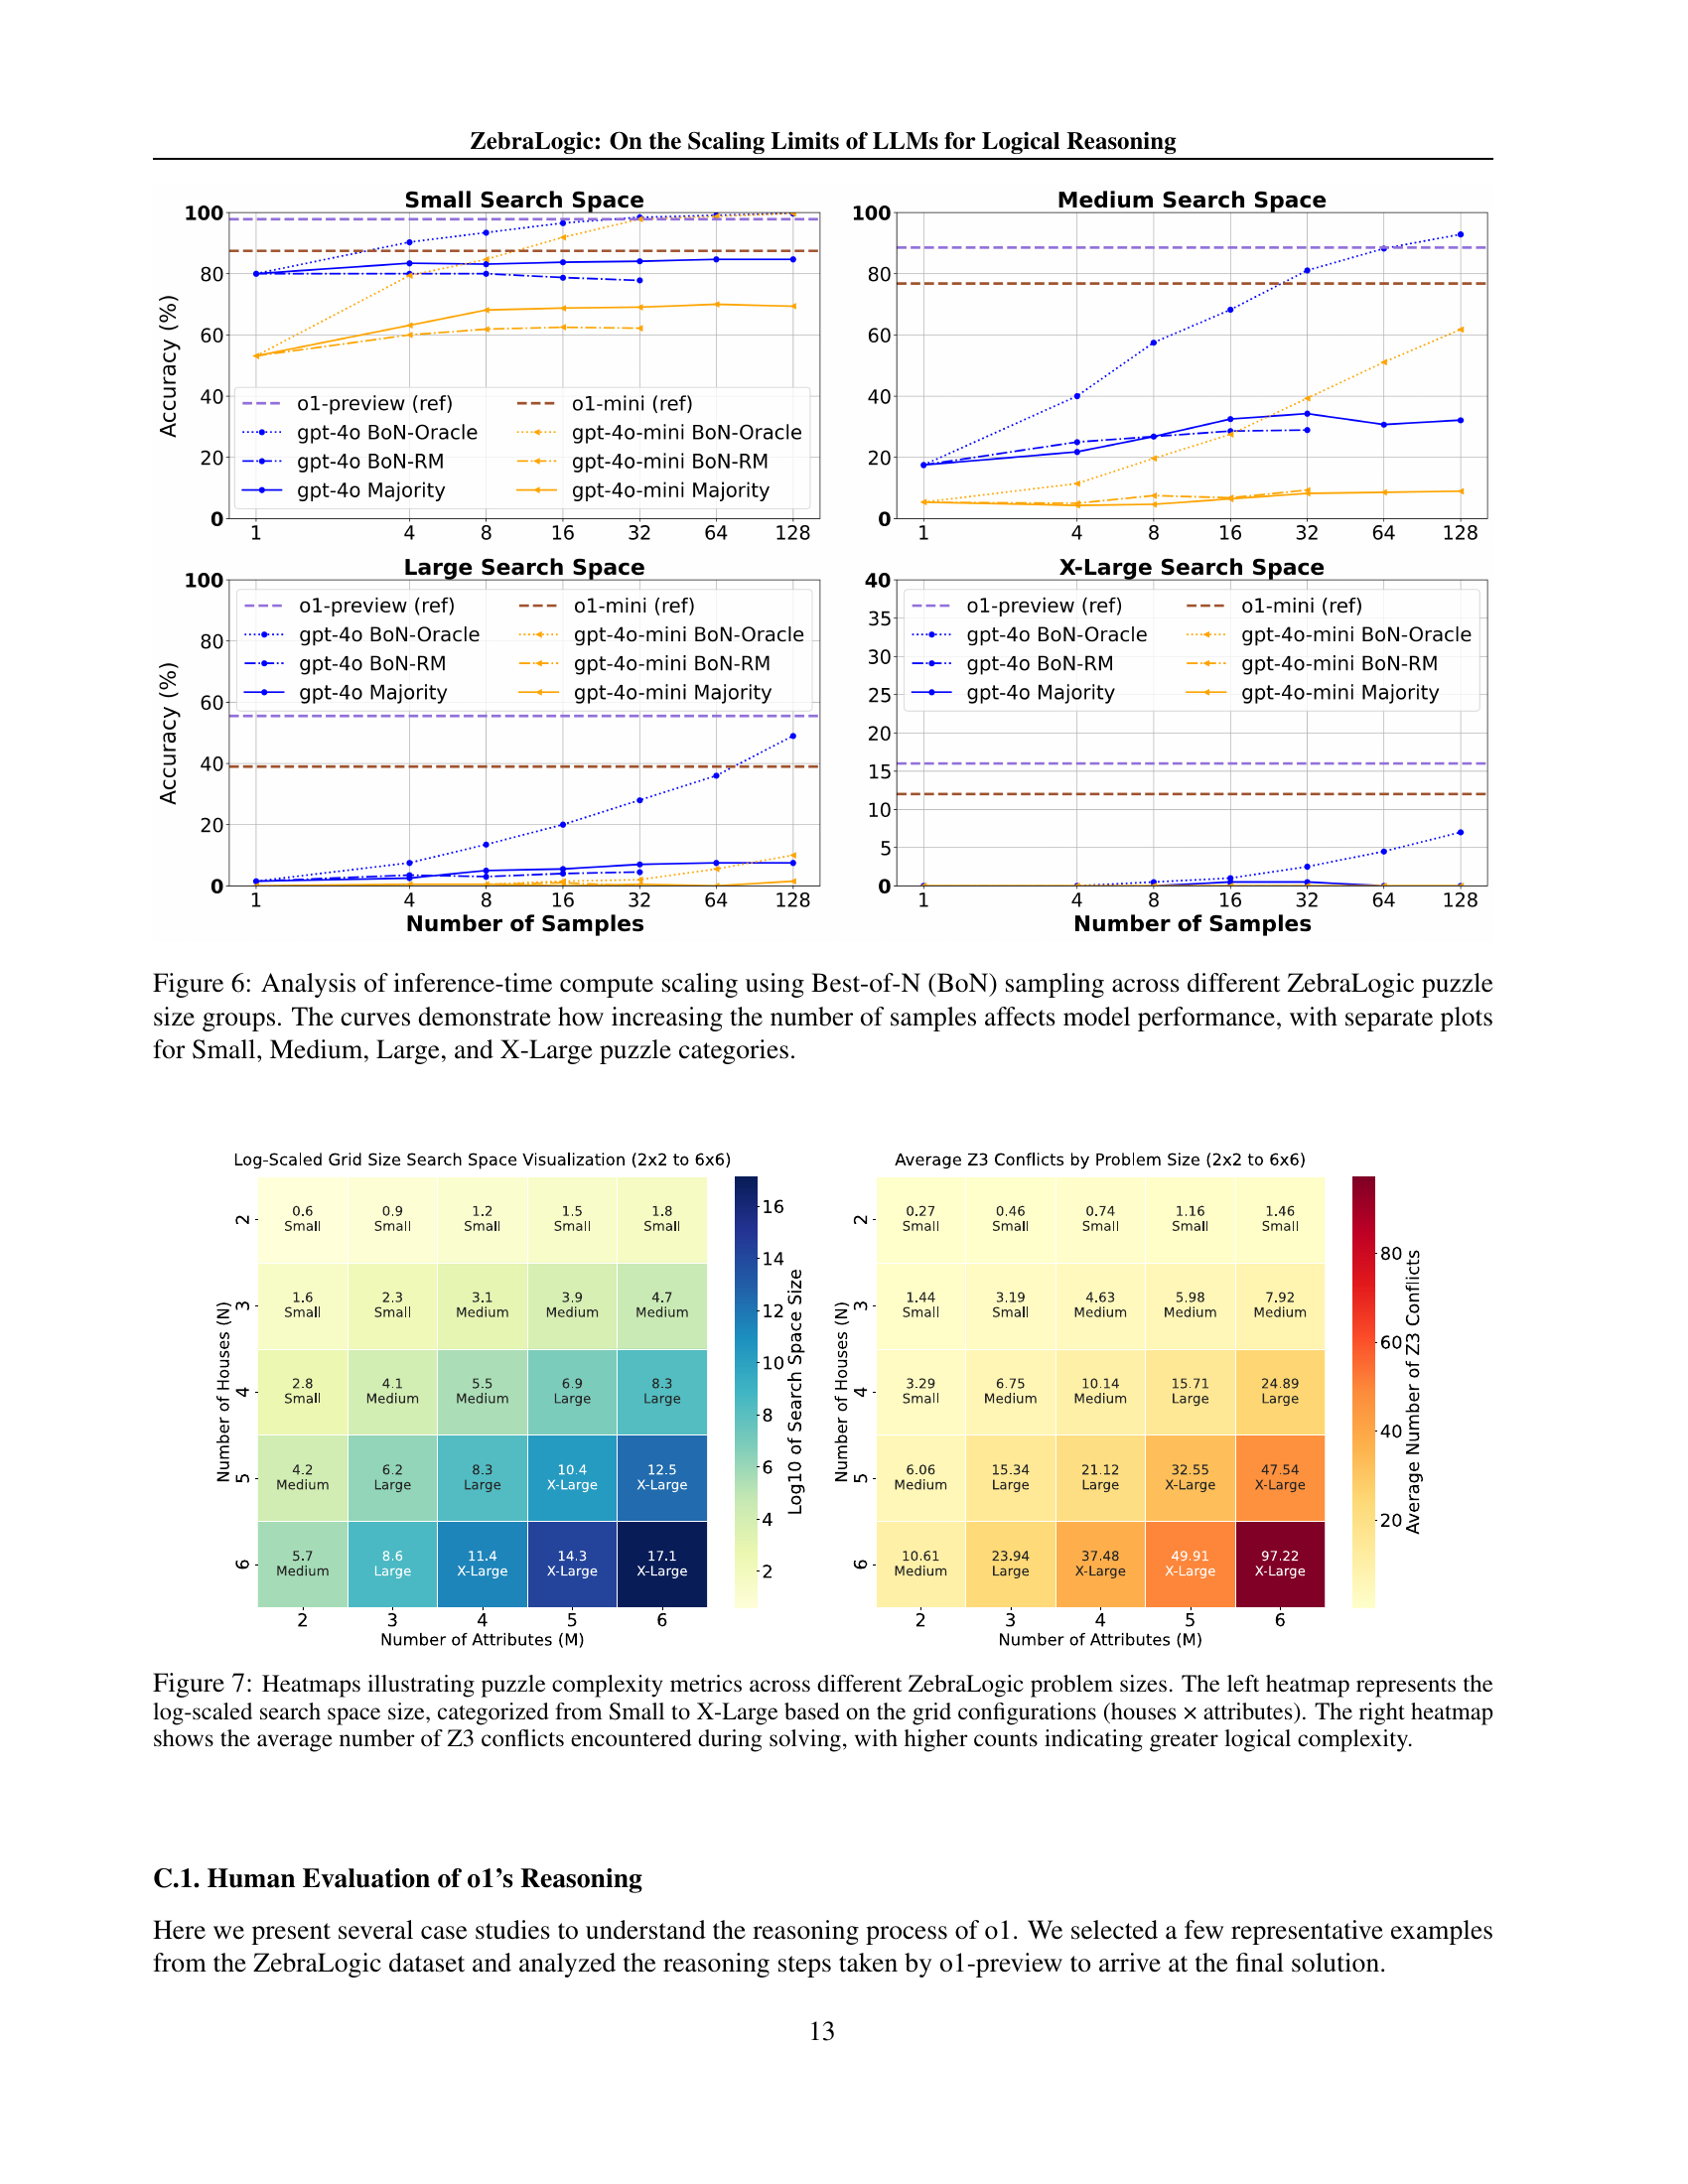
🔼 Figure 6 presents the results of an experiment evaluating the effect of increasing the number of samples on the performance of different LLMs when solving logic puzzles of varying complexity. The experiment used Best-of-N (BoN) sampling, where N candidate solutions were generated for each puzzle, and the best solution among those candidates was selected. The figure shows the accuracy of different models across four categories of puzzle sizes: Small, Medium, Large, and X-Large, each representing a different level of complexity. Separate plots are provided for each category, allowing for a detailed visualization of how the number of samples influences model performance across different complexity levels. The results demonstrate that increasing the number of samples can improve accuracy, but the extent of improvement varies depending on the model and the complexity of the puzzle.
read the caption
Figure 6: Analysis of inference-time compute scaling using Best-of-N (BoN) sampling across different ZebraLogic puzzle size groups. The curves demonstrate how increasing the number of samples affects model performance, with separate plots for Small, Medium, Large, and X-Large puzzle categories.

🔼 Figure 7 presents two heatmaps visualizing the complexity of ZebraLogic puzzles. The left heatmap displays the log-scaled size of the solution space for puzzles with varying numbers of houses and attributes. The solution space size is categorized into four levels: Small, Medium, Large, and X-Large, reflecting increasing difficulty. The right heatmap shows the average number of conflicts encountered by the Z3 SMT solver while solving each puzzle. A higher number of conflicts indicates a greater level of logical complexity and increased difficulty for LLMs to solve the puzzle.
read the caption
Figure 7: Heatmaps illustrating puzzle complexity metrics across different ZebraLogic problem sizes. The left heatmap represents the log-scaled search space size, categorized from Small to X-Large based on the grid configurations (houses × attributes). The right heatmap shows the average number of Z3 conflicts encountered during solving, with higher counts indicating greater logical complexity.
Full paper#