TL;DR#
Current AI methods for generating Scalable Vector Graphics (SVGs) often produce oversimplified or redundant results, failing to capture the layered structure and design logic of professional work. This limits their usability in design workflows that require detailed, editable vector graphics.
LayerTracer overcomes this limitation with a novel diffusion transformer-based framework. It learns from a new dataset of sequential design steps to generate layered raster blueprints. These blueprints are then converted into clean, editable SVGs using a layer-wise vectorization process. The results significantly outperform existing methods in terms of generation quality and editability. The framework also handles image-to-SVG conversion, using a conditional diffusion mechanism that encodes images to guide the hierarchical construction of layered SVGs.
Key Takeaways#
Why does it matter?#
This paper is crucial because it addresses a significant gap in AI-generated SVGs. Current methods struggle with creating layered, editable SVGs that match the quality and design logic of human-created works. LayerTracer’s novel approach, using diffusion transformers and a unique dataset, directly tackles this problem. This opens up new avenues for research in design AI and offers significant potential applications in UI/UX design, CAD, and other fields needing high-quality, editable vector graphics.
Visual Insights#

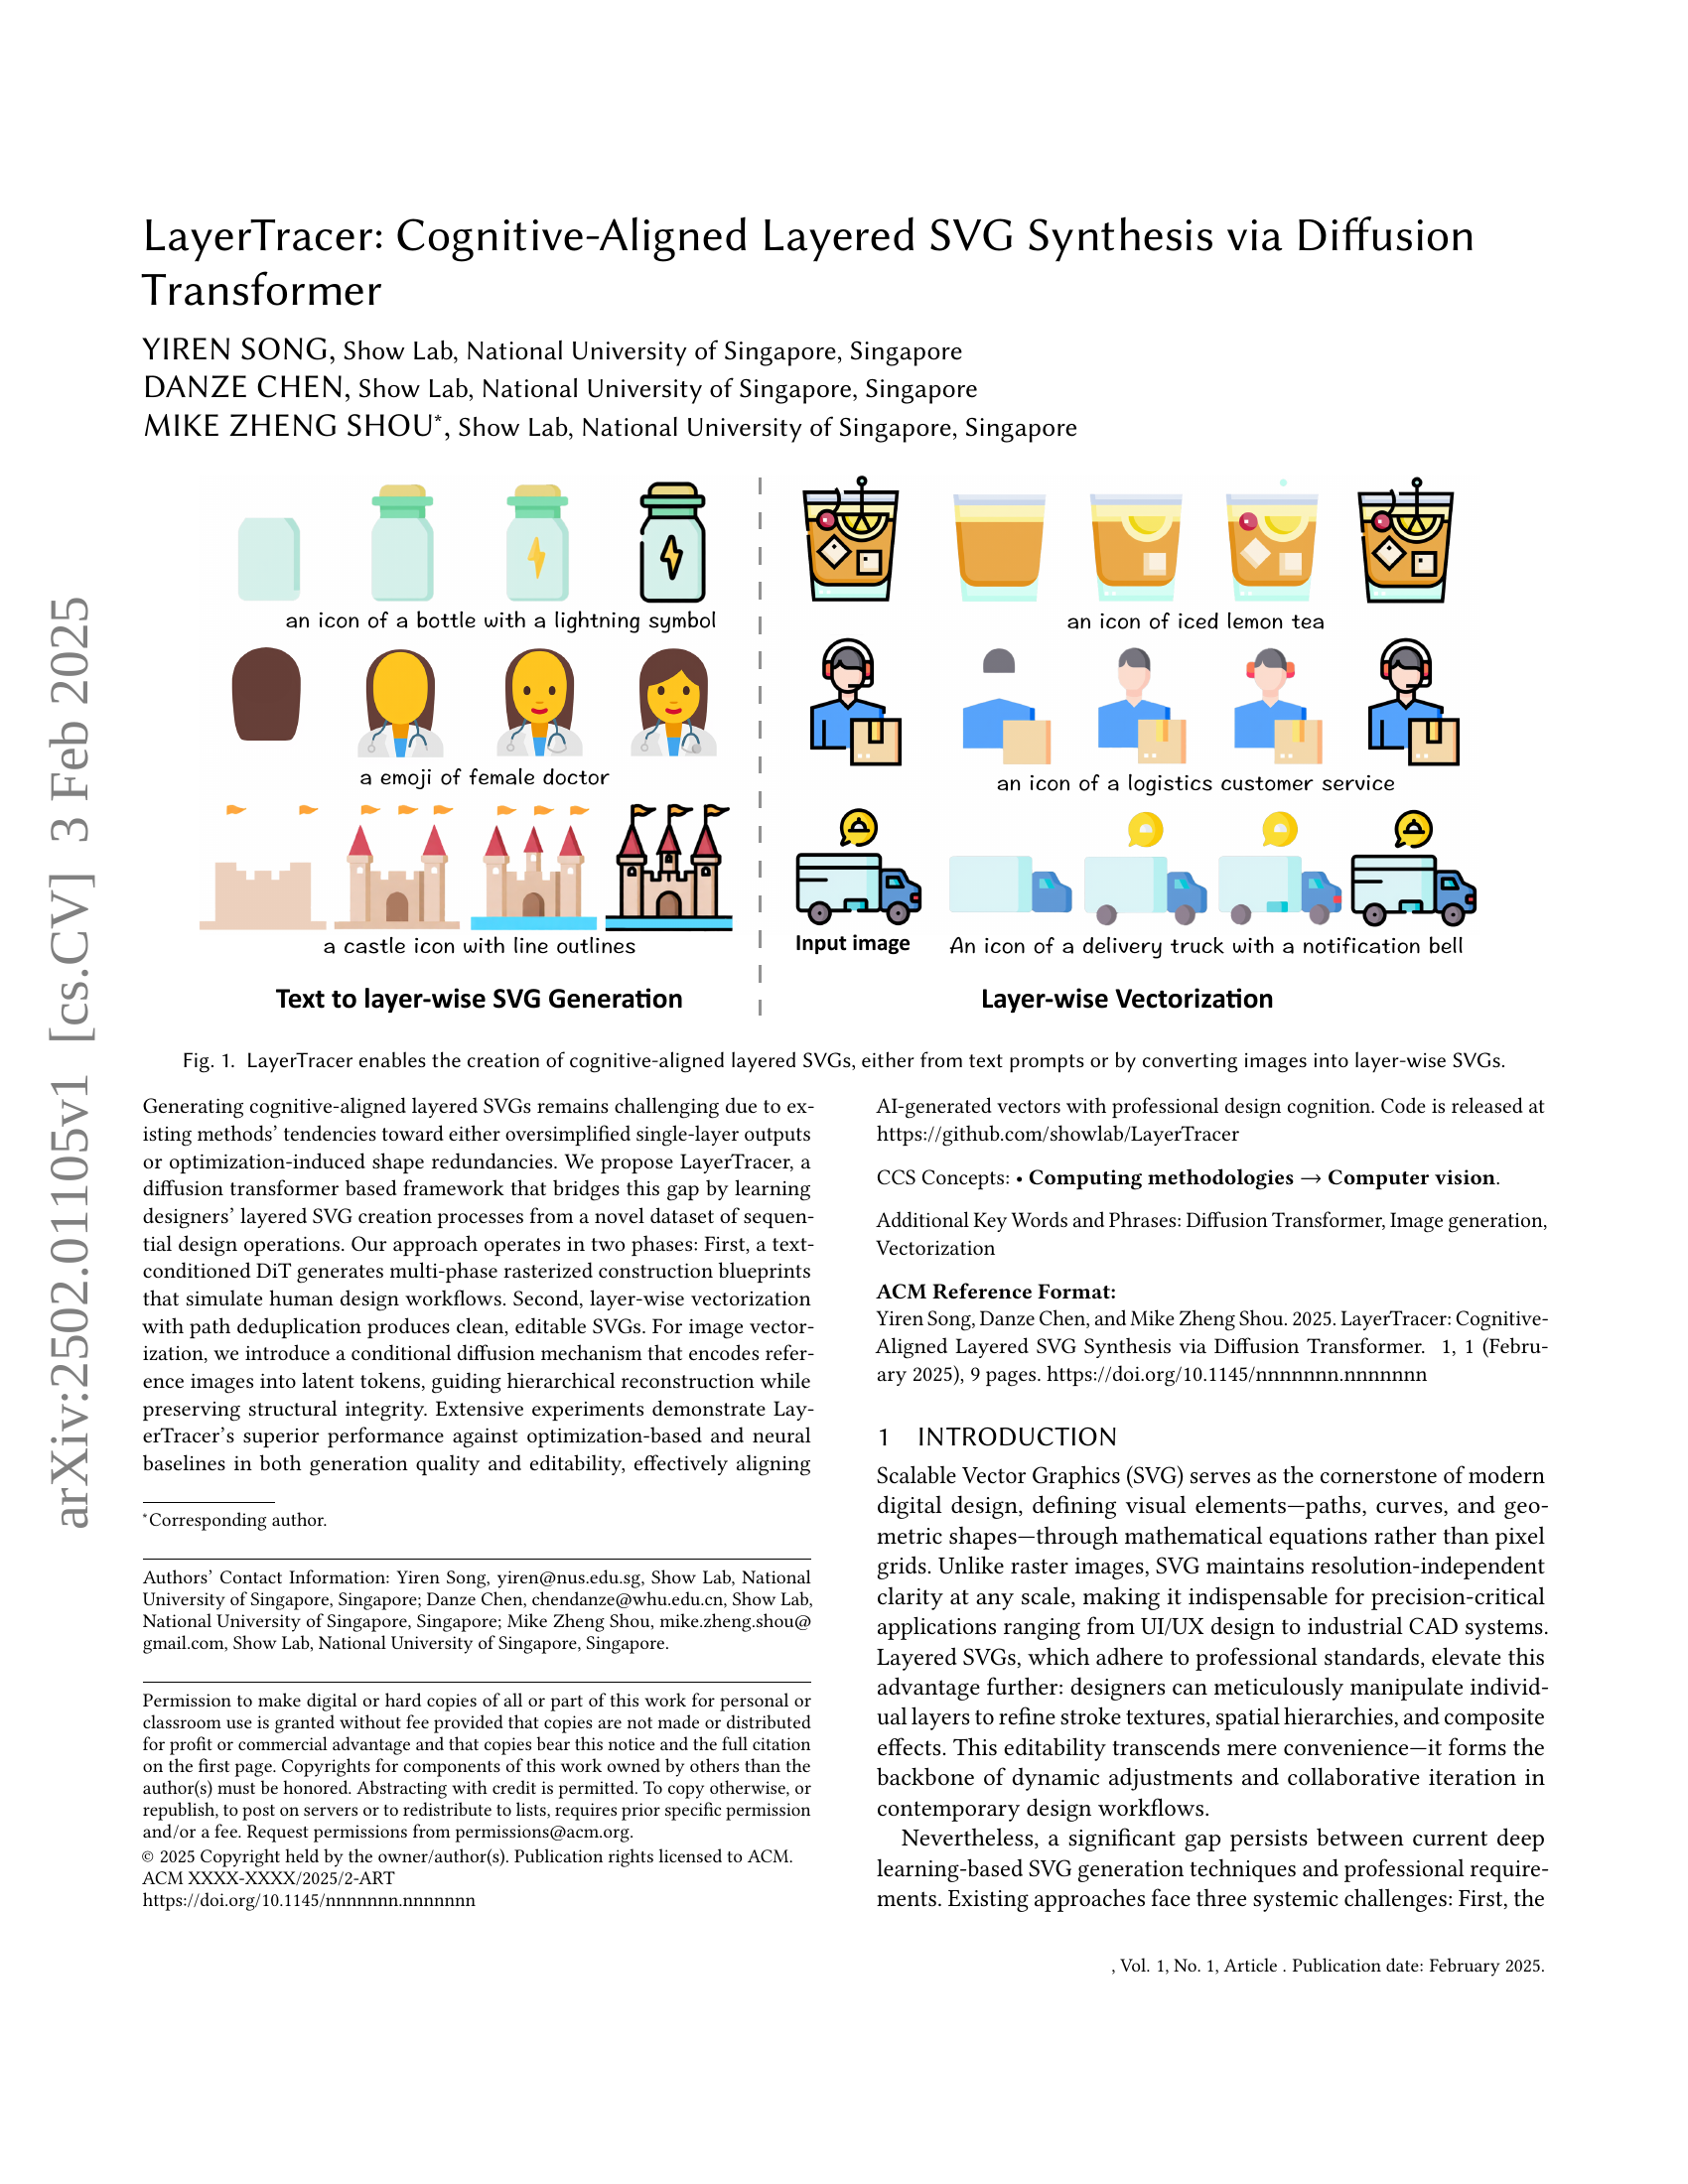
🔼 This figure demonstrates the core functionality of LayerTracer, a novel framework for generating layered Scalable Vector Graphics (SVGs). It shows two primary input methods: text prompts and input images. In both cases, the system produces a multi-layered SVG. The text prompt pathway simulates a designer’s cognitive process, generating a series of design steps that are then vectorized into a layered SVG. The image pathway converts a given image into a layered SVG, mimicking the process of tracing an image, while preserving structural integrity. The cognitive alignment aspect implies the generated layered SVGs retain the logical structure and hierarchical organization typically found in professionally-designed SVGs, making them more editable and intuitive for designers.
read the caption
Figure 1. LayerTracer enables the creation of cognitive-aligned layered SVGs, either from text prompts or by converting images into layer-wise SVGs.
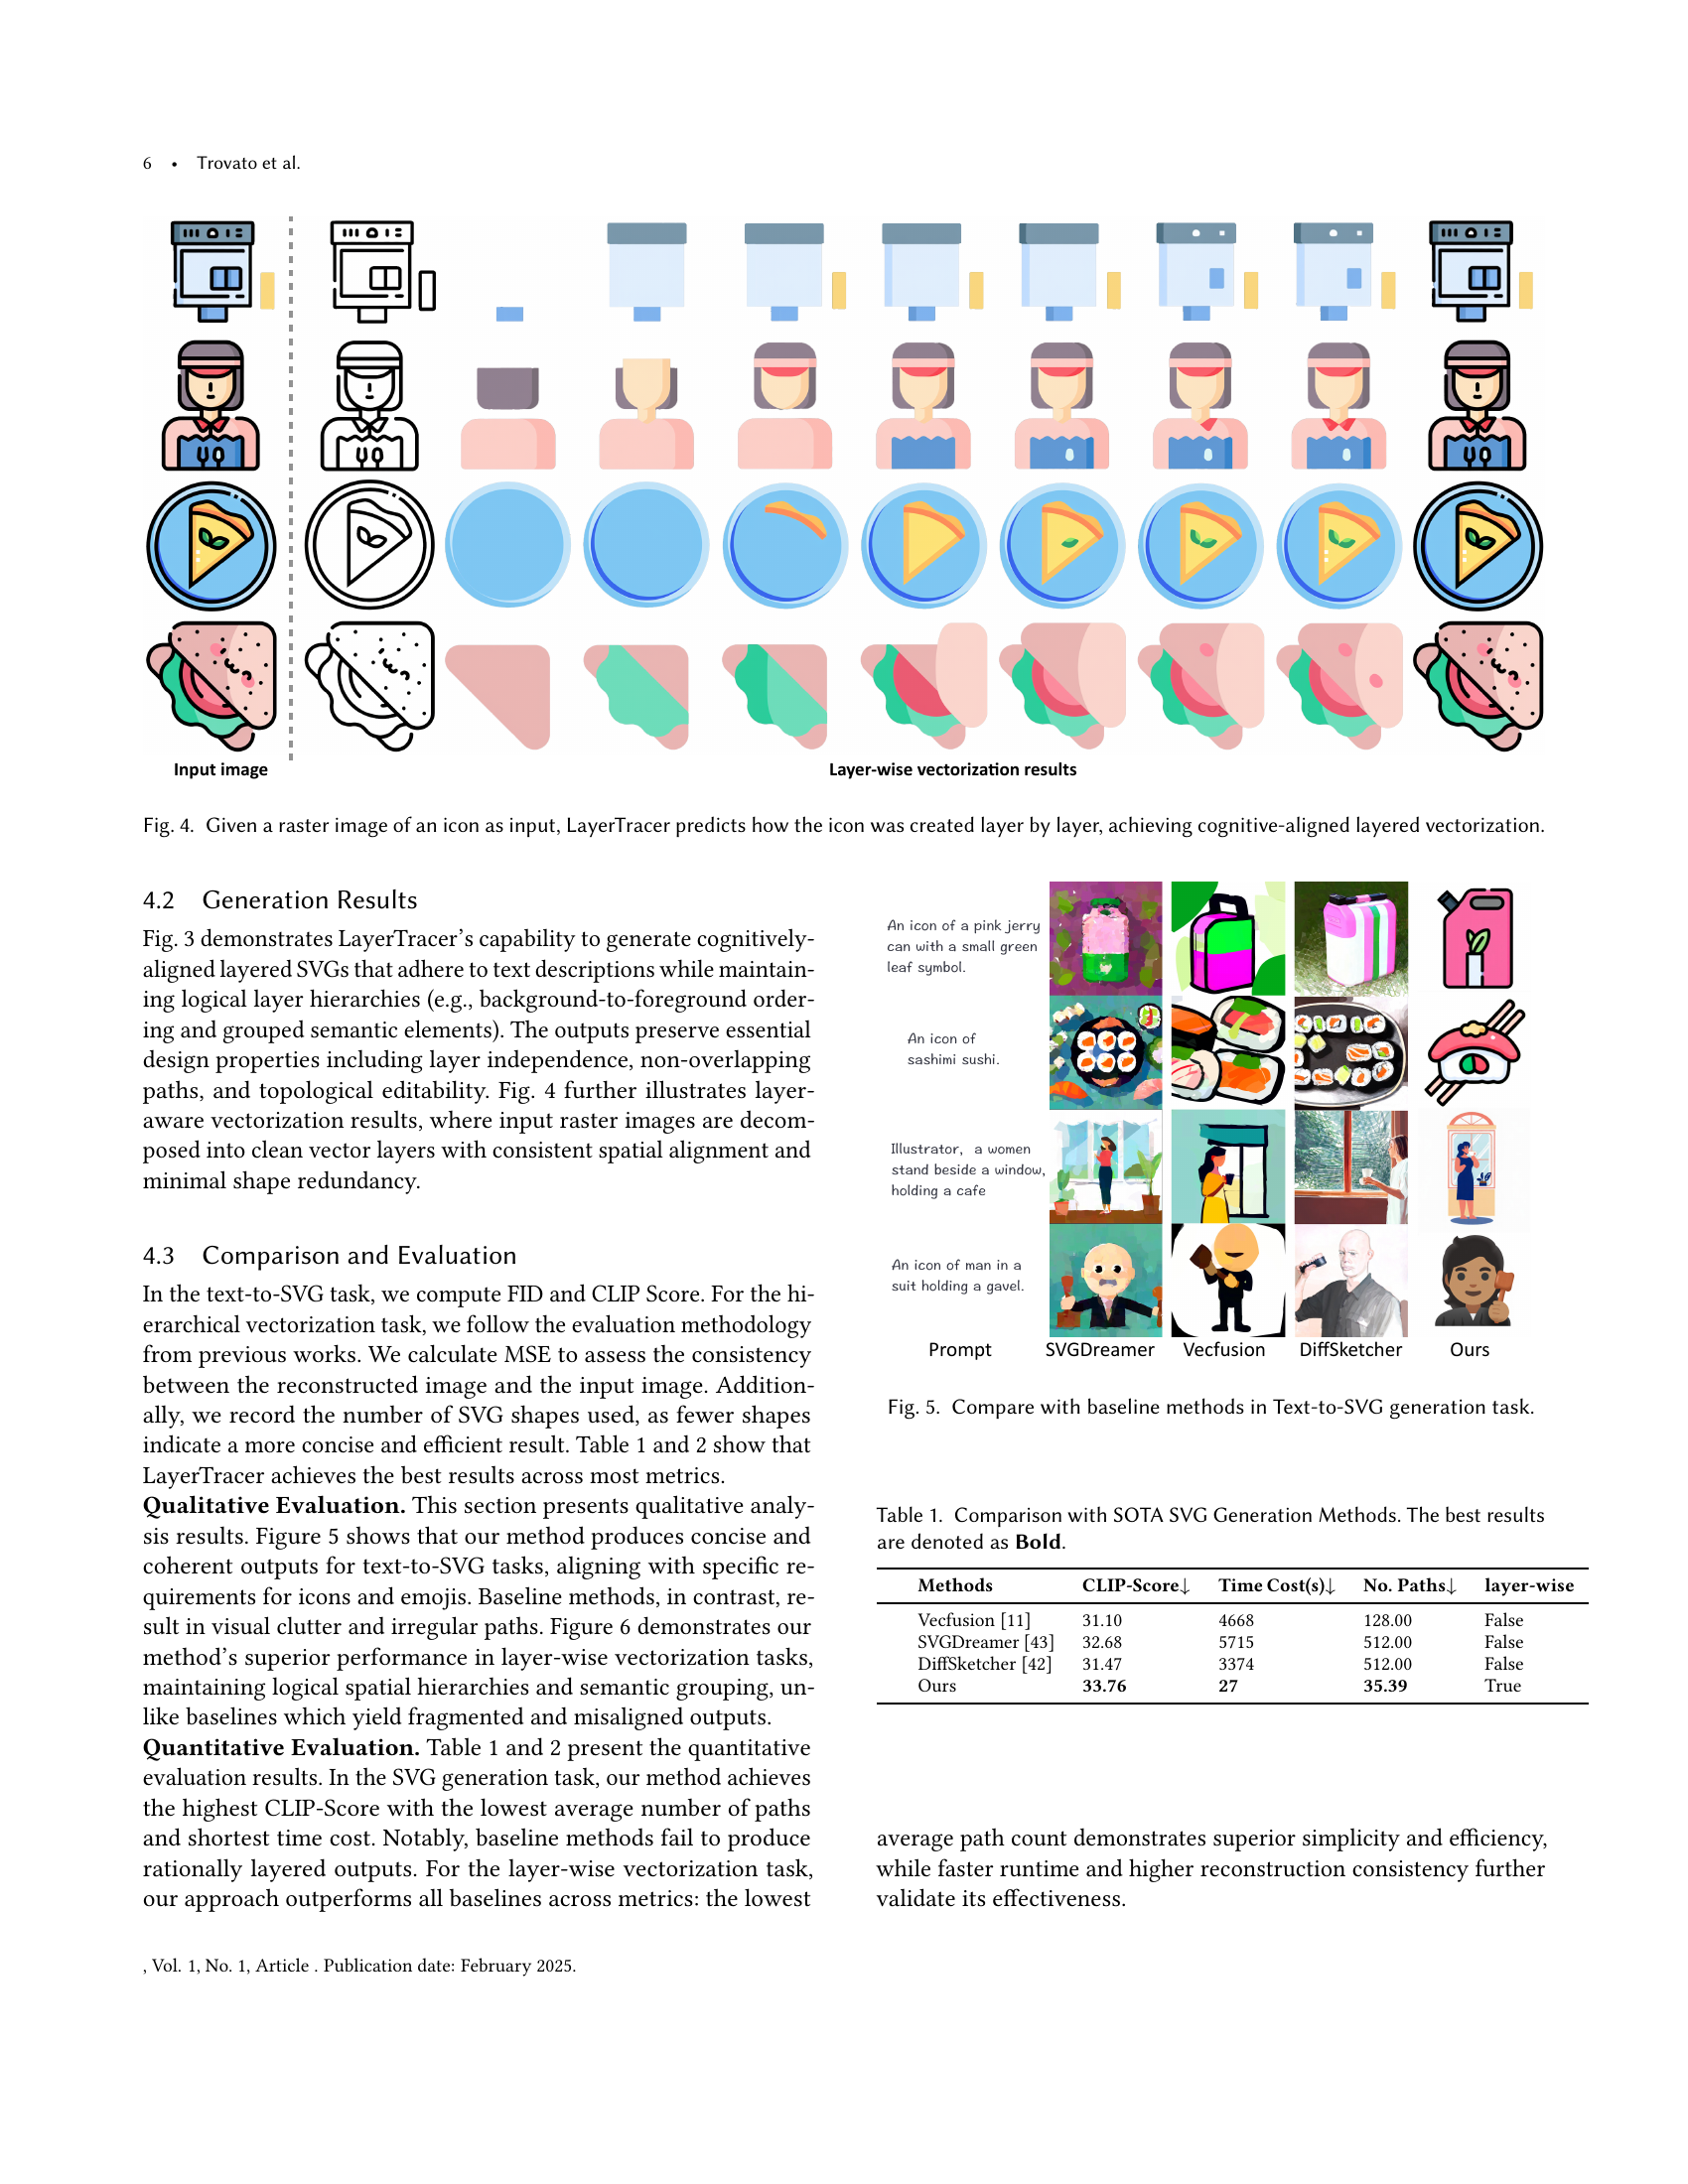
| Methods | CLIP-Score↓ | Time Cost(s)↓ | No. Paths↓ | layer-wise |
|---|---|---|---|---|
| Vecfusion (Jain et al., 2023) | 31.10 | 4668 | 128.00 | False |
| SVGDreamer (Xing et al., 2024b) | 32.68 | 5715 | 512.00 | False |
| DiffSketcher (Xing et al., 2023) | 31.47 | 3374 | 512.00 | False |
| Ours | 33.76 | 27 | 35.39 | True |
🔼 Table 1 presents a quantitative comparison of LayerTracer’s performance against state-of-the-art (SOTA) methods for text-to-SVG generation. It assesses methods across several key metrics: CLIP Score (lower is better, indicating higher quality alignment with the prompt), generation time, the number of paths in the generated SVG (lower is better, indicating simpler and more efficient vector graphics), and a boolean indicator showing whether the generated SVG successfully adheres to a layered structure. The results highlight LayerTracer’s superior performance in generating high-quality, layered SVGs efficiently.
read the caption
Table 1. Comparison with SOTA SVG Generation Methods. The best results are denoted as Bold.
In-depth insights#
Cognitive SVG Synthesis#
Cognitive SVG synthesis represents a significant advancement in AI-driven design, moving beyond simple image generation to emulate the human cognitive process of layered design. This approach focuses on generating not just visually appealing SVGs, but also editable and structurally coherent ones that mirror how a human designer would create them. The key innovation is in modeling the sequential steps of a designer’s workflow, capturing the logical ordering of layers and the spatial reasoning behind element placement. This layered approach is crucial for achieving high-quality results that are easily editable and maintain professional design standards. The integration of diffusion transformers with vectorization techniques further refines this process, enabling both text-to-SVG and image-to-SVG conversions with high fidelity. A key challenge, and one that this research addresses, is the limited availability of large-scale layered SVG datasets; the creation of such datasets is a major contribution in itself. Overall, cognitive SVG synthesis offers the potential for highly automated and intuitive design tools with applications across various fields, from web design to industrial CAD.
Diffusion Transformer#
The concept of a ‘Diffusion Transformer’ in the context of this research paper likely refers to a novel architecture that combines the strengths of diffusion models and transformer networks. Diffusion models excel at generating high-quality, diverse samples from complex data distributions, while transformer networks are adept at capturing long-range dependencies and contextual information within sequential data. By integrating these two powerful paradigms, a Diffusion Transformer likely aims to generate intricate, layered Scalable Vector Graphics (SVGs) that reflect the cognitive processes of human designers. This is achieved by leveraging the diffusion model’s ability to generate plausible design sequences and using the transformer to model the sequential nature of the design process. The model likely learns the intricate relationships between design elements, their spatial arrangement and the temporal order of creation, resulting in high-quality and easily editable vector graphics.
Layered Vectorization#
The concept of ‘Layered Vectorization’ in the context of SVG synthesis is crucial for generating high-quality, editable graphics. It suggests a process that moves beyond simply converting raster images to vector formats. Instead, it prioritizes the reconstruction of the design process itself, mimicking how a human designer would build up an image layer by layer. This layered approach is essential for achieving the cognitive alignment the authors aim for, as it captures the logical sequencing and spatial reasoning inherent in human design workflows. The key advantage lies in the resulting editability of the generated SVGs. Each layer represents a distinct step in the design, allowing for granular control and modification without compromising the structural integrity of the overall image. This is in contrast to methods that produce a single, monolithic vector representation, where editing often leads to unintended distortions and artefacts. The challenges in implementing layered vectorization include accurately identifying and separating distinct layers from source images (raster or text descriptions) and efficiently converting these layers into optimized vector paths. The success of such a method would significantly advance the field of AI-driven design, bridging the gap between automated generation and the sophistication of human-created vector graphics. Therefore, a successful layered vectorization system needs to balance accuracy, efficiency, and the preservation of layered structure for optimal results.
Serpentine Dataset#
The “Serpentine Dataset” section reveals a novel approach to structuring data for training a diffusion model to generate layered SVGs. Instead of simply presenting individual SVGs, the dataset captures the sequential design process, organizing the steps of creation into a grid-like structure. This “serpentine” layout strategically places temporally adjacent design steps spatially close to one another, leveraging the diffusion model’s inherent bias toward local correlations. This design choice is crucial for ensuring spatiotemporal consistency in the generated SVG layers, promoting coherence and preventing fragmented results. The use of a 3x3 or 2x2 grid further enhances the model’s ability to grasp hierarchical relationships within the SVG, effectively mirroring a designer’s cognitive workflow. The dataset’s design is not only innovative but also directly addresses the challenges of limited, high-quality layered SVG datasets, ultimately facilitating better learning and improved generation quality.
Future of SVG#
The future of SVG hinges on bridging the gap between AI-generated and professionally designed graphics. Current deep learning models struggle with the nuanced hierarchical structures and cognitive processes inherent in layered SVGs. Future research should focus on creating larger, higher-quality datasets of layered SVGs that capture the design process itself, potentially using a combination of human-in-the-loop methods and automated data generation techniques. Furthermore, advancements in diffusion models and transformers will be crucial for generating more sophisticated and editable SVGs. Improving the accuracy and efficiency of vectorization techniques from raster images will also be vital for enabling seamless image-to-SVG conversion. Ultimately, the ideal future SVG ecosystem would seamlessly integrate AI-assisted tools for both generation and manipulation, empowering designers to create highly detailed and complex graphics with greater ease and speed.
More visual insights#
More on figures

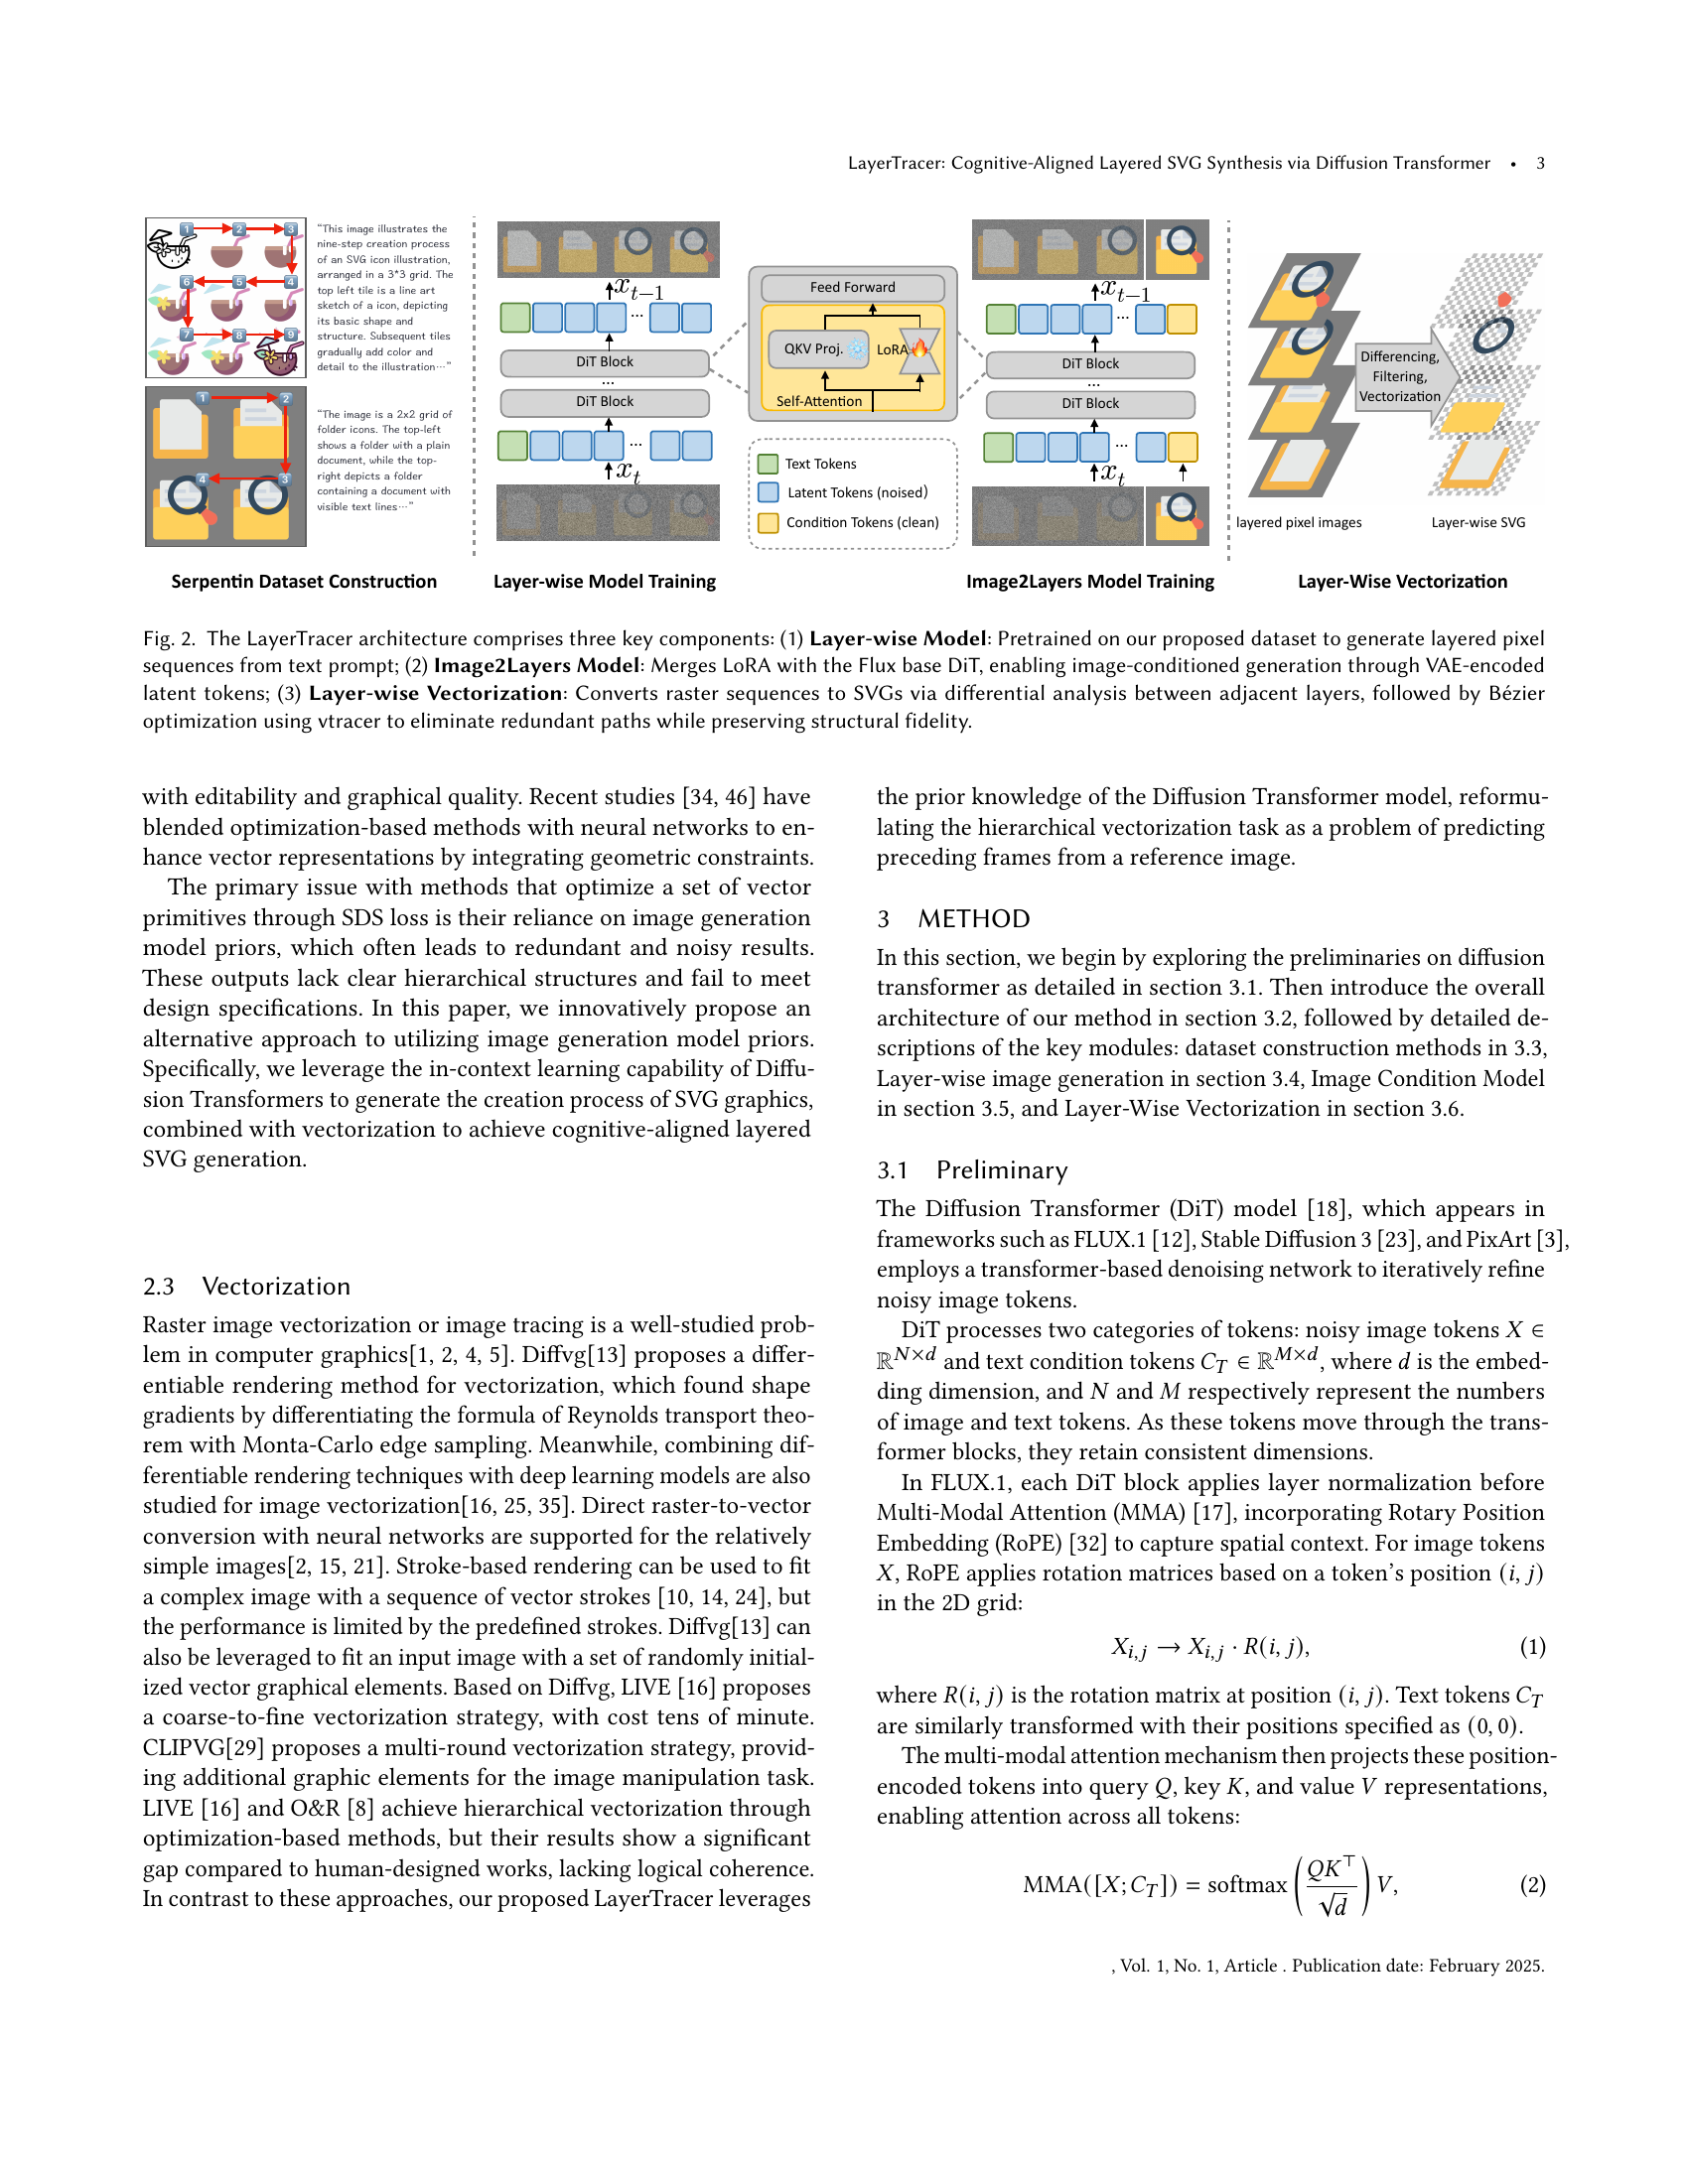
🔼 LayerTracer’s architecture consists of three main components. The first is the Layer-wise Model, a diffusion transformer pretrained on a novel dataset of sequentially generated layered SVGs. This model takes text prompts as input and outputs a sequence of layered raster images, simulating the steps a designer might take to create an SVG. The second is the Image2Layers Model, which uses a pre-trained diffusion transformer combined with Low-Rank Adaptation (LoRA) and a Variational Autoencoder (VAE). This model takes a raster image as input, encodes it into latent tokens using the VAE, and then leverages the LoRA fine-tuning to generate a sequence of layered raster images that mimic how a designer might have created the input image. Finally, the third component is Layer-wise Vectorization, which processes the raster image sequences generated by the previous two components. Using differential analysis, this component identifies changes between consecutive layers, converting the raster images to clean, editable SVG vector graphics. Bézier optimization with vtracer removes redundant paths, ensuring structural fidelity and professional quality.
read the caption
Figure 2. The LayerTracer architecture comprises three key components: (1) Layer-wise Model: Pretrained on our proposed dataset to generate layered pixel sequences from text prompt; (2) Image2Layers Model: Merges LoRA with the Flux base DiT, enabling image-conditioned generation through VAE-encoded latent tokens; (3) Layer-wise Vectorization: Converts raster sequences to SVGs via differential analysis between adjacent layers, followed by Bézier optimization using vtracer to eliminate redundant paths while preserving structural fidelity.

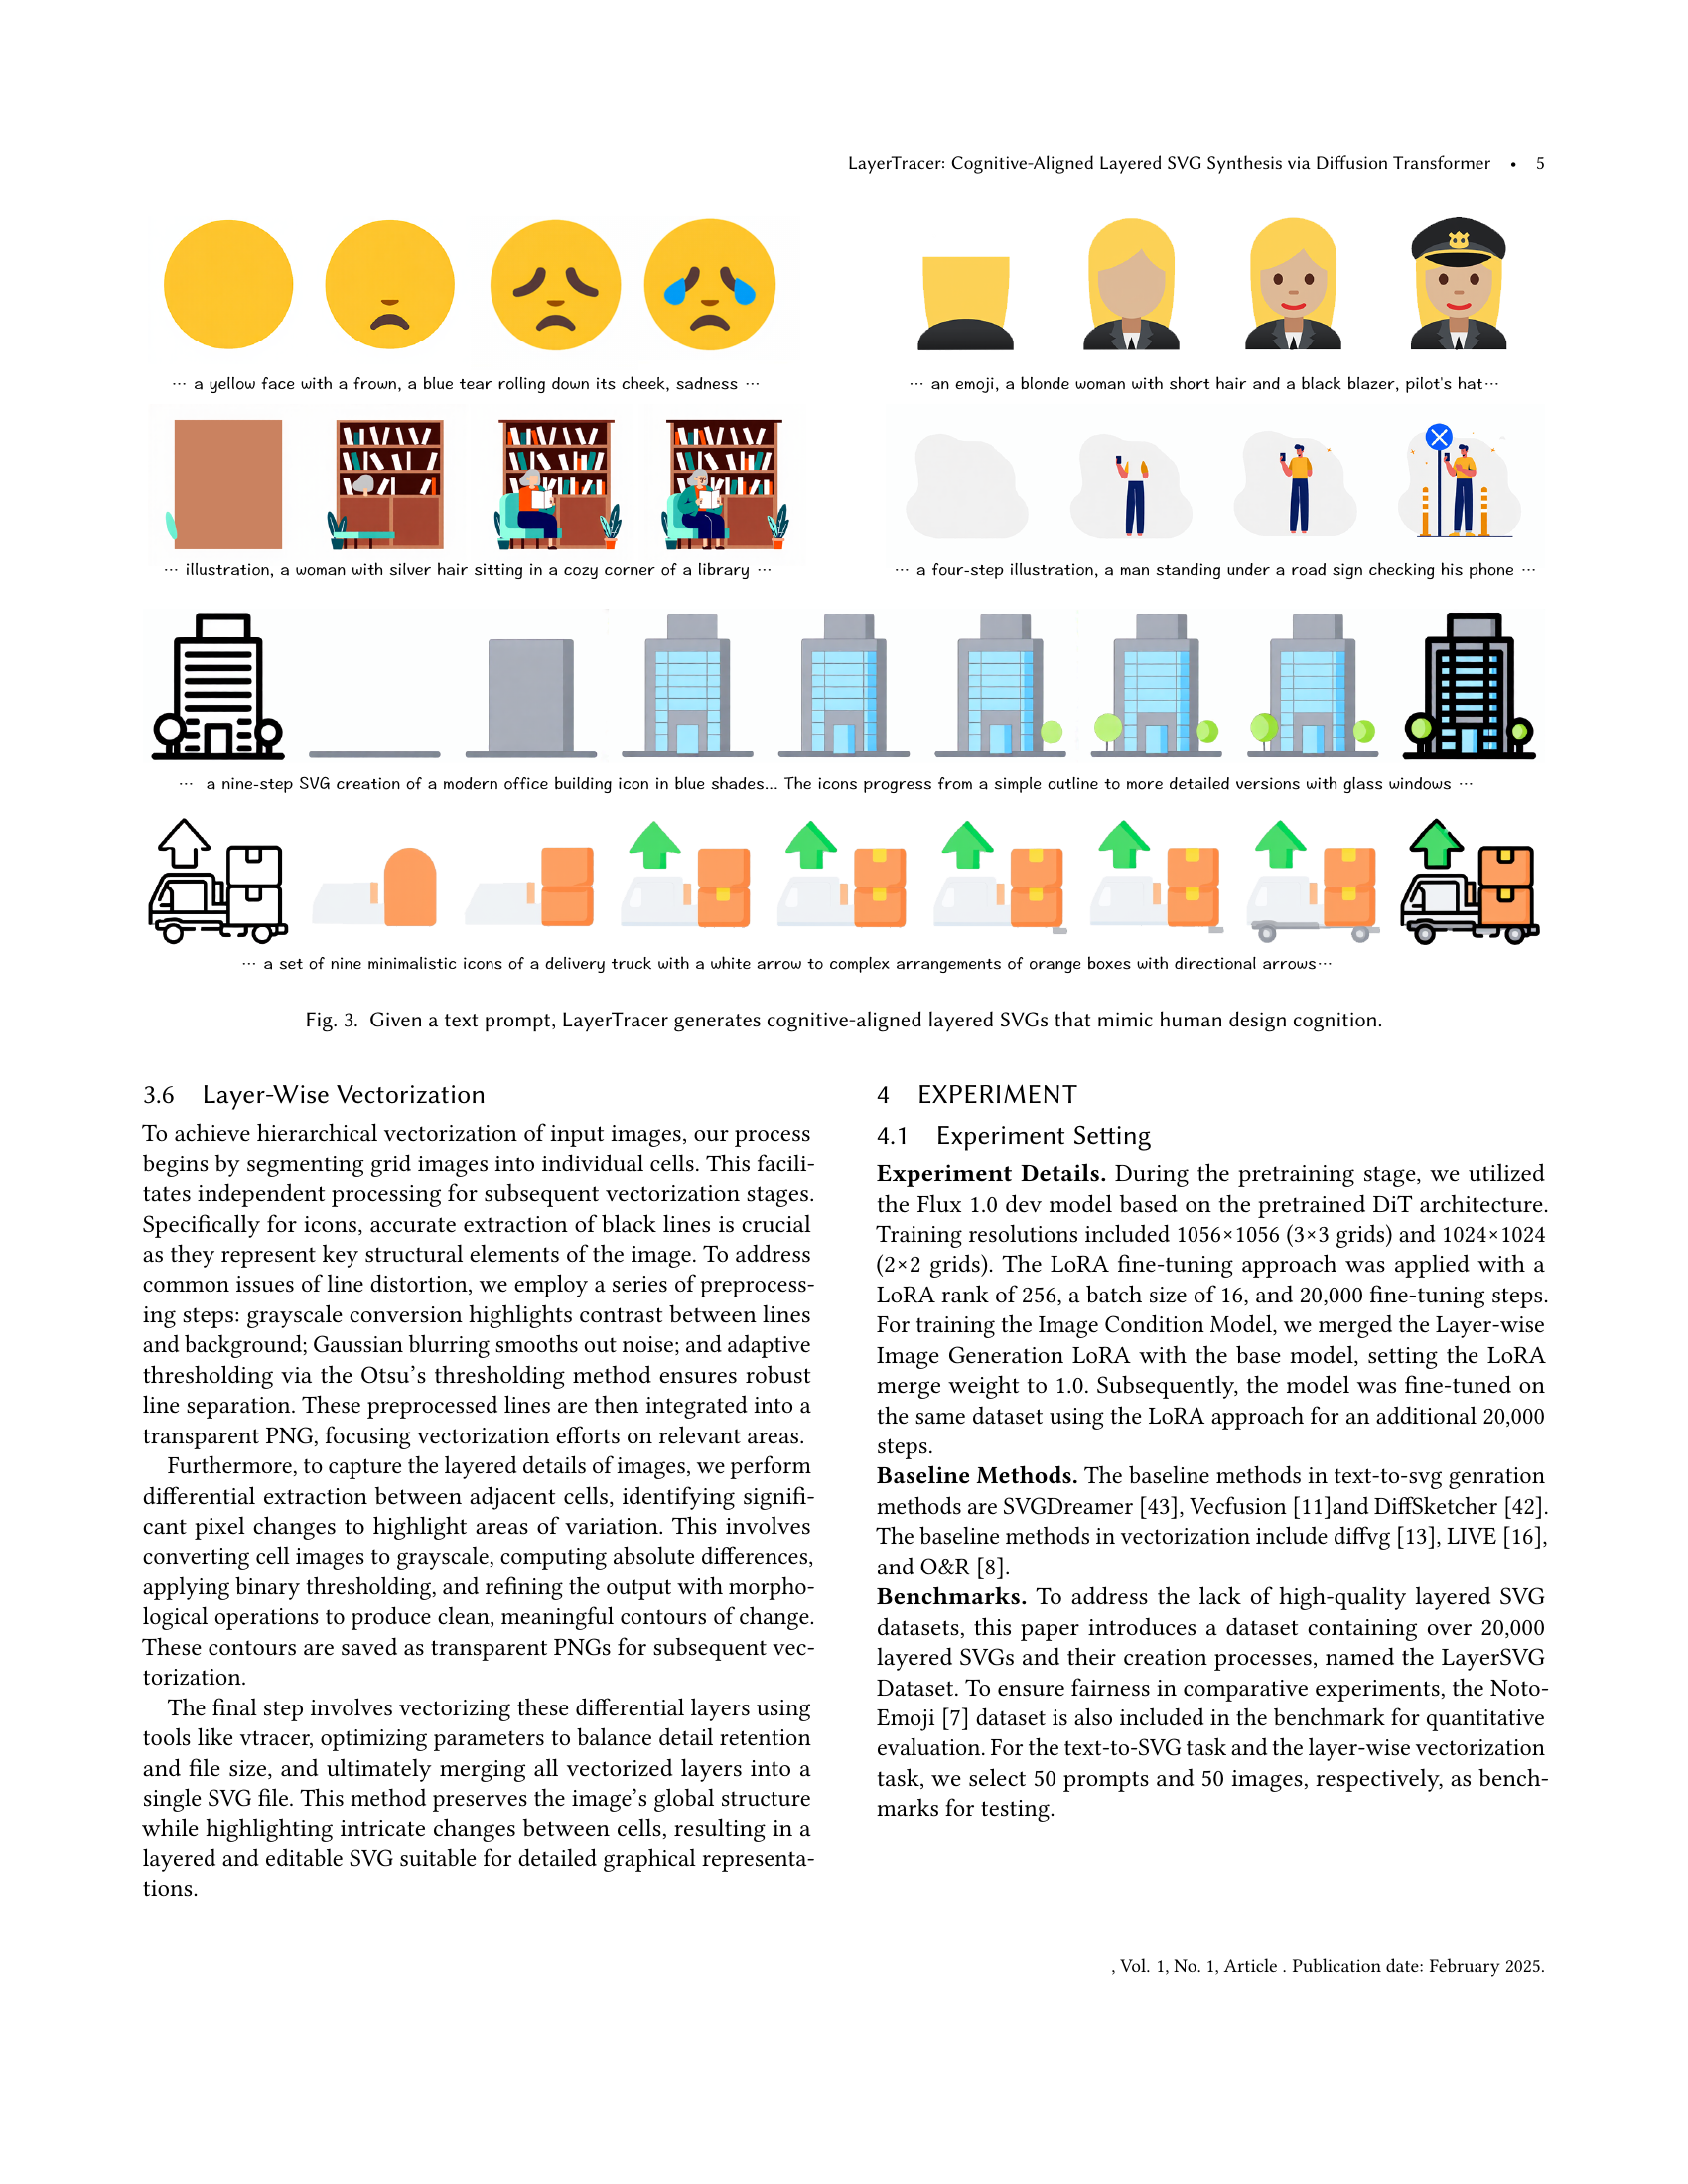
🔼 This figure showcases the LayerTracer model’s ability to generate layered SVGs from text prompts. The examples illustrate the model’s capacity to produce complex, multi-layered designs that closely resemble the way a human designer would approach the task, following a logical sequence and spatial reasoning. Each image demonstrates a sequence of SVG generation steps, starting from basic shapes and gradually adding details, mirroring the iterative process of human design. The cognitive alignment is emphasized by the structured, layered output, highlighting LayerTracer’s ability to model the human design cognition.
read the caption
Figure 3. Given a text prompt, LayerTracer generates cognitive-aligned layered SVGs that mimic human design cognition.

🔼 Figure 4 presents an example of LayerTracer’s image-to-layered-SVG conversion. A raster image (a simple icon) is provided as input. LayerTracer analyzes the image and infers the likely step-by-step process a human designer would have followed to create it. The output isn’t just a single vectorized version of the input; it is a series of layered SVGs, each representing a stage in the construction. This layered output mimics the way a designer builds complexity, with each layer adding detail or refinement, demonstrating the model’s understanding of cognitive design processes. The final result shows how LayerTracer breaks down the complex image into its constituent layers, reflecting a logical and editable SVG.
read the caption
Figure 4. Given a raster image of an icon as input, LayerTracer predicts how the icon was created layer by layer, achieving cognitive-aligned layered vectorization.
🔼 This figure compares the performance of LayerTracer against three baseline methods (SVGDreamer, Vecfusion, and DiffSketcher) in generating SVGs from text prompts. It visually showcases the outputs generated by each method for a set of example prompts, highlighting LayerTracer’s ability to produce more coherent and less cluttered SVGs compared to the baselines. The prompts focus on iconic illustrations, demonstrating the models’ ability to generate meaningful and editable vector graphics from text.
read the caption
Figure 5. Compare with baseline methods in Text-to-SVG generation task.

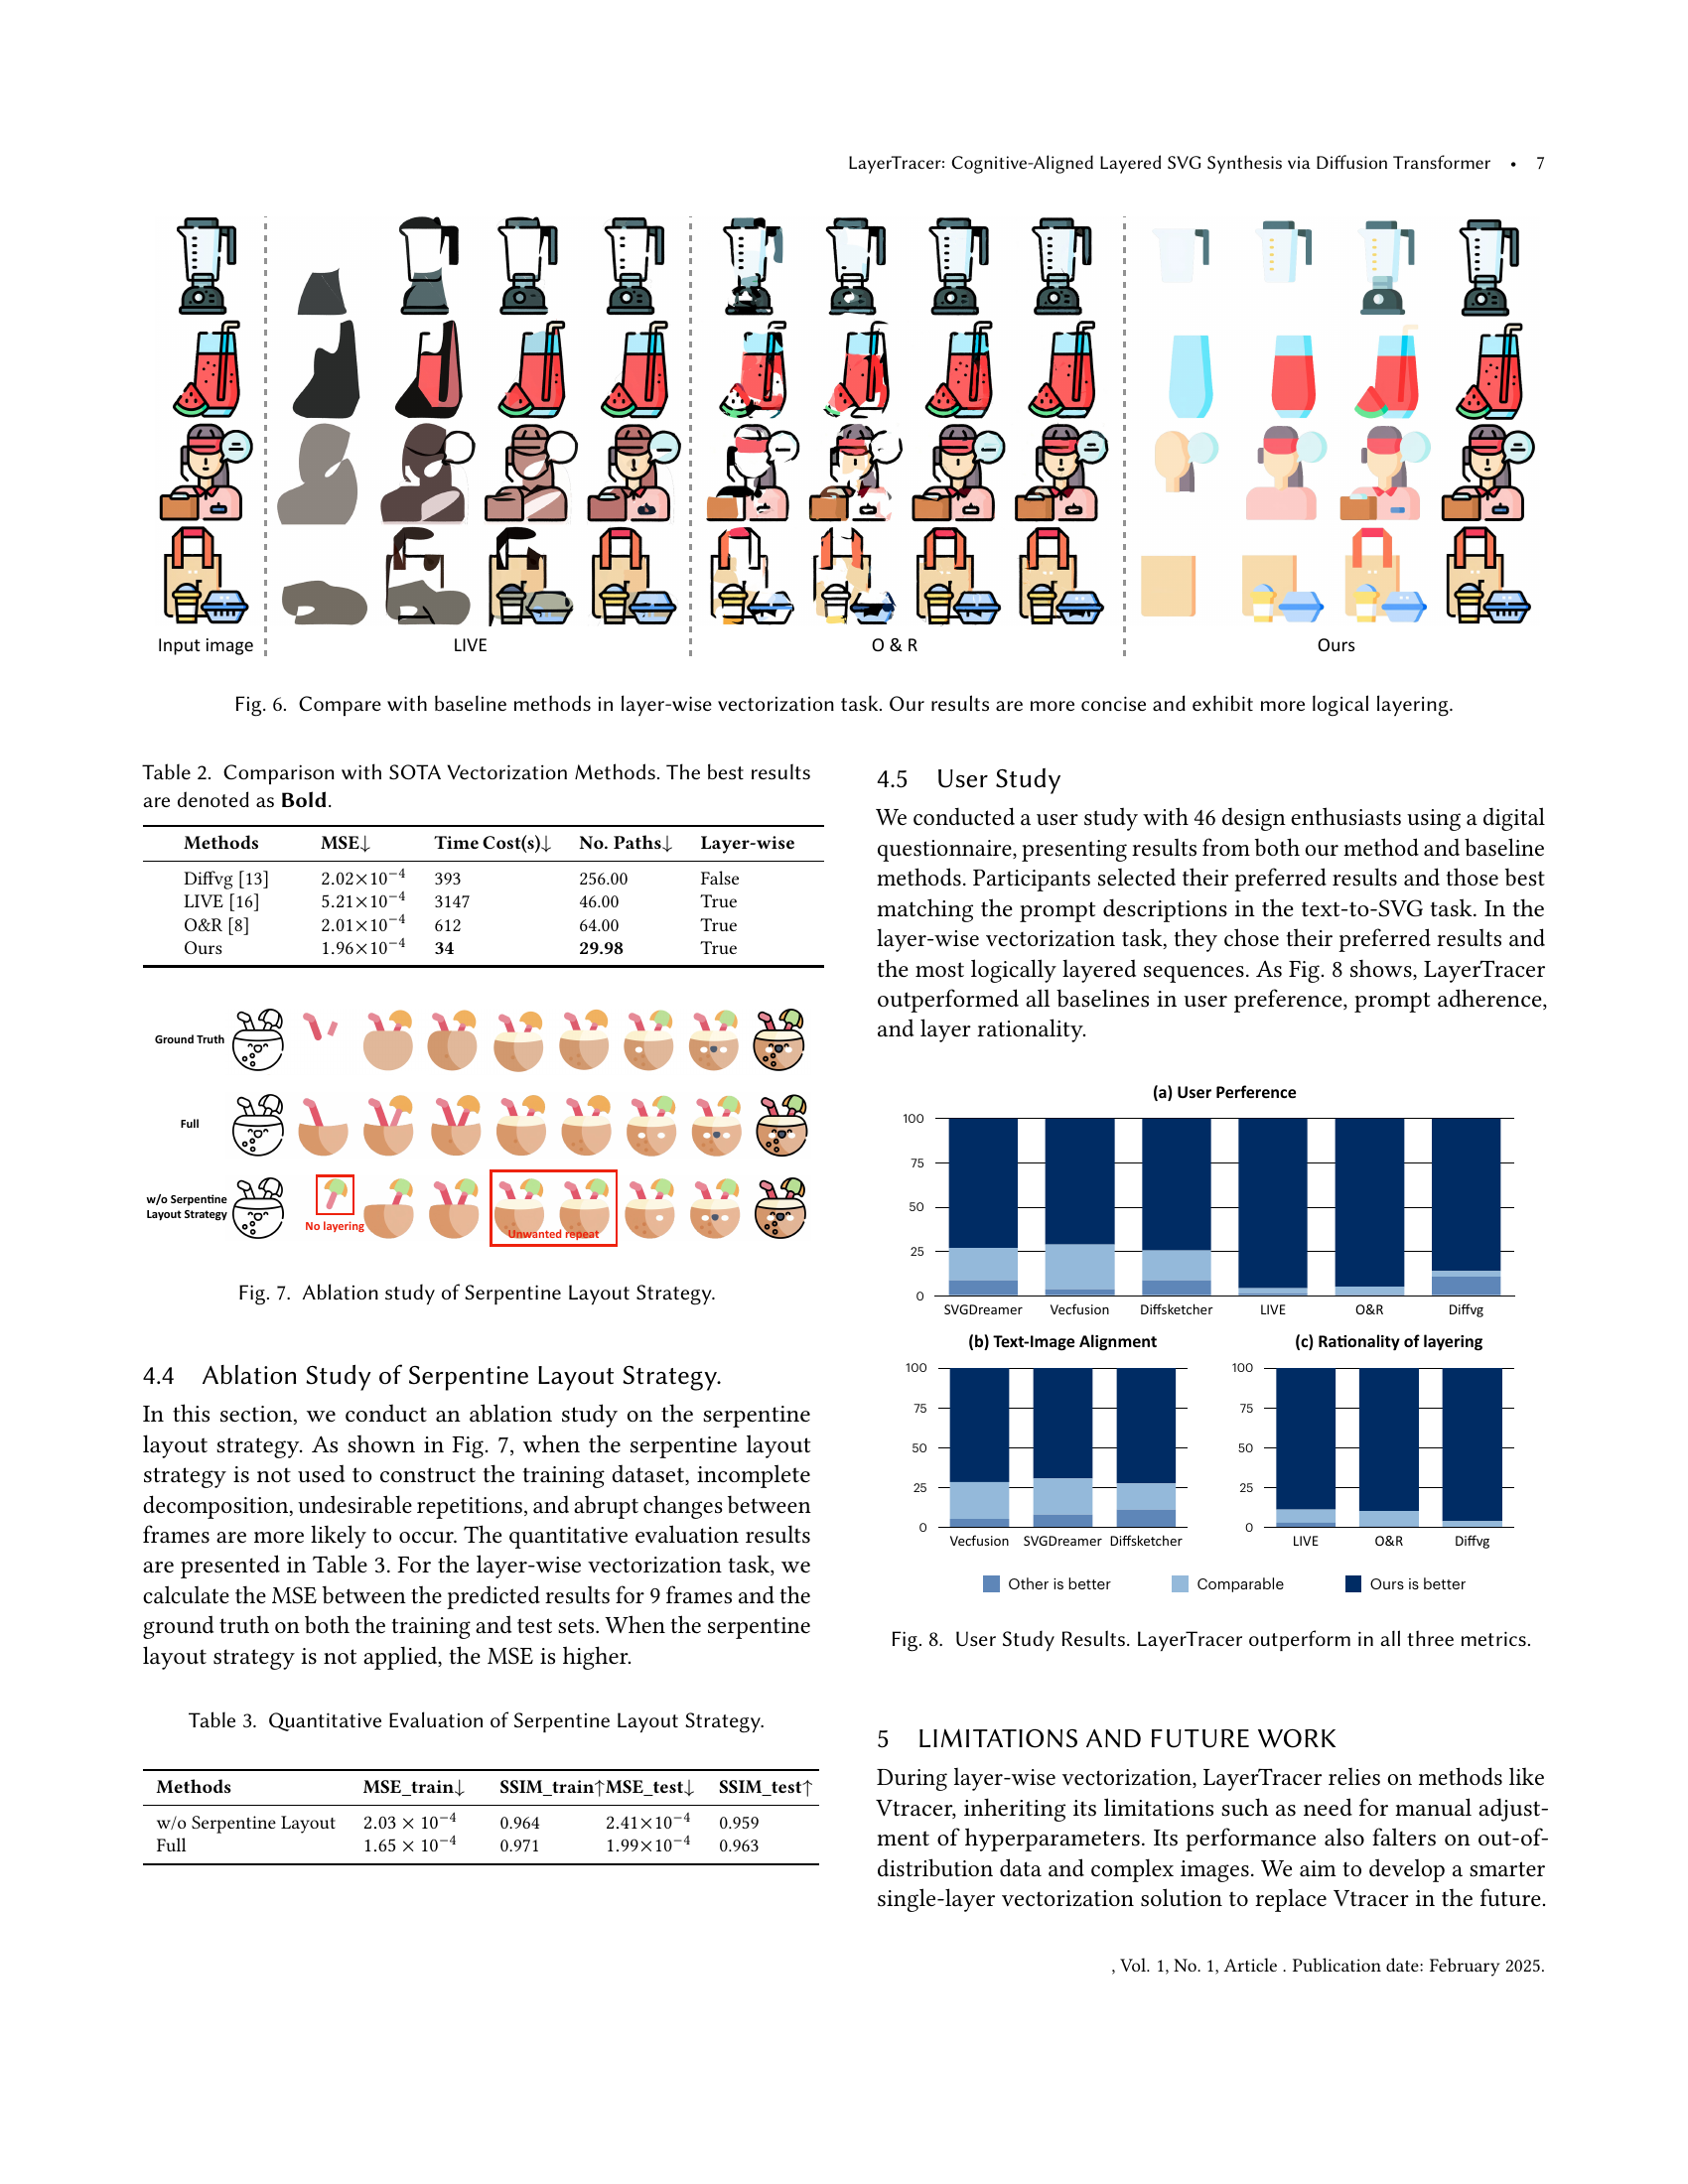
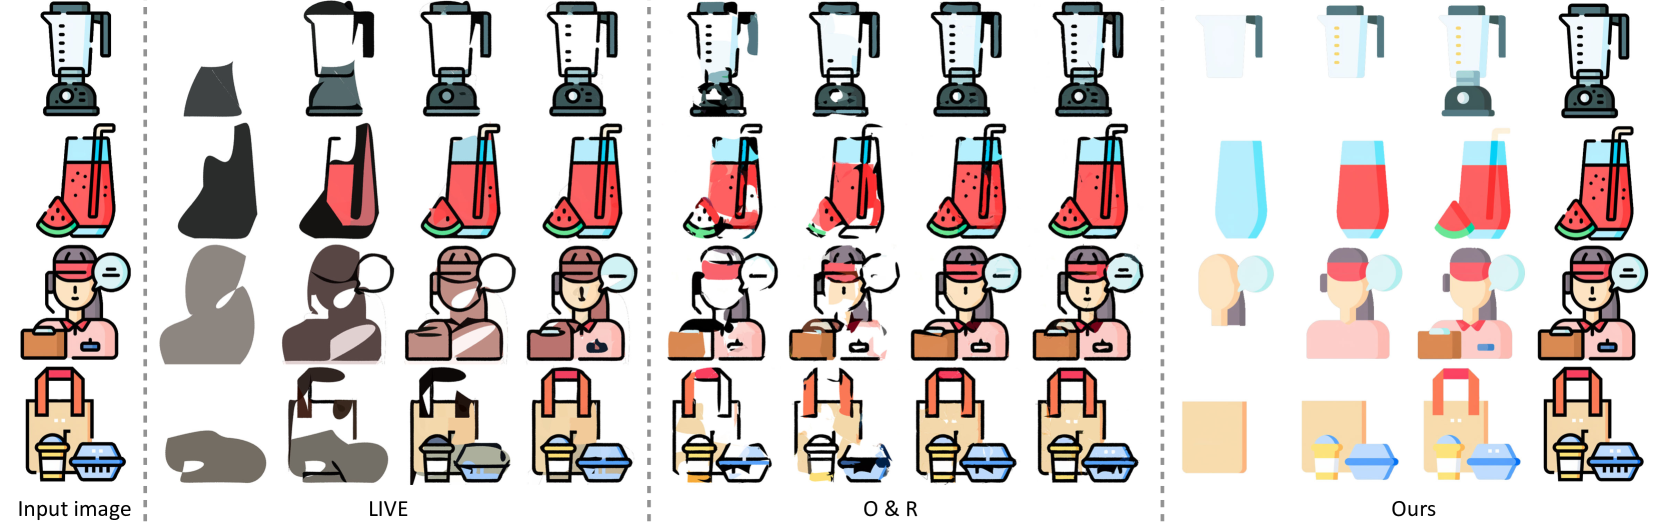
🔼 Figure 6 presents a comparison of layer-wise vectorization results between LayerTracer and several baseline methods. It showcases the superior performance of LayerTracer by demonstrating more concise and logically layered vector graphics outputs compared to the less coherent and cluttered results produced by the baseline methods. The figure visually highlights the improved quality and organization of layers achieved by LayerTracer, emphasizing its ability to maintain structure and editability.
read the caption
Figure 6. Compare with baseline methods in layer-wise vectorization task. Our results are more concise and exhibit more logical layering.

🔼 This ablation study investigates the impact of the serpentine layout strategy on the performance of LayerTracer. The serpentine layout arranges the sequence of frames (representing the steps in SVG creation) in a grid pattern to encourage the model to learn the temporal relationships between the frames. The figure likely shows comparative results of the model’s performance, metrics such as MSE and SSIM on training and testing datasets, when trained with and without the serpentine layout. The results would demonstrate the effectiveness of this layout strategy in improving the coherence and quality of the generated SVG sequences.
read the caption
Figure 7. Ablation study of Serpentine Layout Strategy.
More on tables
| Methods | MSE↓ | Time Cost(s)↓ | No. Paths↓ | Layer-wise |
|---|---|---|---|---|
| Diffvg (Li et al., 2020) | 393 | 256.00 | False | |
| LIVE (Ma et al., 2022) | 3147 | 46.00 | True | |
| O&R (Hirschorn et al., 2024) | 612 | 64.00 | True | |
| Ours | 34 | 29.98 | True |
🔼 This table presents a comparison of LayerTracer’s performance against state-of-the-art (SOTA) vectorization methods. It evaluates these methods across four key metrics: Mean Squared Error (MSE), Time Cost (in seconds), the Number of Paths in the generated SVG (lower is better, indicating efficiency), and a boolean value indicating whether the method produces layered SVGs (True/False). Lower MSE values represent higher accuracy in reconstructing the original image, shorter time costs indicate faster processing, fewer paths denote more concise vector graphics, and a ‘True’ value for layering signifies adherence to the layered SVG standard. The table highlights LayerTracer’s superior performance across all these metrics, demonstrating its efficiency and ability to generate high-quality, layered SVG outputs.
read the caption
Table 2. Comparison with SOTA Vectorization Methods. The best results are denoted as Bold.
| Methods | MSE_train↓ | SSIM_train↑ | MSE_test↓ | SSIM_test↑ |
|---|---|---|---|---|
| w/o Serpentine Layout | 0.964 | 0.959 | ||
| Full | 0.971 | 0.963 |
🔼 This table presents a quantitative analysis of the impact of the serpentine layout strategy on the performance of the LayerTracer model. It compares the Mean Squared Error (MSE) and Structural SIMilarity index (SSIM) for both training and testing datasets, with and without the use of the serpentine layout strategy during dataset creation. The results demonstrate the effectiveness of the serpentine layout in improving the model’s performance.
read the caption
Table 3. Quantitative Evaluation of Serpentine Layout Strategy.
Full paper#