TL;DR#
Current methods for adding or updating knowledge in large language models (LLMs) face challenges: performing many edits leads to a decline in the model’s overall performance. This happens because these methods tend to overfit on new information and create disproportionate growth in the parameters being updated. This issue limits the scalability and practical applicability of these techniques.
To address these challenges, the researchers introduce ENCORE, a new technique that prevents both overfitting and excessive parameter growth. ENCORE uses a combination of early stopping criteria (MPES) and a constraint to limit the magnitude of parameter updates. The results demonstrate that ENCORE successfully performs up to 10,000 sequential edits without significant performance degradation, significantly outperforming existing methods in terms of both accuracy and speed.
Key Takeaways#
Why does it matter?#
This paper is crucial for researchers in natural language processing and machine learning, especially those working on knowledge editing and large language models. It addresses a critical limitation of current methods—model degradation during sequential editing—and proposes a novel solution, opening avenues for improved knowledge integration in LLMs. The efficient method and comprehensive analysis are highly valuable to the field.
Visual Insights#

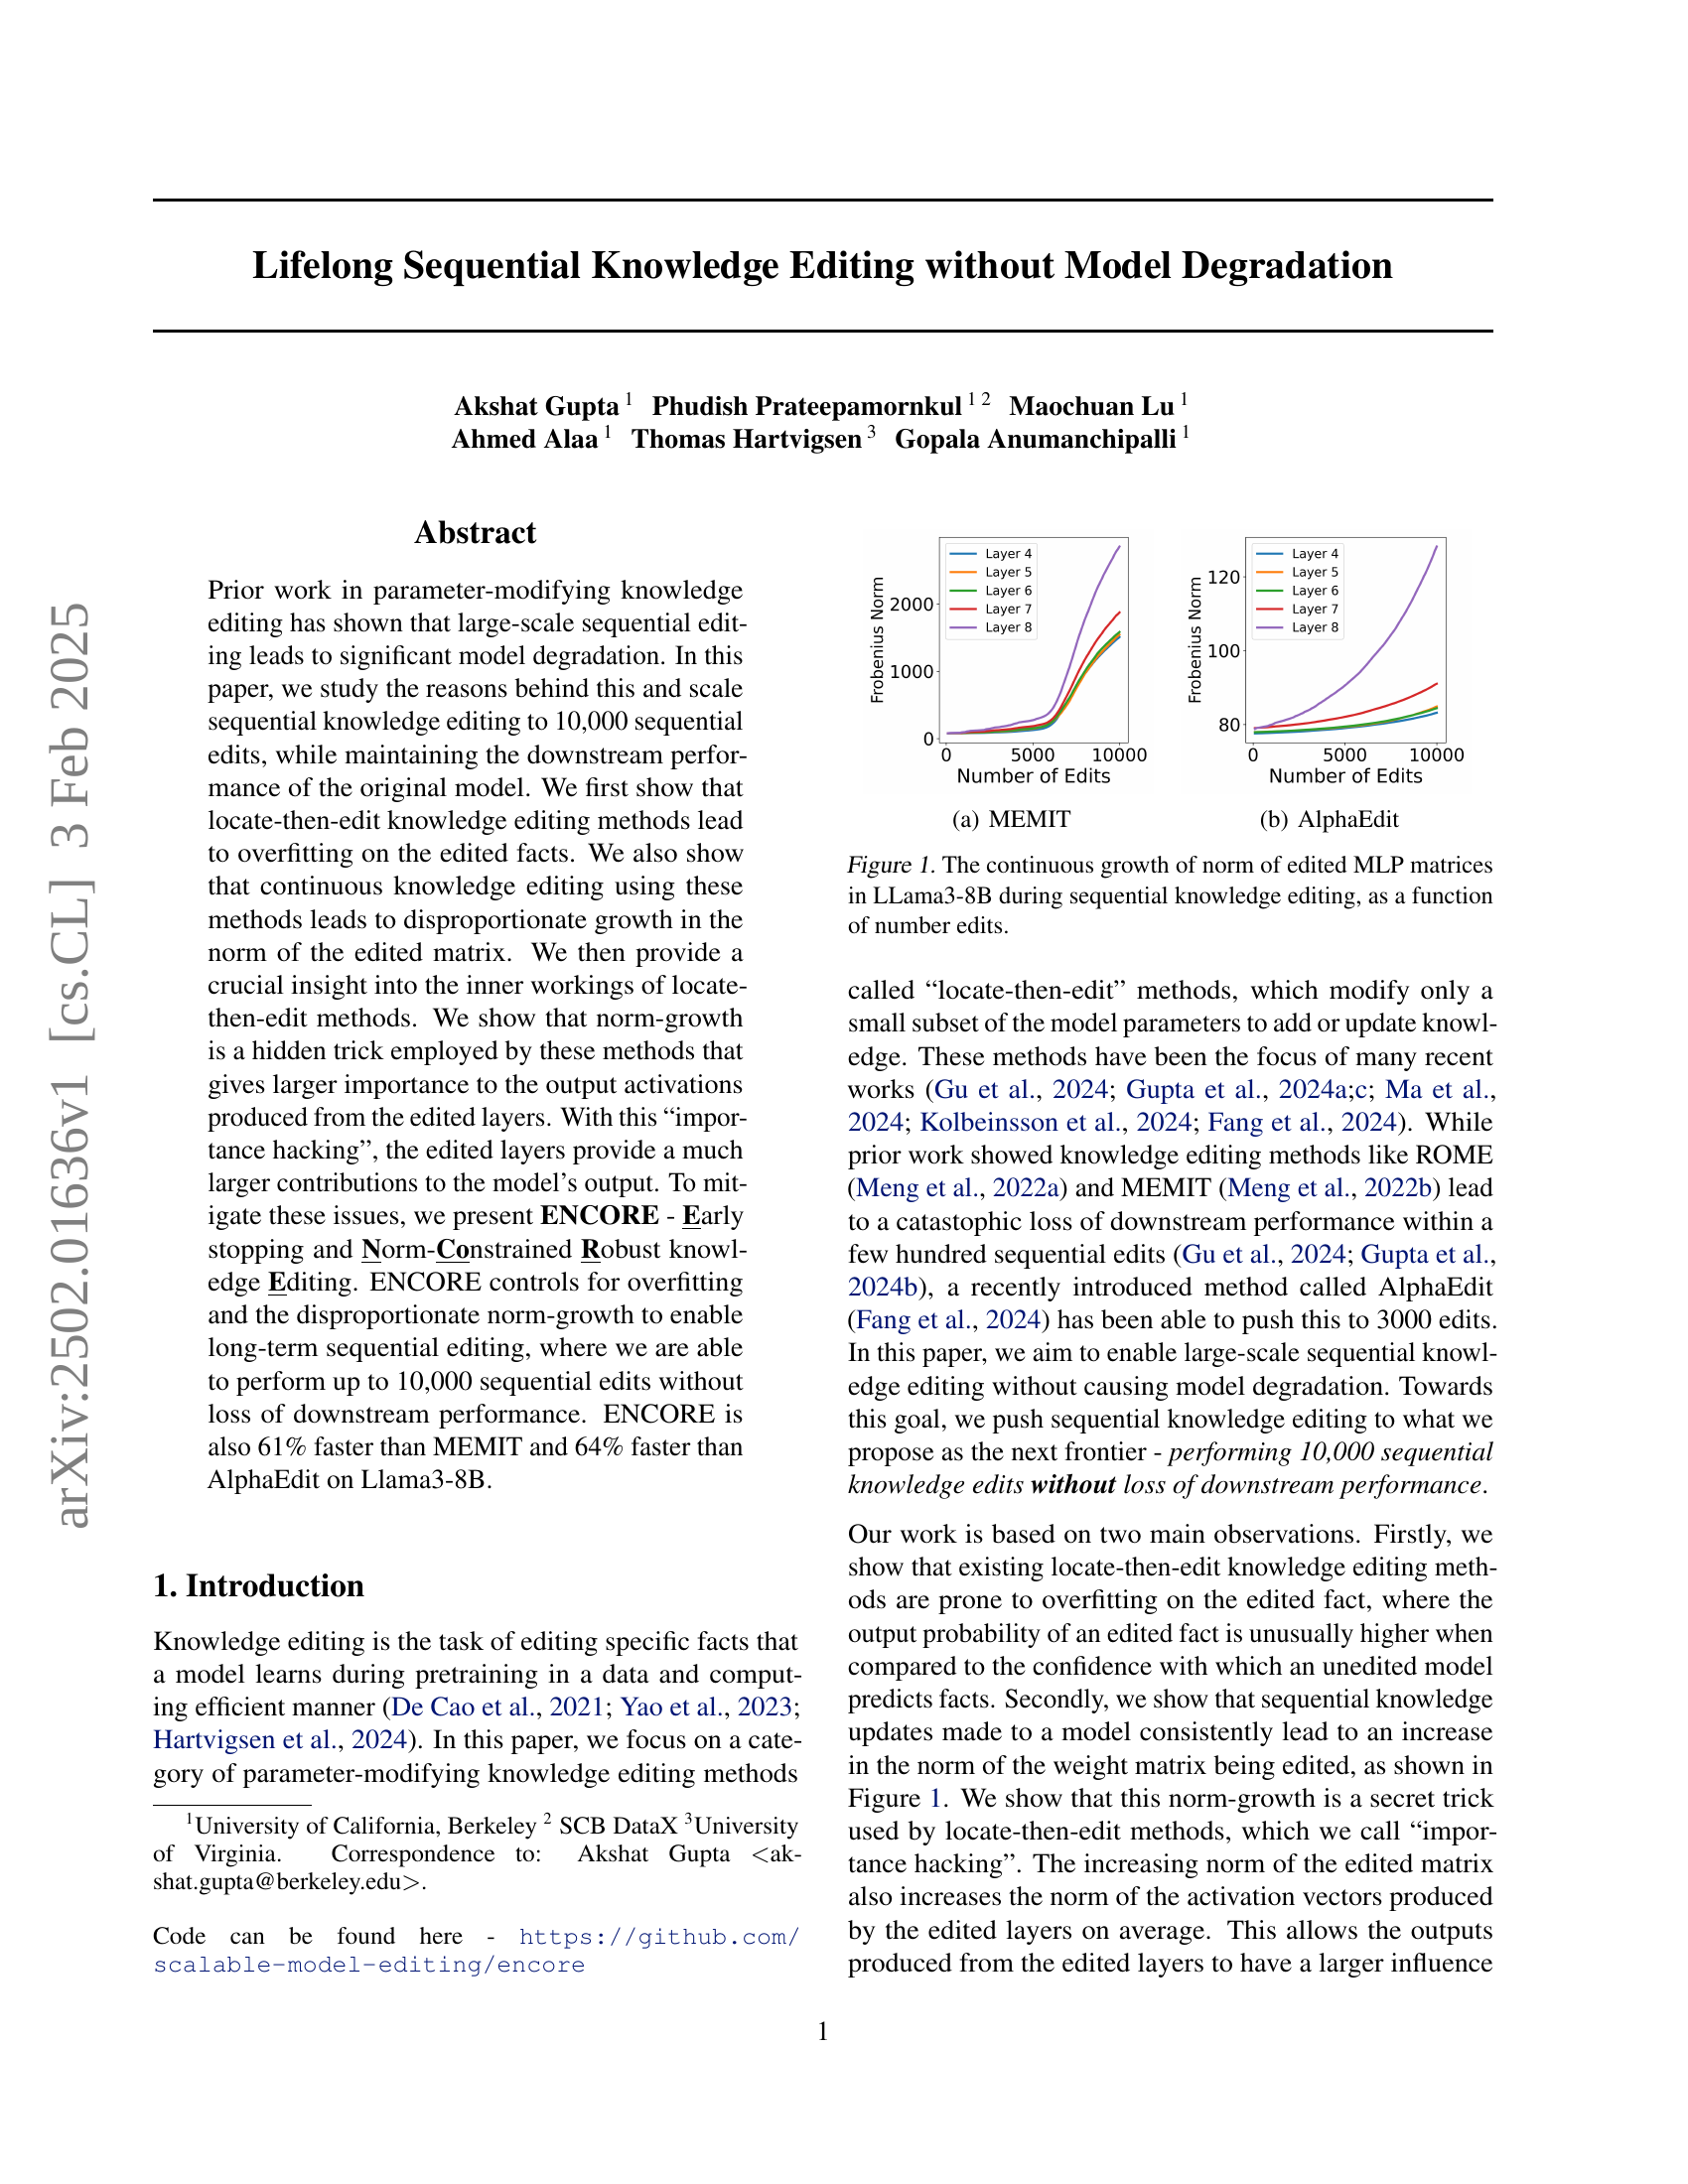
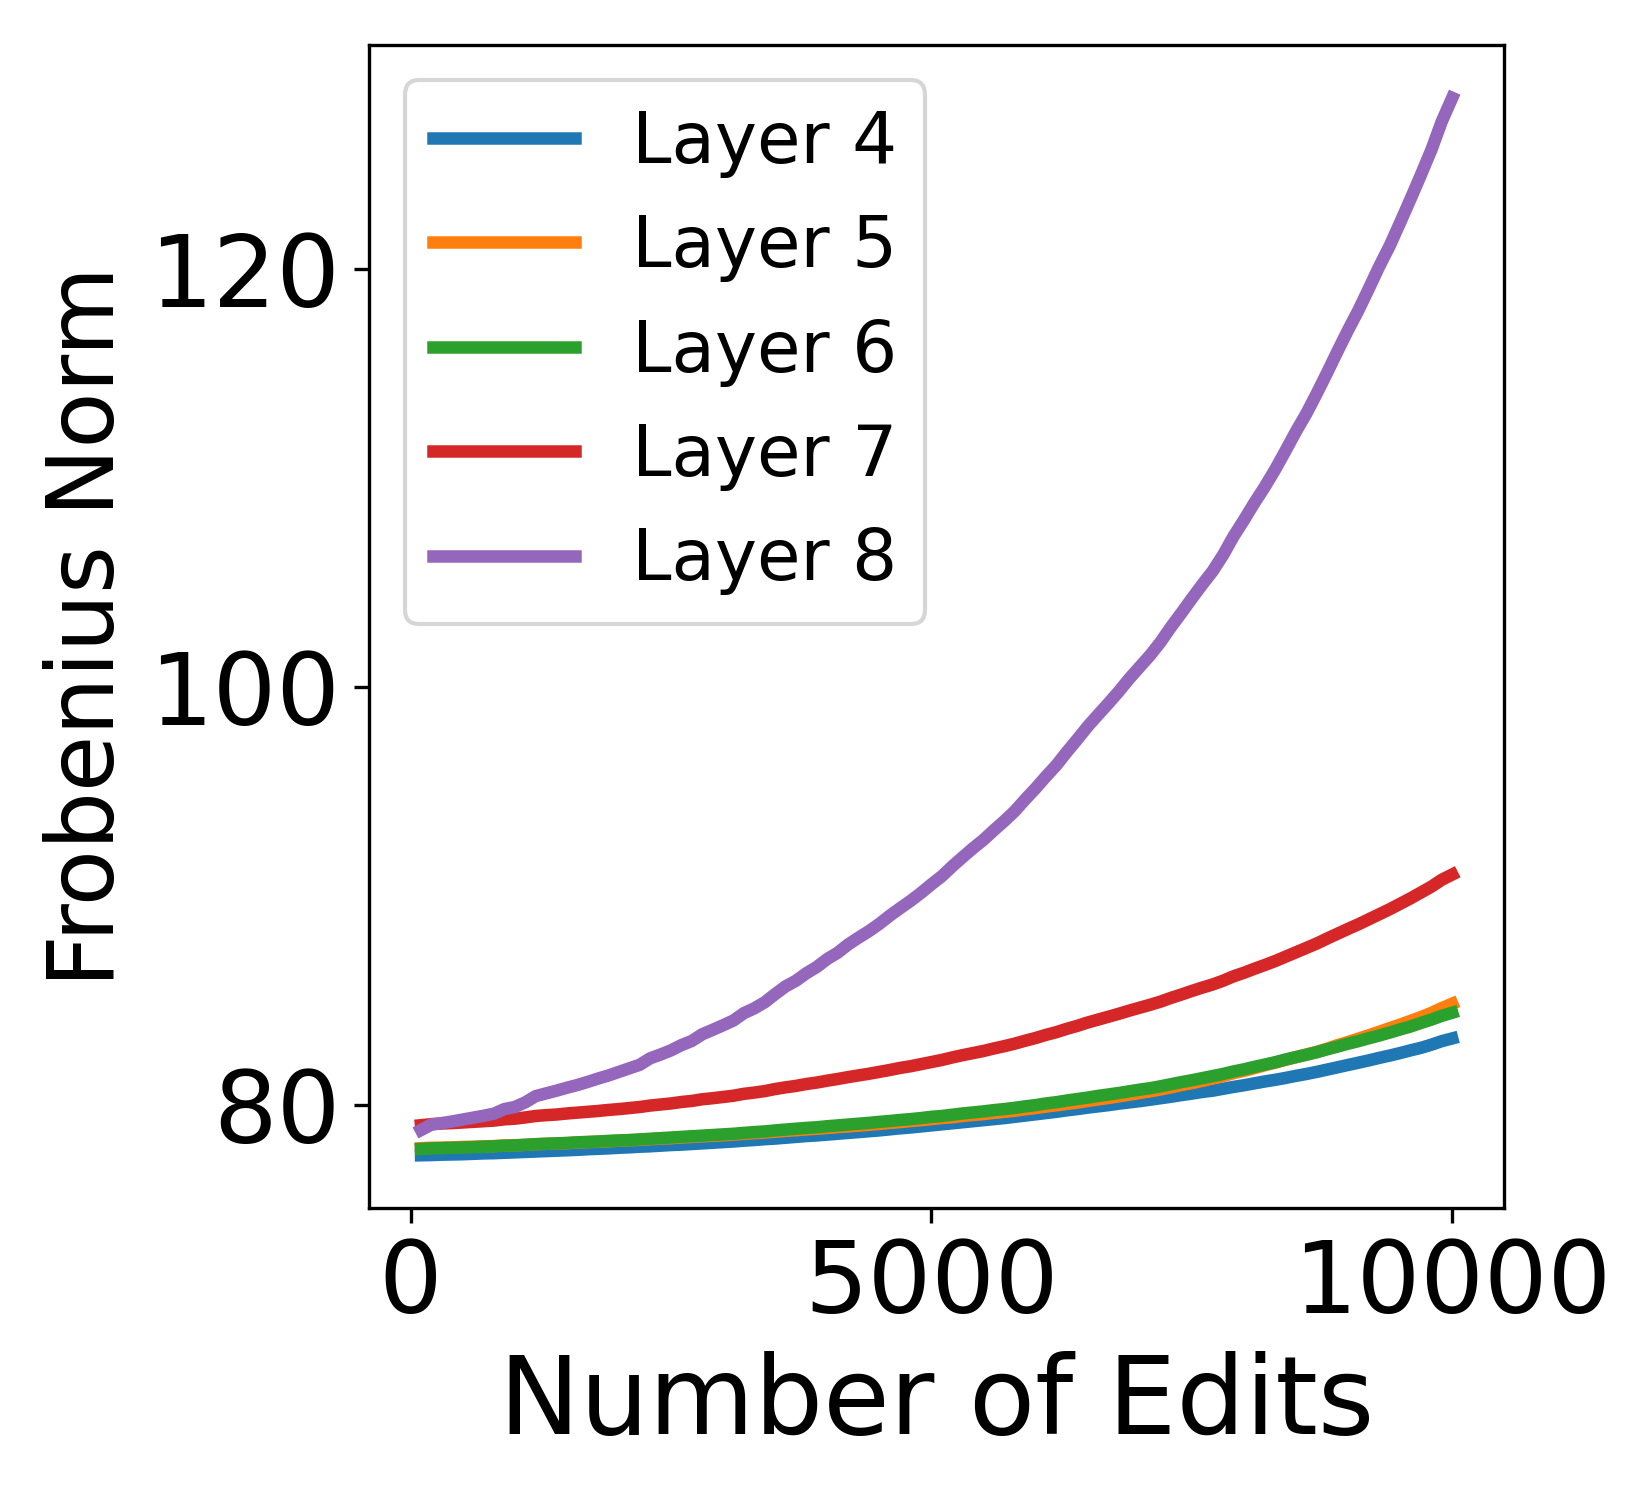
🔼 The figure shows the continuous growth of the Frobenius norm of edited MLP matrices in the Llama3-8B model during sequential knowledge editing using the MEMIT method. The x-axis represents the number of edits, and the y-axis represents the Frobenius norm. The figure illustrates how the norm increases disproportionately with each sequential edit, suggesting a potential cause for model degradation.
read the caption
(a) MEMIT
| Method | Model | Original Fact Prob | Edited Fact Prob w/o MPES | Edited Fact Prob w/ MPES | Time Per Edit w/o MPES (s) | Time Per Edit w/ MPES (s) |
| EMMET | GPT2-XL | 0.39 | 0.98 | 0.47 | 1.26 | 0.63 ( 50%) |
| Llama2-7B | 0.52 | 0.92 | 0.59 | 6.61 | 1.86 ( 71%) | |
| Llama3-8B | 0.49 | 0.99 | 0.61 | 7.65 | 1.86 ( 76%) | |
| MEMIT | GPT2-XL | 0.39 | 0.65 | 0.14 | 1.60 | 0.97 ( 39%) |
| Llama2-7B | 0.52 | 0.75 | 0.41 | 4.84 | 2.79 ( 42%) | |
| Llama3-8B | 0.49 | 0.77 | 0.41 | 8.71 | 3.31 ( 61%) | |
| AlphaEdit | GPT2-XL | 0.39 | 0.98 | 0.39 | 1.49 | 0.83 ( 44%) |
| Llama2-7B | 0.52 | 0.84 | 0.37 | 5.89 | 2.69 ( 54%) | |
| Llama3-8B | 0.49 | 0.75 | 0.33 | 9.44 | 3.43 ( 63%) |
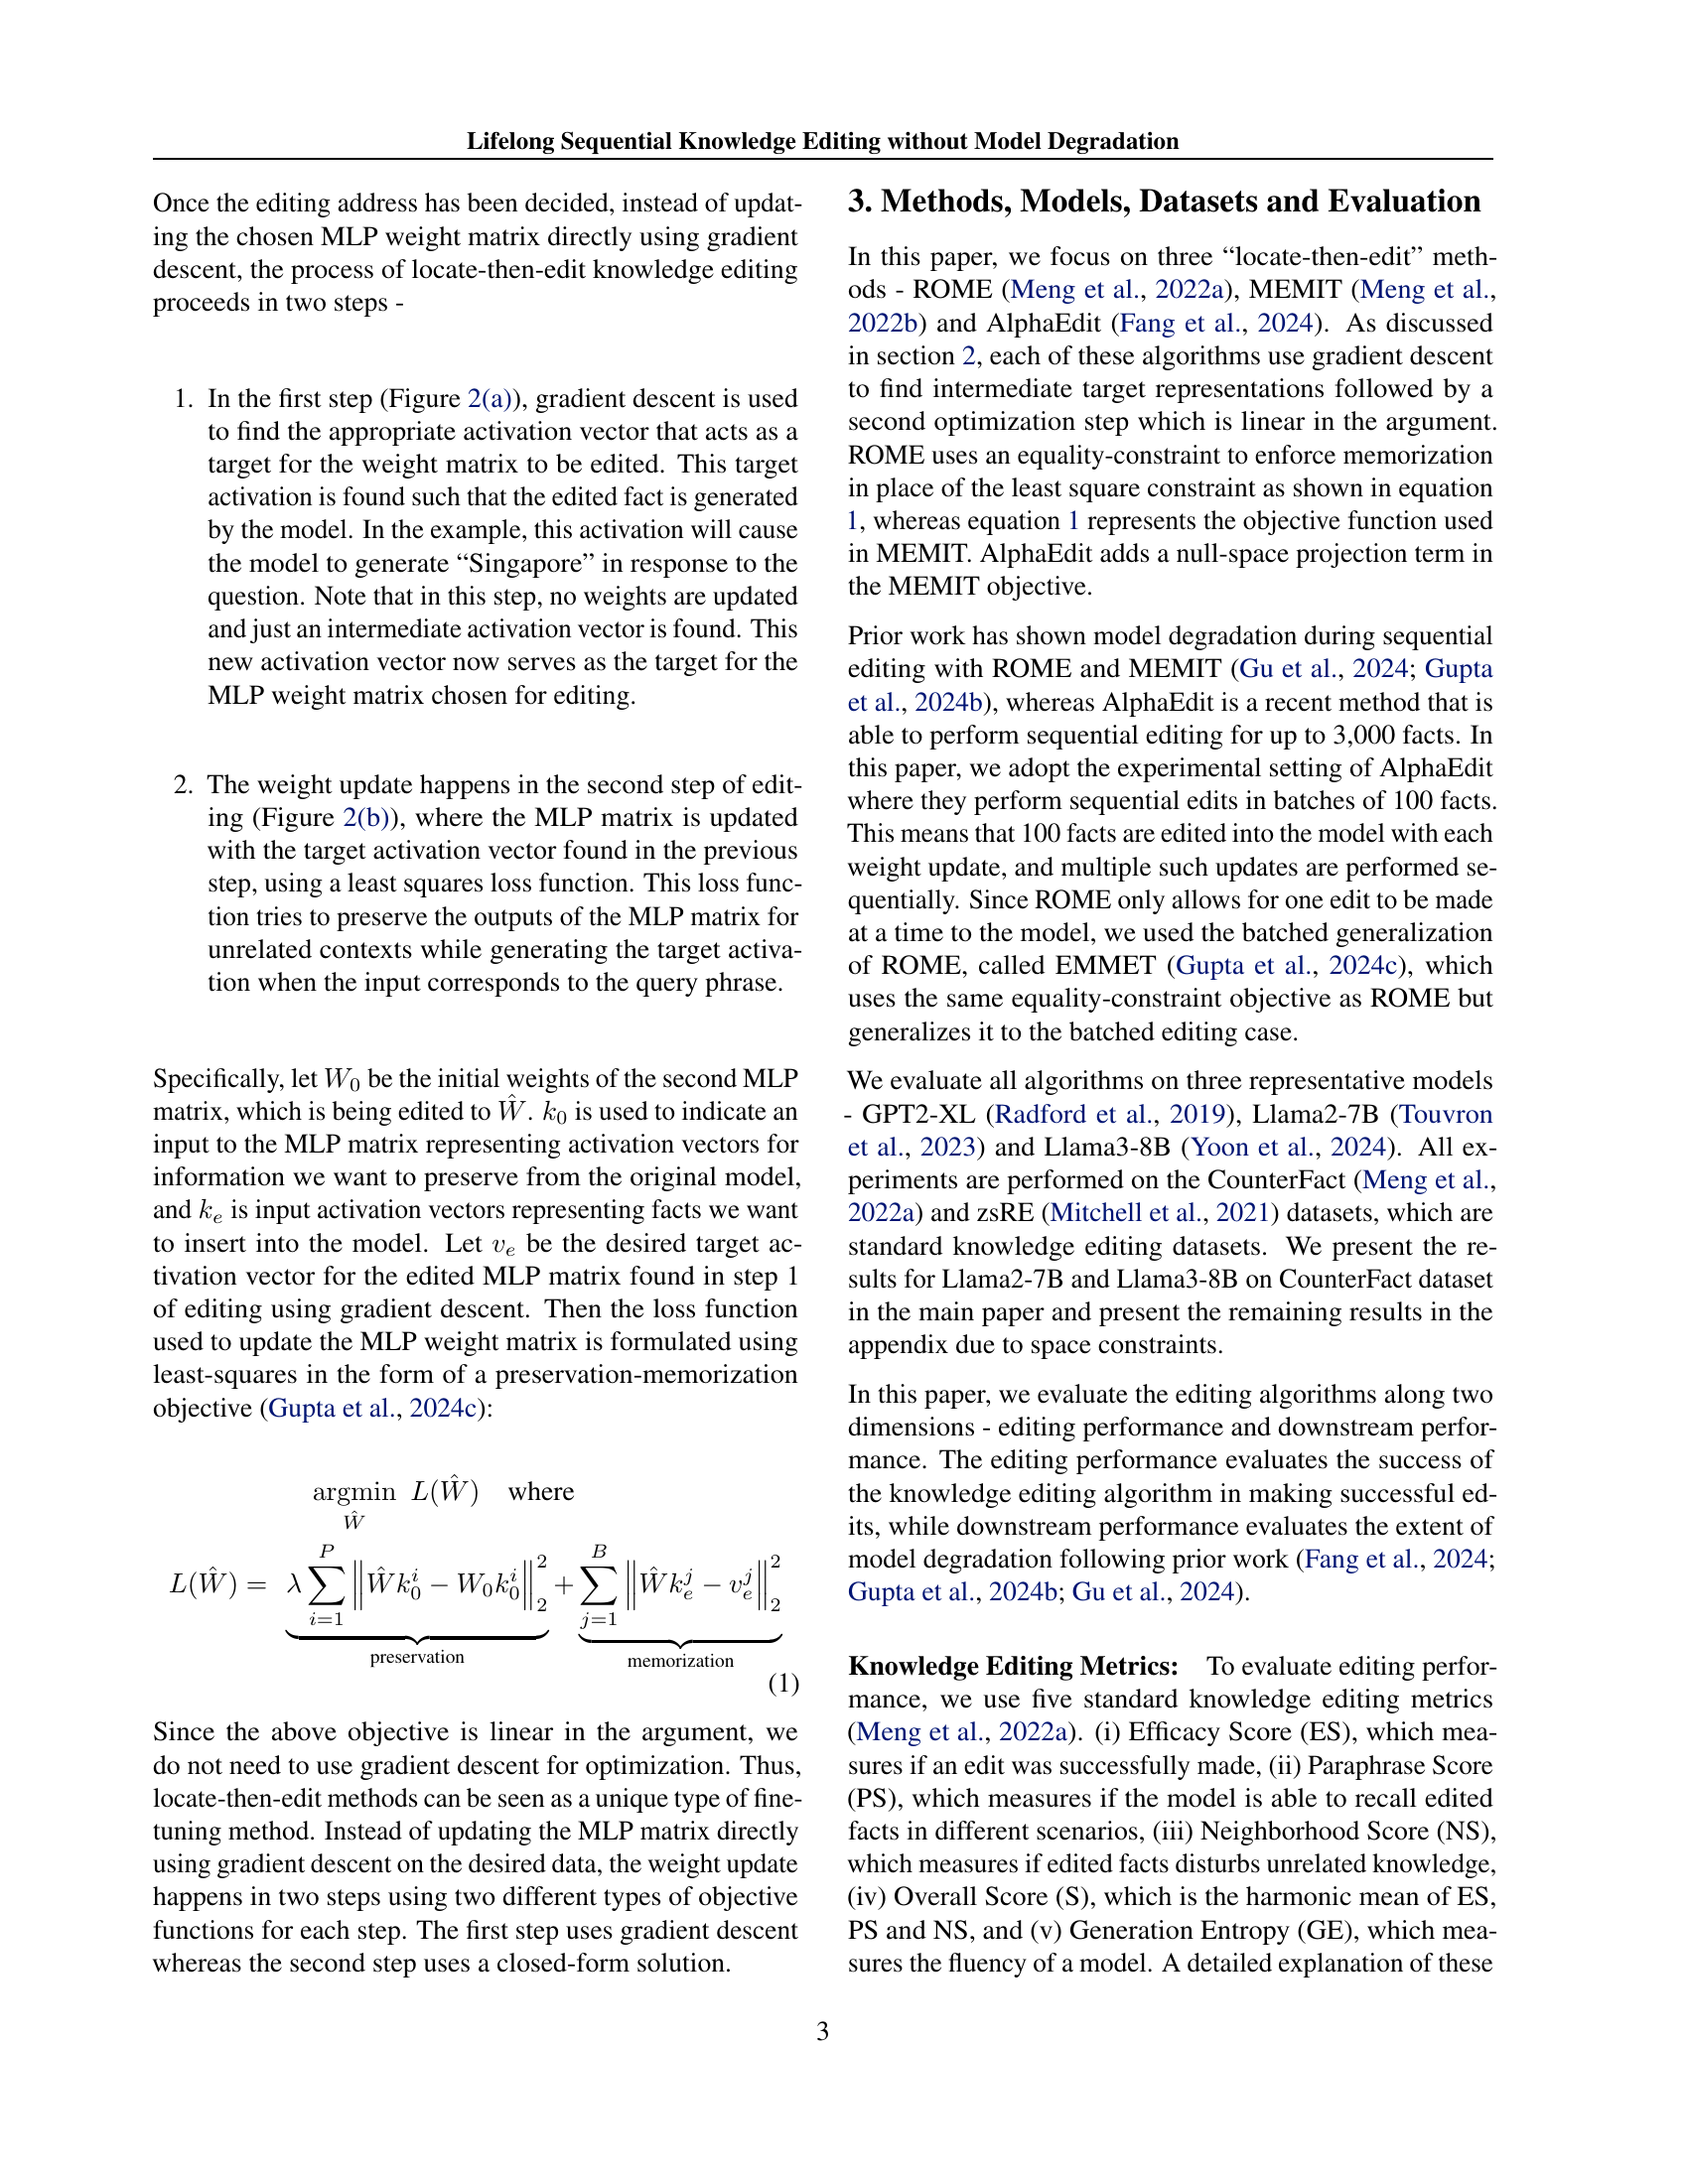
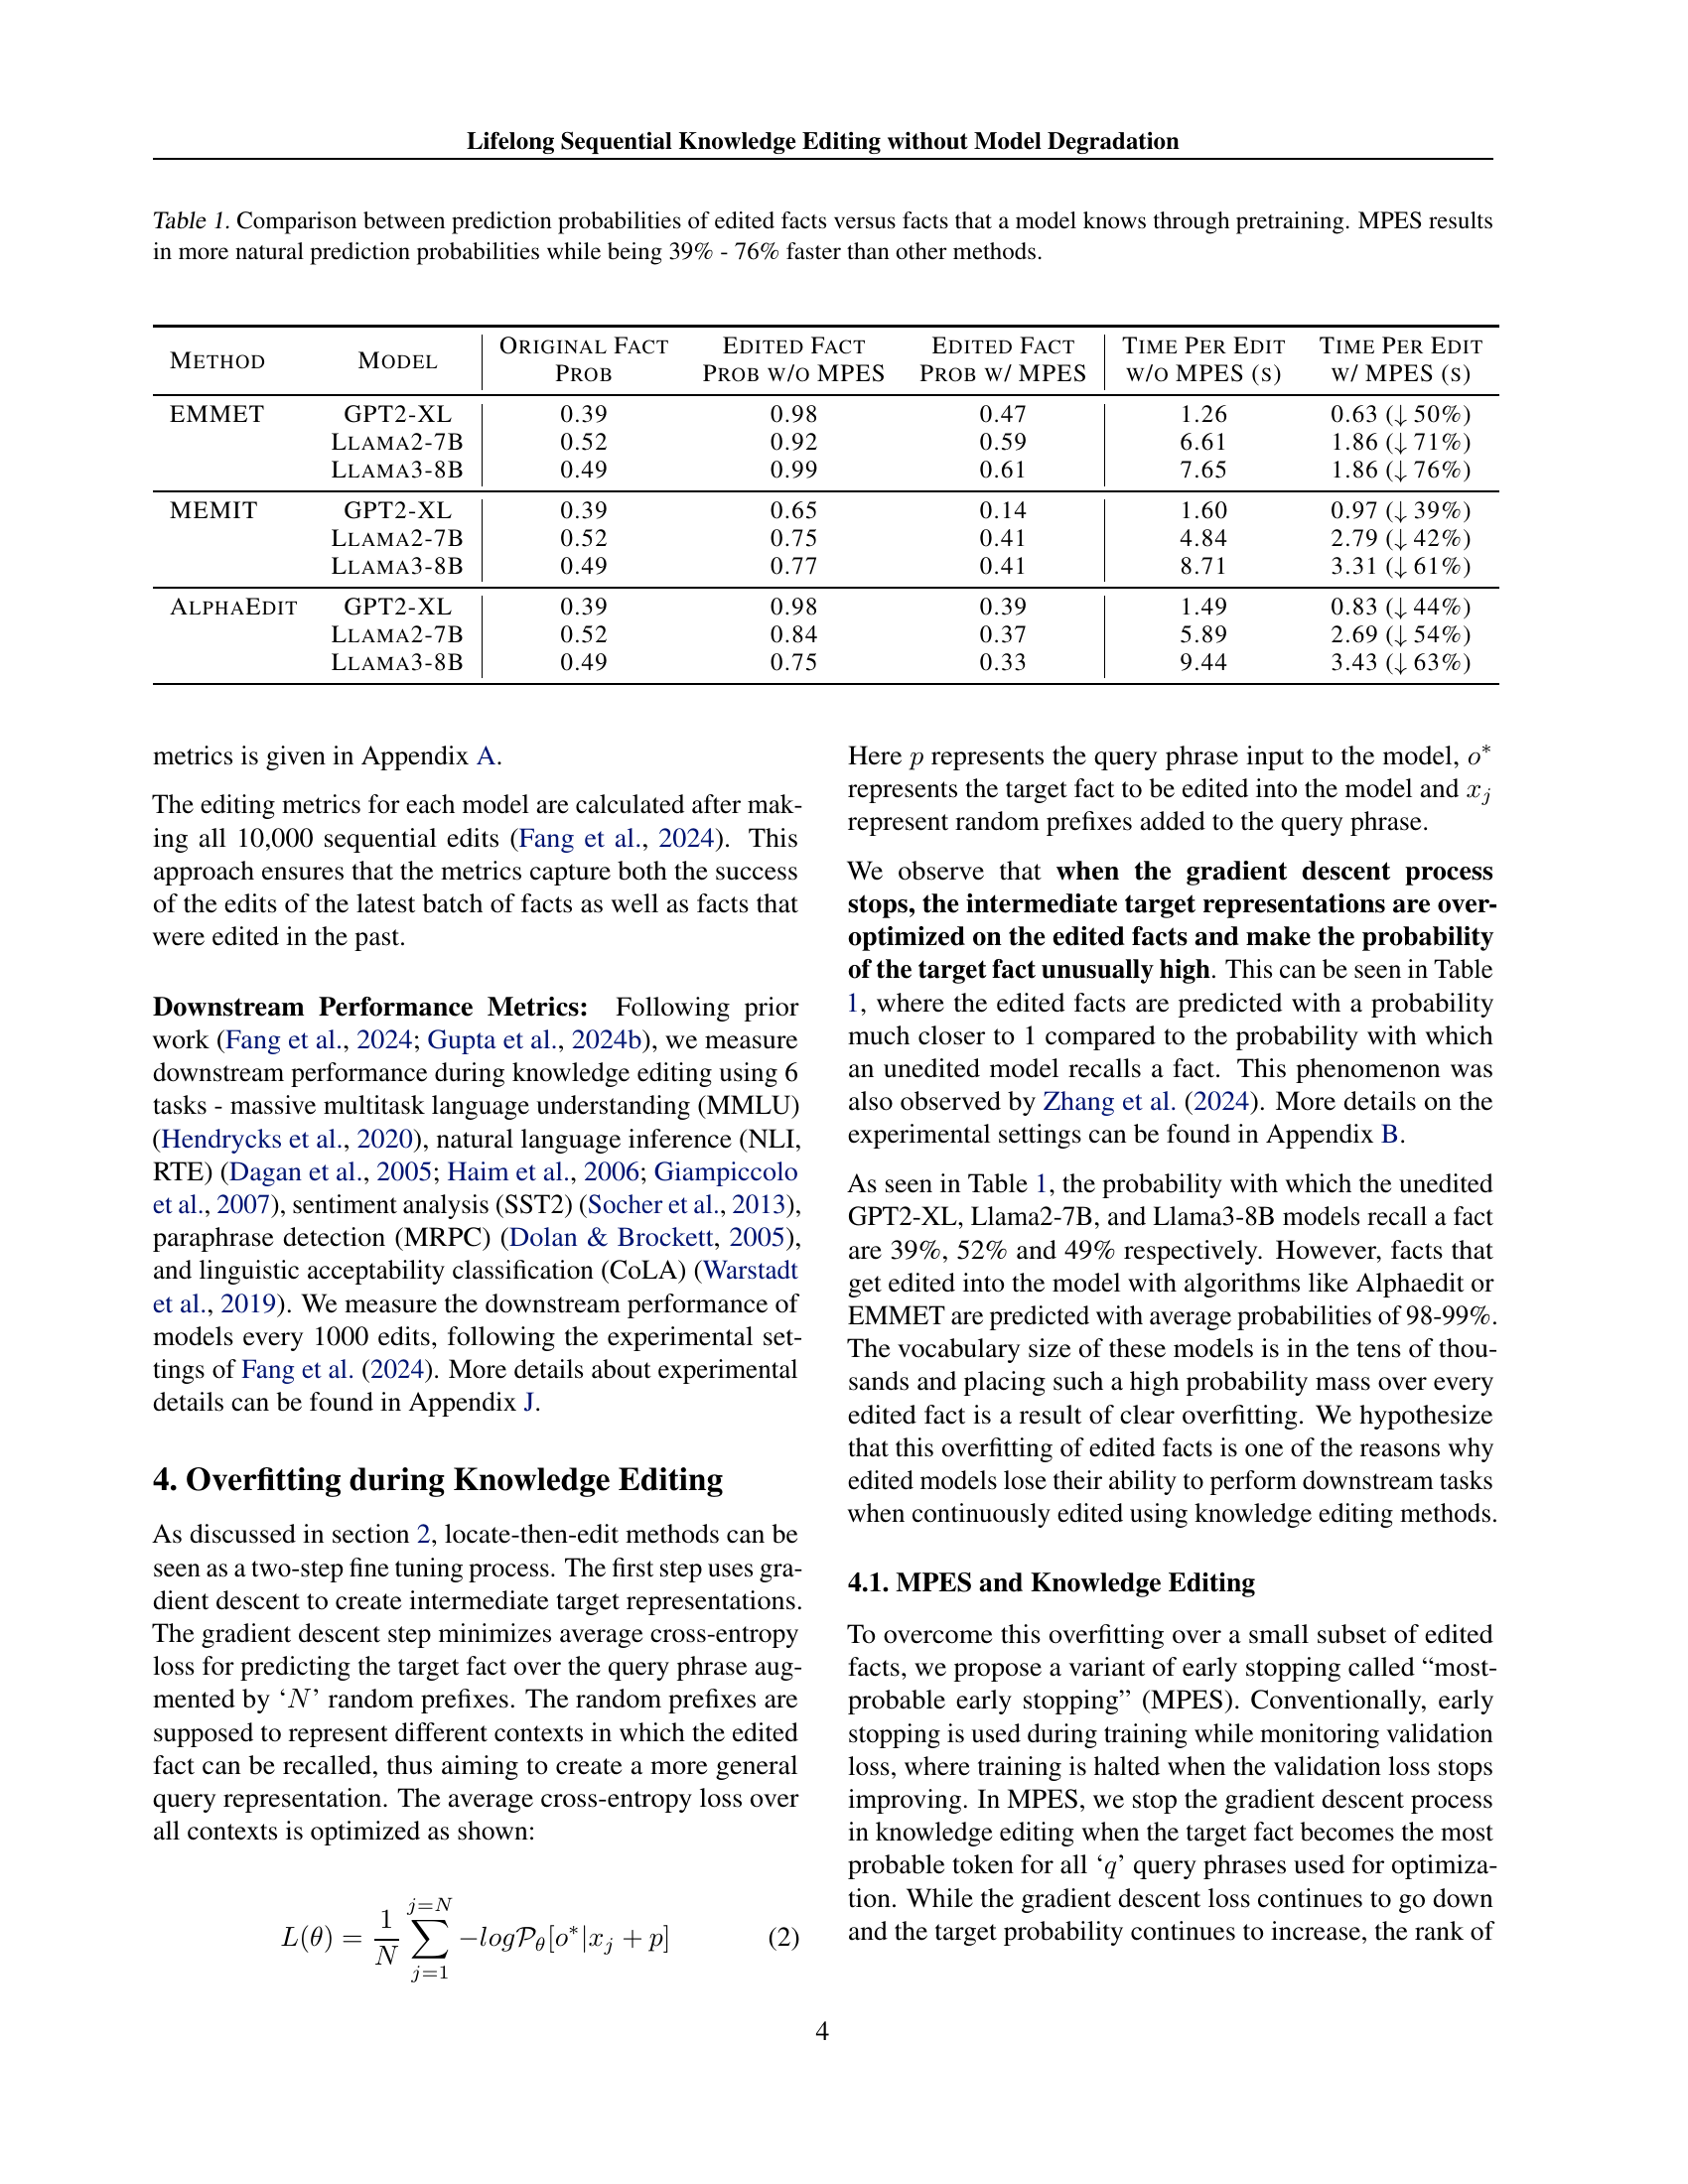
🔼 This table compares the prediction probabilities of facts that have been edited into the model using different knowledge editing methods, against the probabilities of facts that the model already knew from its pretraining. It shows that methods without Most-Probable Early Stopping (MPES) tend to overfit on the edited facts, assigning them unrealistically high probabilities. MPES mitigates this overfitting, resulting in more natural prediction probabilities. The table also demonstrates the significant speed improvements achieved by MPES, showing that it is 39% to 76% faster than other methods.
read the caption
Table 1: Comparison between prediction probabilities of edited facts versus facts that a model knows through pretraining. MPES results in more natural prediction probabilities while being 39% - 76% faster than other methods.
In-depth insights#
Locate-then-Edit Issues#
Locate-then-edit methods, while efficient, present two key issues. First, overfitting on edited facts occurs because the optimization process excessively focuses on ensuring correct predictions for those specific facts. This leads to unusually high confidence scores for edited information, potentially at the expense of the model’s general performance. Second, there is disproportionate norm growth in the edited matrices, meaning the updated weights increase in magnitude much more significantly than other parts of the model. This hidden “importance hacking” allows outputs from these edited layers to dominate the final model output, potentially hindering the model’s ability to incorporate and balance information from other parts of the network. These issues collectively contribute to downstream performance degradation after multiple edits, revealing a limitation in the current approach to knowledge editing.
ENCORE Framework#
The ENCORE framework, designed for lifelong sequential knowledge editing, tackles the critical issue of model degradation during extensive edits. It directly addresses the overfitting and disproportionate norm growth problems inherent in many locate-then-edit methods. ENCORE achieves this through two key mechanisms: Most-Probable Early Stopping (MPES) prevents overfitting by halting gradient descent when the edited facts reach maximum probability, thus improving generalization. Simultaneously, a Frobenius-norm constraint controls the growth of edited matrix norms, preventing the dominance of edited layers and ensuring the model retains broader capabilities. This combined approach allows ENCORE to perform significantly more sequential edits (up to 10,000) while maintaining downstream performance and achieving faster edit speeds compared to previous methods. The framework’s success hinges on its nuanced understanding of the interplay between overfitting, norm growth, and the inner workings of locate-then-edit methods, offering a powerful solution for robust and scalable knowledge editing in large language models.
Norm Growth Analysis#
Analyzing norm growth in the context of lifelong sequential knowledge editing reveals crucial insights into model behavior. Disproportionate increases in the Frobenius norm of edited weight matrices during sequential editing are observed, indicating that these matrices gain undue influence over the model’s output. This phenomenon, termed “importance hacking,” allows the edited layers to override information from other parts of the model, leading to successful edits but potentially harming the model’s overall performance on unrelated tasks. The growth is not random; it consistently increases with each edit, highlighting a systematic issue within the locate-then-edit methods. This observation suggests a need to constrain the norm growth. By controlling this growth, we can mitigate overfitting to specific facts and reduce the model’s tendency to over-rely on recently edited information. This approach paves the way for more robust and reliable lifelong sequential knowledge editing without significant performance degradation.
Overfitting Mitigation#
Overfitting is a critical concern in machine learning, especially when dealing with complex models and limited data. In the context of knowledge editing, overfitting manifests as the model becoming overly reliant on the newly added or corrected information, neglecting previously learned knowledge. This can lead to poor generalization and reduced performance on unseen data. Effective overfitting mitigation strategies are therefore crucial for successful knowledge editing. Techniques such as early stopping, regularization, and data augmentation can be employed to address this issue. Early stopping prevents the model from training for too long, reducing the risk of overfitting. Regularization techniques, such as adding penalty terms to the loss function, constrain model complexity, discouraging overfitting. Data augmentation increases the diversity of the training dataset, making the model less sensitive to specific characteristics of the limited dataset. Careful selection and tuning of these techniques are necessary to achieve the best balance between model accuracy and generalization ability in the context of knowledge editing.
Future Directions#
Future research could explore extending ENCORE’s capabilities to handle more complex edits, such as those involving multiple facts or relationships. Investigating the impact of different norm constraints and early stopping criteria on both editing performance and downstream task performance would be valuable. A deeper understanding of the theoretical underpinnings of norm growth and its relation to model overfitting is needed, potentially involving analysis of activation patterns and information flow within the model’s layers. Furthermore, exploring the robustness and generalization of ENCORE across diverse model architectures and datasets is crucial to solidify its potential as a general-purpose knowledge editing framework. Finally, addressing ethical concerns surrounding knowledge editing requires careful consideration and investigation of the potential for misuse or unintended consequences.
More visual insights#
More on figures
🔼 The figure shows the continuous growth of the Frobenius norm of edited multi-layer perceptron (MLP) matrices in the LLama3-8B model during sequential knowledge editing using AlphaEdit. The x-axis represents the number of edits performed, and the y-axis shows the Frobenius norm. Each line represents a different layer within the MLP.
read the caption
(b) AlphaEdit
🔼 This figure visualizes the continuous increase in the Frobenius norm of edited multi-layer perceptron (MLP) matrices within the LLaMA3-8B model during sequential knowledge editing. Two subfigures are presented: (a) shows the norm growth for the MEMIT method, and (b) shows the norm growth for the AlphaEdit method. The x-axis represents the number of sequential edits performed, while the y-axis represents the Frobenius norm. The plots illustrate that the norm consistently increases with each sequential edit, regardless of the method used. This observation highlights a potential issue where continuous norm growth might lead to model degradation.
read the caption
Figure 1: The continuous growth of norm of edited MLP matrices in LLama3-8B during sequential knowledge editing, as a function of number edits.
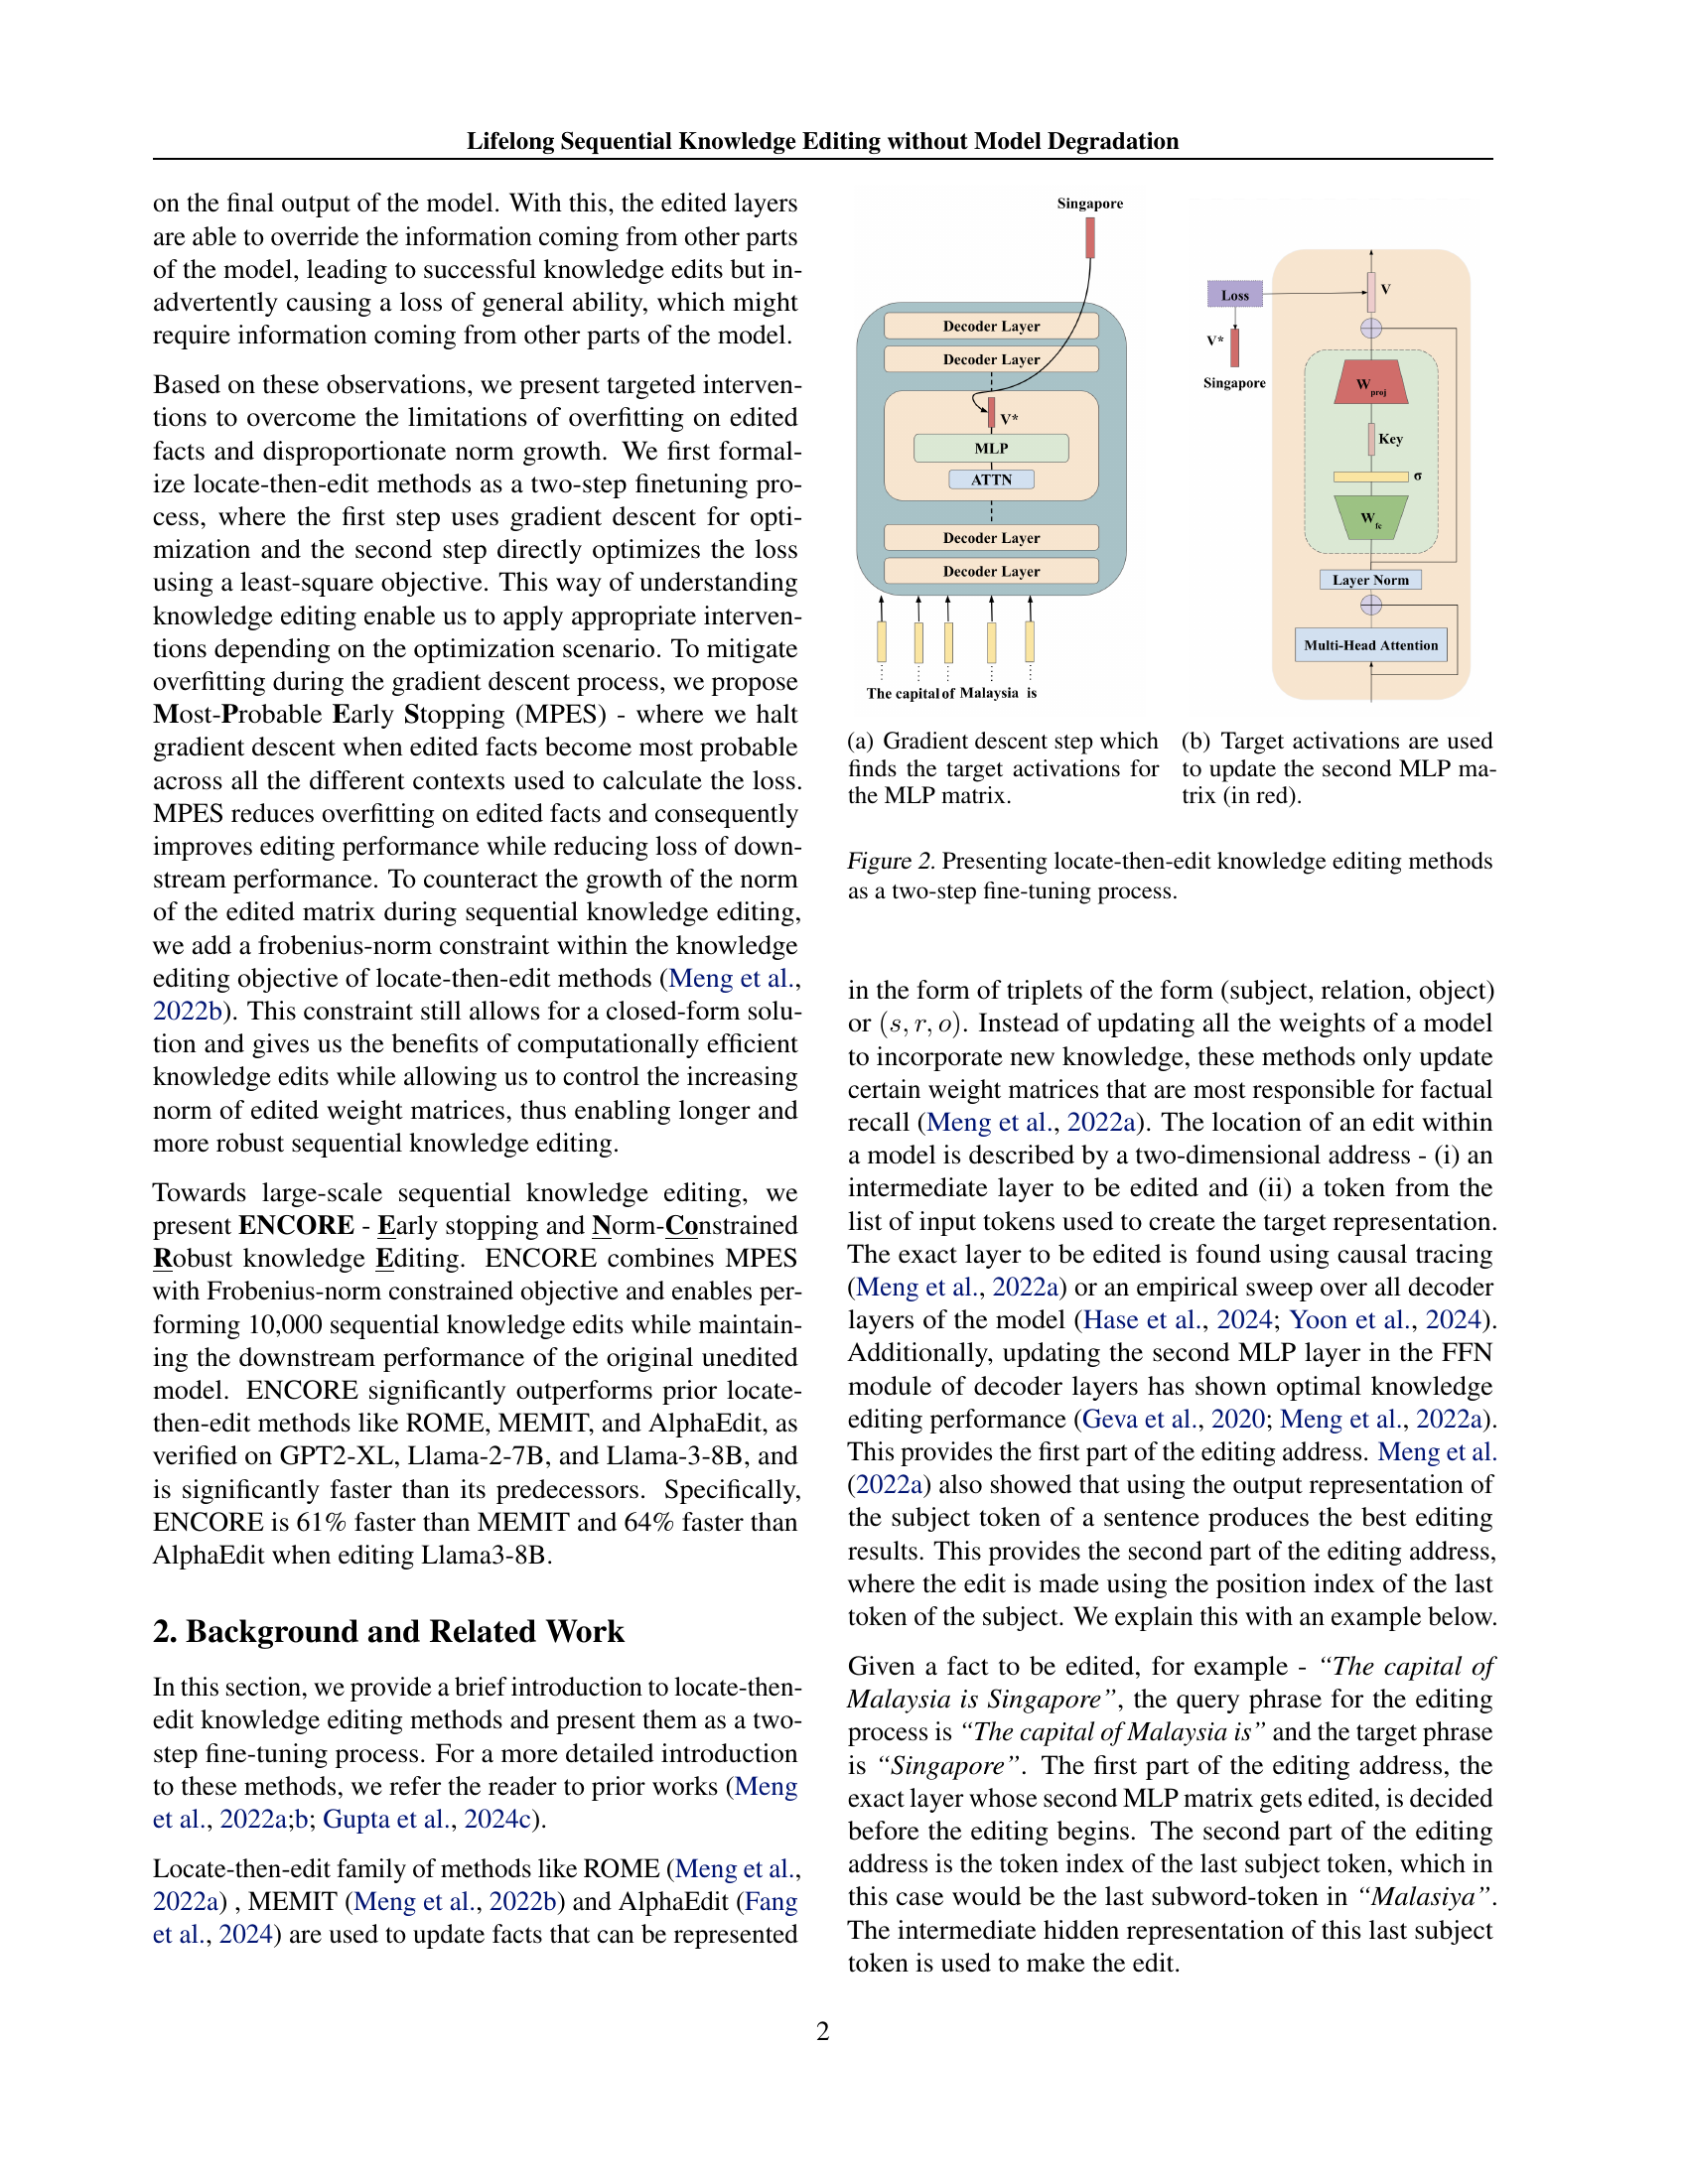
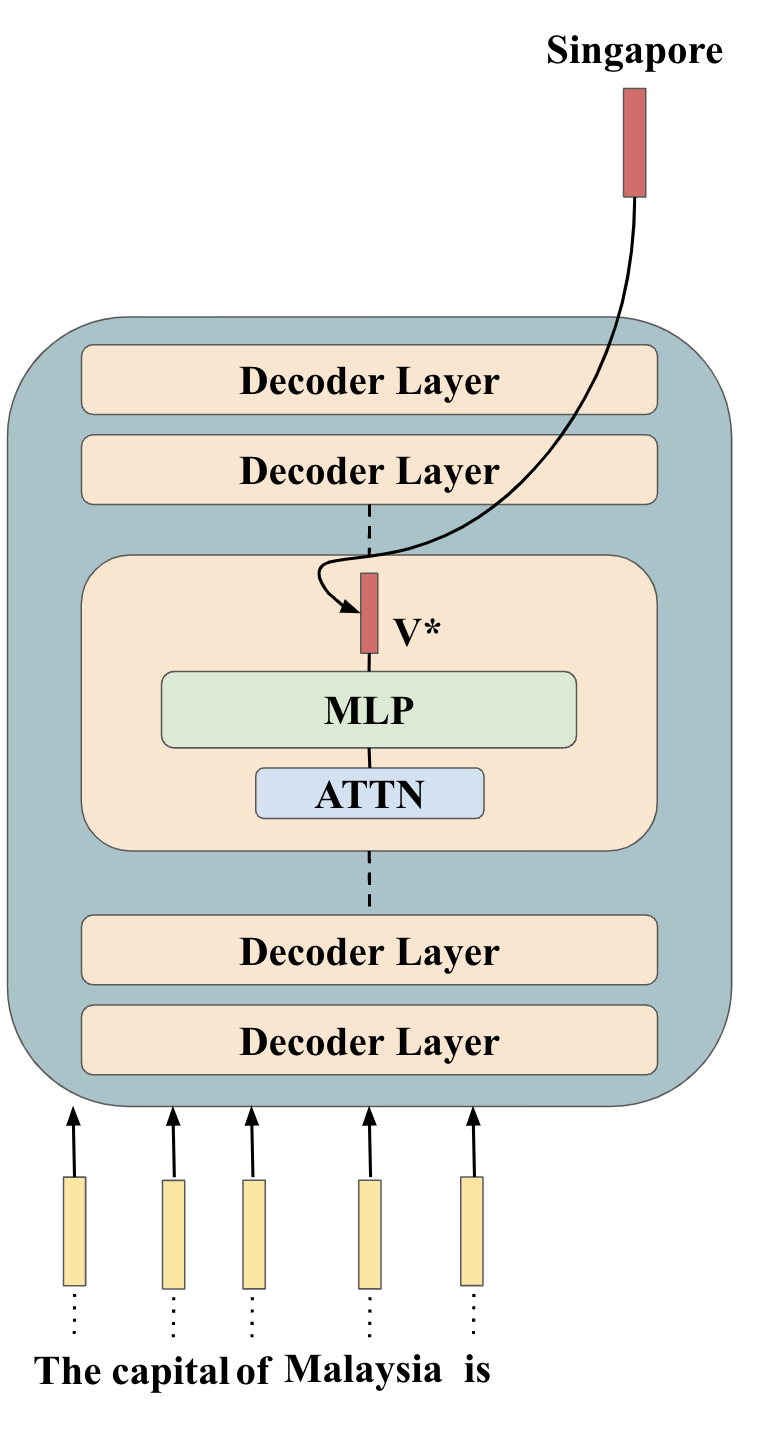
🔼 This figure shows the first step in the locate-then-edit knowledge editing method. The goal is to find the optimal activation vector for the second MLP matrix in a Transformer decoder layer. Gradient descent is used to modify the model’s weights, which will result in the model producing the correct output (target activation) when provided with a specific input. This step focuses solely on finding the desired activation, without directly updating the model’s weights.
read the caption
(a) Gradient descent step which finds the target activations for the MLP matrix.

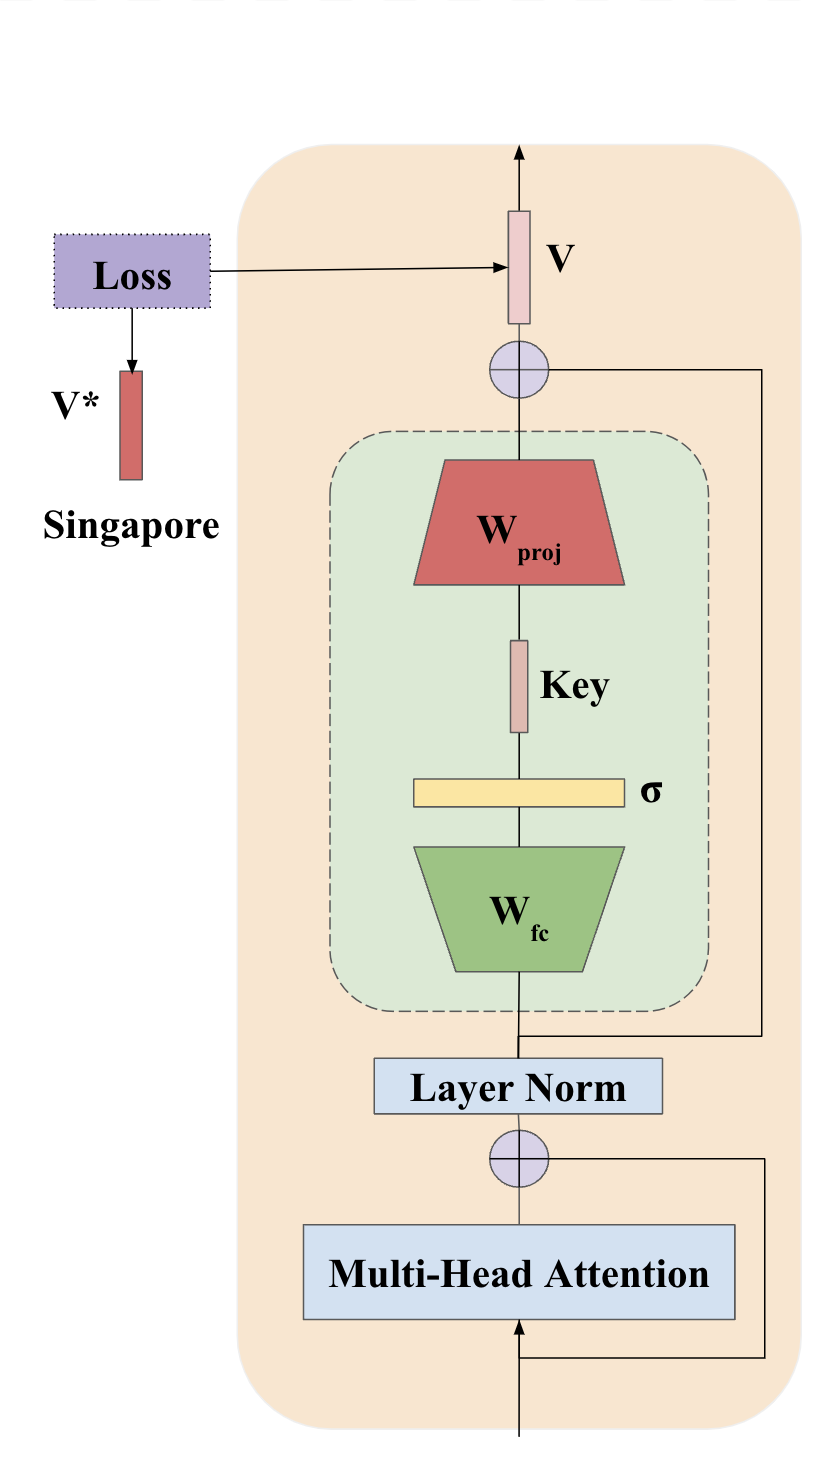
🔼 This figure shows the second step in the locate-then-edit knowledge editing method. The first step (not shown in this figure) uses gradient descent to find an ideal activation vector. This vector represents the desired output for a specific fact that is being edited into the model. In this second step, the found activation vector is used as a target. A least squares loss function is applied to update the weights (in red) of the second Multilayer Perceptron (MLP) matrix within a selected layer. The goal is to adjust the MLP weights so the model produces the target activation (and consequently the edited fact) when presented with a related query, while preserving the model’s output for other, unrelated inputs.
read the caption
(b) Target activations are used to update the second MLP matrix (in red).

🔼 This figure illustrates the two-step process of locate-then-edit knowledge editing methods. The first step uses gradient descent to find the optimal activation vector for the MLP matrix being edited. The second step updates this weight matrix using a least-squares loss function that aims to retain the outputs for unrelated contexts while producing the target activation for the edited fact.
read the caption
Figure 2: Presenting locate-then-edit knowledge editing methods as a two-step fine-tuning process.

🔼 The figure shows the continuous growth of the Frobenius norm of edited MLP matrices in the Llama-3B model during sequential knowledge editing using the MEMIT method. The x-axis represents the number of edits performed, and the y-axis represents the Frobenius norm. Different lines represent different layers within the model, illustrating how the norm increases with each sequential edit.
read the caption
(a) MEMIT

🔼 The figure shows the continuous growth of the Frobenius norm of edited multilayer perceptron (MLP) matrices in the LLama-3B model during sequential knowledge editing using the AlphaEdit method. The x-axis represents the number of edits performed, and the y-axis represents the Frobenius norm. Separate lines show the norm growth for different layers of the MLP. The graph illustrates the significant increase in the norm of the edited matrices as more edits are performed, indicating a potential issue with the AlphaEdit method.
read the caption
(b) AlphaEdit

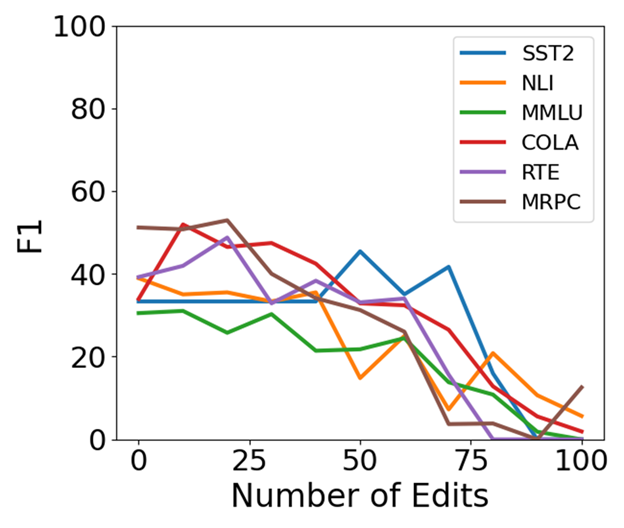
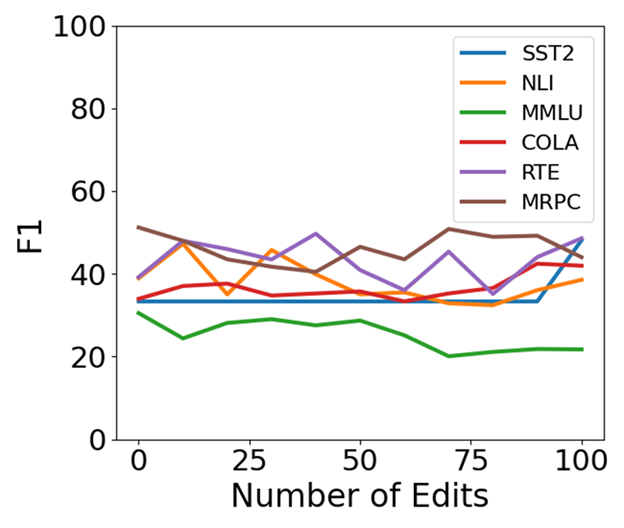
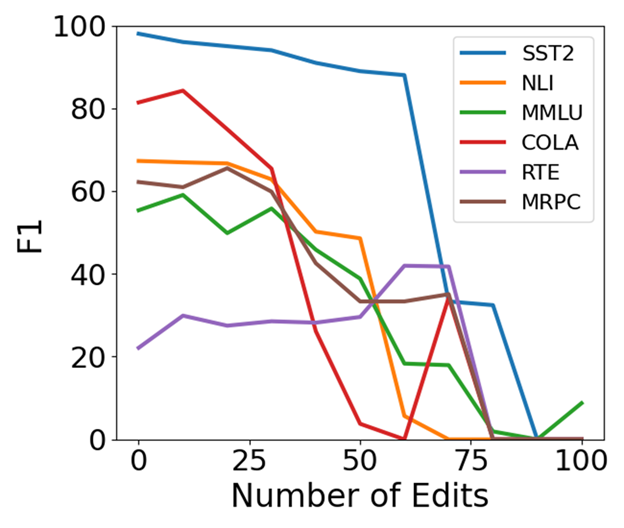
🔼 This figure shows the average downstream performance (F1 score) across six tasks (MMLU, NLI, RTE, SST2, MRPC, and CoLA) for the EMMET algorithm over 10,000 sequential edits. It illustrates the model’s performance degradation over time, demonstrating the impact of sequential knowledge editing on the overall capabilities of the language model. The x-axis represents the number of edits (in batches of 100), and the y-axis shows the average F1 score across the six tasks. Different colored lines show the performance for different model sizes (Llama2 and Llama3).
read the caption
(c) EMMET

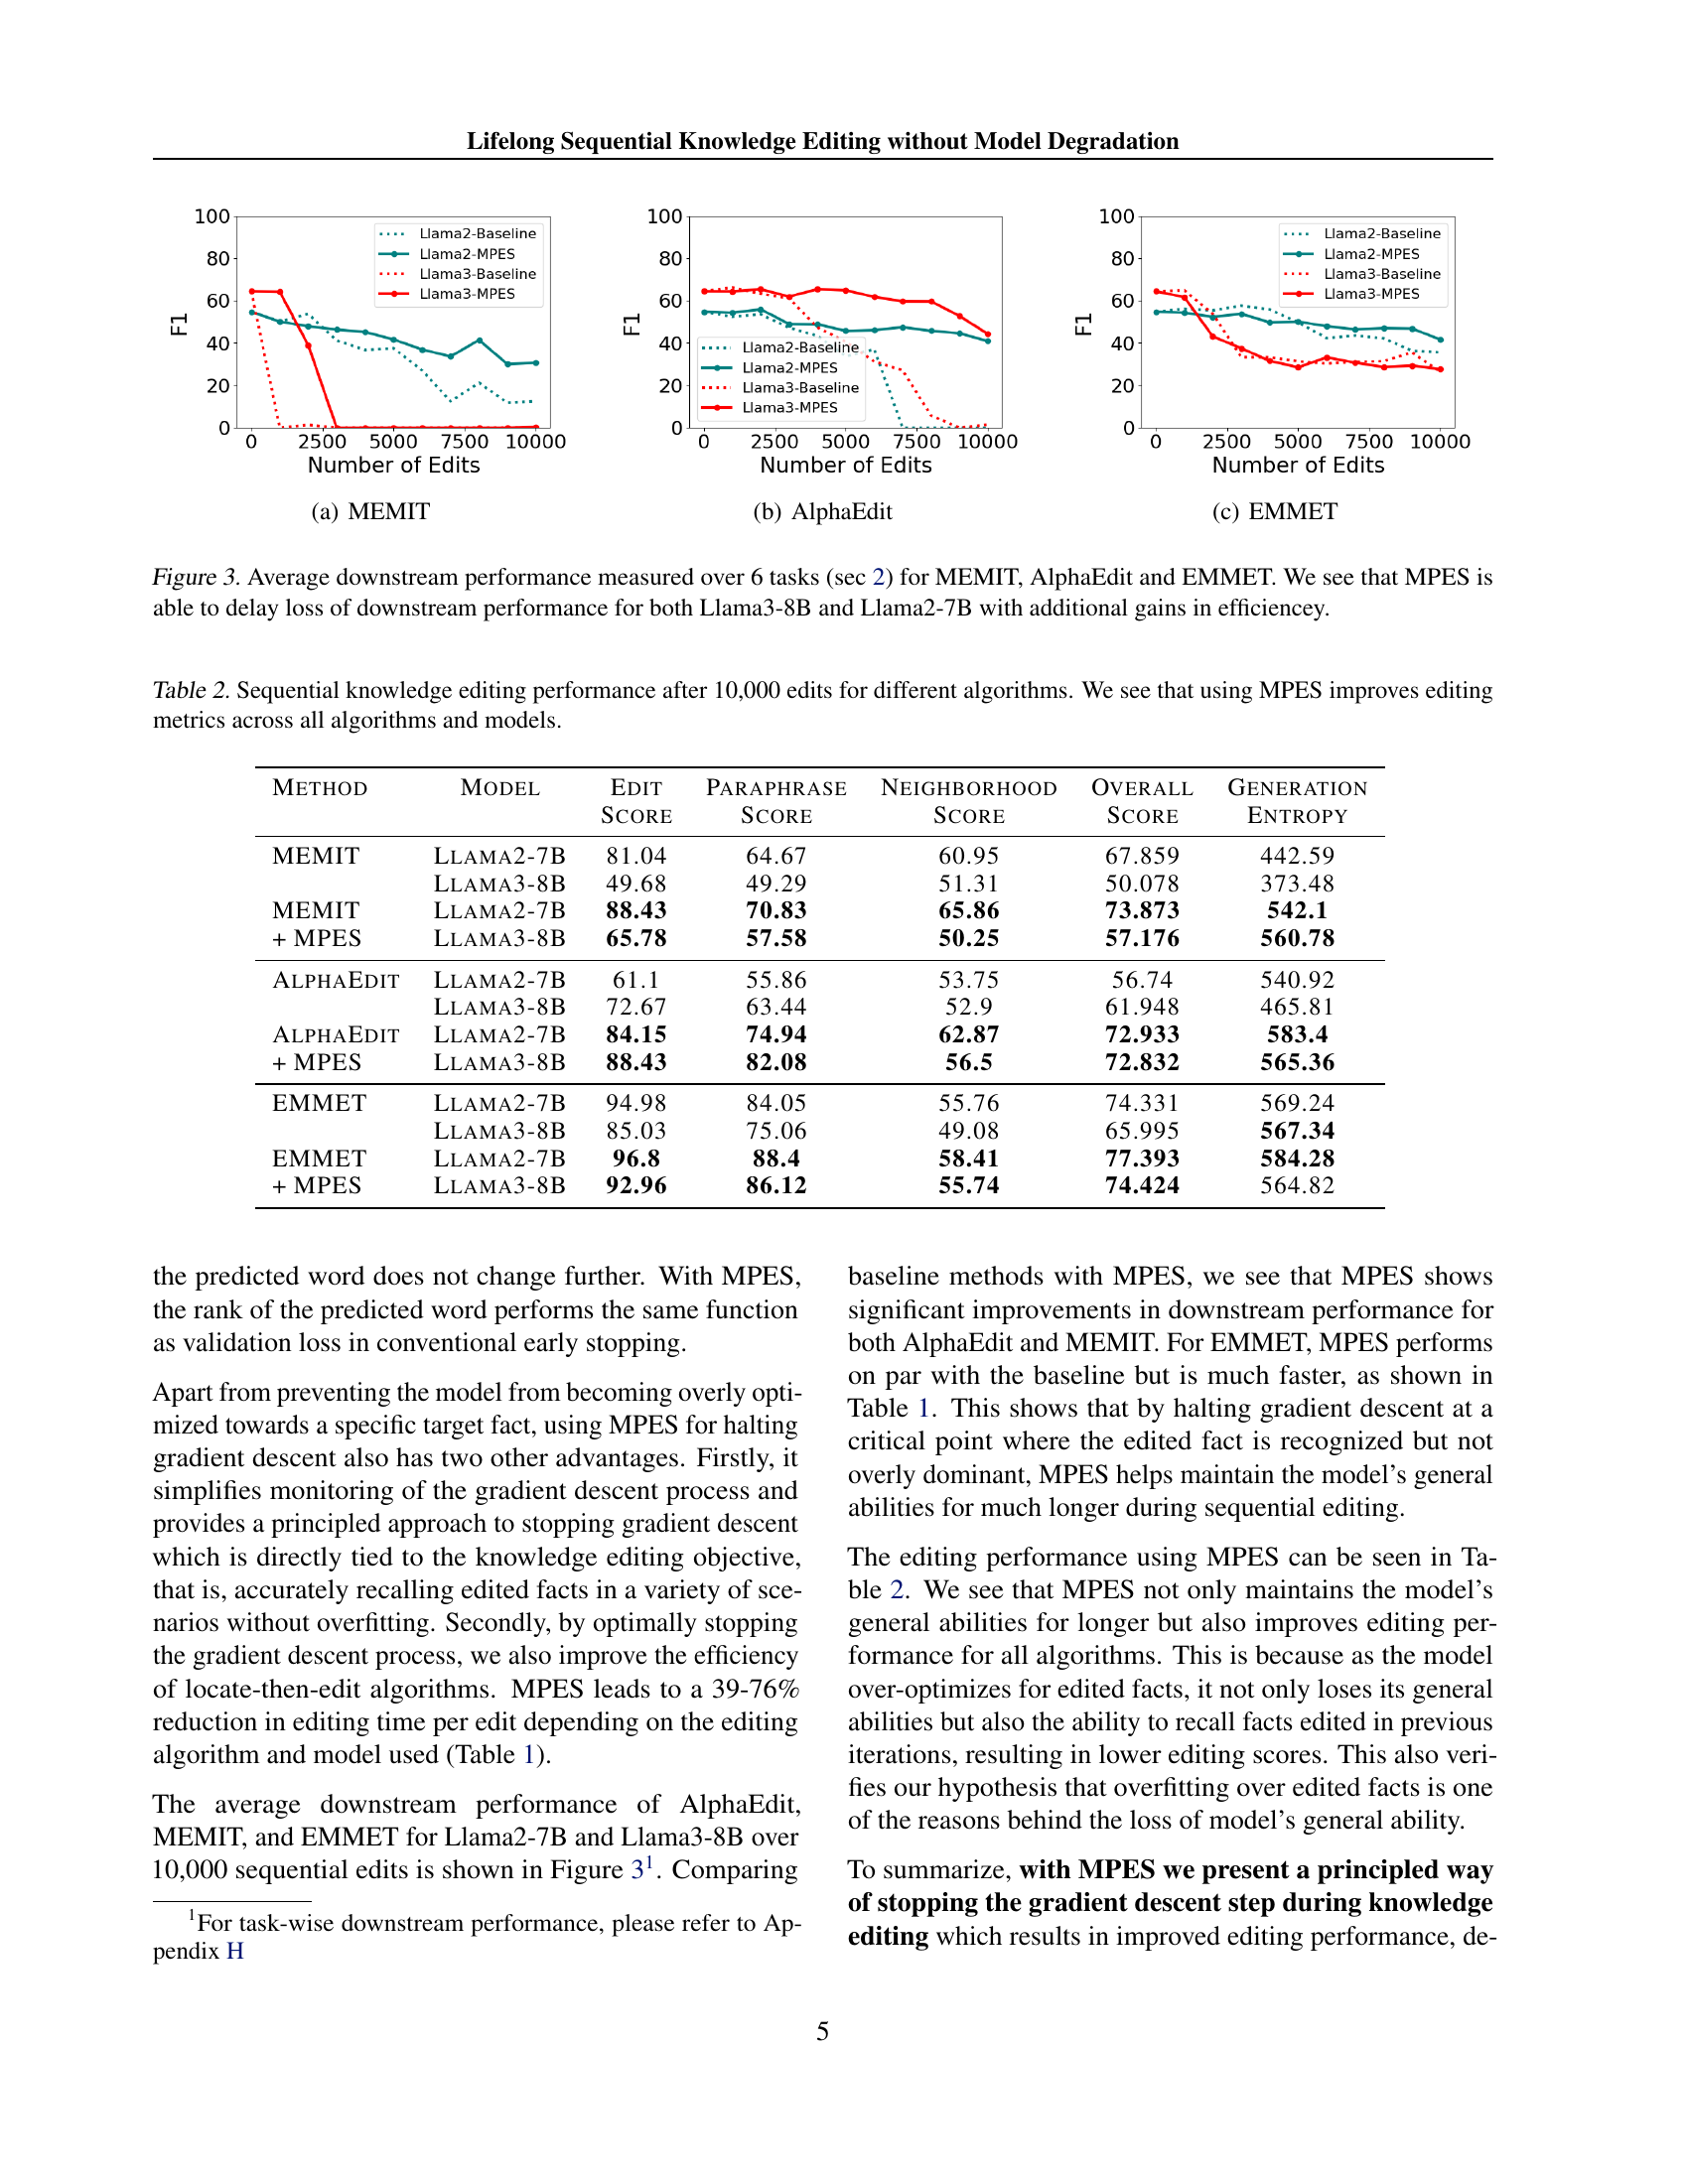
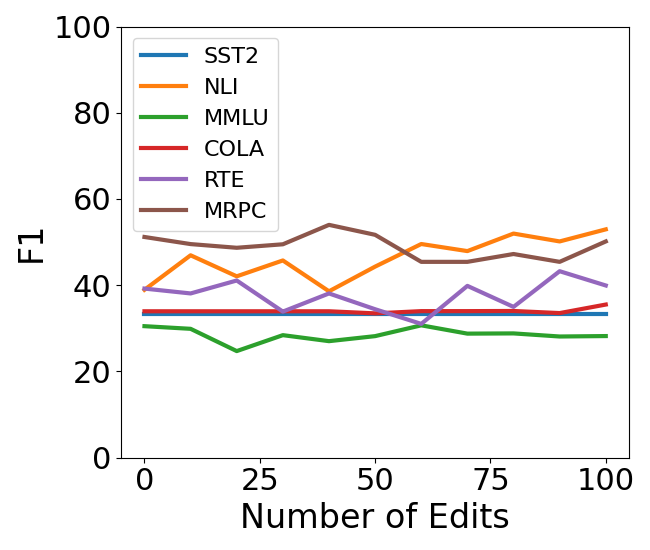
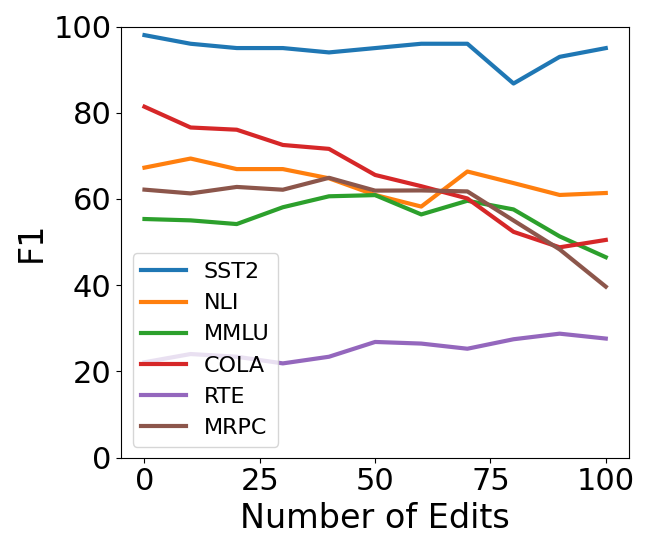
🔼 This figure displays the average performance across six downstream tasks (detailed in Section 2) for three different knowledge editing methods: MEMIT, AlphaEdit, and EMMET. Each method is tested on two different language models, Llama3-8B and Llama2-7B, with and without the Most-Probable Early Stopping (MPES) technique. The x-axis represents the number of edits performed, and the y-axis shows the F1 score, a common metric for evaluating model performance. The graph illustrates how the MPES technique helps mitigate the performance degradation typically observed with sequential knowledge editing, especially over a larger number of edits. This is shown by a slower decline in the F1 score for methods that utilize MPES.
read the caption
Figure 3: Average downstream performance measured over 6 tasks (sec 2) for MEMIT, AlphaEdit and EMMET. We see that MPES is able to delay loss of downstream performance for both Llama3-8B and Llama2-7B with additional gains in efficiencey.

🔼 The figure shows the Frobenius norm of edited MLP matrices in Llama-3-8B during sequential knowledge editing using AlphaEdit. It illustrates the disproportionate growth of the norm in the edited layers (4-8) as the number of edits increases, highlighting a key finding about the inner workings of locate-then-edit methods discussed in the paper.
read the caption
(a) Alphaedit (Llama3-8B)

🔼 The figure shows the continuous growth of the Frobenius norm of edited MLP matrices in the Llama3-8B model during sequential knowledge editing using the MEMIT method. The x-axis represents the number of edits performed, and the y-axis represents the Frobenius norm. The graph displays a clear upward trend for all layers (4-8), indicating that the norm consistently increases as more edits are performed.
read the caption
(b) MEMIT (Llama3-8B)

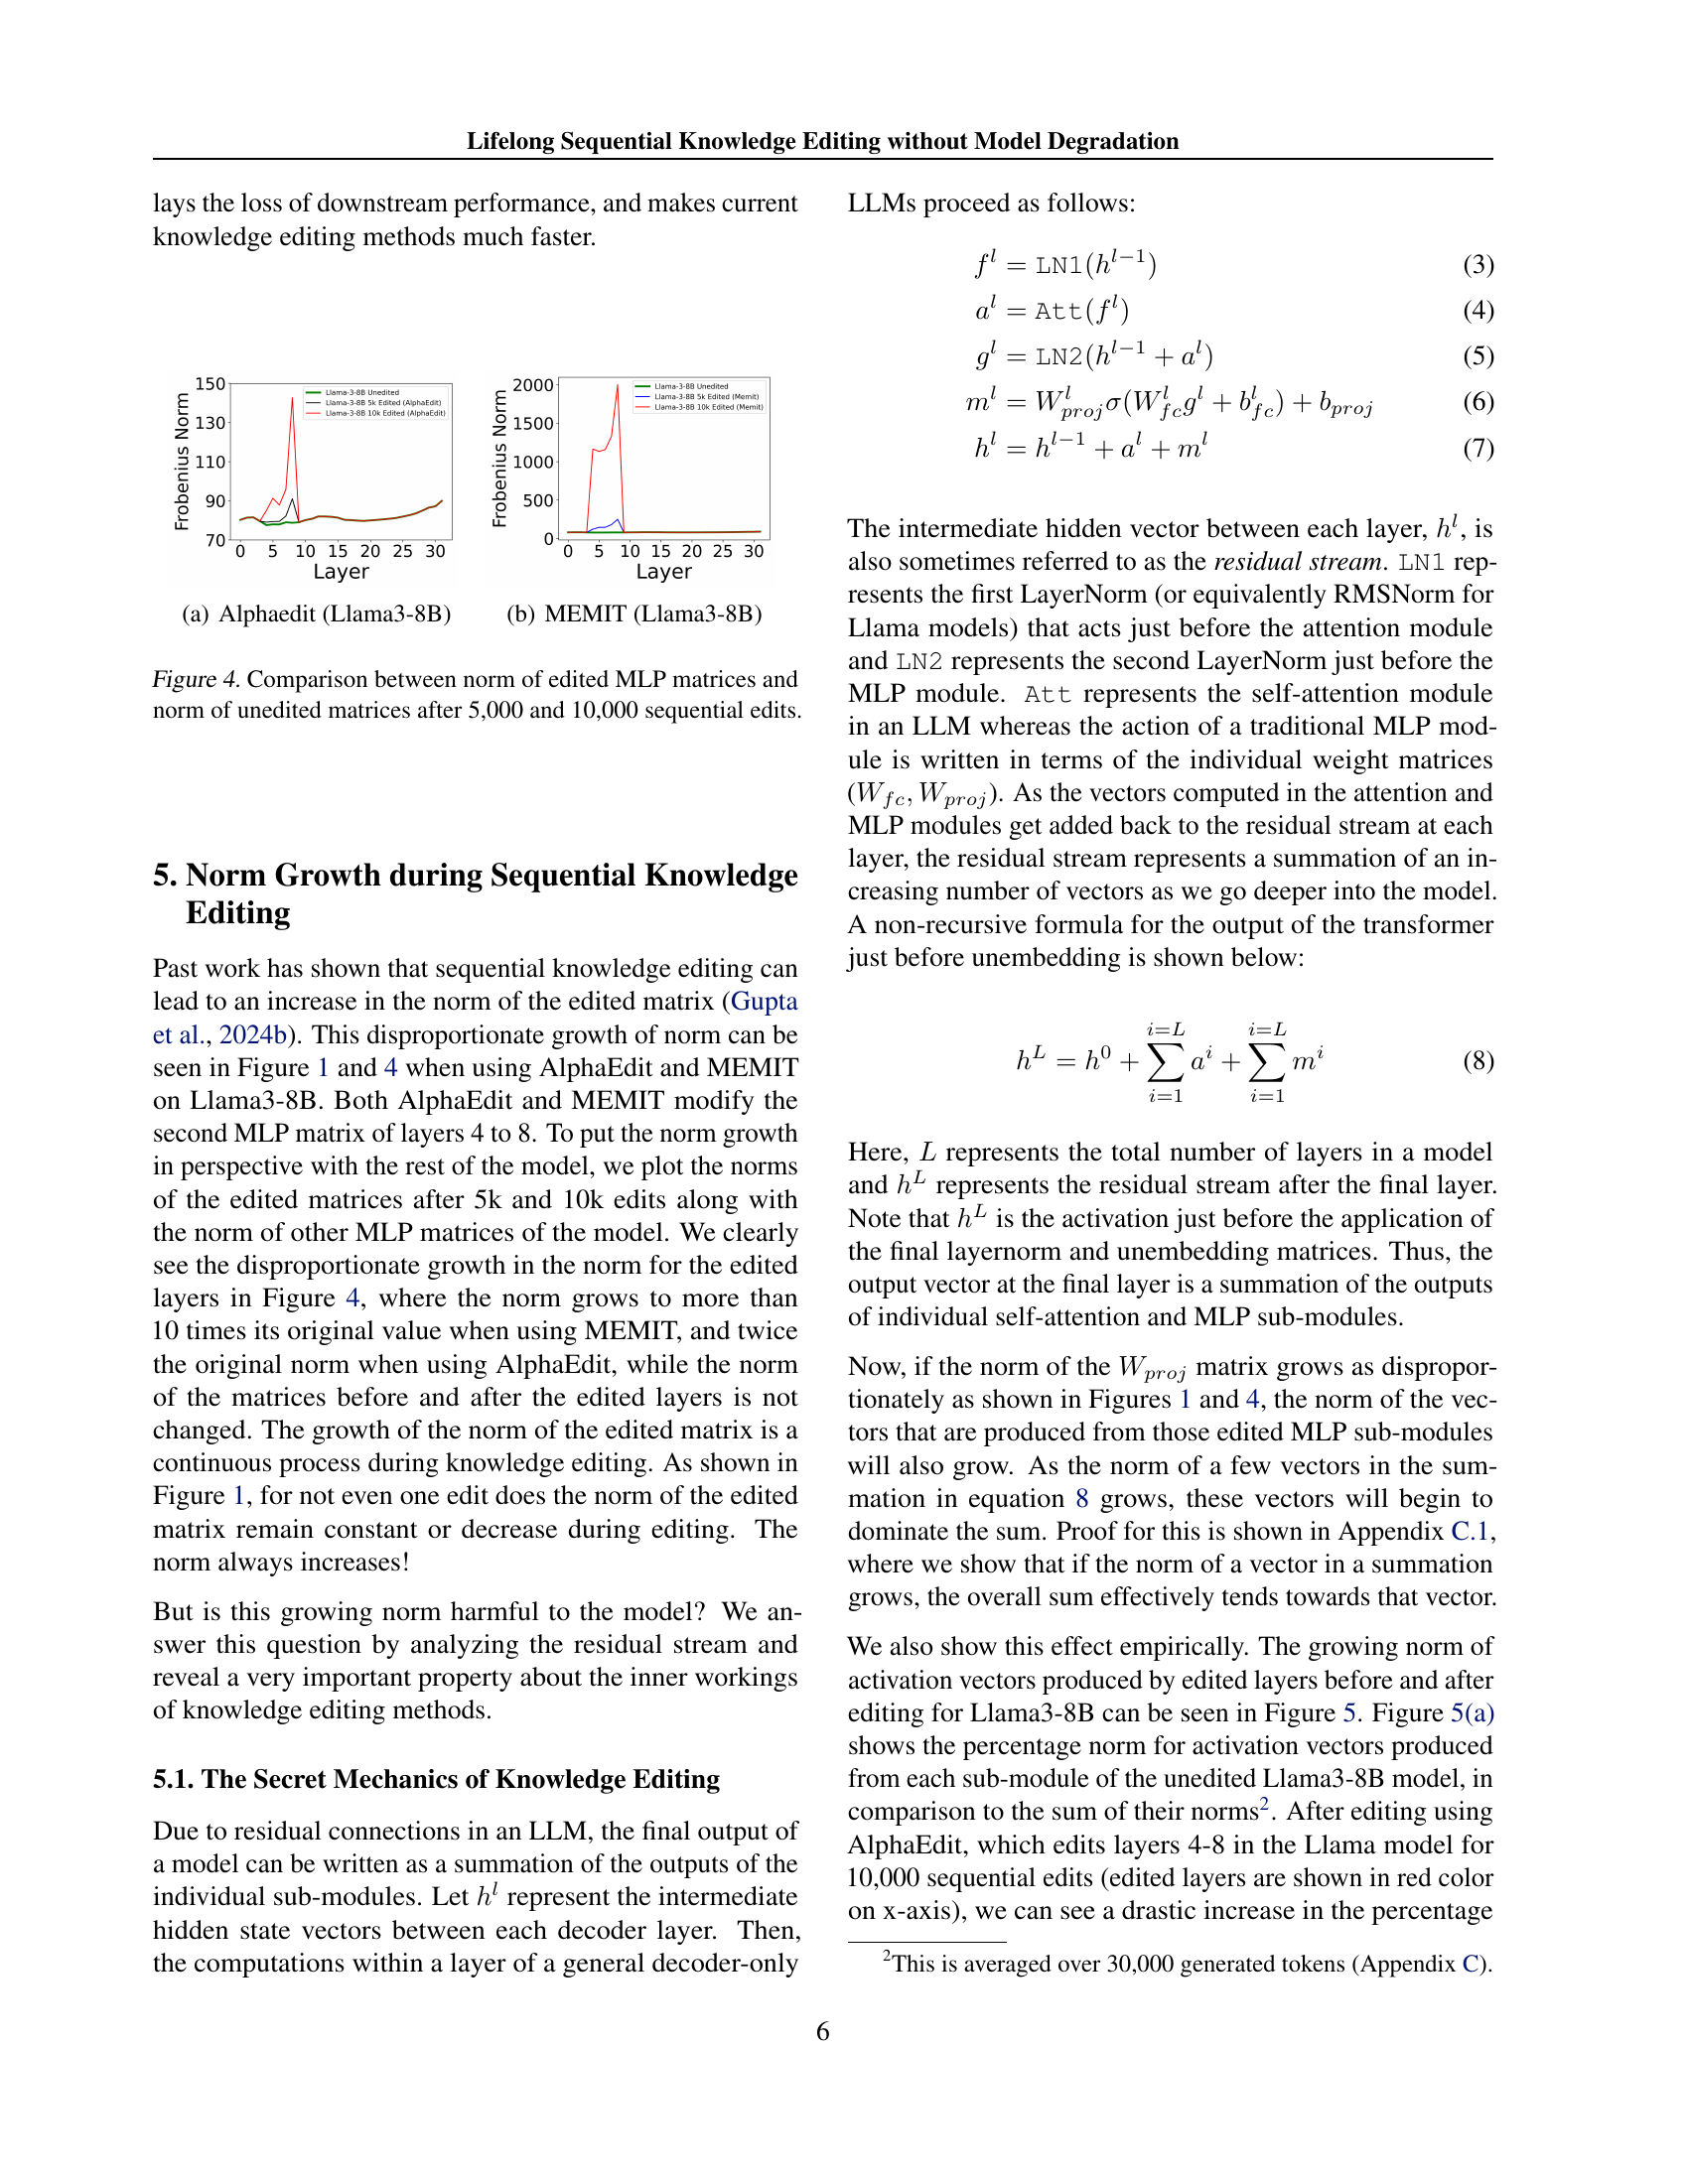
🔼 This figure compares the Frobenius norm (a matrix norm) of the edited MLP (Multilayer Perceptron) matrices against the unedited MLP matrices, after 5,000 and 10,000 sequential edits using AlphaEdit and MEMIT methods. It visualizes the disproportionate growth of the norm for the edited layers compared to the rest of the model, highlighting the norm increase over 10 times its original value for MEMIT and twice for AlphaEdit. This disproportionate growth indicates the ‘importance hacking’ effect described in the paper, where the output from edited layers becomes overly dominant in the model’s output.
read the caption
Figure 4: Comparison between norm of edited MLP matrices and norm of unedited matrices after 5,000 and 10,000 sequential edits.

🔼 This figure shows the proportional contribution of the activation vectors generated from each sub-module of the unedited Llama3-8B model to the overall residual stream. It visualizes the relative influence of different model components (e.g., input, self-attention, MLP layers) on the final model output before any knowledge editing takes place. The proportion of contribution is represented as the average norm ratio for each layer type.
read the caption
(a) Average Norm Proportion For Unedited Llama3-8B

🔼 The figure shows the proportion of the contribution of activation vectors produced from each sub-module to the residual stream for Llama3-8B after applying AlphaEdit. The edited layers are highlighted in red. The figure demonstrates how the influence of the output of edited layers grows dramatically after continuous editing, showing that the edited layers’ contributions become disproportionately larger compared to other parts of the model.
read the caption
(b) Average Norm Proportion for Llama3-8B using Alphaedit

🔼 This figure shows the proportion of the total activation vector norm that comes from each layer in the Llama-3-8B model after applying 10,000 sequential edits using the MEMIT algorithm. The x-axis represents different layer types (e.g., input embeddings, attention, MLP), and the y-axis shows the proportion of the total norm contributed by each layer type. The figure visually demonstrates the disproportionate contribution of the edited layers (highlighted in red) to the model’s output after sequential edits, indicating that these layers have an increased influence compared to other layers. This is a visual representation of the ‘importance hacking’ phenomenon discussed in the paper.
read the caption
(c) Average Norm Proportion for Llama3-8B using MEMIT

🔼 This figure displays the proportion of the total activation vector norm contributed by each layer type in the Llama3-8B model after undergoing 10,000 sequential knowledge edits using the ENCORE method. It visually represents how the influence of different layer types on the final model output changes due to the application of ENCORE. It helps to demonstrate ENCORE’s impact on the activation norms and the distribution of influence across the layers of the model.
read the caption
(d) Average Norm Proportion for Llama3-8B using ENCORE

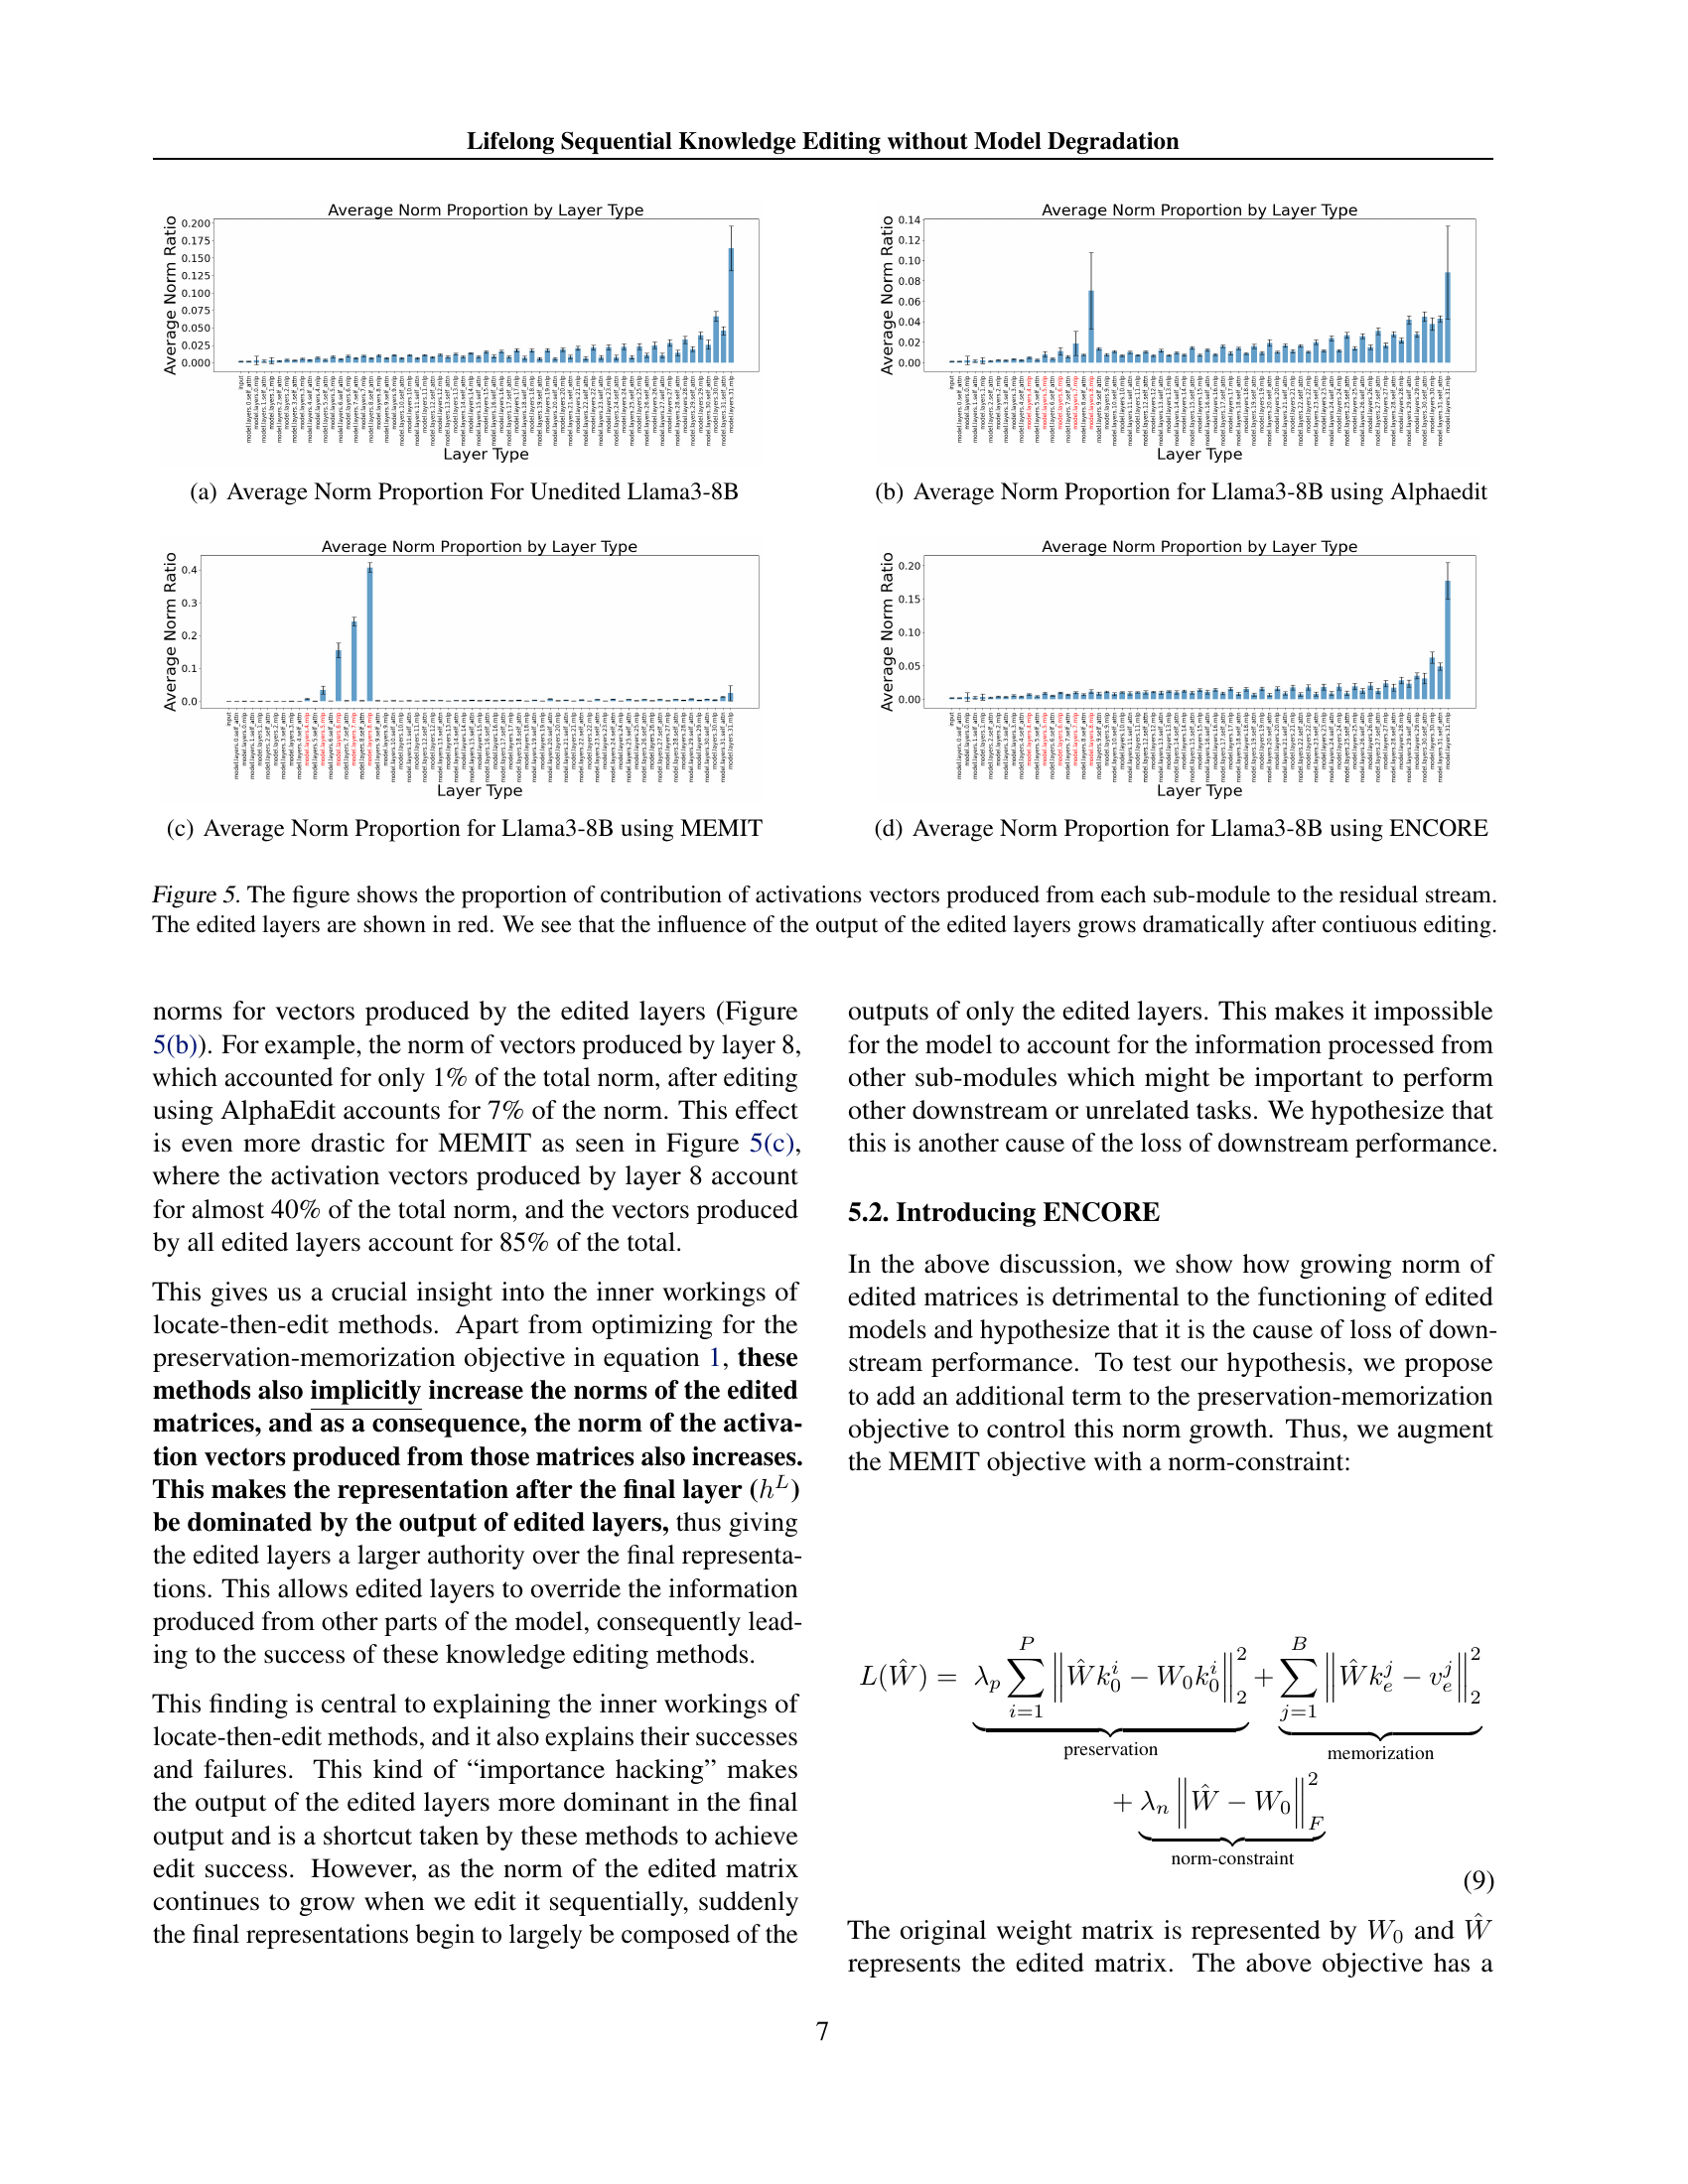
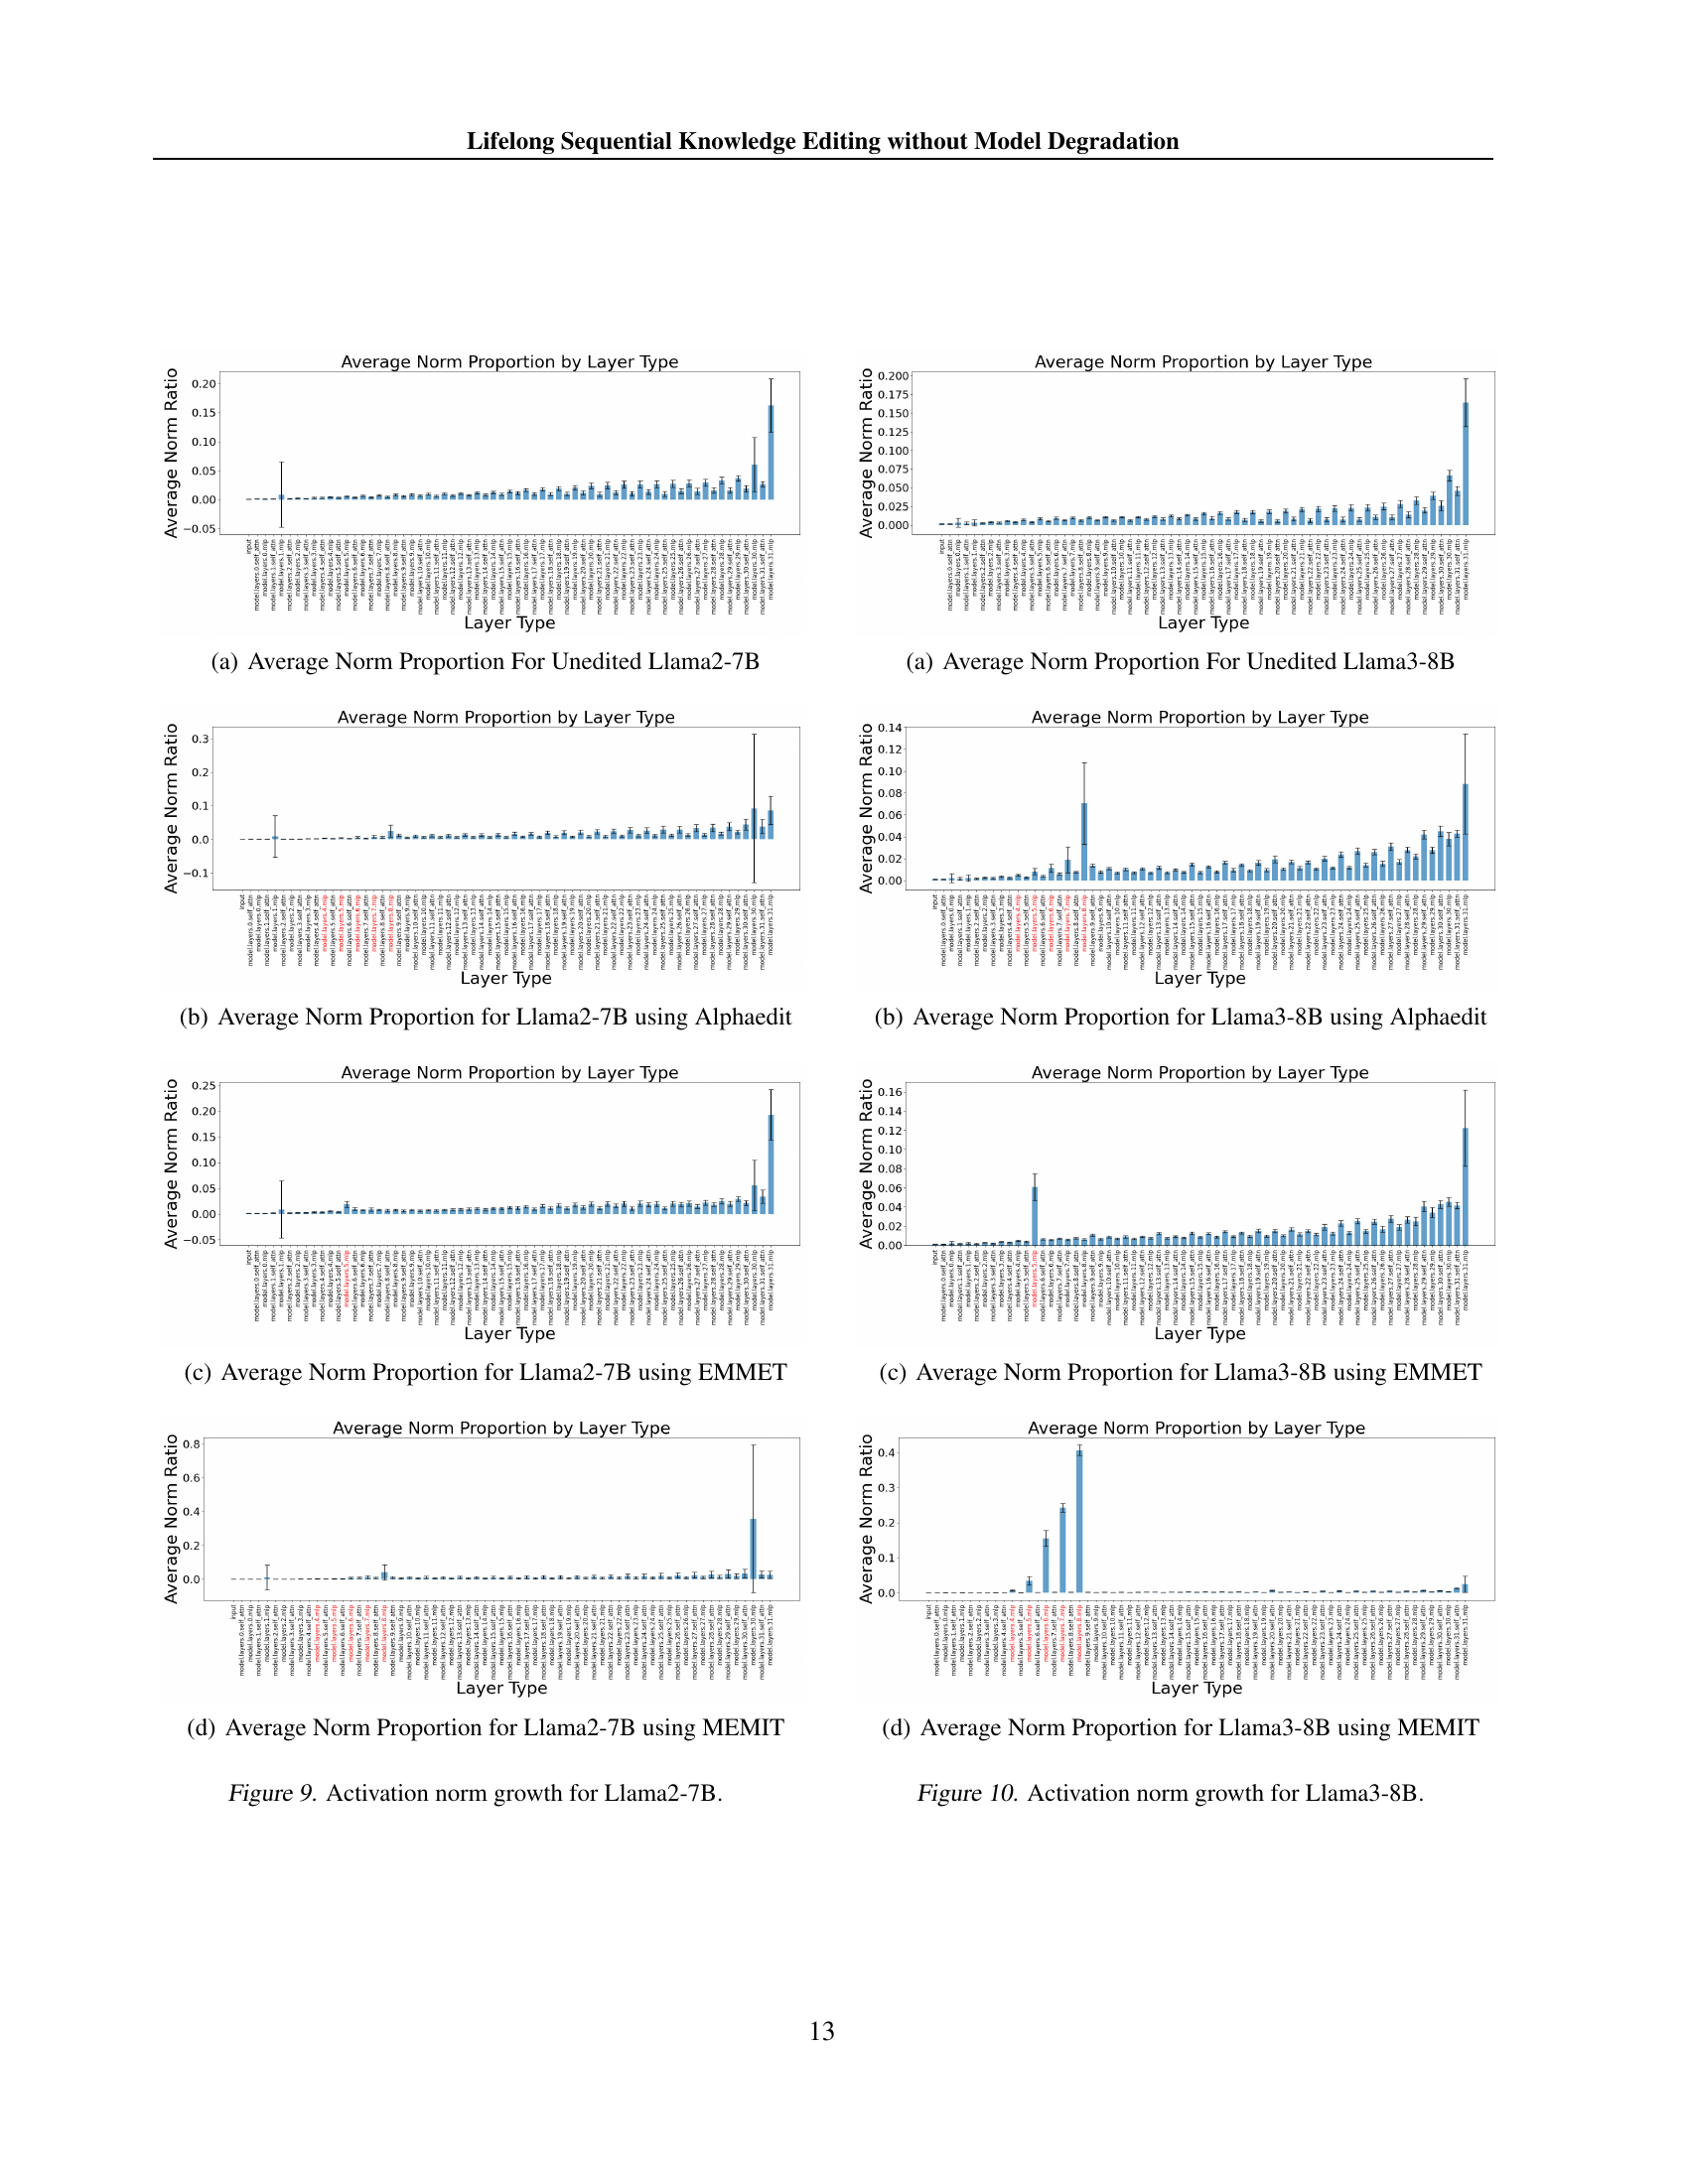
🔼 This figure visualizes the impact of continuous knowledge editing on the model’s internal activation flow. It compares the proportion of each layer’s contribution to the residual stream (the cumulative activation signal) before and after editing. Specifically, it highlights how the proportion of activation from the edited layers (shown in red) increases significantly after multiple edits, indicating that the output of the edited layers dominates the model’s final output. This illustrates the phenomenon of ‘importance hacking’, where the model relies disproportionately on the edited layers to generate the output, potentially compromising its overall performance. The magnitude of increase is shown separately for different editing methods.
read the caption
Figure 5: The figure shows the proportion of contribution of activations vectors produced from each sub-module to the residual stream. The edited layers are shown in red. We see that the influence of the output of the edited layers grows dramatically after contiuous editing.

🔼 This figure shows the average downstream performance across six tasks (MMLU, NLI, RTE, SST2, MRPC, CoLA) for the Llama 2-7B model over 10,000 sequential edits using different algorithms. It illustrates how the model’s performance on these downstream tasks changes as more and more edits are sequentially applied to the model, specifically highlighting the impact of different knowledge editing methods on long-term performance.
read the caption
(a) Llama2-7B

🔼 The figure shows the Frobenius norm of the edited MLP matrices in Llama3-8B during sequential knowledge editing using AlphaEdit. The x-axis represents the layer number, and the y-axis represents the Frobenius norm. The different colored lines represent different numbers of edits (0, 5000, and 10000). The figure demonstrates the significant growth of the norm in the edited layers (layers 4-8) as more edits are performed. This disproportionate norm growth is a key observation in the paper and contributes to the model’s performance degradation during lifelong sequential knowledge editing.
read the caption
(b) Llama3-8B

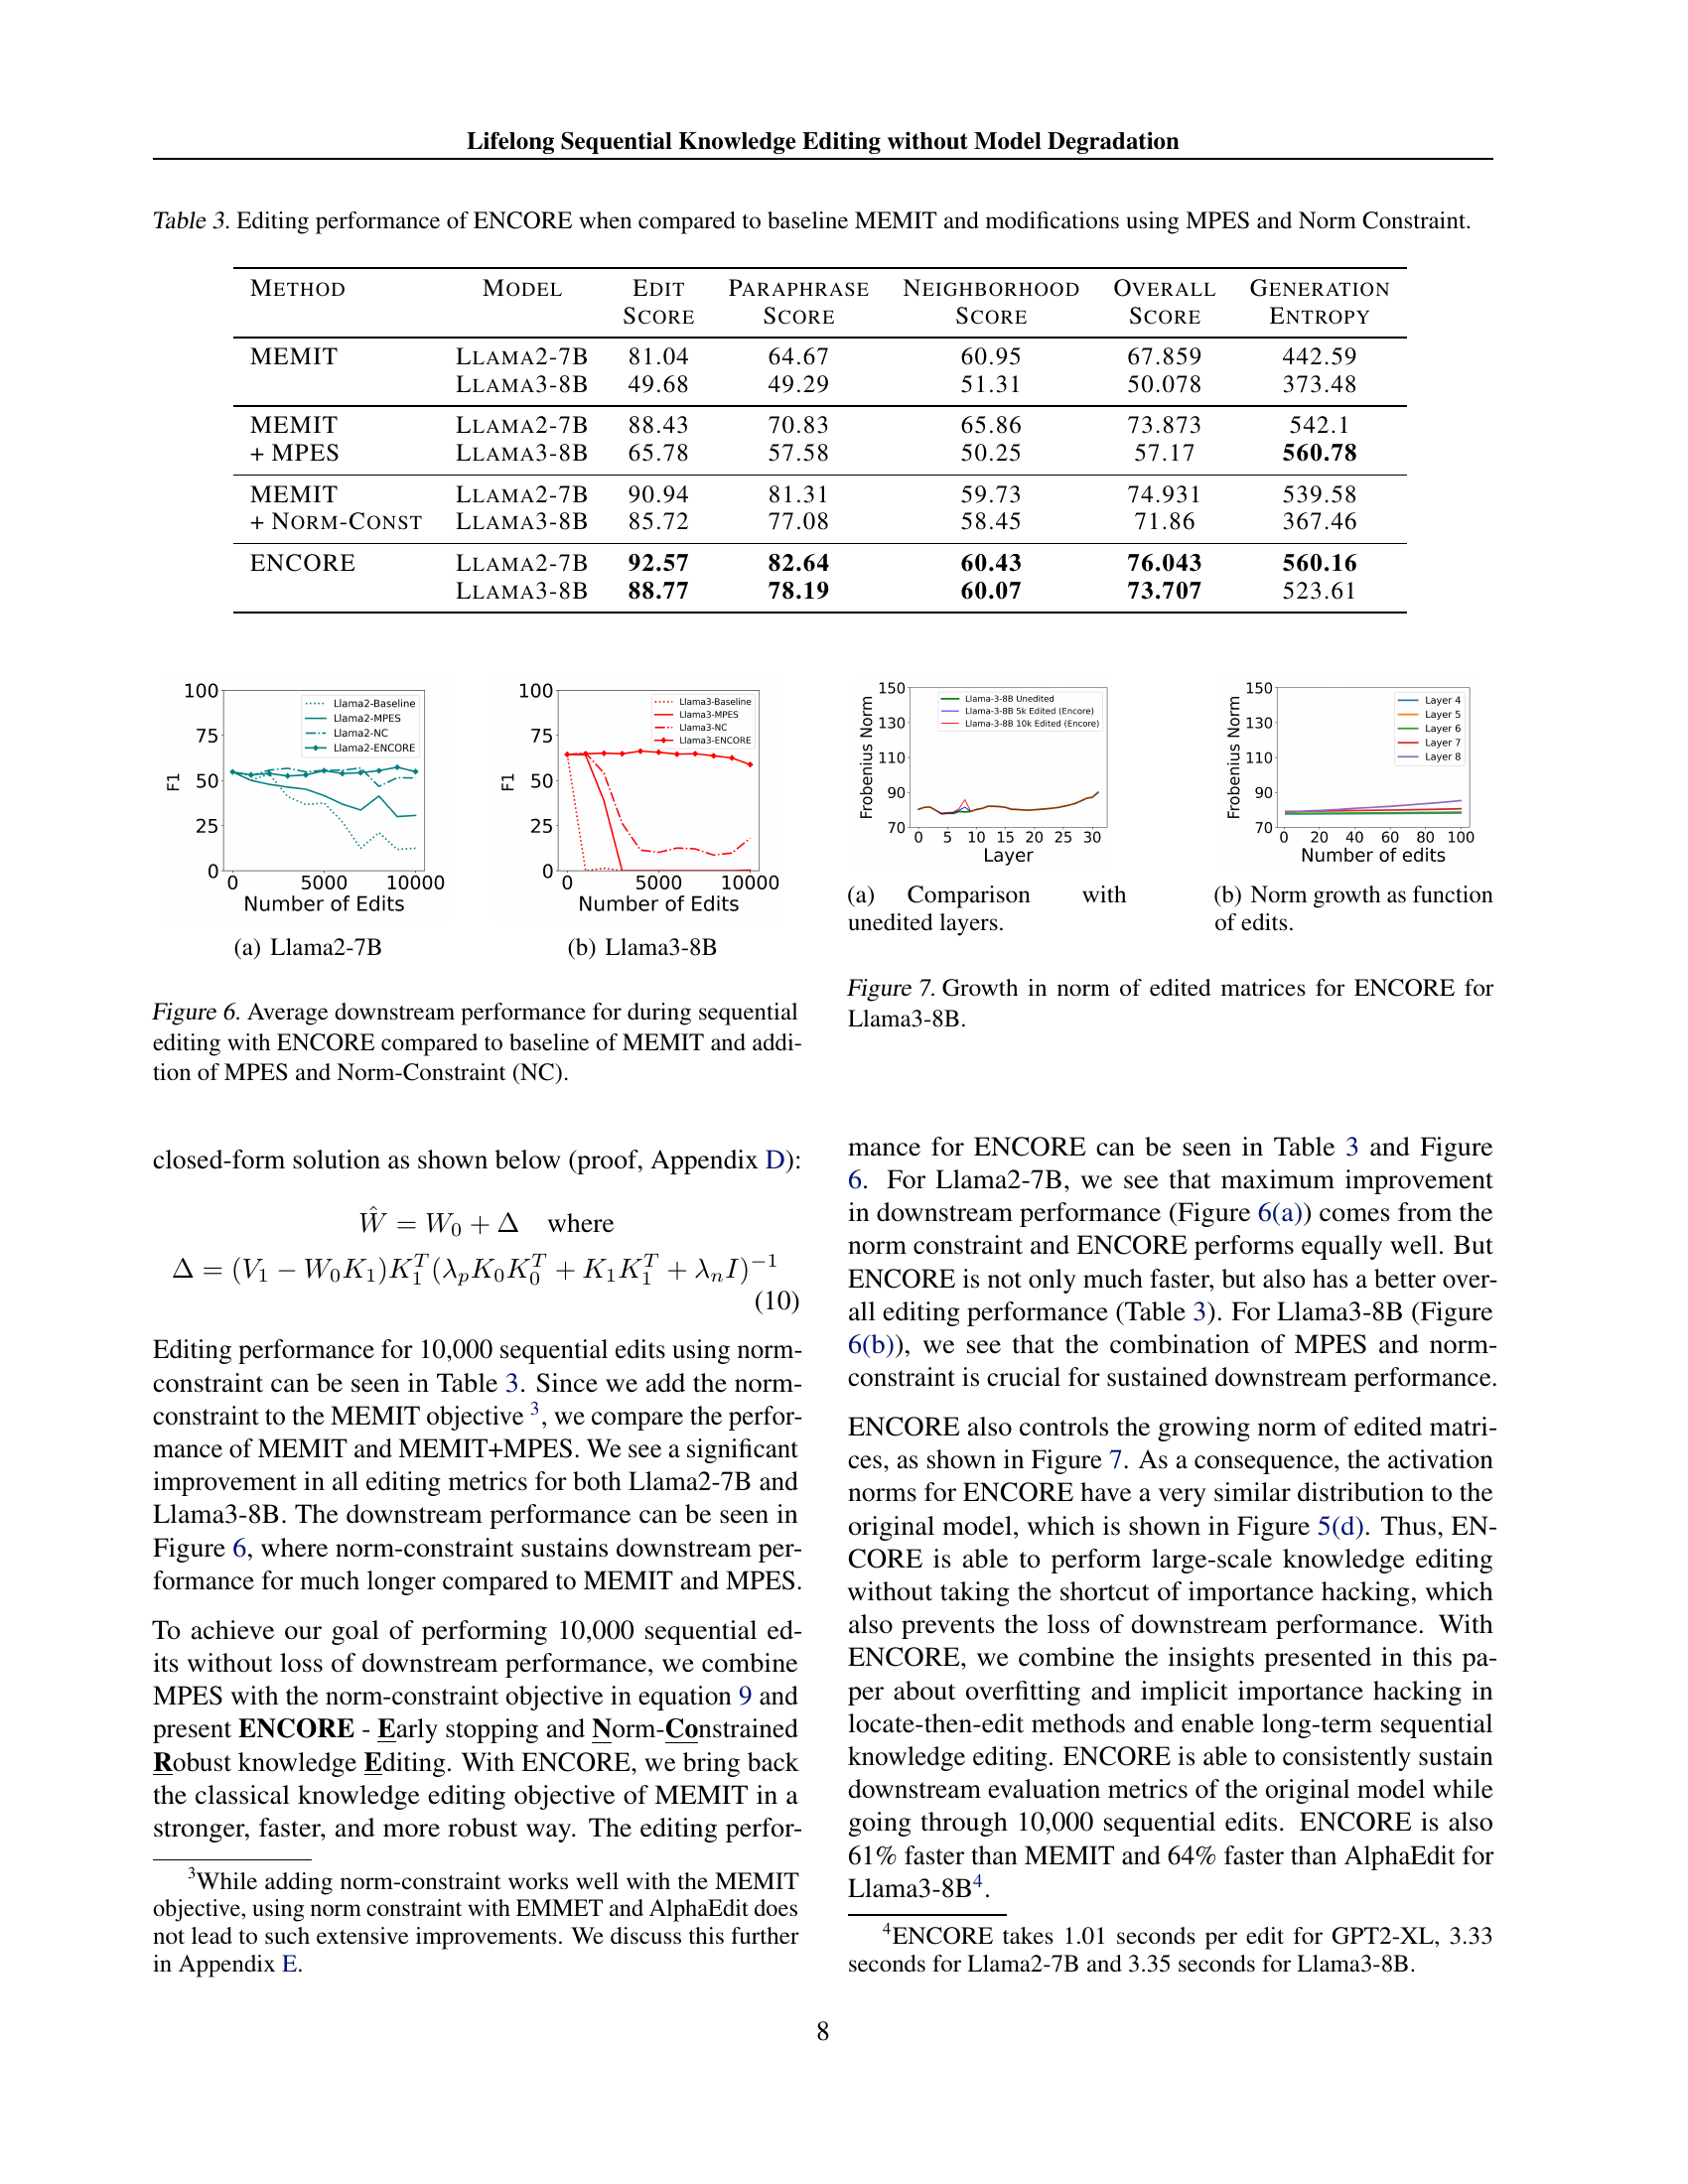
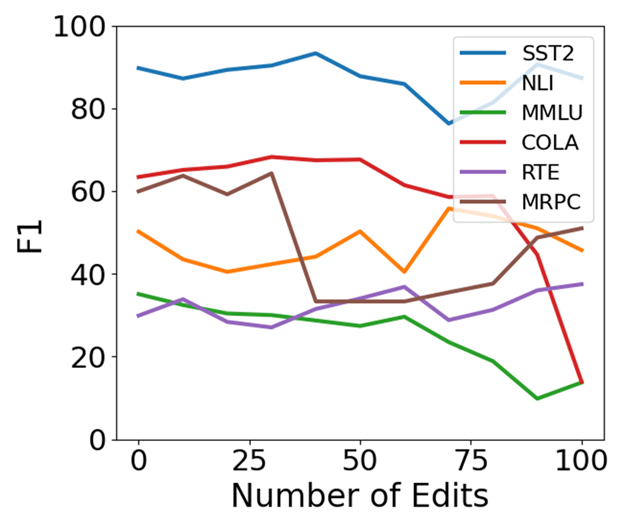
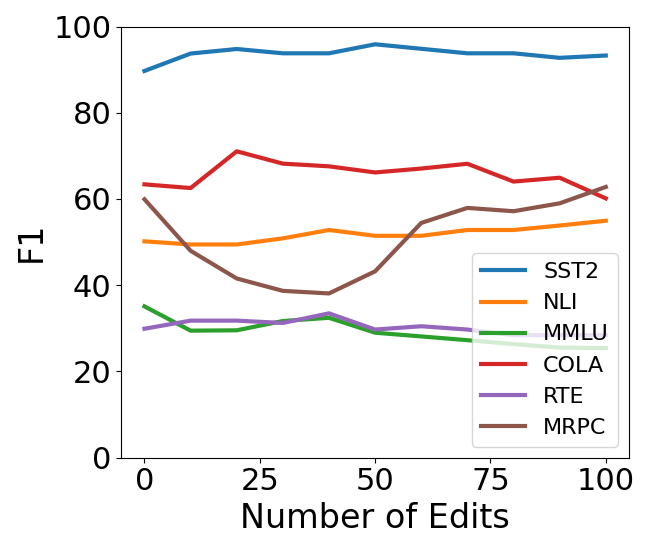
🔼 This figure displays the average performance across six downstream tasks (MMLU, NLI, RTE, SST2, MRPC, CoLA) for Llama 2-7B and Llama 3-8B language models after undergoing 10,000 sequential knowledge editing operations. It compares the performance of four different methods: a baseline MEMIT approach, MEMIT enhanced with Most-Probable Early Stopping (MPES), MEMIT with a Norm Constraint, and ENCORE (which incorporates both MPES and a norm constraint). The x-axis represents the cumulative number of edits, while the y-axis shows the average F1 score across the six downstream tasks. The graph illustrates how ENCORE maintains consistent downstream performance even after numerous edits, outperforming the other methods, highlighting the effectiveness of the combined techniques of MPES and norm constraint in preventing performance degradation during extensive sequential knowledge editing.
read the caption
Figure 6: Average downstream performance for during sequential editing with ENCORE compared to baseline of MEMIT and addition of MPES and Norm-Constraint (NC).

🔼 This figure shows a comparison of the Frobenius norm of the edited MLP matrices (layers 4-8) with the unedited MLP matrices in the Llama-3B model after 5,000 and 10,000 sequential edits using AlphaEdit and MEMIT. The plot visually demonstrates the significant increase in the norm of the edited matrices compared to other layers. It highlights the disproportionate growth that occurs with sequential editing, particularly for MEMIT.
read the caption
(a) Comparison with unedited layers.

🔼 This figure shows how the Frobenius norm of the edited weight matrices changes as the number of sequential edits increases. It provides a visual representation of the ’norm growth’ phenomenon discussed in the paper, where the norm of the edited matrices increases disproportionately with each sequential edit, potentially contributing to model degradation.
read the caption
(b) Norm growth as function of edits.

🔼 This figure visualizes the growth of the Frobenius norm of edited MLP matrices in the Llama3-8B model during sequential knowledge editing using the ENCORE method. It demonstrates that ENCORE effectively controls the growth of these norms, unlike other methods that show a large disproportionate increase. The left panel displays a comparison of norms across all layers of both unedited and edited models (after 5,000 and 10,000 edits). The right panel shows the growth in the norm of the edited matrices as a function of the number of edits performed. This illustrates ENCORE’s ability to maintain reasonable norm levels even after a significant number of edits.
read the caption
Figure 7: Growth in norm of edited matrices for ENCORE for Llama3-8B.

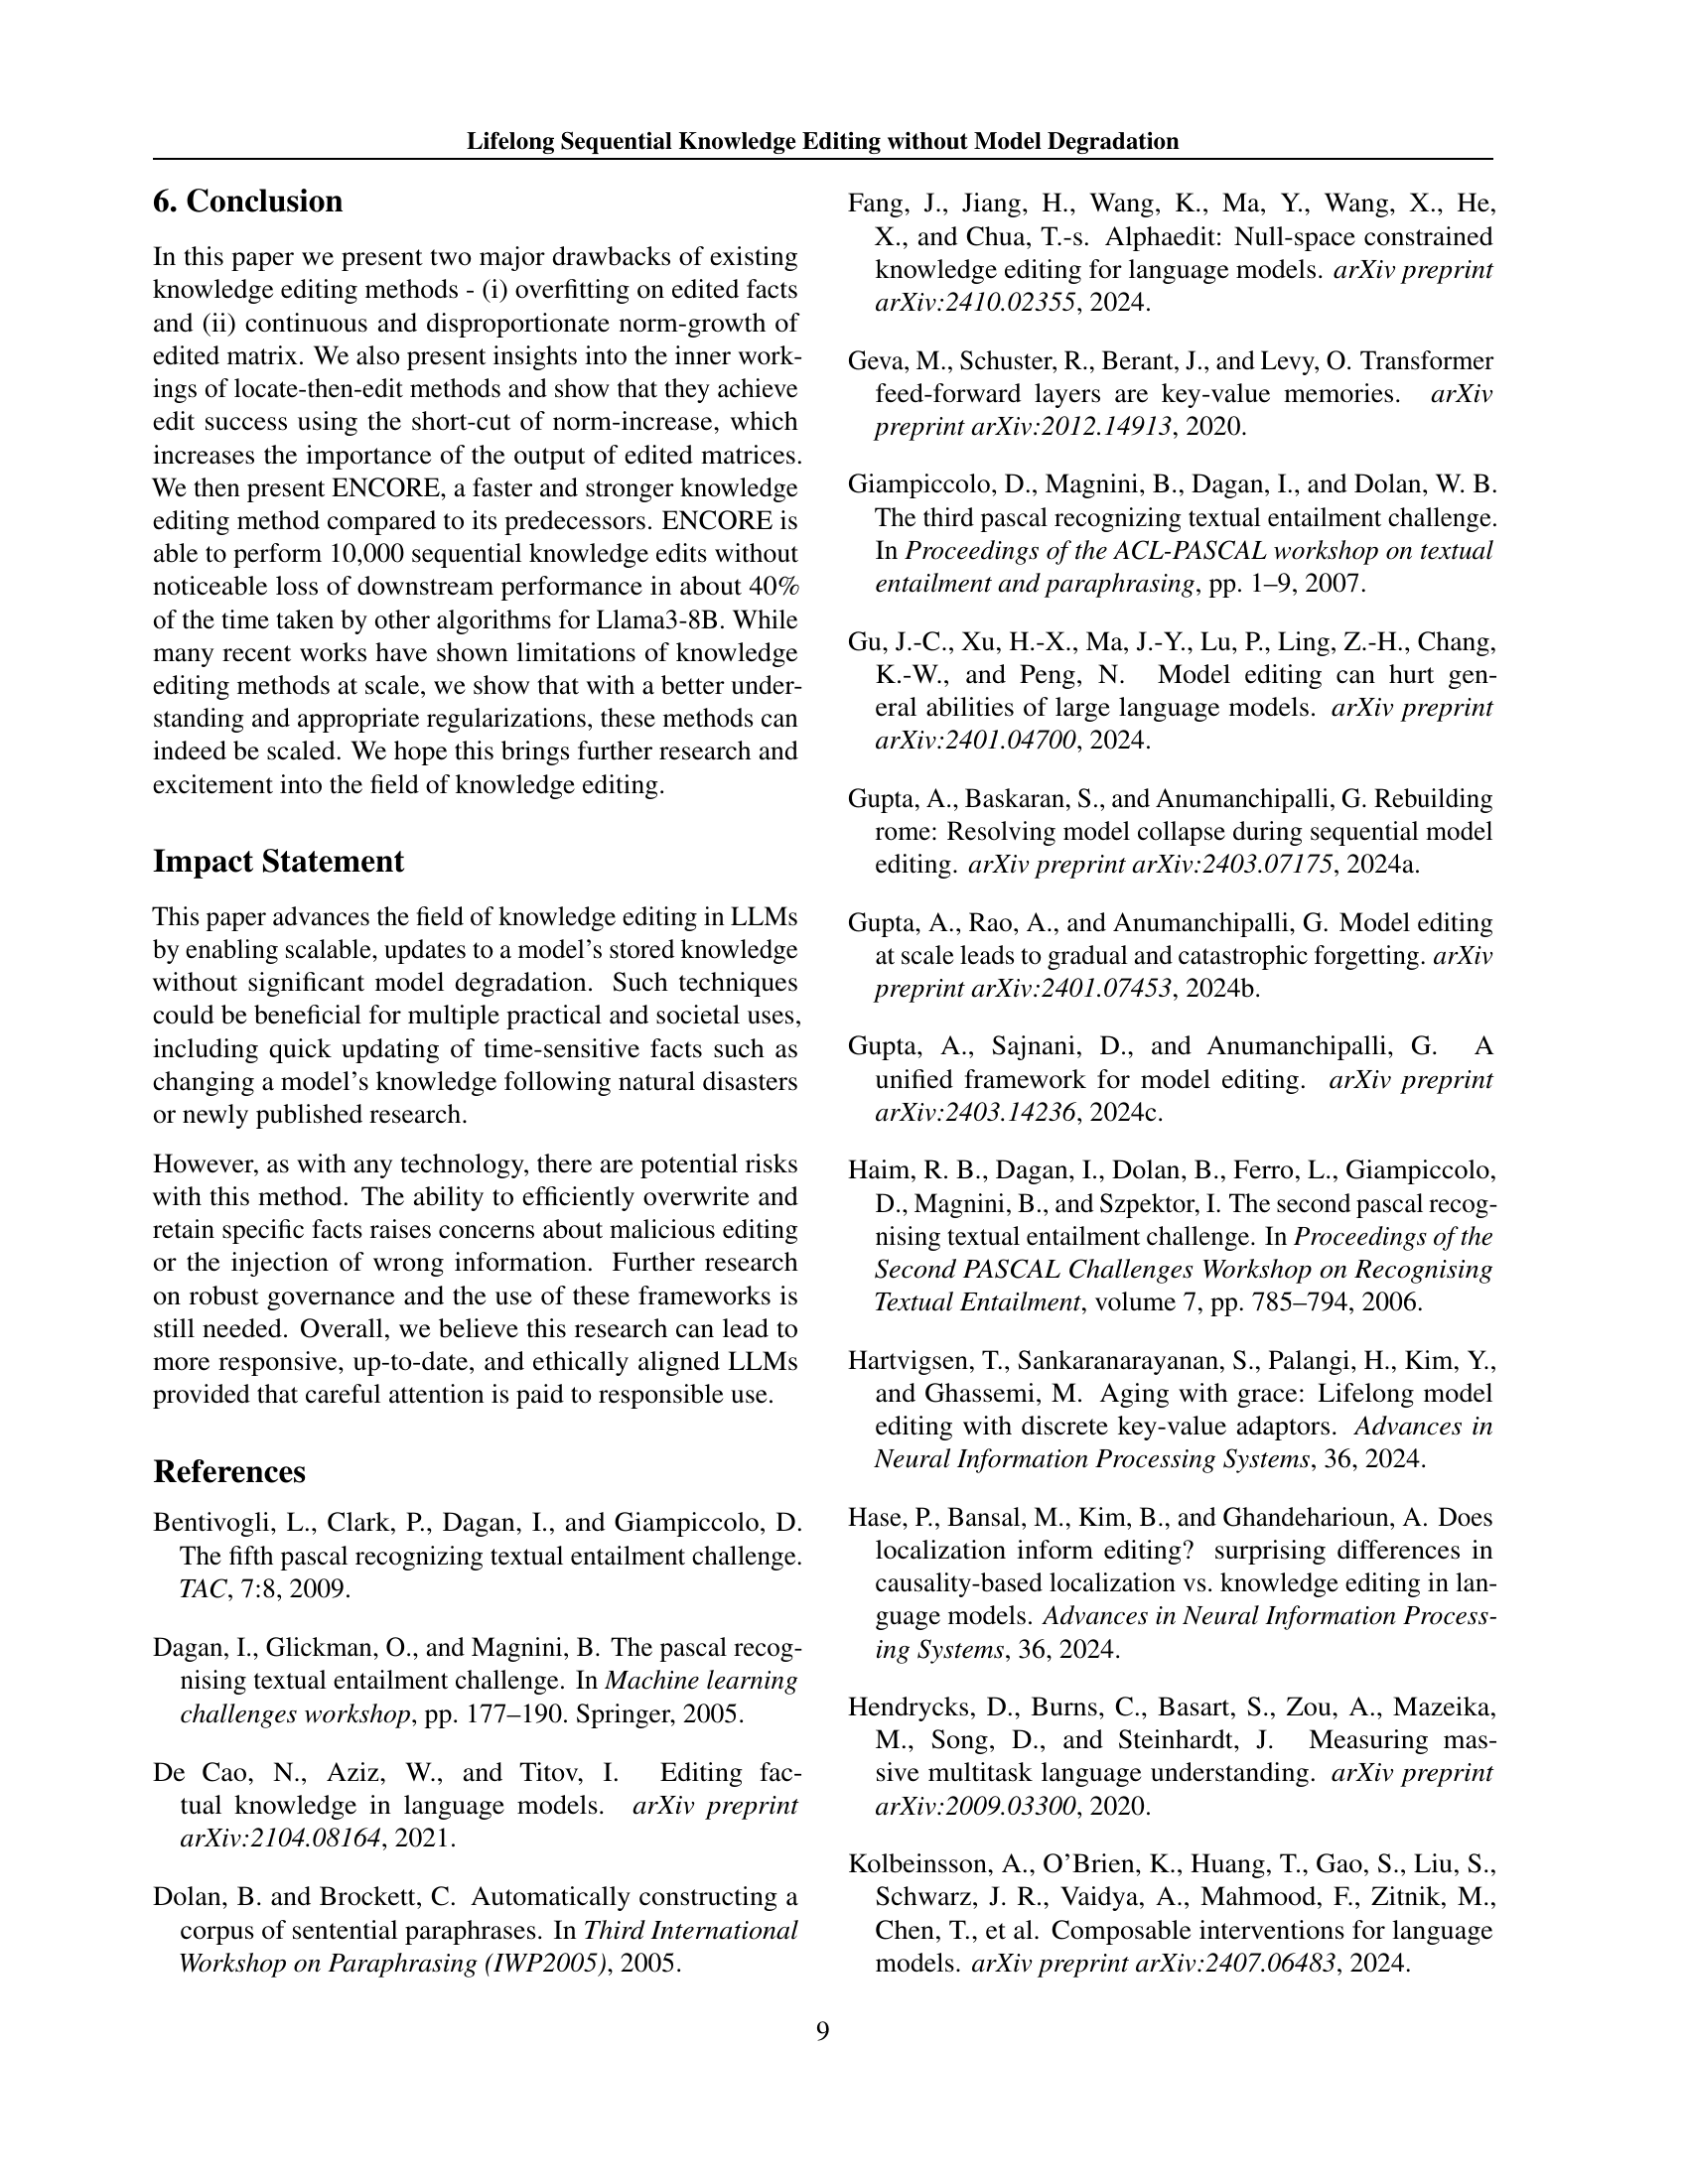
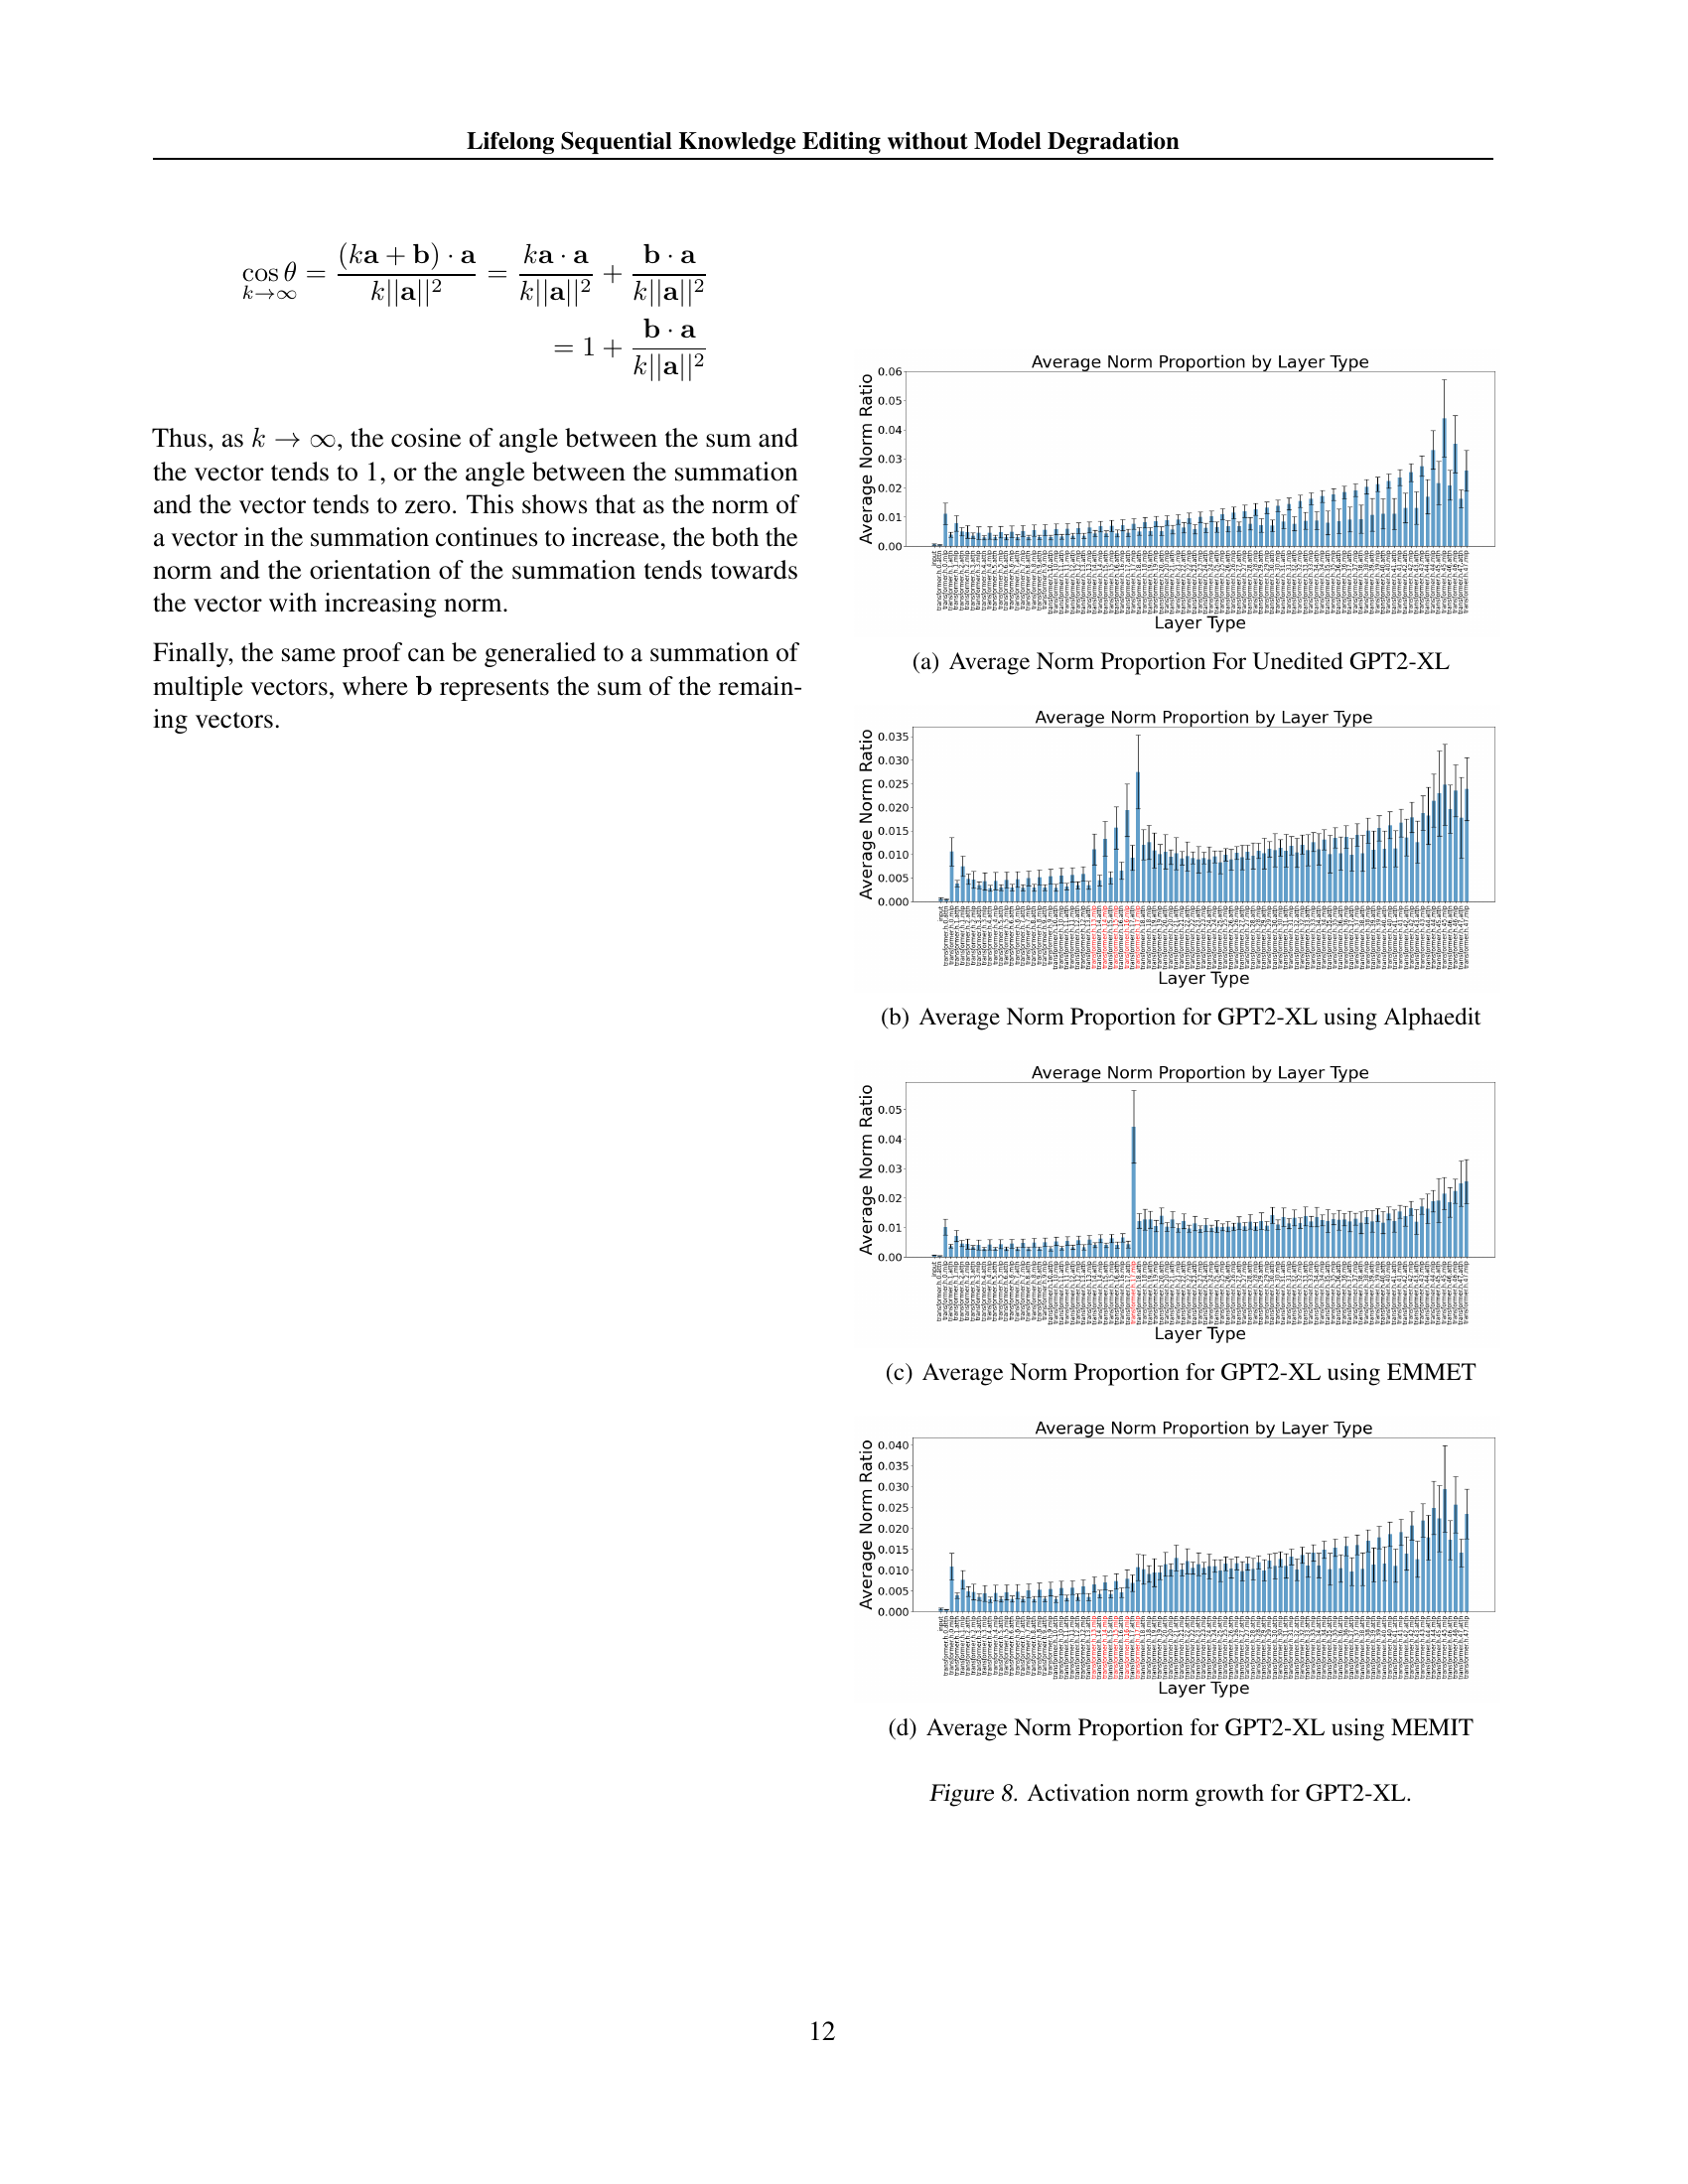
🔼 This figure shows the proportion of the total activation vector norm contributed by each layer type (input, self-attention, MLP) in the GPT-2-XL language model before any edits are applied. It provides a baseline to compare against figures showing norm changes after knowledge editing using various methods.
read the caption
(a) Average Norm Proportion For Unedited GPT2-XL
🔼 This figure is a bar chart showing the proportion of the activation vector norm contributed by different layers in the GPT-2-XL model after applying the AlphaEdit knowledge editing method. The x-axis represents different layer types within the model, and the y-axis represents the average proportion of the activation vector norm for each layer type. It visually demonstrates the relative influence of each layer on the model’s overall output, particularly highlighting how AlphaEdit alters the distribution of activation norms across layers.
read the caption
(b) Average Norm Proportion for GPT2-XL using Alphaedit
🔼 This figure displays a bar chart visualizing the average norm proportions by layer type for the GPT-2-XL model when using the EMMET algorithm. The chart shows the relative contribution of different layer types (such as input, self-attention, and MLP layers) to the overall norm of the model’s activations. Each bar represents a specific layer type, and the height of the bar indicates its contribution to the average norm. This aids in understanding the impact of various layer types on the model’s behavior and performance, particularly when comparing this distribution with similar charts from unedited models or models using different editing algorithms.
read the caption
(c) Average Norm Proportion for GPT2-XL using EMMET

🔼 This figure shows the proportion of the activation vector norm from each layer for GPT2-XL after applying the MEMIT algorithm. The x-axis represents the layer types (e.g., input, self-attn, and MLP), and the y-axis represents the average norm proportion for each layer type. The figure helps illustrate the impact of MEMIT on the distribution of activation norms across different layers of the model, highlighting how the norms of specific layers are affected.
read the caption
(d) Average Norm Proportion for GPT2-XL using MEMIT
🔼 This figure visualizes the growth of activation norms within a GPT2-XL model during sequential knowledge editing. It compares the average norm proportions across different layer types (input, self-attention, MLP) for the unedited model and models edited using AlphaEdit, EMMET, and MEMIT. The plots highlight how the norm distribution shifts after editing, showcasing the disproportionate increase in the norms of the edited layers relative to the other layers in the model.
read the caption
Figure 8: Activation norm growth for GPT2-XL.
🔼 This figure shows the proportion of the activation vector norm from each layer sub-module in the residual stream for an unedited Llama 2-7B model. The bar chart visually represents the contribution of each layer’s sub-module to the overall norm. The x-axis labels represent the various sub-modules within each layer of the model (e.g., input, self-attention, MLP), and the y-axis represents the proportion of the total activation vector norm contributed by each sub-module. This allows for a comparison of the relative importance of different sub-modules in the model’s output.
read the caption
(a) Average Norm Proportion For Unedited Llama2-7B

🔼 The figure shows the proportion of the activation vector norm from each sub-module (e.g., input, self-attention, MLP) of Llama2-7B language model to the total norm of the residual stream after applying AlphaEdit knowledge editing method. The x-axis represents the different sub-modules in the layers, while the y-axis indicates the average proportion of the norm of activation vectors produced from each sub-module to the total norm. The figure illustrates how AlphaEdit affects the norm of activation vectors across the layers, particularly focusing on the impact of the editing process on the relative contribution of different sub-modules to the overall output of the model.
read the caption
(b) Average Norm Proportion for Llama2-7B using Alphaedit

🔼 This figure shows the proportion of the activation vector norms produced from each sub-module of the Llama2-7B model after editing using the EMMET algorithm. The x-axis represents different layer types within the model (e.g., input embeddings, self-attention, MLP), and the y-axis displays the proportion of the total norm contributed by each layer type. This visualization highlights how the contribution of activations from different layers changes due to the editing process. Specifically, this allows for comparison of the relative contributions of different layers before and after edits are applied.
read the caption
(c) Average Norm Proportion for Llama2-7B using EMMET
🔼 This figure shows the proportion of the activation vector norms from different layers in Llama-2-7B model after applying the MEMIT knowledge editing method. The x-axis represents different layer types within the model (e.g., input, self-attention, MLP), and the y-axis shows the average norm proportion for each layer type. It visually represents how the norms of activation vectors from each layer contribute to the overall residual stream. The figure helps to illustrate the impact of MEMIT on the distribution of activation norms across different layers of the model.
read the caption
(d) Average Norm Proportion for Llama2-7B using MEMIT

🔼 This figure visualizes the growth of activation norms across different layers of the Llama2-7B model during sequential knowledge editing using four different methods: unedited, AlphaEdit, EMMET, and MEMIT. Each sub-figure shows the average norm proportion for each layer type in the model, highlighting how the norms change after 5,000 and 10,000 sequential edits. The x-axis represents the layer type, and the y-axis represents the average norm proportion. This helps illustrate the disproportionate growth of norms in certain layers following different knowledge editing methods.
read the caption
Figure 9: Activation norm growth for Llama2-7B.

🔼 This figure displays the average proportion of the activation vector norm contributed by each layer type in the unedited Llama3-8B model. It shows the relative contribution of different layer types (e.g., input, self-attention, MLP) to the overall activation norm. The visualization helps to understand the baseline activation norm distribution before any knowledge editing is applied.
read the caption
(a) Average Norm Proportion For Unedited Llama3-8B
🔼 This figure shows the proportion of the total activation vector norm that comes from each layer of the Llama3-8B model after 10,000 sequential edits using the AlphaEdit algorithm. The x-axis represents different layer types within the model, while the y-axis represents the proportion of the total norm contributed by that layer type. It visually demonstrates the disproportionate increase in the norm of the activation vectors produced by the layers edited by AlphaEdit, compared to the other layers. This highlights the phenomenon of ‘importance hacking’, where edits to the model’s weights cause the output of the edited layers to dominate the model’s output, potentially at the cost of overall model performance.
read the caption
(b) Average Norm Proportion for Llama3-8B using Alphaedit

🔼 This figure shows the proportion of the contribution of activation vectors produced by each sub-module in Llama3-8B to the residual stream after 10,000 sequential edits using the EMMET algorithm. The x-axis represents the different sub-modules in a decoder layer, while the y-axis shows the average norm proportion. The edited layers are highlighted in red, illustrating their increased influence on the final output after the edits.
read the caption
(c) Average Norm Proportion for Llama3-8B using EMMET
🔼 This figure shows the proportion of the activation vector norm from each sub-module of the Llama3-8B model to the total residual stream norm after 10,000 sequential edits using MEMIT. The x-axis represents different sub-modules within a layer, while the y-axis shows the proportion of their contribution to the total residual stream norm. The red bars highlight the edited layers. This visualization helps understand how the contribution of activations from the edited layers changes compared to unedited layers, illustrating the effect of MEMIT on the model’s output.
read the caption
(d) Average Norm Proportion for Llama3-8B using MEMIT

🔼 This figure visualizes the growth of the Frobenius norm of edited MLP matrices in the Llama3-8B model during sequential knowledge editing using different methods. Four subfigures are presented: (a) shows the unedited Llama3-8B model; (b) shows Llama3-8B after 5,000 sequential edits using AlphaEdit; (c) shows Llama3-8B after 10,000 sequential edits using AlphaEdit; (d) shows Llama3-8B after 5,000 and 10,000 sequential edits using MEMIT. The y-axis represents the Frobenius norm, while the x-axis represents the layer index. The figure demonstrates the disproportionate norm growth in the edited layers compared to the rest of the model, illustrating the ‘importance hacking’ phenomenon discussed in the paper.
read the caption
Figure 10: Activation norm growth for Llama3-8B.

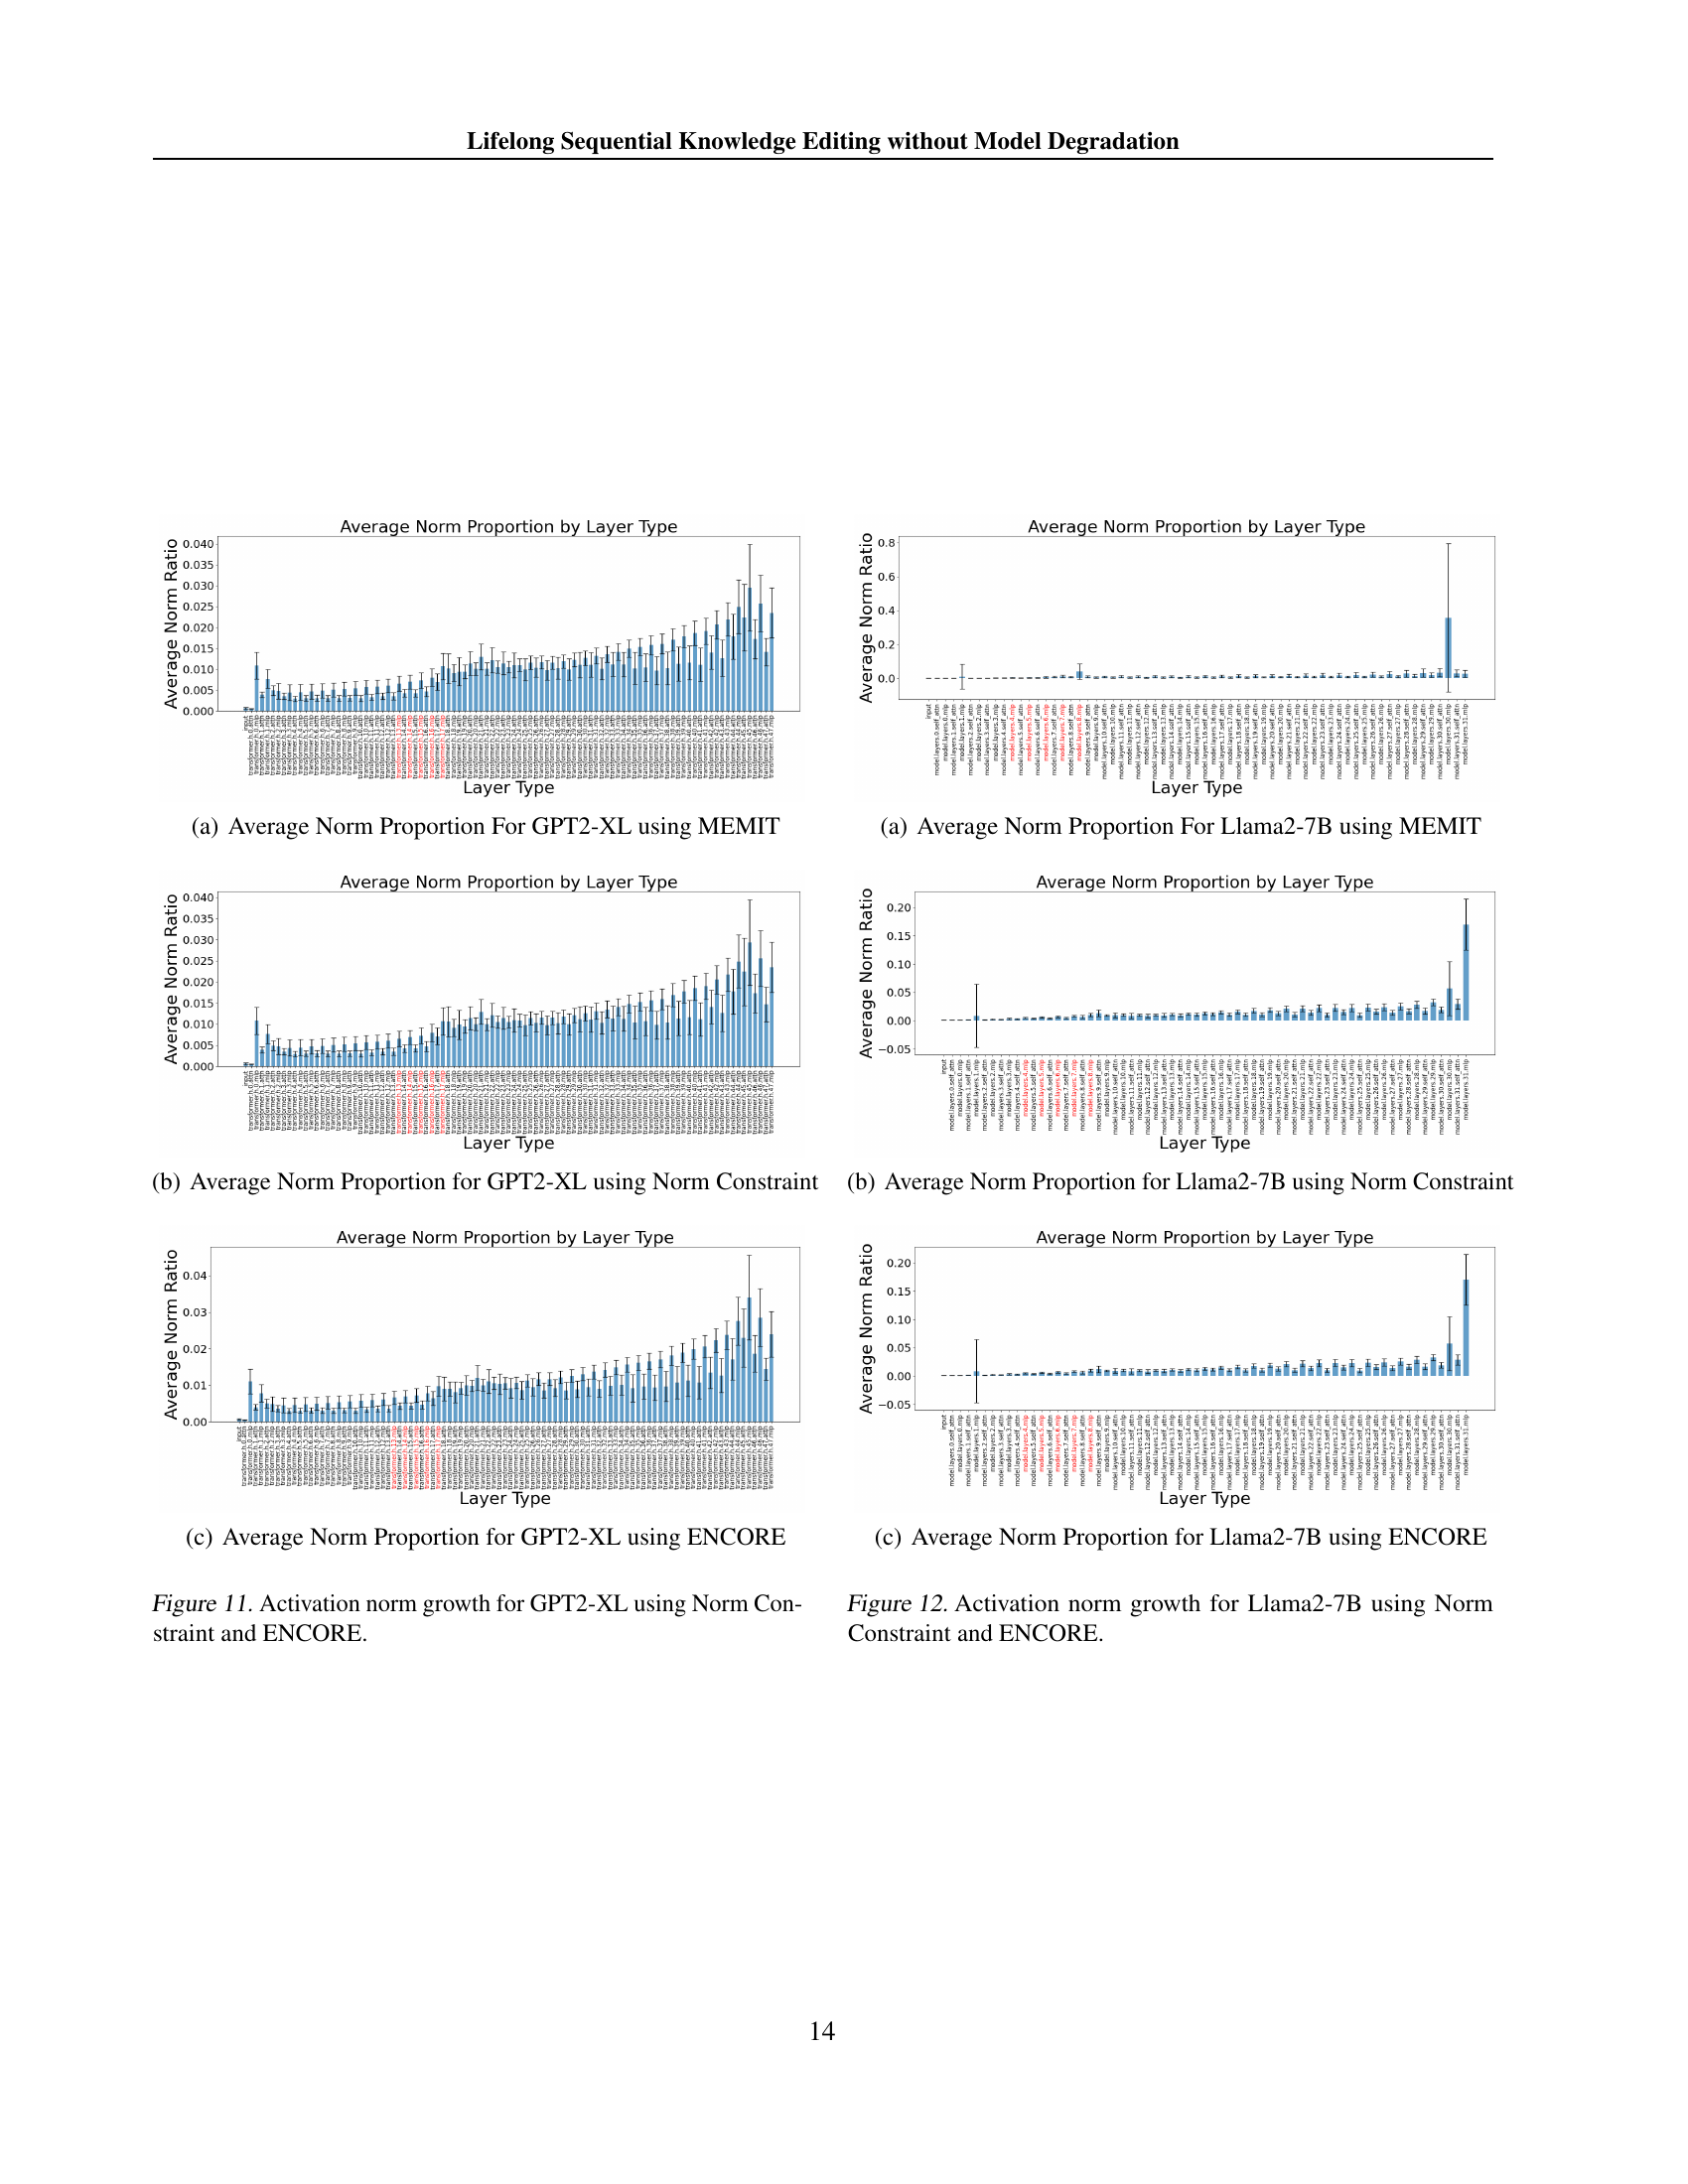
🔼 This figure shows the average proportion of the activation vector norm contributed by different layer types in the GPT-2-XL model when using the MEMIT knowledge editing method. It visualizes the distribution of activation vector norms across various layer types within the model after applying MEMIT. The x-axis likely represents different layer types within the model architecture (e.g., embedding layers, attention layers, feed-forward layers), and the y-axis represents the average proportion of the total activation vector norm contributed by each layer type. This allows for analysis of how different layers in the model contribute to the overall activation norm during the MEMIT process, potentially highlighting whether certain layers are more significantly influenced than others by the edits.
read the caption
(a) Average Norm Proportion For GPT2-XL using MEMIT

🔼 This figure shows the proportion of the activation vector norm contributed by each layer type in the GPT-2-XL model after applying the norm constraint method during sequential knowledge editing. The x-axis represents different layer types within the model, and the y-axis represents the proportion of the total activation vector norm attributed to each layer type. The graph visually displays how the norm constraint method affects the distribution of activation norms across the layers, particularly highlighting the impact on the edited layers.
read the caption
(b) Average Norm Proportion for GPT2-XL using Norm Constraint

🔼 This figure visualizes the proportion of activation vector norms contributed by different layer types in the GPT2-XL model after applying the ENCORE method. It displays the relative influence of each layer’s output on the model’s overall output. The use of ENCORE aims to mitigate the disproportionate growth of norms in certain layers, improving model robustness and performance during sequential knowledge editing.
read the caption
(c) Average Norm Proportion for GPT2-XL using ENCORE

🔼 This figure visualizes the growth of activation vector norms within different layers of the GPT-2-XL language model during sequential knowledge editing. It compares the impact of two methods: using a norm constraint and employing the ENCORE technique. The x-axis represents the layers of the model, while the y-axis shows the average norm of the activation vectors for each layer. By contrasting the norm growth with and without ENCORE, the figure highlights ENCORE’s effectiveness in mitigating the disproportionate increase in activation norms observed in certain layers during sequential knowledge updates.
read the caption
Figure 11: Activation norm growth for GPT2-XL using Norm Constraint and ENCORE.

🔼 This figure shows the proportion of the total activation vector norm contributed by each layer type in the Llama2-7B model after applying the MEMIT knowledge editing method. The x-axis represents different layer types within the model, while the y-axis displays the proportion of the norm. The visualization helps to understand how the norm of activation vectors is distributed across various layer types in the model after applying MEMIT. This distribution of the activation norm across different layer types is crucial for understanding the effectiveness and potential side effects of the knowledge editing method.
read the caption
(a) Average Norm Proportion For Llama2-7B using MEMIT
🔼 This figure shows the proportion of the contribution of activation vectors produced from each sub-module to the residual stream for Llama2-7B after applying the norm constraint method. The x-axis represents different layers in the model, categorized by type (e.g., input, self-attention, MLP). The y-axis displays the average norm proportion. The figure highlights how the norm constraint method affects the distribution of activation norms across different layers, particularly focusing on the impact of the edited layers.
read the caption
(b) Average Norm Proportion for Llama2-7B using Norm Constraint

🔼 This figure is a bar chart showing the proportion of the average activation vector norm from each layer sub-module (input, self-attention, MLP) to the overall residual stream. The chart specifically focuses on the Llama2-7B model after applying the ENCORE method. The x-axis represents the different layer sub-modules, and the y-axis shows the proportion of each sub-module’s norm to the total residual stream. The color coding might highlight the layers modified by ENCORE. This visualization helps to understand the impact of ENCORE on the relative contribution of different layers to the model’s output.
read the caption
(c) Average Norm Proportion for Llama2-7B using ENCORE

🔼 This figure compares the growth of activation norms in the Llama2-7B model during sequential knowledge editing using different methods: Norm Constraint and ENCORE. It visualizes the proportion of the total activation norm contributed by each layer of the model, specifically highlighting the edited layers (shown in red) in order to demonstrate how these methods impact the relative influence of different layers in producing the final output. By comparing the norm growth across layers with and without these editing techniques, the figure helps explain how these methods affect the model’s behavior during sequential updates.
read the caption
Figure 12: Activation norm growth for Llama2-7B using Norm Constraint and ENCORE.

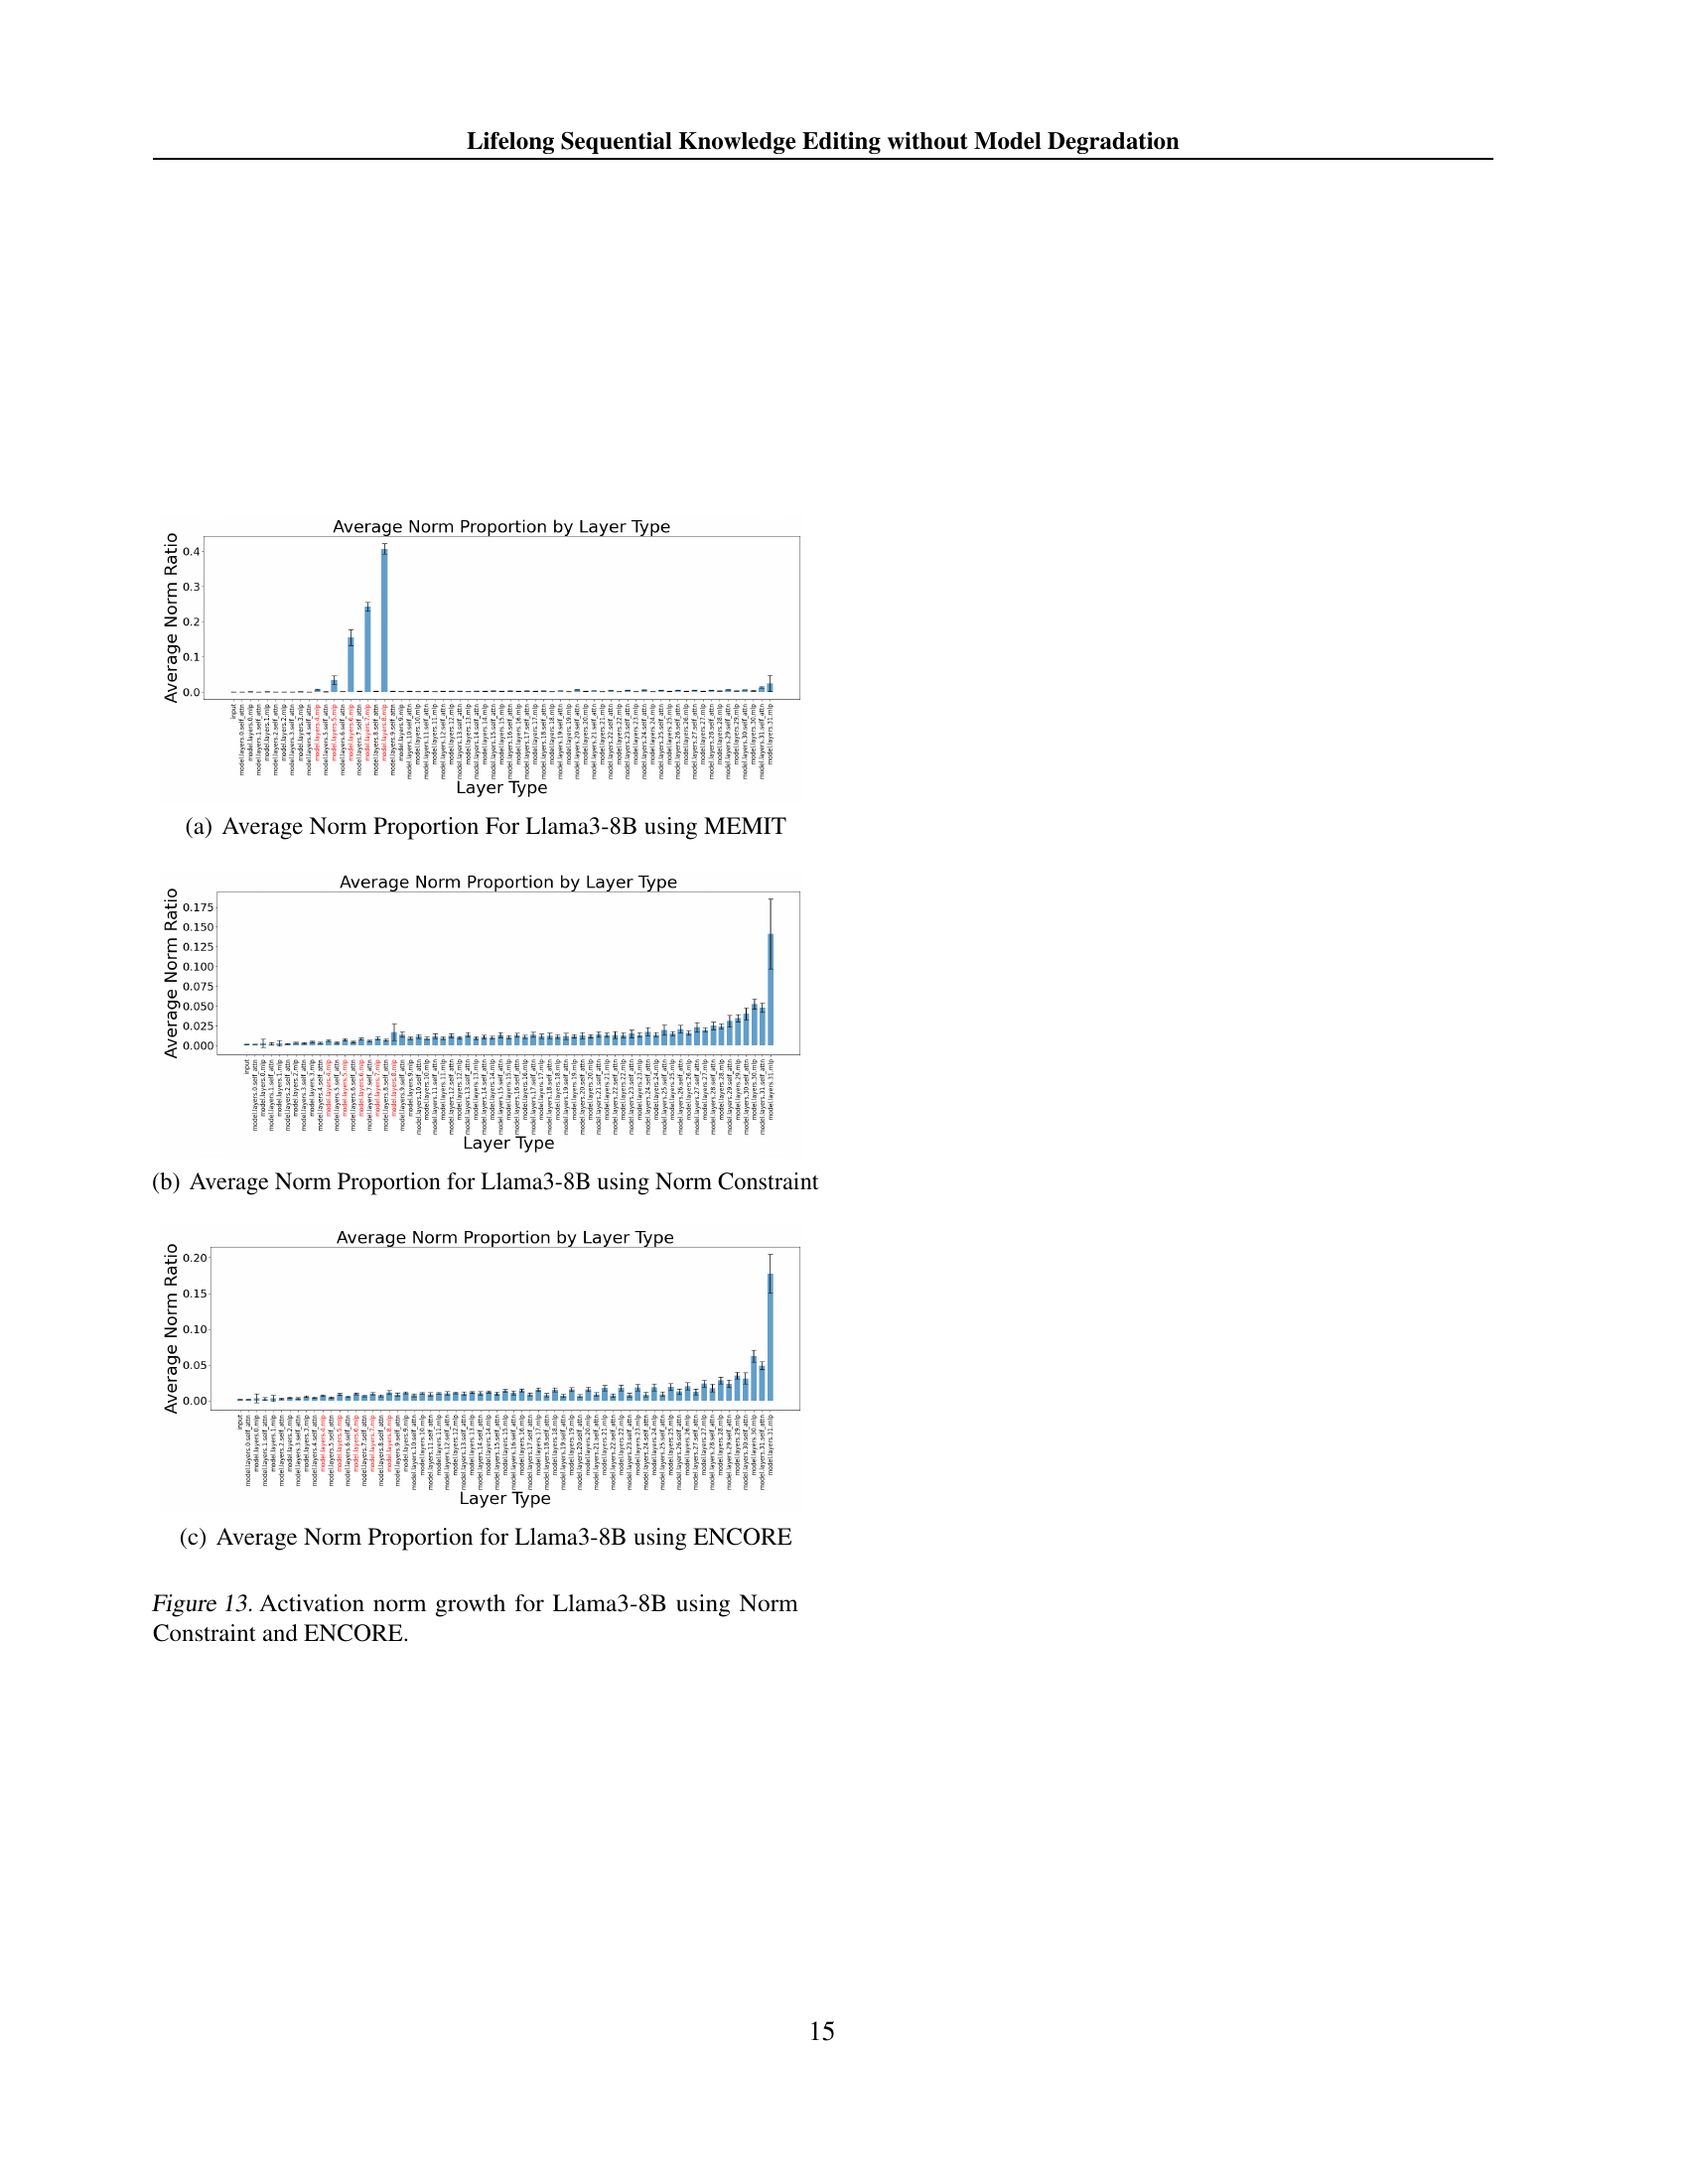
🔼 The figure shows the proportion of the activation vector norm from each sub-module of the Llama3-8B model after 10,000 sequential edits using MEMIT. The x-axis represents different layer types (input, self-attention, MLP), and the y-axis represents the average norm proportion for each layer type. The figure illustrates how the norm of activation vectors produced by the edited layers (in red) increases significantly after continuous editing, demonstrating the importance hacking phenomenon described in the paper.
read the caption
(a) Average Norm Proportion For Llama3-8B using MEMIT

🔼 This figure shows the proportion of the activation vector norm from each layer of the Llama3-8B model after applying the norm constraint method for sequential knowledge editing. The x-axis represents different types of layers in the model, while the y-axis represents the proportion of the norm. It visually demonstrates the effect of the norm constraint on the distribution of activation norms across different layer types within the model.
read the caption
(b) Average Norm Proportion for Llama3-8B using Norm Constraint

🔼 This figure is a bar chart showing the proportion of the activation vector norm contributed by different layers of the Llama 3-8B language model when using the ENCORE method for knowledge editing. The x-axis represents the different layers of the model, and the y-axis represents the proportion of the total activation vector norm originating from each layer. It visually demonstrates the impact of ENCORE on the distribution of activation vector norms across model layers during sequential knowledge editing.
read the caption
(c) Average Norm Proportion for Llama3-8B using ENCORE
🔼 This figure compares the growth of activation vector norms across different layers of the Llama3-8B language model under various knowledge editing methods. It displays how the norms change for the unedited model and after applying 5,000 and 10,000 sequential edits using MEMIT, Norm Constraint, and ENCORE. By visualizing the norm proportions for each layer type, the figure reveals the impact of each editing method on the distribution of activation vector norms, highlighting differences in the influence of various layers on the model’s output. The figure helps illustrate how ENCORE and the Norm Constraint technique attempts to mitigate the disproportionate norm growth observed in other methods.
read the caption
Figure 13: Activation norm growth for Llama3-8B using Norm Constraint and ENCORE.

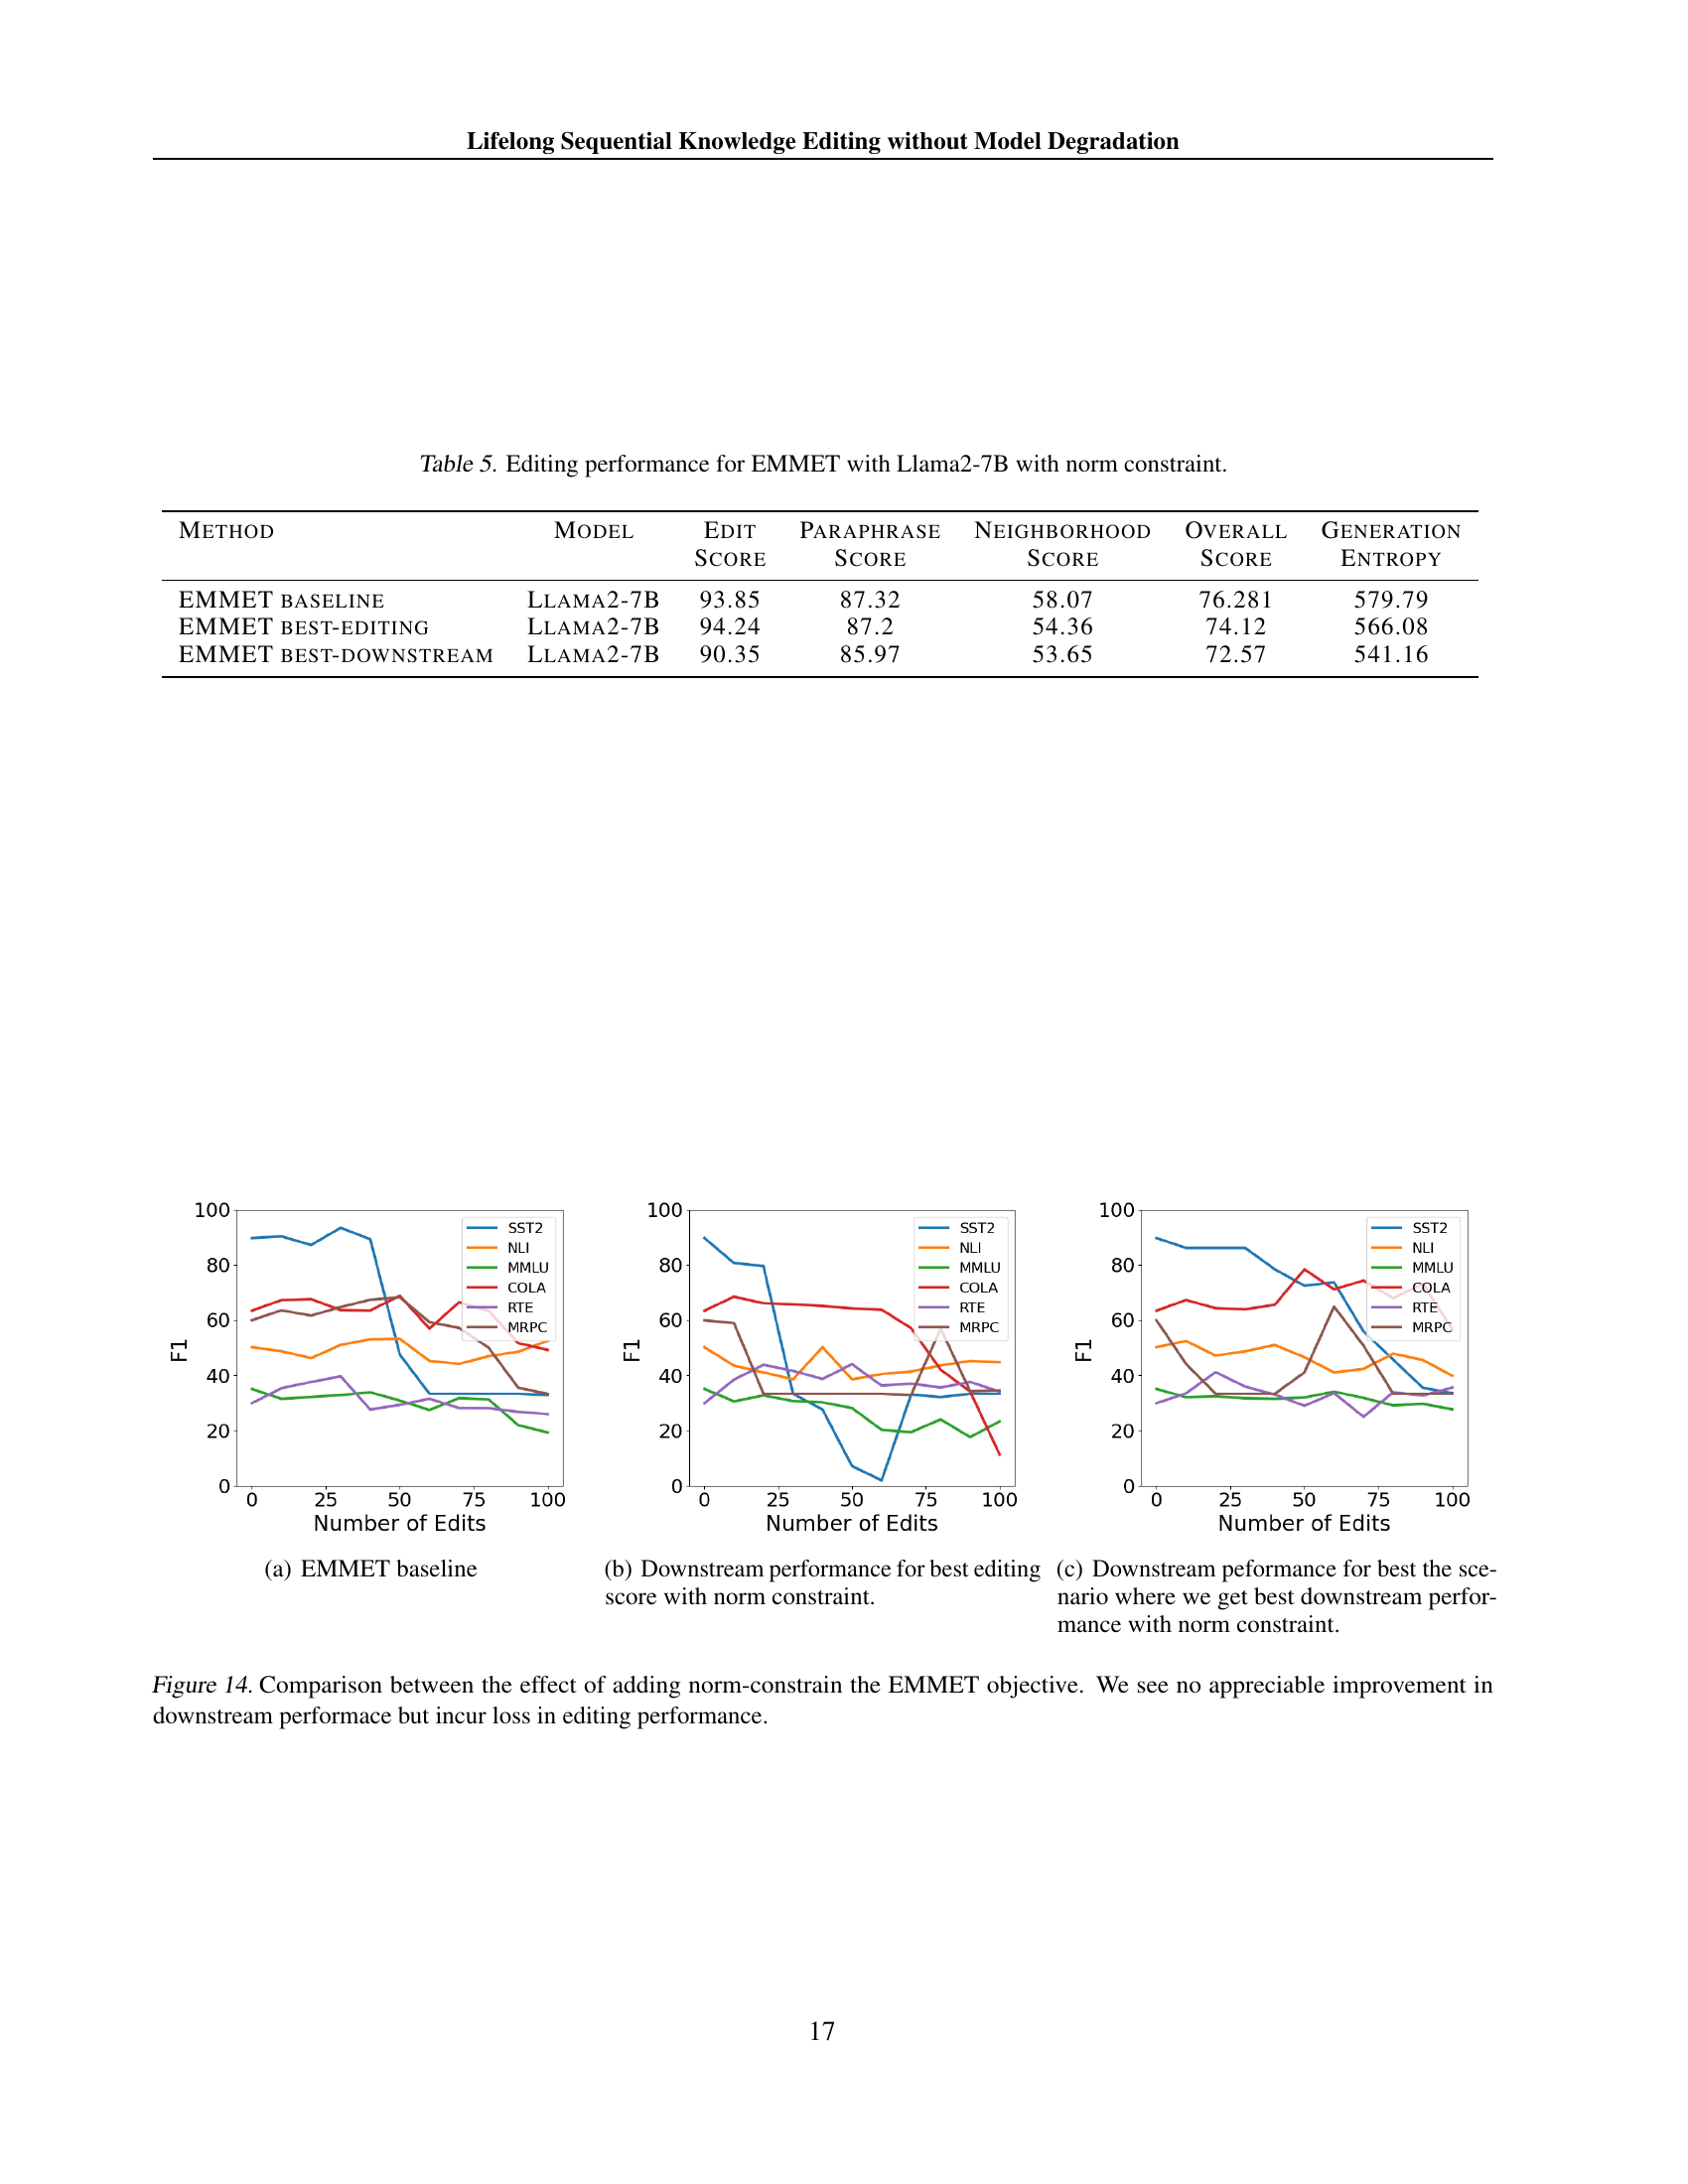
🔼 This figure shows the average downstream performance across six tasks (MMLU, NLI, RTE, SST2, MRPC, and CoLA) for the EMMET baseline model during sequential knowledge editing. The x-axis represents the number of edits performed, while the y-axis displays the F1 score for each task. Different colored lines represent different tasks.
read the caption
(a) EMMET baseline

🔼 This figure shows the downstream performance of the model after performing knowledge editing, specifically focusing on the scenario where the best editing score is achieved using a norm constraint. It demonstrates how the model’s performance on various downstream tasks changes as more edits are performed, and helps to visualize the trade-off between achieving the best editing scores and maintaining downstream capabilities.
read the caption
(b) Downstream performance for best editing score with norm constraint.
🔼 This figure shows the downstream performance of the EMMET model on the Llama2-7B dataset when using a norm constraint during the knowledge editing process. Specifically, it illustrates how the model’s performance on several downstream tasks (SST2, NLI, MMLU, COLA, RTE, MRPC) changes as the number of edits increases. This experiment focuses on the best-performing scenario observed, where the norm constraint is tuned to optimize downstream task performance rather than editing performance alone. The goal is to understand the trade-off between improving downstream task performance and applying the norm constraint successfully during editing.
read the caption
(c) Downstream peformance for best the scenario where we get best downstream performance with norm constraint.

🔼 Figure 14 displays the impact of incorporating a norm constraint into the EMMET objective function on downstream and editing performance. The results show that adding the norm constraint does not lead to a noticeable improvement in downstream performance; in fact, it results in a decrease in editing performance. This indicates a trade-off between maintaining downstream performance and improving edit quality when using the norm constraint with the EMMET objective.
read the caption
Figure 14: Comparison between the effect of adding norm-constrain the EMMET objective. We see no appreciable improvement in downstream performace but incur loss in editing performance.
🔼 This figure shows the Frobenius norm of the edited MLP matrices in the GPT2-XL model after 5,000 and 10,000 sequential edits using the AlphaEdit algorithm. The x-axis represents the layer number, and the y-axis represents the Frobenius norm. The different colored lines represent the norm for the unedited model and for the model after the specified number of edits. This visualization highlights the disproportionate growth of the norm in the edited layers compared to other layers of the model, a phenomenon discussed in the paper as a contributor to model degradation during sequential knowledge editing.
read the caption
(a) Norm growth of GPT2-XL using Alphaedit
🔼 This figure shows the Frobenius norm of the edited MLP matrices in the GPT2-XL model during sequential knowledge editing using the EMMET algorithm. The x-axis represents the layers of the model, while the y-axis shows the Frobenius norm. Different colored lines represent different stages of editing, showing how the norm changes as more edits are sequentially applied to the model.
read the caption
(b) Norm growth of GPT2-XL using EMMET

🔼 This figure shows the Frobenius norm of the edited MLP matrices in the GPT2-XL model during sequential knowledge editing using the MEMIT method. It illustrates the growth of the norm over the layers (x-axis) and the number of edits (different colored lines). This visualization helps to understand the extent of norm increase and its impact on model performance.
read the caption
(c) Norm growth of GPT2-XL using MEMIT
🔼 This figure compares the growth of the Frobenius norm of edited MLP matrices in the GPT2-XL model across different knowledge editing methods. The x-axis represents the layer number, and the y-axis represents the Frobenius norm. Each line in the graph corresponds to a different editing method (AlphaEdit, EMMET, MEMIT) and shows the norm of the edited matrices before any edits and after 5000 and 10000 edits. This visualization helps illustrate how different methods affect the norm of the edited parameters during sequential knowledge editing. Note that the scale of the y-axis is not consistent across different plots within Figure 15, so direct comparison across methods should only be done within each sub-plot.
read the caption
Figure 15: Norm growth of GPT2-XL across different methods

🔼 This figure shows the Frobenius norm of the MLP matrices in the GPT-2-XL model during sequential knowledge editing using the MEMIT method. The x-axis represents the layer number, while the y-axis represents the Frobenius norm. Different colored lines represent different stages of the editing process (e.g., the original unedited model, the model after 5,000 edits, and the model after 10,000 edits). The figure illustrates the significant increase in the norm of the edited matrices as more edits are applied sequentially.
read the caption
(a) Norm growth of GPT2-XL using MEMIT

🔼 This figure shows the Frobenius norm of the edited MLP matrices in the GPT-2-XL model after sequential knowledge editing using the Norm Constraint method. The x-axis represents the layer number, and the y-axis represents the Frobenius norm. Multiple lines are shown, each representing the norm at different stages of sequential editing (e.g., unedited, 5000 edits, 10000 edits). The plot visualizes the impact of the Norm Constraint on the growth of the Frobenius norm during sequential knowledge editing, highlighting whether it effectively mitigates the disproportionate norm increase observed in other methods.
read the caption
(b) Norm growth of GPT2-XL using Norm Constraint
🔼 This figure shows the Frobenius norm of the edited MLP matrices in the GPT-2-XL model after 5,000 and 10,000 sequential edits using the ENCORE method. It visually demonstrates the impact of ENCORE on controlling the growth of the norm in the edited layers, showing how ENCORE prevents the disproportionate increase observed in other methods like MEMIT and AlphaEdit. The graph plots the Frobenius norm against the layer number, enabling a comparison between the norms of the unedited and edited model layers. The controlled norm growth, as a result of ENCORE, is a key aspect of preventing model degradation during large-scale sequential knowledge editing.
read the caption
(c) Norm growth of GPT2-XL using ENCORE
🔼 This figure compares the Frobenius norms of the weight matrices in the second MLP layer of GPT2-XL’s decoder across different editing methods. It illustrates the norm growth over 5,000 and 10,000 edits for three scenarios: using the MEMIT method, applying a norm constraint to MEMIT, and employing ENCORE, the method proposed in the paper. The plot visually demonstrates the effectiveness of the norm constraint and ENCORE in mitigating the disproportionate norm growth observed in MEMIT during sequential knowledge editing.
read the caption
Figure 16: Norm growth of GPT2-XL using Norm Constraint and ENCORE

🔼 This figure shows the Frobenius norm of the edited MLP matrices in Llama2-7B language model after applying AlphaEdit. The x-axis represents the layer number, and the y-axis represents the Frobenius norm. Multiple lines represent the norms at different numbers of edits (e.g., unedited model, 5000 edits, 10000 edits). It illustrates the disproportionate growth of the norm of the edited matrix during sequential knowledge editing with AlphaEdit, a phenomenon that can lead to model degradation.
read the caption
(a) Norm growth of Llama2-7B using Alphaedit

🔼 The figure shows the Frobenius norm of the edited MLP matrices in the Llama2-7B model during sequential knowledge editing using the EMMET algorithm. The x-axis represents the layers of the model, and the y-axis represents the Frobenius norm. Different colored lines represent different stages of the editing process (e.g., unedited, 5000 edits, 10000 edits). The plot illustrates the growth in the norm of the weight matrices as more edits are made, showcasing how the weight changes accumulate over time.
read the caption
(b) Norm growth of Llama2-7B using EMMET

🔼 The figure shows the Frobenius norm of the edited MLP matrices in the Llama2-7B model during sequential knowledge editing using the MEMIT method. The x-axis represents the layer number, and the y-axis represents the Frobenius norm. Different colored lines represent different stages of the editing process (e.g., unedited model, model after 5,000 edits, and model after 10,000 edits). The figure visually demonstrates the disproportionate growth of the norm in the edited layers compared to other layers as the number of edits increases.
read the caption
(c) Norm growth of Llama2-7B using MEMIT

🔼 This figure compares the growth of the Frobenius norm of edited MLP matrices in the Llama2-7B model across different knowledge editing methods (AlphaEdit, EMMET, MEMIT). It visually demonstrates how the norm of the edited matrices changes as a function of the number of sequential edits performed by each method. This provides insight into the impact of different editing techniques on the model’s parameters and can be used to understand the reasons for model degradation.
read the caption
Figure 17: Norm growth of Llama2-7B across different methods

🔼 The figure shows the Frobenius norm of the edited MLP matrices in the Llama2-7B model during sequential knowledge editing using the MEMIT method. The x-axis represents the layer number, and the y-axis represents the Frobenius norm. Different colored lines represent different stages of the editing process (e.g., the unedited model, the model after 5,000 edits, and the model after 10,000 edits). The figure illustrates the disproportionate growth of the norm in the edited layers as sequential edits are performed.
read the caption
(a) Norm growth of Llama2-7B using MEMIT

🔼 This figure shows the Frobenius norm of the edited MLP matrices in the Llama2-7B model during sequential knowledge editing using the Norm Constraint method. The x-axis represents the layer number in the model, and the y-axis represents the Frobenius norm. Multiple lines are shown, each representing the norm at different stages of the editing process (e.g., unedited, after 5000 edits, after 10000 edits). The plot visualizes how the norm of the edited matrices changes as more edits are performed, illustrating the impact of the norm constraint on controlling the growth of the matrix norm. It highlights the effect of the Norm Constraint on mitigating the disproportionate growth in the norm of the edited matrix observed in other methods.
read the caption
(b) Norm growth of Llama2-7B using Norm Constraint

🔼 This figure shows the Frobenius norm of the edited MLP matrices in the Llama2-7B model after sequential knowledge editing using ENCORE. It displays the norm values for each layer of the model, illustrating the impact of ENCORE on controlling the growth of norms in the weight matrices during lifelong sequential knowledge editing. Specifically, it contrasts the norm growth with that observed in other methods, highlighting ENCORE’s effectiveness in mitigating disproportionate norm increases.
read the caption
(c) Norm growth of Llama2-7B using ENCORE

🔼 This figure compares the Frobenius norm of the weight matrices in the Llama-2-7B model’s MLP layers before and after sequential knowledge editing with two methods: Norm Constraint and ENCORE. It visualizes how the norms change for each layer after 5,000 and 10,000 edits using both methods, showing the impact of each technique on the model’s parameters. The goal is to illustrate the effectiveness of ENCORE and Norm Constraint in controlling norm growth during sequential knowledge editing.
read the caption
Figure 18: Norm growth of Llama2-7B using Norm Constraint and ENCORE
🔼 This figure shows the Frobenius norm of the edited MLP matrices in Llama-3-8B during sequential knowledge editing using the AlphaEdit method. The x-axis represents the different layers of the model, and the y-axis represents the Frobenius norm. The different colored lines show the norm after different numbers of edits (e.g., unedited, 5,000 edits, 10,000 edits). The figure highlights the disproportionate growth in the norm of the edited matrices compared to other layers as the number of edits increases, illustrating a key finding of the paper.
read the caption
(a) Norm growth of Llama3-8B using Alphaedit

🔼 The figure shows the Frobenius norm of the edited MLP matrices in the Llama3-8B model after applying the EMMET knowledge editing method. It illustrates the growth of the norm across different layers of the model as a function of the number of edits performed. The x-axis represents the layer number in the model and y-axis represents the Frobenius norm. The plot visualizes how the norm of the edited matrices increases during sequential knowledge editing with EMMET.
read the caption
(b) Norm growth of Llama3-8B using EMMET

🔼 The figure shows the Frobenius norm of the MLP weight matrices in the Llama3-8B model’s decoder layers after 5,000 and 10,000 sequential edits using the MEMIT method. The x-axis represents the layer number, and the y-axis represents the Frobenius norm. It illustrates the significant increase in the norm of the edited matrices (layers 4-8) compared to the unedited model, highlighting the disproportionate norm growth caused by MEMIT during sequential knowledge editing.
read the caption
(c) Norm growth of Llama3-8B using MEMIT

🔼 This figure displays the Frobenius norm of the edited MLP matrices in the Llama3-8B model after 5,000 and 10,000 sequential edits using different knowledge editing methods. The x-axis represents the layer number, and the y-axis represents the Frobenius norm. Each line corresponds to a different method (AlphaEdit, MEMIT, and the proposed ENCORE) and shows how the norm of the edited matrices changes with the number of edits. The figure demonstrates the disproportionate growth of the norm in certain methods compared to the unedited model and other layers, highlighting a key observation in the paper.
read the caption
Figure 19: Norm growth of Llama3-8B across different methods

🔼 The figure visualizes the Frobenius norm of the edited MLP matrices in the Llama3-8B model across different layers during sequential knowledge editing using the MEMIT method. The x-axis represents the layer number, while the y-axis shows the Frobenius norm. Different colored lines depict the norm at various stages of the editing process (e.g., unedited model, 5,000 edits, 10,000 edits). This illustrates the disproportionate growth of the norm in specific layers as more edits are performed.
read the caption
(a) Norm growth of Llama3-8B using MEMIT

🔼 This figure shows the Frobenius norm of the edited MLP matrices in the Llama3-8B model after sequential knowledge editing using the Norm Constraint method. The x-axis represents the different layers of the model, and the y-axis shows the Frobenius norm. The different colored lines represent the norms at different stages of the editing process (e.g., unedited, 5,000 edits, 10,000 edits). This visualization helps illustrate the effectiveness of the Norm Constraint in mitigating the disproportionate growth of norms in the edited layers compared to other methods.
read the caption
(b) Norm growth of Llama3-8B using Norm Constraint

🔼 This figure shows the Frobenius norm of the edited MLP matrices in the Llama3-8B model after performing sequential knowledge editing using the ENCORE method. It illustrates the growth of the norm in the edited layers (layers 4-8) as a function of the number of edits. The graph helps visualize the impact of ENCORE on controlling the norm growth compared to other methods, highlighting ENCORE’s effectiveness in mitigating the disproportionate increase in norm observed in other approaches to sequential knowledge editing.
read the caption
(c) Norm growth of Llama3-8B using ENCORE
🔼 This figure displays a comparison of the Frobenius norm of weight matrices in Llama-3-8B language model’s MLP layers after applying different methods: unedited model, model edited with 5,000 edits using AlphaEdit, and 10,000 edits using AlphaEdit. It shows the norm growth of the matrices in the edited layers relative to unedited layers, highlighting the impact of these methods on the model’s weights. The disproportionate norm increase is an important observation discussed in the paper.
read the caption
Figure 20: Norm growth of Llama3-8B using Norm Constraint and ENCORE

🔼 This figure shows the downstream performance of GPT-2-XL language model when using AlphaEdit for knowledge editing. The x-axis represents the number of edits performed, and the y-axis shows the F1 score across six different downstream tasks: SST-2, NLI, MMLU, COLA, RTE, and MRPC. The lines represent the performance on each task as the number of edits increases. This illustrates the impact of AlphaEdit on the model’s performance on various NLP tasks during sequential knowledge editing.
read the caption
(a) Downstream Performance for GPT2-XL using AlphaEdit

🔼 This figure shows the downstream performance of GPT2-XL language model after applying AlphaEdit with Most-Probable Early Stopping (MPES) method for sequential knowledge editing. The downstream performance is evaluated across six tasks: SST2, NLI, MMLU, COLA, RTE, and MRPC. The x-axis represents the number of edits performed (in batches of 100), and the y-axis shows the F1 score achieved on each of these six tasks. The plot helps to analyze how the downstream performance of the model changes with an increasing number of sequential edits, allowing for the assessment of model degradation after applying MPES.
read the caption
(b) Downstream Performance for GPT2-XL using AlphaEdit with MPES

🔼 This figure displays the downstream performance of GPT-2-XL language model on six different downstream tasks (SST-2, MRPC, NLI, RTE, COLA, MMLU) after applying AlphaEdit and MPES methods with the CounterFact dataset. The x-axis represents the number of edits (in batches of 100) performed, and the y-axis shows the F1 score for each task. The plot helps to visualize how the model’s performance on different tasks changes with sequential knowledge editing using the combined approach.
read the caption
Figure 21: Downstream Performance for GPT2-XL using AlphaEdit and MPES with CounterFact dataset

🔼 This figure shows the downstream performance of GPT-2-XL language model when using the EMMET algorithm for sequential knowledge editing. The downstream performance is evaluated across six different tasks (SST-2, MRPC, NLI, RTE, COLA, MMLU) and is measured as F1 score. The x-axis represents the number of edits (in batches of 100), and the y-axis represents the F1 score for each task. The lines represent the performance of different tasks during the process of sequential knowledge editing using the EMMET algorithm.
read the caption
(a) Downstream Performance for GPT2-XL using EMMET

🔼 This figure shows the downstream performance of GPT2-XL model when using the EMMET algorithm with the Most-Probable Early Stopping (MPES) technique. The downstream performance is evaluated across six different tasks: sentiment analysis (SST2), paraphrase detection (MRPC), natural language inference (NLI, RTE), linguistic acceptability classification (COLA), and massive multitask language understanding (MMLU). The x-axis represents the number of edits (in batches of 100), and the y-axis represents the F1 score for each task. The plot illustrates how the model’s performance on these tasks changes as more knowledge edits are sequentially applied using EMMET and MPES.
read the caption
(b) Downstream Performance for GPT2-XL using EMMET with MPES

🔼 This figure displays the results of downstream performance evaluations for the GPT-2-XL model using two different methods: EMMET and EMMET combined with MPES (Most-Probable Early Stopping). The x-axis represents the number of edits performed, and the y-axis shows the F1 score across six different downstream tasks (SST-2, MRPC, NLI, RTE, COLA, and MMLU). The graph allows for a comparison of the performance of the two methods across various downstream tasks and the impact of MPES on maintaining the model’s performance across many sequential edits.
read the caption
Figure 22: Downstream Performance for GPT2-XL using EMMET and MPES with CounterFact dataset

🔼 This figure displays the downstream performance of GPT-2-XL language model when using the MEMIT knowledge editing algorithm. The x-axis represents the number of edits performed, and the y-axis shows the F1 score across six different downstream tasks (SST2, MRPC, NLI, RTE, COLA, and MMLU). The graph illustrates how the model’s performance on these tasks changes as more edits are sequentially applied. This helps assess whether and to what extent the MEMIT algorithm causes a degradation in the model’s overall capabilities after multiple knowledge editing updates.
read the caption
(a) Downstream Performance for GPT2-XL using MEMIT

🔼 This figure shows the downstream performance of GPT-2-XL language model after applying MEMIT knowledge editing method with Most Probable Early Stopping (MPES). The x-axis represents the number of edits performed in batches of 100, and the y-axis shows the F1 score across six different downstream tasks: SST-2, MRPC, NLI, RTE, COLA, and MMLU. The plot visualizes how the model’s performance on these tasks changes as more knowledge edits are integrated. Different colored lines represent the performance of different downstream tasks, showing their relative robustness to the editing process.
read the caption
(b) Downstream Performance for GPT2-XL using MEMIT with MPES

🔼 This figure shows the downstream performance of GPT-2-XL language model after applying the MEMIT knowledge editing method with an added norm constraint on the CounterFact dataset. The x-axis represents the number of editing steps performed (where each step involves a batch of edits), while the y-axis shows the F1 score across six different downstream tasks (SST-2, MRPC, NLI, RTE, COLA, and MMLU). The graph illustrates the model’s performance on these tasks as the number of editing steps increases. This visualization helps to assess the effect of the norm constraint in maintaining the model’s performance after sequential knowledge editing.
read the caption
(c) Downstream Performance for GPT2-XL using MEMIT with Norm Constraint

🔼 This figure shows the downstream performance of GPT-2-XL language model after applying MEMIT (Memory-efficient in-context editing) and ENCORE (Early stopping and Norm-Constrained Robust knowledge Editing) sequentially. It displays the F1 scores across six different downstream tasks (SST2, NLI, MMLU, COLA, RTE, MRPC) as the number of edits increases. The graph allows for comparison of the model’s performance with and without ENCORE, illustrating its effectiveness in maintaining performance during large-scale sequential knowledge editing.
read the caption
(d) Downstream Performance for GPT2-XL using MEMIT with ENCORE
🔼 This figure displays the downstream performance of GPT-2-XL model on the CounterFact dataset after applying four different knowledge editing methods: MEMIT, MEMIT with MPES (Most-Probable Early Stopping), MEMIT with Norm Constraint, and ENCORE. The x-axis represents the number of edits (in batches of 100) performed on the model, while the y-axis shows the F1 score achieved on six different downstream tasks (SST2, MRPC, NLI, RTE, COLA, and MMLU). The plot allows for a comparison of how each method affects the model’s performance on various tasks as the number of edits increases, demonstrating the impact of the techniques on model degradation during sequential knowledge editing.
read the caption
Figure 23: Downstream Performance for GPT2-XL using MEMIT, MPES, Norm Constraint and ENCORE with CounterFact dataset

🔼 This figure shows the downstream performance of GPT-2-XL language model after applying AlphaEdit knowledge editing method. The x-axis represents the number of edits performed (in batches of 100), and the y-axis shows the F1 score across six different downstream tasks (SST-2, MRPC, NLI, RTE, COLA, and MMLU). The graph displays how the model’s performance on these tasks changes as more edits are incorporated. Different colored lines represent different downstream tasks.
read the caption
(a) Downstream Performance for GPT2-XL using AlphaEdit
🔼 This figure shows the downstream performance of GPT-2-XL language model after applying AlphaEdit with Most-Probable Early Stopping (MPES) for knowledge editing. The x-axis represents the number of edits performed in batches of 100, up to a maximum of 10000 edits. The y-axis shows the F1 score across six different downstream tasks: SST-2, NLI, MMLU, COLA, RTE, and MRPC. The graph illustrates how the model’s performance on these tasks changes as more sequential knowledge edits are applied using the AlphaEdit method enhanced with MPES. This allows for comparison of performance changes as a result of the knowledge editing process.
read the caption
(b) Downstream Performance for GPT2-XL using AlphaEdit with MPES

🔼 This figure displays the downstream performance results for the GPT-2-XL model when using the AlphaEdit algorithm with and without MPES (Most-Probable Early Stopping) on the zsRE dataset. Downstream performance is assessed using several tasks including sentiment analysis, paraphrase detection, natural language inference, and others. The x-axis represents the number of edits performed (in batches of 100), and the y-axis represents the F1 score achieved on each of the downstream tasks. It shows how the addition of MPES affects the performance of AlphaEdit over a sequence of edits.
read the caption
Figure 24: Downstream Performance for GPT2-XL using AlphaEdit and MPES with zsRE dataset

🔼 This figure shows the downstream performance of GPT-2-XL language model when using the EMMET knowledge editing algorithm. Downstream performance is measured across six different tasks: sentiment analysis (SST2), paraphrase detection (MRPC), natural language inference (NLI, RTE), linguistic acceptability (CoLA), and massive multitask language understanding (MMLU). The x-axis represents the number of edits performed, and the y-axis shows the F1-score for each task. The plot helps to visualize how the model’s performance on these downstream tasks changes as more knowledge edits are made using the EMMET method.
read the caption
(a) Downstream Performance for GPT2-XL using EMMET

🔼 This figure shows the downstream performance of GPT-2-XL language model after applying the EMMET algorithm with the addition of Most-Probable Early Stopping (MPES). The x-axis represents the number of edits performed, while the y-axis shows the F1 score across six downstream tasks (SST-2, MRPC, NLI, RTE, COLA, MMLU). The graph illustrates how the model’s performance on these tasks changes as more edits are sequentially introduced using the EMMET method, enhanced by MPES to mitigate overfitting.
read the caption
(b) Downstream Performance for GPT2-XL using EMMET with MPES

🔼 This figure displays the downstream performance results for the GPT2-XL model when employing the EMMET knowledge editing method, both with and without MPES (Most-Probable Early Stopping). The x-axis represents the number of edits, while the y-axis shows the F1 score across six different downstream tasks (SST2, NLI, MMLU, COLA, RTE, MRPC). It visually demonstrates the impact of MPES on mitigating performance degradation during sequential knowledge editing using EMMET.
read the caption
Figure 25: Downstream Performance for GPT2-XL using EMMET and MPES with zsRE dataset

🔼 This figure shows the downstream performance of GPT-2-XL language model after applying MEMIT (Memory-Efficient Multi-task Learning) method for sequential knowledge editing. The x-axis represents the number of edits (in batches of 100), and the y-axis shows the F1 score across six downstream tasks: SST-2, MRPC, NLI, RTE, COLA, and MMLU. The figure helps visualize how well the model maintains its performance on various tasks after a series of knowledge edits, demonstrating the model’s robustness and ability to retain learned knowledge after editing.
read the caption
(a) Downstream Performance for GPT2-XL using MEMIT

🔼 This figure shows the downstream performance of GPT-2-XL language model after applying MEMIT (Memory-Efficient Multi-task Editing) knowledge editing method with MPES (Most-Probable Early Stopping). The downstream performance is evaluated across multiple tasks and is plotted against the number of edits. It illustrates how the model’s performance on various downstream tasks changes as sequential knowledge edits are incorporated using MEMIT with the added MPES optimization. The graph likely shows the F1 scores (a common metric for evaluating model performance) for each task as a function of the number of edits performed.
read the caption
(b) Downstream Performance for GPT2-XL using MEMIT with MPES

🔼 This figure shows the downstream performance of GPT-2-XL language model after applying MEMIT algorithm with a norm constraint during sequential knowledge editing. Downstream performance is evaluated across six different tasks, and the x-axis represents the number of edits performed. The y-axis represents the F1 score, which measures the model’s accuracy. The figure helps visualize how the addition of a norm constraint to the MEMIT algorithm impacts the model’s performance on various downstream tasks after sequential edits.
read the caption
(c) Downstream Performance for GPT2-XL using MEMIT with Norm Constraint

🔼 This figure shows the downstream performance of GPT-2-XL language model on six different downstream tasks after applying sequential knowledge editing using the MEMIT method with ENCORE. The x-axis represents the number of edits, and the y-axis represents the F1 score for each task. The F1 score measures the model’s performance on each task after a specified number of edits. The figure helps to understand how ENCORE affects the performance of the model on various tasks, and how it compares to other methods in the paper.
read the caption
(d) Downstream Performance for GPT2-XL using MEMIT with ENCORE
🔼 This figure displays the downstream performance of GPT-2 XL model on the zsRE dataset after applying four different methods: MEMIT, MEMIT with MPES (early stopping), MEMIT with norm constraint, and ENCORE (which combines MPES and norm constraint). The x-axis represents the number of edits (in batches of 100), and the y-axis represents the F1 score across six different downstream tasks (SST2, MRPC, NLI, RTE, COLA, MMLU). Each line represents the performance of a specific downstream task after applying the mentioned editing method. This visualization helps understand how different methods affect the overall model performance in the long run.
read the caption
Figure 26: Downstream Performance for GPT2-XL using MEMIT, MPES, Norm Constraint and ENCORE with zsRE dataset

🔼 This figure shows the downstream performance of Llama 2-7B language model after applying AlphaEdit knowledge editing method. The x-axis represents the number of edits performed on the model, and the y-axis shows the F1 score across six different downstream tasks (SST2, MRPC, NLI, RTE, CoLA, and MMLU). It illustrates how the model’s performance on these tasks changes as more edits are applied, providing insights into the impact of AlphaEdit on the model’s generalization capabilities.
read the caption
(a) Downstream Performance for Llama2-7B using AlphaEdit

🔼 This figure shows the downstream performance of Llama 2-7B language model after applying AlphaEdit with Most-Probable Early Stopping (MPES). The downstream performance is measured across six different tasks: Massive Multitask Language Understanding (MMLU), Natural Language Inference (NLI), Recognizing Textual Entailment (RTE), Sentiment Analysis (SST2), Paraphrase Detection (MRPC), and Linguistic Acceptability (CoLA). The x-axis represents the number of sequential edits performed in batches of 100. The y-axis represents the F1 score, a common metric used to evaluate the model’s performance on these downstream tasks. The graph illustrates the effect of AlphaEdit, enhanced by MPES, on the model’s ability to maintain performance across multiple tasks during a long sequence of edits.
read the caption
(b) Downstream Performance for Llama2-7B using AlphaEdit with MPES

🔼 This figure displays the downstream performance of the Llama-2-7B language model when using the AlphaEdit algorithm with and without Most-Probable Early Stopping (MPES) on the CounterFact dataset. The graph showcases the F1 scores across six downstream tasks (SST2, NLI, MMLU, CoLA, RTE, MRPC) as the number of edits increases. It visually represents how the model’s performance on these tasks changes over the course of sequential knowledge editing, demonstrating the effects of MPES on mitigating performance degradation.
read the caption
Figure 27: Downstream Performance for Llama2-7B using AlphaEdit and MPES with CounterFact dataset

🔼 This figure shows the downstream performance of the Llama 2-7B model when using the EMMET algorithm for sequential knowledge editing. It displays the F1 scores across six different downstream tasks (SST2, NLI, MMLU, COLA, RTE, MRPC) as the number of edits increases. The graph allows for visualizing the extent to which model performance degrades (or improves) as the model undergoes a series of knowledge editing operations using the EMMET method.
read the caption
(a) Downstream Performance for Llama2-7B using EMMET

🔼 The figure shows the downstream performance of Llama 2-7B language model when using the EMMET knowledge editing method along with the Most-Probable Early Stopping (MPES) technique. Downstream performance is evaluated across six distinct tasks: Massive Multitask Language Understanding (MMLU), Natural Language Inference (NLI), Recognizing Textual Entailment (RTE), Sentiment Analysis (SST2), Paraphrase Detection (MRPC), and Linguistic Acceptability (CoLA). The x-axis represents the number of edits (in batches of 100), and the y-axis represents the F1 score achieved on each task. The graph visualizes how the model’s performance on these tasks changes as more edits are sequentially applied using the combined EMMET and MPES approach.
read the caption
(b) Downstream Performance for Llama2-7B using EMMET with MPES

🔼 This figure displays the downstream performance results for the Llama 2-7B language model when employing the EMMET method with and without MPES (Most-Probable Early Stopping). The downstream performance is evaluated across six distinct tasks: SST-2, NLI, MMLU, COLA, RTE, and MRPC, and is presented as F1 scores plotted against the number of edits. The graph helps assess how well the model maintains its performance on general language tasks as it undergoes sequential knowledge editing using the EMMET approach, examining the impact of using MPES to improve performance.
read the caption
Figure 28: Downstream Performance for Llama2-7B using EMMET and MPES with CounterFact dataset
More on tables
| Method | Model | Edit Score | Paraphrase Score | Neighborhood Score | Overall Score | Generation Entropy |
| MEMIT | Llama2-7B | 81.04 | 64.67 | 60.95 | 67.859 | 442.59 |
| Llama3-8B | 49.68 | 49.29 | 51.31 | 50.078 | 373.48 | |
| MEMIT | Llama2-7B | 88.43 | 70.83 | 65.86 | 73.873 | 542.1 |
| + MPES | Llama3-8B | 65.78 | 57.58 | 50.25 | 57.176 | 560.78 |
| AlphaEdit | Llama2-7B | 61.1 | 55.86 | 53.75 | 56.74 | 540.92 |
| Llama3-8B | 72.67 | 63.44 | 52.9 | 61.948 | 465.81 | |
| AlphaEdit | Llama2-7B | 84.15 | 74.94 | 62.87 | 72.933 | 583.4 |
| + MPES | Llama3-8B | 88.43 | 82.08 | 56.5 | 72.832 | 565.36 |
| EMMET | Llama2-7B | 94.98 | 84.05 | 55.76 | 74.331 | 569.24 |
| Llama3-8B | 85.03 | 75.06 | 49.08 | 65.995 | 567.34 | |
| EMMET | Llama2-7B | 96.8 | 88.4 | 58.41 | 77.393 | 584.28 |
| + MPES | Llama3-8B | 92.96 | 86.12 | 55.74 | 74.424 | 564.82 |
🔼 This table presents the results of sequential knowledge editing experiments after 10,000 edits using four different methods: MEMIT, MEMIT with MPES, AlphaEdit, and AlphaEdit with MPES. The performance is evaluated across two language models (Llama-2-7B and Llama-3-8B) using five key metrics: Edit Score (ES), Paraphrase Score (PS), Neighborhood Score (NS), Overall Score (S), and Generation Entropy (GE). The table highlights the impact of incorporating MPES (Most-Probable Early Stopping) on the editing performance, demonstrating improvements in various metrics across both models and methods. It showcases the efficacy and robustness of the knowledge editing techniques, particularly when combined with MPES.
read the caption
Table 2: Sequential knowledge editing performance after 10,000 edits for different algorithms. We see that using MPES improves editing metrics across all algorithms and models.
| Method | Model | Edit Score | Paraphrase Score | Neighborhood Score | Overall Score | Generation Entropy |
| MEMIT | Llama2-7B | 81.04 | 64.67 | 60.95 | 67.859 | 442.59 |
| Llama3-8B | 49.68 | 49.29 | 51.31 | 50.078 | 373.48 | |
| MEMIT | Llama2-7B | 88.43 | 70.83 | 65.86 | 73.873 | 542.1 |
| + MPES | Llama3-8B | 65.78 | 57.58 | 50.25 | 57.17 | 560.78 |
| MEMIT | Llama2-7B | 90.94 | 81.31 | 59.73 | 74.931 | 539.58 |
| + Norm-Const | Llama3-8B | 85.72 | 77.08 | 58.45 | 71.86 | 367.46 |
| ENCORE | Llama2-7B | 92.57 | 82.64 | 60.43 | 76.043 | 560.16 |
| Llama3-8B | 88.77 | 78.19 | 60.07 | 73.707 | 523.61 |
🔼 This table presents a comparison of the editing performance of three knowledge editing methods: the baseline MEMIT approach, MEMIT enhanced with Most-Probable Early Stopping (MPES), and MEMIT further improved with both MPES and a Frobenius norm constraint. The results are shown for Llama2-7B and Llama3-8B language models, highlighting the impact of each modification on editing scores (Edit, Paraphrase, Neighborhood) and overall performance, including generation entropy. This demonstrates the effectiveness of ENCORE (Early stopping and Norm-Constrained Robust knowledge Editing), which combines MPES and the norm constraint, in achieving superior performance compared to the individual improvements and the original MEMIT method.
read the caption
Table 3: Editing performance of ENCORE when compared to baseline MEMIT and modifications using MPES and Norm Constraint.
| Model | Method | Edit Score | Paraphrase Score | Neighborhood Score | Overall Score | Generation Entropy |
| GPT2-XL | EMMET | 79.27 | 67.45 | 52.39 | 64.48 | 570.24 |
| EMMET+MPES | 95.08 | 79.47 | 56.33 | 73.43 | 555.39 | |
| AlphaEdit | 88.58 | 70.33 | 56.04 | 69.2 | 580.27 | |
| AlphaEdit + MPES | 95.52 | 82.08 | 60.03 | 76.32 | 565.44 | |
| MEMIT | 94.04 | 79.91 | 57.9 | 74.22 | 517.37 | |
| MEMIT + MPES | 91.43 | 73.68 | 61.71 | 73.68 | 532.47 | |
| Norm-Constraint | 93.89 | 80.9 | 58.0 | 74.53 | 504.68 | |
| ENCORE | 93.21 | 78.04 | 59.95 | 74.58 | 524.34 |
🔼 This table presents the knowledge editing performance results for the GPT-2-XL model on the CounterFact dataset. It compares several knowledge editing algorithms (EMMET, AlphaEdit, MEMIT, and ENCORE) and evaluates their performance when combined with the Most-Probable Early Stopping (MPES) technique. The performance is assessed using five key metrics: Efficacy Score (ES), Paraphrase Score (PS), Neighborhood Score (NS), Overall Score (S), and Generation Entropy (GE). These metrics provide a comprehensive evaluation of the accuracy, generalization, and fluency of knowledge editing across different algorithms.
read the caption
Table 4: Knowledge editing performance for GPT2-XL on the CounterFact dataset for different algorithms in combination with MPES.
| Method | Model | Edit Score | Paraphrase Score | Neighborhood Score | Overall Score | Generation Entropy |
| EMMET baseline | Llama2-7B | 93.85 | 87.32 | 58.07 | 76.281 | 579.79 |
| EMMET best-editing | Llama2-7B | 94.24 | 87.2 | 54.36 | 74.12 | 566.08 |
| EMMET best-downstream | Llama2-7B | 90.35 | 85.97 | 53.65 | 72.57 | 541.16 |
🔼 This table presents the editing performance results for the EMMET algorithm using the Llama2-7B model, specifically focusing on how the inclusion of a norm constraint affects the editing performance. It compares the baseline EMMET performance with two variations that incorporate the norm constraint: one optimized for the best overall editing score and the other optimized for the best downstream performance.
read the caption
Table 5: Editing performance for EMMET with Llama2-7B with norm constraint.
| Method | Model | Probability Cut Off | ||
| EMMET + MPES | GPT2-XL | 10,000 | +1 | |
| Llama2-7B | 15,000 | +0 | ||
| Llama3-8B | 15,000 | +0 | ||
| AlphaEdit + MPEs | GPT2-XL | 20,000 | +1 | |
| Llama2-7B | 15,000 | +0 | ||
| Llama3-8B | 15,000 | +0 | ||
| MEMIT + MPEs | GPT2-XL | 20,000 | +2 | |
| Llama2-7B | 15,000 | +1 | ||
| Llama3-8B | 15,000 | +2 |
🔼 This table presents the hyperparameters used for different knowledge editing algorithms when combined with the Most-Probable Early Stopping (MPES) technique. It shows the specific values of λp (lambda p), the probability cutoff parameter, and the model used (GPT2-XL, Llama2-7B, Llama3-8B) for each algorithm (EMMET, AlphaEdit, MEMIT). These settings are crucial for fine-tuning the algorithms’ performance and controlling for overfitting during the knowledge editing process on the CounterFact dataset.
read the caption
Table 6: Hyperparameters for different algorithms with MPES on CouterFact dataset
| Method | Model | ||
| Norm Constraint | GPT2-XL | 20,000 | 10 |
| Llama2-7B | 15,000 | 10 | |
| Llama3-8B | 15,000 | 20 |
🔼 This table shows the hyperparameters used for the norm constraint method on the CounterFact dataset. It lists the model (GPT2-XL, Llama2-7B, Llama3-8B), the lambda parameter (λ), and the hyperparameter A for each model. These values were used in the experiments involving the norm constraint technique.
read the caption
Table 7: Hyperparameters for Norm Constraint on CouterFact dataset
| Method | Model | Probability Cut Off | ||
| ENCORE | GPT2-XL | 20,000 | 10 | +3 |
| Llama2-7B | 15,000 | 10 | +2 | |
| Llama3-8B | 15,000 | 20 | +1 |
🔼 This table presents the optimal hyperparameters for the ENCORE model when fine-tuning on the CounterFact dataset. It lists the model (GPT2-XL, Llama2-7B, Llama3-8B), the lambda parameter (λ), the hyperparameter for the norm constraint (λn), and the probability cutoff used for early stopping. These values were determined empirically to yield optimal performance with the ENCORE method on this dataset.
read the caption
Table 8: Hyperparameters for ENCORE on CouterFact dataset
| Method | Model | Probability Cut Off | ||
| EMMET + MPES | GPT2-XL | 10,000 | +1 | |
| Llama2-7B | 15,000 | +1 | ||
| Llama3-8B | 15,000 | +2 | ||
| AlphaEdit + MPEs | GPT2-XL | 20,000 | +1 | |
| Llama2-7B | 15,000 | +1 | ||
| Llama3-8B | 15,000 | +3 | ||
| MEMIT + MPEs | GPT2-XL | 20,000 | +5 | |
| Llama2-7B | 15,000 | +1 | ||
| Llama3-8B | 15,000 | +4 |
🔼 This table presents the hyperparameters used for different knowledge editing algorithms when combined with Most-Probable Early Stopping (MPES) on the zsRE dataset. It shows the values of λp (lambda p), λn (lambda n), and the probability cutoff for each algorithm (EMMET, AlphaEdit, and MEMIT) across three different language models (GPT2-XL, Llama2-7B, and Llama3-8B). These hyperparameters were fine-tuned for optimal performance on the zsRE dataset.
read the caption
Table 9: Hyperparameters for different algorithms with MPES on zsRE dataset
| Method | Model | ||
| Norm Constraint | GPT2-XL | 20,000 | 40 |
| Llama2-7B | 15,000 | 10 | |
| Llama3-8B | 15,000 | 20 |
🔼 This table presents the hyperparameters used for the norm constraint method on the zsRE dataset. It shows the model (GPT2-XL, Llama2-7B, Llama3-8B), the hyperparameter λ for the norm constraint (40, 10, 20 respectively), and the hyperparameter A which is the Frobenius norm constraint (20000, 15000, 15000 respectively).
read the caption
Table 10: Hyperparameters for Norm Constraint on zsRE dataset
| Method | Model | Probability Cut Off | ||
| ENCORE | GPT2-XL | 20,000 | 40 | +4 |
| Llama2-7B | 15,000 | 10 | +2 | |
| Llama3-8B | 15,000 | 10 | +3 |
🔼 This table presents the hyperparameters used for the ENCORE model on the zsRE dataset. It details the values of lambda_p (λp), lambda_n (λn), and the probability cutoff used during the training process. These values were specifically tuned for the ENCORE model and this specific dataset to achieve optimal performance in the knowledge editing task. The table shows hyperparameter settings for GPT2-XL, Llama2-7B, and Llama3-8B models.
read the caption
Table 11: Hyperparameters for ENCORE on zsRE dataset
| Model | Method | Edit Score | Paraphrase Score | Neighborhood Score |
| GPT2-XL | EMMET | 39.71 | 27.17 | 9.78 |
| EMMET+MPES | 53.55 | 39.42 | 16.81 | |
| AlphaEdit | 42.1 | 33.61 | 14.61 | |
| AlphaEdit + MPES | 54.99 | 43.18 | 18.4 | |
| MEMIT | 74.6 | 61.77 | 22.4 | |
| MEMIT + MPES | 75.09 | 61.58 | 23.37 | |
| Norm-Constraint | 74.51 | 61.9 | 23.39 | |
| ENCORE | 74.46 | 61.79 | 23.41 |
🔼 This table presents the editing performance of different knowledge editing methods on the GPT2-XL model using the zsRE dataset. It shows the efficacy, paraphrase score, and neighborhood score for each method. These metrics evaluate the success of the edit, the model’s ability to generalize to paraphrases of the edited fact, and the impact on related knowledge, respectively.
read the caption
Table 12: Editing performance for GPT2-XL on zsre dataset
| Model | Method | Edit Score | Paraphrase Score | Neighborhood Score |
| Llama2-7B | EMMET | 75.42 | 69.69 | 33.89 |
| EMMET+MPES | 84.07 | 76.9 | 41.88 | |
| AlphaEdit | 83.77 | 77.12 | 41.96 | |
| AlphaEdit + MPES | 83.8 | 77.64 | 41.97 | |
| MEMIT | 79.49 | 74.29 | 41.8 | |
| MEMIT + MPES | 83.01 | 77.45 | 44.64 | |
| Norm-Constraint | 88.73 | 84.05 | 47.98 | |
| ENCORE | 89.1 | 84.28 | 48.51 |
🔼 This table presents the performance of different knowledge editing methods on the Llama 2-7B model using the zsRE dataset. The metrics evaluated include the Edit Score, Paraphrase Score, and Neighborhood Score, providing a comprehensive assessment of each method’s effectiveness in modifying the model’s factual knowledge.
read the caption
Table 13: Editing performance for Llama2-7B on zsre dataset
| Model | Method | Edit Score | Paraphrase Score | Neighborhood Score |
| Llama3-8B | EMMET | 96.97 | 90.96 | 45.26 |
| EMMET+MPES | 96.75 | 91.31 | 46.44 | |
| AlphaEdit | 89.27 | 82.19 | 45.23 | |
| AlphaEdit + MPES | 93.54 | 85.93 | 47.32 | |
| MEMIT | 96.45 | 90.3 | 48.91 | |
| MEMIT + MPES | 96.85 | 90.76 | 47.34 | |
| Norm-Constraint | 90.4 | 84.58 | 49.09 | |
| ENCORE | 93.15 | 86.19 | 49.81 |
🔼 This table presents the performance of different knowledge editing methods on the Llama3-8B model using the zsRE dataset. It shows the efficacy (EDIT SCORE), generalization (PARAPHRASE SCORE), locality (NEIGHBORHOOD SCORE) and overall performance (OVERALL SCORE) of each method. The methods compared include EMMET, EMMET with MPES, AlphaEdit, AlphaEdit with MPES, MEMIT, MEMIT with MPES, MEMIT with norm constraint, and ENCORE. The scores are presented to allow for comparison and evaluation of the effectiveness of each technique in terms of accuracy, consistency, and potential interference with previously learned knowledge.
read the caption
Table 14: Editing performance for Llama3-8B on zsre dataset
Full paper#