TL;DR#
Large vision-language models (LVLMs) are powerful but prone to “hallucinations,” generating text that’s grammatically correct but factually inaccurate or unrelated to the image. This is a significant problem, limiting their use in real-world applications. Existing solutions often require retraining or extra data, making them impractical.
This paper introduces VISTA, a novel approach that doesn’t need extra training. It analyzes how LVLMs handle information during generation, pinpointing three key issues. Based on these, VISTA uses two simple techniques to guide the generation process towards more accurate and visually grounded outputs. Experiments show that VISTA significantly reduces hallucinations across multiple LVLMs and various generation methods. This is done with a training-free approach making it easy to apply to already existing systems.
Key Takeaways#
Why does it matter?#
This paper is crucial because it tackles the pervasive problem of hallucination in large vision-language models (LVLMs). By offering a training-free, inference-time solution (VISTA), it directly addresses a major obstacle hindering LVLMs’ real-world applicability. The insights into LVLMs’ internal dynamics and the proposed method are highly relevant to current research efforts focused on improving LVLMs’ reliability and trustworthiness. VISTA’s efficiency and broad applicability make it a significant contribution, opening new avenues for research into more robust and reliable multimodal AI systems.
Visual Insights#

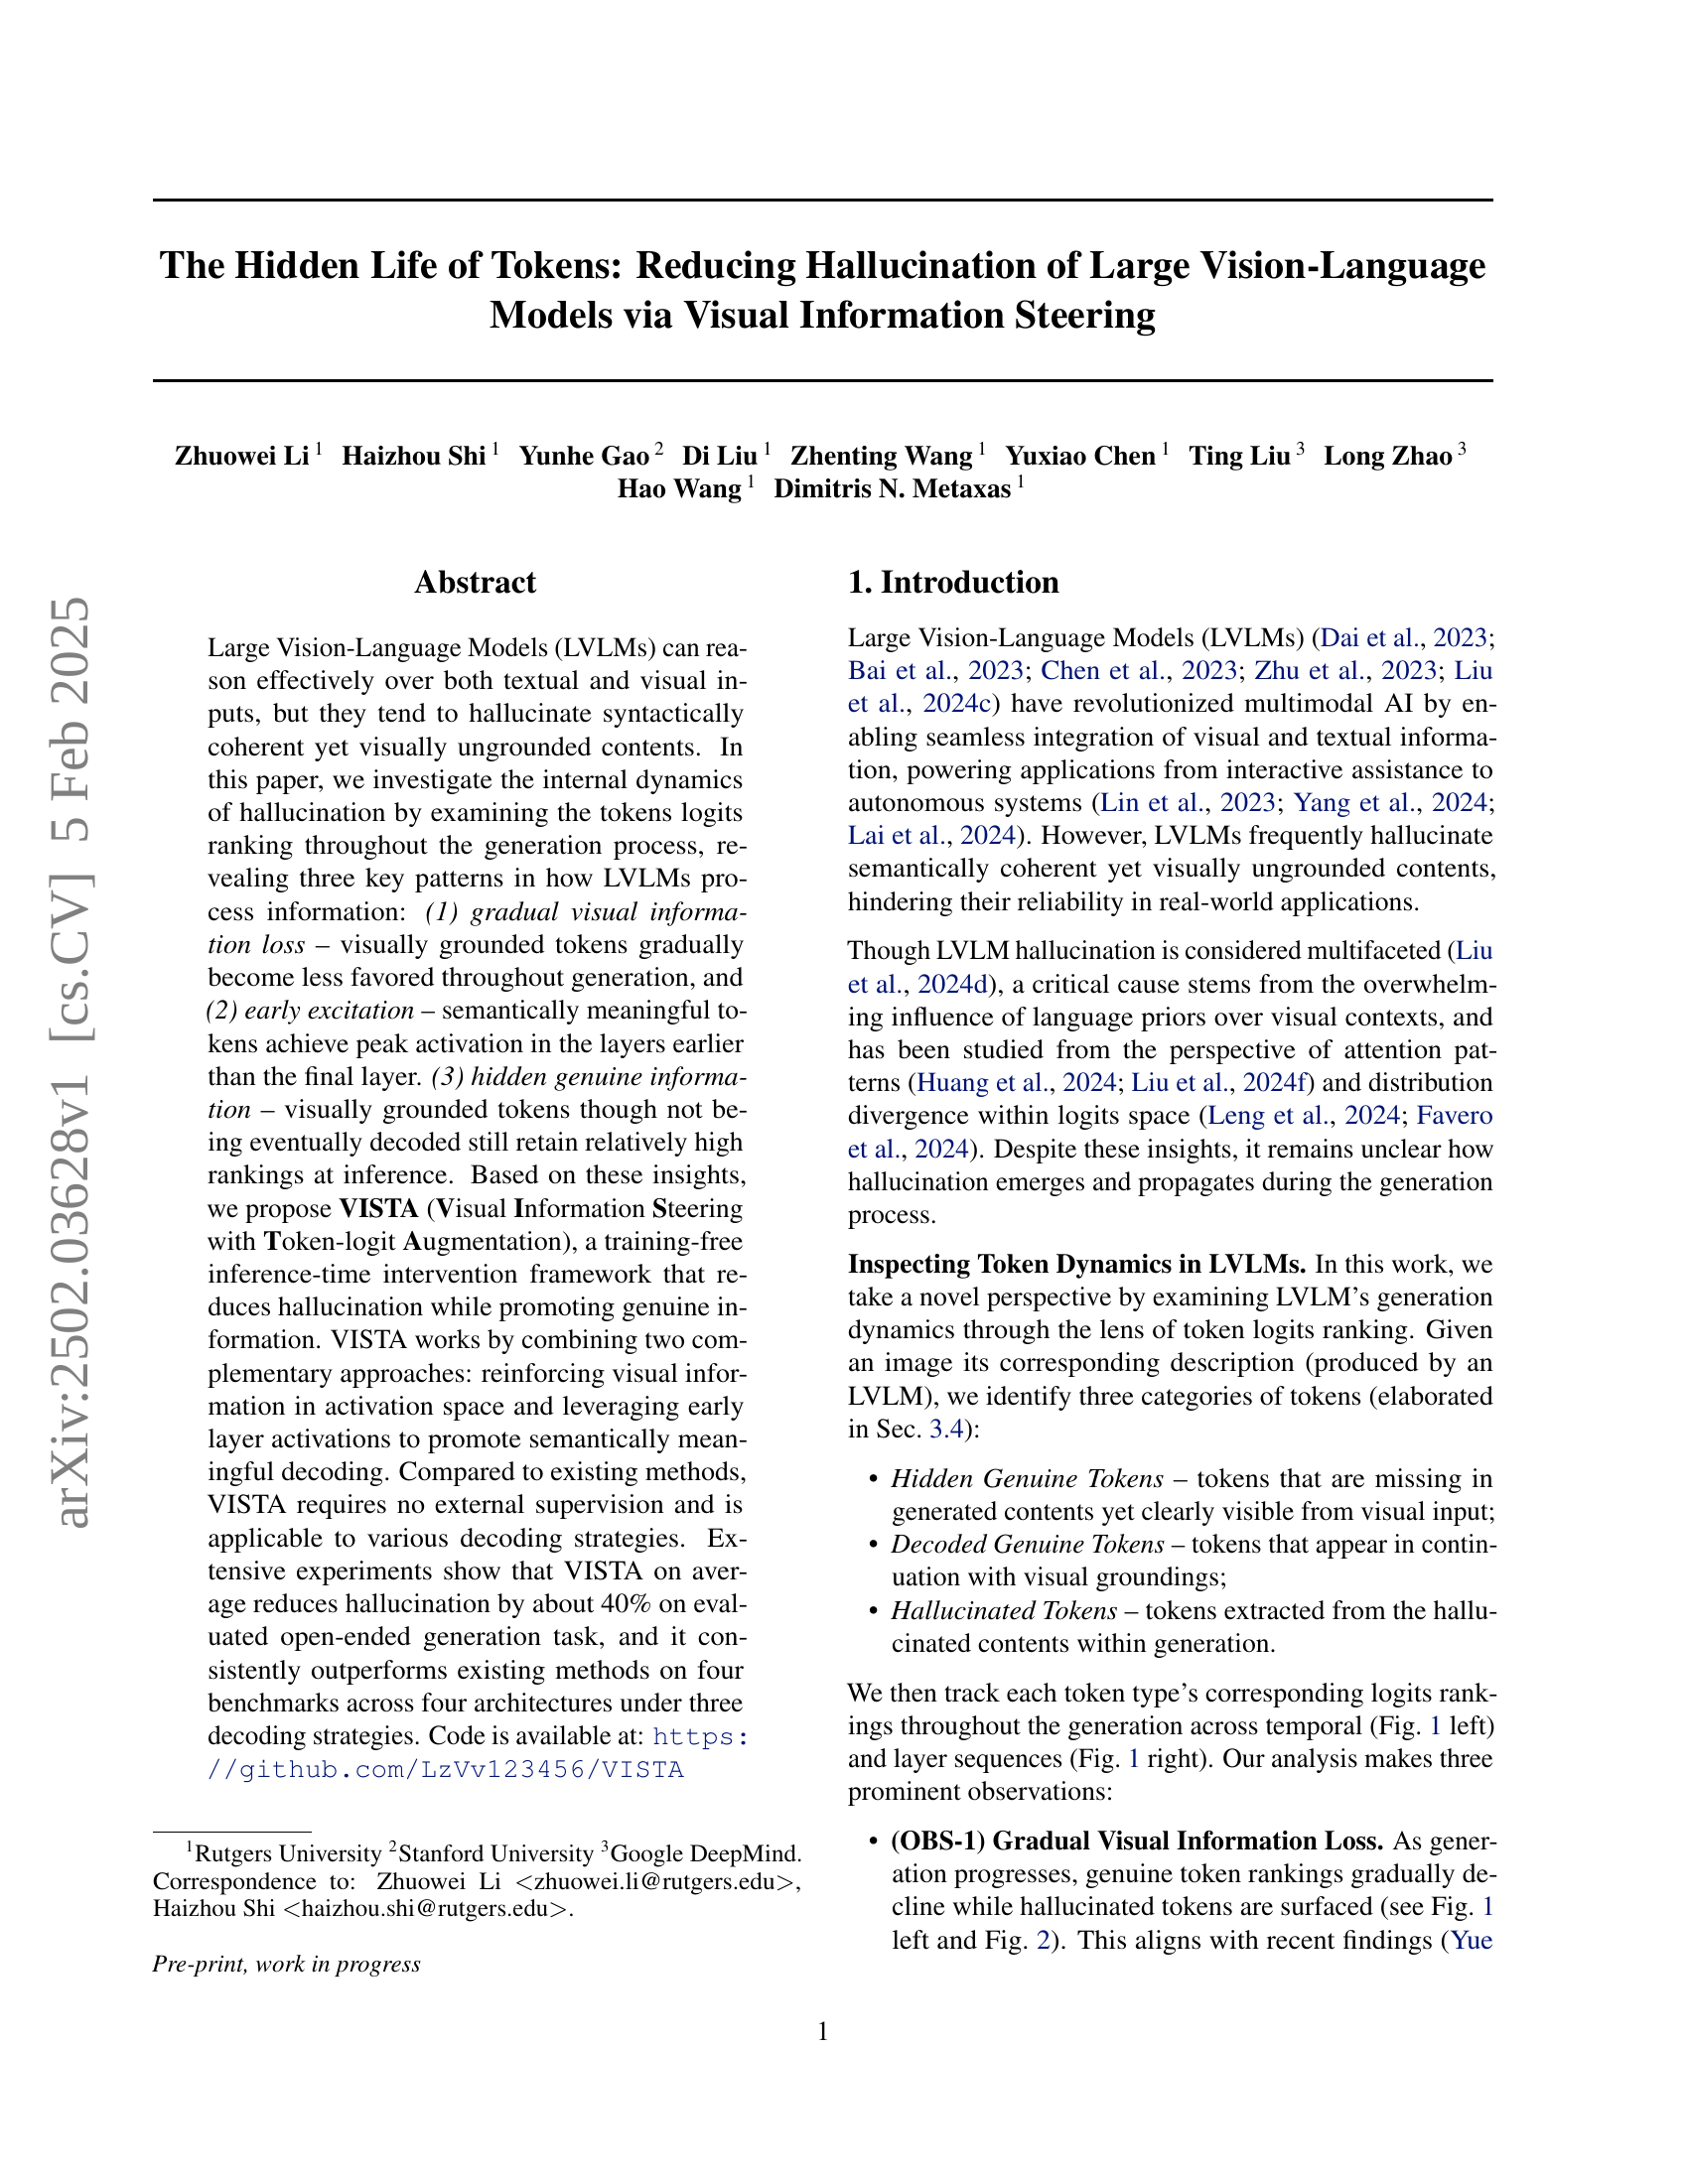
🔼 This figure analyzes token ranking patterns during the image caption generation process of Large Vision-Language Models (LVLMs). It uses data from 500 randomly selected images from the MS COCO dataset. The left panel shows the average token ranking across the last five layers of the LVLMs, illustrating how token rankings change over time (early, mid, and late generation stages). The right panel displays the average token ranking across all time steps for each layer, highlighting the ’early excitation’ phenomenon where semantically meaningful tokens reach peak activation earlier in the network layers than the final layer.
read the caption
Figure 1: Analysis of token logits ranking patterns across 500 randomly selected images from MSCOCO dataset. Higher ranking indicates higher generation probability. Left: Average token ranking from the last five layers, showing temporal progression across early, mid, and late generation stages. Right: Layer-wise evolution of token rankings averaged across all time steps, demonstrating early-excitation phenomenon.
| Decoding | Method | LLAVA-1.5 (Liu et al., 2024a) | MiniGPT-4 (Zhu et al., 2023) | Shikra (Chen et al., 2023) | InstructBLIP (Dai et al., 2023) | ||||
|---|---|---|---|---|---|---|---|---|---|
| CHAIR | CHAIR | CHAIR | CHAIR | CHAIR | CHAIR | CHAIR | CHAIR | ||
| Greedy | Vanilla | 46.4 | 12.1 | 35.2 | 10.7 | 56.8 | 14.8 | 38.0 | 10.7 |
| DoLa (Chuang et al., 2024) | 45.4 | 11.9 | - | - | 60.0 | 15.1 | - | - | |
| VCD (Leng et al., 2024) | 47.4 | 13.0 | - | - | - | - | 45.8 | 12.8 | |
| PAI (Liu et al., 2024f) | 22.8 | 7.0 | 29.2 | 10.9 | 40.8 | 11.0 | - | - | |
| VISTA (ours) | 20.4 | 6.9 | 19.8 | 6.0 | 31.4 | 9.7 | 27.4 | 8.1 | |
| Beam Search | Vanilla | 49.0 | 12.5 | 33.0 | 11.0 | 53.8 | 14.4 | 37.8 | 10.7 |
| VCD (Leng et al., 2024) | 49.8 | 12.4 | - | - | - | - | 49.2 | 13.7 | |
| OPERA (Huang et al., 2024) | 45.2 | 12.4 | 26.8 | 9.3 | 39.6 | 12.2 | 50.2 | 13.9 | |
| PAI (Liu et al., 2024f) | 22.3 | 6.8 | 31.6 | 11.2 | 41.6 | 10.4 | - | - | |
| VISTA (ours) | 17.4 | 6.3 | 18.4 | 6.4 | 32.2 | 9.5 | 26.8 | 7.8 | |
| Nucleus Sampling | Vanilla | 53.2 | 15.1 | 34.8 | 11.2 | 56.4 | 15.9 | 46.6 | 13.1 |
| DoLa (Chuang et al., 2024) | 47.2 | 14.0 | - | - | 56.6 | 16.3 | - | - | |
| VCD (Leng et al., 2024) | 60.8 | 16.2 | - | - | - | - | 57.0 | 16.0 | |
| PAI (Liu et al., 2024f) | 30.2 | 10.3 | 31.8 | 13.2 | 43.2 | 12.0 | - | - | |
| VISTA (ours) | 24.0 | 8.2 | 18.4 | 6.4 | 31.8 | 9.7 | 29.4 | 9.1 | |
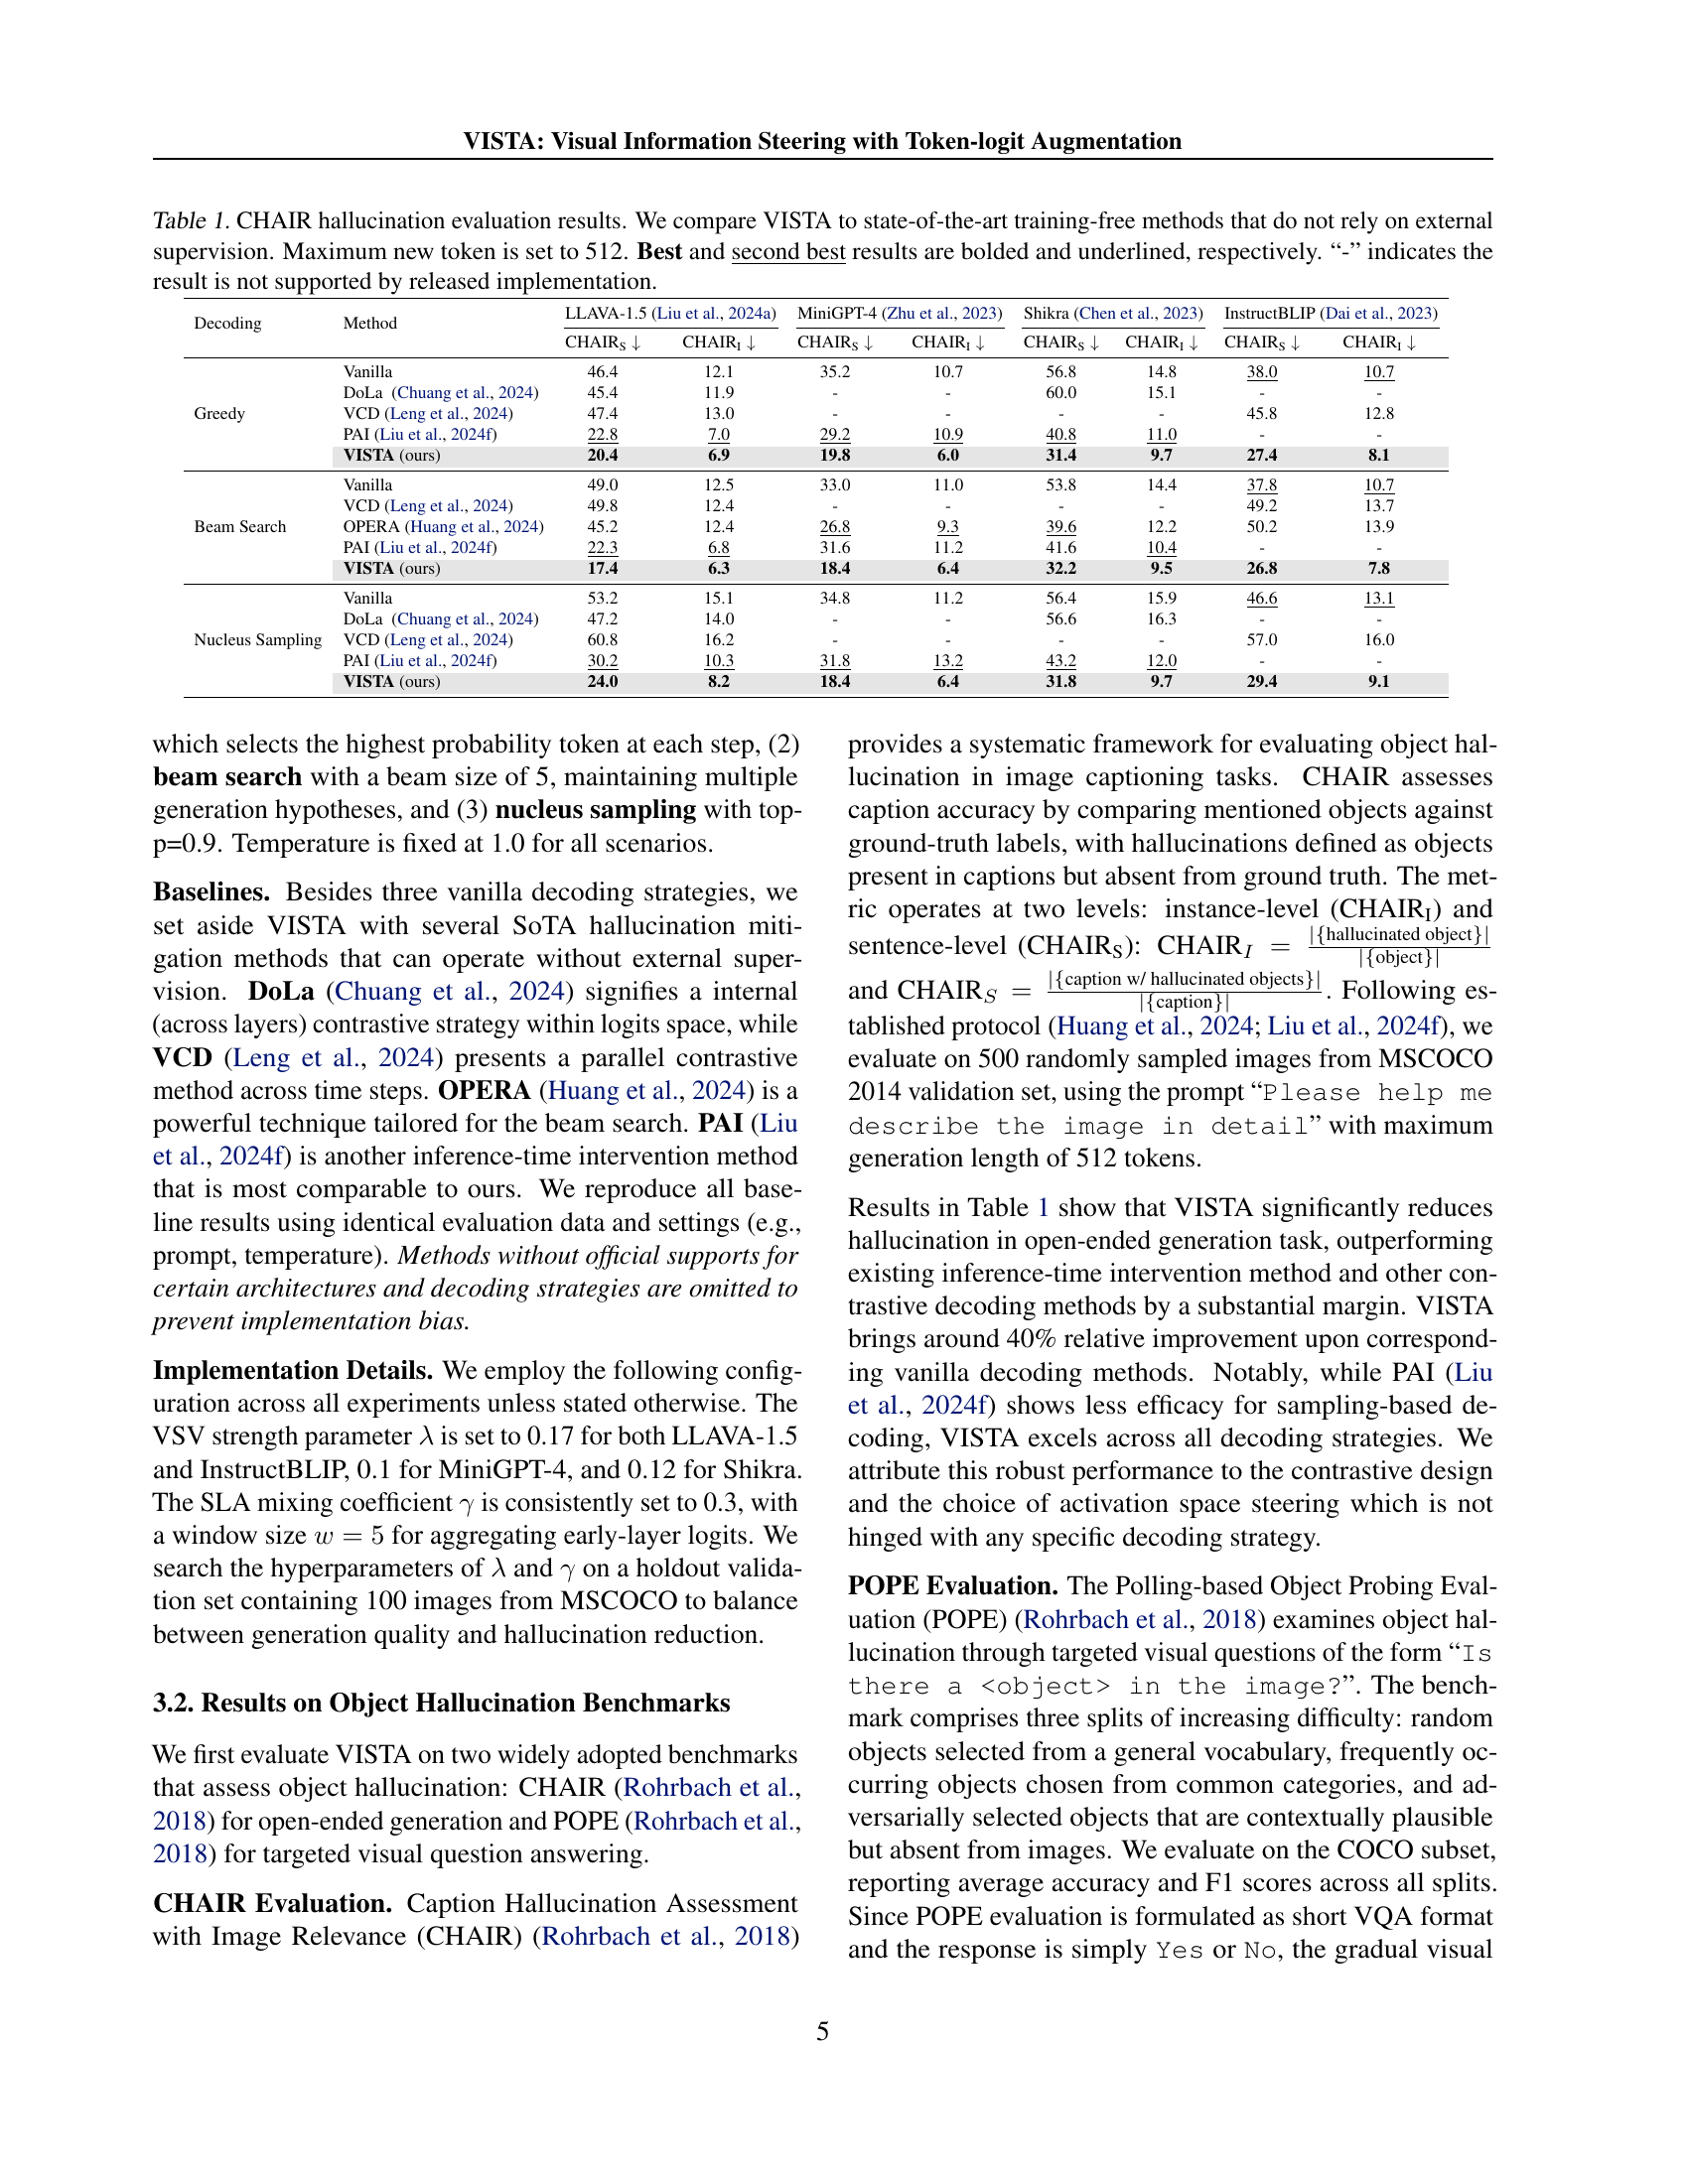
🔼 Table 1 presents a comprehensive comparison of VISTA’s performance against several state-of-the-art training-free hallucination reduction methods on the CHAIR benchmark. The results are broken down by model architecture (LLaVA-1.5, MiniGPT-4, Shikra, InstructBLIP), decoding strategy (greedy, beam search, nucleus sampling), and evaluation metric (CHAIRs and CHAIR₁). The maximum number of generated tokens was limited to 512. The table highlights VISTA’s consistent improvement across various models and decoding strategies, showcasing its effectiveness in reducing hallucination without requiring additional training or external supervision. Results not available due to limitations in the released implementations are indicated with a hyphen.
read the caption
Table 1: CHAIR hallucination evaluation results. We compare VISTA to state-of-the-art training-free methods that do not rely on external supervision. Maximum new token is set to 512. Best and second best results are bolded and underlined, respectively. “-” indicates the result is not supported by released implementation.
In-depth insights#
Token Dynamics#
Analyzing token dynamics in large vision-language models (LVLMs) offers crucial insights into their internal mechanisms and limitations. Tracking token rankings throughout the generation process reveals key patterns: a gradual loss of visual information where visually grounded tokens become less prominent, an early excitation of semantically meaningful tokens reaching peak activation before the final layer, and the presence of hidden genuine information, where visually relevant tokens maintain high rank despite not being selected for output. Understanding these dynamics is essential to address the challenge of hallucination, as the observed patterns directly relate to the tendency of LVLMs to prioritize language priors over visual context. By analyzing token dynamics, researchers can uncover the interplay of visual and linguistic information in LVLMs, ultimately informing the development of methods to improve their reliability and reduce the occurrence of visually ungrounded outputs.
VISTA Framework#
The VISTA framework, as described in the research paper, is a novel, training-free method designed to reduce hallucination in Large Vision-Language Models (LVLMs) during inference. It cleverly leverages insights into the dynamics of token logits ranking throughout the generation process, identifying patterns of gradual visual information loss and early excitation of semantically meaningful tokens. VISTA’s core innovation lies in its two-pronged approach: first, it introduces a Visual Steering Vector (VSV) to reinforce visual information in activation space, counteracting the observed information loss. Second, it utilizes a Self-Logits Augmentation (SLA) method, leveraging the early layer activation of important tokens to promote their decoding. The strength of VISTA is its training-free nature and broad applicability. It does not require model modifications or additional training data and can be integrated with various decoding strategies (greedy, beam search, nucleus sampling). By combining VSV and SLA synergistically, VISTA effectively mitigates hallucination while promoting genuine, visually-grounded information, resulting in more reliable and accurate LVLMs output. The method’s efficiency and flexibility make it a practical solution for improving existing LVLMs without significant computational overhead.
Hallucination Study#
A hypothetical “Hallucination Study” section in a vision-language model research paper would likely delve into the phenomenon of model hallucinations, exploring their causes, characteristics, and potential mitigation strategies. The study might involve a detailed analysis of the model’s internal workings during generation, possibly using techniques like logit analysis to track the probability scores of different tokens. It could investigate the relative contributions of visual and textual information to the generation process, identifying scenarios where language biases overwhelm visual cues, leading to hallucinatory outputs. The research may also explore the influence of various decoding strategies (greedy, beam search, nucleus sampling) on the frequency and nature of hallucinations. Quantitative metrics such as precision, recall, and F1-score would likely be employed to evaluate the severity of hallucinations across different tasks. Furthermore, the study might propose and evaluate new methods for mitigating hallucinations, such as training-free inference-time interventions that adjust the model’s internal activations or logits. The evaluation could compare the effectiveness of the proposed method(s) against existing techniques. Finally, the “Hallucination Study” section should provide a conclusive discussion summarizing the key findings, their implications for the development of more reliable vision-language models, and directions for future research.
Ablation Analysis#
Ablation studies systematically evaluate the contribution of individual components within a complex system. In the context of a research paper, an ablation analysis section would dissect a proposed method, removing or altering parts to understand their impact on overall performance. This helps isolate the key components driving the success of the method. A well-executed ablation study will show not only what works well but also why it works. For example, if a model uses several techniques, removing each one individually will reveal whether it is essential for improving the results or if another component could be removed instead. The results highlight the relative importance of each component, guiding future design choices and refinement of the proposed approach. A well-designed ablation study strengthens the paper’s findings by demonstrating the robustness and necessity of the employed techniques, rather than simply reporting overall performance. The clarity and detail in presenting ablation study results significantly contribute to the paper’s overall credibility and impact.
Future Work#
Future work in this area could explore several promising avenues. Expanding VISTA’s applicability to a broader range of LVLMs and decoding strategies is crucial to establish its generalizability and robustness. Investigating the potential for integrating VISTA with other hallucination reduction techniques could lead to synergistic improvements. A deeper understanding of the interplay between VSV and SLA, perhaps through more detailed ablation studies, could lead to even more effective methods. Finally, exploring the use of VISTA in interactive scenarios such as visual dialogue or question answering would greatly enhance its practical value and would necessitate further research into the dynamics of multi-turn interactions. The impact of different visual encoders on VISTA’s performance should also be examined.
More visual insights#
More on figures

🔼 This figure visualizes the changes in token rankings over time and across different layers of a Large Vision-Language Model (LVLM) during the text generation process. The heatmaps show the ranking of tokens (words) based on their probability of being generated at each step. Specifically, it tracks three types of tokens: 1) Hidden Genuine Tokens: Words that are visually present in the image but missing from the generated caption. 2) Decoded Genuine Tokens: Words correctly included in the caption that are visually grounded in the image. 3) Hallucinated Tokens: Words present in the generated caption that lack visual grounding in the image. The heatmaps reveal two key phenomena: 1) Gradual Visual Information Loss: As generation proceeds, genuine tokens (both decoded and hidden) decrease in ranking, while hallucinated tokens rise in ranking. 2) Early Excitation: Semantically meaningful tokens reach their peak activation earlier in the network’s layers than the final layer, suggesting a shift towards syntactic elements in the final layer’s decisions. Darker colors represent higher probability (i.e., higher ranking) for the tokens.
read the caption
Figure 2: Token ranking heatmaps for a representative image, demonstrating the evolution of token rankings across model layers (vertical axis) and generation steps (horizontal axis). Darker colors indicate higher ranking. The visualization reveals both gradual visual information loss and early excitation phenomena.
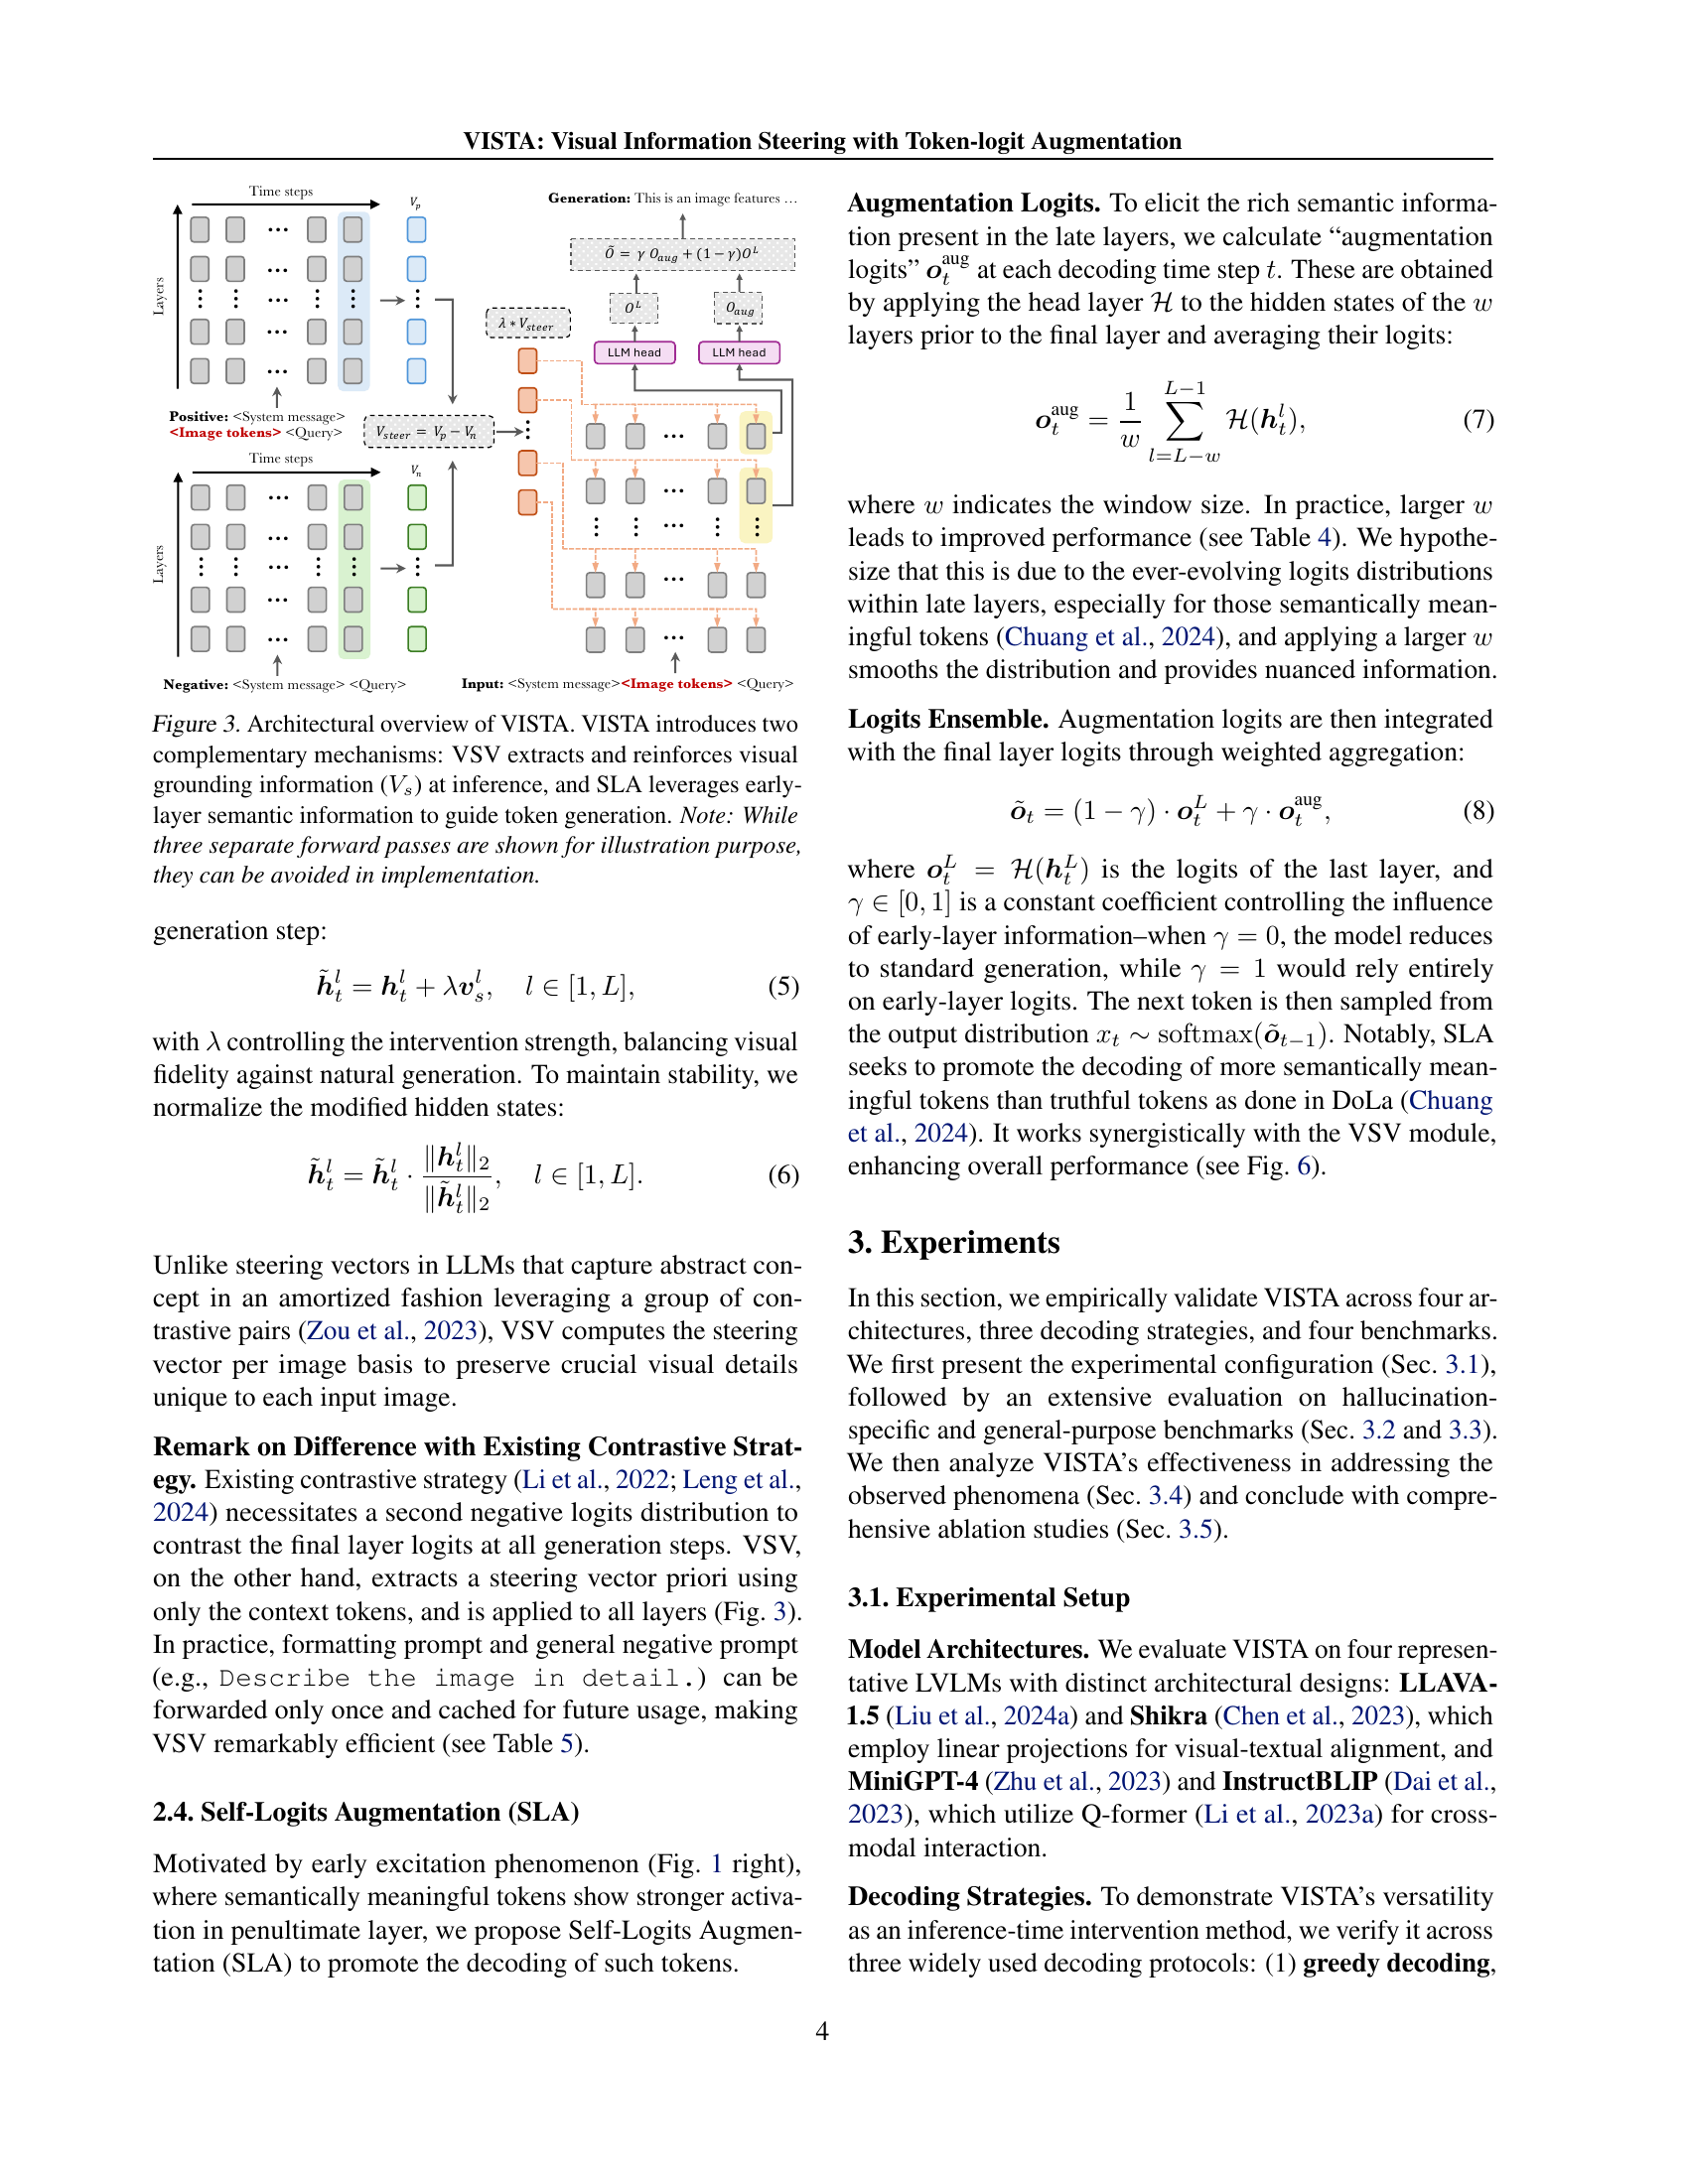
🔼 VISTA, a training-free method for reducing hallucination in large vision-language models (LVLMs), is presented in this figure. It consists of two modules: Visual Steering Vector (VSV) and Self-Logits Augmentation (SLA). VSV leverages visual information from the image to counteract the loss of visual information during text generation. It does so by injecting a visual steering vector into the residual stream at each layer. Meanwhile, SLA uses the early excitation pattern of semantically meaningful tokens to guide decoding by incorporating early-layer logits into the final layer’s logits. The figure shows the flow of information through both modules. Note that while three separate forward passes are illustrated, they are not necessary in the actual implementation.
read the caption
Figure 3: Architectural overview of VISTA. VISTA introduces two complementary mechanisms: VSV extracts and reinforces visual grounding information (Vssubscript𝑉𝑠V_{s}italic_V start_POSTSUBSCRIPT italic_s end_POSTSUBSCRIPT) at inference, and SLA leverages early-layer semantic information to guide token generation. Note: While three separate forward passes are shown for illustration purpose, they can be avoided in implementation.

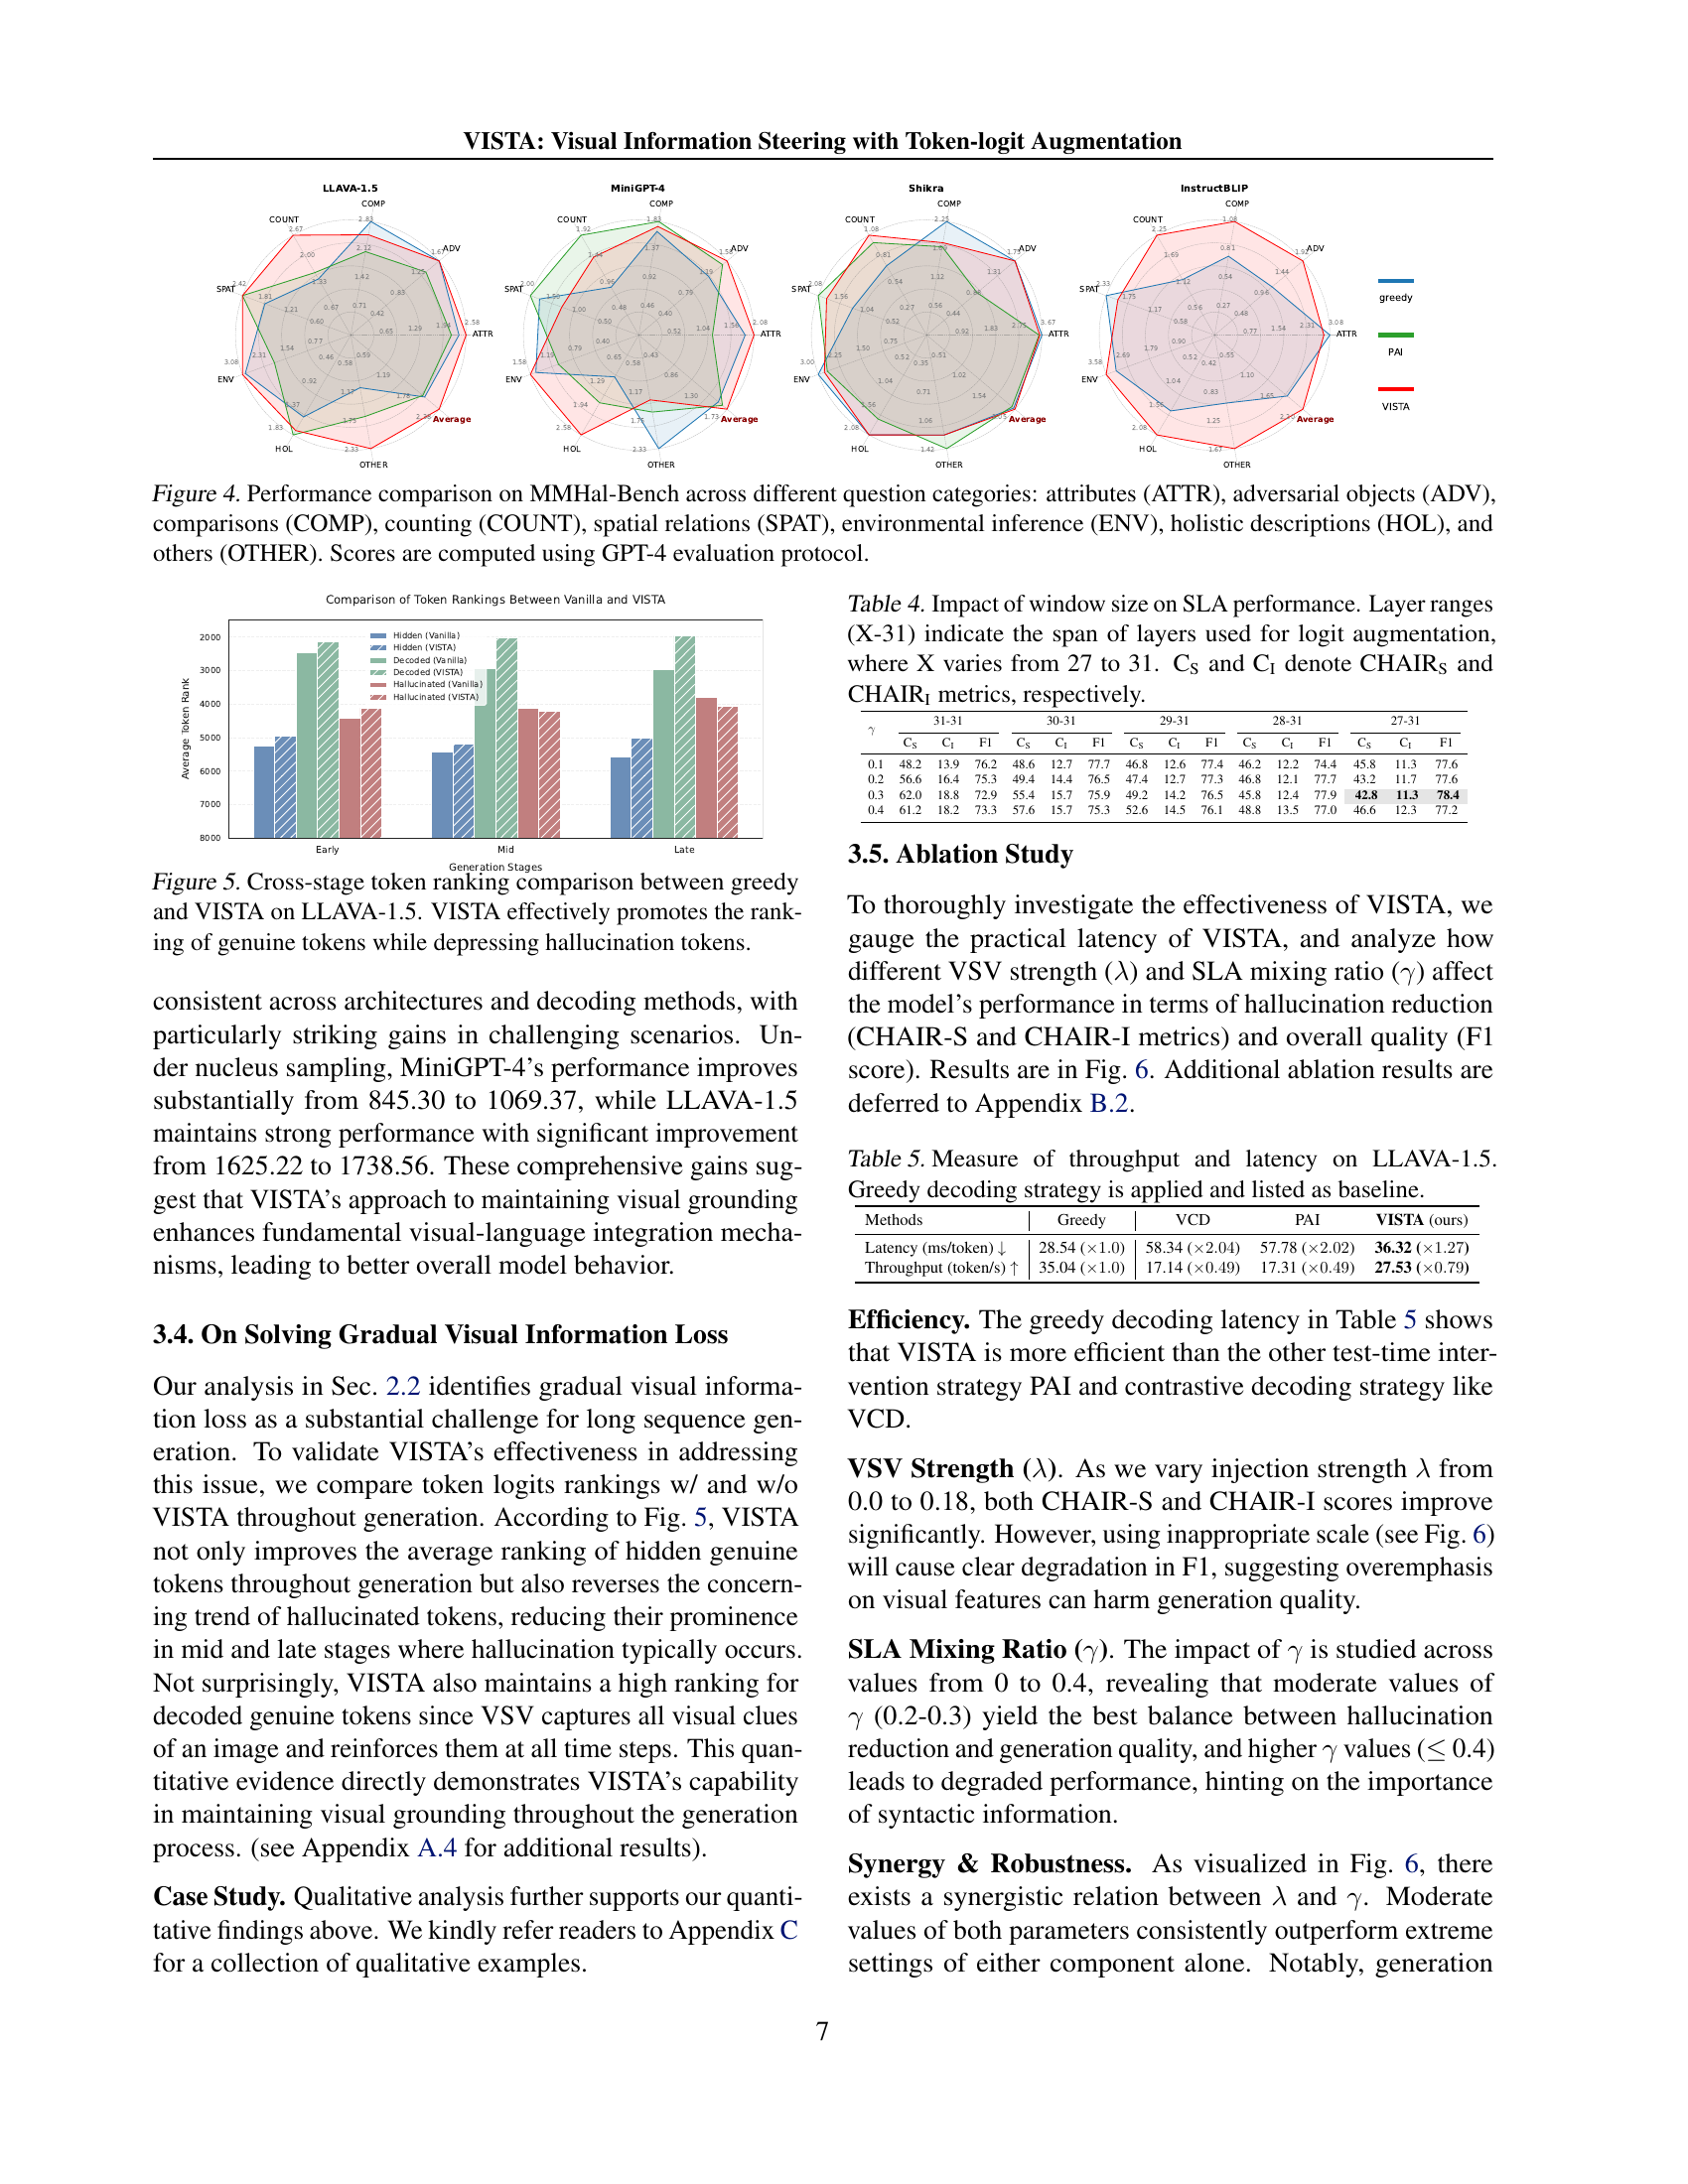
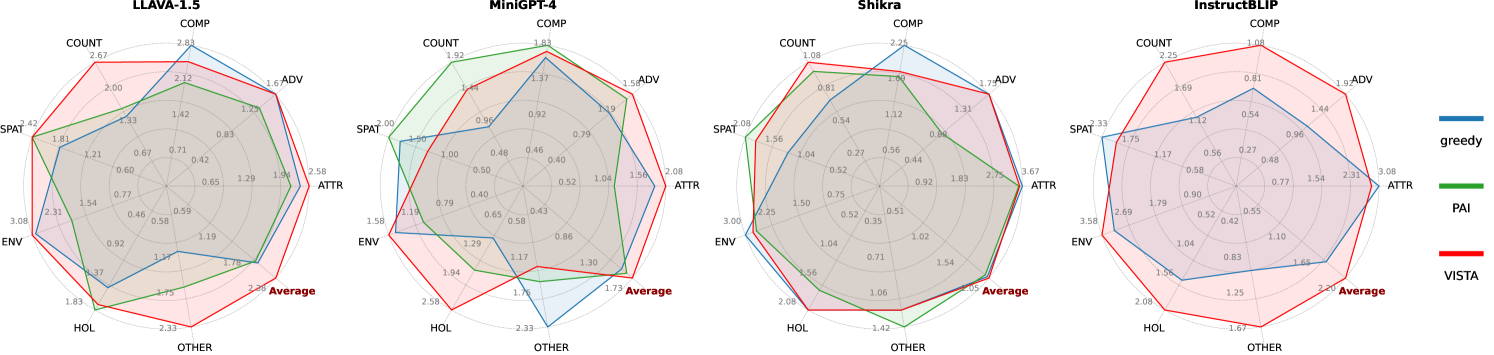
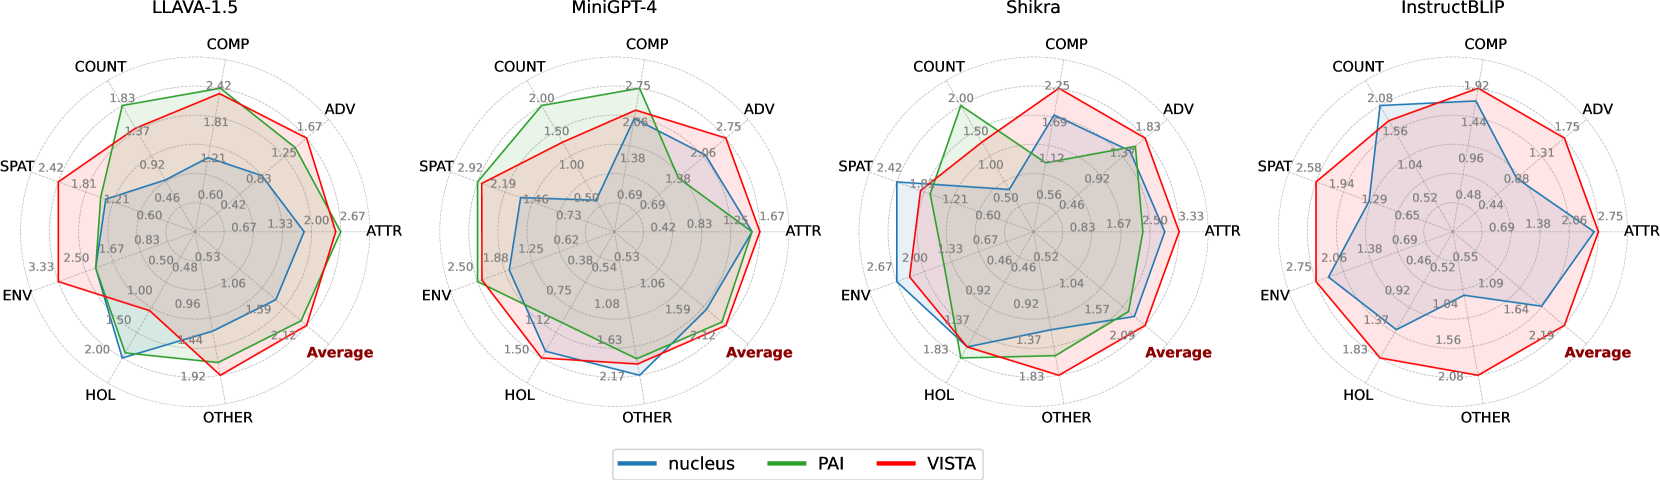
🔼 Figure 4 presents a detailed performance comparison of different Large Vision Language Models (LVLMs) on the MMHal-Bench benchmark. MMHal-Bench is a comprehensive evaluation suite focusing on eight distinct question categories designed to assess various aspects of visual-language reasoning and holistic understanding. The categories are: Attributes (ATTR), Adversarial Objects (ADV), Comparisons (COMP), Counting (COUNT), Spatial Relations (SPAT), Environmental Inference (ENV), Holistic Descriptions (HOL), and Others (OTHER). The figure visually represents the performance of each model within each of these categories, showing their relative strengths and weaknesses in different aspects of visual-language understanding. Performance scores are computed using GPT-4, a large language model serving as an evaluation oracle.
read the caption
Figure 4: Performance comparison on MMHal-Bench across different question categories: attributes (ATTR), adversarial objects (ADV), comparisons (COMP), counting (COUNT), spatial relations (SPAT), environmental inference (ENV), holistic descriptions (HOL), and others (OTHER). Scores are computed using GPT-4 evaluation protocol.

🔼 This figure displays a comparison of token rankings across different stages of text generation for both a standard greedy decoding method and the proposed VISTA method, using the LLAVA-1.5 model. The x-axis represents the generation stages (Early, Mid, Late), and the y-axis shows the average token rank. Different colored lines represent different token types: Hidden Genuine Tokens (tokens present in the image but not generated), Decoded Genuine Tokens (tokens present in the image and generated), and Hallucinated Tokens (tokens not present in the image but generated). The graph visually demonstrates that VISTA effectively improves the ranking of genuine tokens (both hidden and decoded) while simultaneously reducing the ranking of hallucinated tokens.
read the caption
Figure 5: Cross-stage token ranking comparison between greedy and VISTA on LLAVA-1.5. VISTA effectively promotes the ranking of genuine tokens while depressing hallucination tokens.

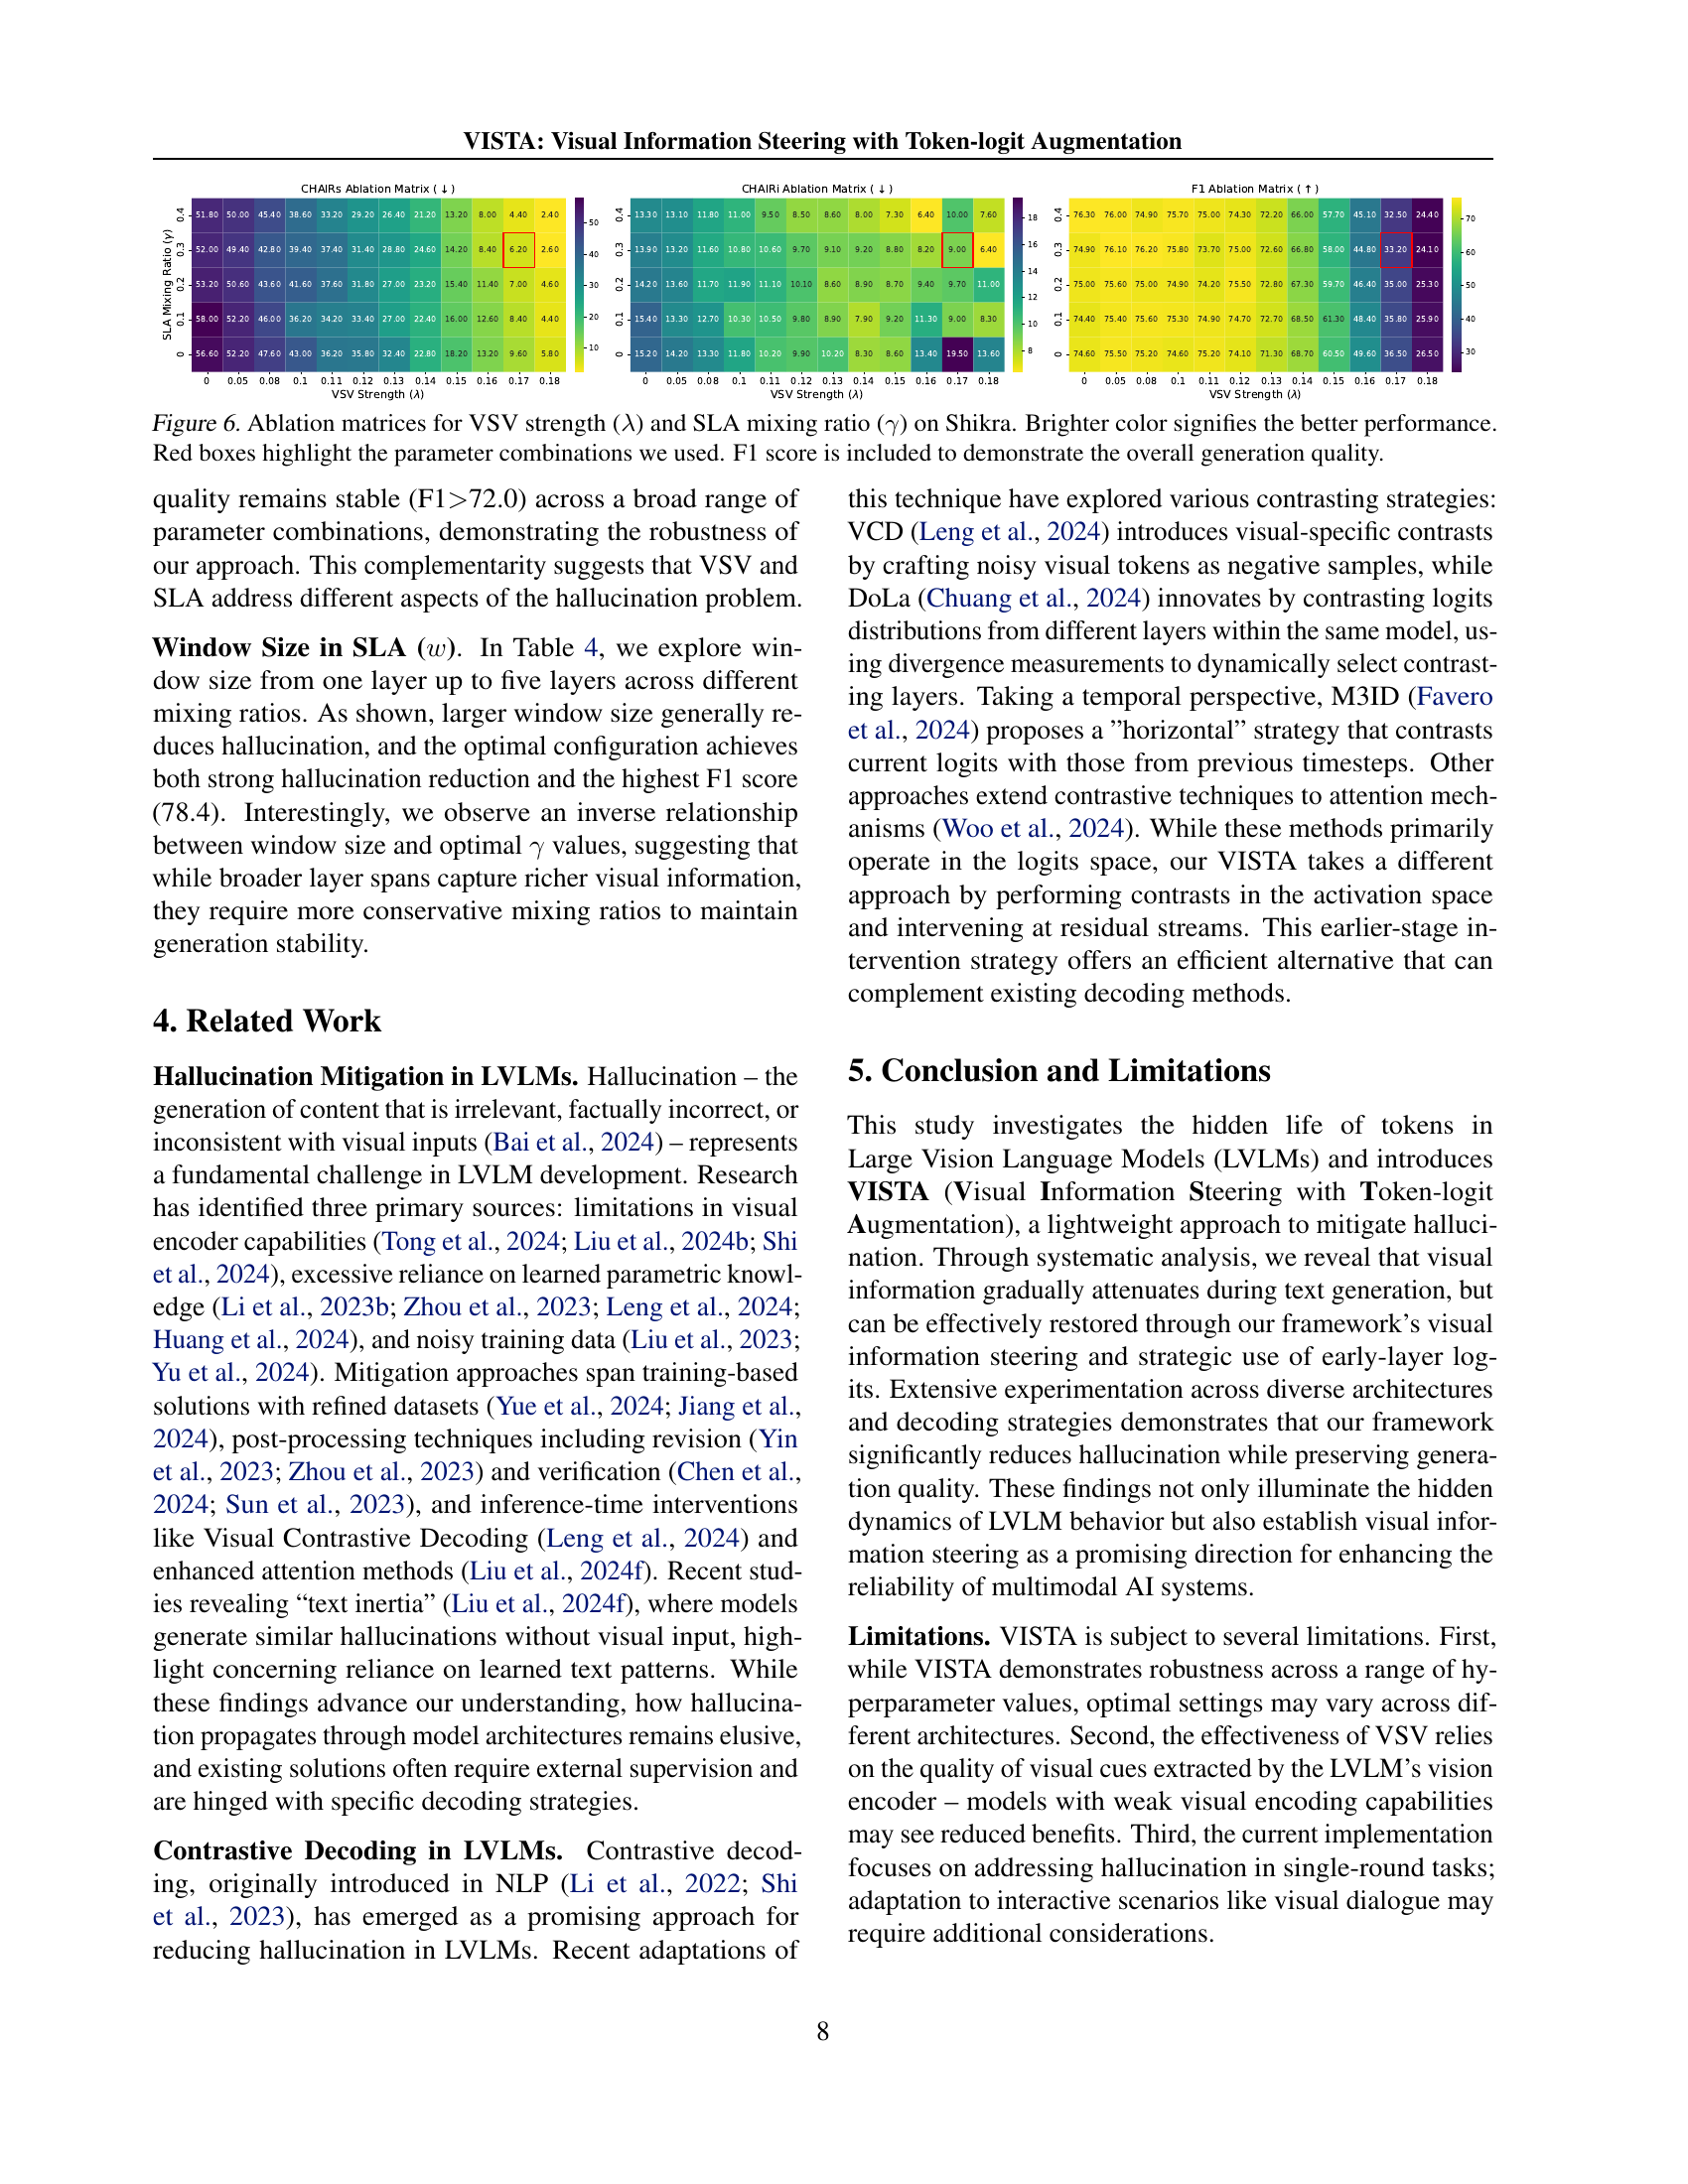
🔼 This figure visualizes the ablation study results on the Shikra model, analyzing the effects of varying VSV (Visual Steering Vector) strength (lambda) and SLA (Self-Logits Augmentation) mixing ratio (gamma) on the model’s performance. Each cell in the matrix represents a combination of lambda and gamma values. The color intensity indicates performance, with brighter colors signifying better results. Three matrices are shown: one for CHAIRs, CHAIR1, and F1 score. The red boxes highlight the parameter combinations used in the main experiments of the paper. The F1 score matrix is included to assess the overall generation quality, supplementing the hallucination metrics (CHAIRs and CHAIR1).
read the caption
Figure 6: Ablation matrices for VSV strength (λ𝜆\lambdaitalic_λ) and SLA mixing ratio (γ𝛾\gammaitalic_γ) on Shikra. Brighter color signifies the better performance. Red boxes highlight the parameter combinations we used. F1 score is included to demonstrate the overall generation quality.

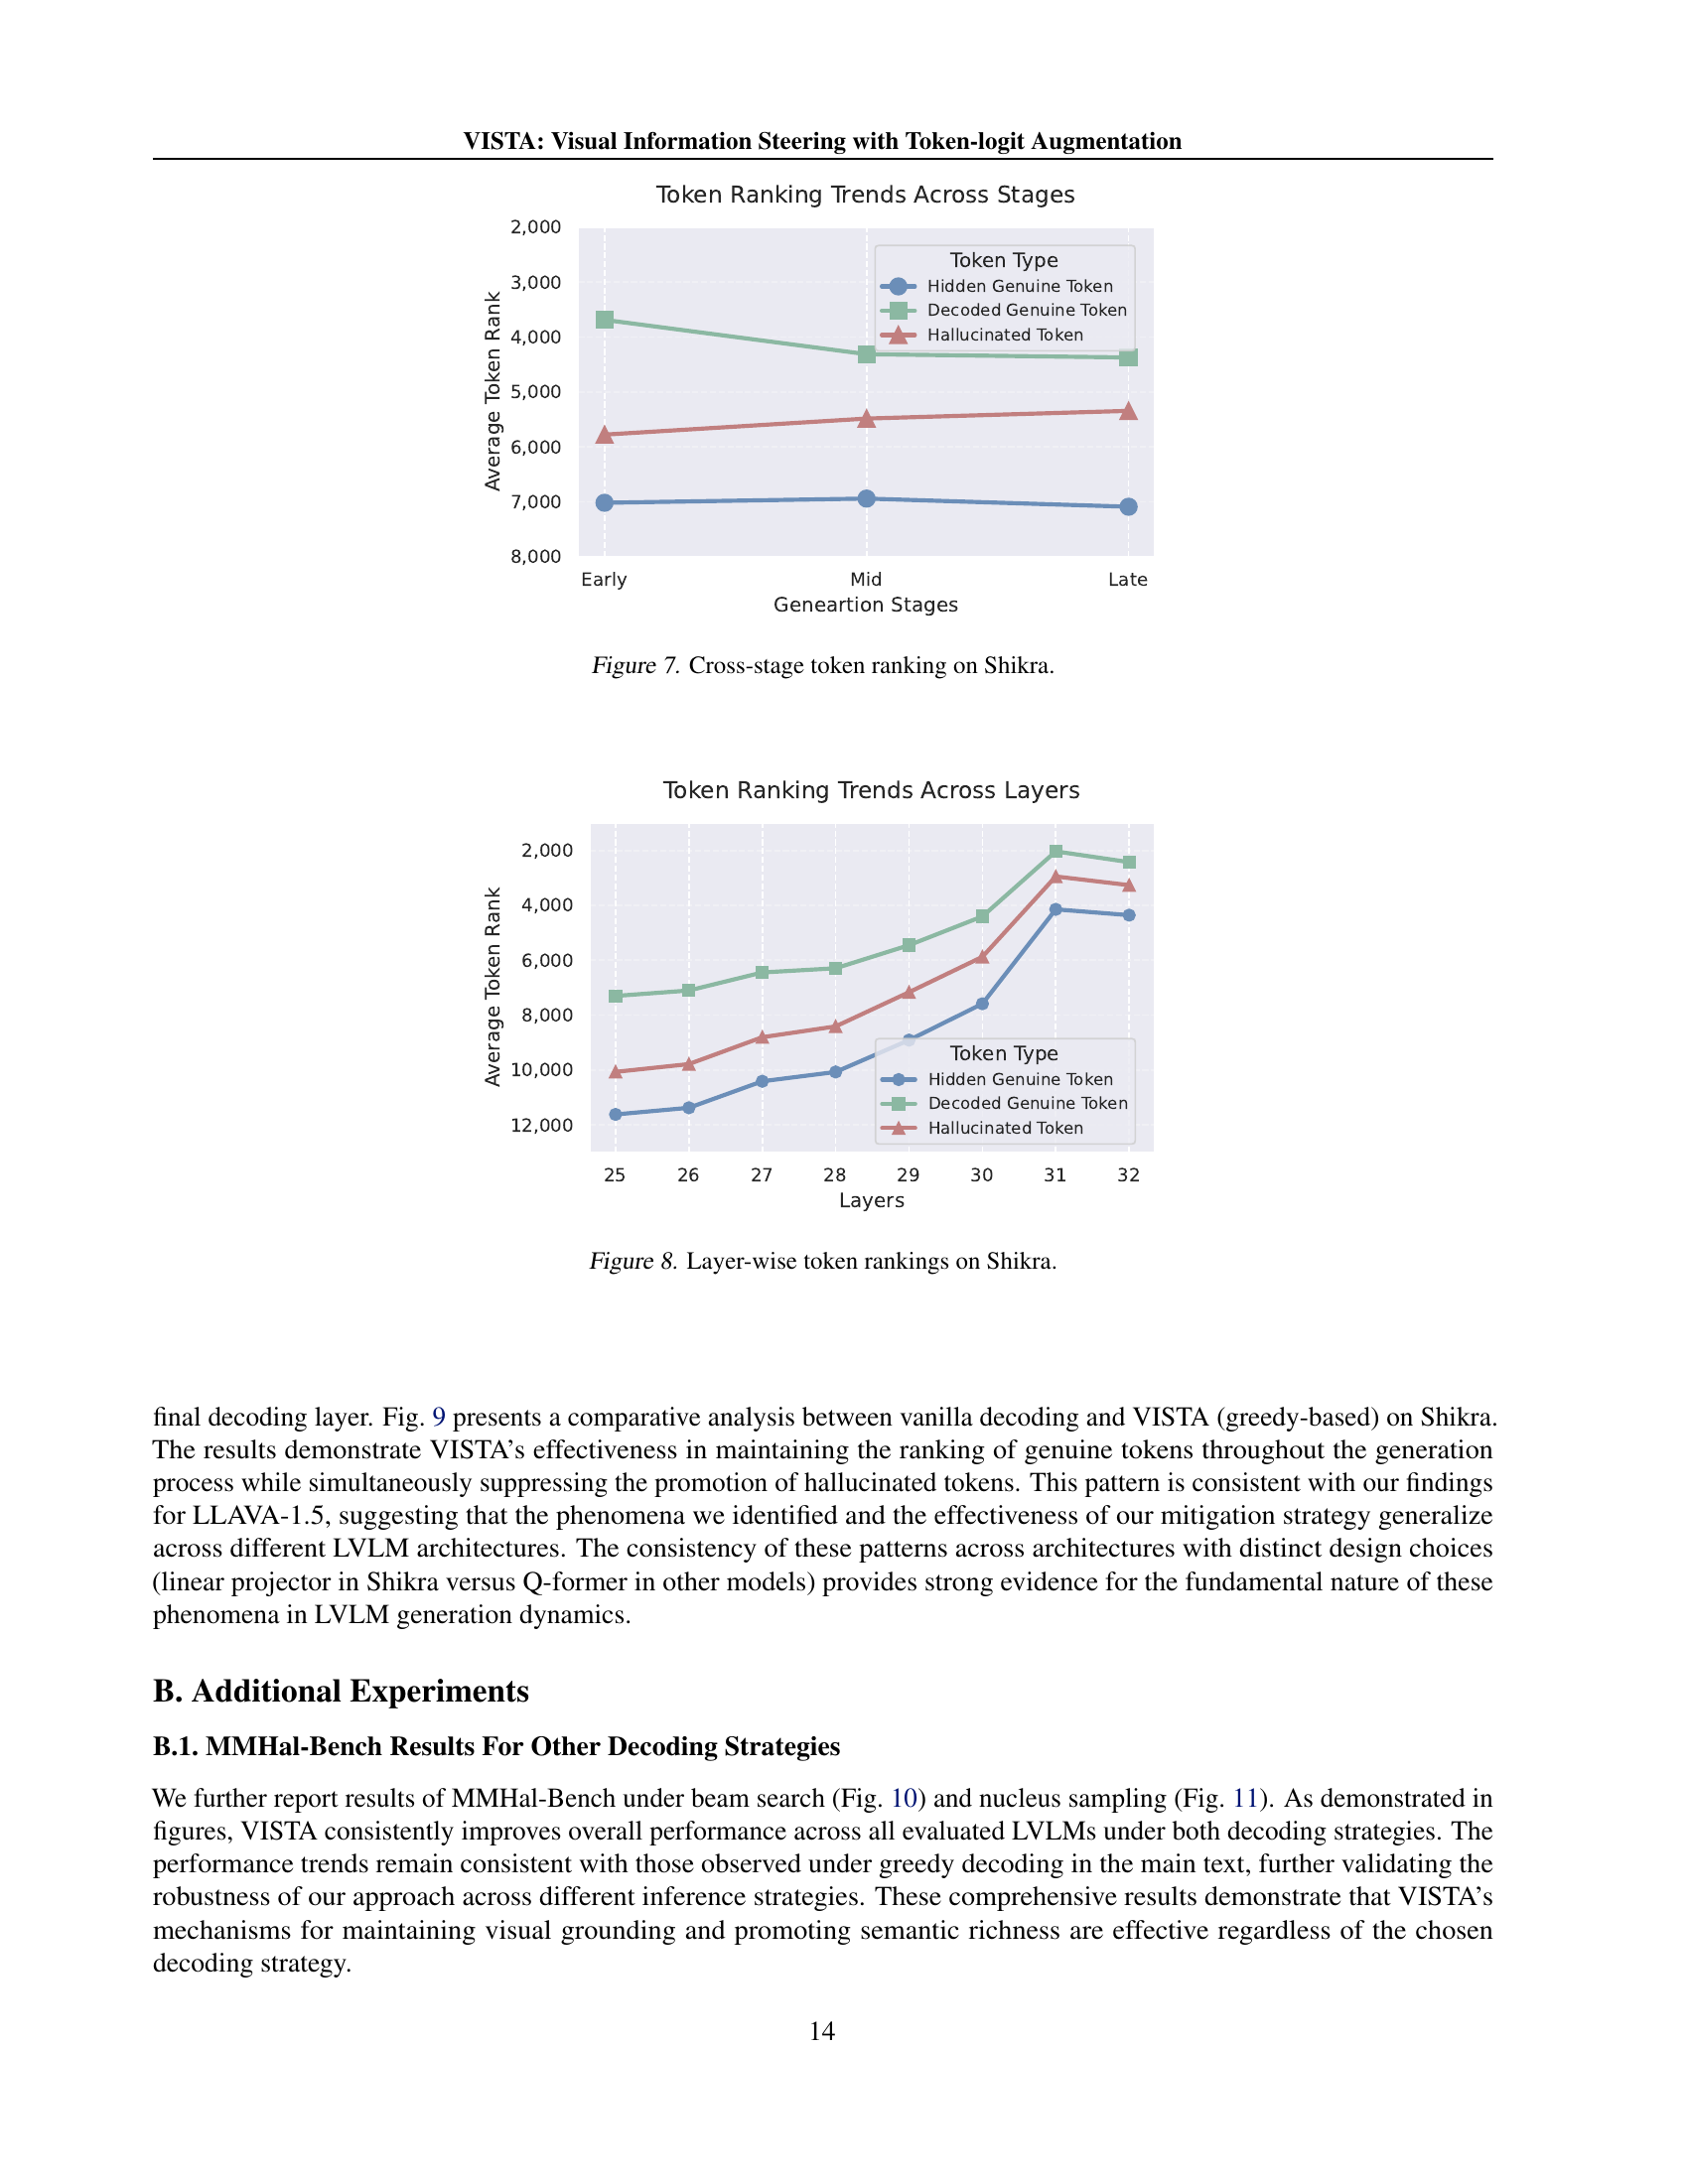
🔼 This figure shows the average token ranking across different generation stages (early, mid, late) for three token categories in the Shikra model: hidden genuine tokens, decoded genuine tokens, and hallucinated tokens. The graph visually represents how the ranking of each token category changes over time during the text generation process. It demonstrates trends related to concepts like gradual visual information loss and the early excitation of semantically meaningful tokens.
read the caption
Figure 7: Cross-stage token ranking on Shikra.

🔼 This figure shows the average token ranking across different layers of the Shikra model. It displays how the ranking of hidden genuine tokens (tokens present in the image but not in the generated caption), decoded genuine tokens (tokens present in both the image and the caption), and hallucinated tokens (tokens present in the caption but not in the image) changes as the model processes information through its layers. The x-axis represents the layer number, and the y-axis represents the average token rank.
read the caption
Figure 8: Layer-wise token rankings on Shikra.

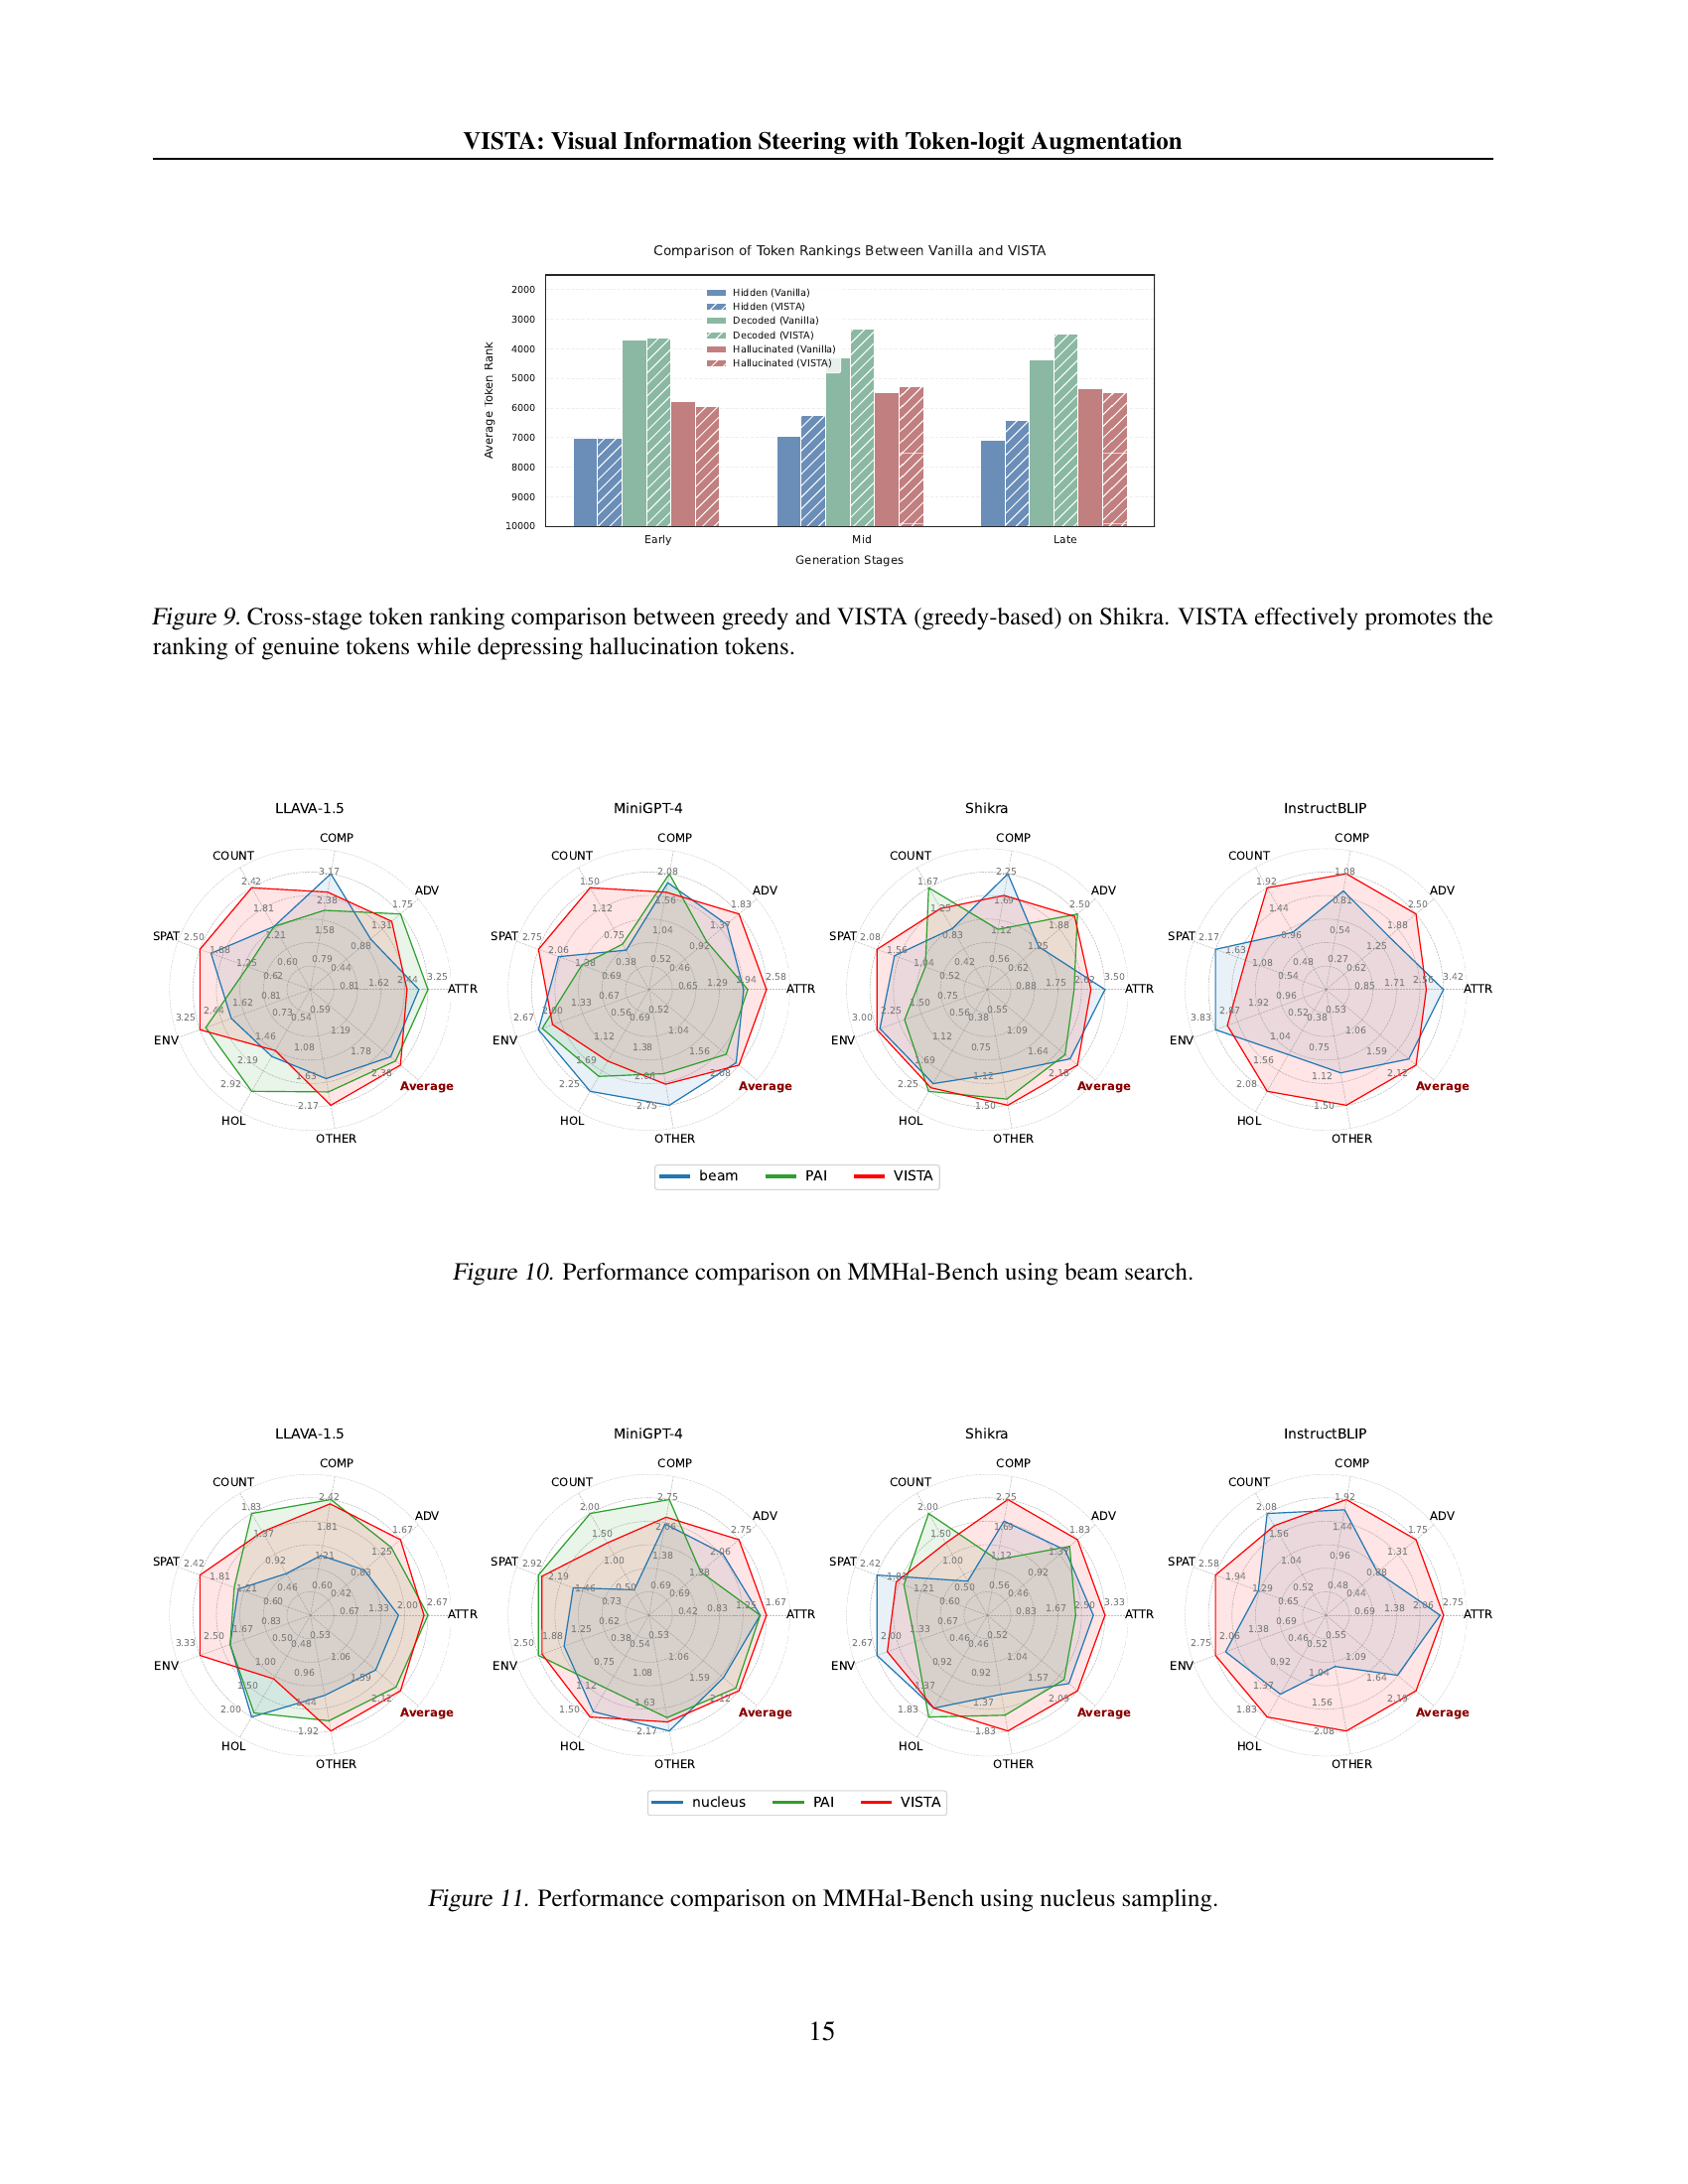
🔼 This figure displays a comparison of average token rankings across different generation stages (early, mid, late) for three categories of tokens: hidden genuine tokens (correct tokens not generated), decoded genuine tokens (correct tokens generated), and hallucinated tokens (incorrect tokens generated). The comparison is made between a baseline greedy decoding method and the proposed VISTA method (using greedy decoding). The results show that VISTA significantly improves the rankings of genuine tokens, particularly hidden genuine tokens that are not generated but still relevant to the image, while suppressing the rankings of hallucinated tokens. This demonstrates VISTA’s ability to enhance the generation of accurate tokens based on visual information while mitigating the generation of incorrect ones.
read the caption
Figure 9: Cross-stage token ranking comparison between greedy and VISTA (greedy-based) on Shikra. VISTA effectively promotes the ranking of genuine tokens while depressing hallucination tokens.
🔼 This figure presents a comparison of performance across four large vision-language models (LLaVA-1.5, MiniGPT-4, Shikra, and InstructBLIP) on the MMHal-Bench benchmark, utilizing beam search as the decoding strategy. The MMHal-Bench benchmark assesses eight different aspects of model capabilities: object attributes (ATTR), adversarial objects (ADV), comparisons (COMP), counting (COUNT), spatial relations (SPAT), environmental inferences (ENV), holistic descriptions (HOL), and other miscellaneous tasks (OTHER). The radar charts visually compare the performance of each model against the baseline (vanilla) performance, with VISTA showing improvements across various aspects.
read the caption
Figure 10: Performance comparison on MMHal-Bench using beam search.

🔼 This figure presents a comparison of model performance on the MMHal-Bench benchmark, specifically focusing on the nucleus sampling decoding method. It illustrates the relative strengths and weaknesses of different large vision-language models (LVLMs) in handling various aspects of visual and linguistic understanding, as measured by MMHal-Bench’s eight distinct question categories. The visualization likely uses radar charts or a similar technique to compare models across multiple dimensions of performance, highlighting which models excel in certain areas and where they struggle.
read the caption
Figure 11: Performance comparison on MMHal-Bench using nucleus sampling.

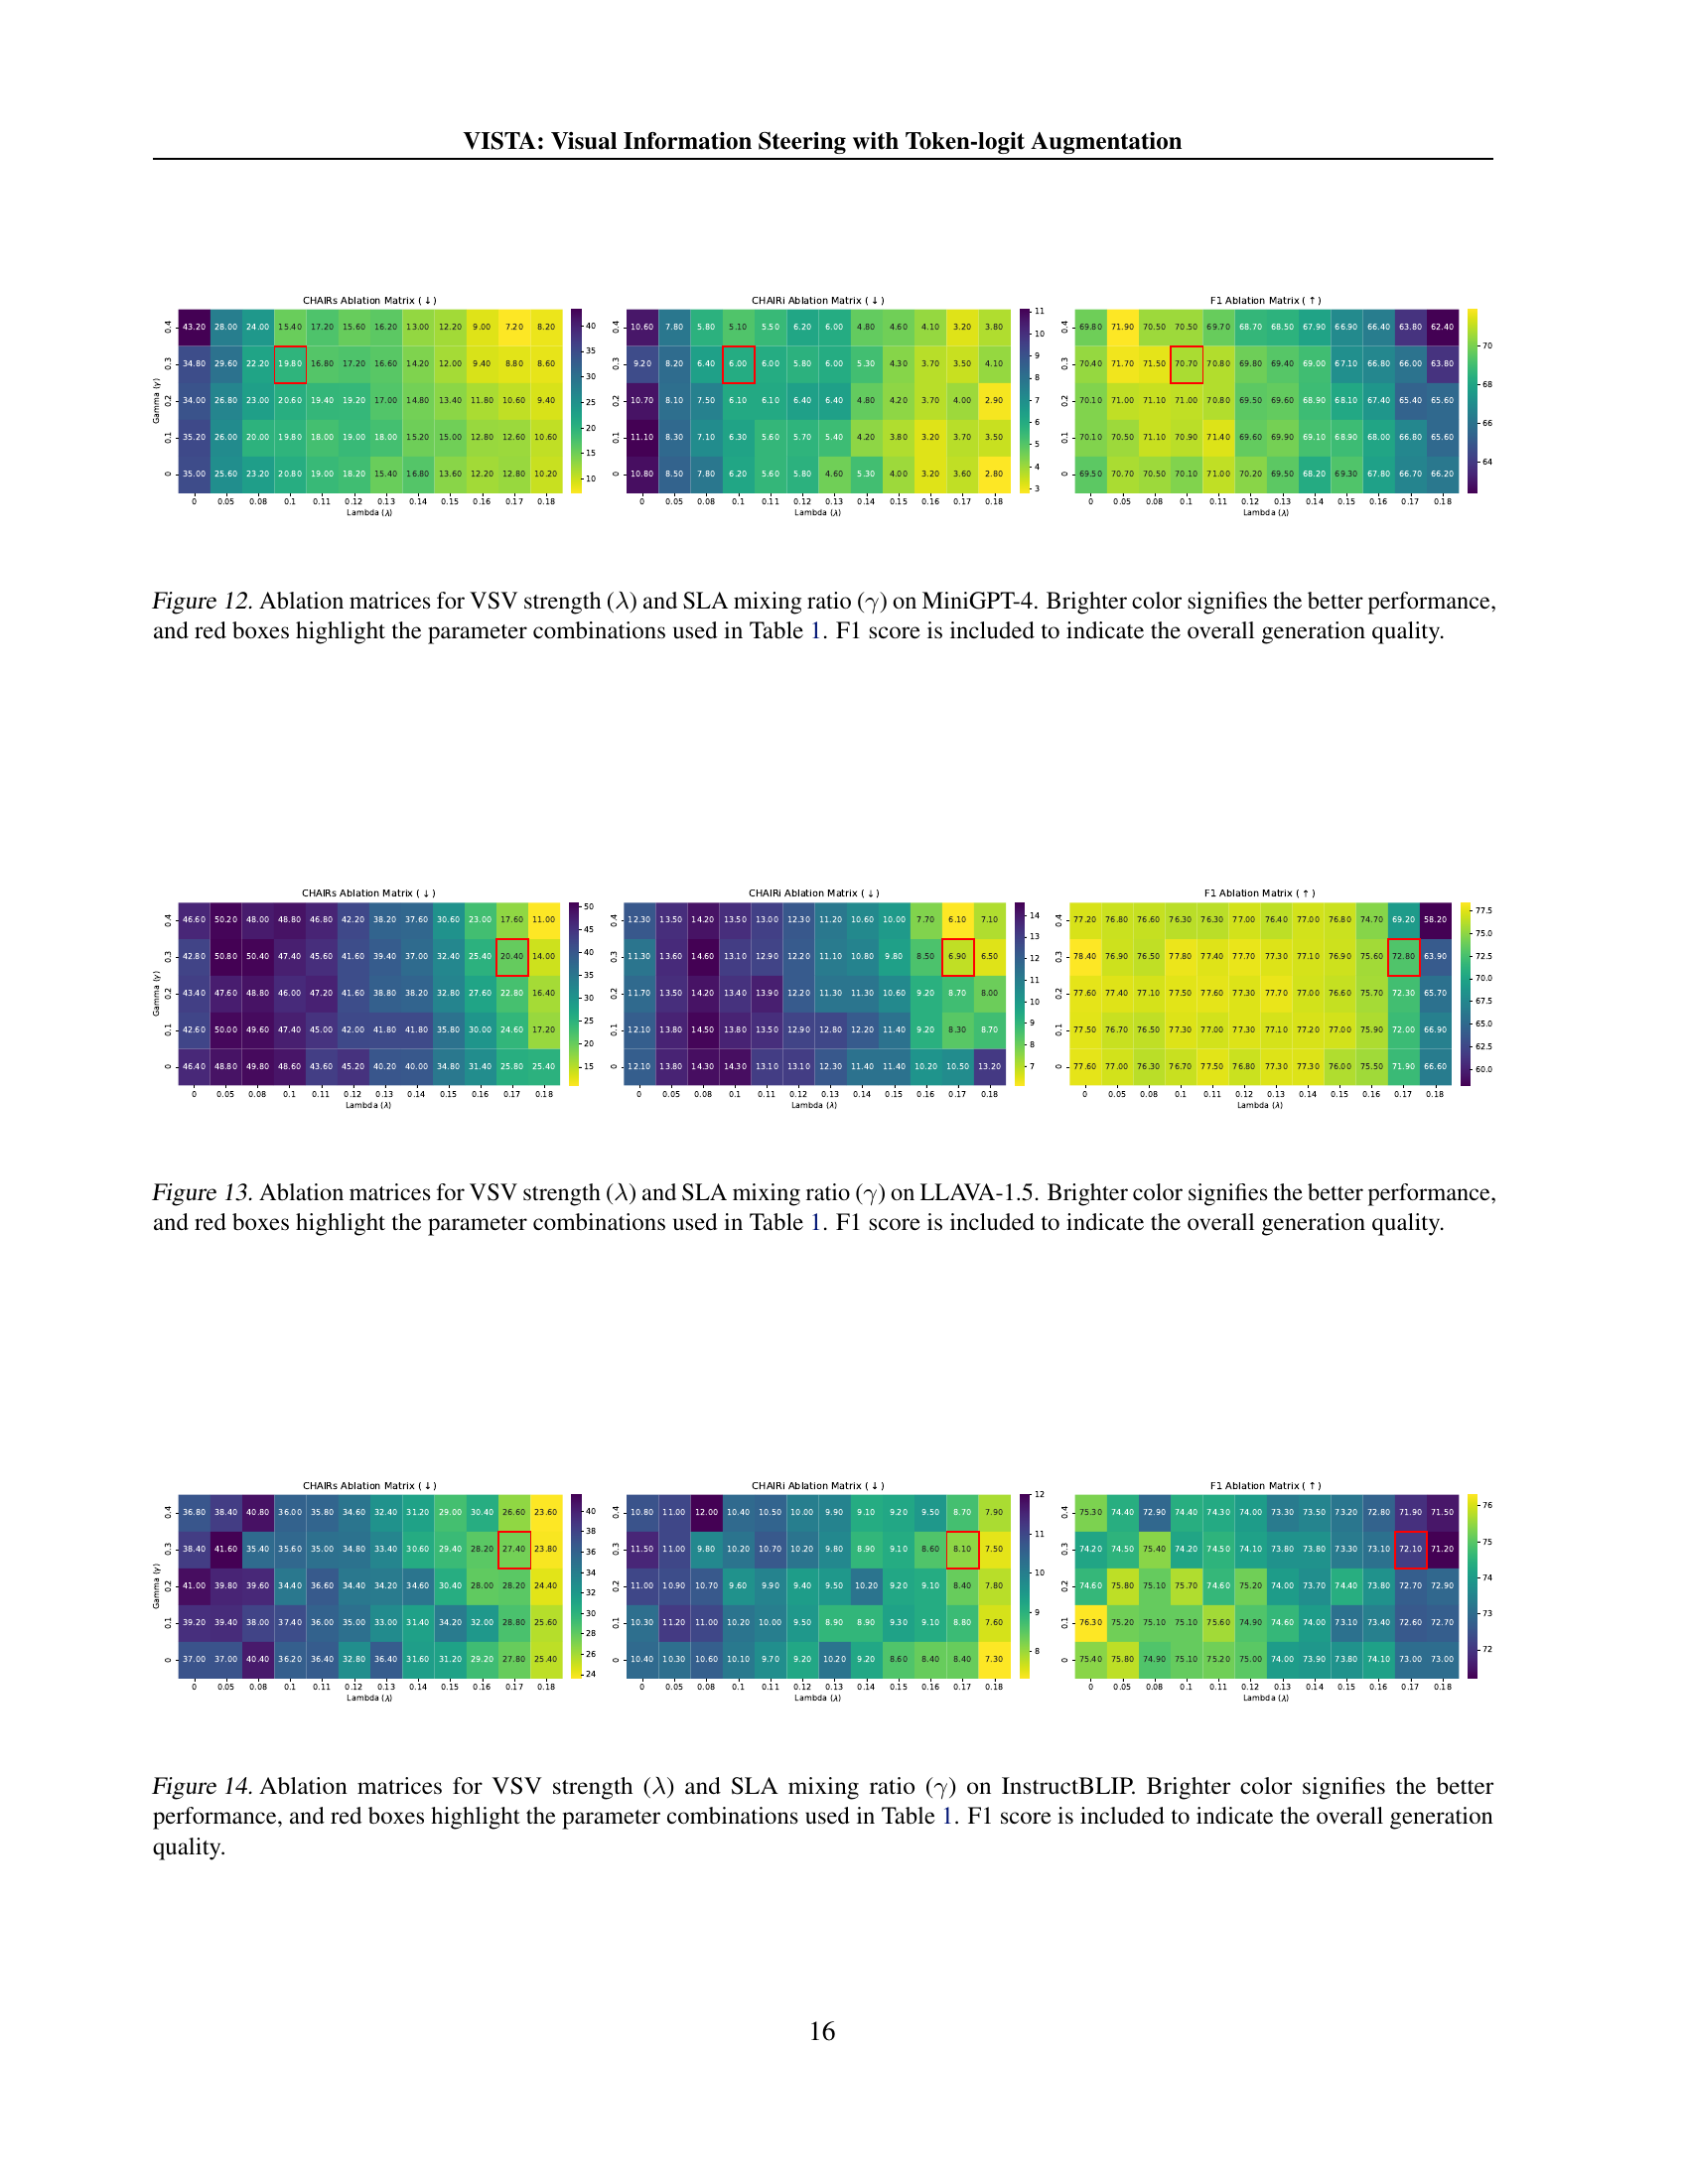
🔼 This figure presents ablation study results on the MiniGPT-4 model, specifically focusing on the impact of two key parameters: Visual Steering Vector (VSV) strength (λ) and Self-Logits Augmentation (SLA) mixing ratio (γ). The ablation matrices visualize how changes in these parameters affect three metrics: CHAIRs (sentence-level caption hallucination), CHAIR₁ (instance-level caption hallucination), and F1 (overall generation quality). Brighter colors in the matrices indicate better performance across all three metrics. Red boxes highlight the specific parameter combinations (λ and γ values) that yielded the best results as reported in Table 1 of the paper. This helps readers understand the optimal balance between the two parameters for achieving the best performance in reducing hallucination without negatively impacting overall generation quality.
read the caption
Figure 12: Ablation matrices for VSV strength (λ𝜆\lambdaitalic_λ) and SLA mixing ratio (γ𝛾\gammaitalic_γ) on MiniGPT-4. Brighter color signifies the better performance, and red boxes highlight the parameter combinations used in Table 1. F1 score is included to indicate the overall generation quality.

🔼 This ablation study analyzes the effect of varying the visual steering vector (VSV) strength (λ) and self-logits augmentation (SLA) mixing ratio (γ) on the LLAVA-1.5 model. The figure shows three matrices: one for CHAIRs, one for CHAIR₁, and one for F1 score. Each matrix displays the performance of the model across different combinations of λ and γ. Brighter colors indicate better performance. The red boxes highlight the specific parameter settings (λ and γ) used in the main experiments (Table 1) of the paper. The F1 score matrix provides a measure of the overall generation quality, balancing the effects of hallucination reduction and overall caption generation quality. The study aims to find optimal values for λ and γ that strike a balance between reducing hallucinations and maintaining good caption quality.
read the caption
Figure 13: Ablation matrices for VSV strength (λ𝜆\lambdaitalic_λ) and SLA mixing ratio (γ𝛾\gammaitalic_γ) on LLAVA-1.5. Brighter color signifies the better performance, and red boxes highlight the parameter combinations used in Table 1. F1 score is included to indicate the overall generation quality.

🔼 This figure presents ablation study results on the InstructBLIP model, showing the impact of varying the visual steering vector (VSV) strength (λ) and self-logits augmentation (SLA) mixing ratio (γ) on the model’s performance. The ablation matrices visualize the effects of these hyperparameters on three key metrics: CHAIRs (sentence-level hallucination), CHAIR₁ (instance-level hallucination), and F1 (overall generation quality). Brighter colors in the matrices indicate better performance. Red boxes highlight the specific parameter combinations (λ and γ) used in the main experiments of the paper (as detailed in Table 1). The F1 score provides a comprehensive measure of overall generation quality, balancing hallucination reduction with the generation quality.
read the caption
Figure 14: Ablation matrices for VSV strength (λ𝜆\lambdaitalic_λ) and SLA mixing ratio (γ𝛾\gammaitalic_γ) on InstructBLIP. Brighter color signifies the better performance, and red boxes highlight the parameter combinations used in Table 1. F1 score is included to indicate the overall generation quality.

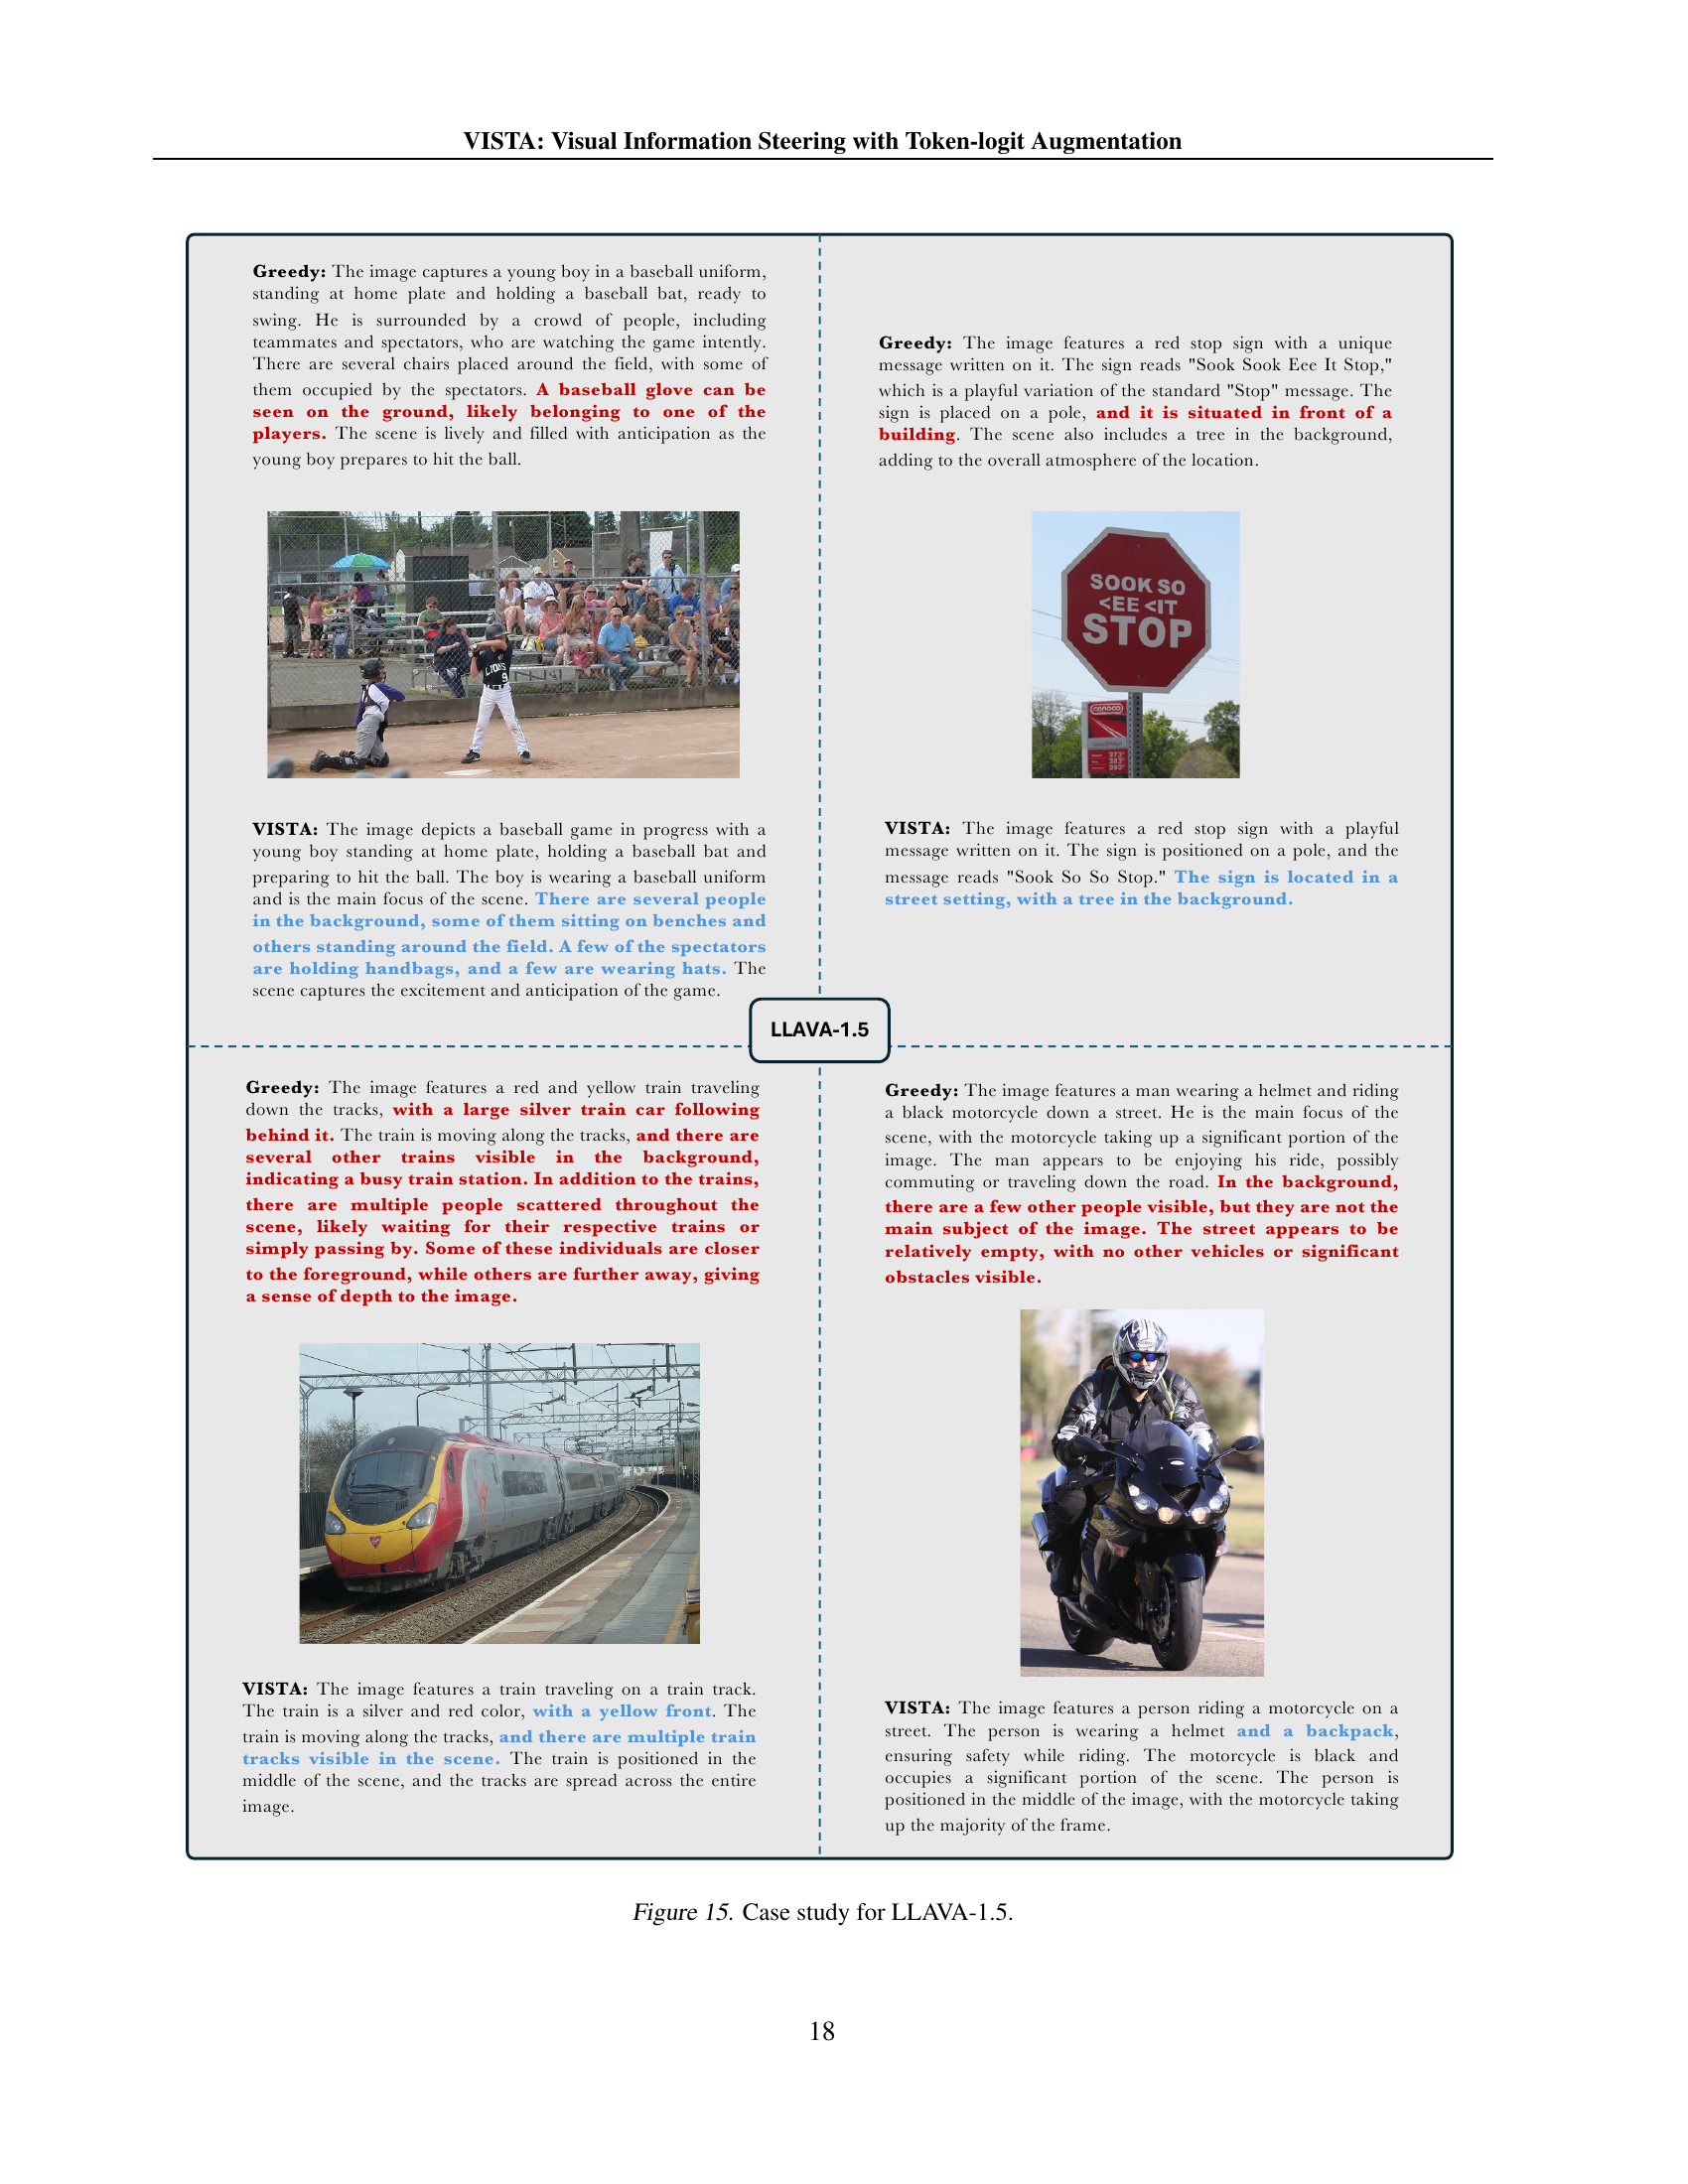
🔼 This figure presents a qualitative case study showcasing the effectiveness of VISTA on LLAVA-1.5. It displays examples of image captioning outputs generated by the vanilla LLAVA-1.5 model and VISTA enhanced LLAVA-1.5. The examples illustrate how VISTA improves the accuracy and detail of the generated captions, reducing hallucinations (incorrect details in captions not present in images) and including missing genuine information (details present in images but not captured in vanilla captions). Each example includes the image, the vanilla caption, and VISTA caption.
read the caption
Figure 15: Case study for LLAVA-1.5.

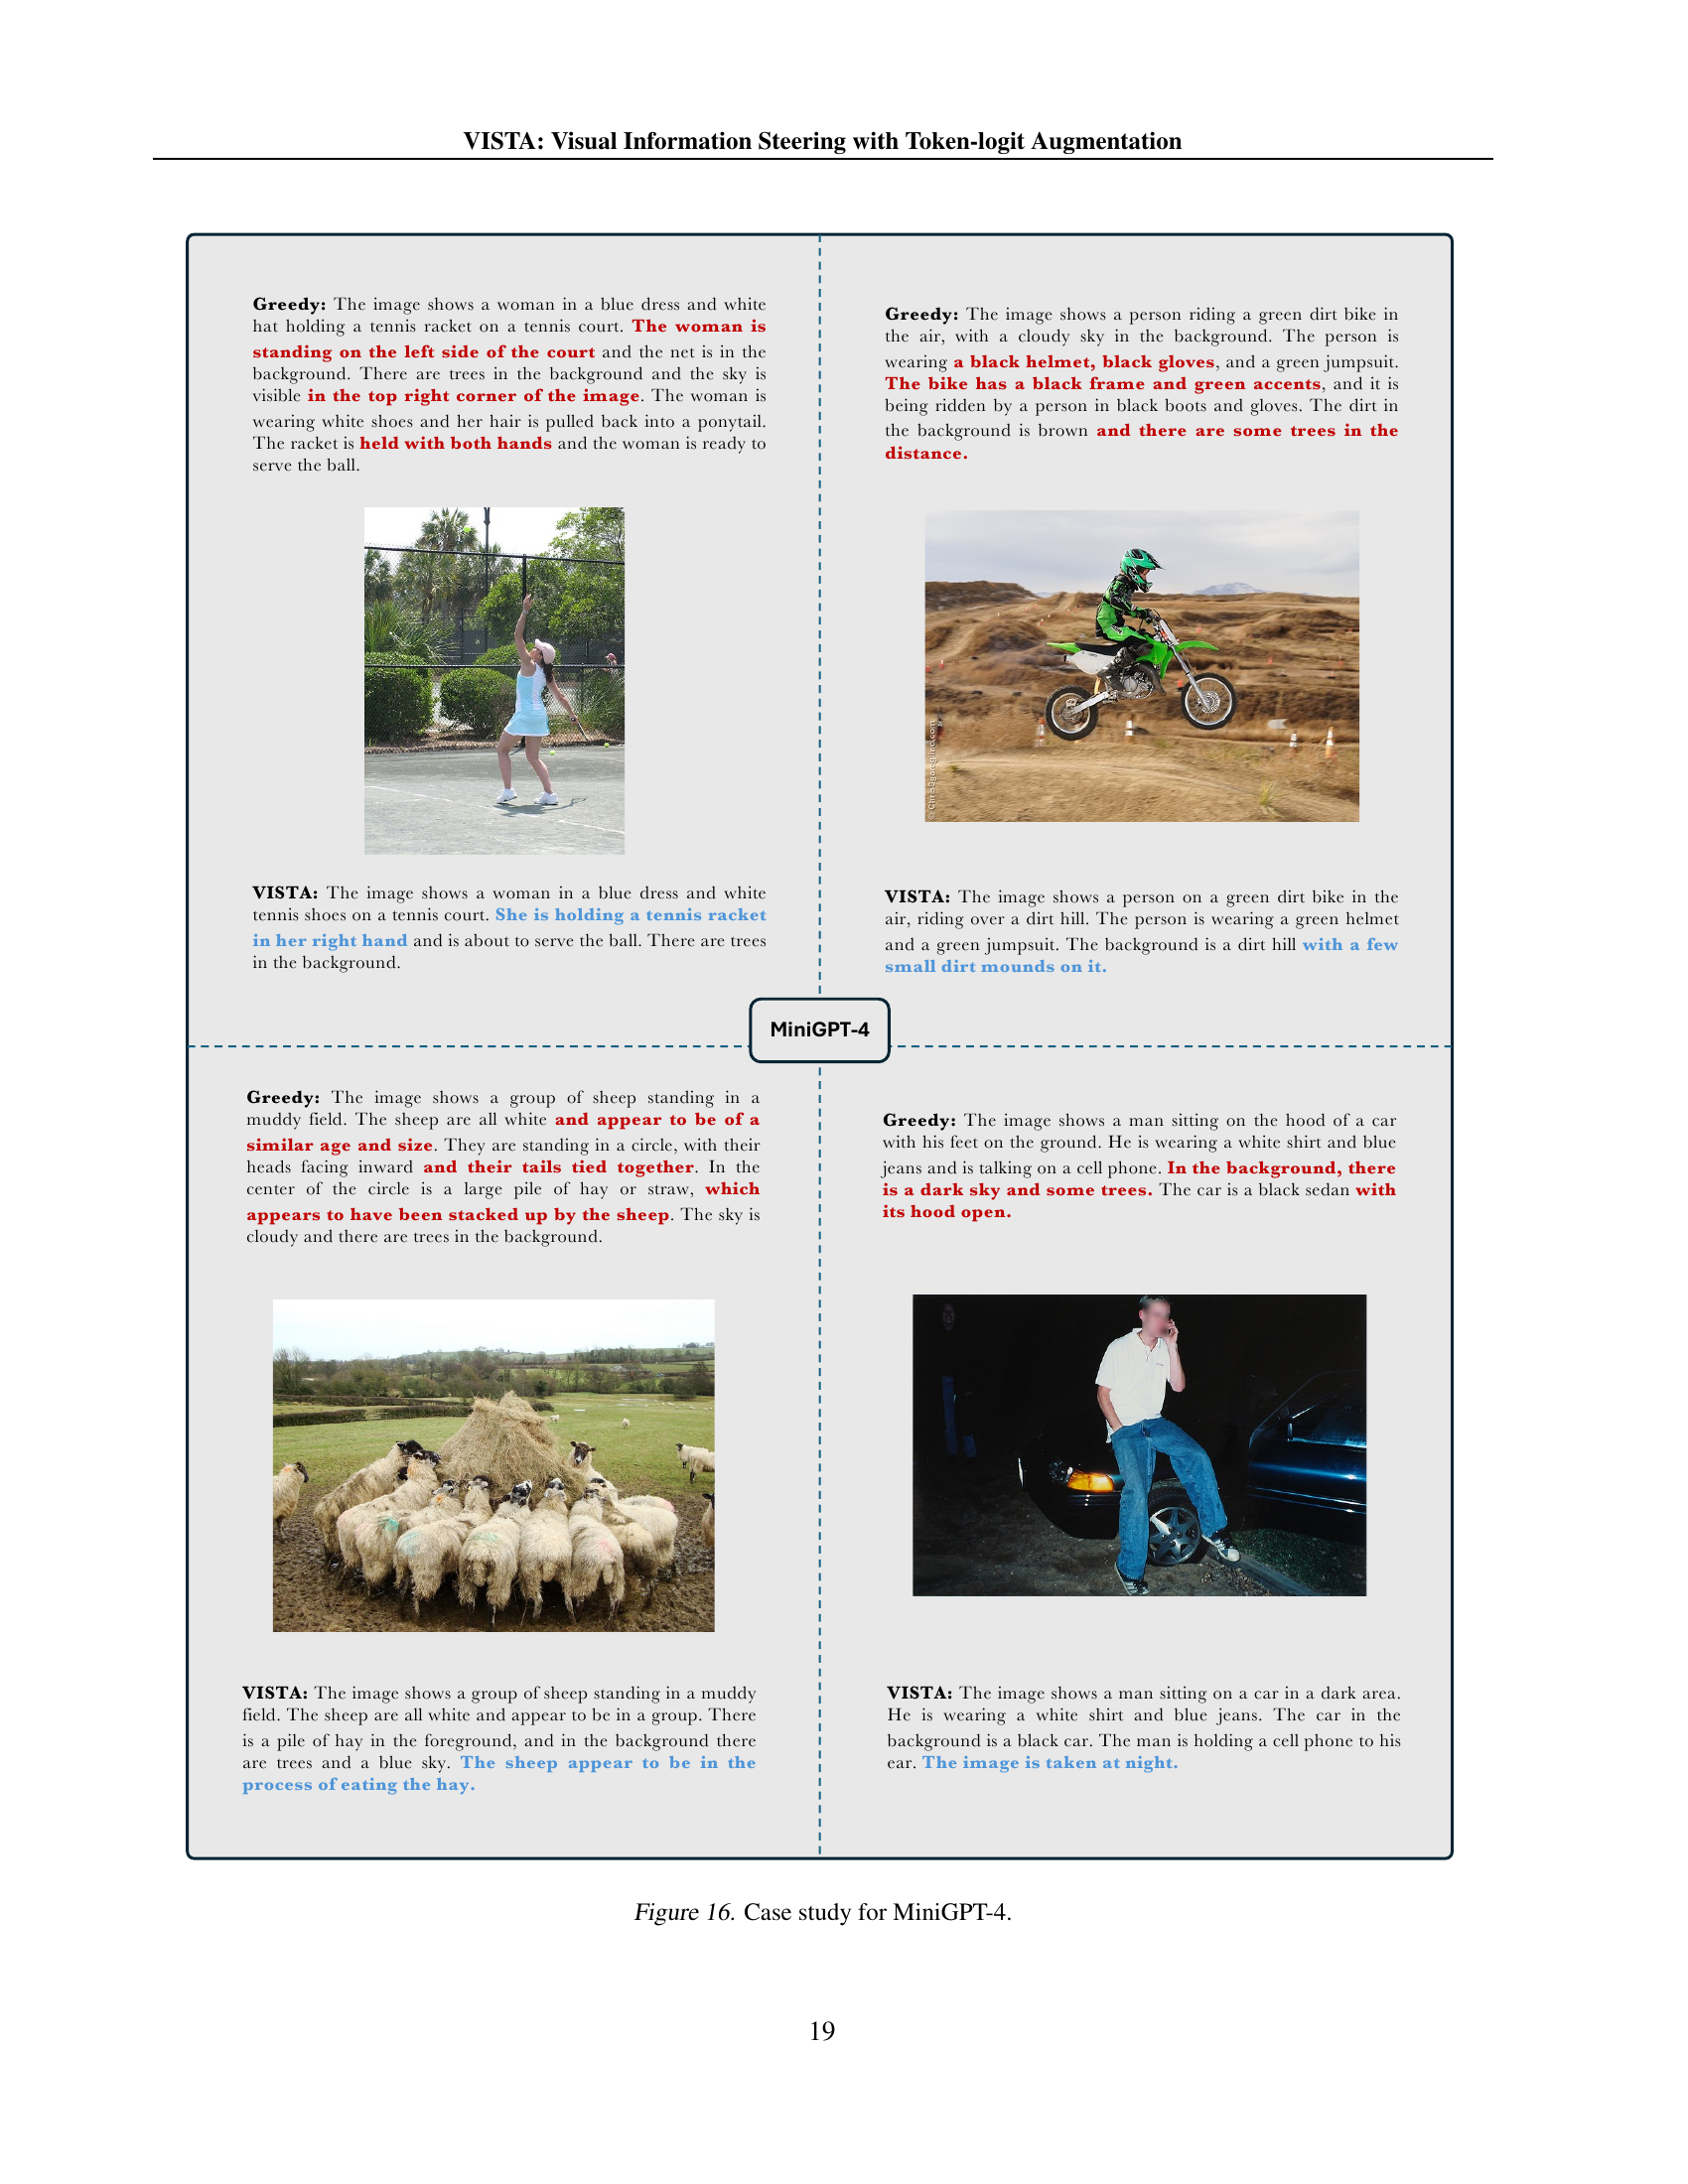
🔼 This figure showcases comparative examples of image captioning results between the vanilla MiniGPT-4 model and the VISTA-enhanced model. Each pair of images presents the same input image, followed by a caption generated by the vanilla model and then a caption from VISTA. Differences between the two captions are highlighted to illustrate how VISTA reduces hallucination and improves the accuracy and completeness of the generated descriptions, focusing on object properties and relations. Specifically, hallucinated elements in the vanilla captions are shown in red, while elements correctly added or corrected by VISTA are in blue.
read the caption
Figure 16: Case study for MiniGPT-4.

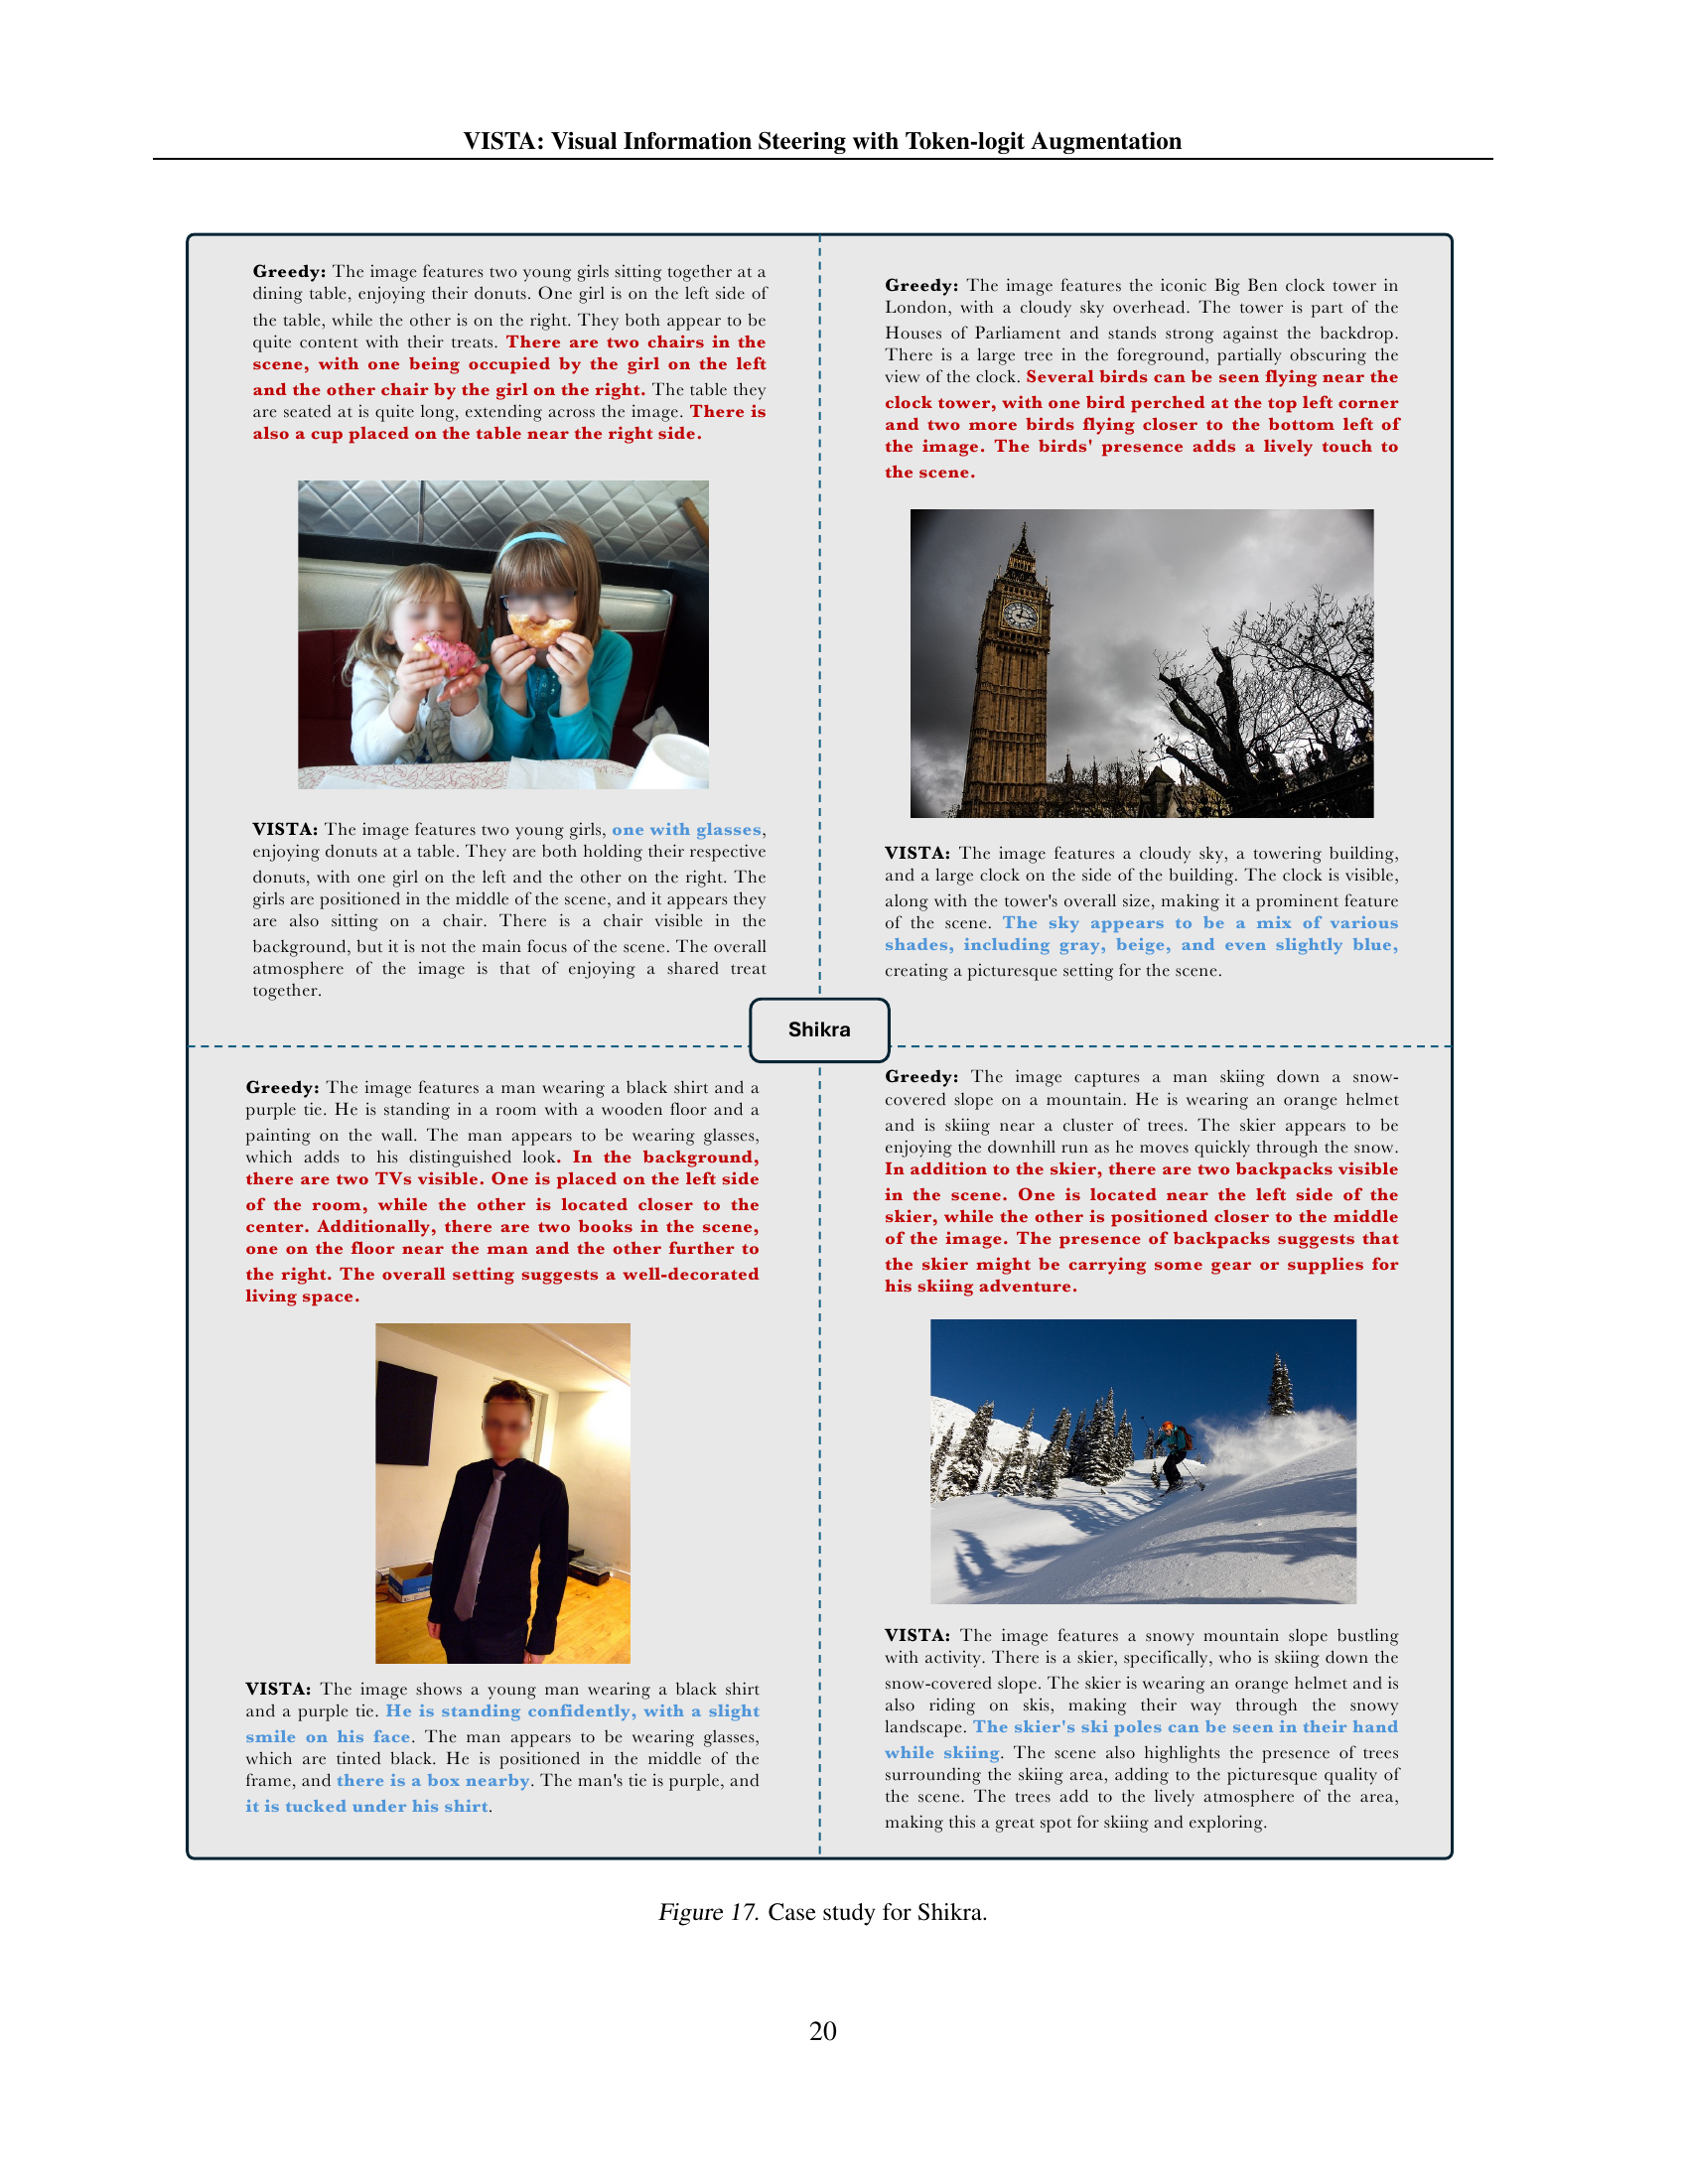
🔼 This figure showcases a qualitative comparison between the vanilla Shikra model and the VISTA-enhanced Shikra model’s performance on two image captioning examples. The first example shows two girls sitting at a table enjoying donuts. The vanilla model’s caption is generic and misses details such as the girls’ glasses and the placement of a chair near the table. The VISTA model provides a more precise and detailed caption that includes the previously missed details. The second example presents a picture of a man in a suit and tie, standing in a room with distinct features like paintings and books. Again, the vanilla model produces a less descriptive caption compared to the VISTA-enhanced model. The VISTA caption provides more specific details about the man’s appearance, the room’s layout, and the additional items visible in the scene. This demonstrates VISTA’s ability to enhance the Shikra model’s image captioning abilities by including visually grounded details in the captions while reducing hallucinated or irrelevant details.
read the caption
Figure 17: Case study for Shikra.
More on tables
| Decoding | Method | LLAVA-1.5 (Liu et al., 2024a) | MiniGPT-4 (Zhu et al., 2023) | Shikra (Chen et al., 2023) | InstructBLIP (Dai et al., 2023) | ||||
|---|---|---|---|---|---|---|---|---|---|
| Avg. Accuracy | Avg. F1 | Avg. Accuracy | Avg. F1 | Avg. Accuracy | Avg. F1 | Avg. Accuracy | Avg. F1 | ||
| Greedy | Vanilla | 84.79 | 85.61 | 76.76 | 76.82 | 81.32 | 82.01 | 84.36 | 84.64 |
| DoLa (Chuang et al., 2024) | 84.92 | 85.67 | - | - | 81.13 | 81.94 | - | - | |
| VCD (Leng et al., 2024) | 84.80 | 85.65 | - | - | - | - | 84.81 | 85.28 | |
| PAI (Liu et al., 2024f) | 85.85 | 86.08 | 75.64 | 77.57 | 81.30 | 80.81 | - | - | |
| VISTA (ours) | 86.15 | 86.29 | 77.06 | 77.80 | 82.44 | 82.47 | 84.87 | 84.95 | |
| Beam Search | Vanilla | 85.45 | 84.93 | 73.68 | 72.40 | 81.73 | 82.10 | 84.38 | 83.71 |
| VCD (Leng et al., 2024) | 85.85 | 85.90 | - | - | - | - | 84.90 | 84.43 | |
| OPERA (Huang et al., 2024) | 85.68 | 85.83 | 74.81 | 75.42 | 82.18 | 82.49 | 85.31 | 85.51 | |
| PAI (Liu et al., 2024f) | 86.27 | 85.91 | 73.83 | 74.63 | 81.90 | 81.08 | - | - | |
| VISTA (ours) | 85.83 | 85.95 | 75.96 | 77.17 | 82.54 | 82.52 | 85.78 | 85.74 | |
| Nucleus Sampling | Vanilla | 81.26 | 82.40 | 60.56 | 62.04 | 78.94 | 80.18 | 78.83 | 79.74 |
| DoLa (Chuang et al., 2024) | 81.20 | 82.44 | - | - | 79.49 | 80.72 | - | - | |
| VCD (Leng et al., 2024) | 81.08 | 82.22 | - | - | - | - | 79.61 | 80.43 | |
| PAI (Liu et al., 2024f) | 81.92 | 83.16 | 61.26 | 63.40 | 79.25 | 79.87 | - | - | |
| VISTA (ours) | 85.35 | 85.54 | 66.96 | 68.05 | 81.01 | 81.15 | 83.11 | 83.27 | |
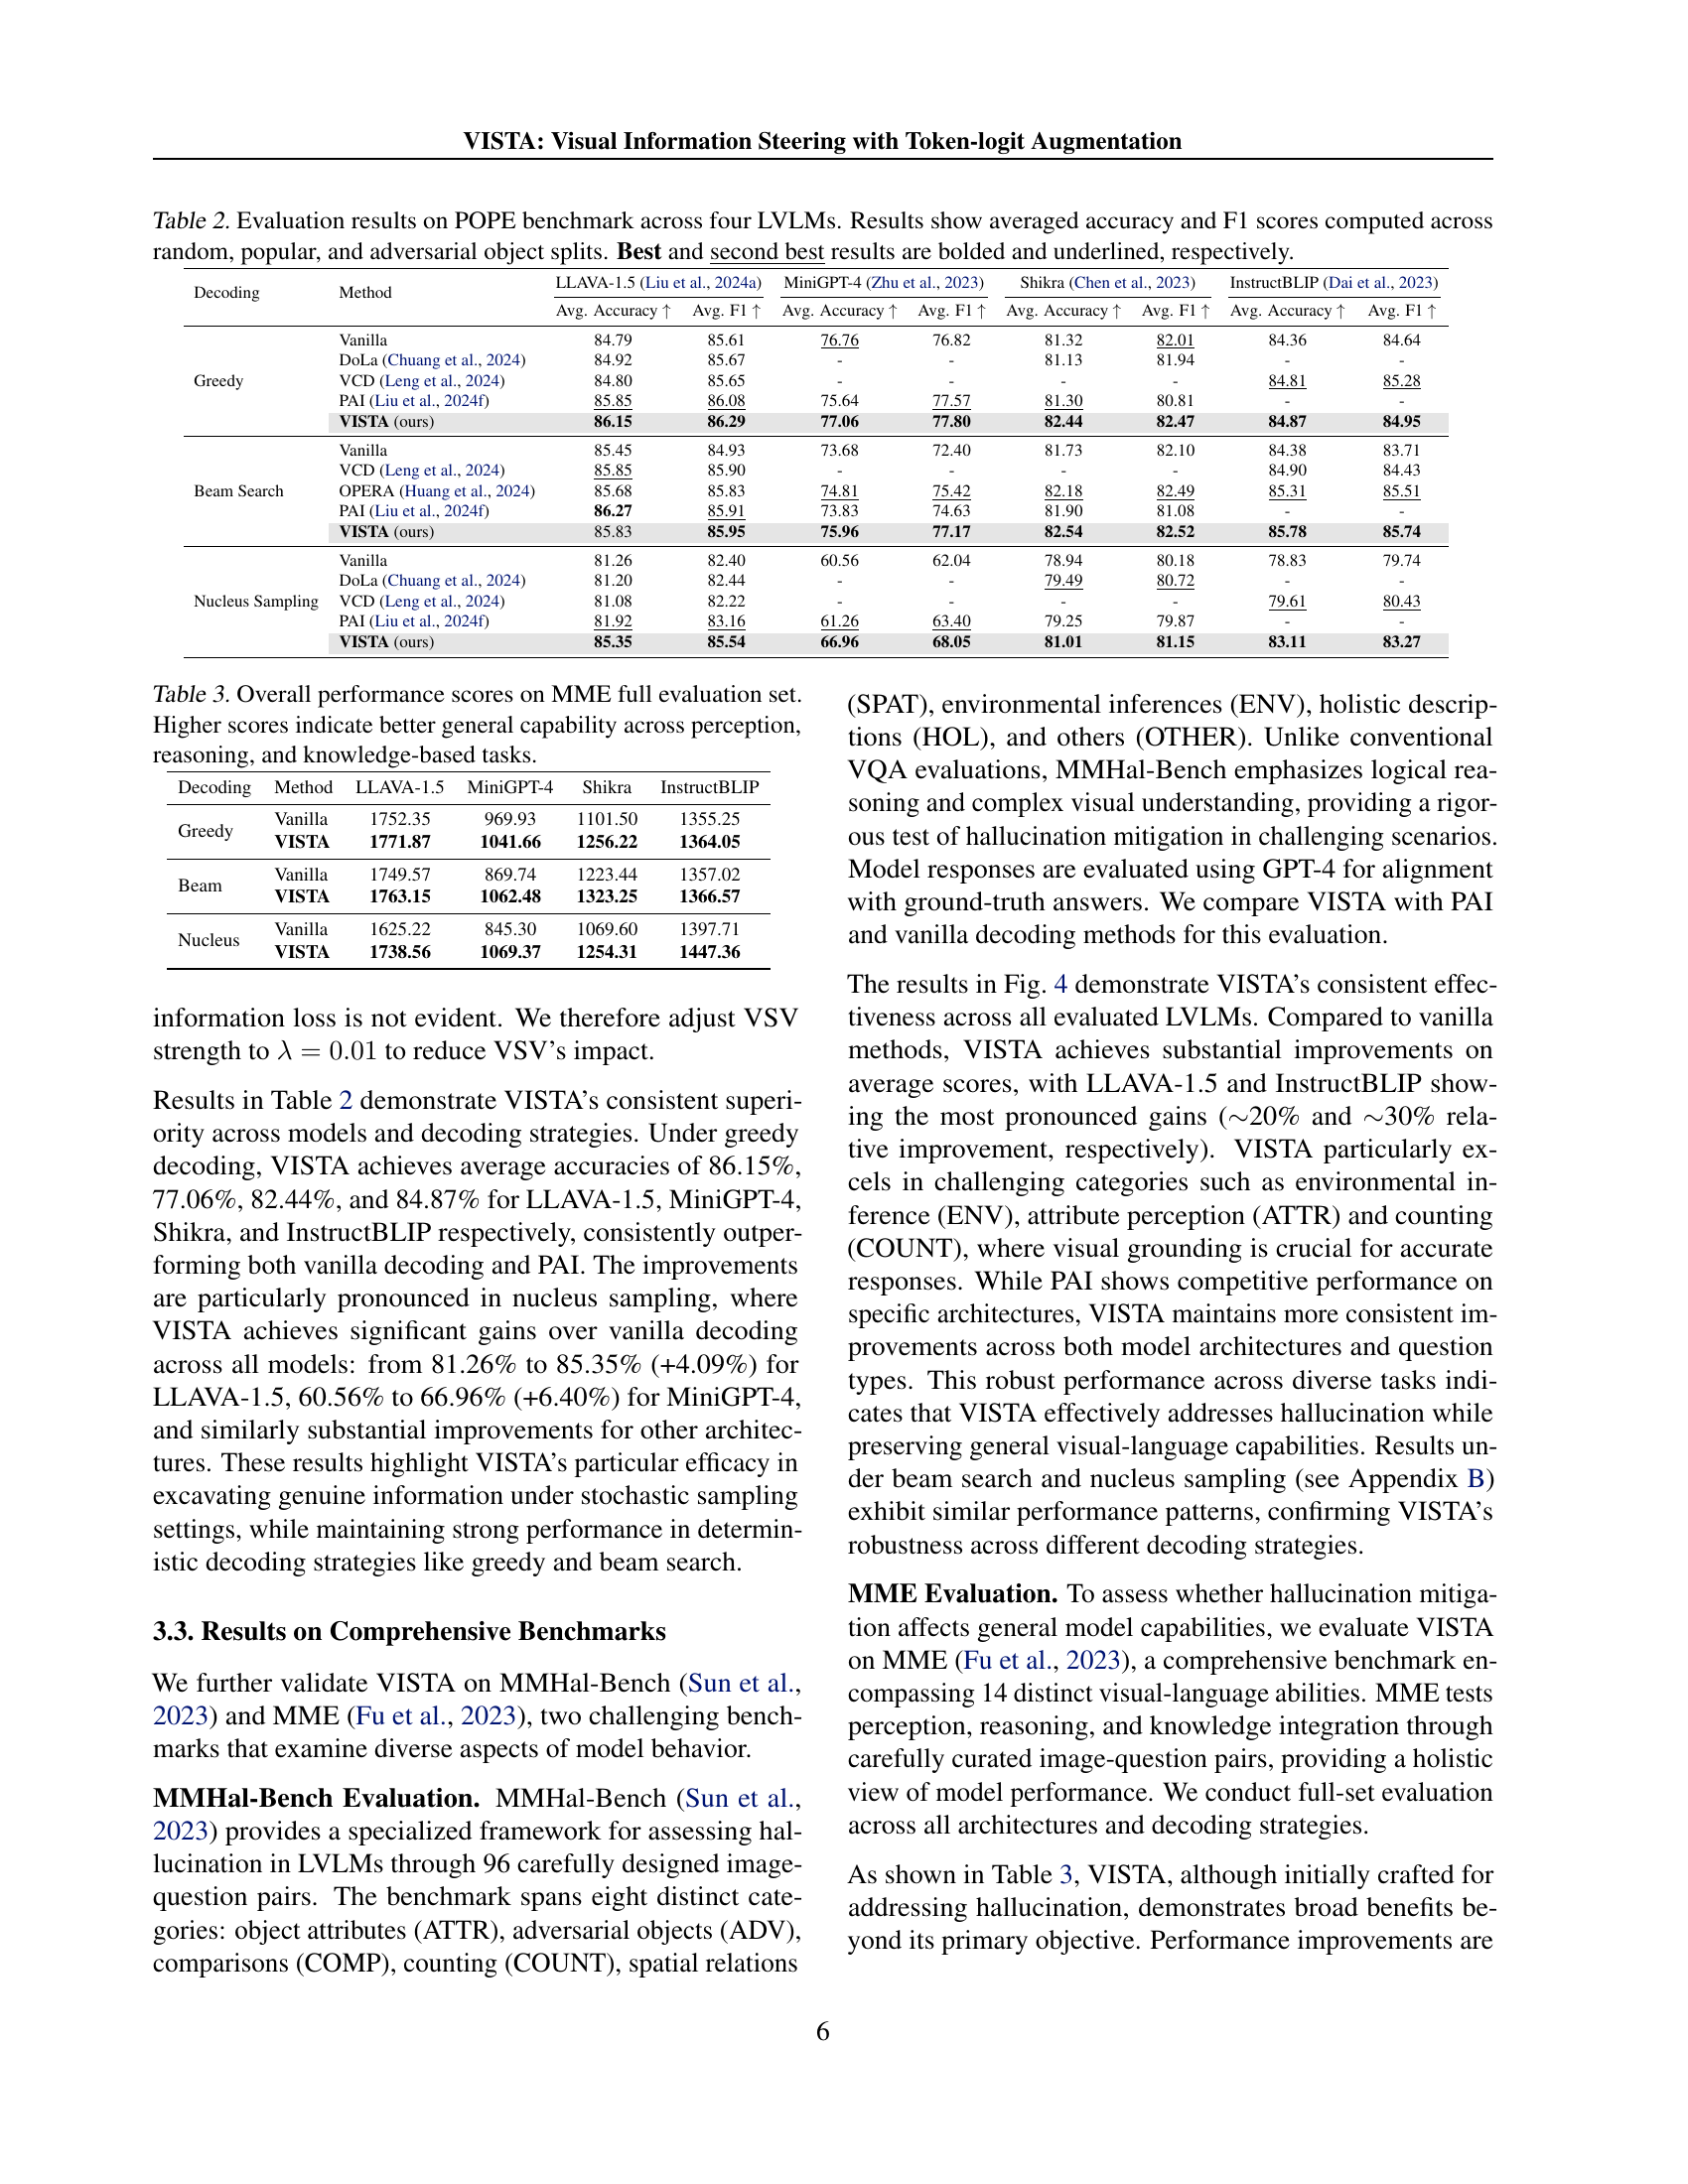
🔼 Table 2 presents a comprehensive evaluation of the POPE benchmark across four different Large Vision-Language Models (LLaVA-1.5, MiniGPT-4, Shikra, and InstructBLIP). The POPE benchmark assesses object hallucination in image captioning by evaluating the model’s ability to accurately identify objects in images through visual question answering. The evaluation is conducted using three different sets of objects: random, frequently appearing, and adversarially selected. The table displays the average accuracy and F1 scores across these object sets for each model under various decoding strategies (greedy, beam search, and nucleus sampling). Best and second-best results are highlighted for easy comparison.
read the caption
Table 2: Evaluation results on POPE benchmark across four LVLMs. Results show averaged accuracy and F1 scores computed across random, popular, and adversarial object splits. Best and second best results are bolded and underlined, respectively.
| Decoding | Method | LLAVA-1.5 | MiniGPT-4 | Shikra | InstructBLIP |
|---|---|---|---|---|---|
| Greedy | Vanilla | 1752.35 | 969.93 | 1101.50 | 1355.25 |
| VISTA | 1771.87 | 1041.66 | 1256.22 | 1364.05 | |
| Beam | Vanilla | 1749.57 | 869.74 | 1223.44 | 1357.02 |
| VISTA | 1763.15 | 1062.48 | 1323.25 | 1366.57 | |
| Nucleus | Vanilla | 1625.22 | 845.30 | 1069.60 | 1397.71 |
| VISTA | 1738.56 | 1069.37 | 1254.31 | 1447.36 |
🔼 Table 3 presents a comprehensive evaluation of four large vision-language models (LLaVA-1.5, MiniGPT-4, Shikra, and InstructBLIP) across a range of perceptual, reasoning, and knowledge-based tasks, as measured by the Multimodal Machine Evaluation (MME) benchmark. The table shows the overall performance scores achieved by each model under three different decoding strategies (greedy, beam search, and nucleus sampling). Higher scores reflect better overall performance across all task categories, indicating superior general capabilities in multimodal understanding and reasoning.
read the caption
Table 3: Overall performance scores on MME full evaluation set. Higher scores indicate better general capability across perception, reasoning, and knowledge-based tasks.
| 31-31 | 30-31 | 29-31 | 28-31 | 27-31 | |||||||||||
|---|---|---|---|---|---|---|---|---|---|---|---|---|---|---|---|
| C | C | F1 | C | C | F1 | C | C | F1 | C | C | F1 | C | C | F1 | |
| 0.1 | 48.2 | 13.9 | 76.2 | 48.6 | 12.7 | 77.7 | 46.8 | 12.6 | 77.4 | 46.2 | 12.2 | 74.4 | 45.8 | 11.3 | 77.6 |
| 0.2 | 56.6 | 16.4 | 75.3 | 49.4 | 14.4 | 76.5 | 47.4 | 12.7 | 77.3 | 46.8 | 12.1 | 77.7 | 43.2 | 11.7 | 77.6 |
| 0.3 | 62.0 | 18.8 | 72.9 | 55.4 | 15.7 | 75.9 | 49.2 | 14.2 | 76.5 | 45.8 | 12.4 | 77.9 | 42.8 | 11.3 | 78.4 |
| 0.4 | 61.2 | 18.2 | 73.3 | 57.6 | 15.7 | 75.3 | 52.6 | 14.5 | 76.1 | 48.8 | 13.5 | 77.0 | 46.6 | 12.3 | 77.2 |
🔼 This table presents the ablation study result on the impact of different window sizes in the Self-Logits Augmentation (SLA) module on the model’s performance. The window size (w) determines how many layers before the final layer are used to compute the augmentation logits. The experiment varies the window size (w) from 27 to 31 layers before the last layer (31). The table shows the results of CHAIRS and CHAIRI metrics which evaluate the level of hallucination in the generated captions. The F1 score, representing the overall performance, is also included. This analysis helps to understand the optimal window size for balancing the benefits of including information from earlier layers against potential noise or irrelevant information.
read the caption
Table 4: Impact of window size on SLA performance. Layer ranges (X-31) indicate the span of layers used for logit augmentation, where X varies from 27 to 31. CSS{}_{\text{S}}start_FLOATSUBSCRIPT S end_FLOATSUBSCRIPT and CII{}_{\text{I}}start_FLOATSUBSCRIPT I end_FLOATSUBSCRIPT denote CHAIRSS{}_{\text{S}}start_FLOATSUBSCRIPT S end_FLOATSUBSCRIPT and CHAIRII{}_{\text{I}}start_FLOATSUBSCRIPT I end_FLOATSUBSCRIPT metrics, respectively.
| Methods | Greedy | VCD | PAI | VISTA (ours) |
|---|---|---|---|---|
| Latency (ms/token) | 28.54 () | 58.34 () | 57.78 () | 36.32 () |
| Throughput (token/s) | 35.04 () | 17.14 () | 17.31 () | 27.53 () |
🔼 This table presents a quantitative comparison of the throughput (tokens per second) and latency (milliseconds per token) for different decoding methods when applied to the LLAVA-1.5 large vision-language model. The greedy decoding strategy serves as the baseline against which other methods are measured. The table shows how efficiently each method processes tokens during the text generation process.
read the caption
Table 5: Measure of throughput and latency on LLAVA-1.5. Greedy decoding strategy is applied and listed as baseline.
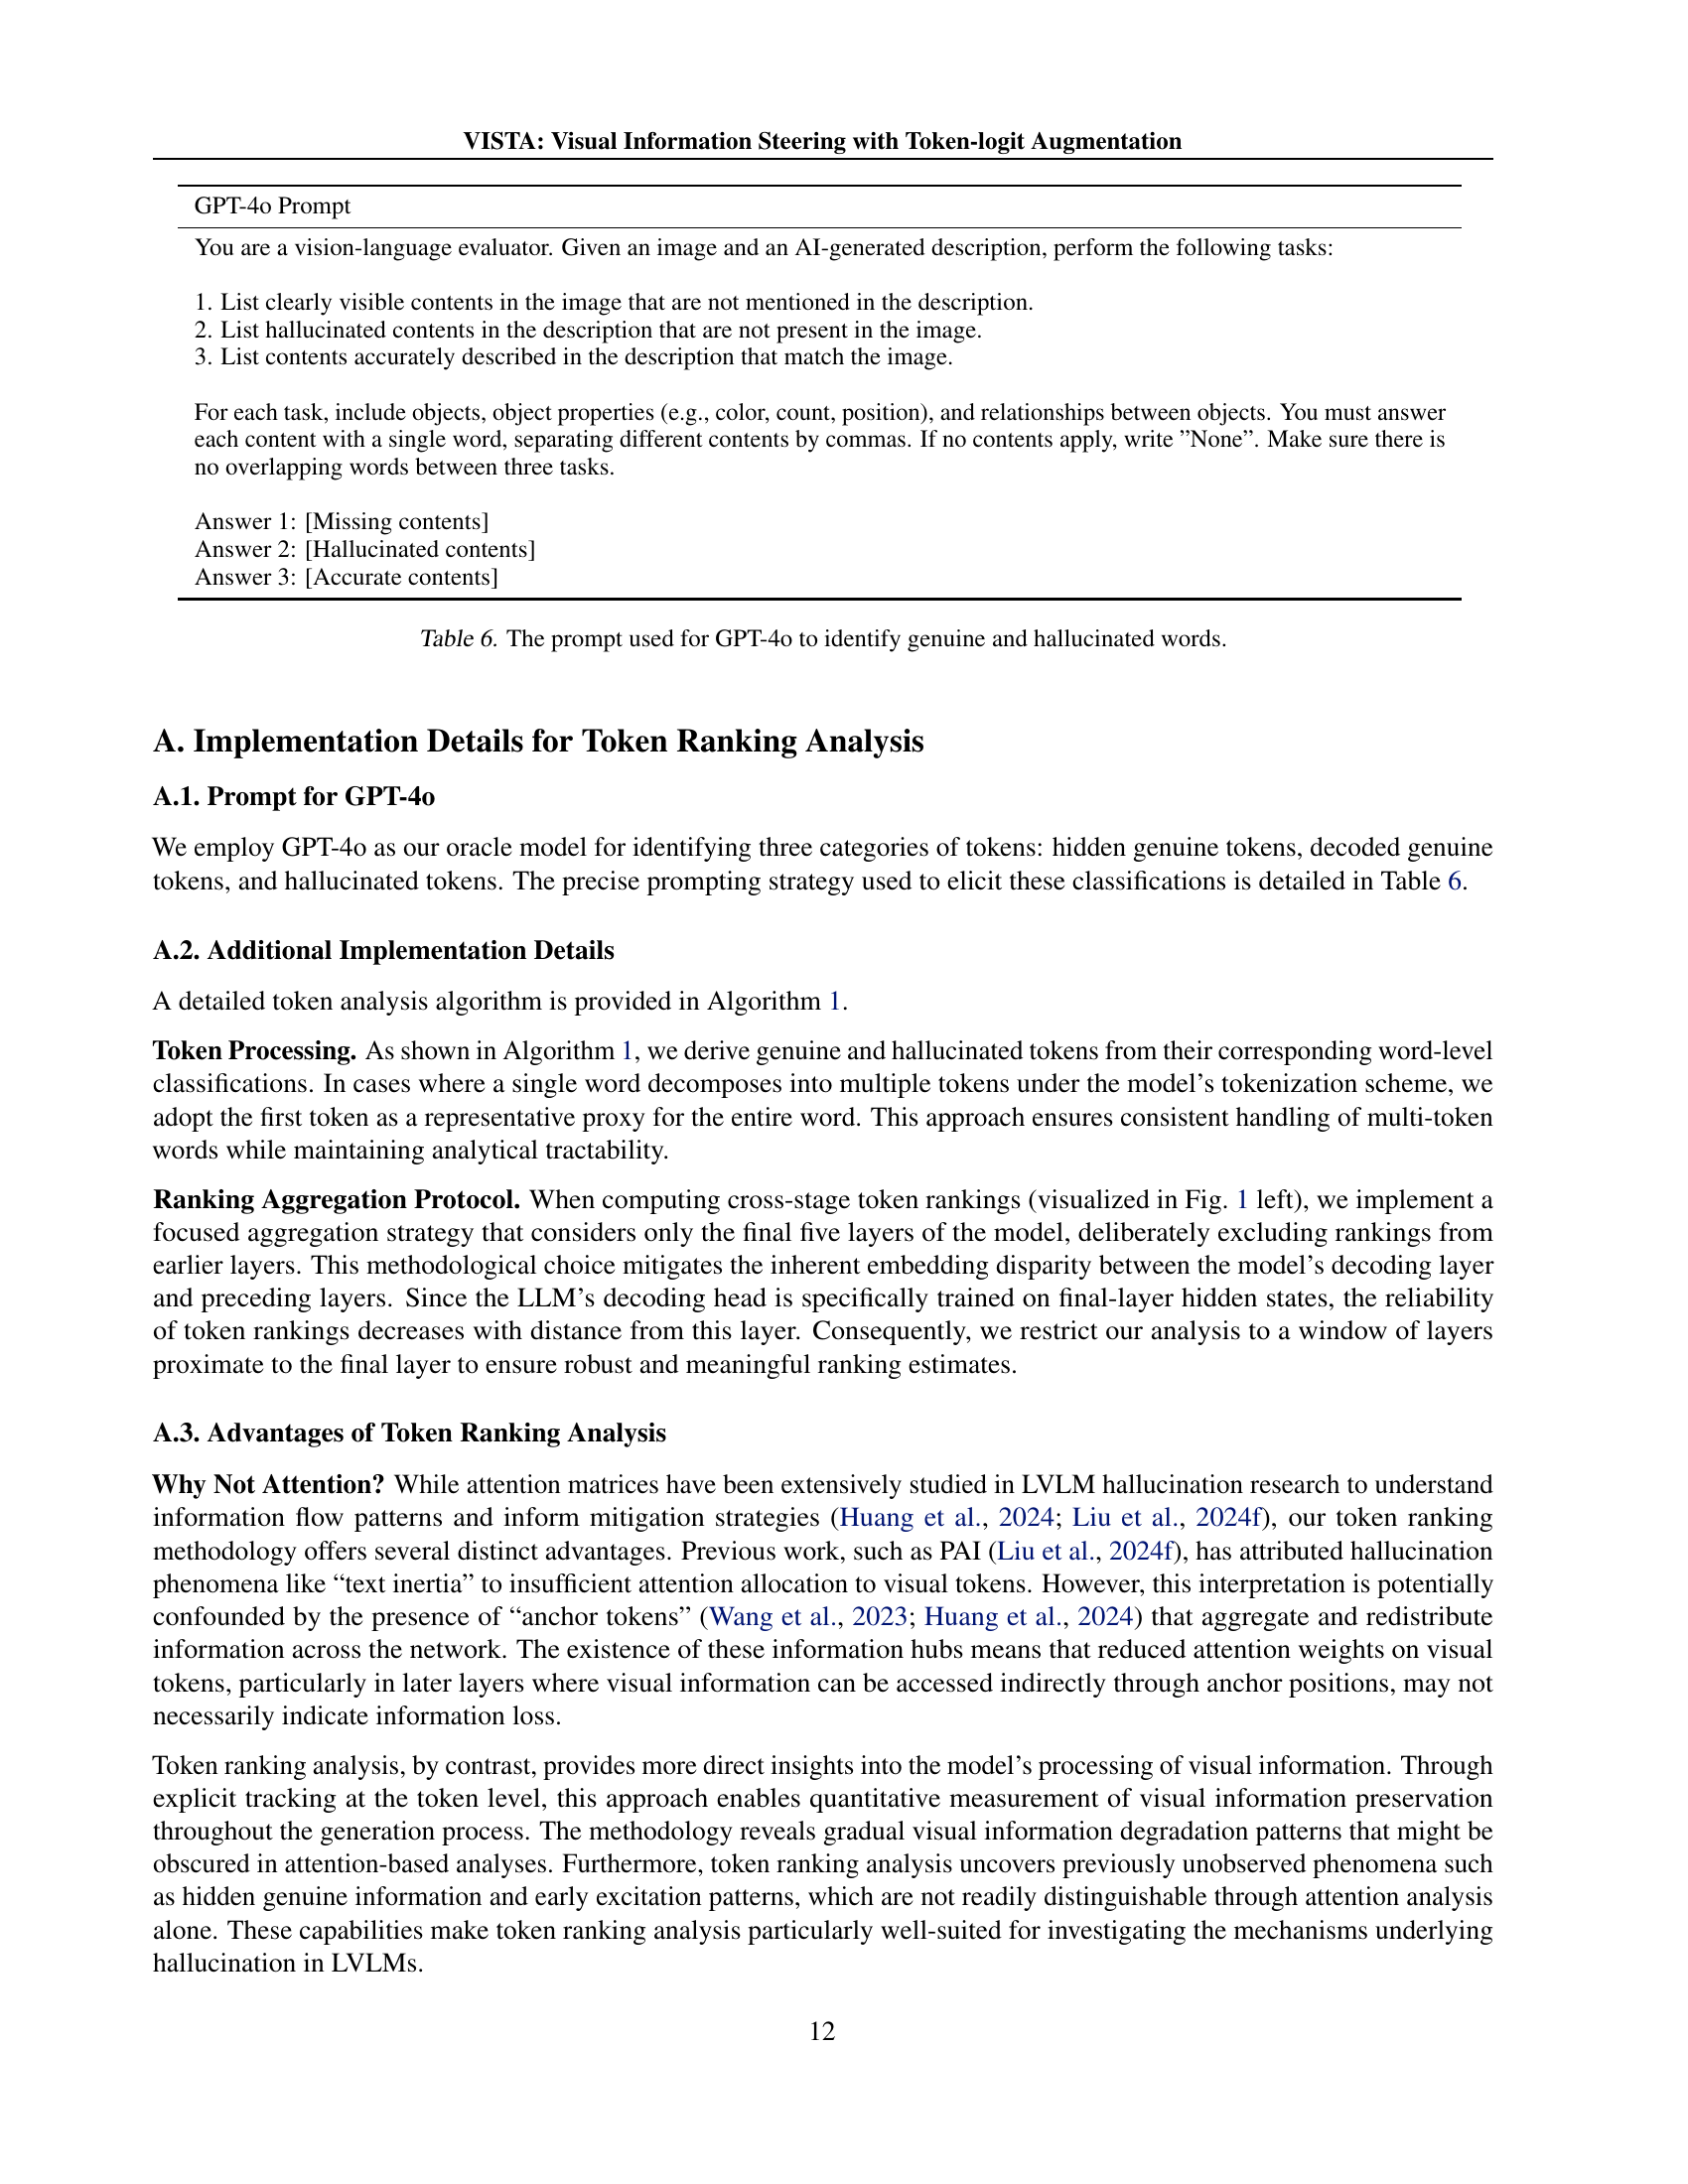
| GPT-4o Prompt |
|---|
| You are a vision-language evaluator. Given an image and an AI-generated description, perform the following tasks: |
| 1. List clearly visible contents in the image that are not mentioned in the description. |
| 2. List hallucinated contents in the description that are not present in the image. |
| 3. List contents accurately described in the description that match the image. |
| For each task, include objects, object properties (e.g., color, count, position), and relationships between objects. You must answer each content with a single word, separating different contents by commas. If no contents apply, write ”None”. Make sure there is no overlapping words between three tasks. |
| Answer 1: [Missing contents] |
| Answer 2: [Hallucinated contents] |
| Answer 3: [Accurate contents] |
🔼 This table details the prompt given to GPT-40 to distinguish between genuine and hallucinated words in image captions. The prompt instructs GPT-40 to analyze an image and its AI-generated caption, identifying words that accurately describe the image, words describing visible content missing from the caption, and hallucinated words present in the caption but absent from the image. It specifies that the output should be concise, using single words separated by commas for each category and noting ‘None’ if no applicable words exist in a category.
read the caption
Table 6: The prompt used for GPT-4o to identify genuine and hallucinated words.
Full paper#