TL;DR#
High-resolution video generation using diffusion transformers is currently very slow due to the high computational cost of 3D attention mechanisms. Existing methods to improve speed, such as sliding window attention, have proven ineffective due to inefficiencies in handling the irregular attention patterns this creates. The significant processing time makes it difficult to use these models for practical applications.
This paper introduces a novel method called Sliding Tile Attention (STA) to address this challenge. STA cleverly restructures the computation to work efficiently with the hardware, resulting in a much faster approach. The researchers demonstrate that STA can accelerate video generation significantly (up to 3.53 times faster) compared to previous state-of-the-art methods while maintaining high video quality. This makes high-resolution video generation more feasible for broader applications.
Key Takeaways#
Why does it matter?#
This paper is important because it significantly accelerates video generation, a computationally expensive task. It addresses a key limitation of diffusion transformers, paving the way for more efficient and practical applications in video editing, generation, and analysis. The proposed method, sliding tile attention (STA), can be applied to other high-dimensional data, potentially impacting research in various fields. This work opens new avenues for optimizing attention mechanisms and improving efficiency in large language models.
Visual Insights#

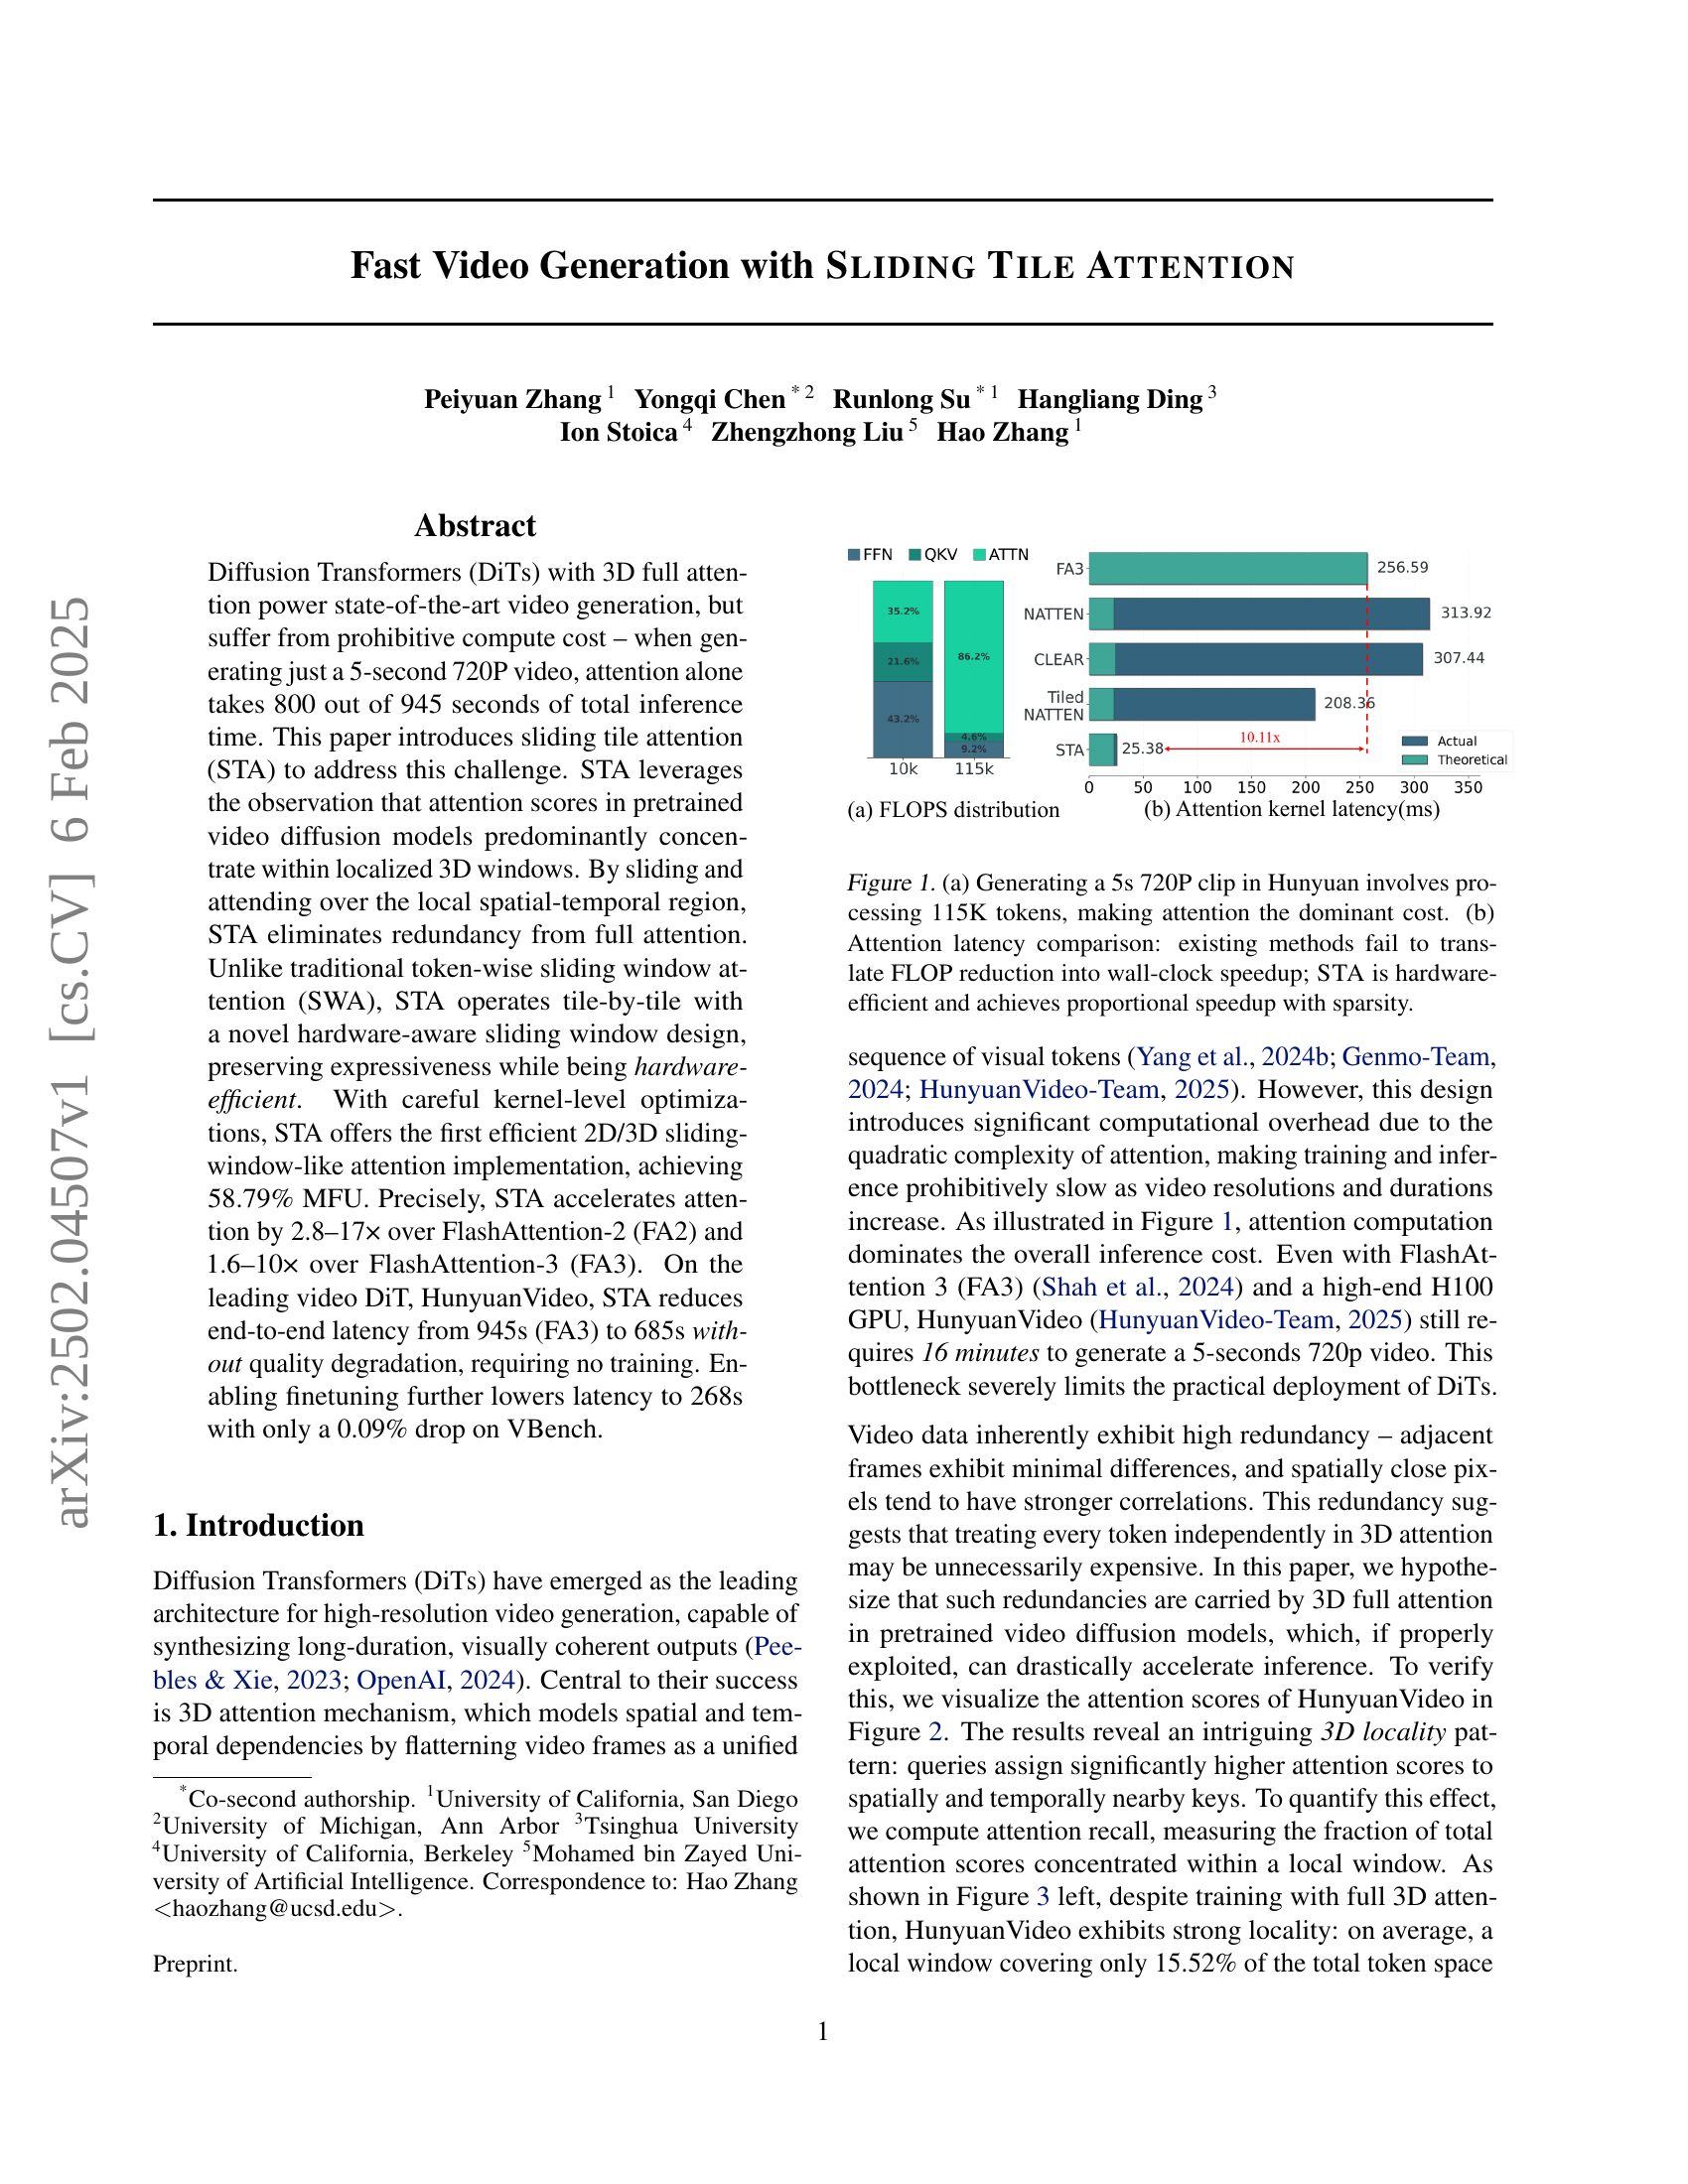
🔼 Figure 1 is a two-part figure demonstrating the efficiency of Sliding Tile Attention (STA) in video generation. Part (a) shows the computational breakdown of generating a 5-second, 720p video using the HunyuanVideo model. It highlights that attention operations consume the bulk (around 86%) of the total inference time, processing 115,000 tokens. Part (b) compares the attention latency of STA against existing methods (FlashAttention-2 and FlashAttention-3). It shows that unlike other methods, STA translates its theoretical FLOP reduction into a proportional wall-clock speedup, which demonstrates its hardware efficiency and effectiveness.
read the caption
Figure 1: (a) Generating a 5s 720P clip in Hunyuan involves processing 115K tokens, making attention the dominant cost. (b) Attention latency comparison: existing methods fail to translate FLOP reduction into wall-clock speedup; STA is hardware-efficient and achieves proportional speedup with sparsity.
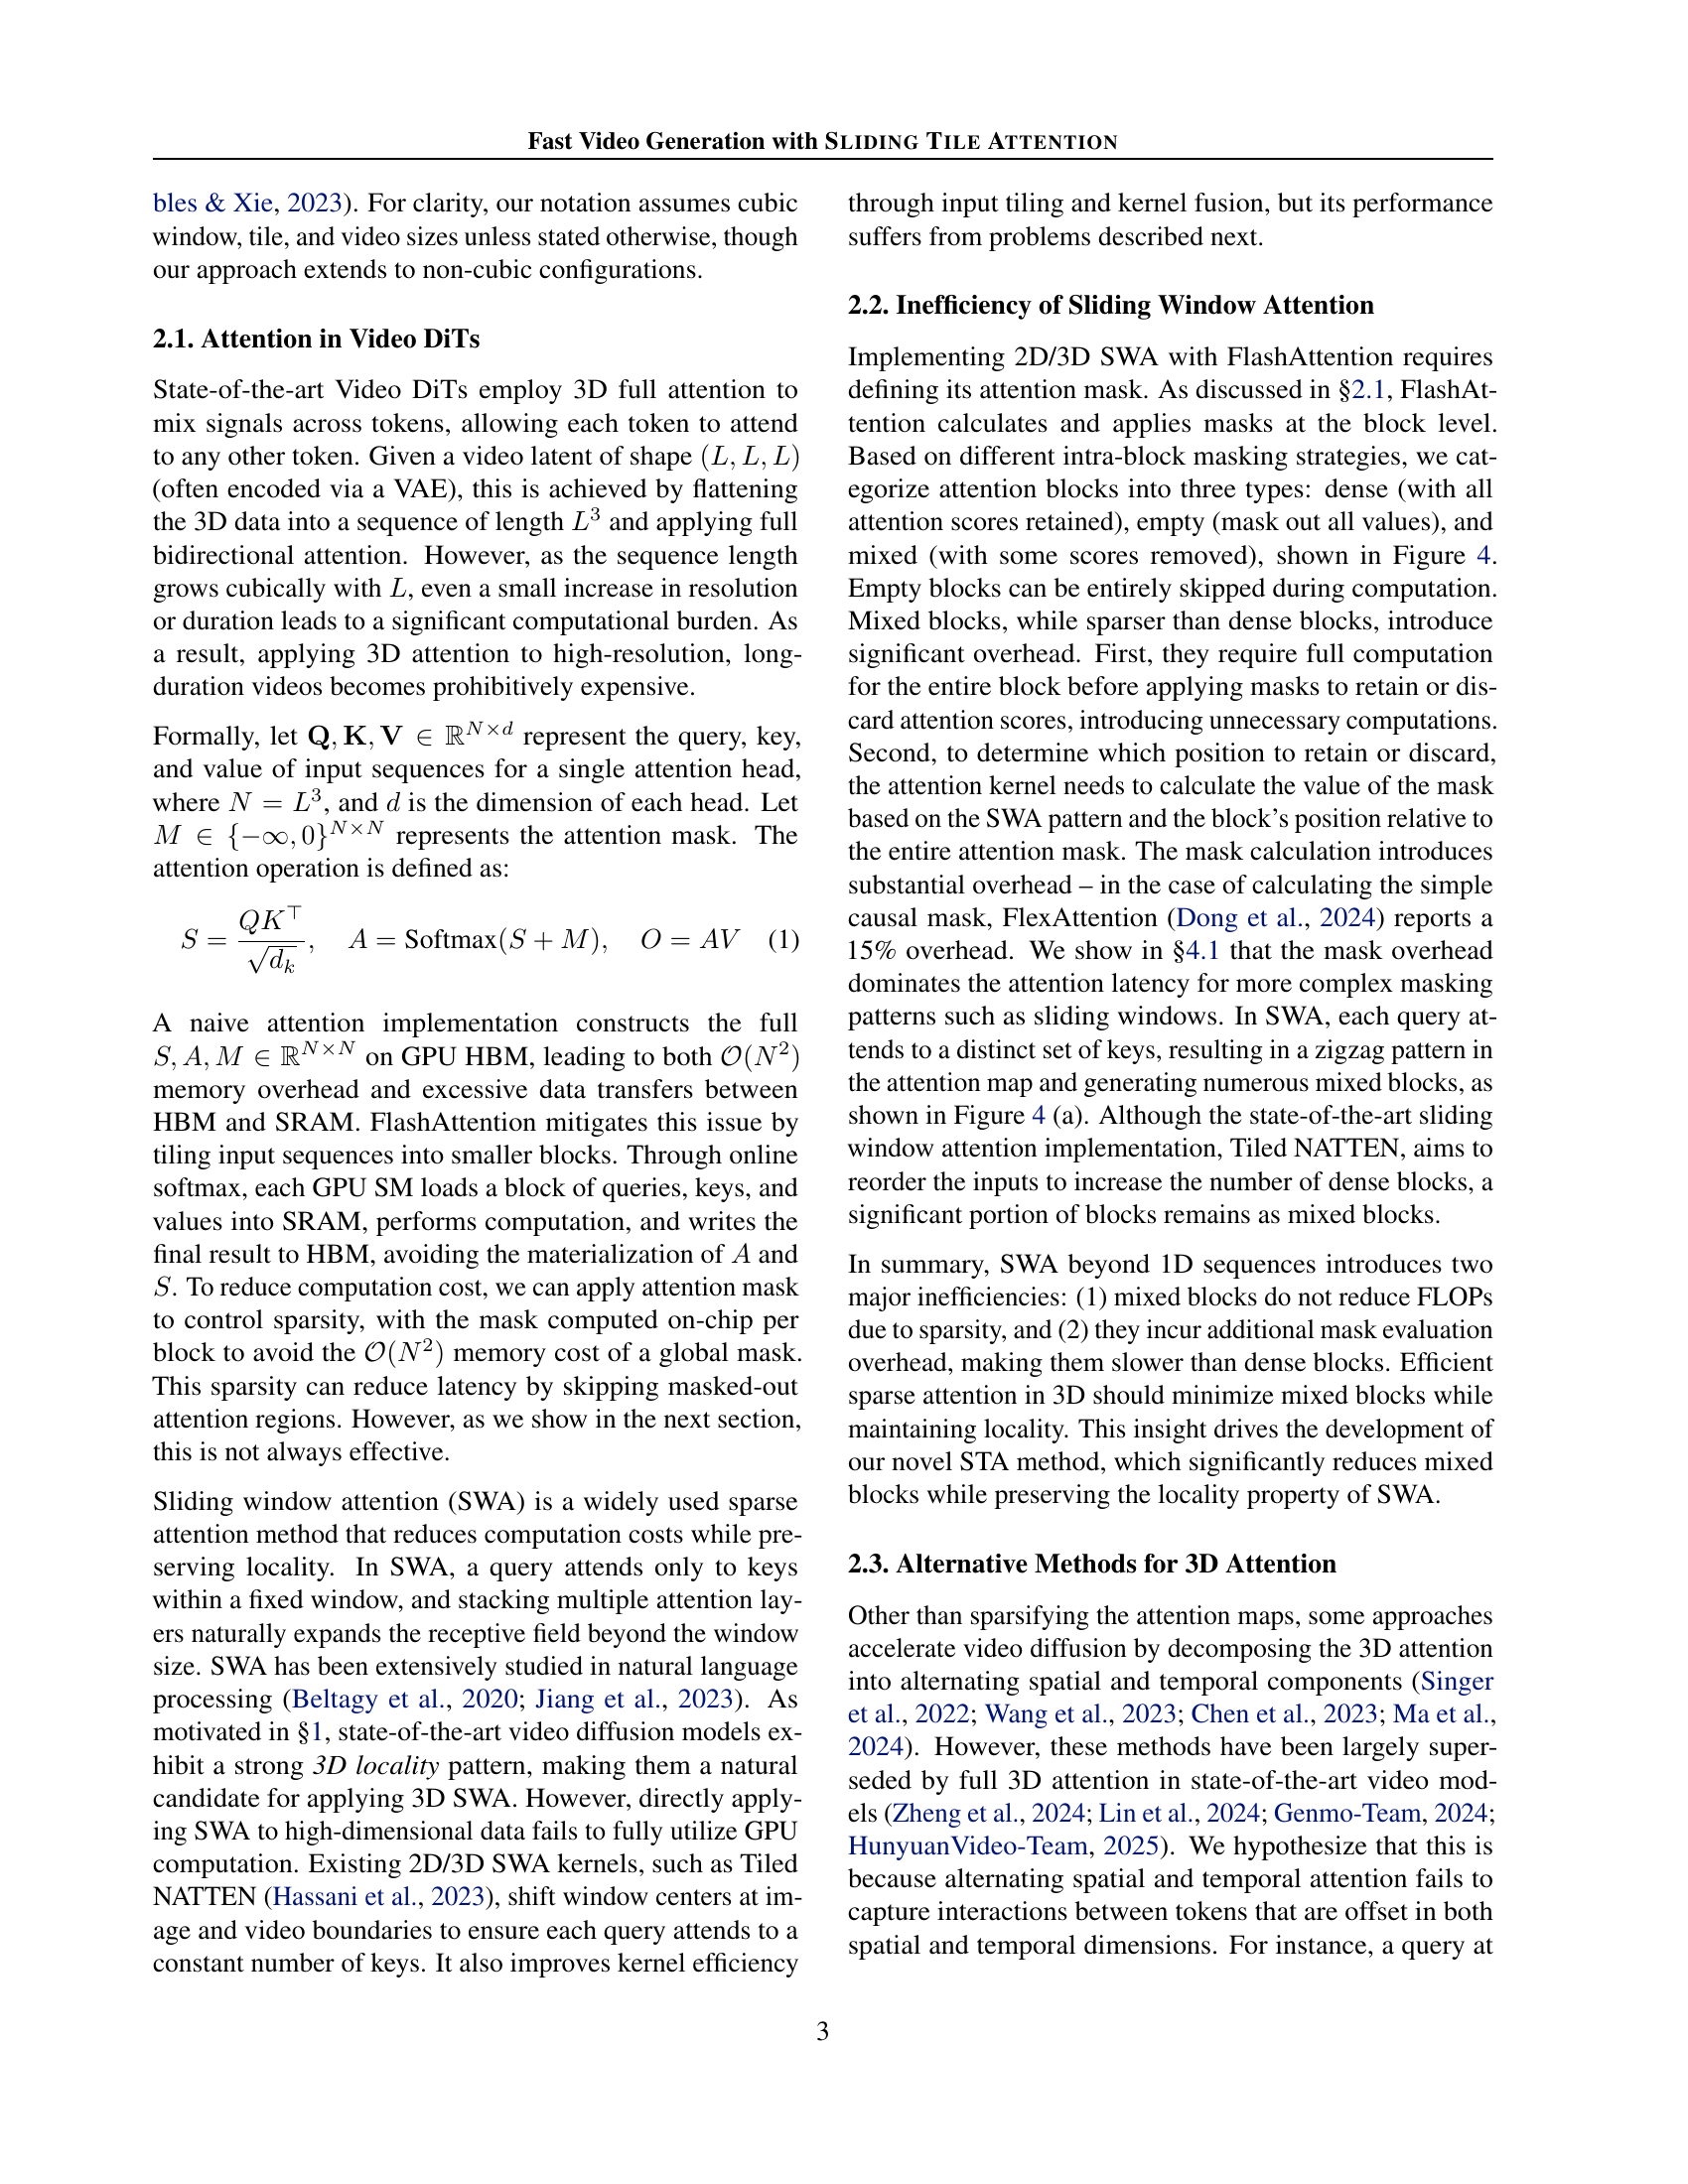
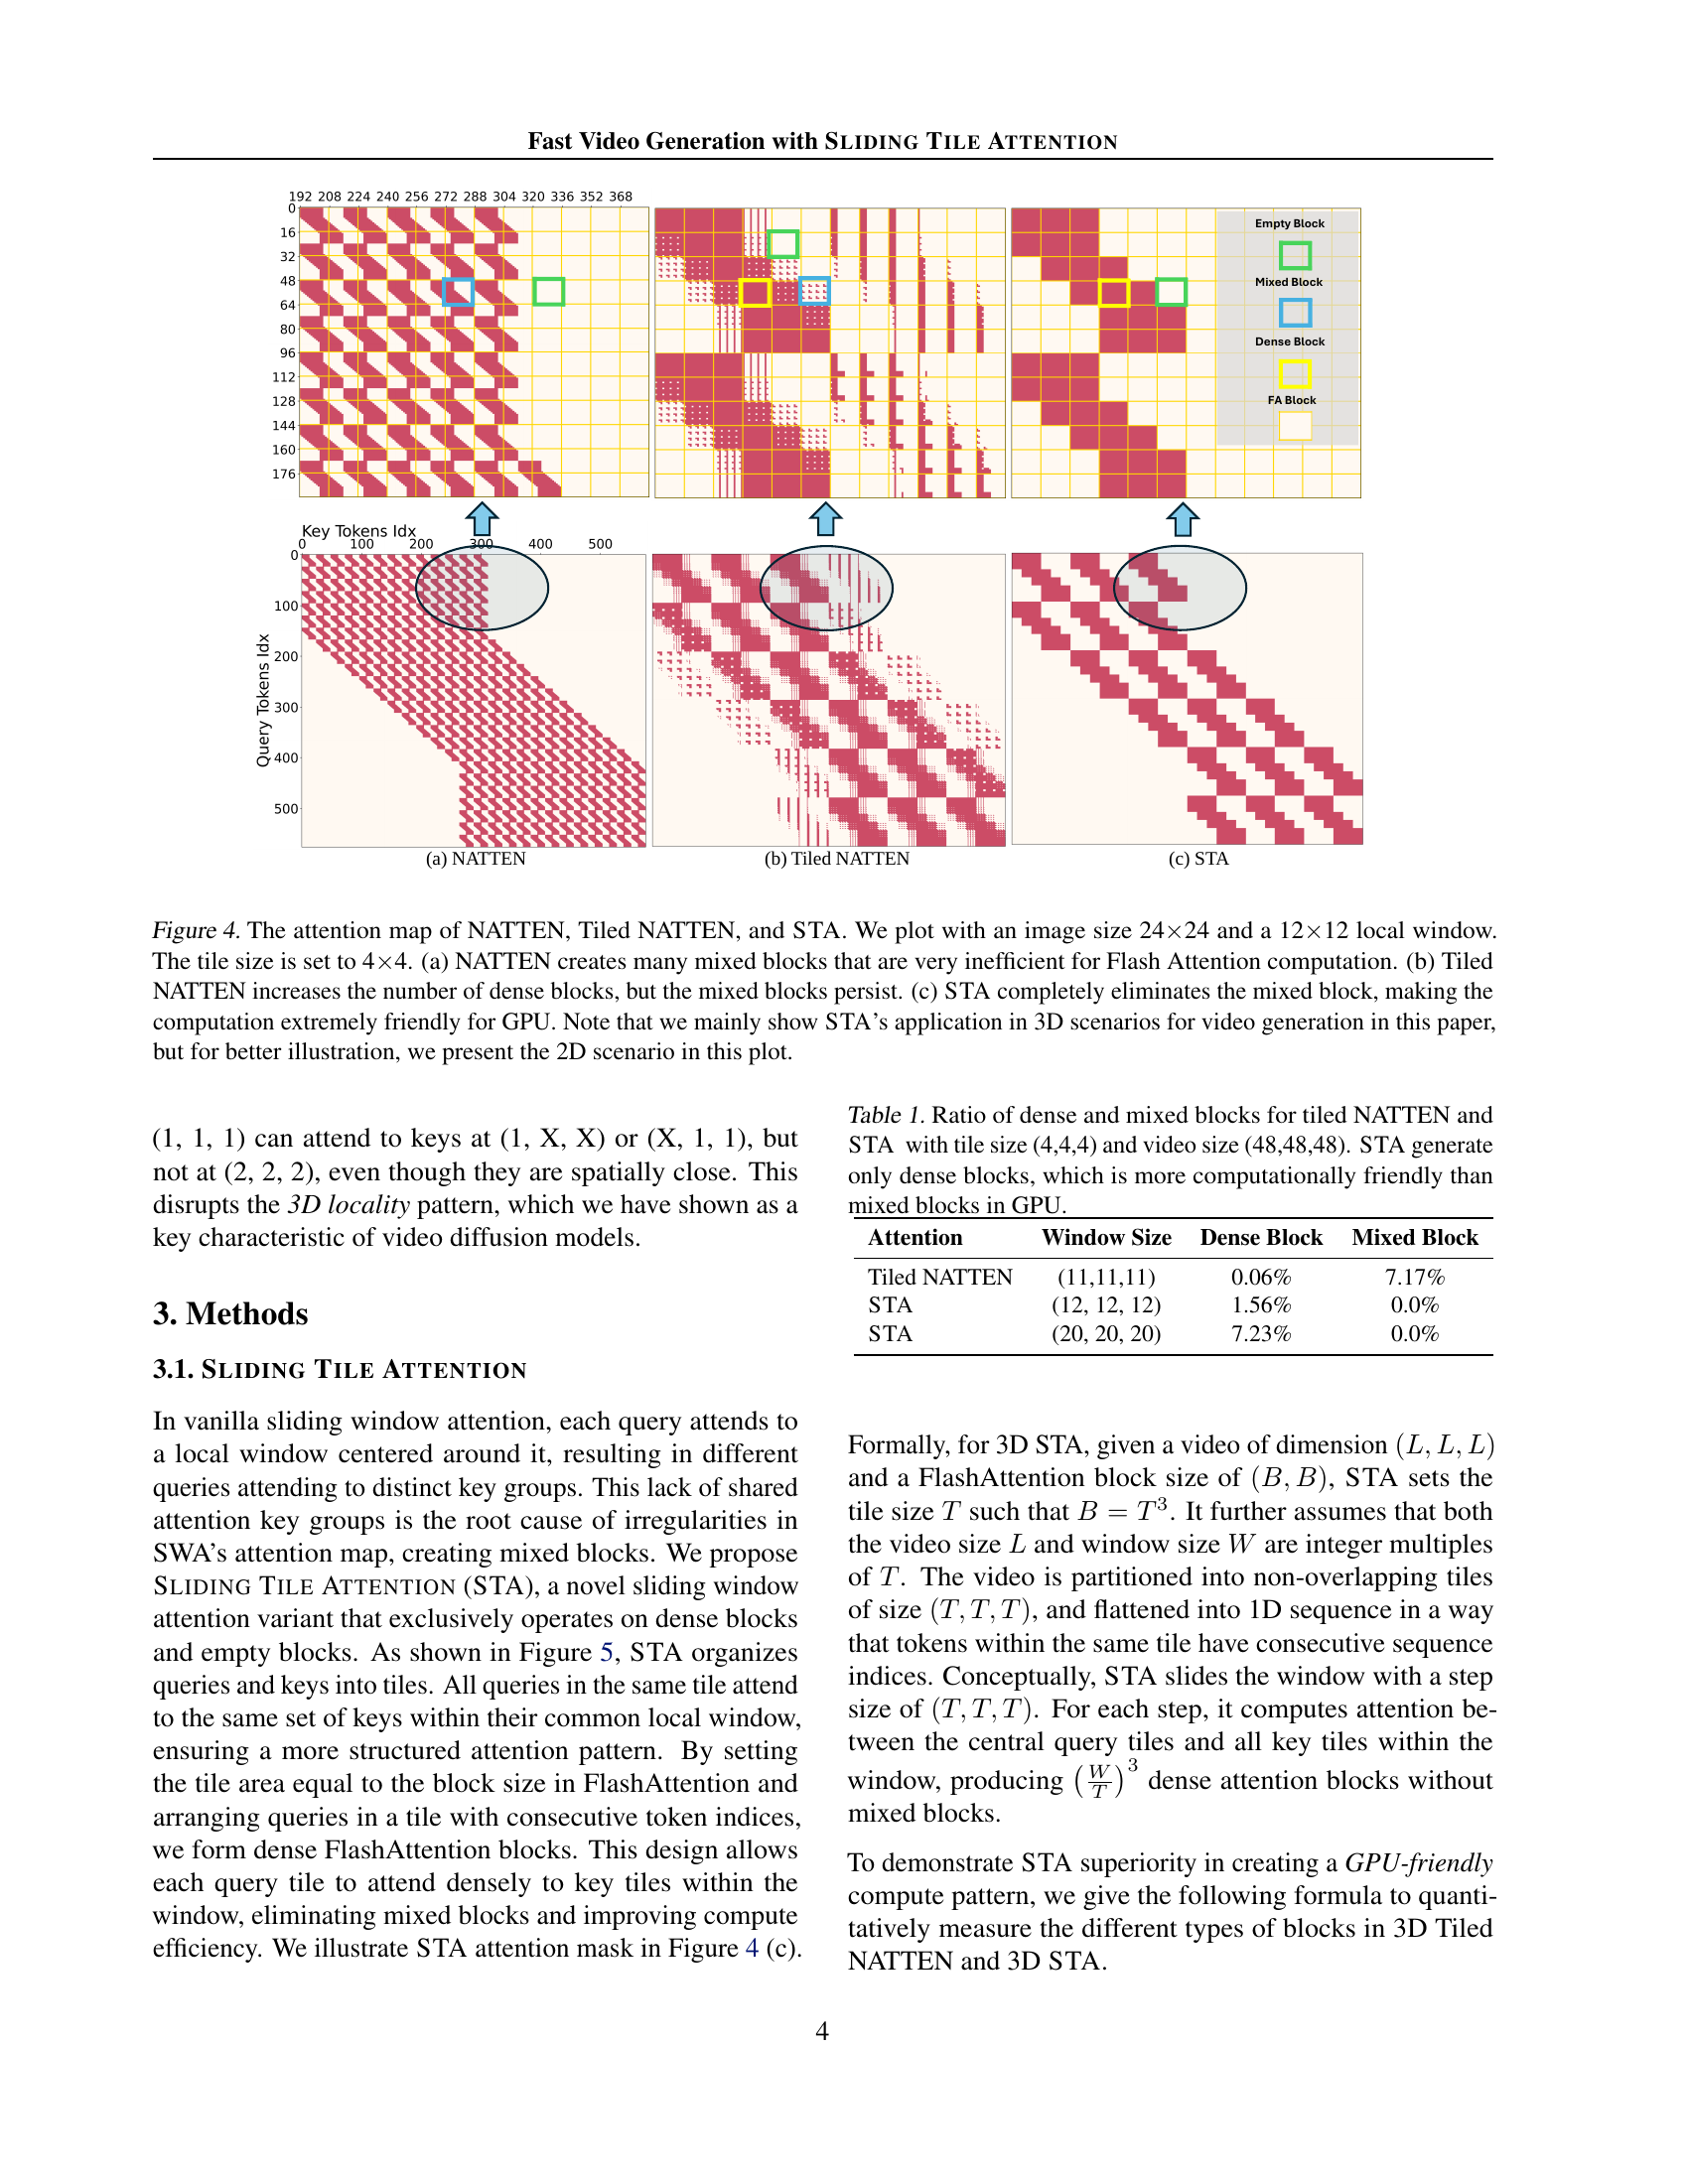
| Attention | Window Size | Dense Block | Mixed Block |
| Tiled NATTEN | (11,11,11) | 0.06% | 7.17% |
| STA | (12, 12, 12) | 1.56% | 0.0% |
| STA | (20, 20, 20) | 7.23% | 0.0% |
🔼 This table compares the number of dense and mixed blocks generated by the Tiled NATTEN and STA attention mechanisms. The comparison uses a tile size of (4, 4, 4) and a video size of (48, 48, 48). Dense blocks are computationally efficient because they don’t require any masking operations, unlike mixed blocks. The results show that STA generates only dense blocks, making it more efficient than Tiled NATTEN on GPUs. This difference in block types is a key factor in the performance improvements achieved by STA.
read the caption
Table 1: Ratio of dense and mixed blocks for tiled NATTEN and STA with tile size (4,4,4) and video size (48,48,48). STA generate only dense blocks, which is more computationally friendly than mixed blocks in GPU.
In-depth insights#
3D Attention Sparsity#
3D attention mechanisms are computationally expensive, especially for high-resolution videos. This necessitates exploring sparsity techniques to make video generation more efficient. Sparsity aims to reduce the computational burden by focusing attention on only the most relevant parts of the input video, rather than processing all tokens equally. This can be achieved by various methods, including sliding windows or tile-based approaches. The effectiveness of a sparsity method depends on preserving the crucial information while discarding redundant information. This balance is crucial for achieving a good speed-quality trade-off. A naive implementation of sparsity can lead to significant overhead. Therefore, careful kernel optimization is critical for hardware efficiency. A well-designed sparse attention mechanism should exhibit a high memory access efficiency and computational throughput. Evaluating the impact on video generation quality is also necessary, to ensure the tradeoff between speed and fidelity is acceptable.
STA: Tile-Based Attention#
The proposed Sliding Tile Attention (STA) mechanism offers a novel approach to address the computational limitations of 3D attention in video generation. Unlike traditional sliding window attention, STA operates on tiles of tokens, which are contiguous groups of tokens forming a spatial-temporal cube. This tile-based approach enhances hardware efficiency by reducing the irregular memory access patterns and mask overhead common in other sliding window methods. By carefully aligning tile sizes with hardware block sizes, STA creates primarily dense blocks for computation, leading to significant speedups. The method also incorporates head specialization by optimizing tile sizes per attention head, further boosting efficiency and preserving the quality of the generated video. Hardware-aware design is central to STA’s success, highlighting its practical advantages for deploying video diffusion models efficiently.
Hardware Efficiency Gains#
The research paper highlights significant hardware efficiency gains achieved through the proposed Sliding Tile Attention (STA) mechanism. STA’s superior performance stems from its novel tile-based approach, cleverly addressing the inefficiencies of traditional sliding window attention in high-dimensional video data. Unlike methods that struggle to translate FLOP reductions into actual speedups, STA demonstrates a remarkable 10x acceleration over existing methods while maintaining a high memory access efficiency (MFU). This impressive speedup directly translates to faster video generation, significantly reducing inference time. The improvements are not merely theoretical; real-world testing on a state-of-the-art video diffusion model confirms substantial end-to-end latency reductions. Furthermore, the design of STA shows an inherent compatibility with modern GPU architectures, maximizing parallelism and reducing unnecessary overhead. This hardware-aware design is a key differentiator, ensuring that computational gains are effectively realized in practice. The paper also provides detailed kernel-level optimizations, demonstrating how careful engineering can further boost efficiency, proving STA’s potential for widespread adoption in video generation tasks.
Locality in Video DiTs#
The concept of ‘Locality in Video DiTs’ centers on the observation that attention mechanisms in pretrained video diffusion models exhibit a strong spatial and temporal locality. Attention scores are heavily concentrated within localized 3D windows, meaning that a token primarily attends to nearby tokens in space and time, rather than globally across the entire video. This crucial insight enables significant optimization opportunities. Exploiting this locality reduces computational redundancy inherent in full 3D attention, a computationally expensive operation. The paper investigates the degree and consistency of this locality across different attention heads and prompts, showing that while the exact pattern differs across heads, locality remains surprisingly robust, suggesting the validity of attention sparsification strategies. Understanding and leveraging this inherent locality is key to developing efficient and scalable video generation models, leading to faster inference times without substantial loss of visual quality.
Finetuning and Speedup#
The research paper explores the impact of fine-tuning on a novel attention mechanism called Sliding Tile Attention (STA) to accelerate video generation. Fine-tuning STA with a high sparsity configuration leads to substantial speed improvements, demonstrating the efficiency of the method. The results reveal a trade-off between speed and quality. While training-free STA already provides significant speedup, finetuning pushes the performance further, albeit at a slight cost in visual fidelity. This suggests a promising direction for optimizing video diffusion models: using a highly efficient attention mechanism like STA with carefully balanced fine-tuning to achieve the desired trade-off between computational cost and quality.
More visual insights#
More on figures

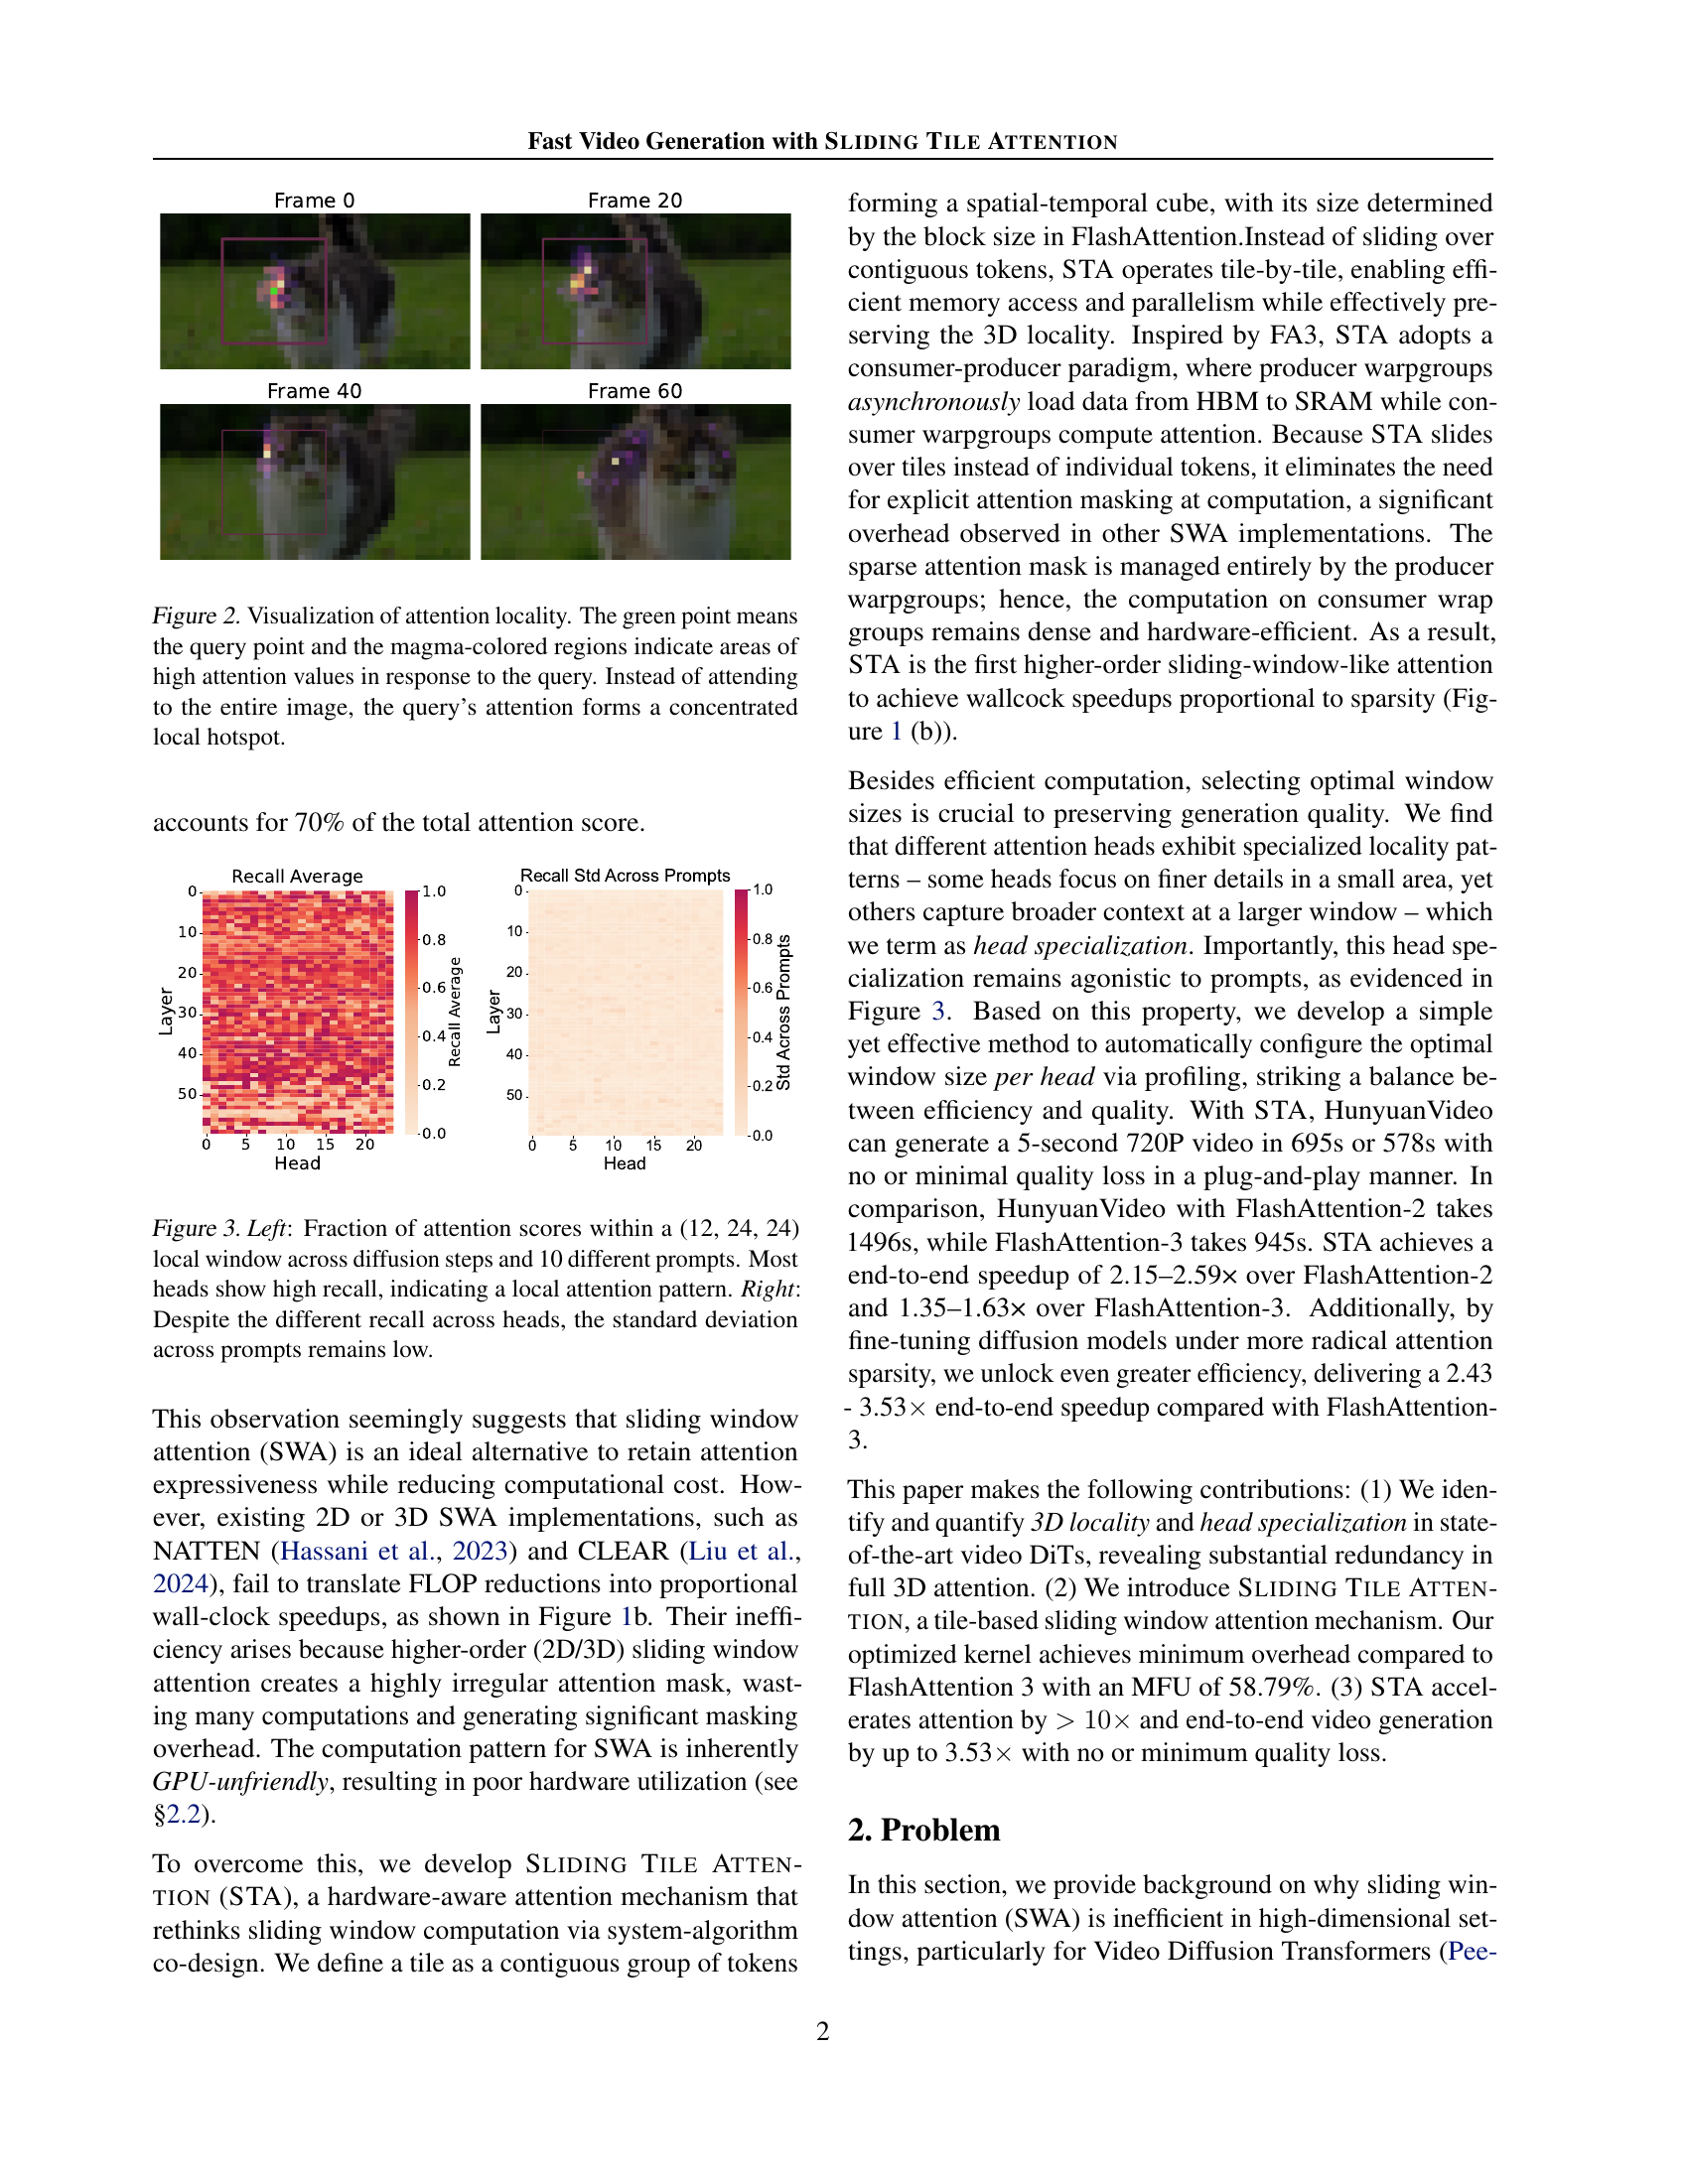
🔼 This figure visualizes the locality of attention in a pretrained video diffusion model. Each image shows a single query point (green dot) and its corresponding attention weights (magma color scale). The intensity of the color represents the attention score; brighter colors mean higher attention weights. Instead of attending to all tokens, the query’s attention is concentrated in a small spatial-temporal region (hotspot) near the query point. This demonstrates the highly localized nature of attention, suggesting that only a small portion of the video needs to be processed for each query.
read the caption
Figure 2: Visualization of attention locality. The green point means the query point and the magma-colored regions indicate areas of high attention values in response to the query. Instead of attending to the entire image, the query’s attention forms a concentrated local hotspot.

🔼 This figure visualizes the locality of attention in a pretrained video diffusion model. The left panel shows the fraction of total attention scores that fall within a 3D window of size (12, 24, 24) across different diffusion steps and 10 different prompts. The high recall values observed across most attention heads demonstrate a strong tendency for attention to focus on localized spatial-temporal regions rather than attending to global context. The right panel complements this by showing that despite variations in recall across different heads, the standard deviation of recall scores across the 10 prompts remains low. This implies that the local attention pattern is robust and consistent across different inputs.
read the caption
Figure 3: Left: Fraction of attention scores within a (12, 24, 24) local window across diffusion steps and 10 different prompts. Most heads show high recall, indicating a local attention pattern. Right: Despite the different recall across heads, the standard deviation across prompts remains low.

🔼 This figure compares the attention maps of three different attention mechanisms: NATTEN, Tiled NATTEN, and STA. All are visualized for a 24x24 image with a 12x12 local window and 4x4 tiles. NATTEN shows many inefficient ‘mixed blocks’ where both attended and un-attended values exist, requiring more computation. Tiled NATTEN improves on this slightly by increasing the number of efficient ‘dense blocks,’ but mixed blocks remain. STA, however, entirely eliminates mixed blocks, resulting in a much more efficient computation pattern suitable for GPUs. Although the paper primarily focuses on the 3D application of STA for video generation, this figure uses a simplified 2D example for easier comprehension.
read the caption
Figure 4: The attention map of NATTEN, Tiled NATTEN, and STA. We plot with an image size 24×\times×24 and a 12×\times×12 local window. The tile size is set to 4×\times×4. (a) NATTEN creates many mixed blocks that are very inefficient for Flash Attention computation. (b) Tiled NATTEN increases the number of dense blocks, but the mixed blocks persist. (c) STA completely eliminates the mixed block, making the computation extremely friendly for GPU. Note that we mainly show STA’s application in 3D scenarios for video generation in this paper, but for better illustration, we present the 2D scenario in this plot.

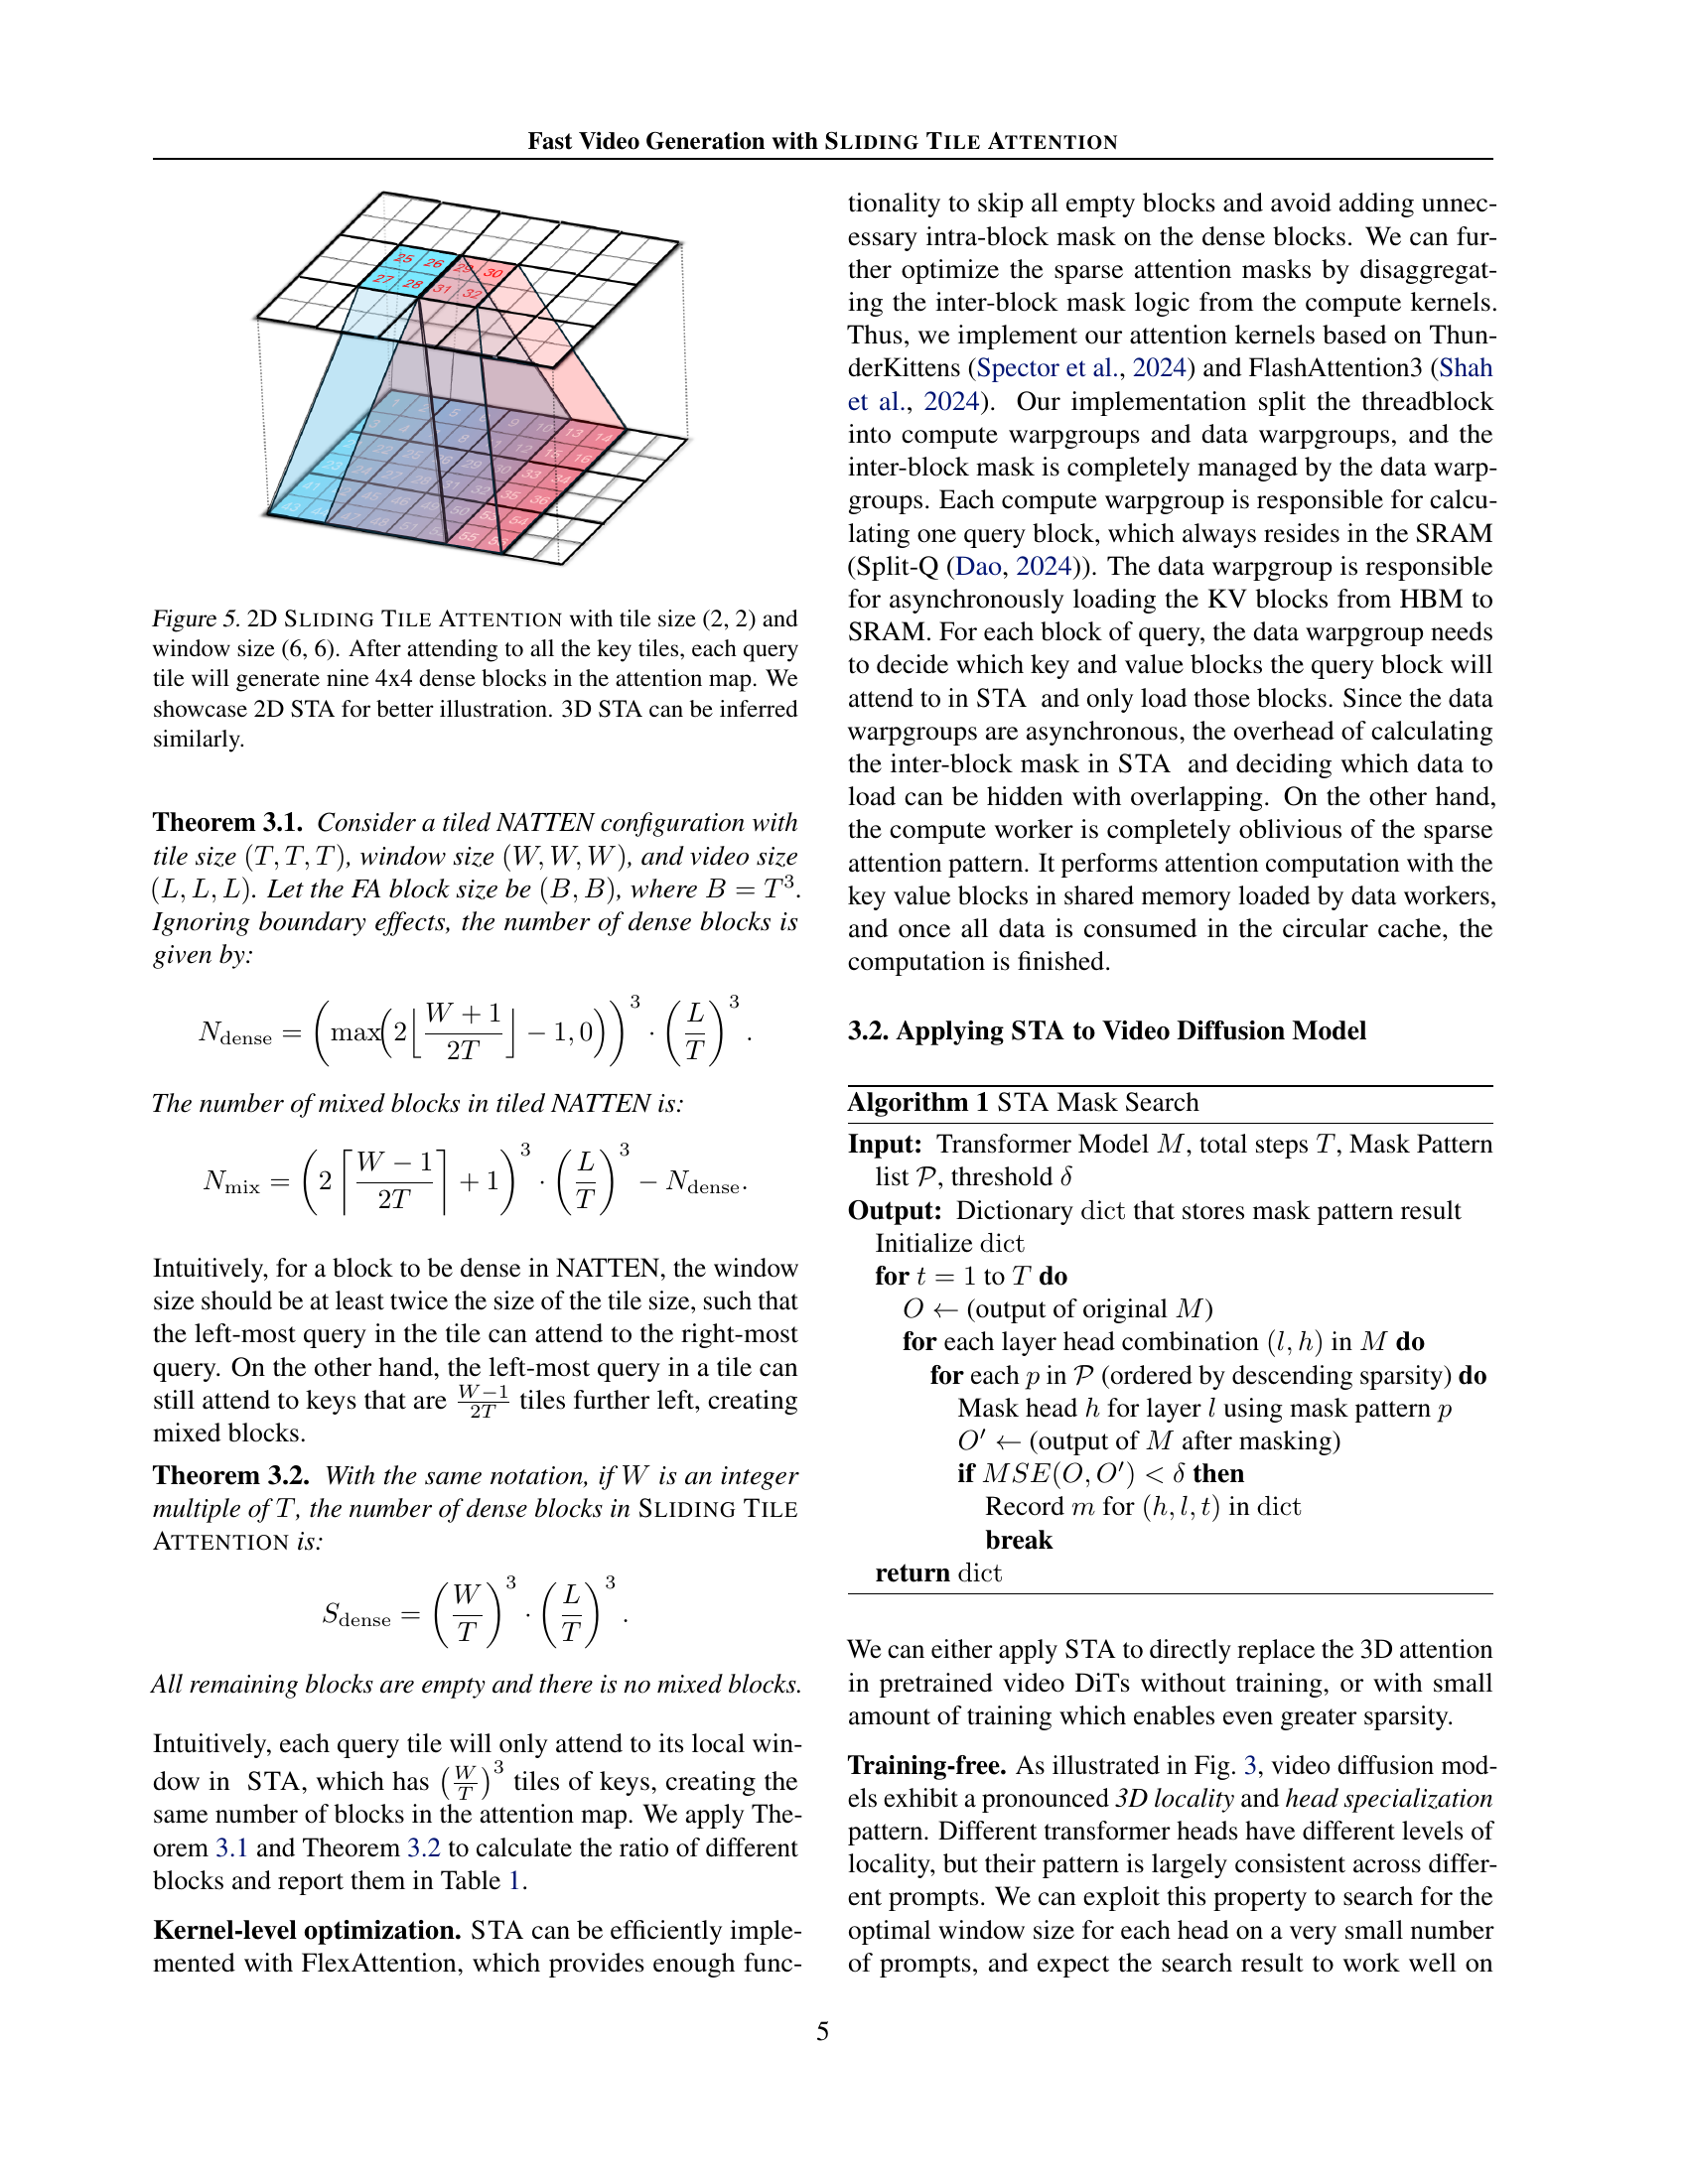
🔼 This figure illustrates the SLIDING TILE ATTENTION (STA) mechanism in two dimensions. It shows how tiles of query tokens attend to tiles of key tokens within a defined window. Each query tile interacts with a set of key tiles to form a set of 4x4 dense blocks, avoiding the sparse and irregular attention patterns found in traditional sliding window approaches. The use of tiles ensures efficient memory access and computation. The 2D example in the figure serves as a simplified representation to clarify the concept. The 3D version of STA functions similarly.
read the caption
Figure 5: 2D Sliding Tile Attention with tile size (2, 2) and window size (6, 6). After attending to all the key tiles, each query tile will generate nine 4x4 dense blocks in the attention map. We showcase 2D STA for better illustration. 3D STA can be inferred similarly.

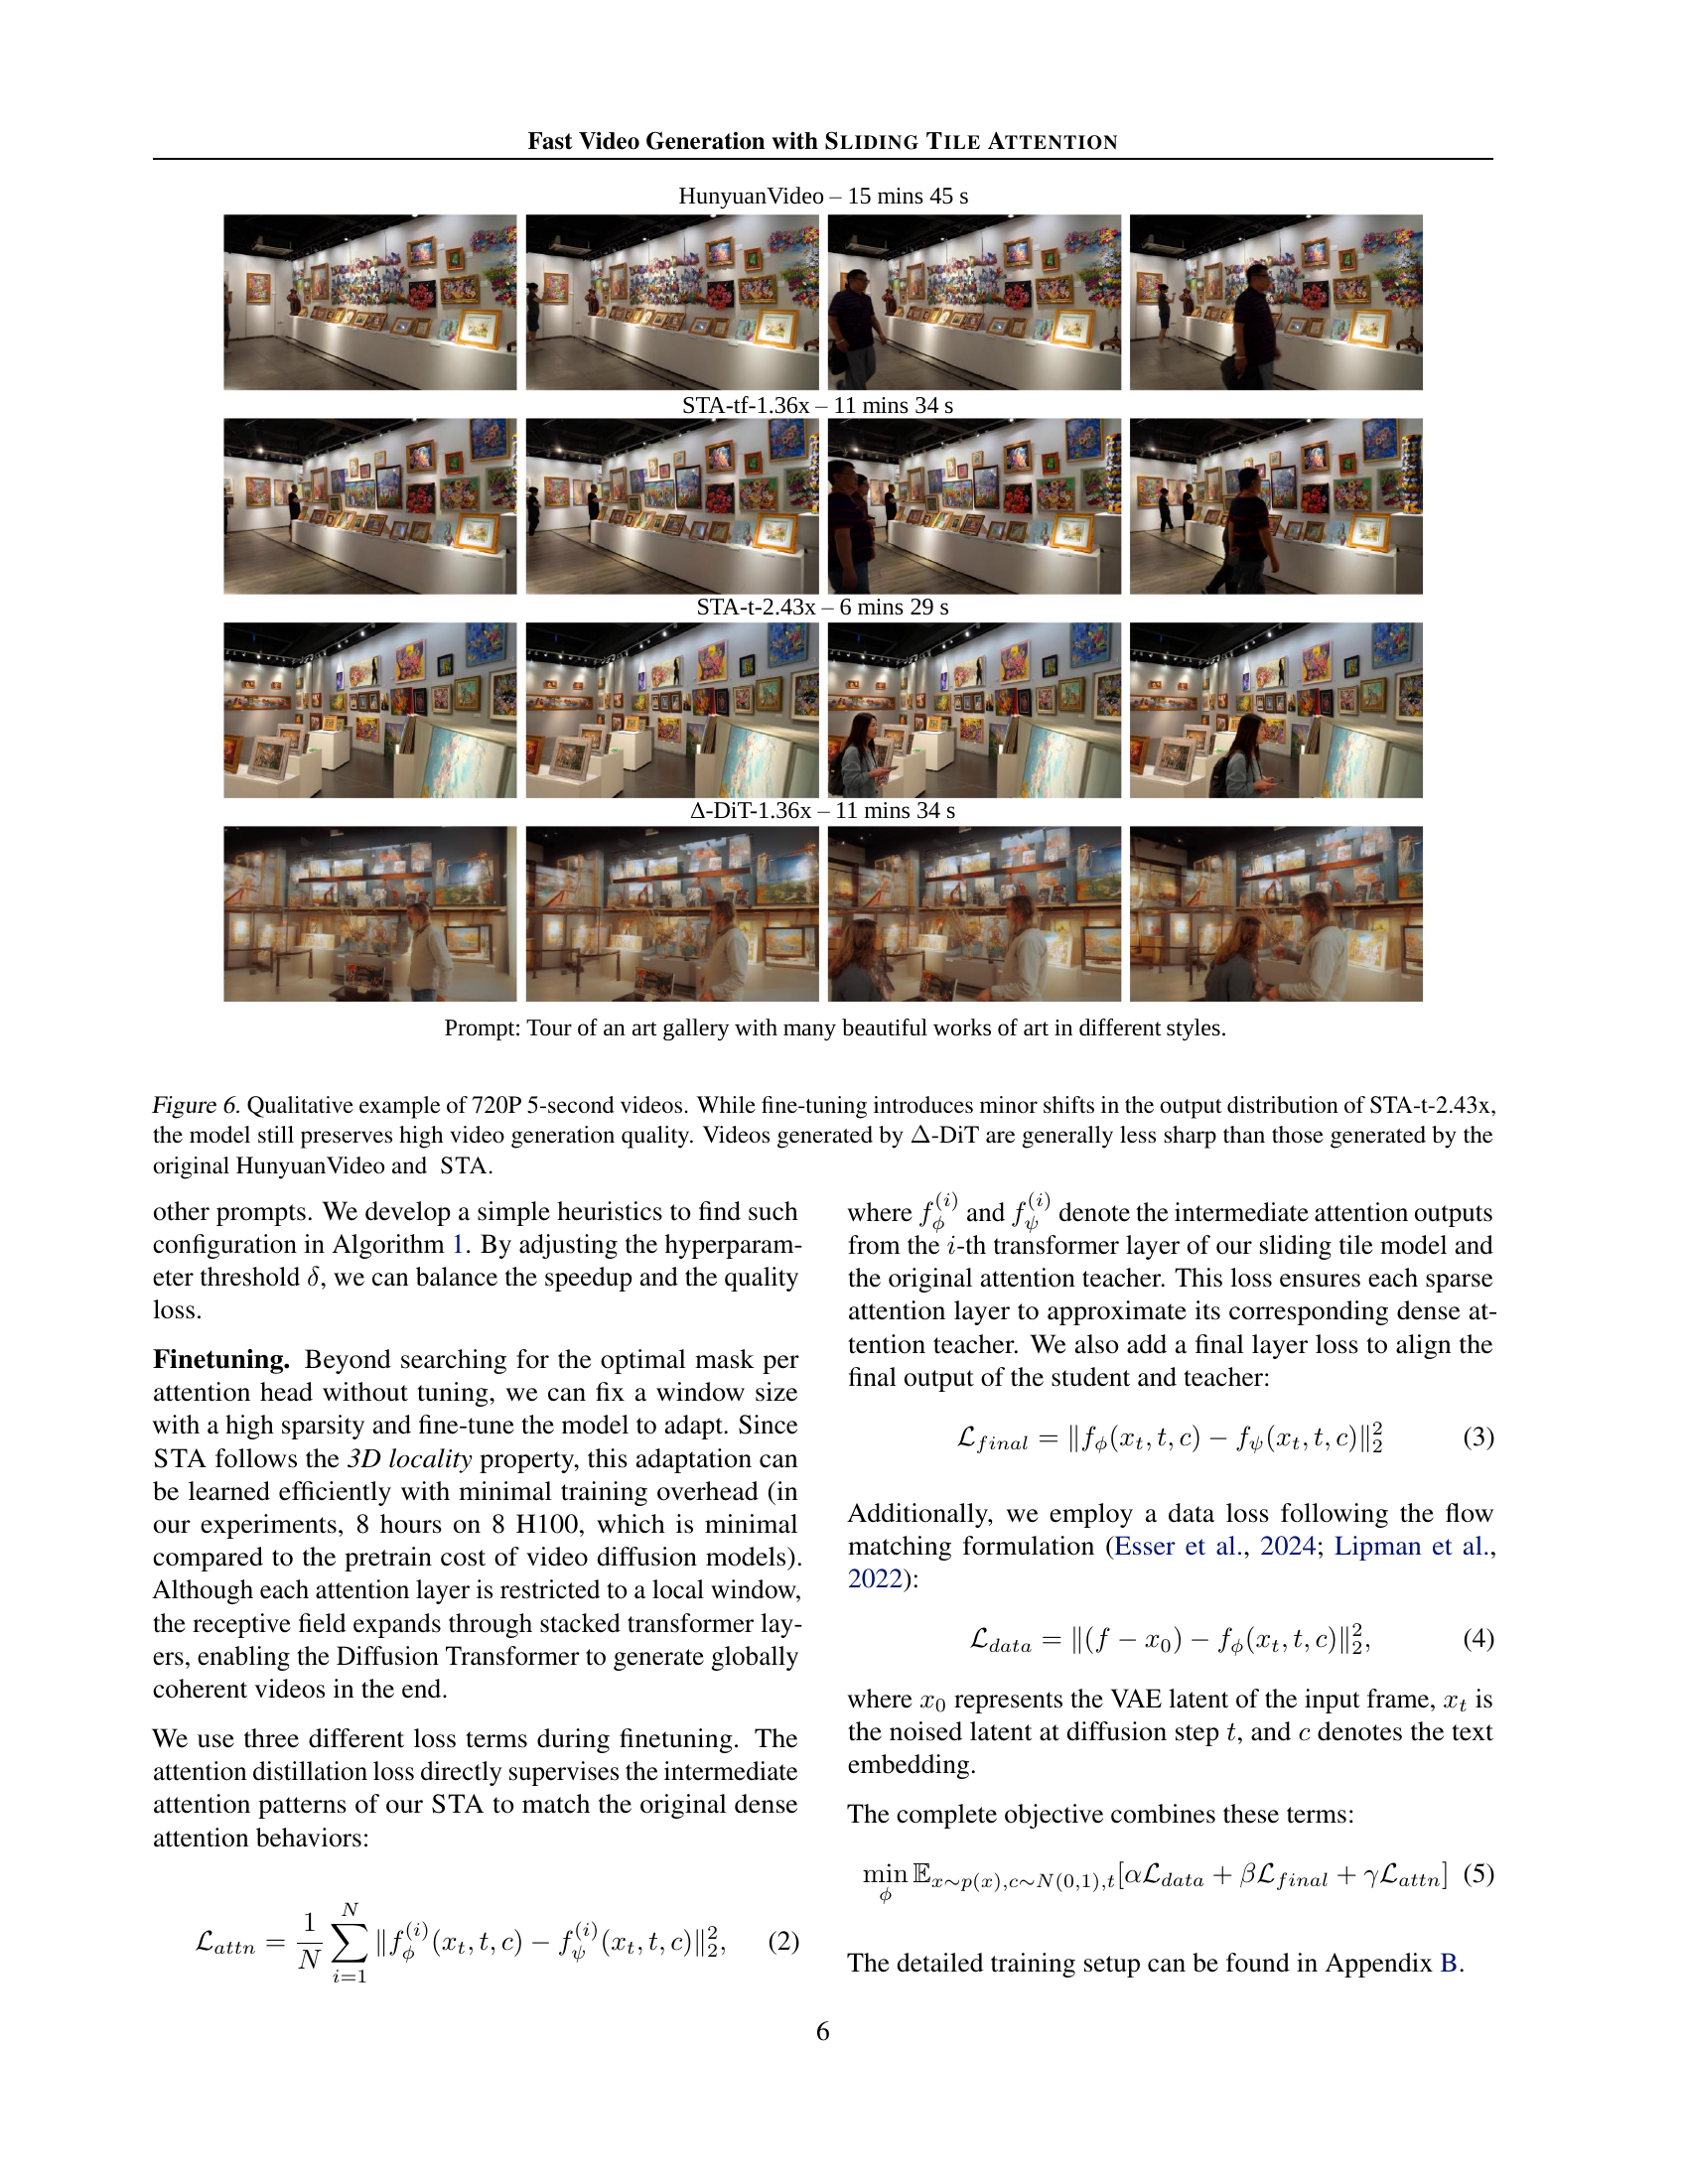
🔼 Figure 6 presents a qualitative comparison of 5-second, 720p videos generated by four different methods: the original HunyuanVideo model, STA without fine-tuning (STA-tf-1.36x), STA with fine-tuning (STA-t-2.43x), and A-DiT. The image showcases that while fine-tuning STA (STA-t-2.43x) leads to subtle changes in the video’s visual style, its overall quality remains high. In contrast, videos generated by A-DiT appear noticeably less sharp than those produced by HunyuanVideo and STA.
read the caption
Figure 6: Qualitative example of 720P 5-second videos. While fine-tuning introduces minor shifts in the output distribution of STA-t-2.43x, the model still preserves high video generation quality. Videos generated by ΔΔ\Deltaroman_Δ-DiT are generally less sharp than those generated by the original HunyuanVideo and STA.

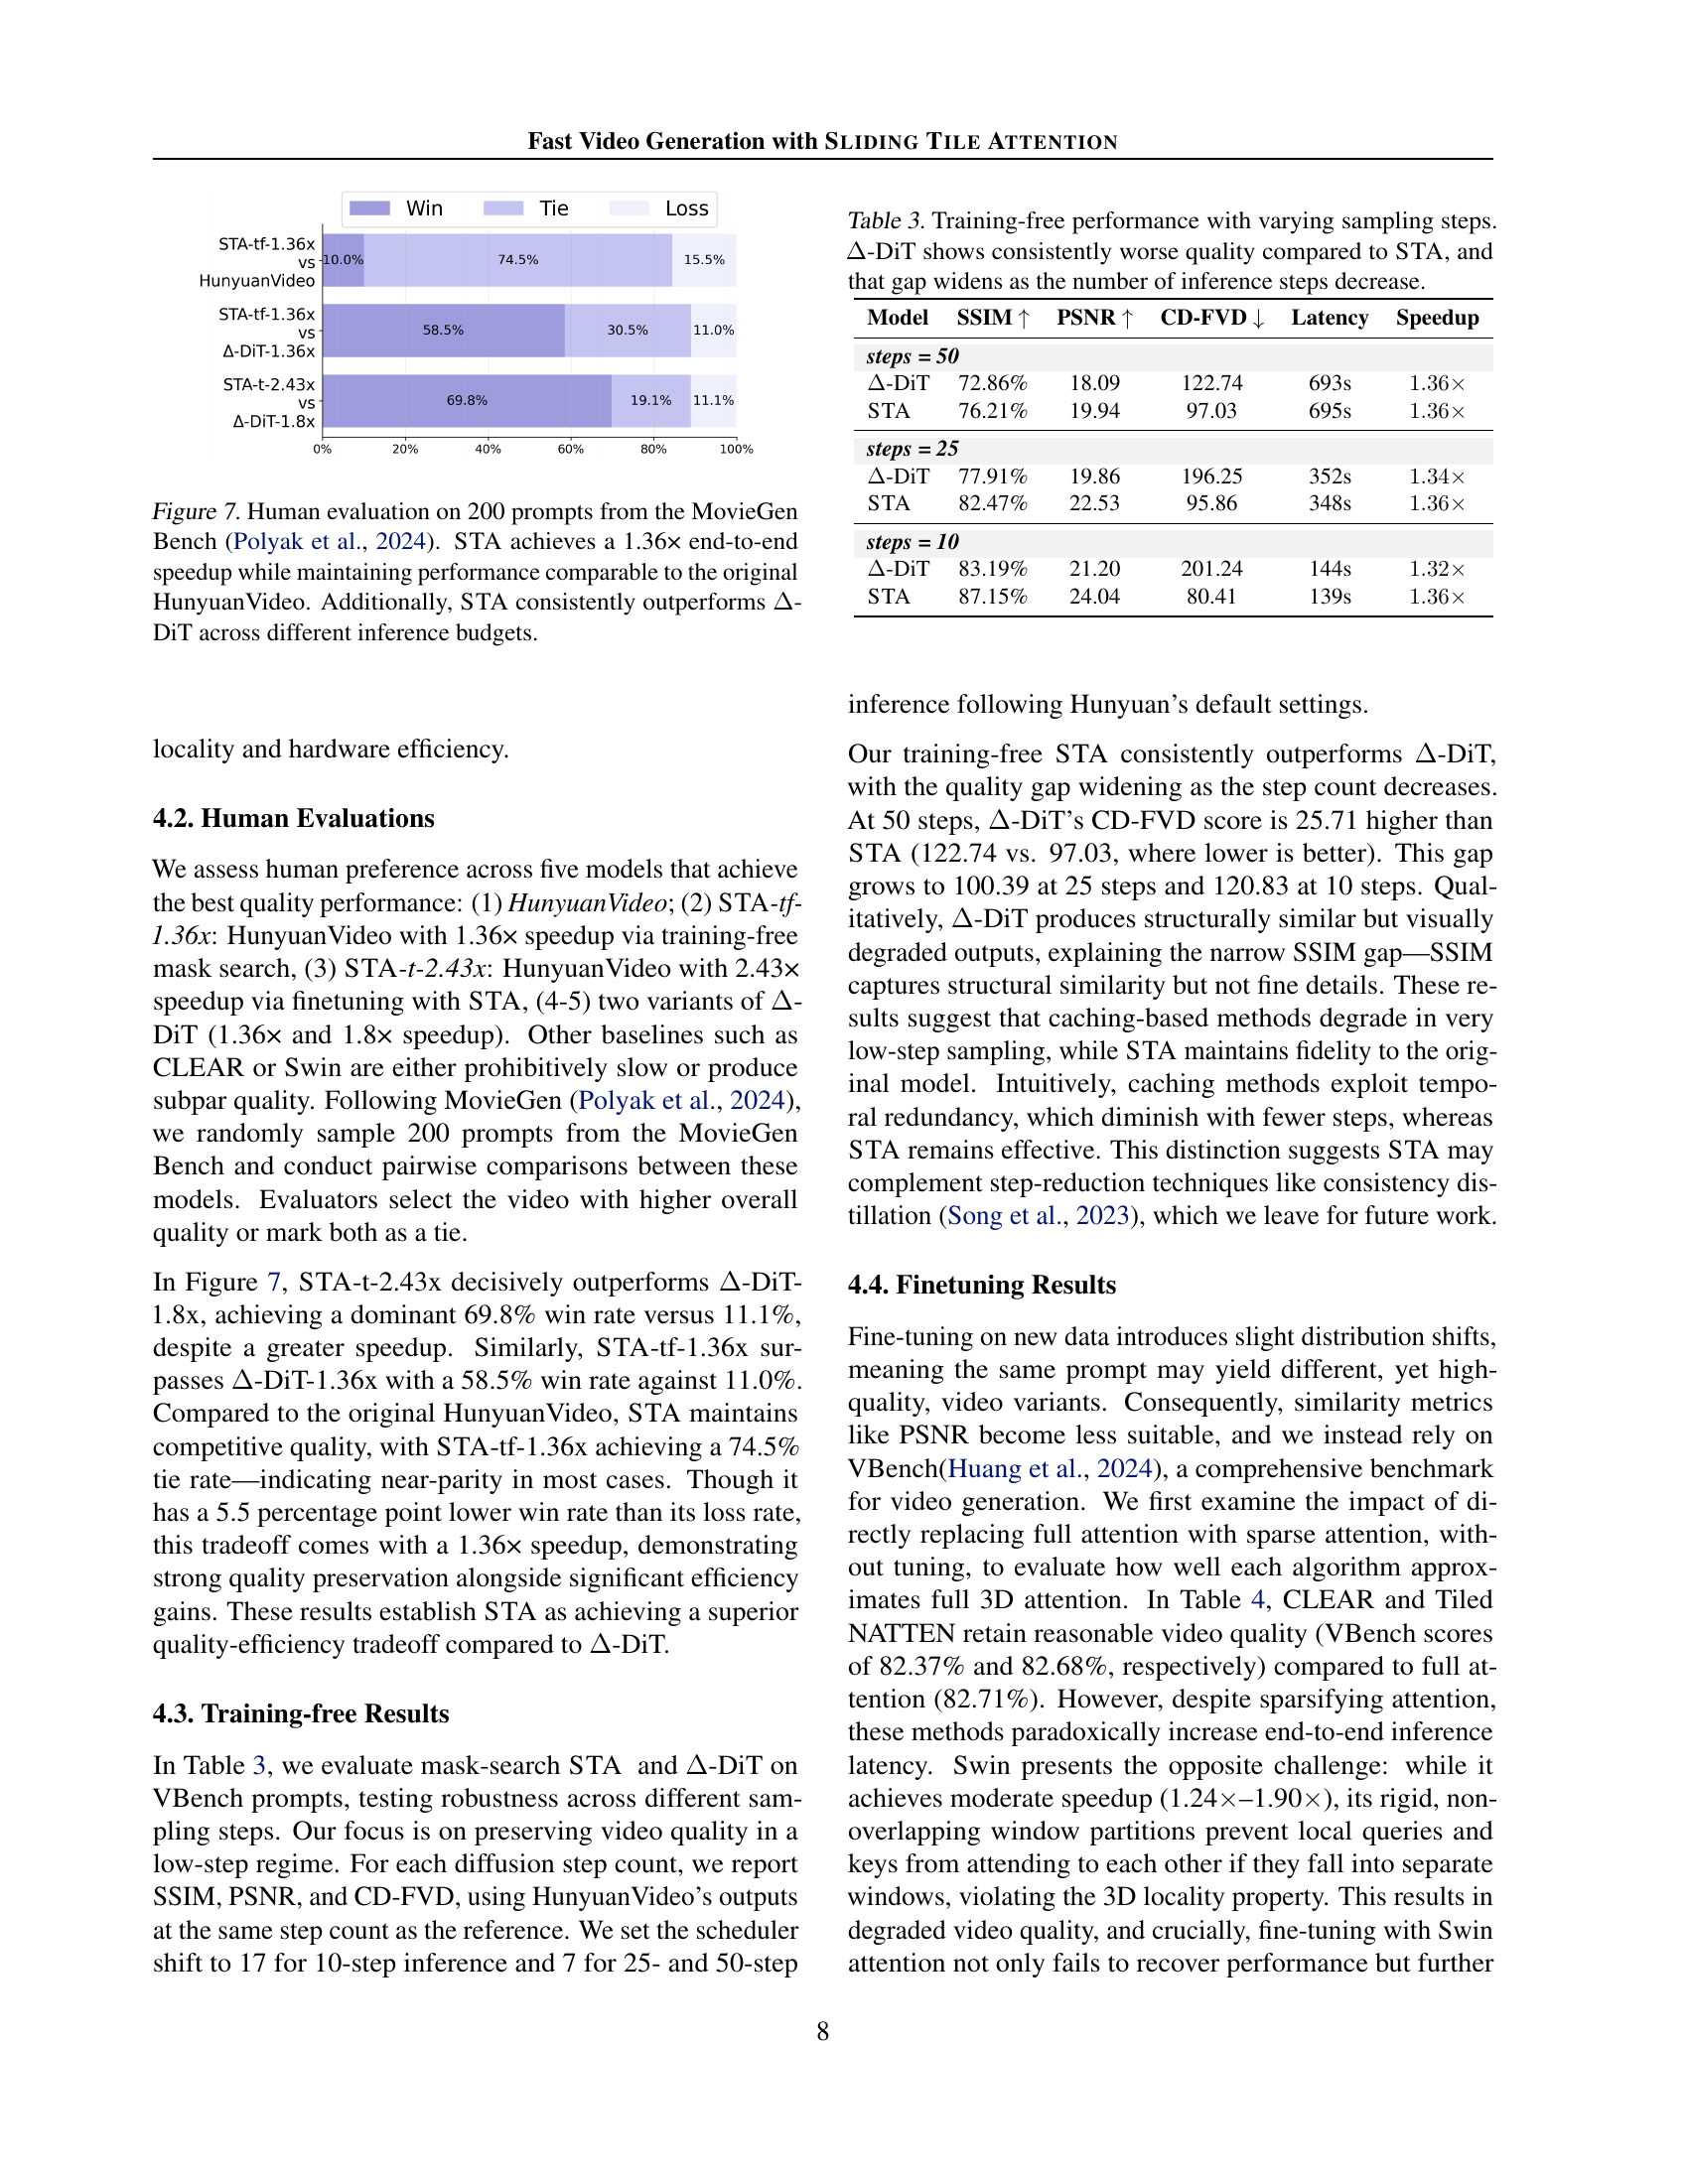
🔼 This figure displays the results of a human evaluation comparing the video generation quality and speed of different models. Specifically, it shows that the proposed SLIDING TILE ATTENTION (STA) method achieves a 1.36x speedup in end-to-end video generation compared to the original HunyuanVideo model while maintaining comparable video quality. Importantly, STA consistently outperforms the A-DiT model across varying inference budgets, demonstrating its superior efficiency and quality in video generation.
read the caption
Figure 7: Human evaluation on 200 prompts from the MovieGen Bench (Polyak et al., 2024). STA achieves a 1.36× end-to-end speedup while maintaining performance comparable to the original HunyuanVideo. Additionally, STA consistently outperforms ΔΔ\Deltaroman_Δ-DiT across different inference budgets.

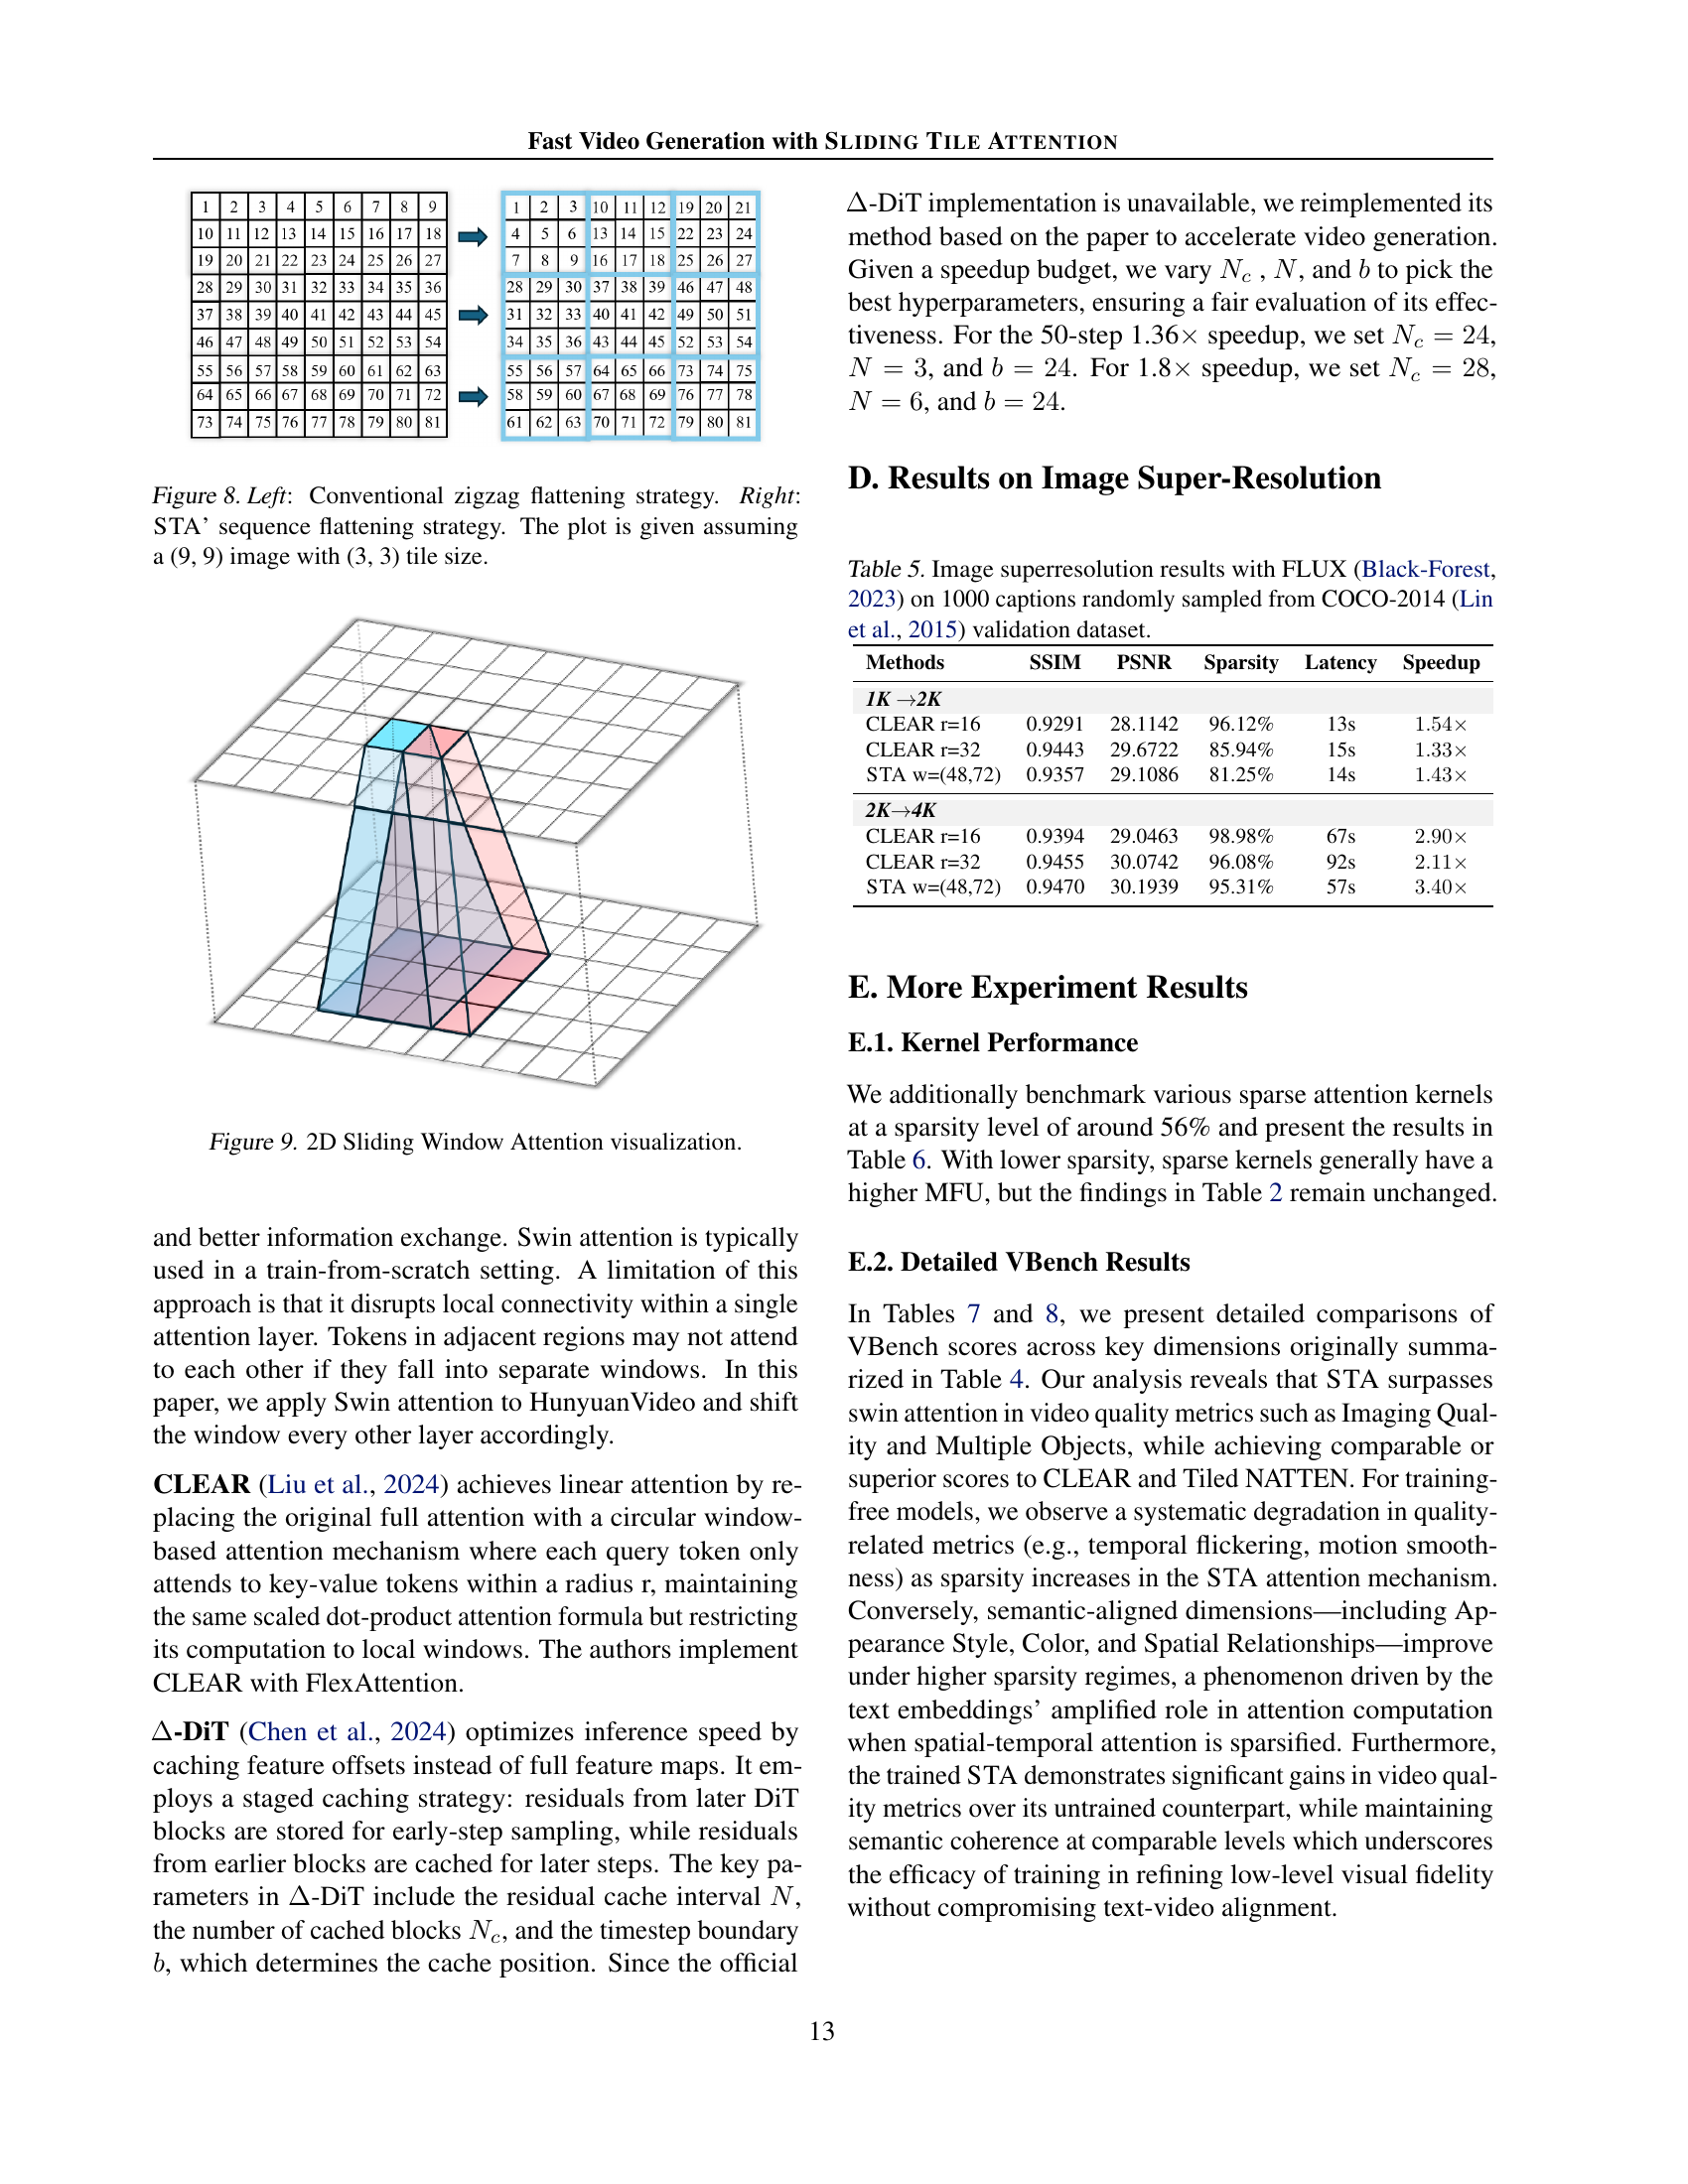
🔼 This figure compares the conventional zigzag flattening method used in processing image data with the SLIDING TILE ATTENTION (STA) method proposed in the paper. The zigzag method flattens a 2D image into a 1D sequence in a non-contiguous manner, which can lead to inefficiencies in processing. In contrast, the STA method groups tokens into tiles (in this example, 3x3 tiles within a larger 9x9 image) before flattening. This tile-based approach maintains spatial locality and improves the efficiency of attention mechanisms by processing contiguous data.
read the caption
Figure 8: Left: Conventional zigzag flattening strategy. Right: STA’ sequence flattening strategy. The plot is given assuming a (9, 9) image with (3, 3) tile size.

🔼 This figure visualizes how the sliding window attention mechanism works in two dimensions. It shows how a query token’s attention is focused on a localized window of key tokens. The window slides across the input, with each position showing the attention weights between the center query token and the surrounding key tokens within the window.
read the caption
Figure 9: 2D Sliding Window Attention visualization.

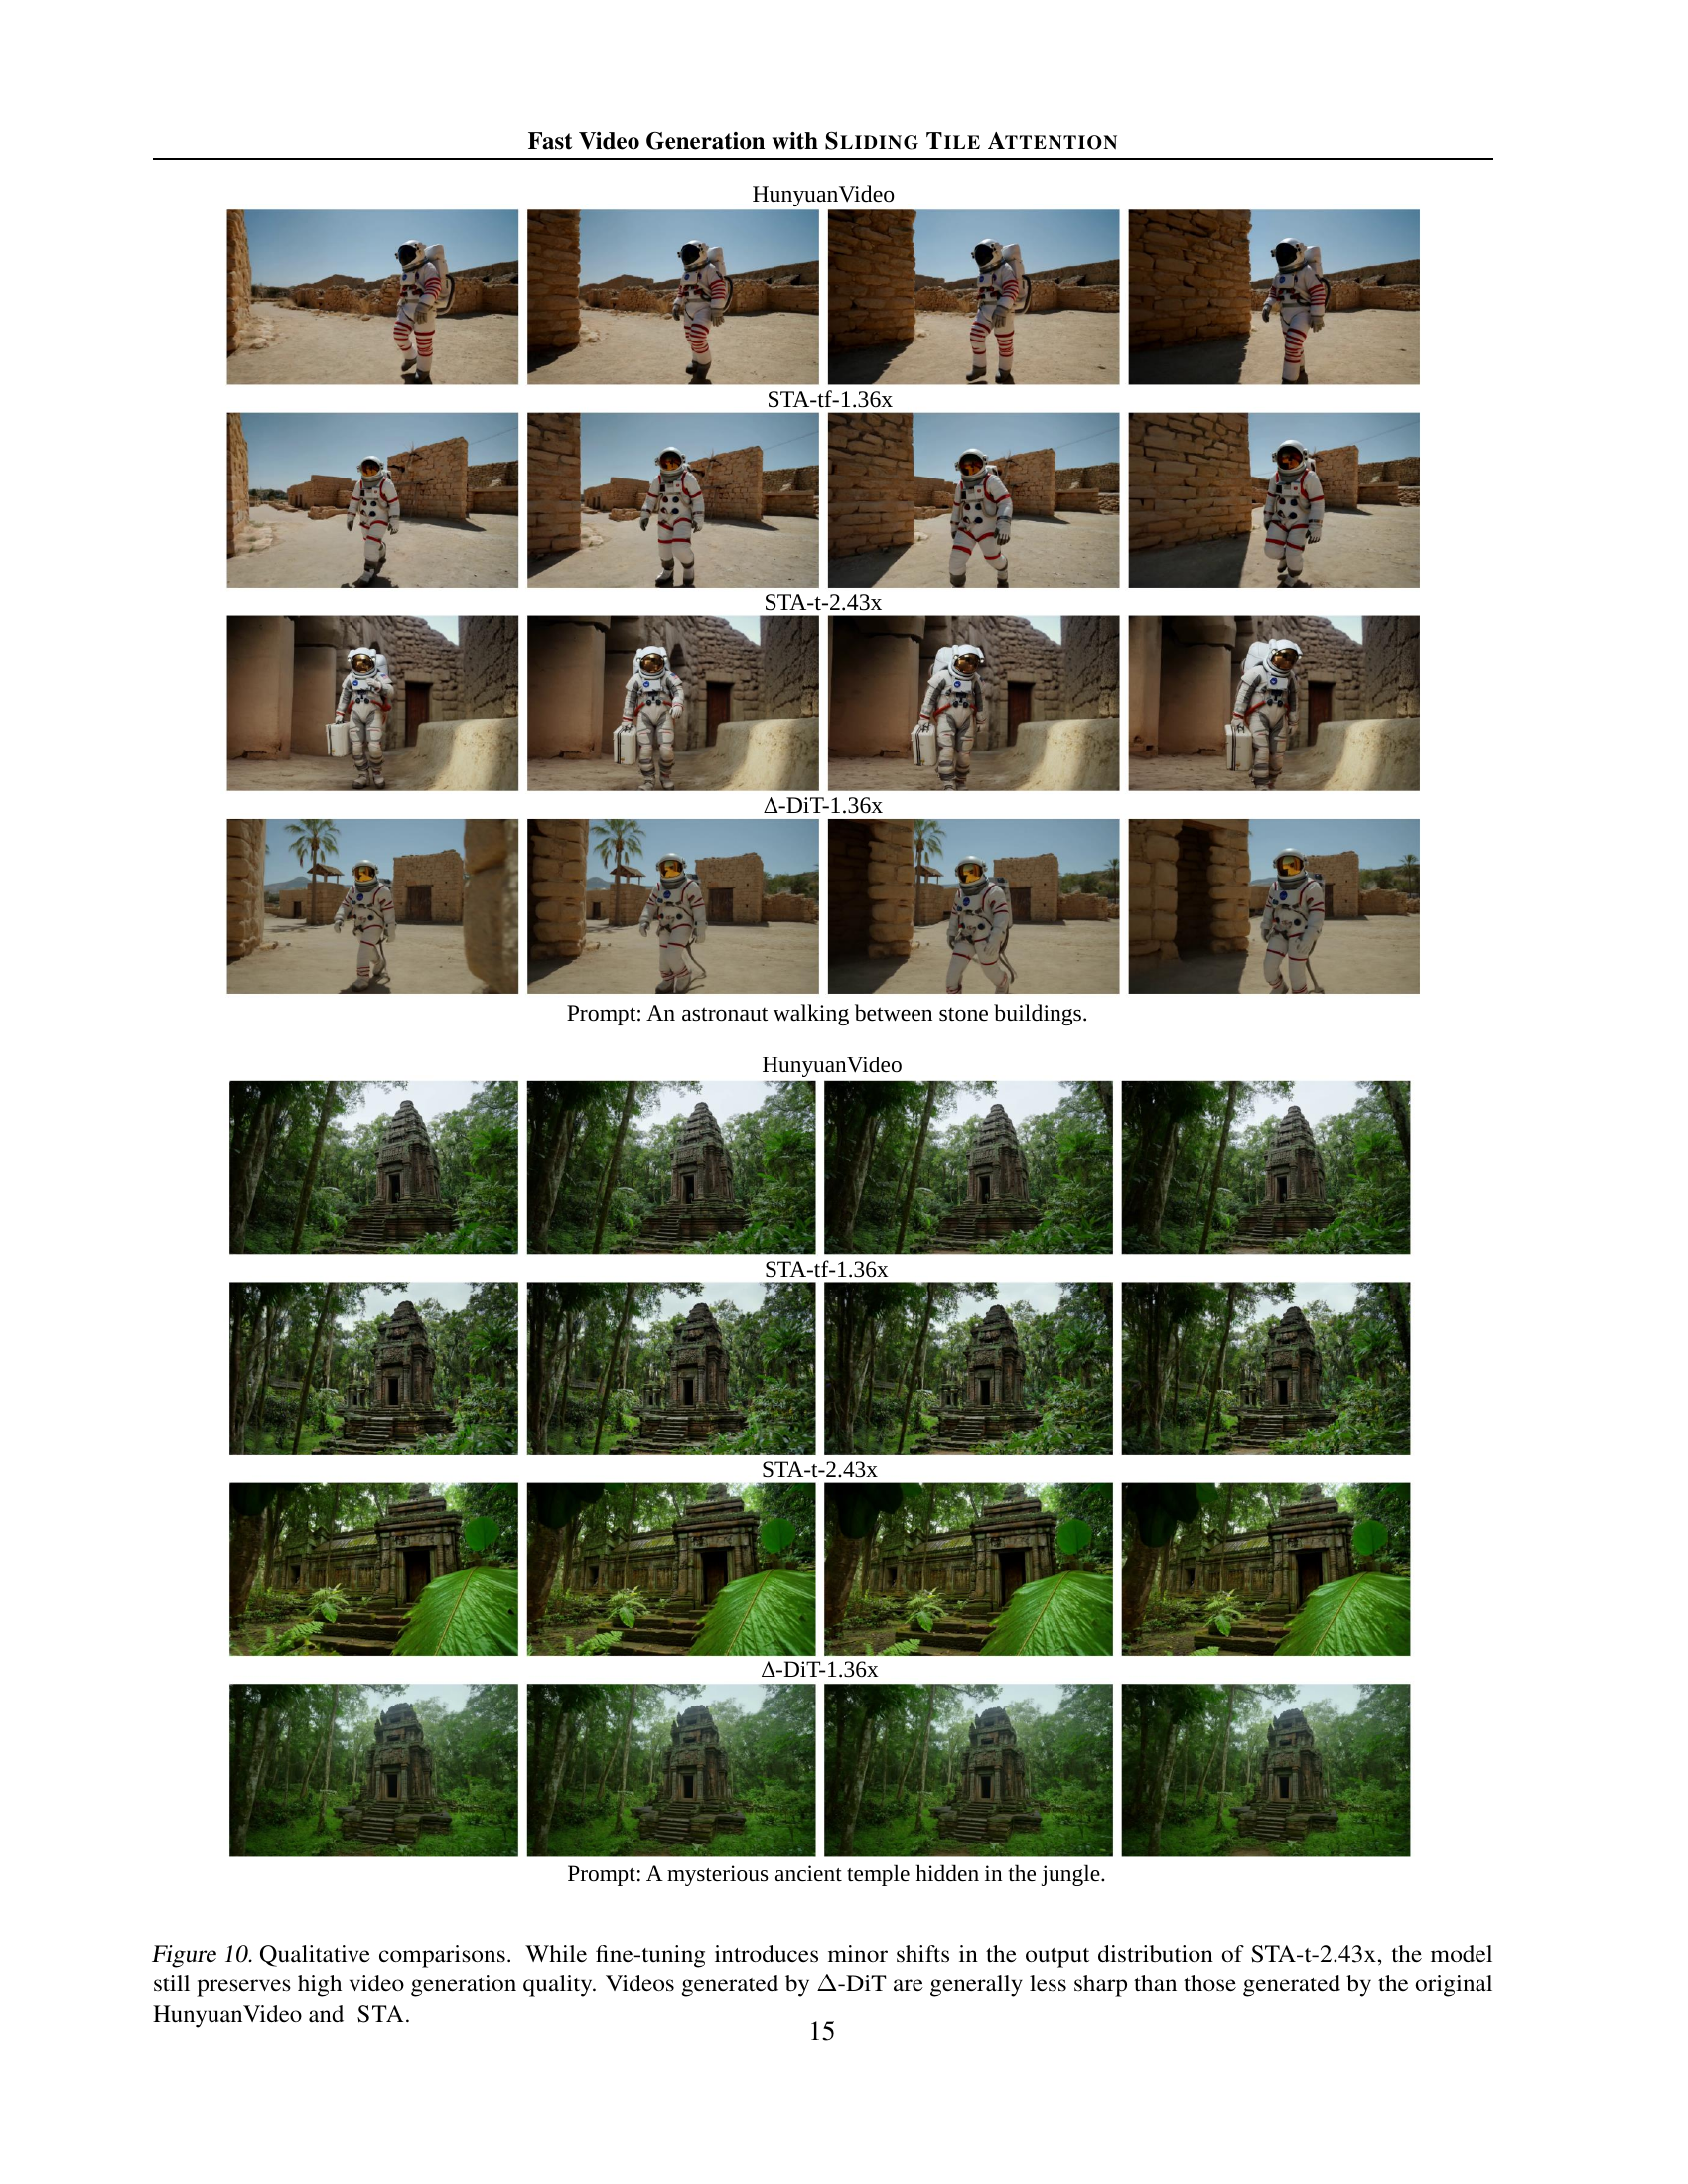
🔼 This figure displays a qualitative comparison of video generation results from four different methods: the original HunyuanVideo model, a version using STA without fine-tuning (STA-tf-1.36x), a version using STA with fine-tuning (STA-t-2.43x), and a method called A-DiT. Two example prompts are used to generate videos, and the resulting videos are shown for each method. The caption highlights that while fine-tuning STA may slightly alter the video distribution, the overall quality remains high. In contrast, videos generated by A-DiT appear less sharp compared to those generated by HunyuanVideo and STA.
read the caption
Figure 10: Qualitative comparisons. While fine-tuning introduces minor shifts in the output distribution of STA-t-2.43x, the model still preserves high video generation quality. Videos generated by ΔΔ\Deltaroman_Δ-DiT are generally less sharp than those generated by the original HunyuanVideo and STA.

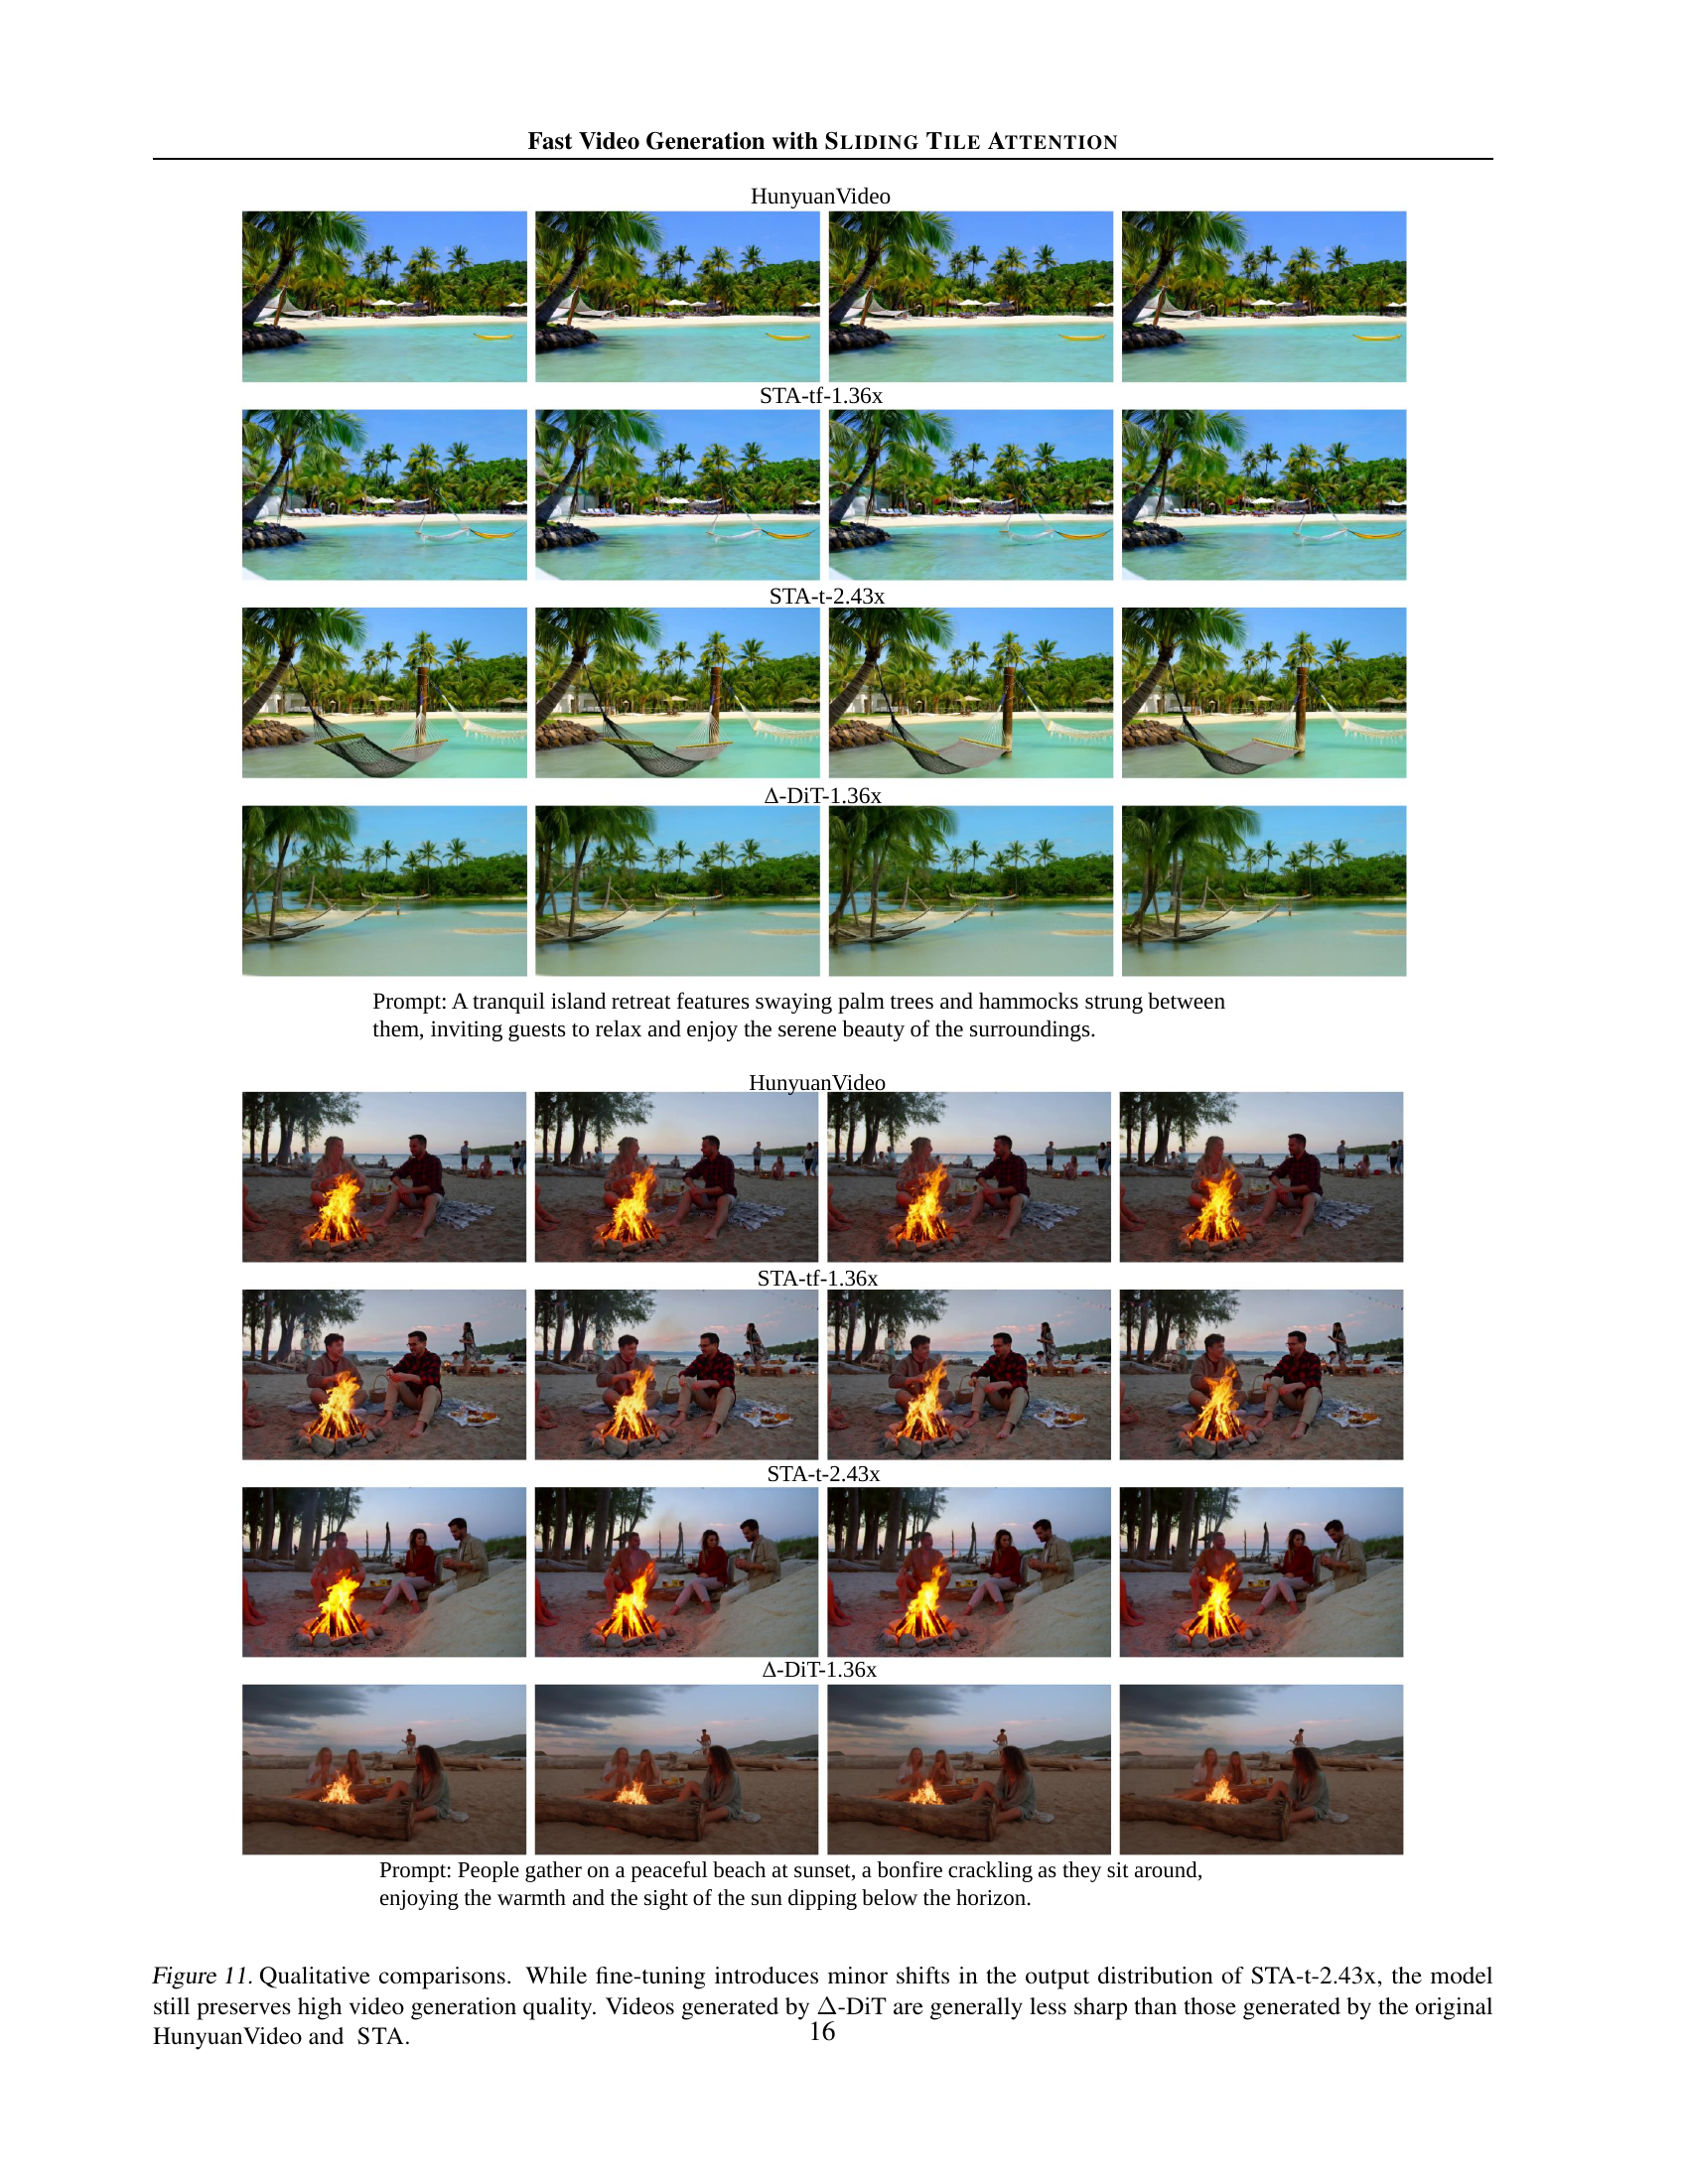
🔼 Figure 11 presents a qualitative comparison of video generation results from four different models: the original HunyuanVideo model, STA with training-free mask search (STA-tf-1.36x), STA with finetuning (STA-t-2.43x), and A-DiT. Two example prompts were used to generate videos. The figure showcases that while fine-tuning STA leads to minor changes in the video distribution (STA-t-2.43x), the overall video quality remains high. In contrast, videos produced by A-DiT exhibit noticeably lower sharpness compared to those generated by HunyuanVideo and STA.
read the caption
Figure 11: Qualitative comparisons. While fine-tuning introduces minor shifts in the output distribution of STA-t-2.43x, the model still preserves high video generation quality. Videos generated by ΔΔ\Deltaroman_Δ-DiT are generally less sharp than those generated by the original HunyuanVideo and STA.
More on tables
| Methods | Implementation | Config | Sparsity | TFLOPS | Latency(ms) | MFU | Kernel Efficiency | Speedup |
| FA 3 | ThunderKittens | - | 0.00% | 164.03 | 265.28 | 62.49% | 100.00% | |
| FA 3 | CUDA | - | 0.00% | 164.03 | 256.59 | 64.61% | 103.39% | |
| CLEAR | FlexAttention | r=16 | 90.46% | 15.65 | 307.44 | 5.15% | 8.24% | |
| NATTEN | FlexAttention | w=(19,25,25) | 89.69% | 16.91 | 313.92 | 5.44% | 8.71% | |
| Tiled NATTEN | CUDA | w=(19,25,25) | 89.69% | 16.91 | 458.36 | 3.73% | 5.97% | |
| Tiled NATTEN | FlexAttention | w=(19,25,25) | 89.69% | 16.91 | 208.36 | 8.20% | 13.12% | |
| Swin | FlexAttention | w=(24,32,32) | 87.42% | 20.64 | 47.90 | 43.55% | 69.69% | |
| STA | FlexAttention | w=(18,24,24) | 91.00% | 14.76 | 36.36 | 41.03% | 65.66% | |
| STA | ThunderKittens | w=(30,40,40) | 58.33% | 68.35 | 111.73 | 61.82% | 98.93% | |
| STA | ThunderKittens | w=(18,24,24) | 91.00% | 14.76 | 25.38 | 58.79% | 94.09% |
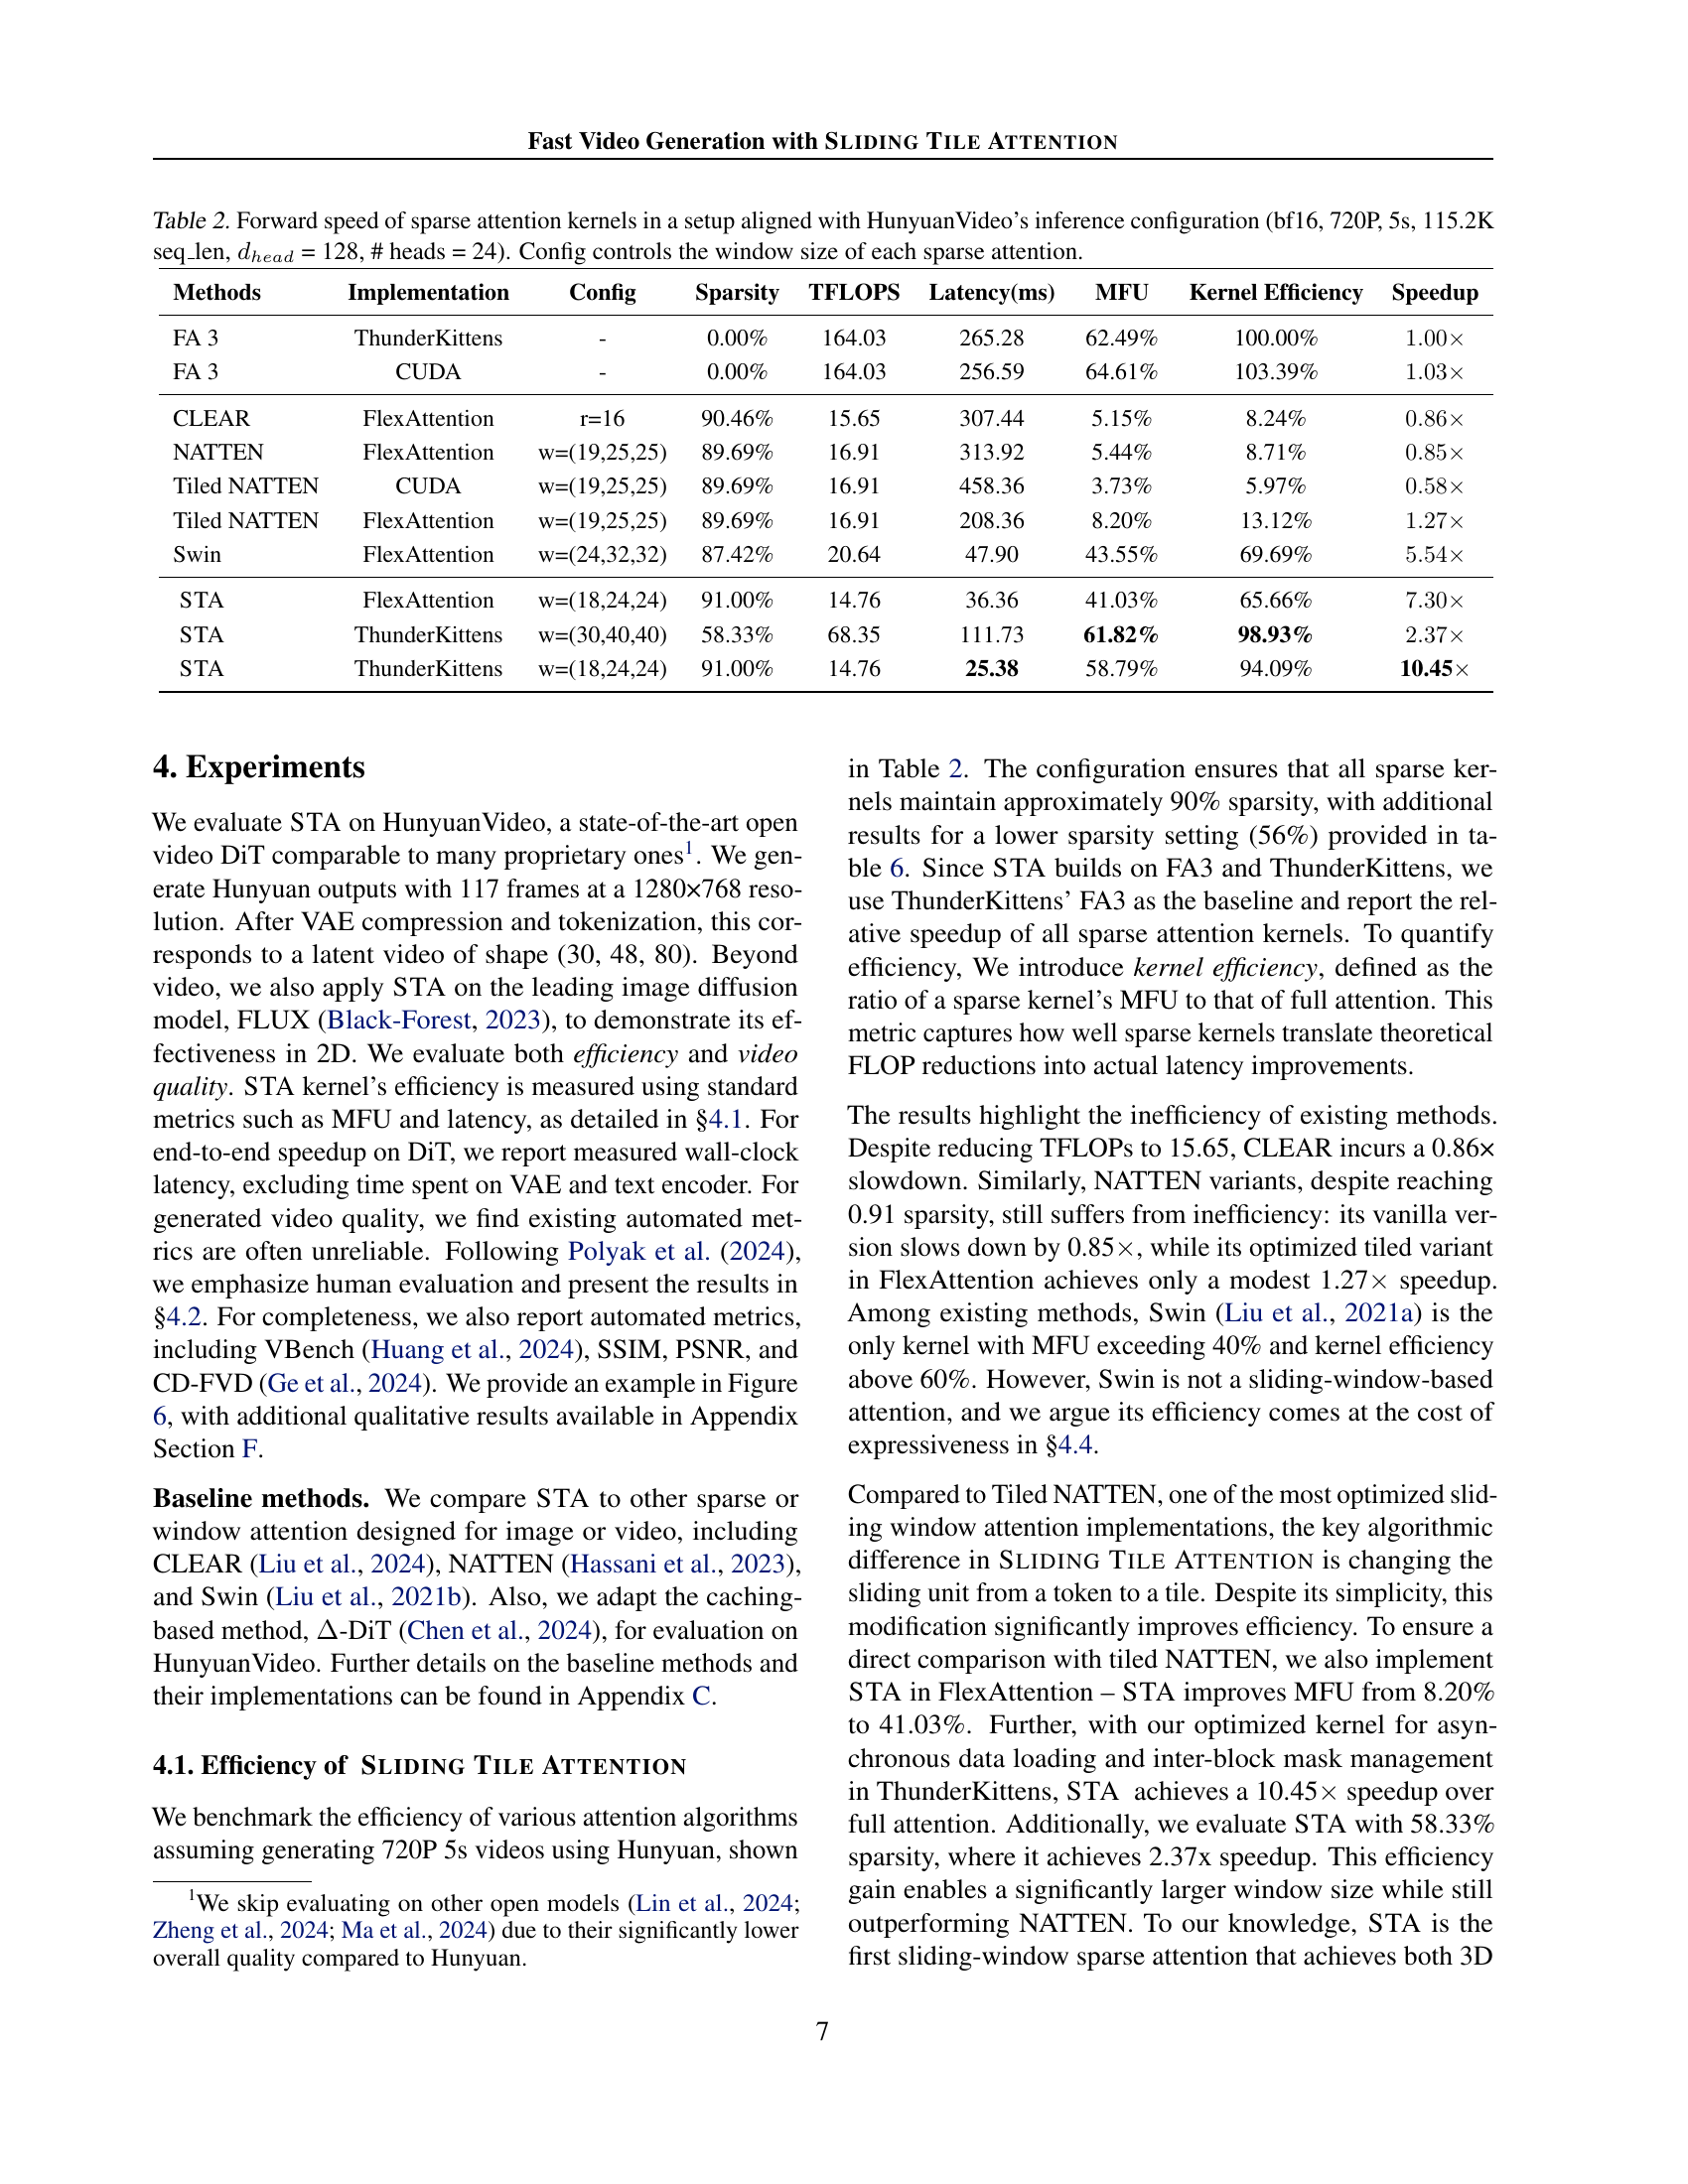
🔼 This table presents a comparison of the forward pass speed of various sparse attention mechanisms, including FlashAttention-3 (FA3), CLEAR, NATTEN, Tiled NATTEN, Swin Transformer, and the proposed SLIDING TILE ATTENTION (STA). The comparison is performed under the same configuration used for HunyuanVideo inference: bf16 precision, 720p video resolution, 5-second video duration, 115,200 sequence length, 128 hidden dimensions per head, and 24 attention heads. The table shows the sparsity achieved by each method, the theoretical FLOPS (TFLOPS), latency in milliseconds, memory access efficiency (MFU), kernel efficiency, and relative speedup compared to FA3. The ‘Config’ column indicates the window size parameter for each sparse attention method, highlighting the impact of this parameter on performance.
read the caption
Table 2: Forward speed of sparse attention kernels in a setup aligned with HunyuanVideo’s inference configuration (bf16, 720P, 5s, 115.2K seq_len, dheadsubscript𝑑ℎ𝑒𝑎𝑑d_{head}italic_d start_POSTSUBSCRIPT italic_h italic_e italic_a italic_d end_POSTSUBSCRIPT = 128, # heads = 24). Config controls the window size of each sparse attention.
| Model | SSIM | PSNR | CD-FVD | Latency | Speedup |
| steps = 50 | |||||
| -DiT | 72.86% | 18.09 | 122.74 | 693s | |
| STA | 76.21% | 19.94 | 97.03 | 695s | |
| steps = 25 | |||||
| -DiT | 77.91% | 19.86 | 196.25 | 352s | |
| STA | 82.47% | 22.53 | 95.86 | 348s | |
| steps = 10 | |||||
| -DiT | 83.19% | 21.20 | 201.24 | 144s | |
| STA | 87.15% | 24.04 | 80.41 | 139s | |
🔼 This table presents a comparison of video generation quality and efficiency across different models with varying numbers of sampling steps. The models compared are ΔΔ Δ-DiT and STA (Sliding Tile Attention), both using a training-free approach. The evaluation metrics include SSIM, PSNR, and CD-FVD, which are standard measures of video quality. Additionally, the table shows the inference latency and speedup achieved by each model relative to a baseline. The results demonstrate that STA consistently outperforms ΔΔ Δ-DiT in terms of quality, and this difference becomes more pronounced as the number of sampling steps decreases. This highlights the robustness and efficiency of STA for video generation.
read the caption
Table 3: Training-free performance with varying sampling steps. ΔΔ\Deltaroman_Δ-DiT shows consistently worse quality compared to STA, and that gap widens as the number of inference steps decrease.
| Methods | Config | VBench Quality | VBench Semantic | VBench Total | Attn Sparsity | PFLOPS | Latency | Speedup |
| FA2 | – | 85.34% | 72.17% | 82.71% | 0.00% | 574.16 | 1496s | 0.63 |
| FA3 | – | 85.34% | 72.17% | 82.71% | 0.00% | 574.16 | 945s | 1.00 |
| w.o training | ||||||||
| CLEAR | r=32 | 84.41% | 74.20% | 82.37% | 56.23% | 280.90 | 2567s | 0.37 |
| Tiled NATTEN | w=(30,41,41) | 84.61% | 75.00% | 82.69% | 58.33% | 269.92 | 1858s | 0.51 |
| Swin | w=(48,64,64) | 80.91% | 71.35% | 79.00% | 55.81% | 283.11 | 762s | 1.24 |
| Swin | w=(30,40,40) | 78.84% | 72.28% | 77.53% | 76.49% | 175.20 | 497s | 1.90 |
| STA | w=(30,40,40) | 84.63% | 73.83% | 82.46% | 58.33% | 269.92 | 527s | 1.79 |
| STA | w=(18,24,24) | 81.47% | 77.03% | 80.58% | 91.00% | 99.54 | 268s | 3.53 |
| w. training | ||||||||
| Swin | w=(30,40,40) | 77.50% | 67.39% | 75.48% | 55.81% | 283.08 | 497s | 1.90 |
| STA | w=(30,24,40) | 85.37% | 73.52% | 83.00% | 75.00% | 182.99 | 388s | 2.44 |
| STA | w=(18,24,24) | 84.76% | 74.05% | 82.62% | 91.00% | 99.54 | 268s | 3.53 |
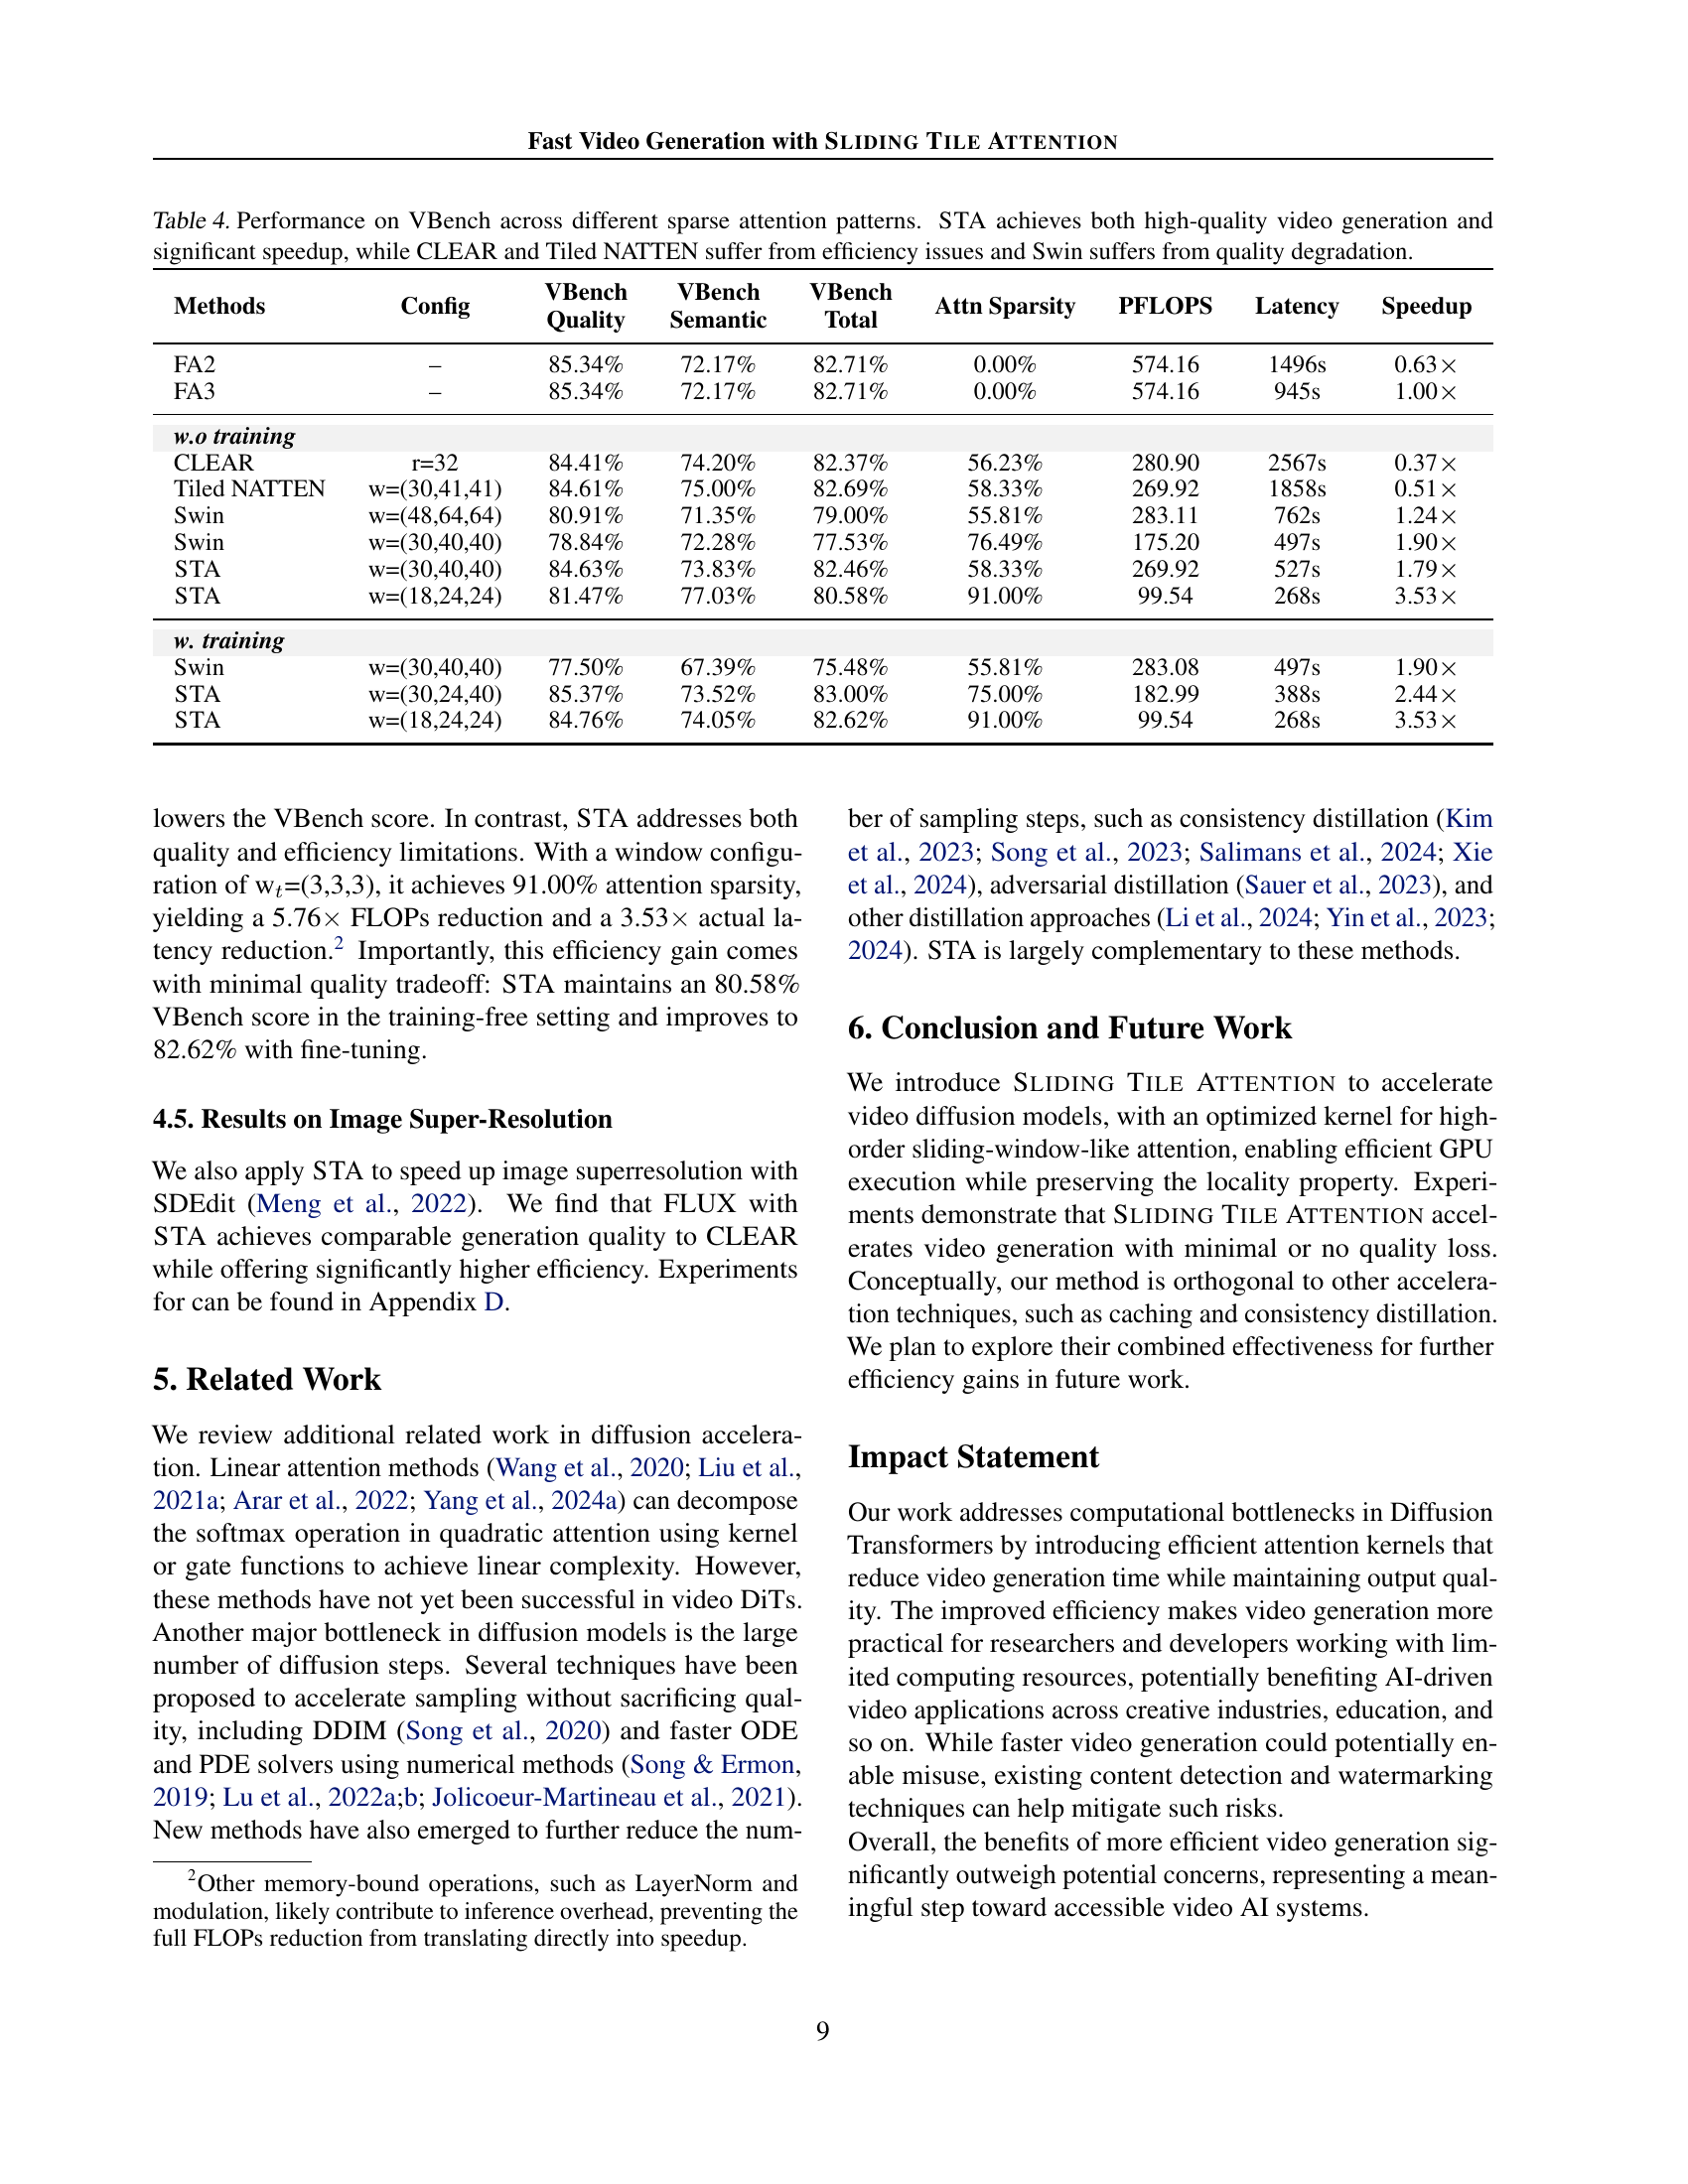
🔼 This table presents a comparison of different sparse attention mechanisms on the video generation quality and efficiency using VBench. It shows that SLIDING TILE ATTENTION (STA) achieves both high-quality video generation and significant speedup compared to other methods. The other methods, CLEAR and Tiled NATTEN, suffer from efficiency issues (they are slower than expected despite reducing computation), while Swin Transformer suffers from a degradation in video quality. The results highlight STA’s superior performance.
read the caption
Table 4: Performance on VBench across different sparse attention patterns. STA achieves both high-quality video generation and significant speedup, while CLEAR and Tiled NATTEN suffer from efficiency issues and Swin suffers from quality degradation.
| Methods | SSIM | PSNR | Sparsity | Latency | Speedup |
| 1K 2K | |||||
| CLEAR r=16 | 0.9291 | 28.1142 | 96.12% | 13s | |
| CLEAR r=32 | 0.9443 | 29.6722 | 85.94% | 15s | |
| STA w=(48,72) | 0.9357 | 29.1086 | 81.25% | 14s | |
| 2K4K | |||||
| CLEAR r=16 | 0.9394 | 29.0463 | 98.98% | 67s | |
| CLEAR r=32 | 0.9455 | 30.0742 | 96.08% | 92s | |
| STA w=(48,72) | 0.9470 | 30.1939 | 95.31% | 57s | |
🔼 This table presents the results of image super-resolution experiments conducted using the FLUX model. The experiments involved upscaling images from 1000 randomly selected captions from the COCO-2014 validation dataset. The table shows the performance of different methods (CLEAR with different radius values and STA with a specific window size) in terms of SSIM, PSNR, sparsity, latency, and speedup compared to a baseline. The results highlight the trade-off between speed and quality.
read the caption
Table 5: Image superresolution results with FLUX (Black-Forest, 2023) on 1000 captions randomly sampled from COCO-2014 (Lin et al., 2015) validation dataset.
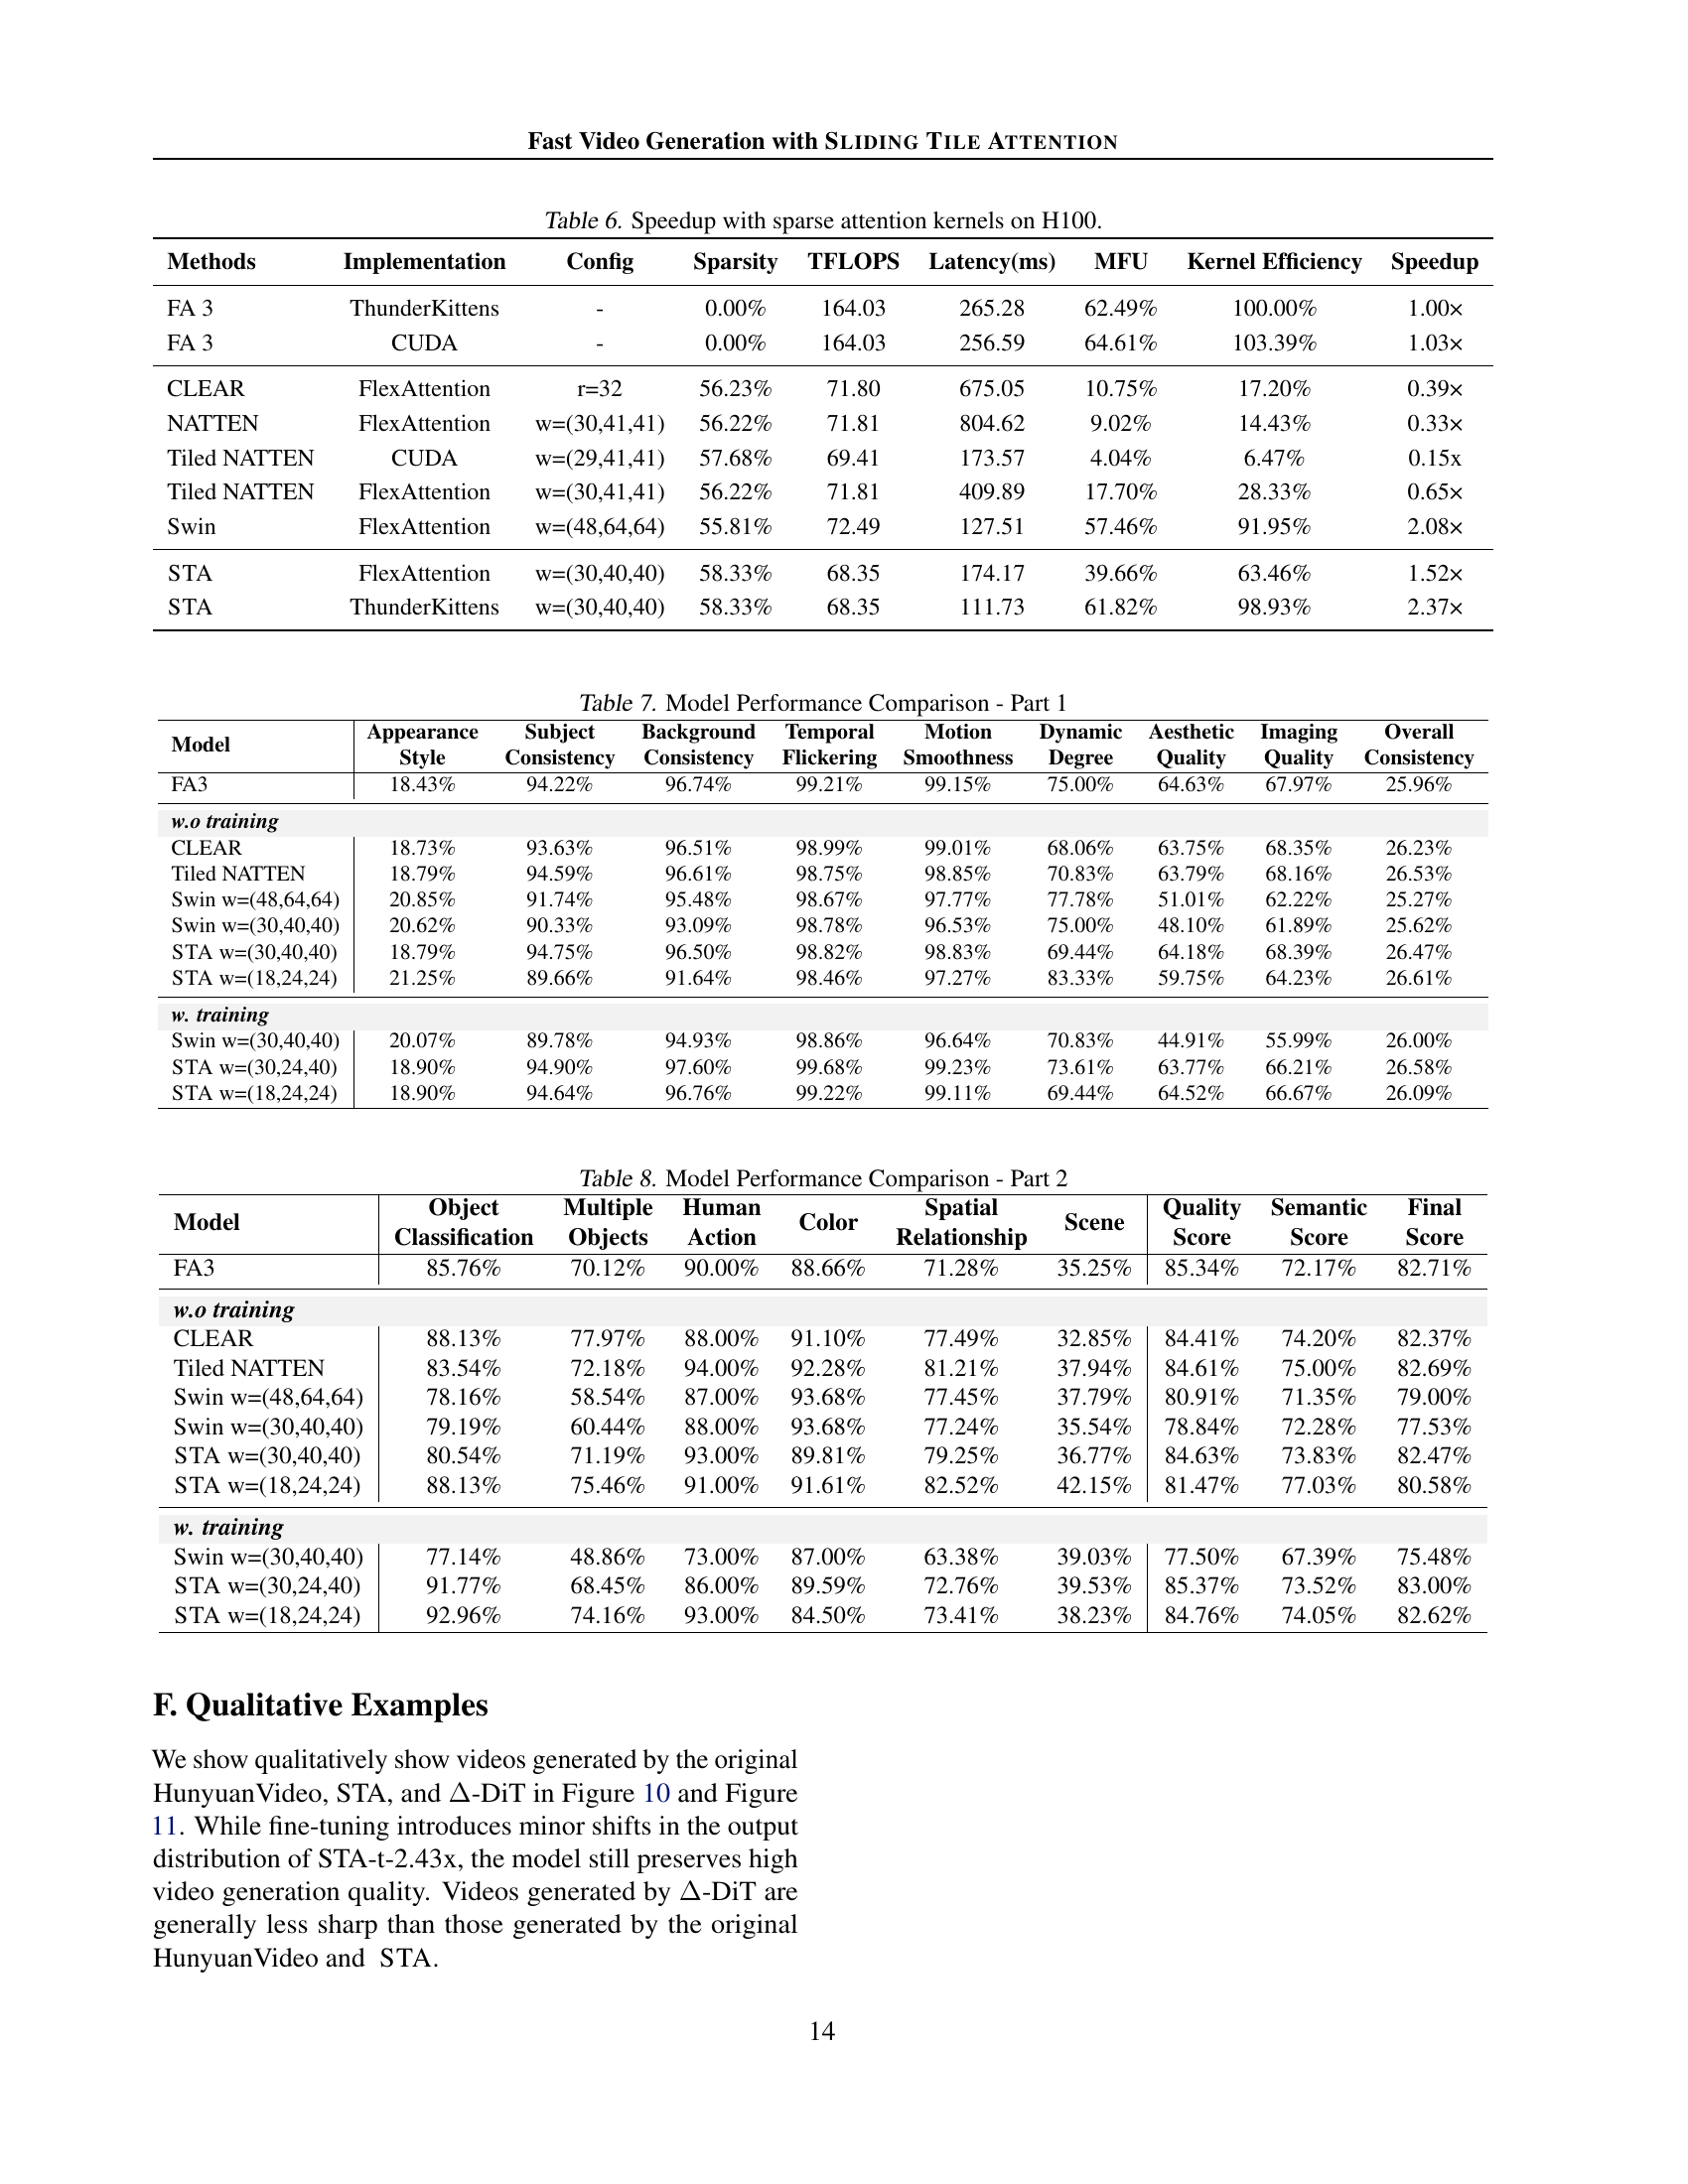
| Methods | Implementation | Config | Sparsity | TFLOPS | Latency(ms) | MFU | Kernel Efficiency | Speedup |
| FA 3 | ThunderKittens | - | 0.00% | 164.03 | 265.28 | 62.49% | 100.00% | 1.00× |
| FA 3 | CUDA | - | 0.00% | 164.03 | 256.59 | 64.61% | 103.39% | 1.03× |
| CLEAR | FlexAttention | r=32 | 56.23% | 71.80 | 675.05 | 10.75% | 17.20% | 0.39× |
| NATTEN | FlexAttention | w=(30,41,41) | 56.22% | 71.81 | 804.62 | 9.02% | 14.43% | 0.33× |
| Tiled NATTEN | CUDA | w=(29,41,41) | 57.68% | 69.41 | 173.57 | 4.04% | 6.47% | 0.15x |
| Tiled NATTEN | FlexAttention | w=(30,41,41) | 56.22% | 71.81 | 409.89 | 17.70% | 28.33% | 0.65× |
| Swin | FlexAttention | w=(48,64,64) | 55.81% | 72.49 | 127.51 | 57.46% | 91.95% | 2.08× |
| STA | FlexAttention | w=(30,40,40) | 58.33% | 68.35 | 174.17 | 39.66% | 63.46% | 1.52× |
| STA | ThunderKittens | w=(30,40,40) | 58.33% | 68.35 | 111.73 | 61.82% | 98.93% | 2.37× |
🔼 This table presents the speedup achieved by different sparse attention kernels on an H100 GPU. It compares the performance of several methods, including FlashAttention-3 (FA3), CLEAR, NATTEN, Swin Transformer, and the proposed SLIDING TILE ATTENTION (STA), across various configurations and sparsity levels. The comparison focuses on kernel efficiency (measured as Memory-Flops Utilization, or MFU) and latency, providing a comprehensive evaluation of different sparse attention mechanisms.
read the caption
Table 6: Speedup with sparse attention kernels on H100.
| Model | Appearance Style | Subject Consistency | Background Consistency | Temporal Flickering | Motion Smoothness | Dynamic Degree | Aesthetic Quality | Imaging Quality | Overall Consistency |
| FA3 | 18.43% | 94.22% | 96.74% | 99.21% | 99.15% | 75.00% | 64.63% | 67.97% | 25.96% |
| w.o training | |||||||||
| CLEAR | 18.73% | 93.63% | 96.51% | 98.99% | 99.01% | 68.06% | 63.75% | 68.35% | 26.23% |
| Tiled NATTEN | 18.79% | 94.59% | 96.61% | 98.75% | 98.85% | 70.83% | 63.79% | 68.16% | 26.53% |
| Swin w=(48,64,64) | 20.85% | 91.74% | 95.48% | 98.67% | 97.77% | 77.78% | 51.01% | 62.22% | 25.27% |
| Swin w=(30,40,40) | 20.62% | 90.33% | 93.09% | 98.78% | 96.53% | 75.00% | 48.10% | 61.89% | 25.62% |
| STA w=(30,40,40) | 18.79% | 94.75% | 96.50% | 98.82% | 98.83% | 69.44% | 64.18% | 68.39% | 26.47% |
| STA w=(18,24,24) | 21.25% | 89.66% | 91.64% | 98.46% | 97.27% | 83.33% | 59.75% | 64.23% | 26.61% |
| w. training | |||||||||
| Swin w=(30,40,40) | 20.07% | 89.78% | 94.93% | 98.86% | 96.64% | 70.83% | 44.91% | 55.99% | 26.00% |
| STA w=(30,24,40) | 18.90% | 94.90% | 97.60% | 99.68% | 99.23% | 73.61% | 63.77% | 66.21% | 26.58% |
| STA w=(18,24,24) | 18.90% | 94.64% | 96.76% | 99.22% | 99.11% | 69.44% | 64.52% | 66.67% | 26.09% |
🔼 This table presents a detailed quantitative comparison of different video generation models across various aspects of video quality. The models are evaluated on several key dimensions, including the appearance style consistency, temporal motion consistency, dynamic consistency, aesthetic quality, overall video quality, and overall scene consistency. These are compared between the models using various metrics, allowing for a nuanced understanding of the relative strengths and weaknesses of each model regarding different aspects of video generation.
read the caption
Table 7: Model Performance Comparison - Part 1
| Model | Object Classification | Multiple Objects | Human Action | Color | Spatial Relationship | Scene | Quality Score | Semantic Score | Final Score |
| FA3 | 85.76% | 70.12% | 90.00% | 88.66% | 71.28% | 35.25% | 85.34% | 72.17% | 82.71% |
| w.o training | |||||||||
| CLEAR | 88.13% | 77.97% | 88.00% | 91.10% | 77.49% | 32.85% | 84.41% | 74.20% | 82.37% |
| Tiled NATTEN | 83.54% | 72.18% | 94.00% | 92.28% | 81.21% | 37.94% | 84.61% | 75.00% | 82.69% |
| Swin w=(48,64,64) | 78.16% | 58.54% | 87.00% | 93.68% | 77.45% | 37.79% | 80.91% | 71.35% | 79.00% |
| Swin w=(30,40,40) | 79.19% | 60.44% | 88.00% | 93.68% | 77.24% | 35.54% | 78.84% | 72.28% | 77.53% |
| STA w=(30,40,40) | 80.54% | 71.19% | 93.00% | 89.81% | 79.25% | 36.77% | 84.63% | 73.83% | 82.47% |
| STA w=(18,24,24) | 88.13% | 75.46% | 91.00% | 91.61% | 82.52% | 42.15% | 81.47% | 77.03% | 80.58% |
| w. training | |||||||||
| Swin w=(30,40,40) | 77.14% | 48.86% | 73.00% | 87.00% | 63.38% | 39.03% | 77.50% | 67.39% | 75.48% |
| STA w=(30,24,40) | 91.77% | 68.45% | 86.00% | 89.59% | 72.76% | 39.53% | 85.37% | 73.52% | 83.00% |
| STA w=(18,24,24) | 92.96% | 74.16% | 93.00% | 84.50% | 73.41% | 38.23% | 84.76% | 74.05% | 82.62% |
🔼 This table presents a detailed breakdown of the qualitative performance comparison between different video generation models, focusing on various aspects of visual quality. The models are assessed across several key dimensions, such as the accuracy of object classification, the quality of human actions, and the visual characteristics of objects, and their spatial relationships within the scene. It provides a quantitative analysis of the models’ strengths and weaknesses across various visual elements to offer a more nuanced and comprehensive understanding of their performance capabilities.
read the caption
Table 8: Model Performance Comparison - Part 2
Full paper#