TL;DR#
Current text-to-video (T2V) models struggle to generate high-resolution videos with high fidelity and motion, often requiring extensive computing resources. This is primarily due to the high computational cost of 3D attention mechanisms and the need for numerous function evaluations (NFEs). Single-stage models amplify these issues when generating high-resolution outputs, demanding considerable model capacity and NFEs. This creates challenges for practical applications.
FlashVideo tackles these issues with a novel two-stage approach. The first stage uses a large model and sufficient NFEs to prioritize prompt fidelity at a lower resolution, focusing on generating accurate content and motion. The second stage leverages flow matching between low and high resolutions to add fine details, requiring only a few NFEs. This method dramatically reduces computational costs and wait times while improving efficiency, allowing for the generation of high-quality, high-resolution videos with reduced parameters and NFEs. This significantly enhances the commercial viability of T2V technology.
Key Takeaways#
Why does it matter?#
This paper is important because it presents FlashVideo, a novel two-stage framework for high-resolution video generation that significantly improves efficiency while maintaining high quality. It addresses the critical challenge of balancing computational cost and visual fidelity in text-to-video generation, a key area of current research. The two-stage design, flow-matching technique, and focus on computational efficiency offer valuable insights and new avenues for future research in this field.
Visual Insights#

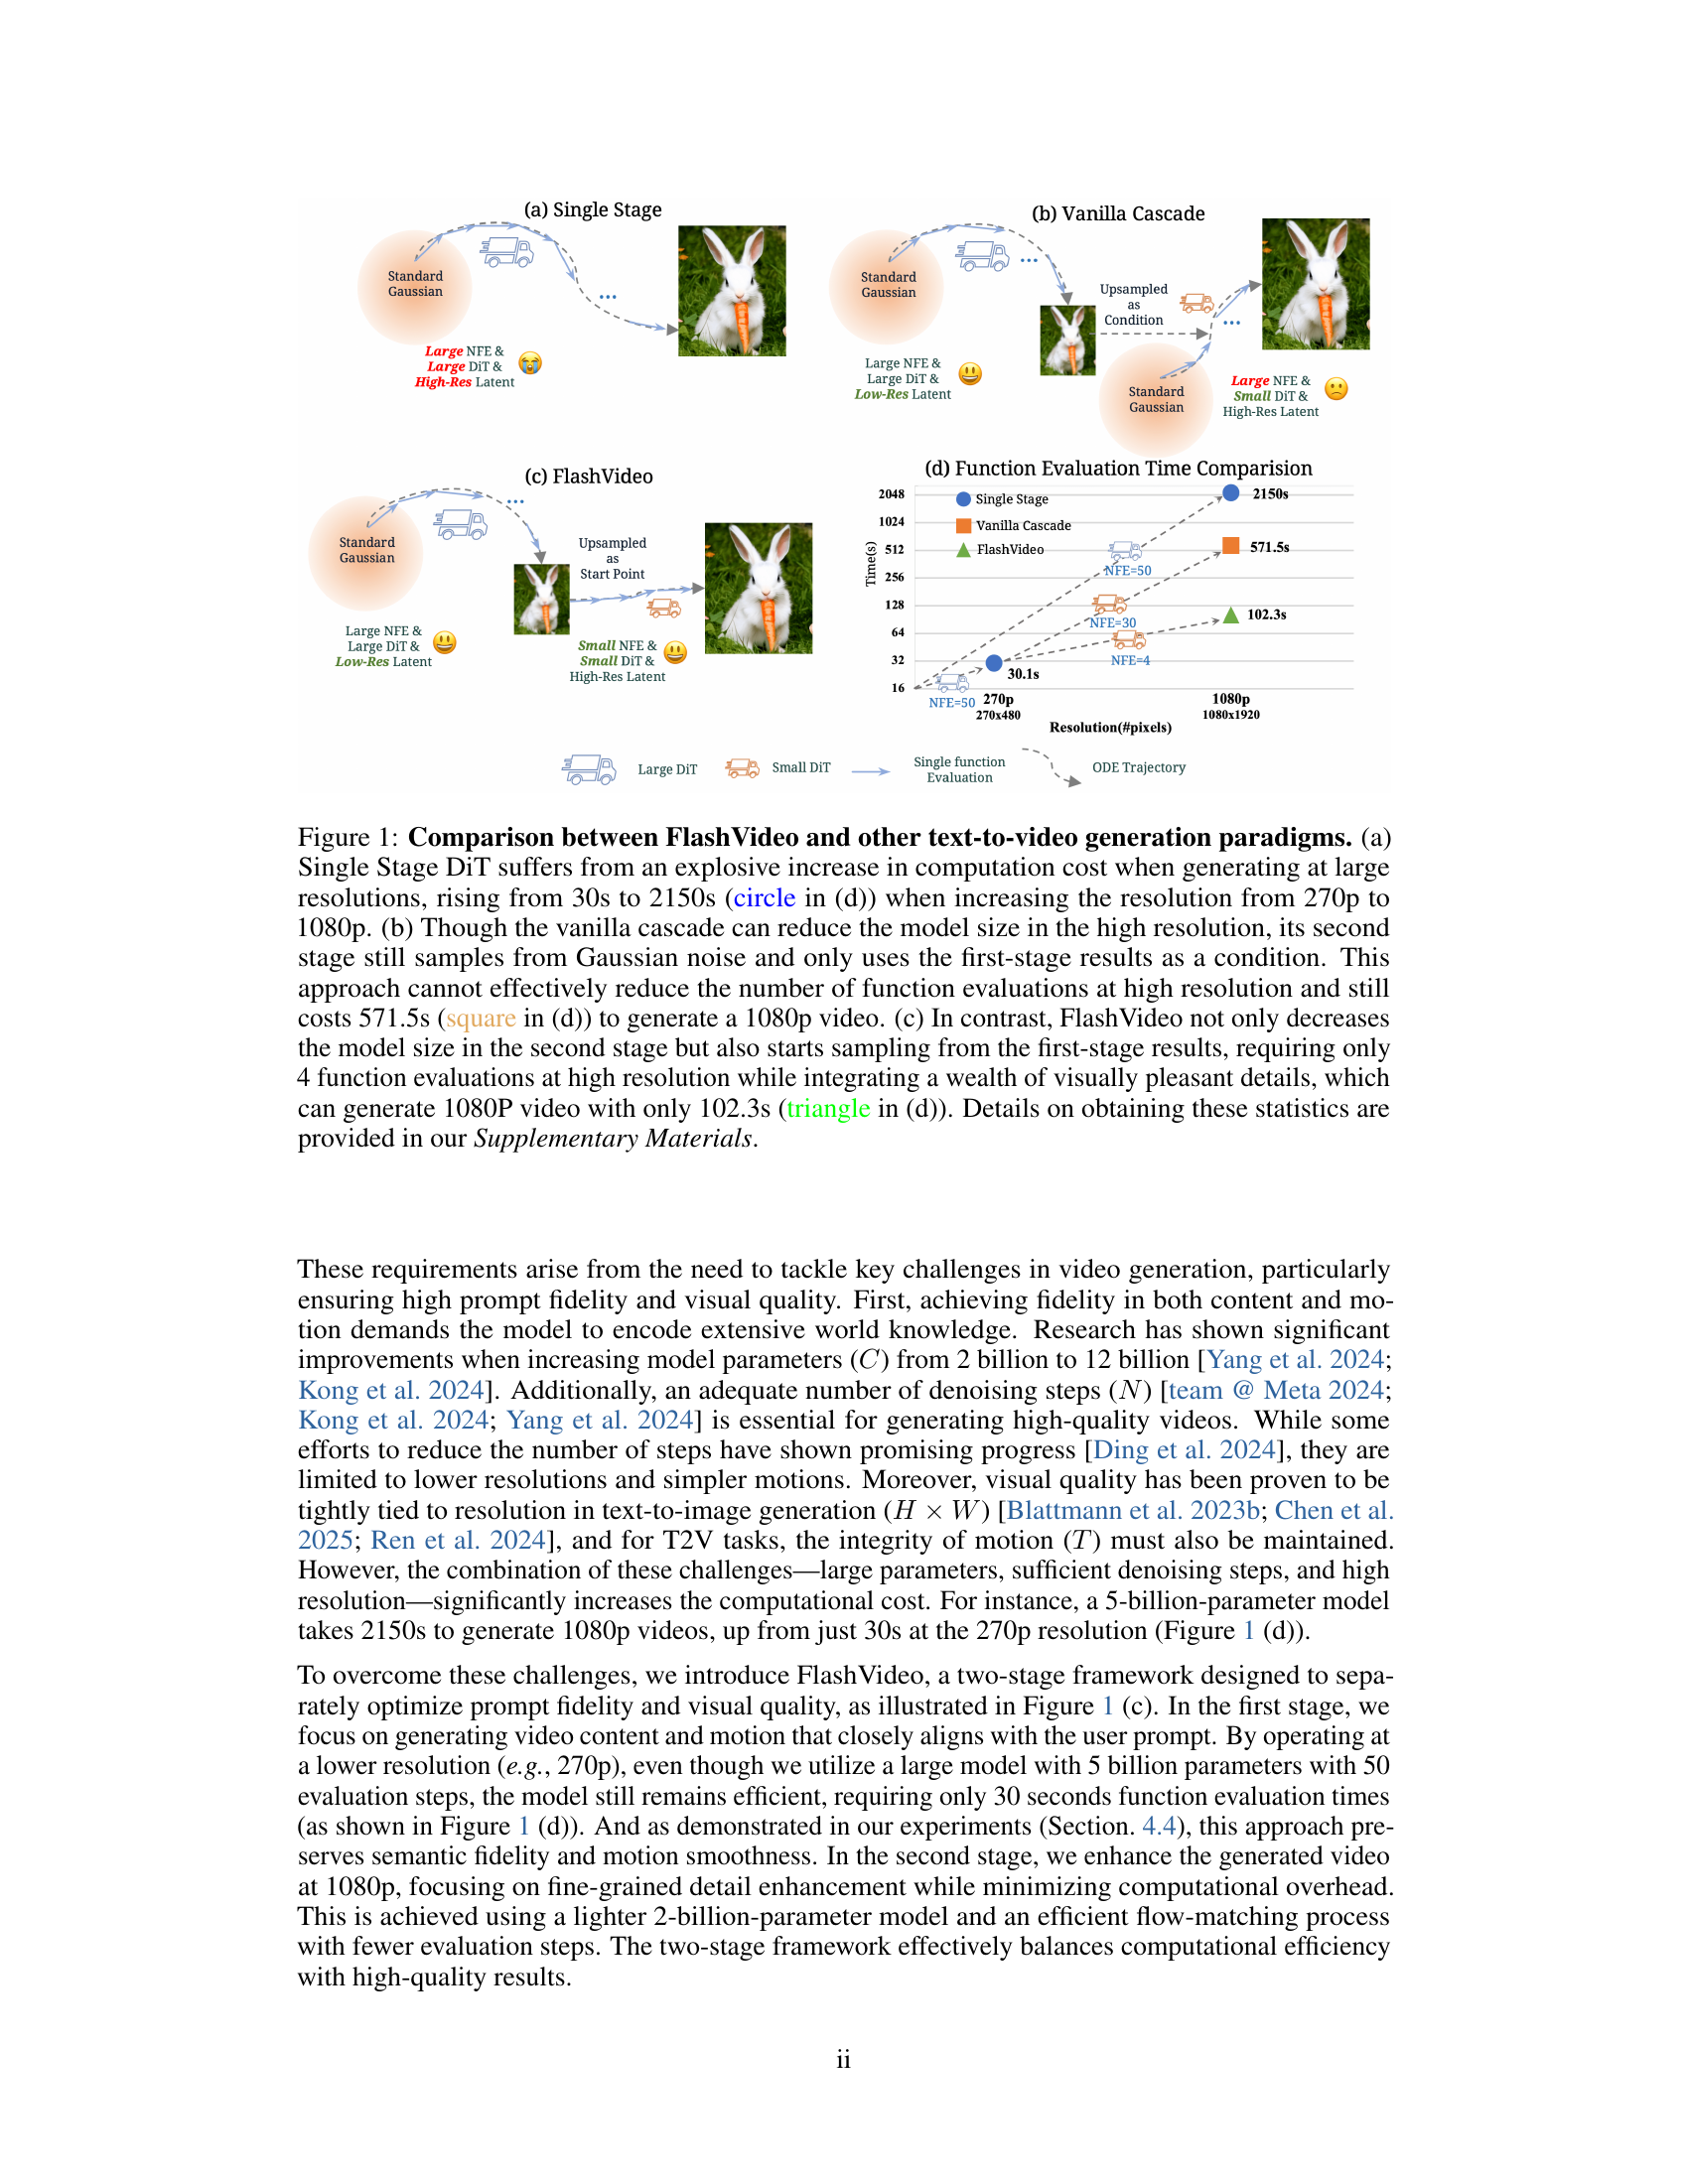
🔼 Figure 1 compares three different text-to-video generation approaches: a single-stage diffusion model, a vanilla cascade model, and the proposed FlashVideo model. The single-stage model shows a dramatic increase in computation time (from 30 seconds to 2150 seconds) when increasing the output resolution from 270p to 1080p. The vanilla cascade reduces model size at high resolution but still requires a significant amount of time (571.5 seconds for 1080p), as it samples from Gaussian noise and only uses the first-stage results as a condition. In contrast, FlashVideo achieves substantial computational efficiency by using a two-stage process. The first stage generates a low-resolution video using a large model and many function evaluations to ensure high fidelity, and then the second stage leverages flow matching to generate a high-resolution video from the low-resolution output using a smaller model and only 4 function evaluations. This process results in a significant reduction in computation time (102.3 seconds for 1080p), while still maintaining high visual quality.
read the caption
Figure 1: Comparison between FlashVideo and other text-to-video generation paradigms. (a) Single Stage DiT suffers from an explosive increase in computation cost when generating at large resolutions, rising from 30s to 2150s (circle in (d)) when increasing the resolution from 270p to 1080p. (b) Though the vanilla cascade can reduce the model size in the high resolution, its second stage still samples from Gaussian noise and only uses the first-stage results as a condition. This approach cannot effectively reduce the number of function evaluations at high resolution and still costs 571.5s (square in (d)) to generate a 1080p video. (c) In contrast, FlashVideo not only decreases the model size in the second stage but also starts sampling from the first-stage results, requiring only 4 function evaluations at high resolution while integrating a wealth of visually pleasant details, which can generate 1080P video with only 102.3s (triangle in (d)). Details on obtaining these statistics are provided in our Supplementary Materials.
| Method | Total Score | Quality Score | Semantic Score | subject consistency | background consistency | temporal flickering | motion smoothness | dynamic degree | aesthetic quality | imaging quality | object class | multiple objects | human action | color | spatial relationship | scene | appearance style | temporal style | overall consistency |
| Vchitect(VEnhancer) | 82.24 | 83.54 | 77.06 | 96.83 | 96.66 | 98.57 | 98.98 | 63.89 | 60.41 | 65.35 | 86.61 | 68.84 | 97.20 | 87.04 | 57.55 | 56.57 | 23.73 | 25.01 | 27.57 |
| CogVideoX-1.5 | 82.17 | 82.78 | 79.76 | 96.87 | 97.35 | 98.88 | 98.31 | 50.93 | 62.79 | 65.02 | 87.47 | 69.65 | 97.20 | 87.55 | 80.25 | 52.91 | 24.89 | 25.19 | 27.30 |
| CogVideoX-5B | 81.61 | 82.75 | 77.04 | 96.23 | 96.52 | 98.66 | 96.92 | 70.97 | 61.98 | 62.90 | 85.23 | 62.11 | 99.40 | 82.81 | 66.35 | 53.20 | 24.91 | 25.38 | 27.59 |
| CogVideoX-2B | 81.57 | 82.51 | 77.79 | 96.42 | 96.53 | 98.45 | 97.76 | 58.33 | 61.47 | 65.60 | 87.81 | 69.35 | 97.00 | 86.87 | 54.64 | 57.51 | 24.93 | 25.56 | 28.01 |
| Mochi-1 | 80.13 | 82.64 | 70.08 | 96.99 | 97.28 | 99.40 | 99.02 | 61.85 | 56.94 | 60.64 | 86.51 | 50.47 | 94.60 | 79.73 | 69.24 | 36.99 | 20.33 | 23.65 | 25.15 |
| LTX-Video | 80.00 | 82.30 | 70.79 | 96.56 | 97.20 | 99.34 | 98.96 | 54.35 | 59.81 | 60.28 | 83.45 | 45.43 | 92.80 | 81.45 | 65.43 | 51.07 | 21.47 | 22.62 | 25.19 |
| OpenSora-1.2 | 80.00 | 82.30 | 70.79 | 96.56 | 97.20 | 99.34 | 98.96 | 54.35 | 59.81 | 60.28 | 83.45 | 45.43 | 92.80 | 81.45 | 65.43 | 51.07 | 21.47 | 22.62 | 25.19 |
| OpenSoraPlan-V1.1 | 78.00 | 80.91 | 66.38 | 95.73 | 96.73 | 99.03 | 98.28 | 47.72 | 56.85 | 62.28 | 76.30 | 40.35 | 86.80 | 89.19 | 53.11 | 27.17 | 22.90 | 23.87 | 26.52 |
| FlashVideo | 82.49 | 82.58 | 82.10 | 96.96 | 96.82 | 98.43 | 97.01 | 59.58 | 62.29 | 66.21 | 89.87 | 80.67 | 99.20 | 85.81 | 83.02 | 57.17 | 24.39 | 25.46 | 27.81 |
| FlashVideo | 82.99 | 83.35 | 81.56 | 97.19 | 97.09 | 98.52 | 98.89 | 56.88 | 62.11 | 65.40 | 88.38 | 78.93 | 99.40 | 84.84 | 82.16 | 57.43 | 24.36 | 25.26 | 27.59 |
🔼 Table 1 presents a quantitative comparison of FlashVideo against several state-of-the-art open-source text-to-video generation models using the VBench-Long benchmark. The benchmark assesses video quality across various aspects, including semantic meaning, aesthetic appeal, and technical aspects like temporal consistency. Models compared include Vchitect-2.0 (with VEnhancer), multiple versions of CogVideoX, Mochi-1, LTX-Video, OpenSora, and OpenSoraPlan. The table highlights FlashVideo’s superior performance in achieving high semantic fidelity and overall quality, achieved through its unique two-stage cascade approach.
read the caption
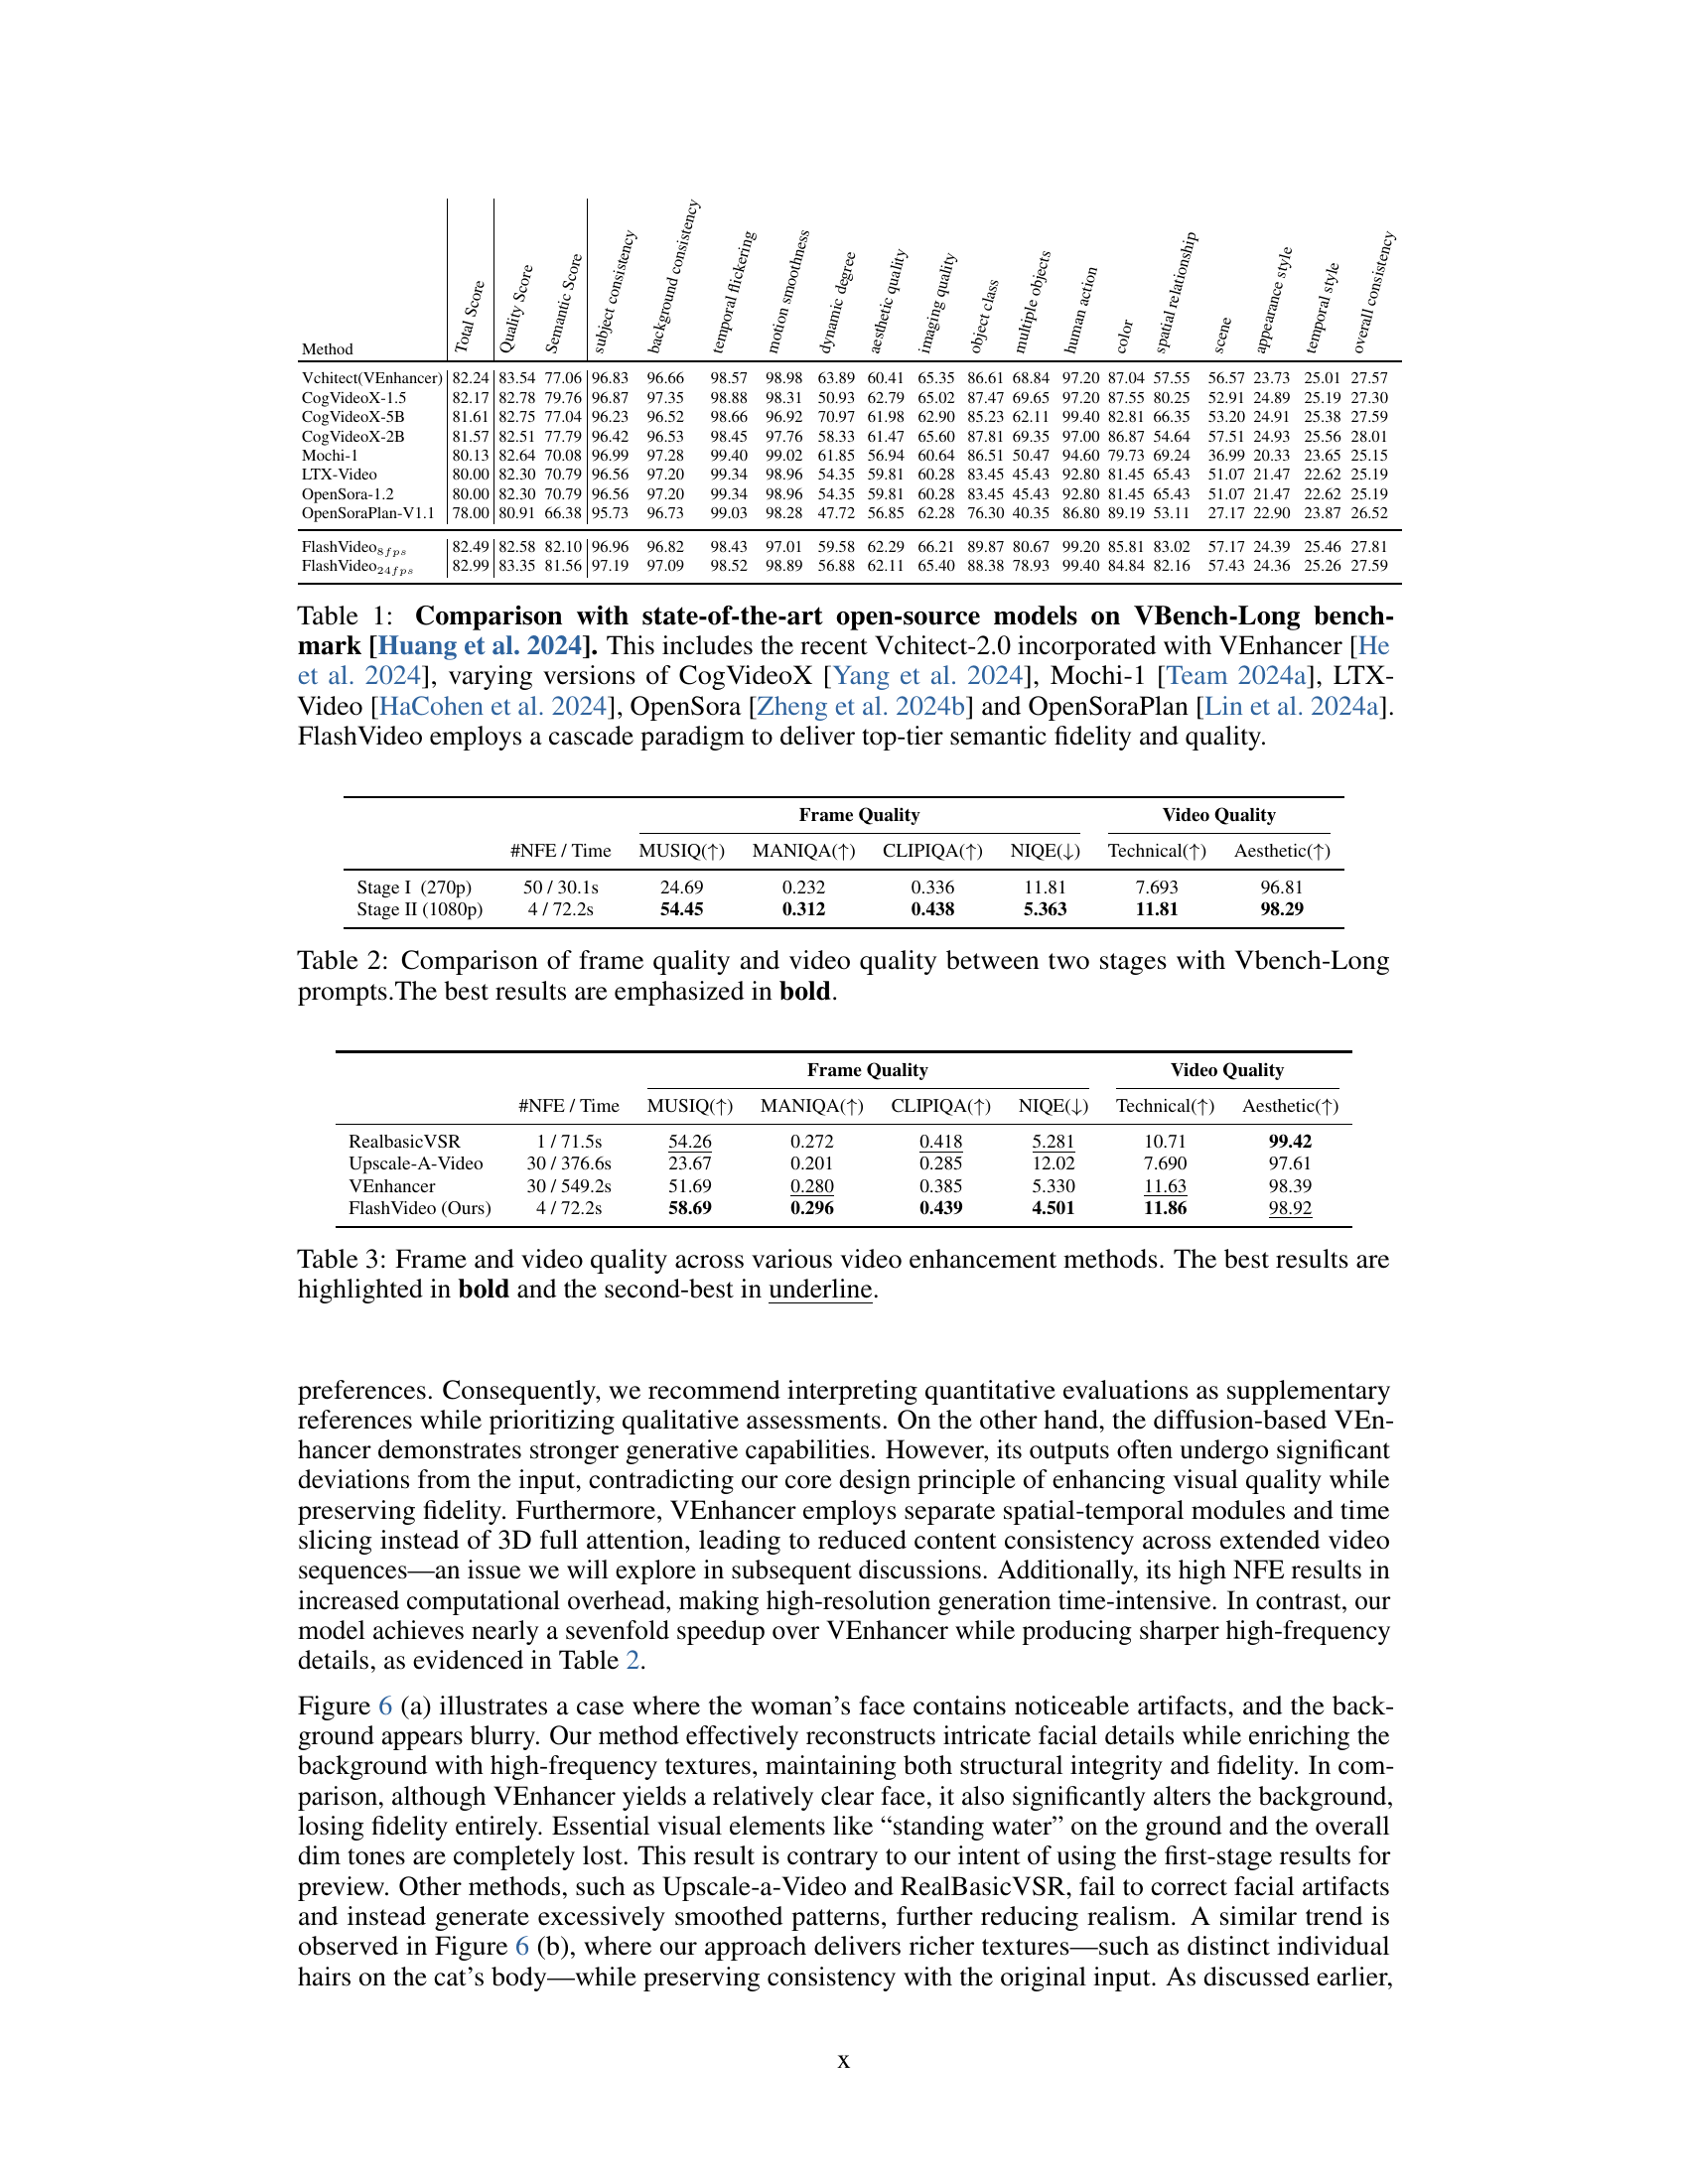
Table 1: Comparison with state-of-the-art open-source models on VBench-Long benchmark [Huang et al. 2024]. This includes the recent Vchitect-2.0 incorporated with VEnhancer [He et al. 2024], varying versions of CogVideoX [Yang et al. 2024], Mochi-1 [Team 2024a], LTX-Video [HaCohen et al. 2024], OpenSora [Zheng et al. 2024b] and OpenSoraPlan [Lin et al. 2024a]. FlashVideo employs a cascade paradigm to deliver top-tier semantic fidelity and quality.
In-depth insights#
Two-Stage DiT#
A two-stage Diffusion Transformer (DiT) approach for video generation offers a compelling strategy to balance high-resolution quality with computational efficiency. The core idea is to decouple the generation process. The first stage prioritizes prompt fidelity using a large model at lower resolution, focusing on accurate content and motion representation. This stage leverages a substantial number of function evaluations (NFEs) to capture semantic details efficiently. In the second stage, a smaller model refines the low-resolution output to achieve higher resolution, focusing on detail enhancement via techniques like flow matching. This two-stage approach reduces computational demands significantly by shifting the bulk of NFEs to the less computationally intensive low-resolution stage. By strategically allocating model resources and NFEs across the two stages, this method efficiently generates high-quality videos, overcoming challenges associated with high-resolution, single-stage DiTs. Furthermore, the two-stage design allows for an early preview of the video before committing to full-resolution generation, reducing wait times and providing better user control. The effectiveness of this approach hinges on careful selection of models, resolutions, and optimization strategies for each stage. This architecture showcases an important tradeoff between computational cost and fidelity. The two-stage approach highlights a practical pathway towards more commercially viable and responsive high-resolution video generation systems.
Flow Matching#
The concept of ‘flow matching’ in the context of high-resolution video generation is a crucial innovation. It cleverly addresses the computational challenges of traditional methods by avoiding redundant sampling from Gaussian noise in the high-resolution stage. Instead, it leverages the low-resolution output as a starting point, effectively using it to guide the generation of higher-resolution details through a flow-matching process. This technique minimizes the number of function evaluations needed, resulting in significant computational savings while simultaneously ensuring a smooth transition between low and high resolutions. The core idea is to find a mapping (a ‘flow’) from the low-resolution latent space to the high-resolution space, directly guiding the generation process rather than starting from scratch. This approach likely relies on techniques that efficiently learn and represent this flow, possibly involving neural networks trained to predict or optimize the trajectory in the latent space, allowing for a smooth and accurate enhancement of video quality. The straight ODE trajectories further enhance efficiency by simplifying the optimization process. Ultimately, flow matching proves to be a powerful tool to balance fidelity and efficiency in high-resolution video generation, making it a promising avenue for future research in computationally expensive generative models.
High-Res Video#
Generating high-resolution videos presents significant challenges in text-to-video (T2V) models. Computational costs explode as resolution increases due to the complexity of 3D attention mechanisms and the need for numerous function evaluations. Many existing single-stage models struggle with this tradeoff between fidelity and efficiency, often requiring extensive processing power and time. Two-stage approaches offer a potential solution by separating the generation into low-resolution fidelity and high-resolution detail stages. This allows for more efficient use of model capacity and computation. Flow matching is a technique that can further enhance efficiency by directly traversing from low-resolution outputs to high-resolution ones, minimizing the need for additional steps. However, carefully designed training data is crucial, employing techniques like latent and pixel degradation to adequately balance the tradeoff between fine details and preserving the integrity of the source video. Furthermore, human preference alignment in the final stages is important for achieving visually appealing and desirable results. The successful integration of these techniques results in high-quality high-resolution video generation with superior computational efficiency compared to single-stage approaches.
Computational Efficiency#
The research paper emphasizes computational efficiency as a critical factor in high-resolution video generation. Traditional single-stage diffusion models suffer from excessively high computational costs, especially when generating high-resolution outputs. The proposed two-stage framework, FlashVideo, directly addresses this issue by strategically allocating computational resources across stages. The first stage prioritizes prompt fidelity by generating a low-resolution video using a larger model but fewer function evaluations. The second stage leverages flow matching to efficiently enhance visual quality at high resolution with minimal computational overhead. This two-stage approach is shown to significantly reduce computational costs and generation times compared to existing methods, making high-resolution video generation more commercially viable. Flow matching is key to the efficiency gains of Stage II. The design choices, including model sizing and the number of function evaluations, are carefully considered to achieve an optimal balance between speed and quality. Careful training strategies, like coarse-to-fine training and human preference alignment, further contribute to the efficiency and efficacy of the model.
Future Directions#
Future research should prioritize improving efficiency for longer videos and higher resolutions. Addressing the computational demands of 3D attention mechanisms is crucial, perhaps through exploring more efficient attention strategies like sparse attention or windowed attention. Improving robustness to fast motion and varied video lengths is also critical. This may involve data augmentation techniques focused on these challenging scenarios or architectural innovations that better handle temporal dynamics. Further exploration of latent degradation techniques and their optimal settings for different video qualities and characteristics is needed. Finally, investigating the potential of FlashVideo as a general enhancement model—extending beyond its current two-stage design to accommodate varied resolutions and frame counts—is a significant area for future work. This could involve refining the latent matching process for superior adaptability and scaling up the model capacity to handle more complex videos.
More visual insights#
More on figures

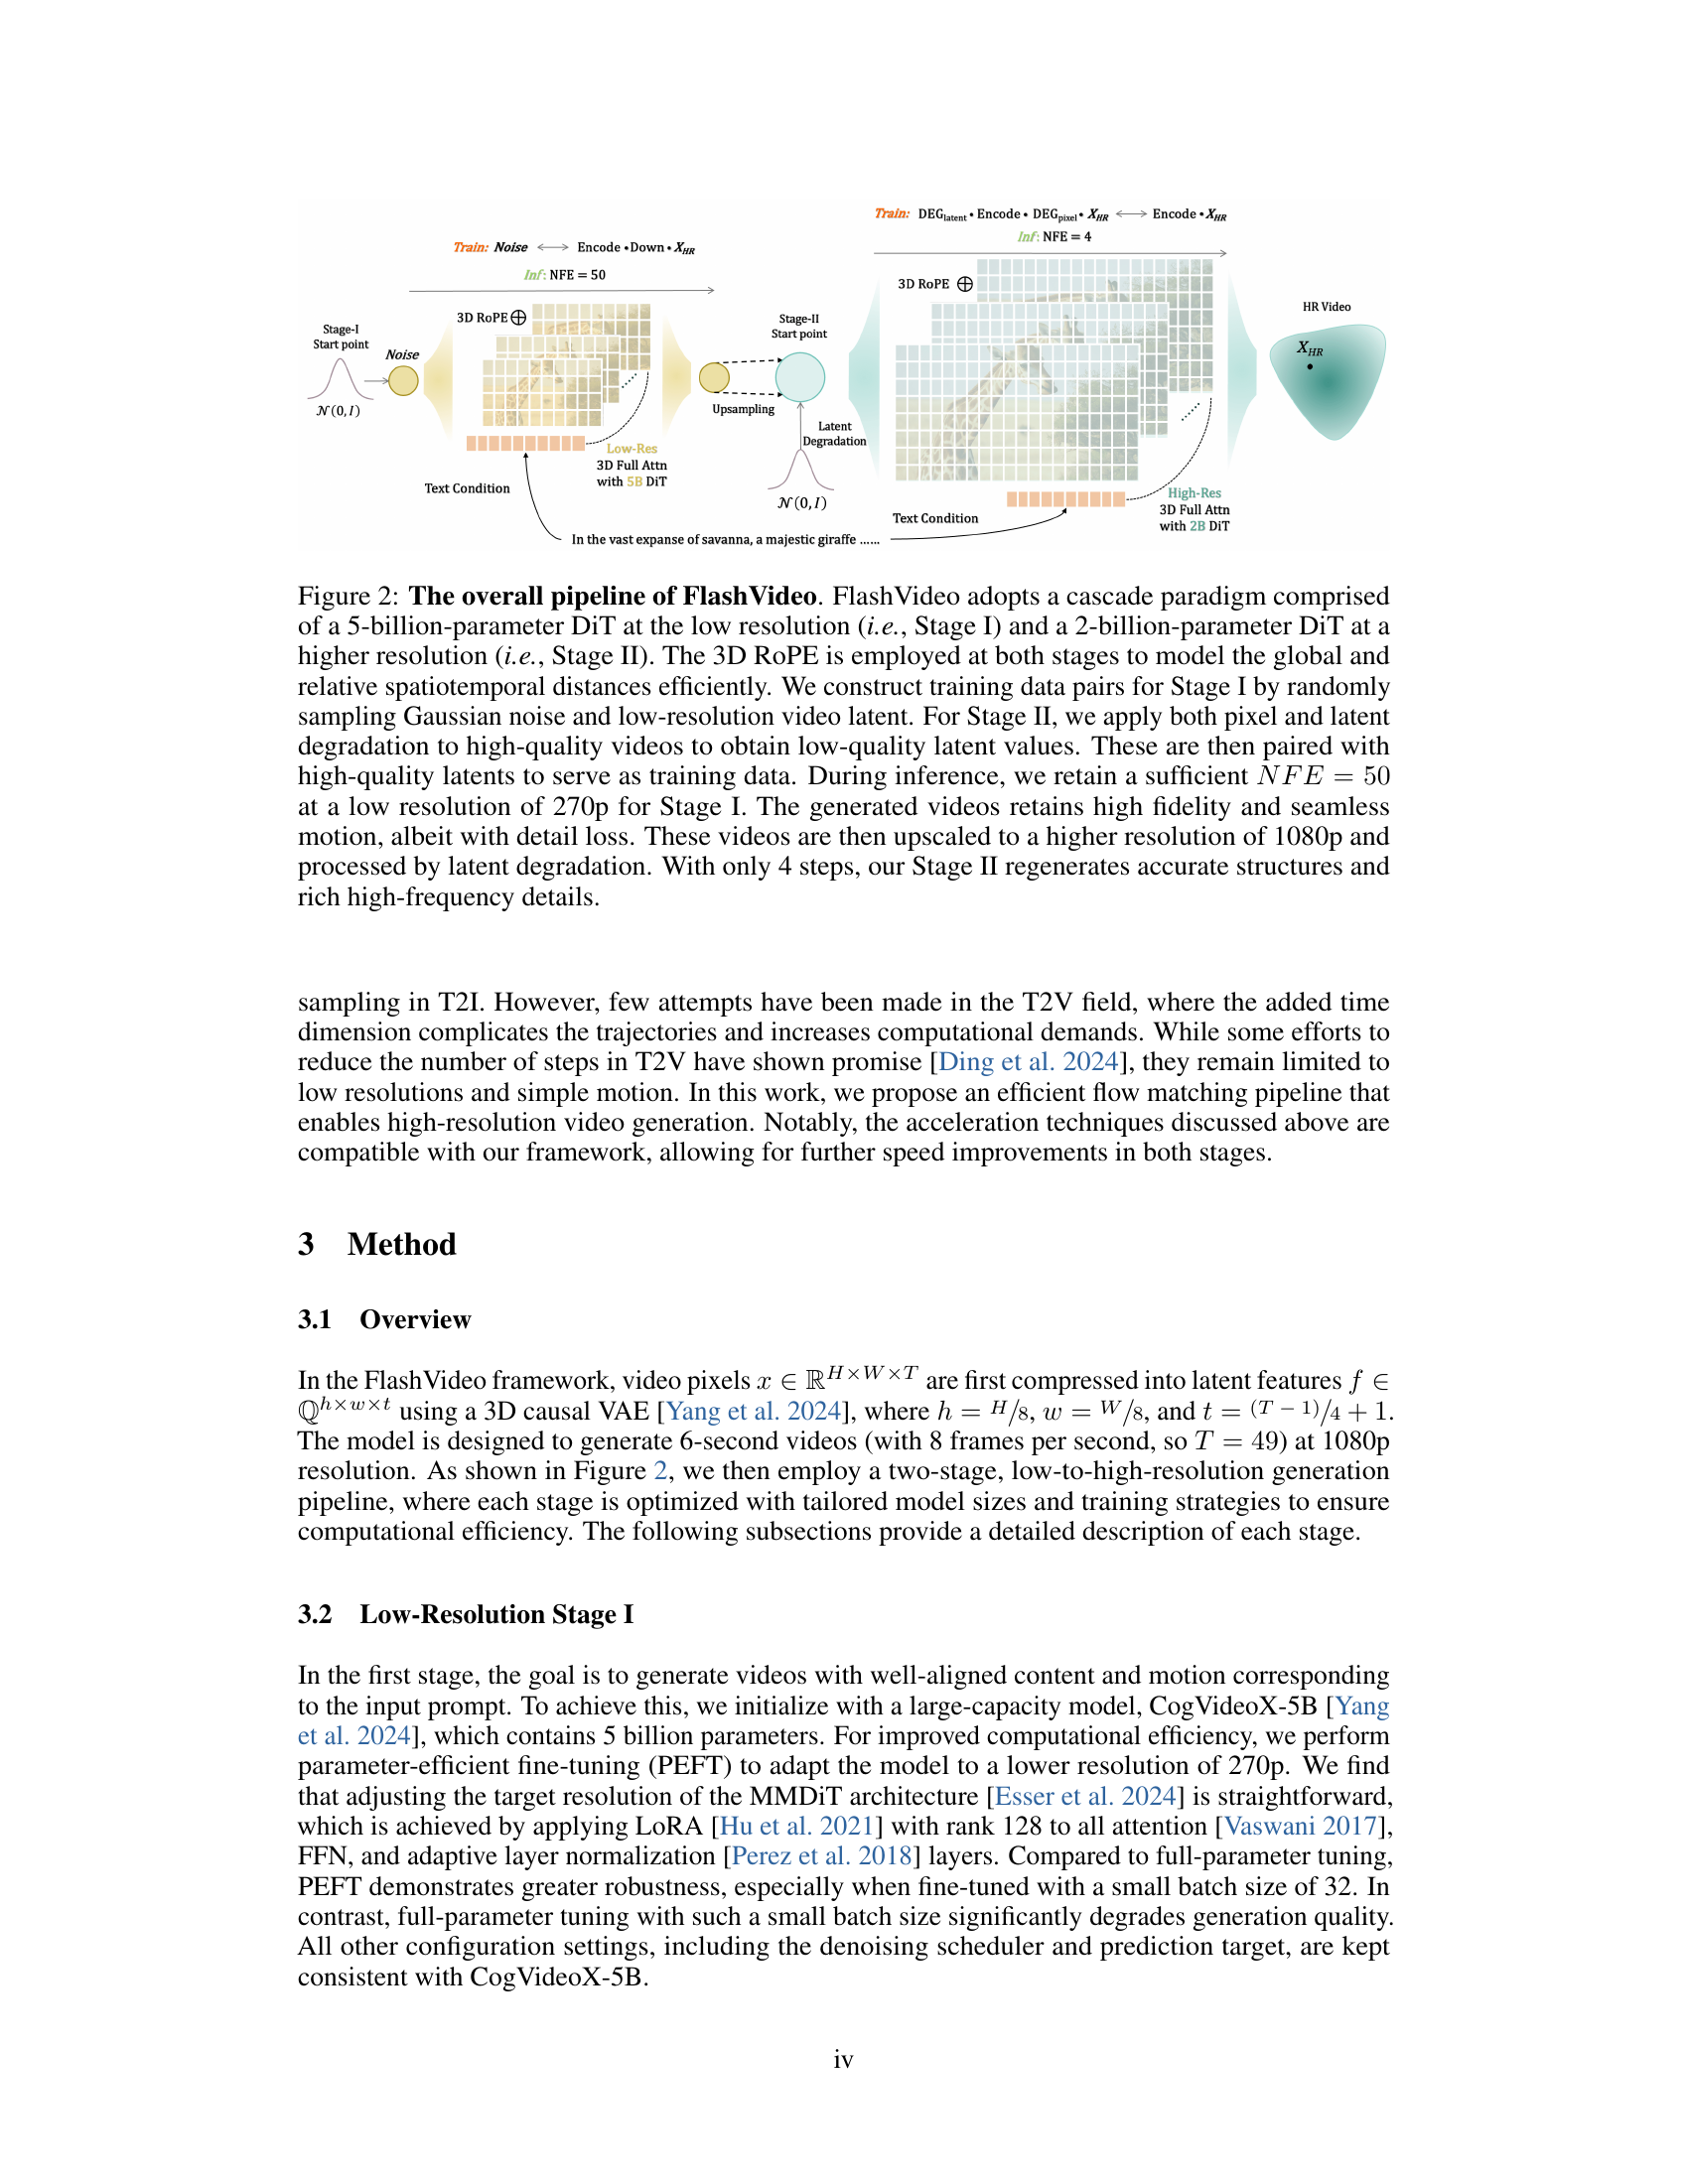
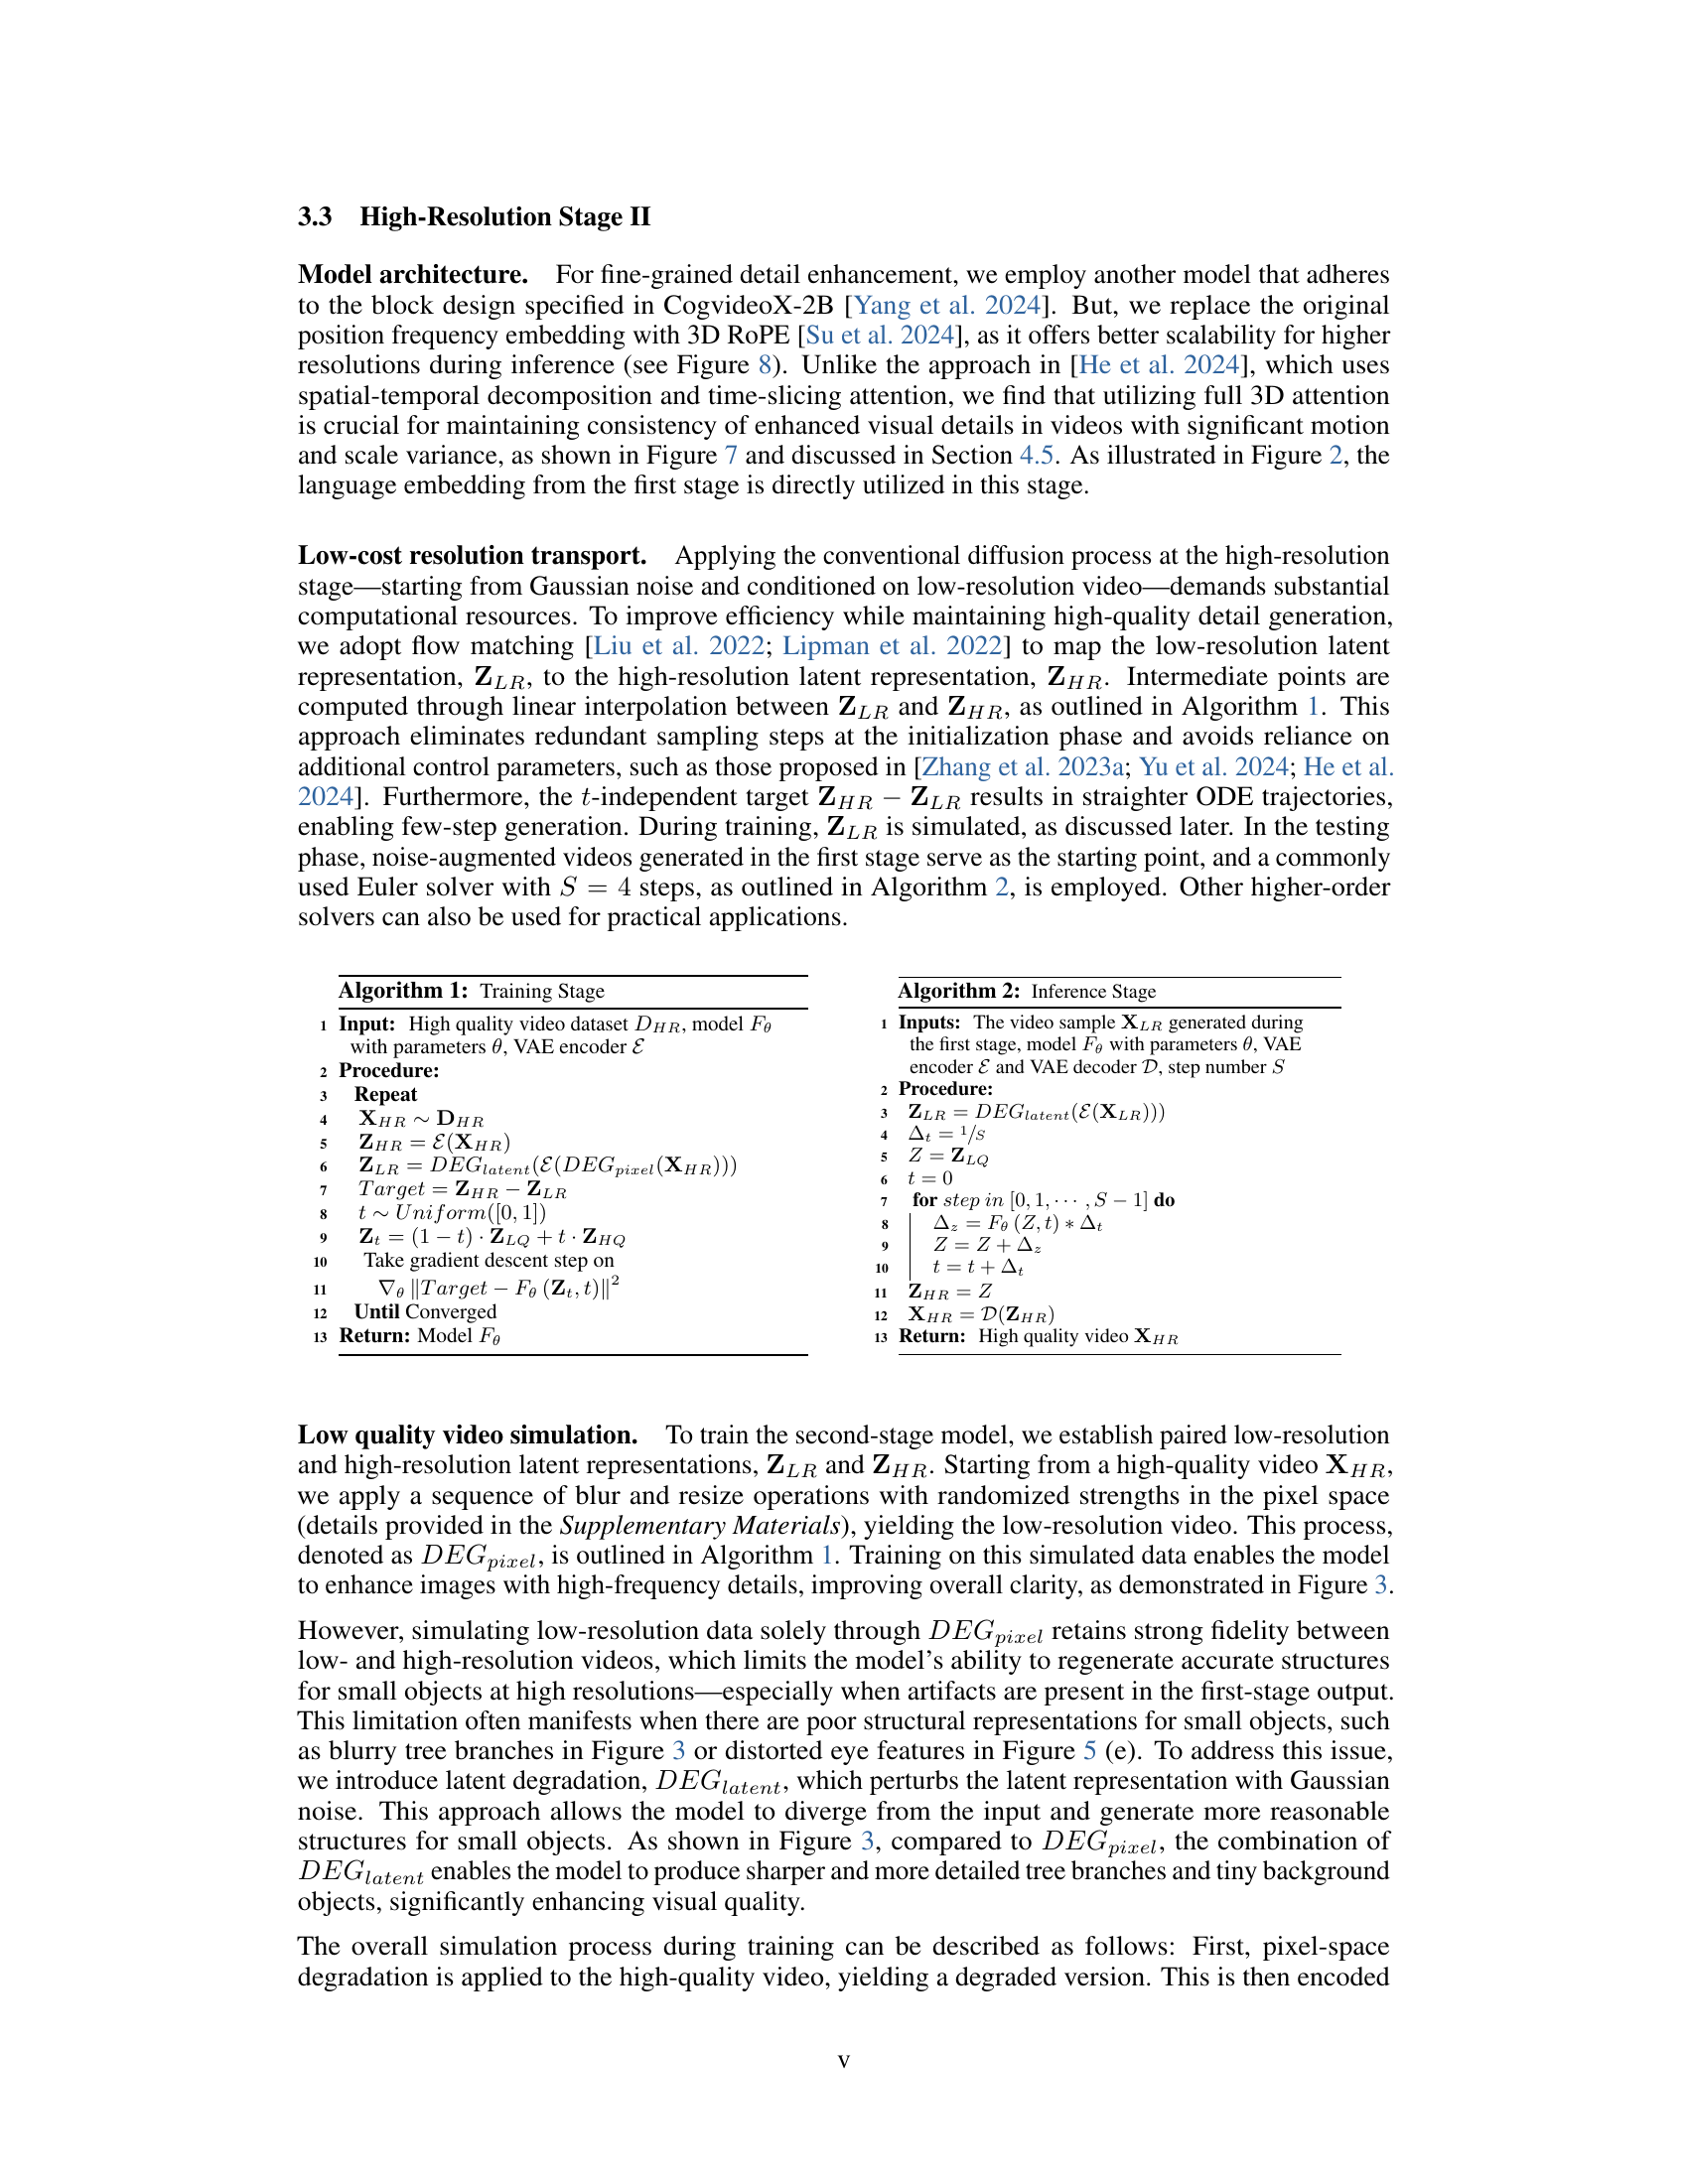
🔼 FlashVideo uses a two-stage approach. Stage I uses a large 5-billion parameter model at low resolution (270p) with many function evaluations (NFEs) to prioritize accuracy and high fidelity. Stage II employs a smaller 2-billion parameter model at high resolution (1080p) to refine details using a flow matching technique that requires only a few NFEs. Both stages utilize 3D RoPE for efficient spatiotemporal modeling. The training data for Stage I consists of random Gaussian noise and low-resolution video latents, while Stage II’s training data is created by degrading high-quality videos to obtain low-quality latents that are then paired with their high-quality counterparts. During inference, Stage I generates a low-resolution video (with 50 NFEs), which is then upscaled and further processed by Stage II (with 4 NFEs) to produce the final high-resolution video.
read the caption
Figure 2: The overall pipeline of FlashVideo. FlashVideo adopts a cascade paradigm comprised of a 5-billion-parameter DiT at the low resolution (i.e., Stage \Romannum1) and a 2-billion-parameter DiT at a higher resolution (i.e., Stage \Romannum2). The 3D RoPE is employed at both stages to model the global and relative spatiotemporal distances efficiently. We construct training data pairs for Stage \Romannum1 by randomly sampling Gaussian noise and low-resolution video latent. For Stage \Romannum2, we apply both pixel and latent degradation to high-quality videos to obtain low-quality latent values. These are then paired with high-quality latents to serve as training data. During inference, we retain a sufficient NFE=50𝑁𝐹𝐸50NFE=50italic_N italic_F italic_E = 50 at a low resolution of 270p for Stage \Romannum1. The generated videos retains high fidelity and seamless motion, albeit with detail loss. These videos are then upscaled to a higher resolution of 1080p and processed by latent degradation. With only 4 steps, our Stage \Romannum2 regenerates accurate structures and rich high-frequency details.

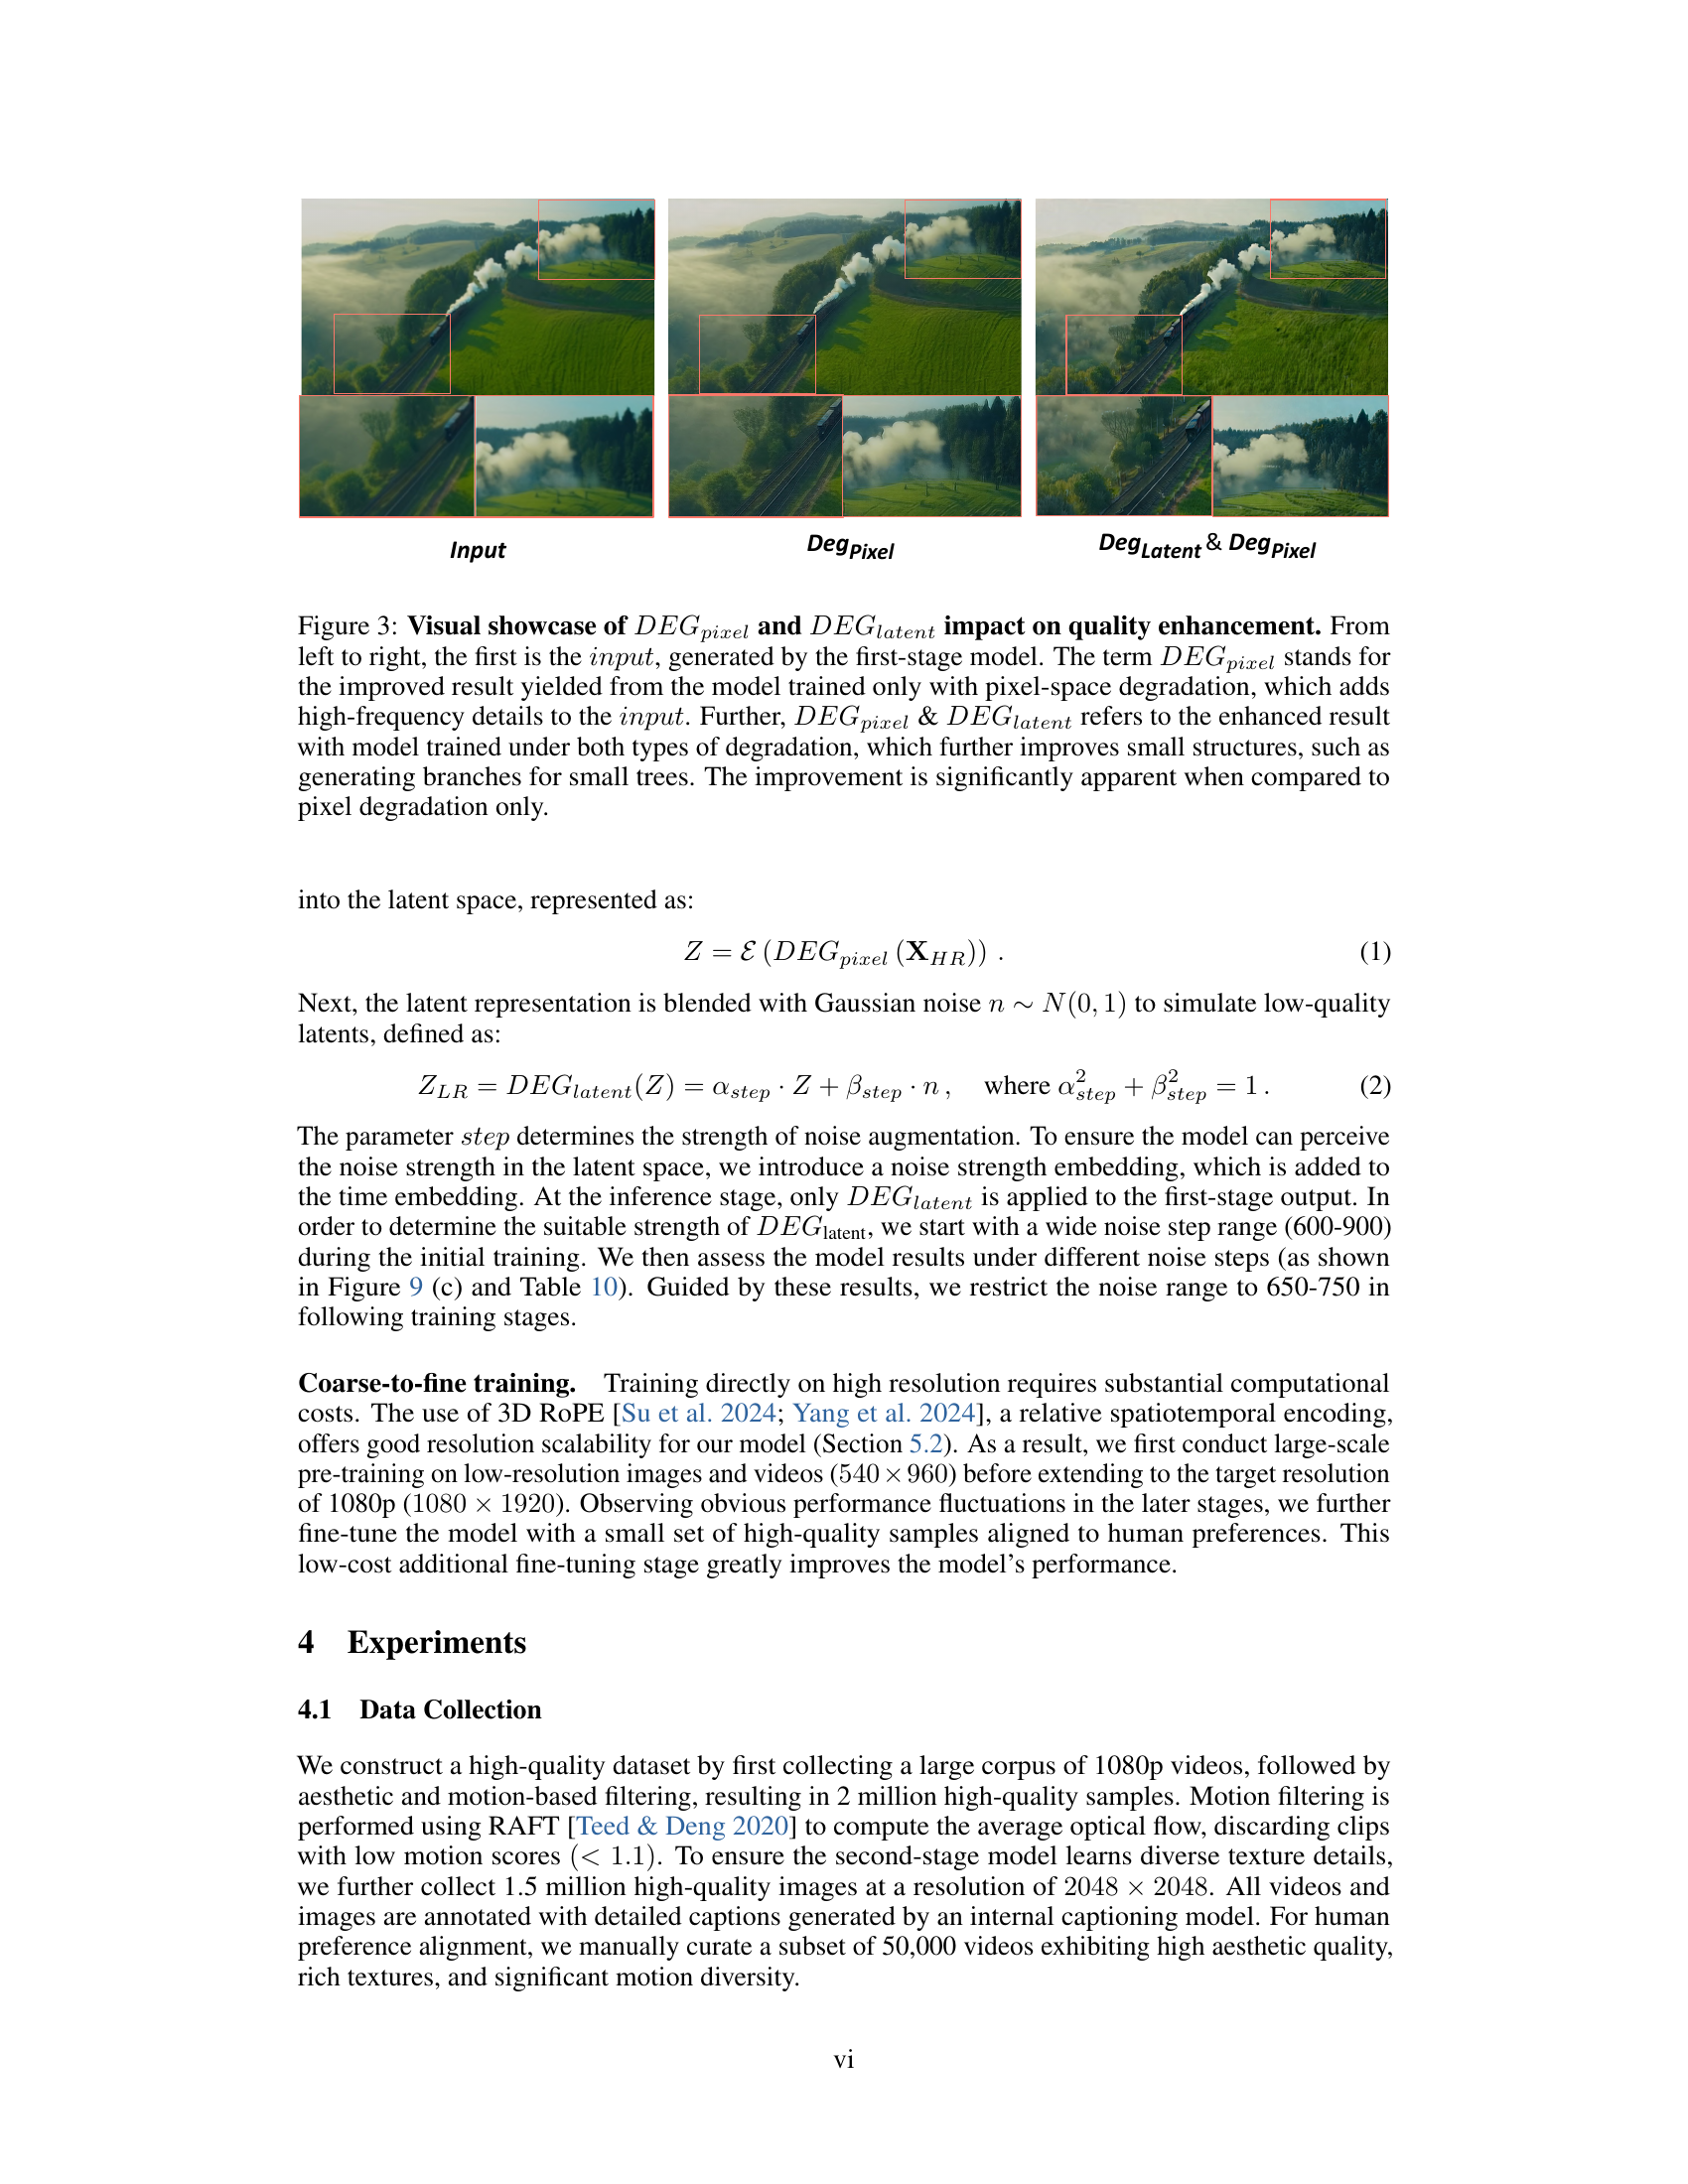
🔼 This figure demonstrates the impact of different data augmentation techniques on the quality of video generation. The input video is generated by the first stage of the FlashVideo model and is relatively low resolution. The image shows three versions of the same video: 1. Input: The original output of the first-stage model, showing the basic scene and motion but lacking fine details. 2. DEGpixel: The result after applying only pixel-space degradation to the input video. This enhances the high-frequency details, resulting in a sharper video. 3. DEGpixel & DEGlatent: The result after applying both pixel-space and latent-space degradation techniques to the input. This further improves the fine details (e.g., small tree branches), demonstrating the added benefit of the latent degradation approach.
read the caption
Figure 3: Visual showcase of DEGpixel𝐷𝐸subscript𝐺𝑝𝑖𝑥𝑒𝑙DEG_{pixel}italic_D italic_E italic_G start_POSTSUBSCRIPT italic_p italic_i italic_x italic_e italic_l end_POSTSUBSCRIPT and DEGlatent𝐷𝐸subscript𝐺𝑙𝑎𝑡𝑒𝑛𝑡DEG_{latent}italic_D italic_E italic_G start_POSTSUBSCRIPT italic_l italic_a italic_t italic_e italic_n italic_t end_POSTSUBSCRIPT impact on quality enhancement. From left to right, the first is the input𝑖𝑛𝑝𝑢𝑡inputitalic_i italic_n italic_p italic_u italic_t, generated by the first-stage model. The term DEGpixel𝐷𝐸subscript𝐺𝑝𝑖𝑥𝑒𝑙DEG_{pixel}italic_D italic_E italic_G start_POSTSUBSCRIPT italic_p italic_i italic_x italic_e italic_l end_POSTSUBSCRIPT stands for the improved result yielded from the model trained only with pixel-space degradation, which adds high-frequency details to the input𝑖𝑛𝑝𝑢𝑡inputitalic_i italic_n italic_p italic_u italic_t. Further, DEGpixel𝐷𝐸subscript𝐺𝑝𝑖𝑥𝑒𝑙DEG_{pixel}italic_D italic_E italic_G start_POSTSUBSCRIPT italic_p italic_i italic_x italic_e italic_l end_POSTSUBSCRIPT & DEGlatent𝐷𝐸subscript𝐺𝑙𝑎𝑡𝑒𝑛𝑡DEG_{latent}italic_D italic_E italic_G start_POSTSUBSCRIPT italic_l italic_a italic_t italic_e italic_n italic_t end_POSTSUBSCRIPT refers to the enhanced result with model trained under both types of degradation, which further improves small structures, such as generating branches for small trees. The improvement is significantly apparent when compared to pixel degradation only.

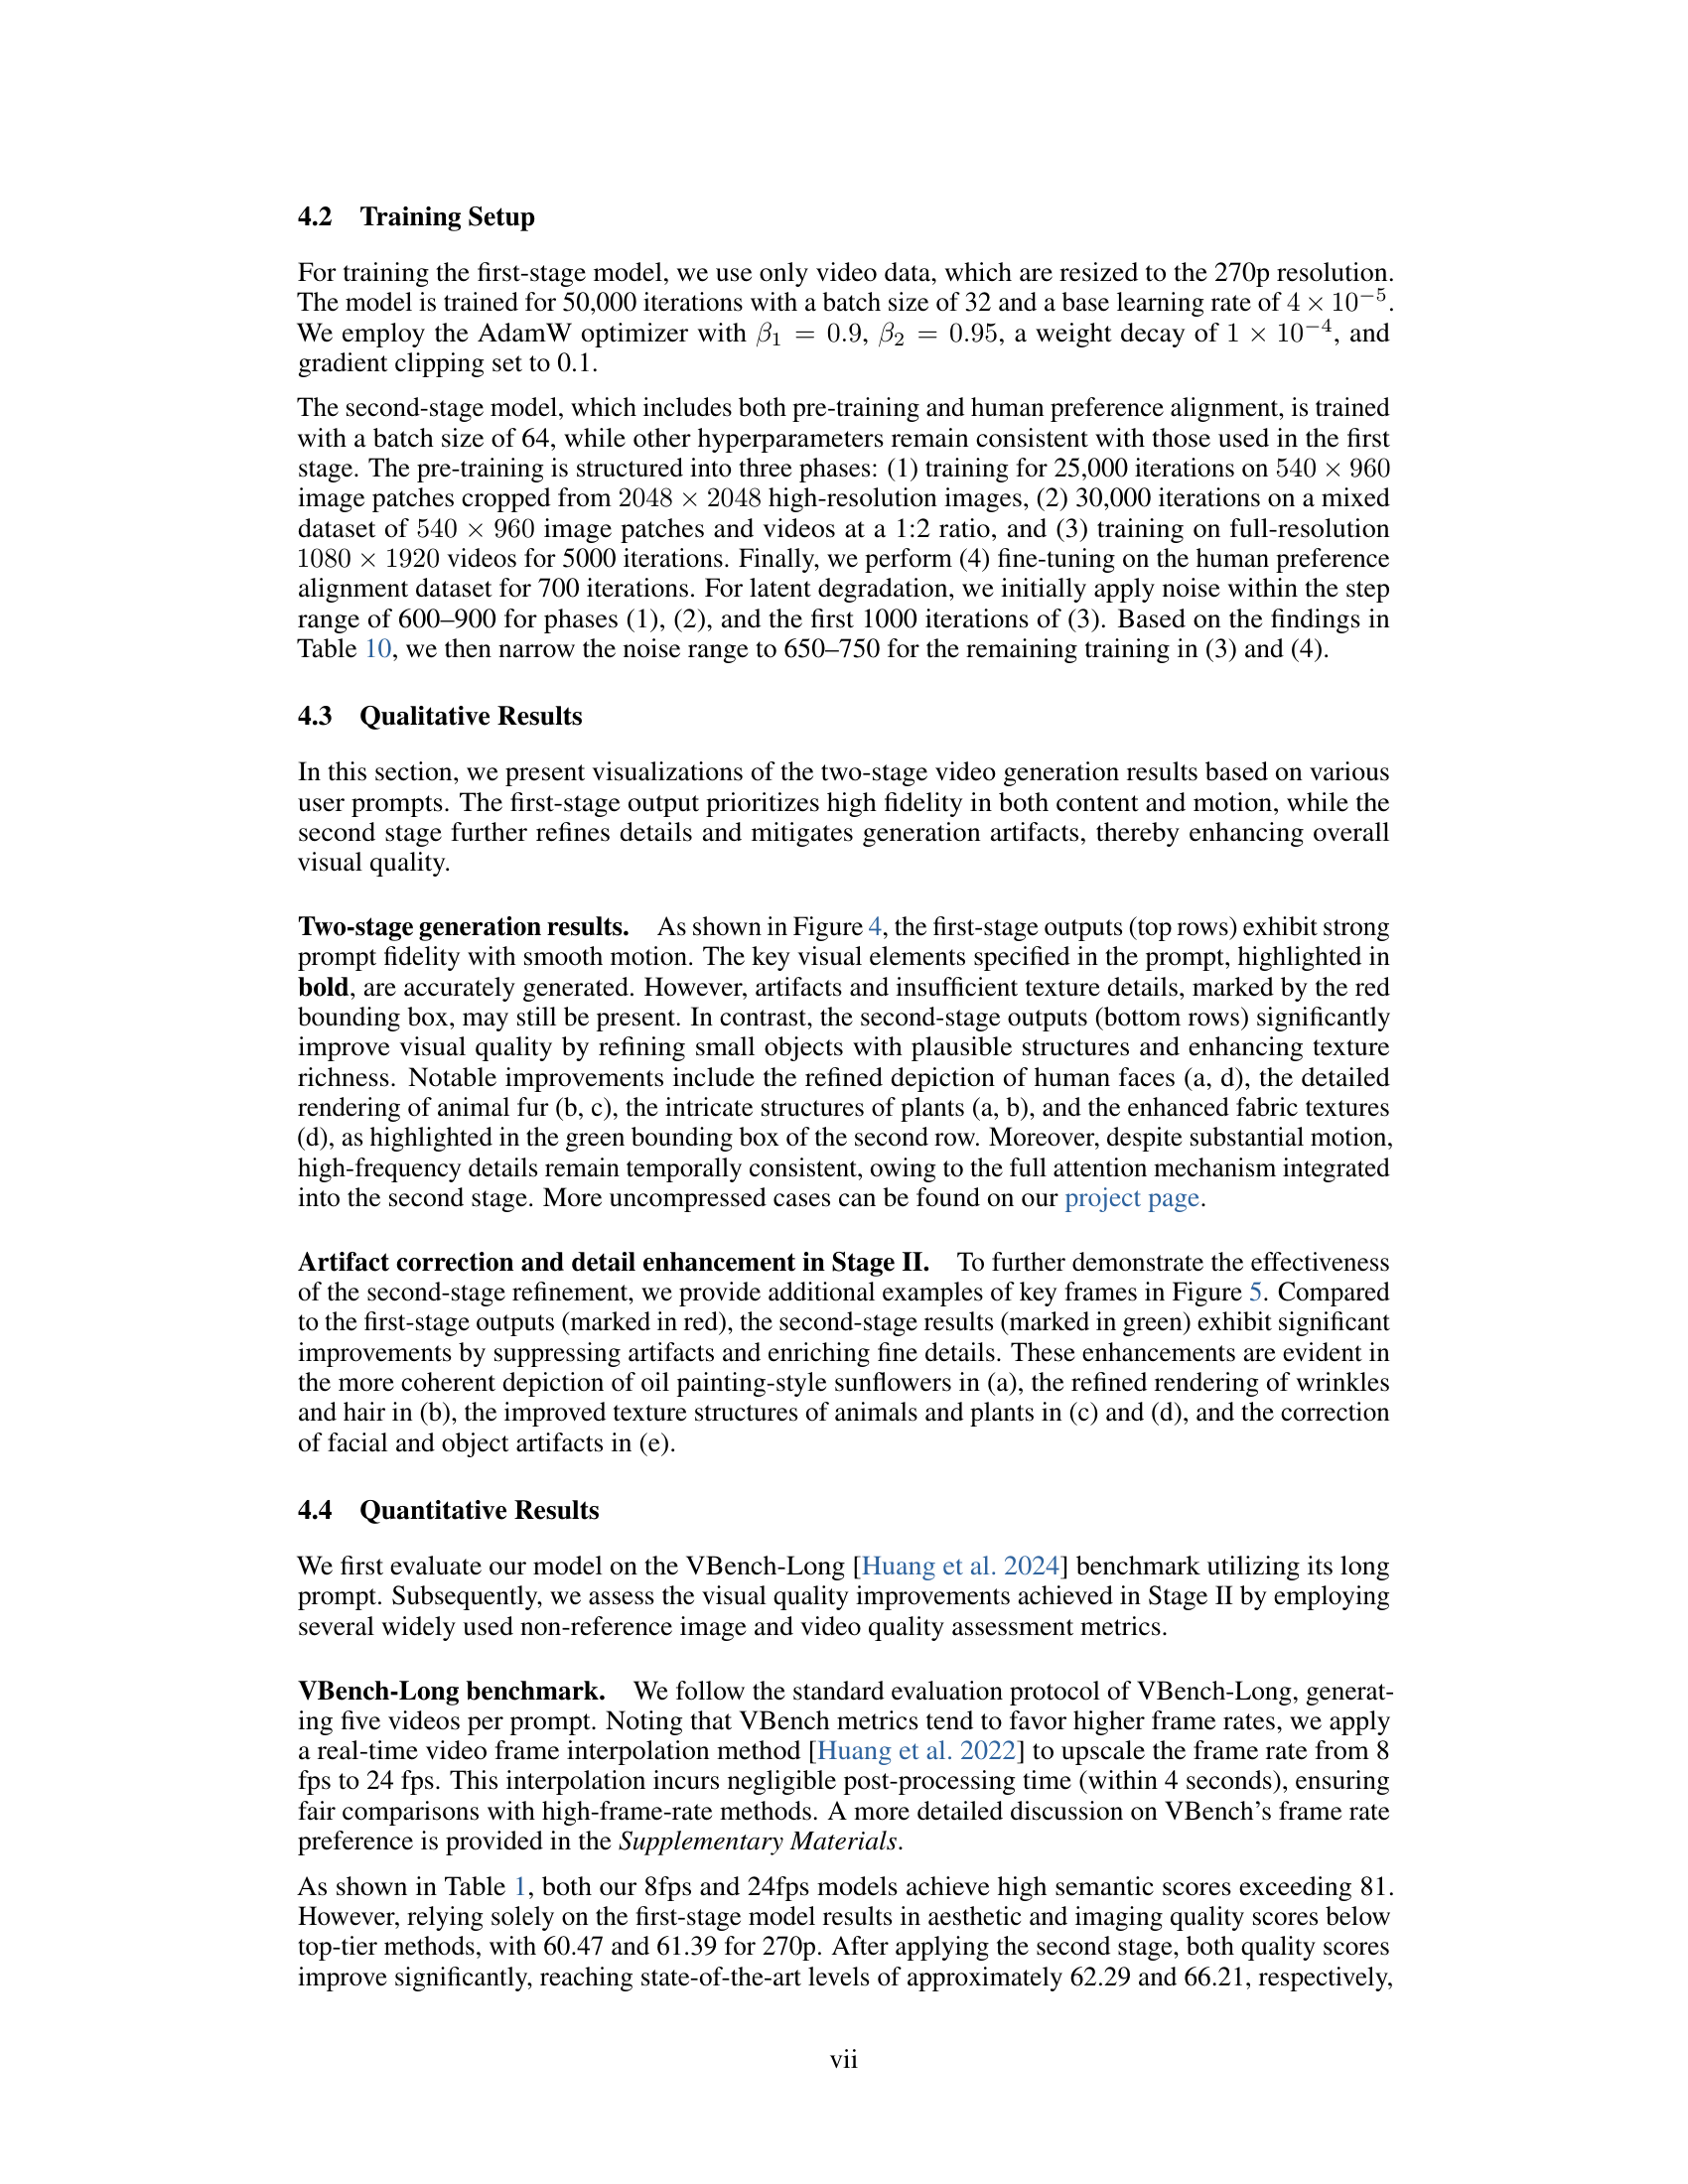
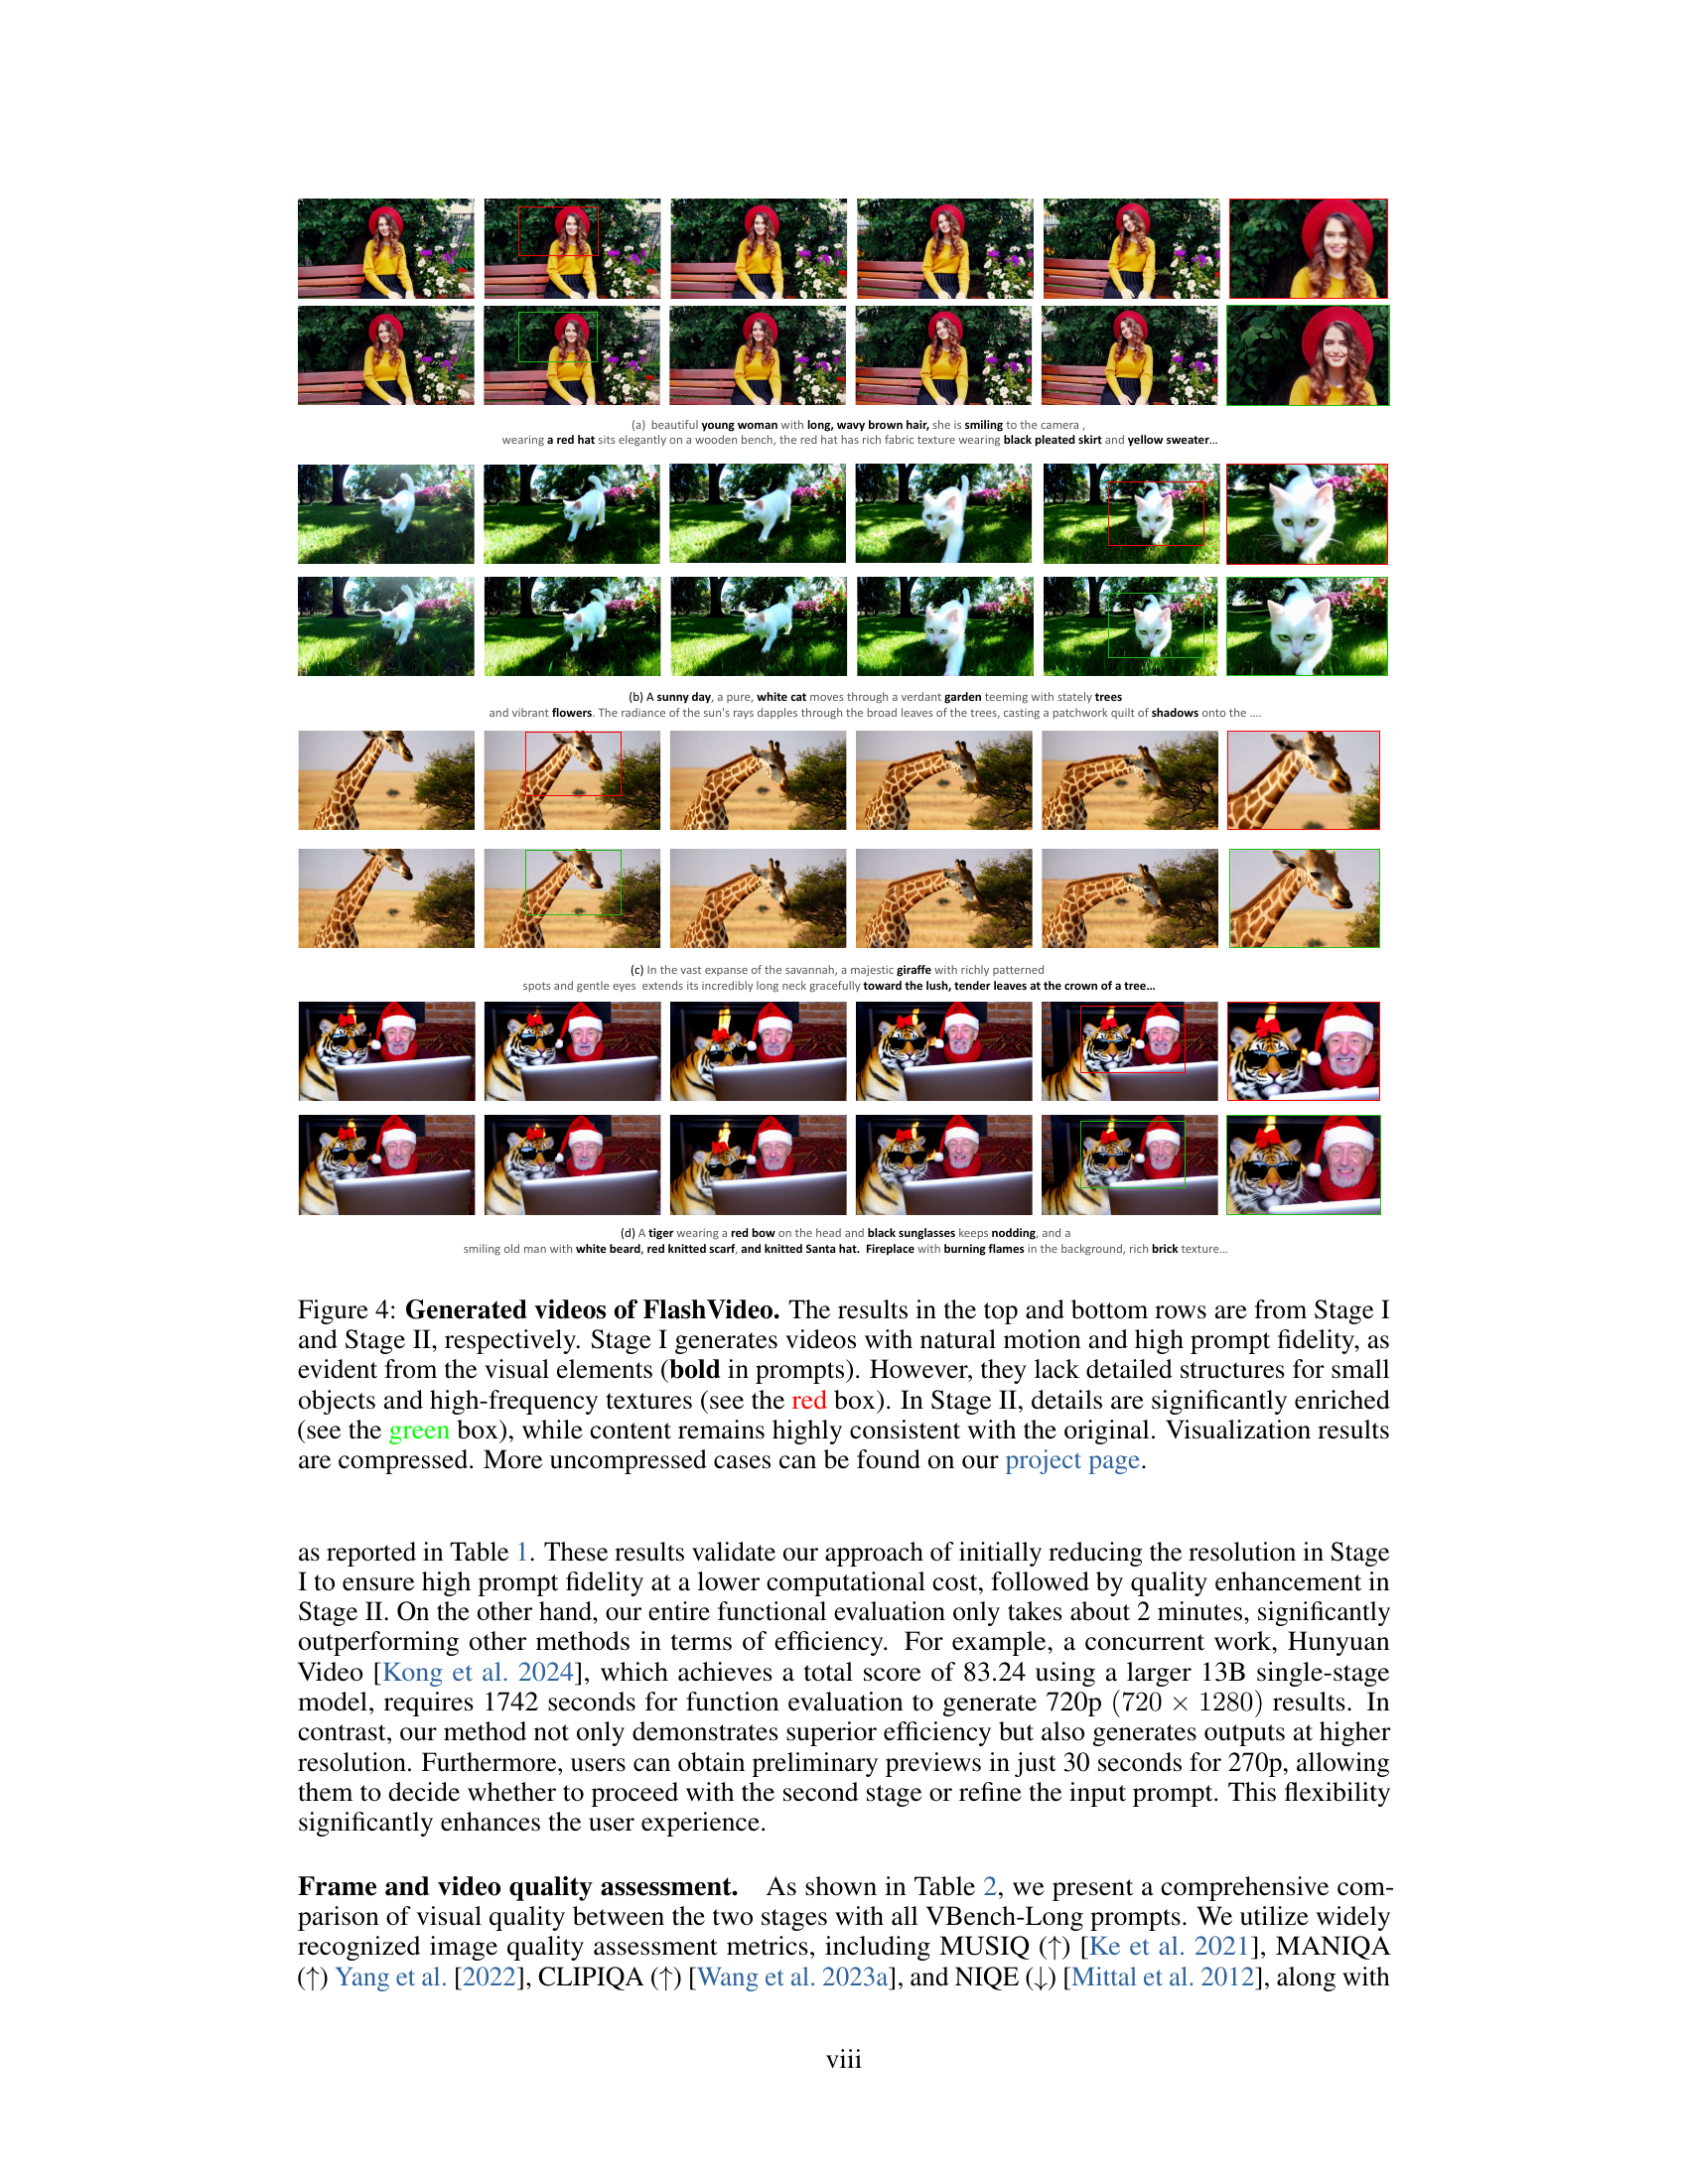
🔼 This figure showcases the two-stage video generation process of the FlashVideo model. The top row displays the output from Stage 1, which prioritizes accurate representation of the text prompt (shown in bold). While the videos exhibit natural motion and good overall fidelity, they lack fine details in smaller objects and high-frequency textures (highlighted by a red box). The bottom row shows the output from Stage 2, which refines the Stage 1 output. This stage significantly enhances the visual details (highlighted by a green box) while ensuring high consistency with the initial, prompt-focused output. Note that these are compressed visualizations; higher-resolution versions are available on the project’s GitHub page.
read the caption
Figure 4: Generated videos of FlashVideo. The results in the top and bottom rows are from Stage \Romannum1 and Stage \Romannum2, respectively. Stage \Romannum1 generates videos with natural motion and high prompt fidelity, as evident from the visual elements (bold in prompts). However, they lack detailed structures for small objects and high-frequency textures (see the red box). In Stage \Romannum2, details are significantly enriched (see the green box), while content remains highly consistent with the original. Visualization results are compressed. More uncompressed cases can be found on our project page.

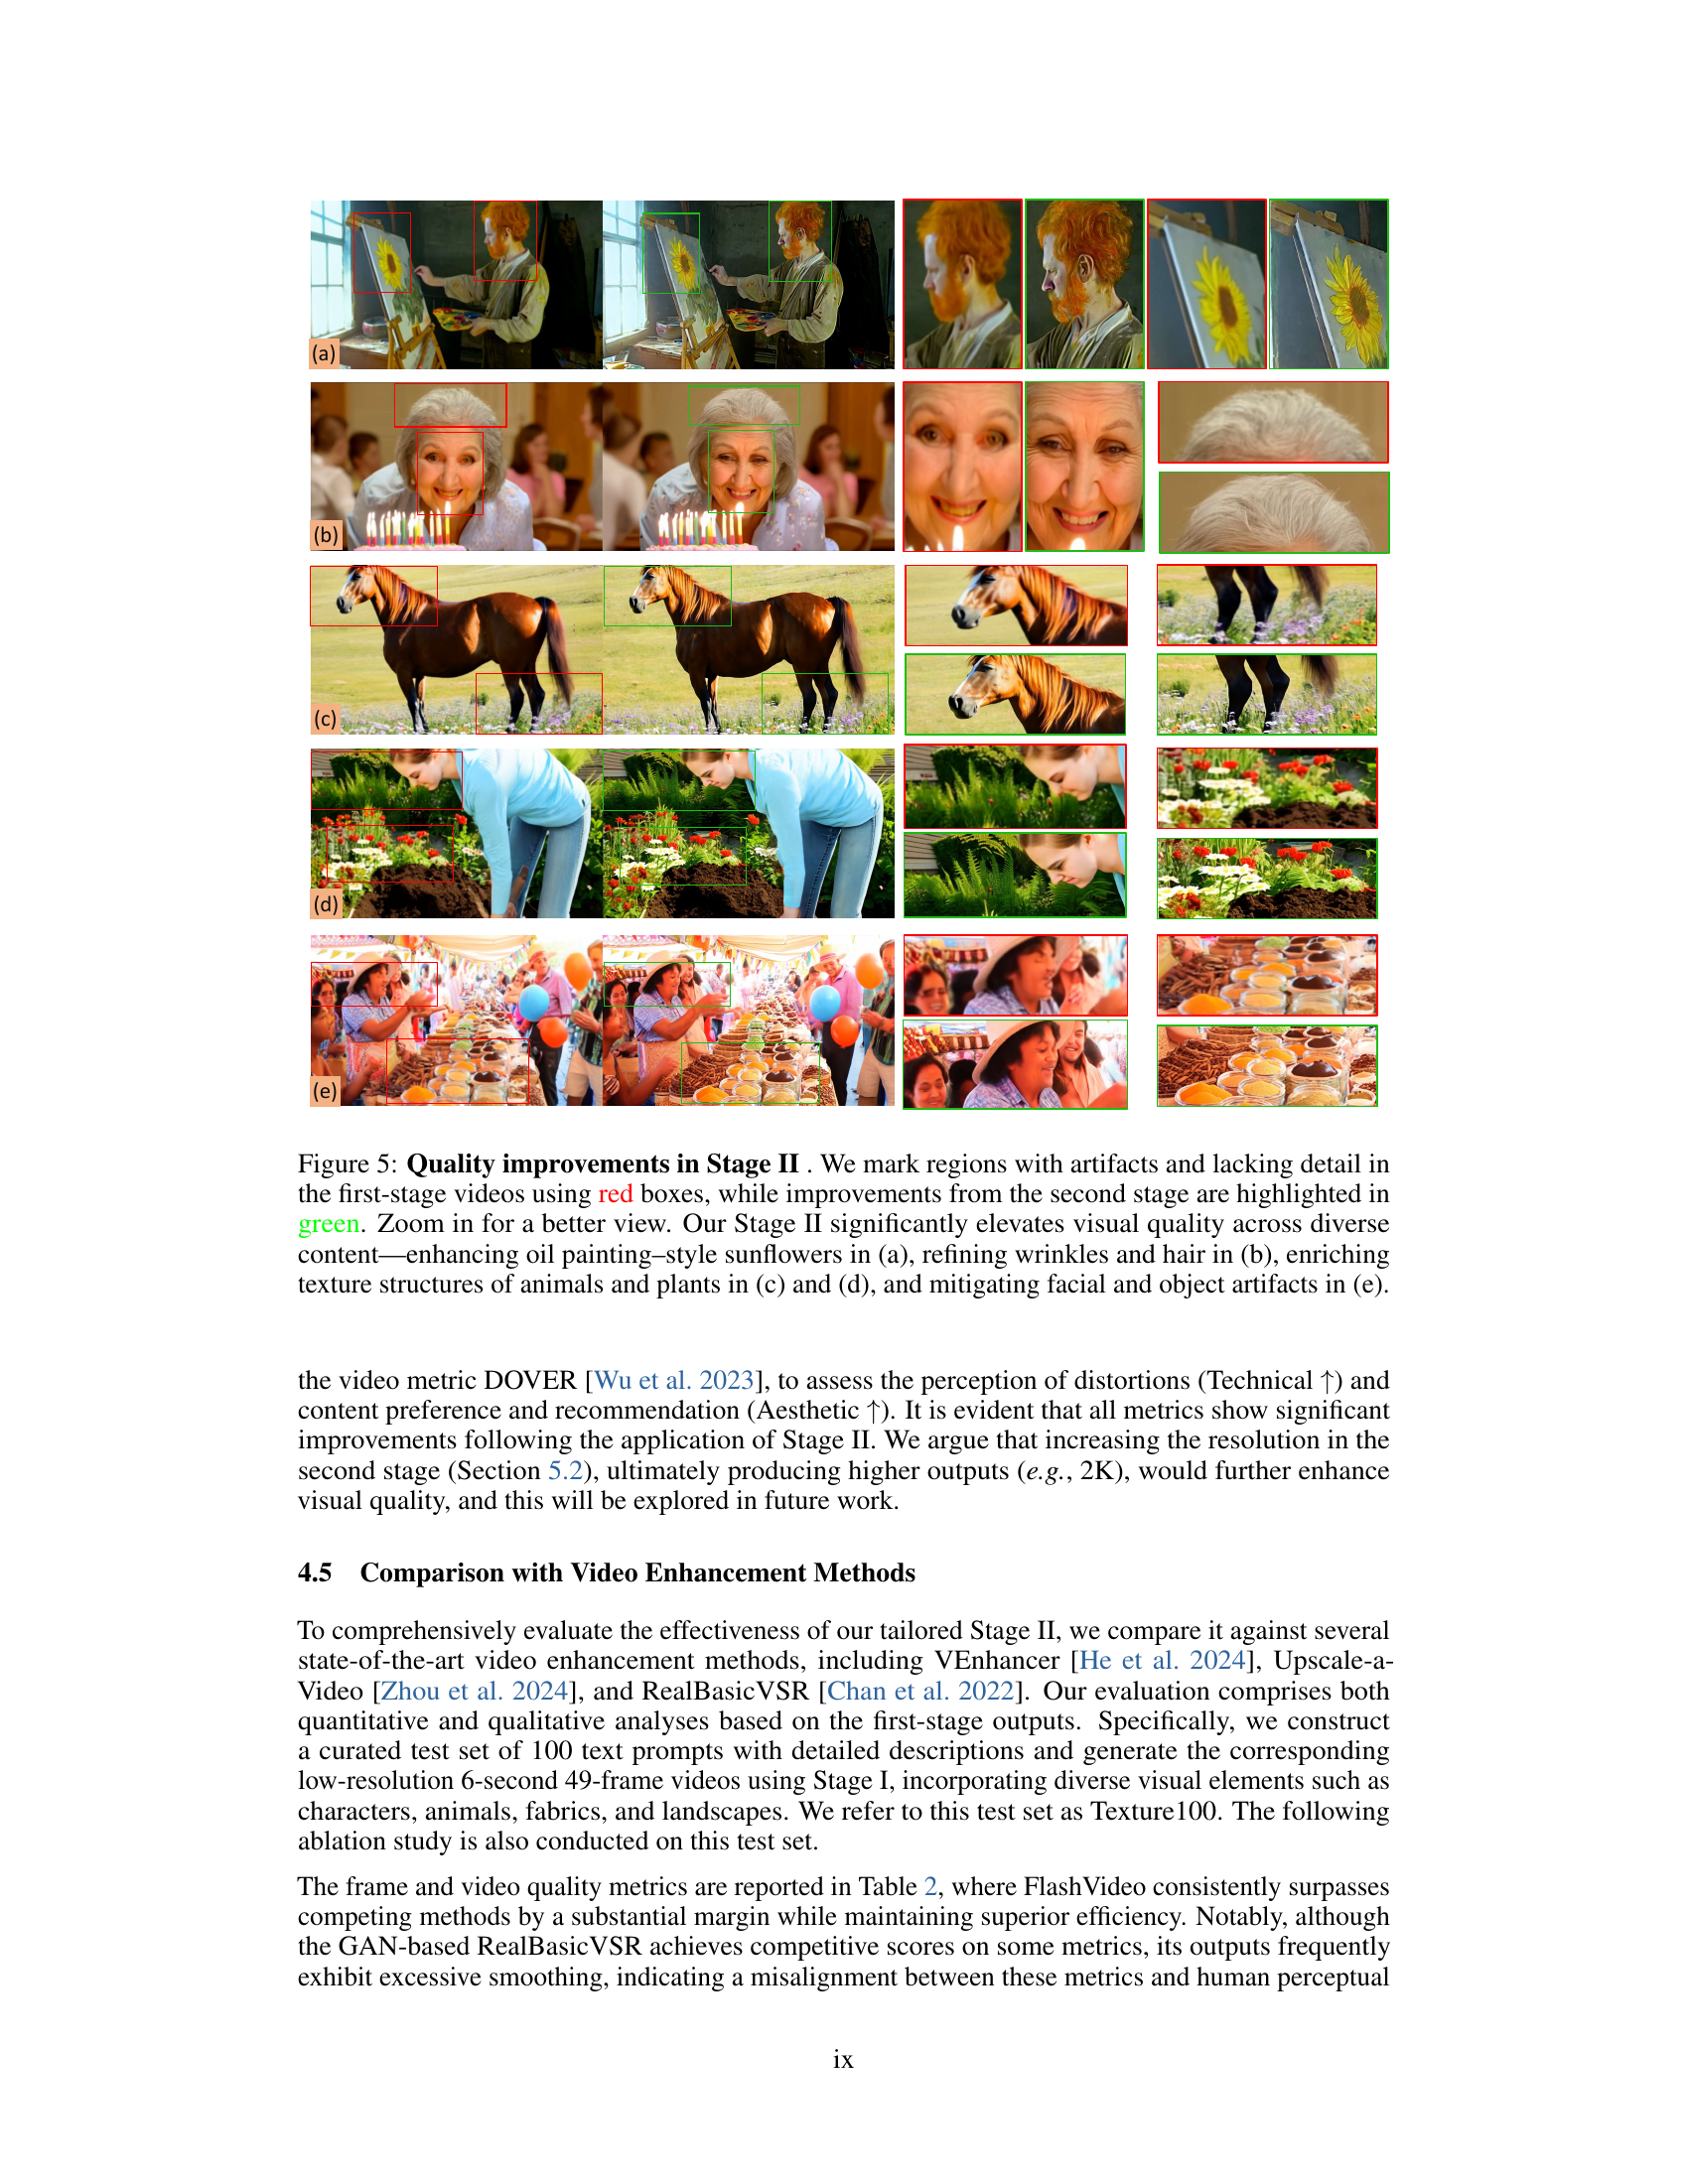
🔼 Figure 5 presents a visual comparison showcasing the improvements achieved by Stage II of the FlashVideo model. The left column displays the outputs of Stage I, highlighting areas with artifacts and missing details using red boxes. The right column shows the corresponding results after processing with Stage II, where enhanced regions are marked with green boxes. Specifically, the figure demonstrates improved visual quality through several examples: (a) enhanced detail and clarity in oil-painted sunflowers, (b) refined wrinkles and hair, (c) and (d) richer textures in animals and plants, and (e) correction of facial and object artifacts. The comparison visually emphasizes the enhancement in fine details and overall visual quality resulting from the two-stage process.
read the caption
Figure 5: Quality improvements in Stage \Romannum2 . We mark regions with artifacts and lacking detail in the first-stage videos using red boxes, while improvements from the second stage are highlighted in green. Zoom in for a better view. Our Stage \Romannum2 significantly elevates visual quality across diverse content—enhancing oil painting–style sunflowers in (a), refining wrinkles and hair in (b), enriching texture structures of animals and plants in (c) and (d), and mitigating facial and object artifacts in (e).

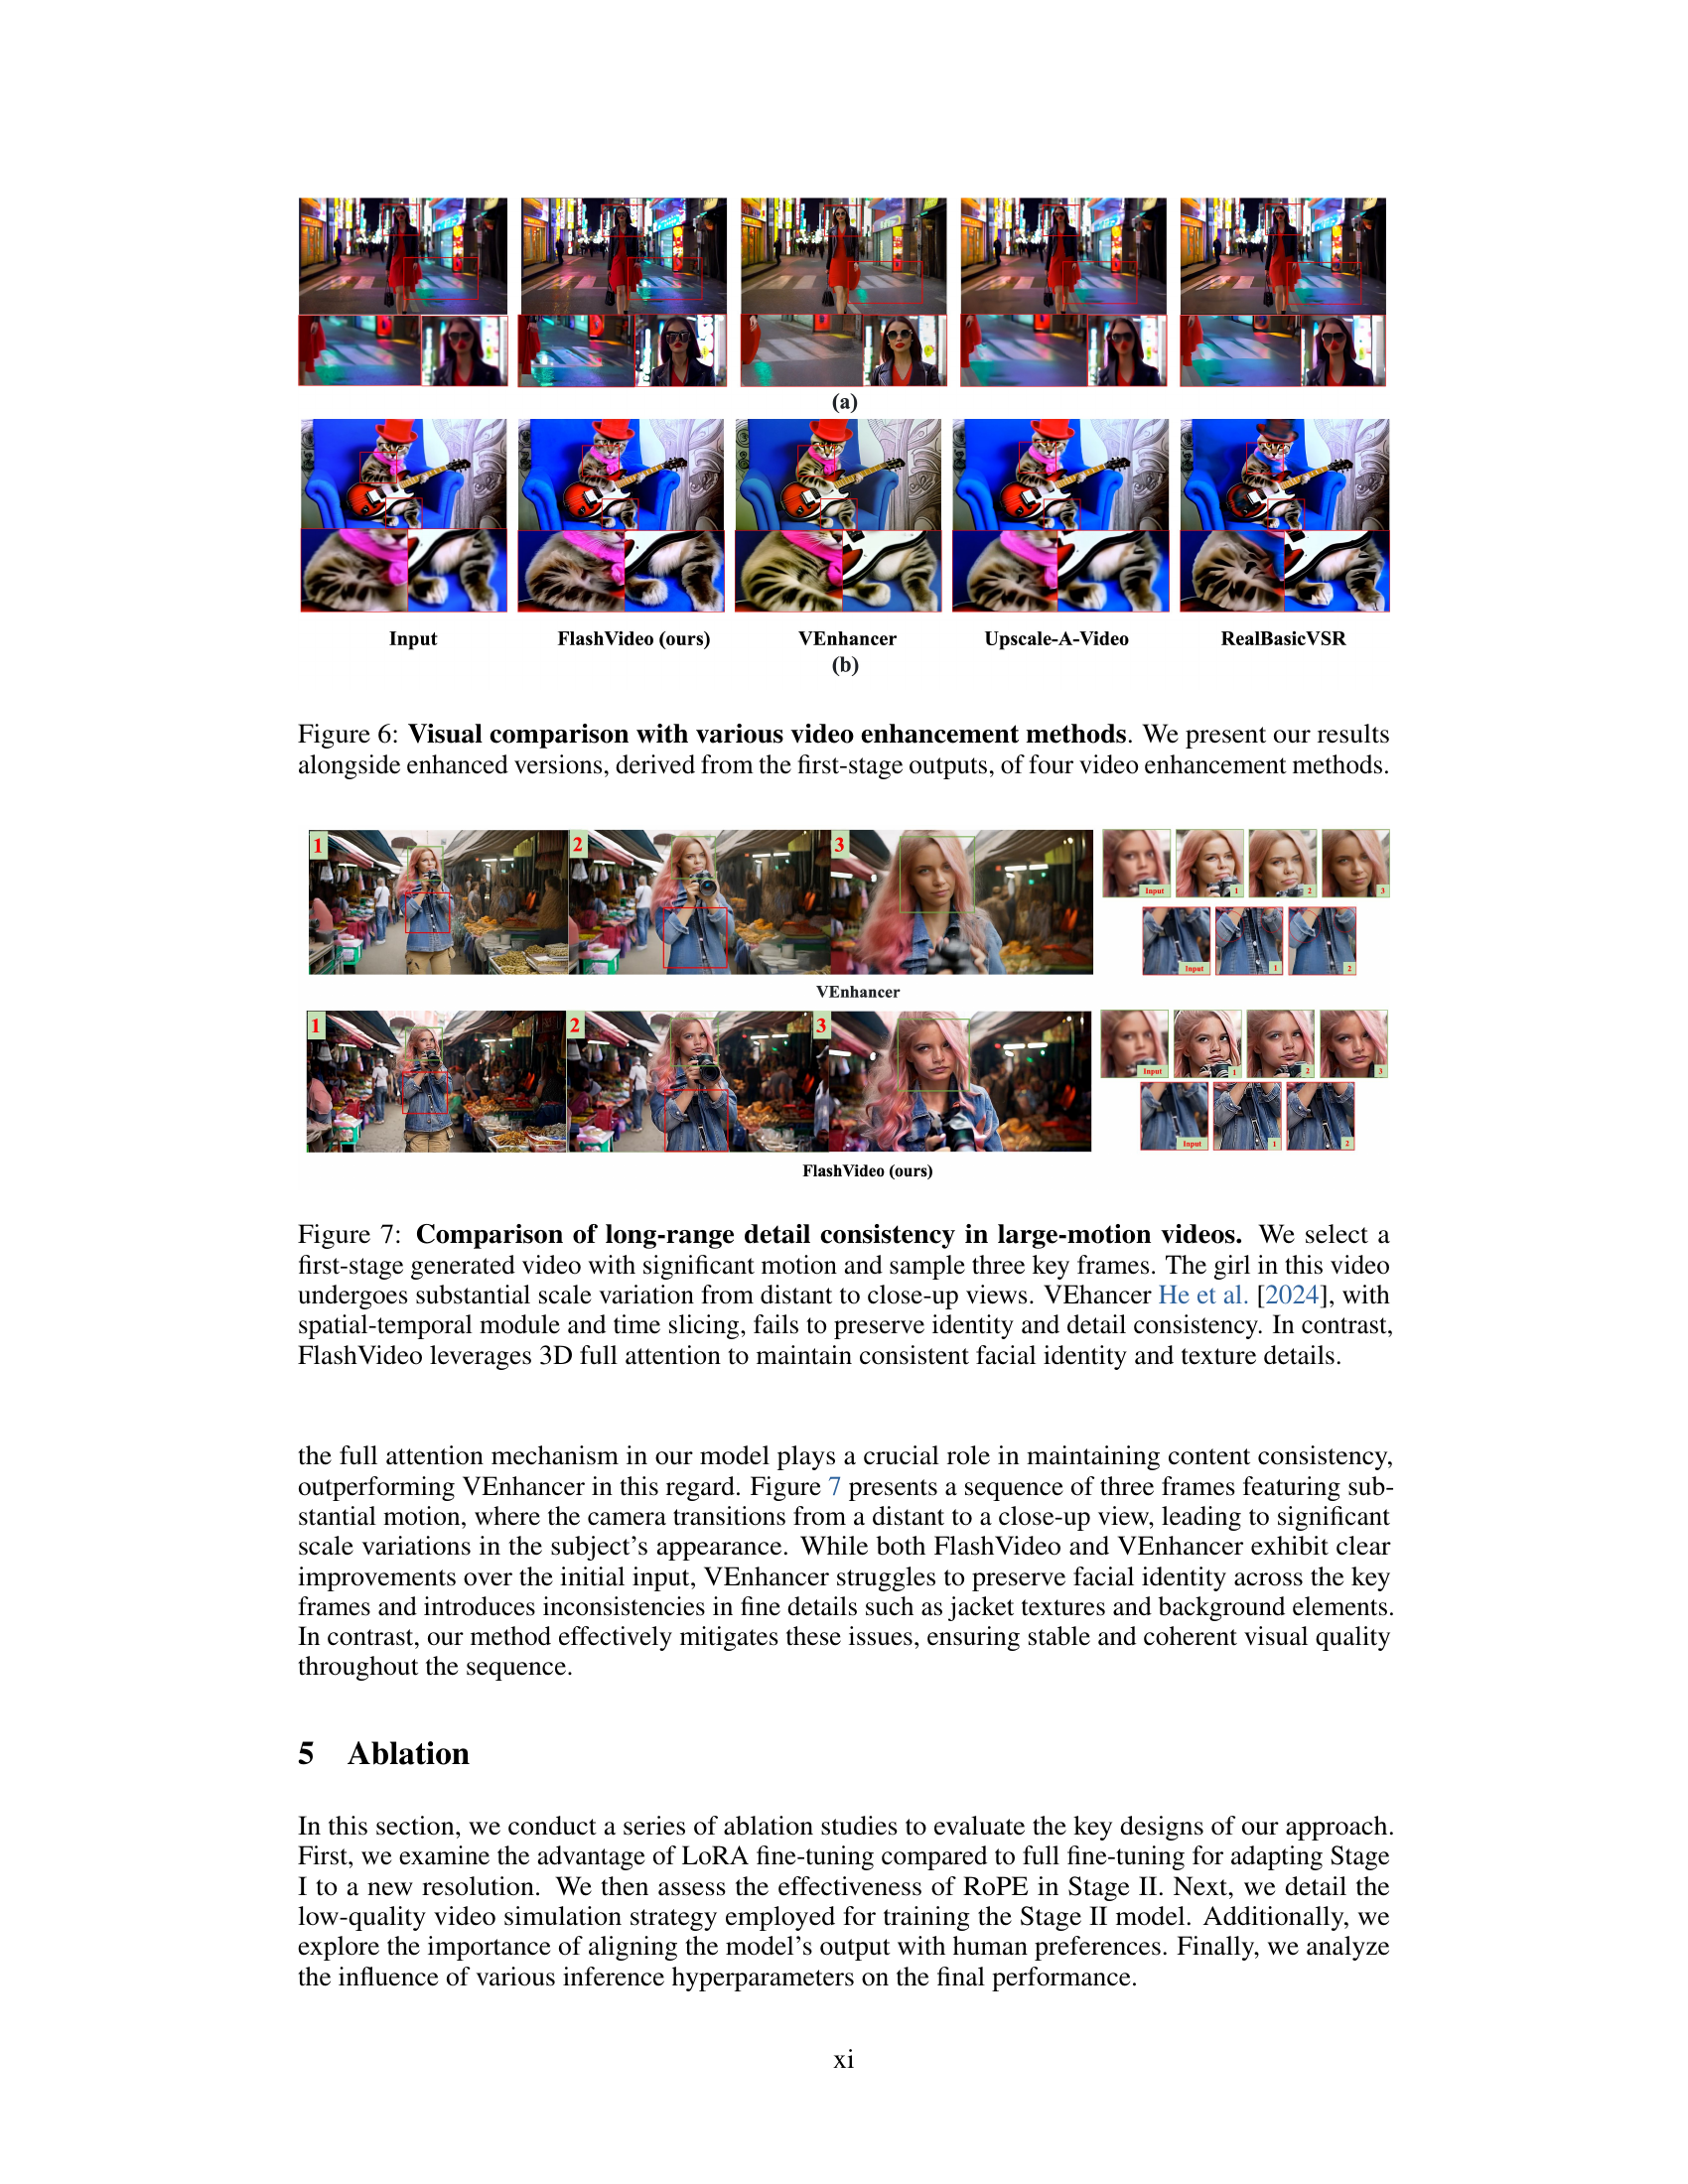
🔼 Figure 6 shows a comparison of FlashVideo’s high-resolution video generation results with those of four other state-of-the-art video enhancement methods. The comparison uses the low-resolution output from FlashVideo’s first stage as input to each of the other methods to highlight the relative performance gains of FlashVideo’s two-stage approach. The figure visually demonstrates the enhanced detail and overall visual quality achieved by FlashVideo compared to the other methods.
read the caption
Figure 6: Visual comparison with various video enhancement methods. We present our results alongside enhanced versions, derived from the first-stage outputs, of four video enhancement methods.
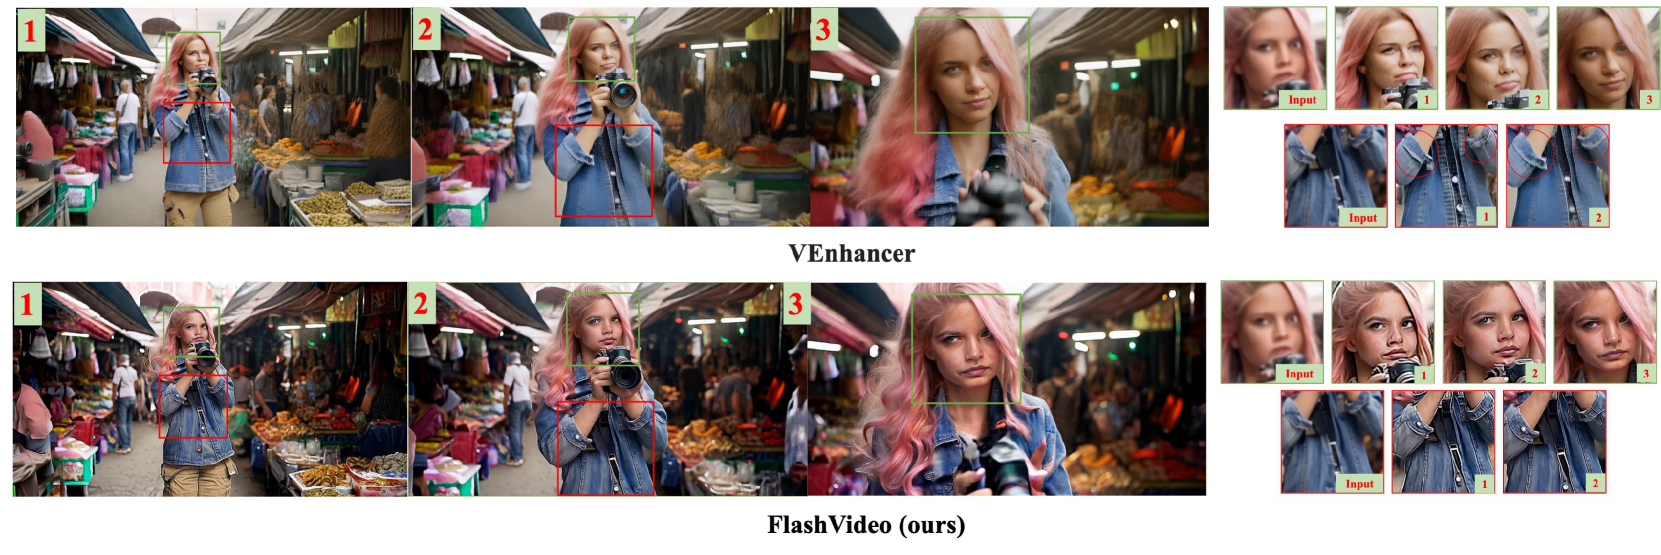
🔼 This figure compares the long-range detail consistency of two different video generation models in videos containing significant motion and substantial scale variation. Three key frames are extracted from a video generated by the first stage of the FlashVideo model, showcasing a girl whose size changes considerably from distant to close-up views. The comparison highlights that VEnhancer, using a spatial-temporal module and time slicing, struggles to maintain consistent facial identity and detail over these changes. In contrast, the FlashVideo model, which leverages 3D full attention, successfully preserves facial identity and texture details throughout.
read the caption
Figure 7: Comparison of long-range detail consistency in large-motion videos. We select a first-stage generated video with significant motion and sample three key frames. The girl in this video undergoes substantial scale variation from distant to close-up views. VEhancer He et al. [2024], with spatial-temporal module and time slicing, fails to preserve identity and detail consistency. In contrast, FlashVideo leverages 3D full attention to maintain consistent facial identity and texture details.

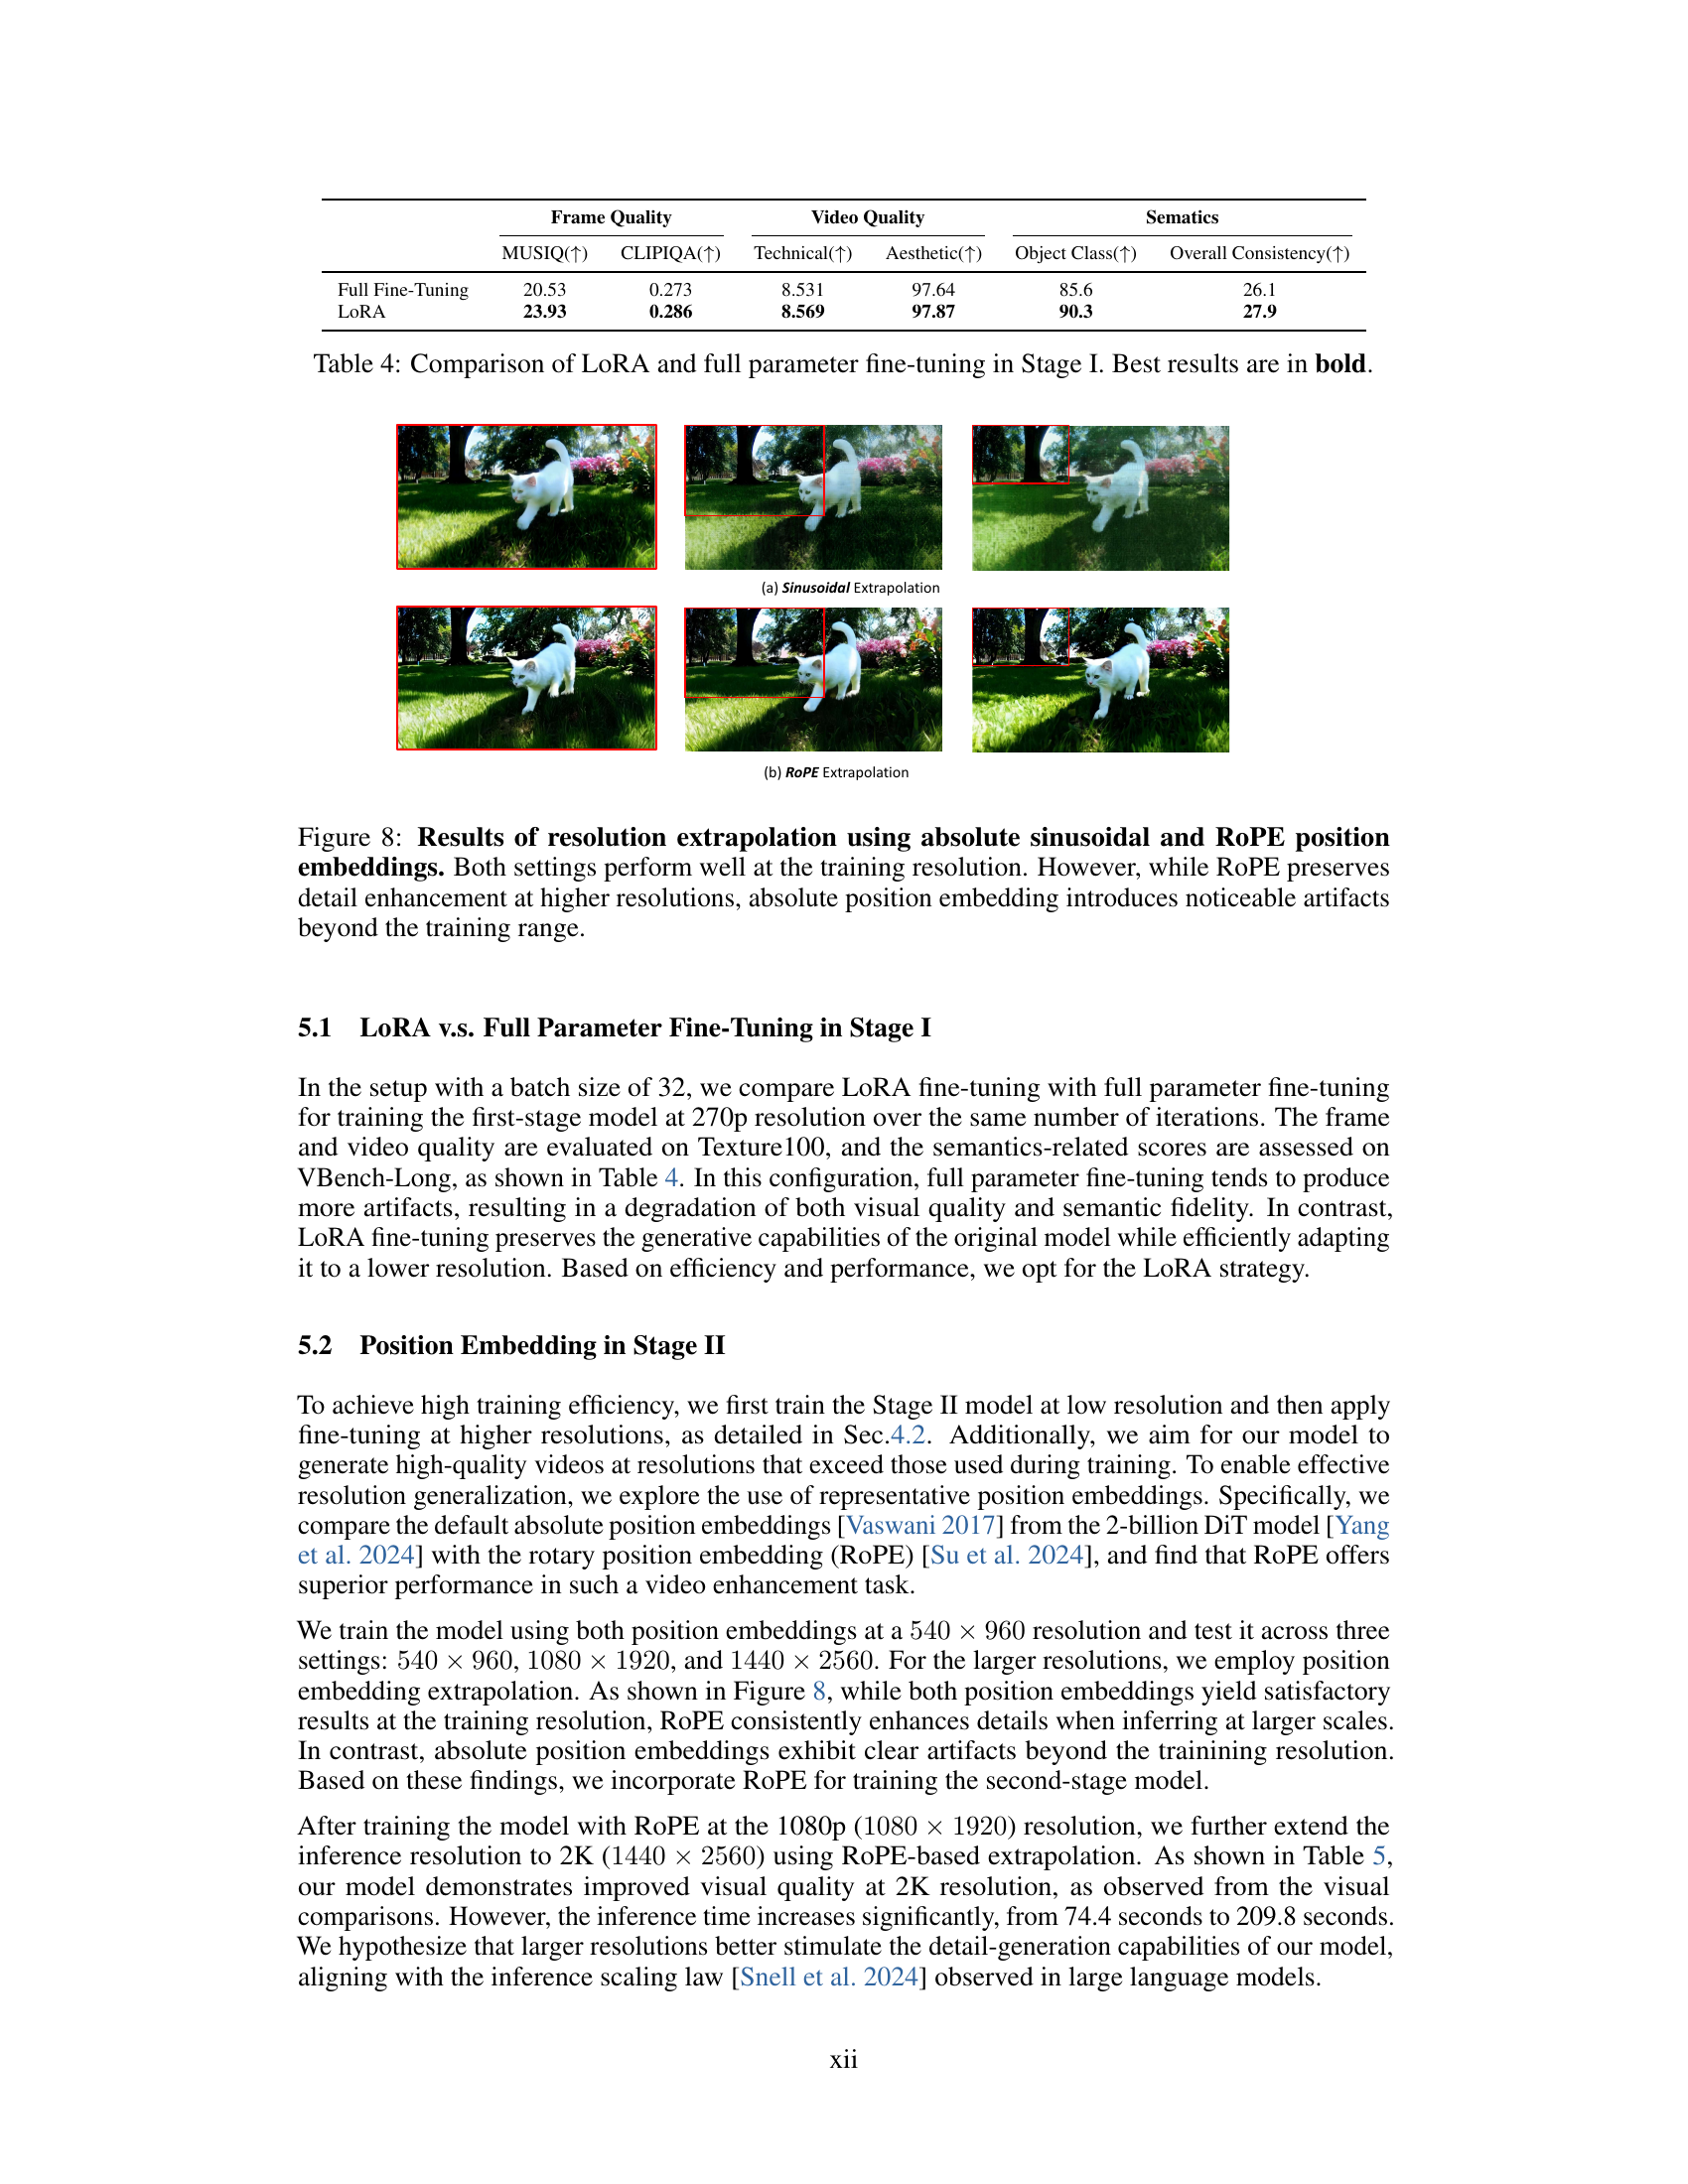
🔼 This figure compares the performance of two different positional encoding methods, absolute sinusoidal positional embedding and Rotary Position Embedding (RoPE), in handling resolution extrapolation in a diffusion model for video generation. Both methods perform well within the training resolution. However, when the model is asked to generate videos at resolutions beyond those it was trained on, absolute sinusoidal positional embedding produces noticeable artifacts, while RoPE maintains the quality of detail enhancement. This demonstrates RoPE’s robustness in handling unseen resolutions.
read the caption
Figure 8: Results of resolution extrapolation using absolute sinusoidal and RoPE position embeddings. Both settings perform well at the training resolution. However, while RoPE preserves detail enhancement at higher resolutions, absolute position embedding introduces noticeable artifacts beyond the training range.

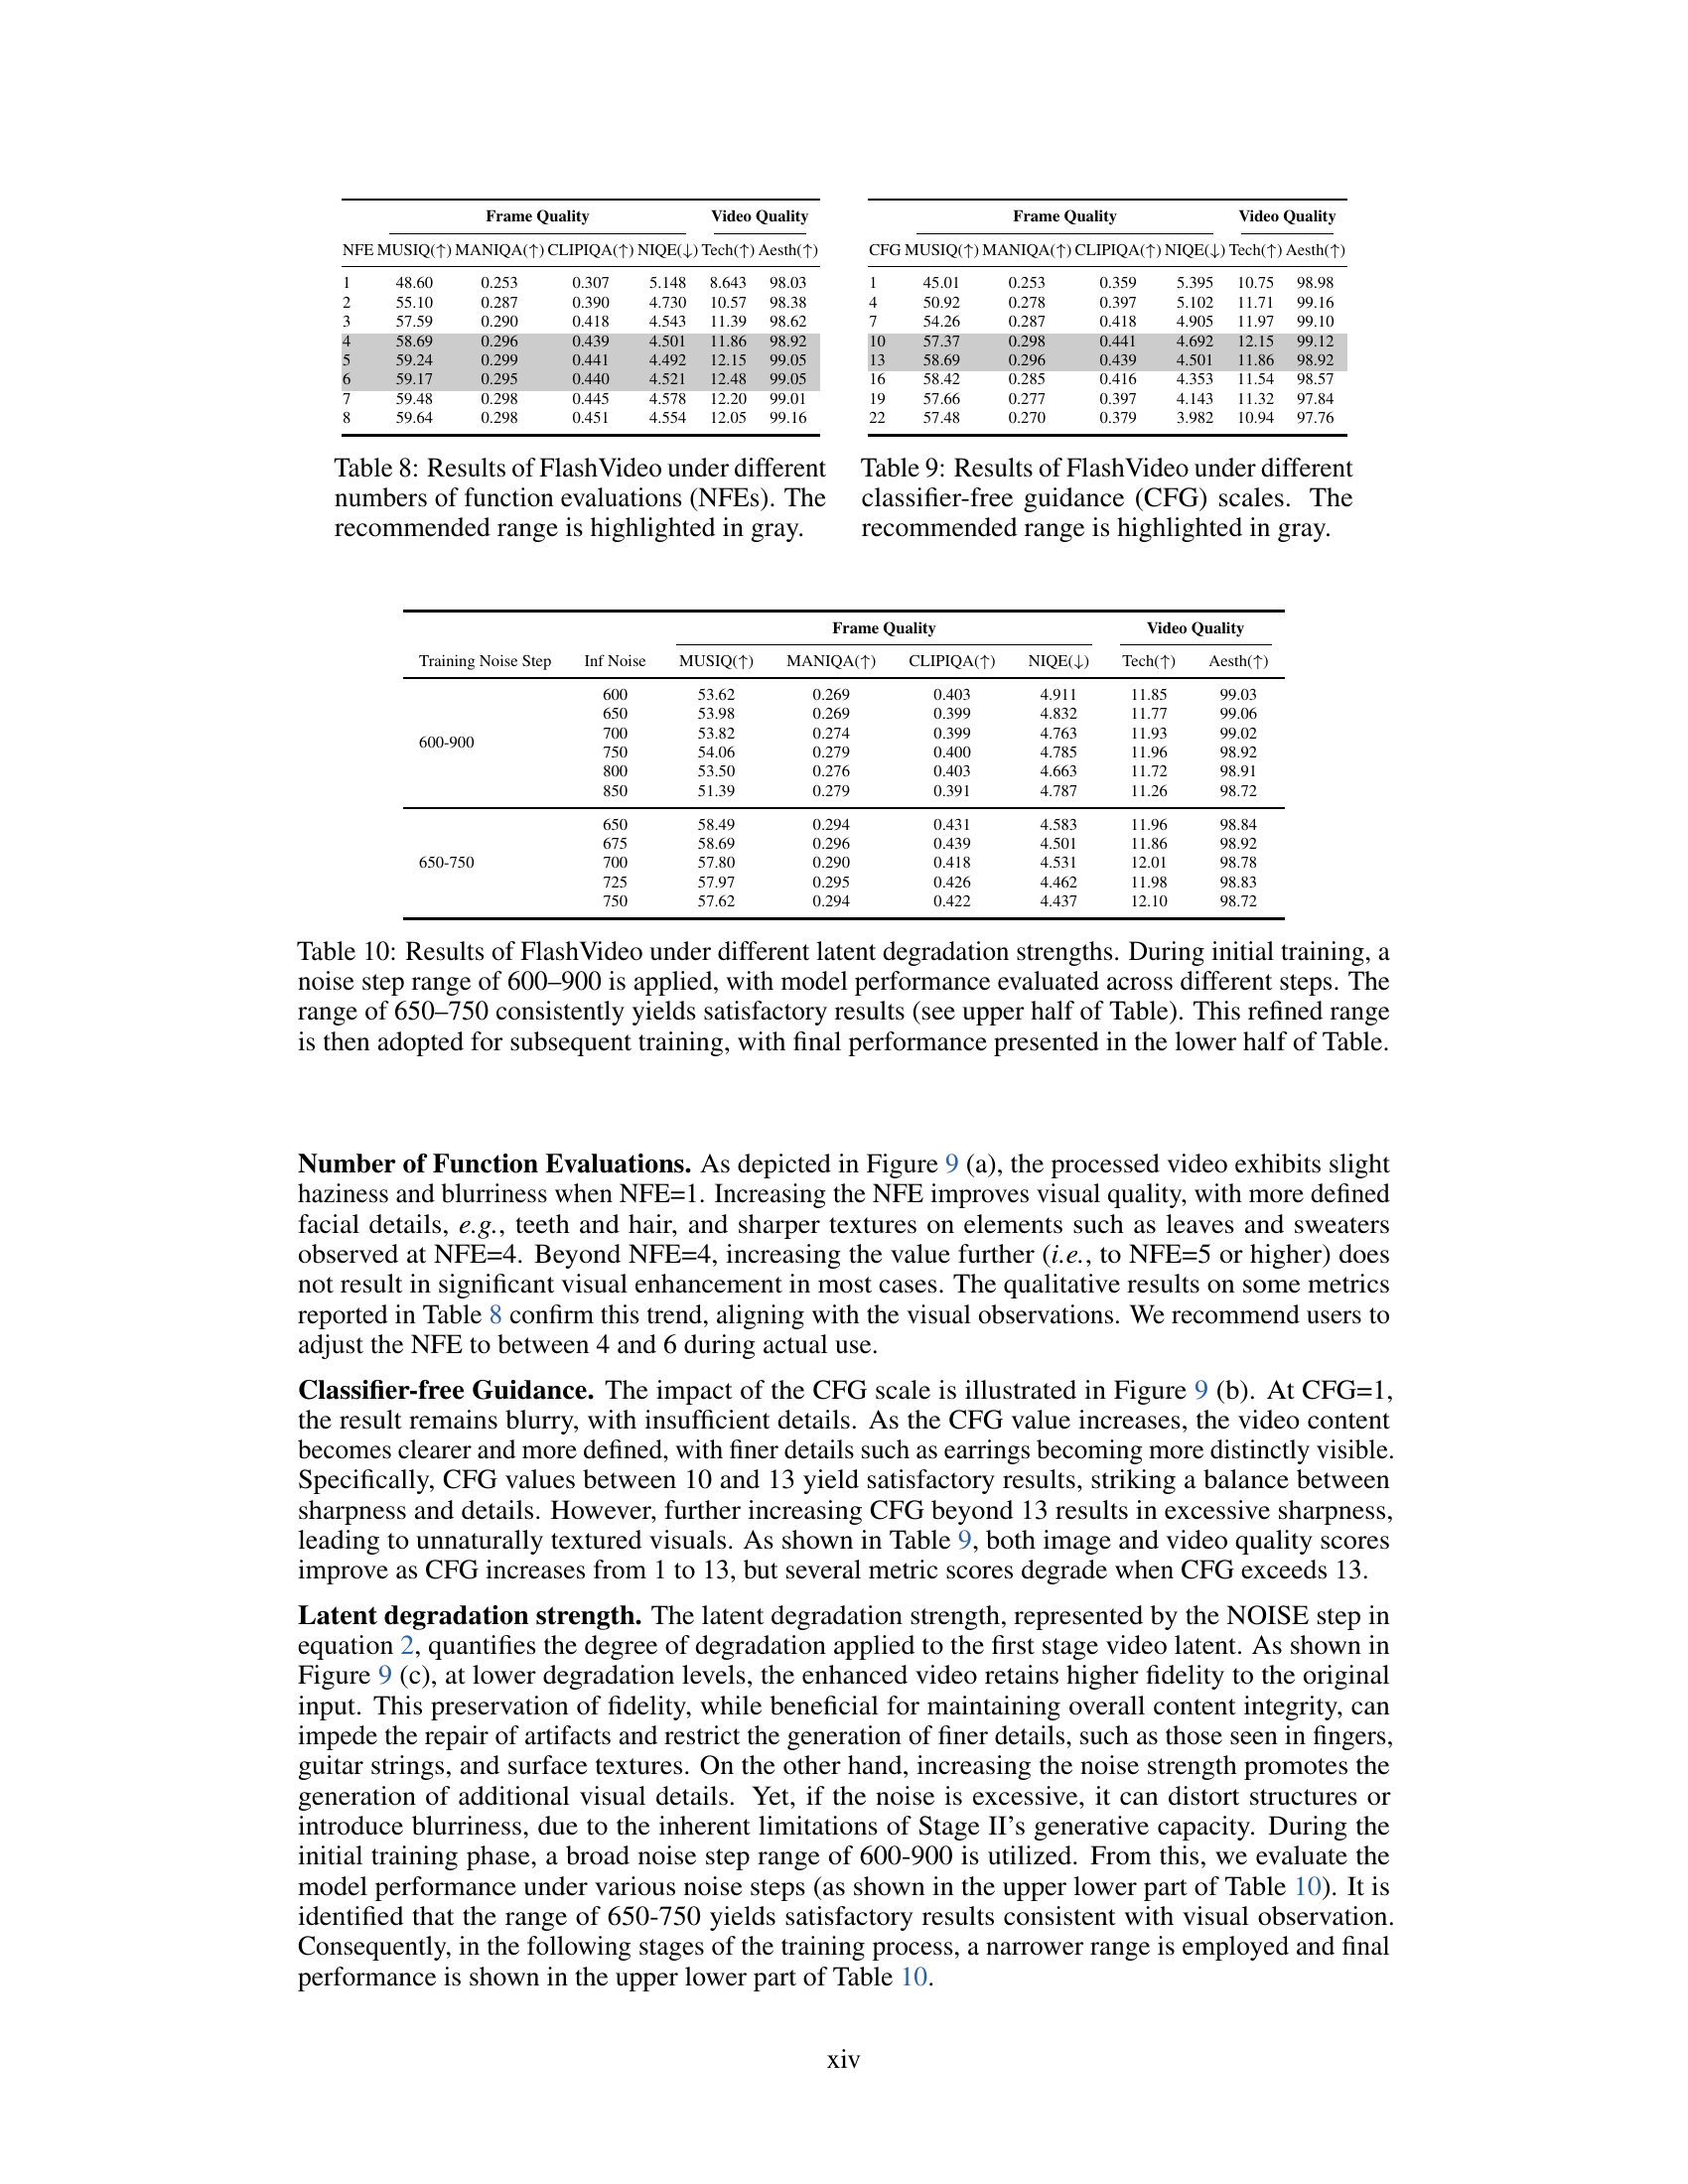
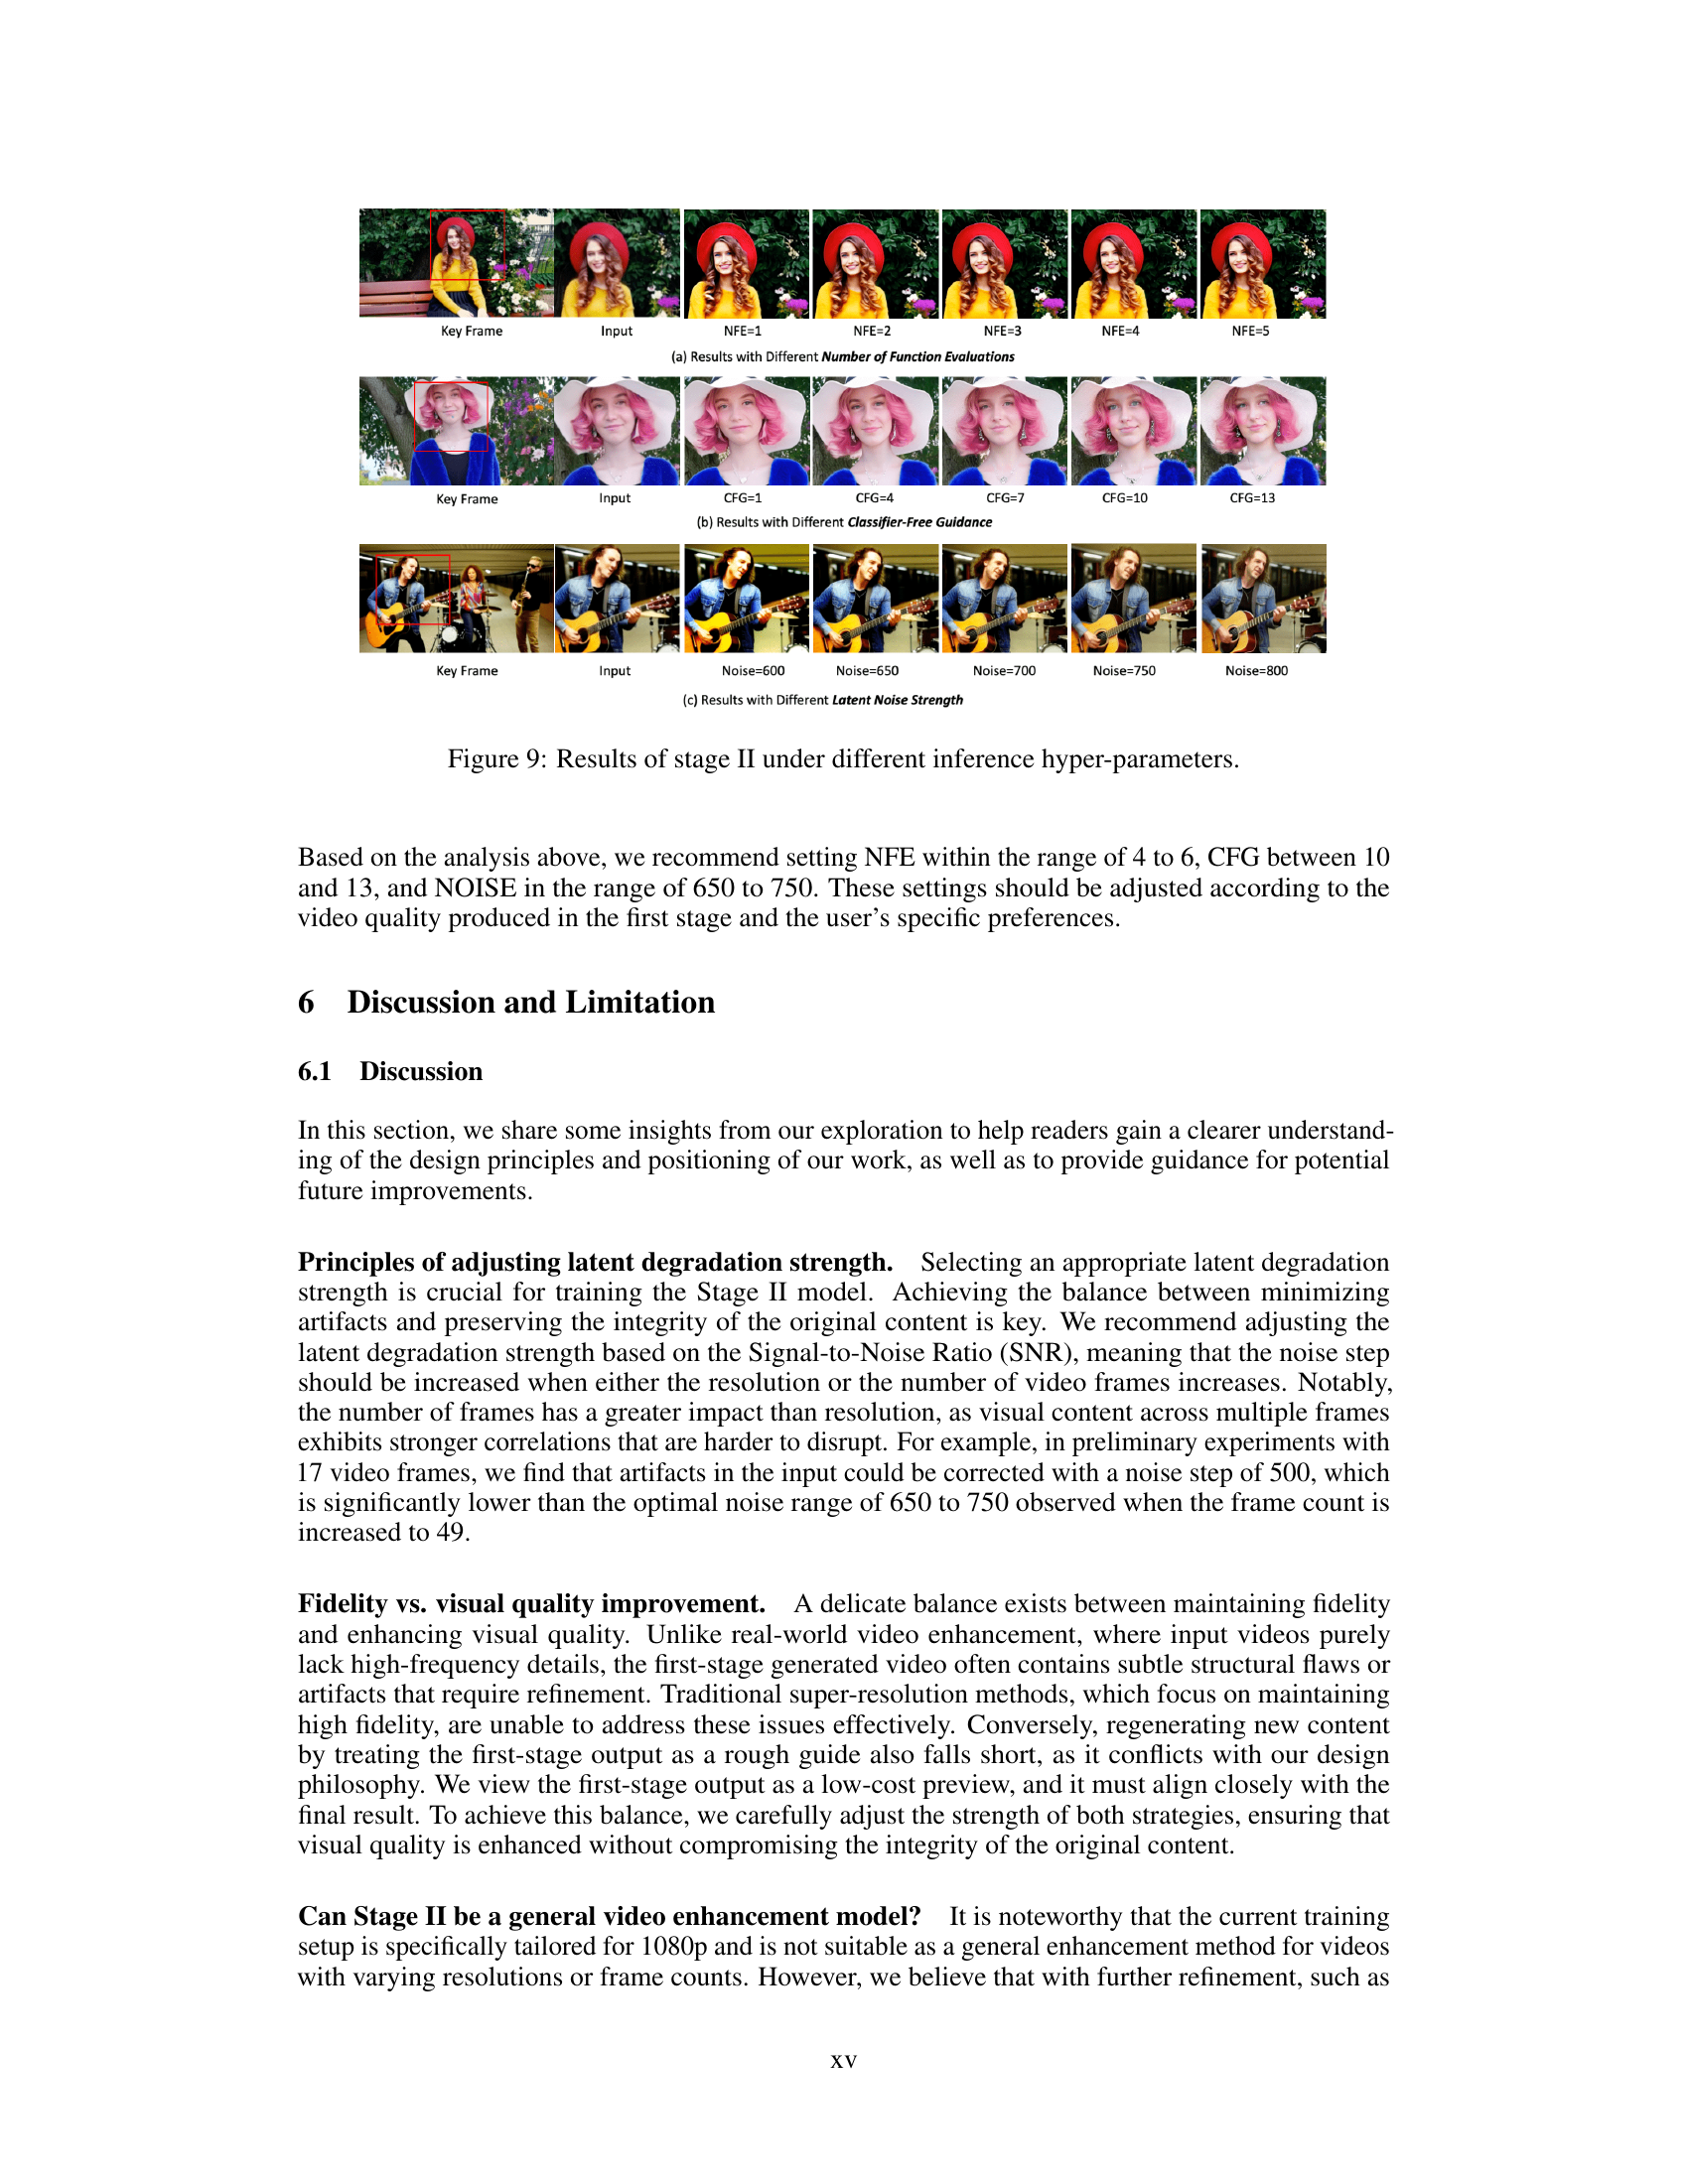
🔼 This table presents the results of the FlashVideo model when varying the number of function evaluations (NFEs). The NFEs represent the number of iterative denoising steps in the diffusion model. The table shows how different numbers of NFEs impact the quality of the generated videos, measured using various metrics such as MUSIQ, MANIQA, CLIPIQA, and NIQE. The gray highlighted range indicates the recommended number of NFEs for optimal video quality and computational efficiency. The results show a balance between improving video quality and keeping the computation cost reasonable, since very high NFEs lead to high quality but are computationally expensive.
read the caption
Table 8: Results of FlashVideo under different numbers of function evaluations (NFEs). The recommended range is highlighted in gray.
More on tables
| Frame Quality | Video Quality | ||||||
| #NFE / Time | MUSIQ() | MANIQA() | CLIPIQA() | NIQE() | Technical() | Aesthetic() | |
| Stage \Romannum1 (270p) | 50 / 30.1s | 24.69 | 0.232 | 0.336 | 11.81 | 7.693 | 96.81 |
| Stage \Romannum2 (1080p) | 4 / 72.2s | 54.45 | 0.312 | 0.438 | 5.363 | 11.81 | 98.29 |
🔼 This table presents a quantitative comparison of the video quality generated by FlashVideo’s two-stage approach using the VBench-Long benchmark. It contrasts the quality metrics (MUSIQ, MANIQA, CLIPIQA, NIQE, Technical, Aesthetic) of the low-resolution outputs from Stage I against the high-resolution outputs from Stage II. The results show the improvements achieved in video quality in the second stage while also highlighting the difference in computational cost (number of function evaluations (NFEs) and time taken) between stages. Bold values indicate the best performance in each metric.
read the caption
Table 2: Comparison of frame quality and video quality between two stages with Vbench-Long prompts.The best results are emphasized in bold.
| Frame Quality | Video Quality | ||||||
| #NFE / Time | MUSIQ() | MANIQA() | CLIPIQA() | NIQE() | Technical() | Aesthetic() | |
| RealbasicVSR | 1 / 71.5s | 54.26 | 0.272 | 0.418 | 5.281 | 10.71 | 99.42 |
| Upscale-A-Video | 30 / 376.6s | 23.67 | 0.201 | 0.285 | 12.02 | 7.690 | 97.61 |
| VEnhancer | 30 / 549.2s | 51.69 | 0.280 | 0.385 | 5.330 | 11.63 | 98.39 |
| FlashVideo (Ours) | 4 / 72.2s | 58.69 | 0.296 | 0.439 | 4.501 | 11.86 | 98.92 |
🔼 This table presents a quantitative comparison of the visual quality improvements achieved by different video enhancement methods applied to the first-stage outputs. Specifically, it shows the results of applying several state-of-the-art video enhancement methods, including VEnhancer, Upscale-a-Video, and RealBasicVSR, to videos generated by Stage I of the FlashVideo model. Multiple metrics are used to assess both frame-level quality (MUSIQ, MANIQA, CLIPIQA, and NIQE) and overall video quality (Technical and Aesthetic scores from DOVER). The table highlights the best and second-best performing methods for each metric, allowing for a direct comparison of the effectiveness of different enhancement approaches in improving various aspects of video quality.
read the caption
Table 3: Frame and video quality across various video enhancement methods. The best results are highlighted in bold and the second-best in underline.
| Frame Quality | Video Quality | Sematics | ||||
| MUSIQ() | CLIPIQA() | Technical() | Aesthetic() | Object Class() | Overall Consistency() | |
| Full Fine-Tuning | 20.53 | 0.273 | 8.531 | 97.64 | 85.6 | 26.1 |
| LoRA | 23.93 | 0.286 | 8.569 | 97.87 | 90.3 | 27.9 |
🔼 This table presents a comparison of two different fine-tuning methods for a low-resolution stage of a video generation model. It compares LoRA (Low-Rank Adaptation) and full parameter fine-tuning in terms of their impact on frame quality metrics (MUSIQ, CLIPIQA), video quality metrics (Technical, Aesthetic), and semantic scores (Object Class, Overall Consistency). The results show the effectiveness of LoRA compared to full parameter fine-tuning, particularly in terms of achieving higher quality results while maintaining efficiency.
read the caption
Table 4: Comparison of LoRA and full parameter fine-tuning in Stage \Romannum1. Best results are in bold.
| Frame Quality | Video Quality | ||||||
| #NFE / Time | MUSIQ() | MANIQA() | CLIPIQA() | NIQE() | Technical() | Aesthetic() | |
| FlashVideo-1080p | 4 / 72.2s | 58.69 | 0.296 | 0.439 | 4.501 | 11.86 | 98.92 |
| FlashVideo-2K | 4 / 209.8s | 62.40 | 0.354 | 0.497 | 4.463 | 12.25 | 99.20 |
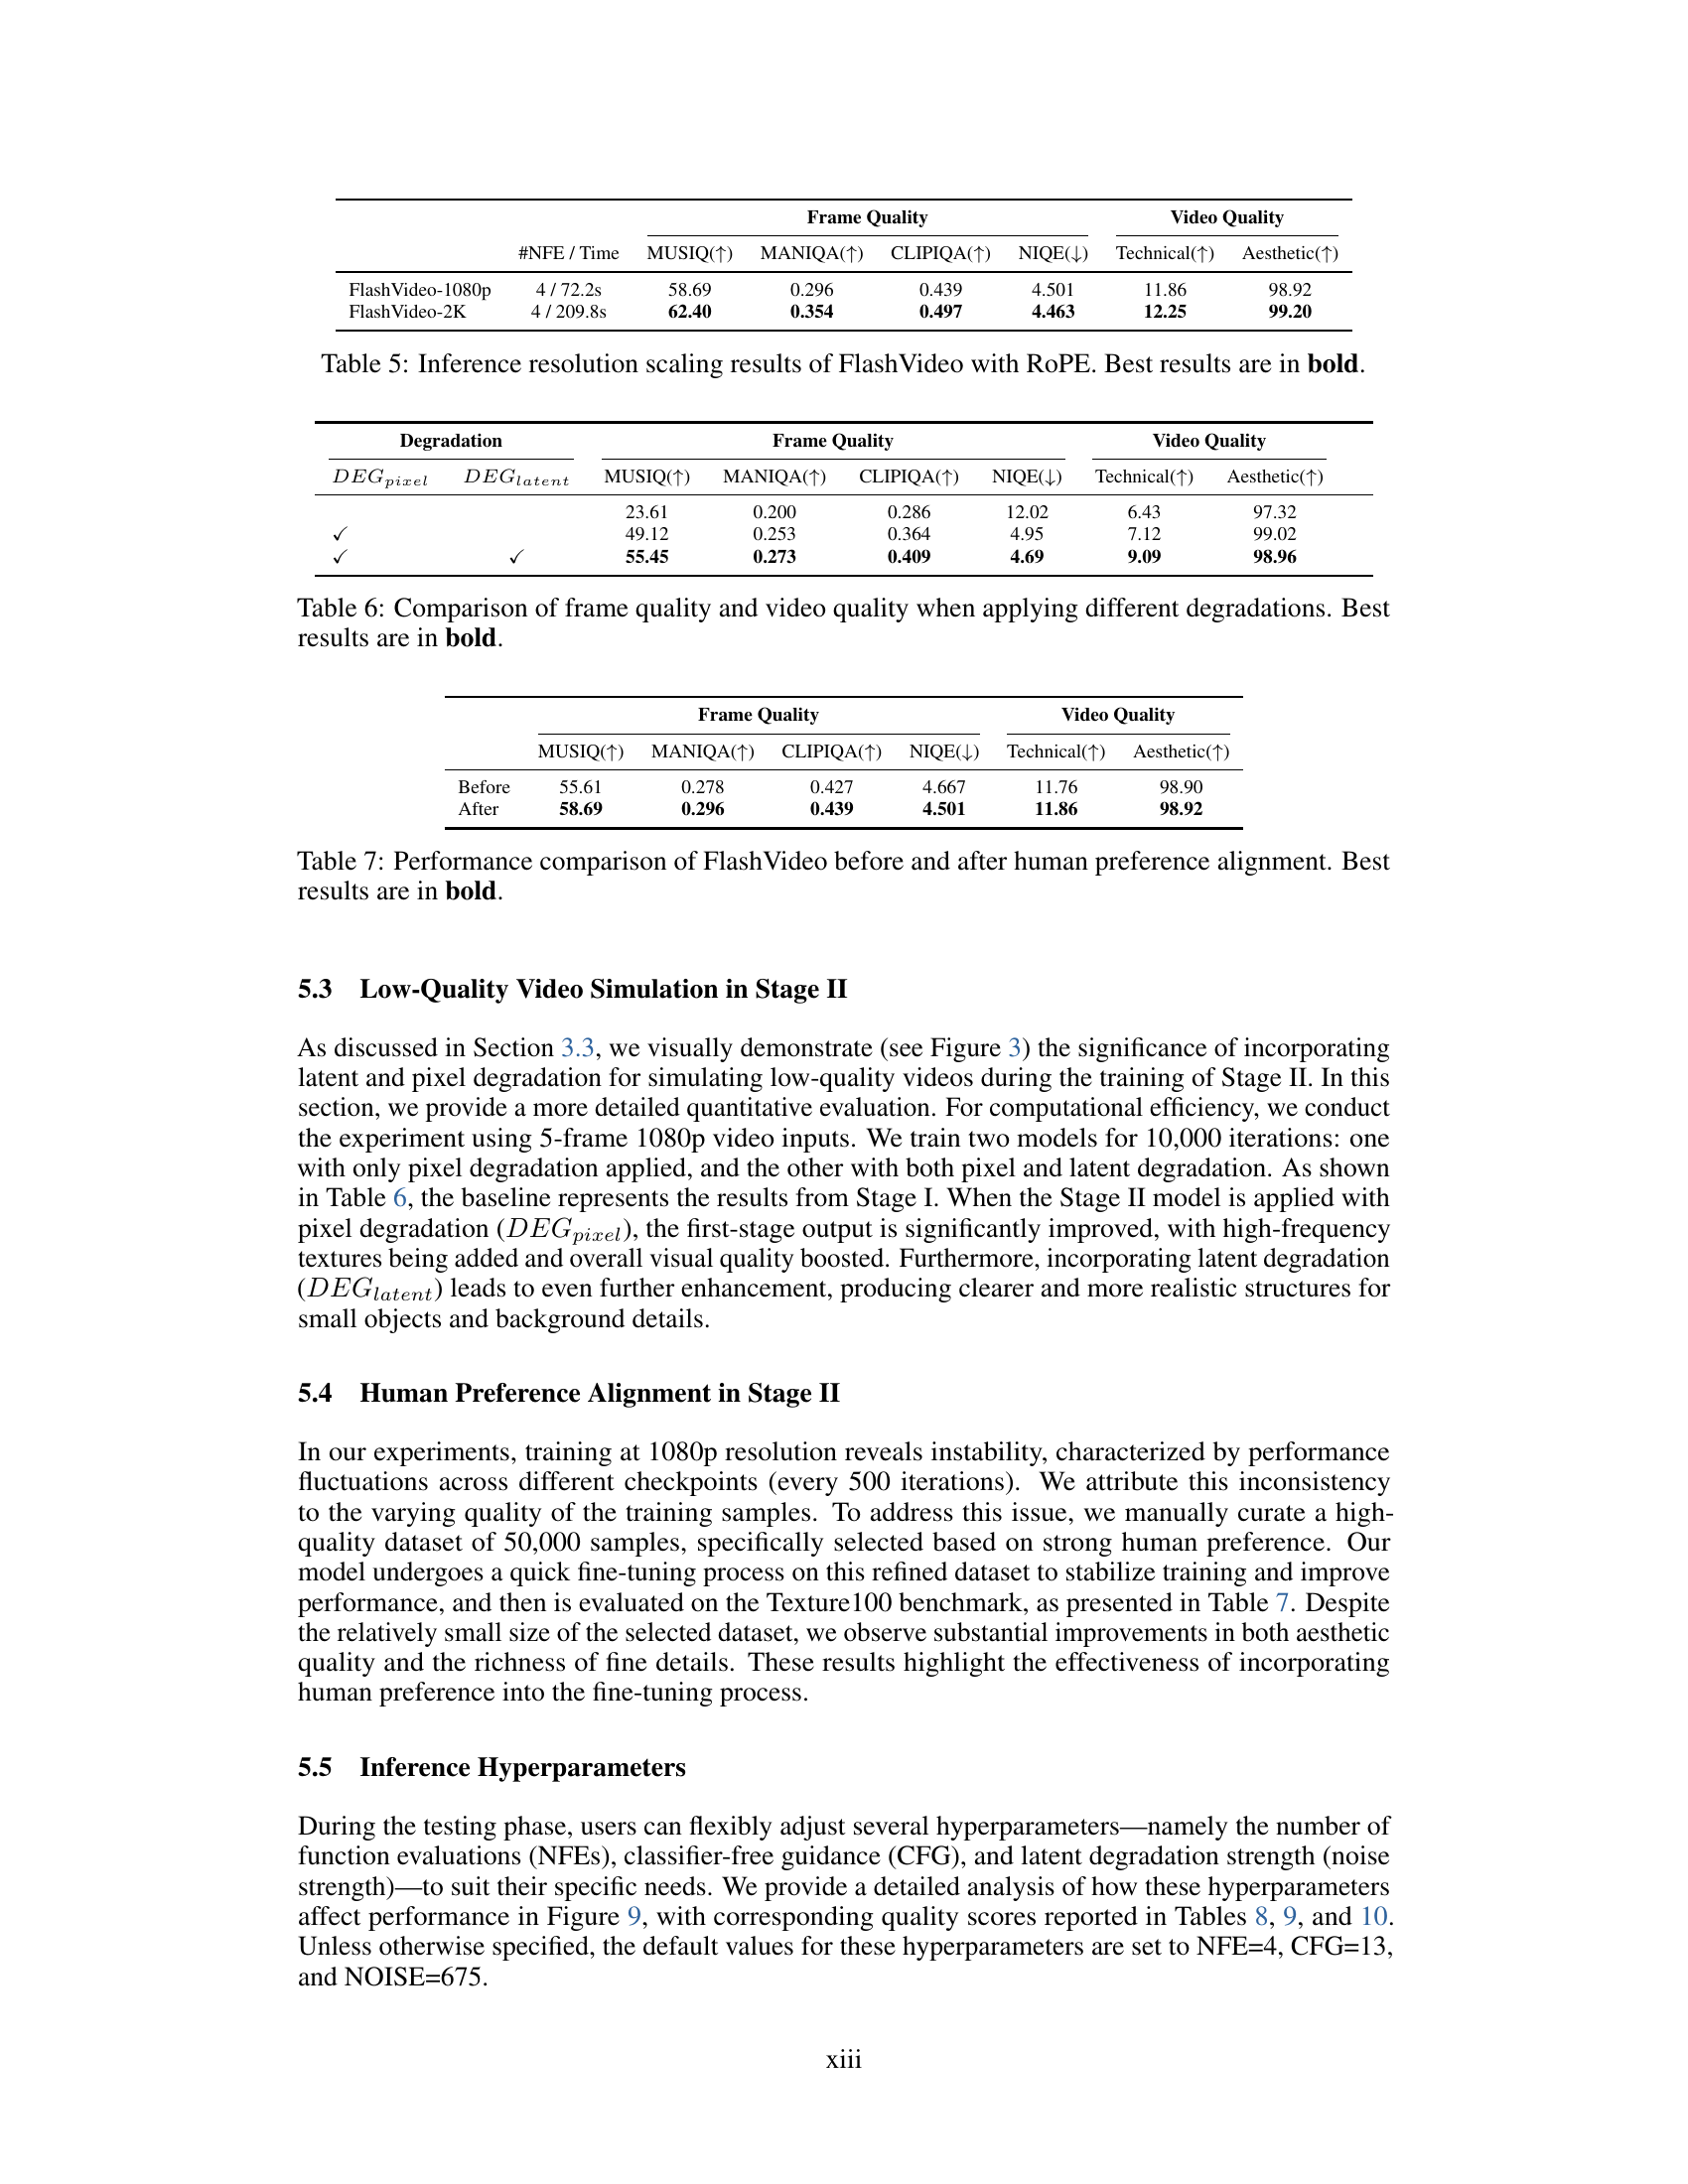
🔼 This table presents the results of scaling the inference resolution of the FlashVideo model, using the Rotary Position Embedding (RoPE) technique. It compares the performance metrics (MUSIQ, MANIQA, CLIPIQA, NIQE, Technical, and Aesthetic) at two different resolutions: 1080p and 2K (higher resolution). The number of function evaluations (NFEs) and inference time are also reported for each resolution. The best performance in each metric is highlighted in bold, demonstrating the impact of higher resolution on the model’s output quality while noting the increased computational cost.
read the caption
Table 5: Inference resolution scaling results of FlashVideo with RoPE. Best results are in bold.
| Degradation | Frame Quality | Video Quality | ||||||
| MUSIQ() | MANIQA() | CLIPIQA() | NIQE() | Technical() | Aesthetic() | |||
| 23.61 | 0.200 | 0.286 | 12.02 | 6.43 | 97.32 | |||
| ✓ | 49.12 | 0.253 | 0.364 | 4.95 | 7.12 | 99.02 | ||
| ✓ | ✓ | 55.45 | 0.273 | 0.409 | 4.69 | 9.09 | 98.96 | |
🔼 This table presents a comparison of frame and video quality metrics when different data augmentation methods are used during the training of the high-resolution stage. The methods compared are using pixel-space degradation only (DEGpixel) and a combination of pixel-space and latent-space degradation (DEGlatent). The metrics used to evaluate quality include MUSIQ, MANIQA, CLIPIQA, and NIQE, reflecting both objective and subjective image quality aspects. Additionally, technical and aesthetic scores are included to provide a comprehensive evaluation of the generated videos. The best performing method for each metric is highlighted in bold, allowing for a direct comparison of the effectiveness of each degradation technique.
read the caption
Table 6: Comparison of frame quality and video quality when applying different degradations. Best results are in bold.
| Frame Quality | Video Quality | |||||
| MUSIQ() | MANIQA() | CLIPIQA() | NIQE() | Technical() | Aesthetic() | |
| Before | 55.61 | 0.278 | 0.427 | 4.667 | 11.76 | 98.90 |
| After | 58.69 | 0.296 | 0.439 | 4.501 | 11.86 | 98.92 |
🔼 This table presents a quantitative comparison of FlashVideo’s performance before and after incorporating human preference alignment during fine-tuning. It shows improvements in various metrics related to both frame-level quality (MUSIQ, MANIQA, CLIPIQA, NIQE) and overall video quality (Technical and Aesthetic), indicating that aligning the model with human preferences enhances its ability to generate visually appealing and high-quality videos.
read the caption
Table 7: Performance comparison of FlashVideo before and after human preference alignment. Best results are in bold.
| Frame Quality | Video Quality | |||||
| NFE | MUSIQ() | MANIQA() | CLIPIQA() | NIQE() | Tech() | Aesth() |
| 1 | 48.60 | 0.253 | 0.307 | 5.148 | 8.643 | 98.03 |
| 2 | 55.10 | 0.287 | 0.390 | 4.730 | 10.57 | 98.38 |
| 3 | 57.59 | 0.290 | 0.418 | 4.543 | 11.39 | 98.62 |
| 4 | 58.69 | 0.296 | 0.439 | 4.501 | 11.86 | 98.92 |
| 5 | 59.24 | 0.299 | 0.441 | 4.492 | 12.15 | 99.05 |
| 6 | 59.17 | 0.295 | 0.440 | 4.521 | 12.48 | 99.05 |
| 7 | 59.48 | 0.298 | 0.445 | 4.578 | 12.20 | 99.01 |
| 8 | 59.64 | 0.298 | 0.451 | 4.554 | 12.05 | 99.16 |
🔼 This table presents the results of experiments conducted to determine the optimal latent degradation strength for the FlashVideo model. During the initial training phase, a wide range of noise steps (600-900) was tested. The table shows the model’s performance across this range, indicating that a narrower range of 650-750 consistently produces satisfactory results. This optimized range was then used in subsequent training phases. The upper half of the table displays results from the initial broader range, and the lower half shows the results from the refined, optimal range, highlighting the improvement in model performance after focusing on this narrower range.
read the caption
Table 10: Results of FlashVideo under different latent degradation strengths. During initial training, a noise step range of 600–900 is applied, with model performance evaluated across different steps. The range of 650–750 consistently yields satisfactory results (see upper half of Table). This refined range is then adopted for subsequent training, with final performance presented in the lower half of Table.
Full paper#