TL;DR#
Multimodal models like Show-o are promising but suffer from slow inference speeds due to their complex processes. This necessitates a large number of sampling steps for image and text generation, increasing serving costs. Prior acceleration methods are often model-specific, lacking a unified approach. This significantly limits their applicability to various models.
Show-o Turbo tackles this challenge head-on by introducing a unified denoising perspective for both image and text generation, using parallel decoding and adapting consistency distillation techniques. This approach significantly reduces the number of sampling steps needed while maintaining a high level of performance. Experiments show substantial speed improvements in image-to-text generation (1.5x speedup) and competitive results in text-to-image generation, often outperforming the original Show-o even with fewer steps.
Key Takeaways#
Why does it matter?#
This paper is important because it significantly accelerates the inference speed of Show-o, a leading unified multimodal model, without substantial performance loss. This addresses a critical limitation of current multimodal models and opens new avenues for efficient large-scale multimodal applications. The proposed Show-o Turbo method is also broadly applicable, and its underlying principles can inspire future research on accelerating other similar models.
Visual Insights#

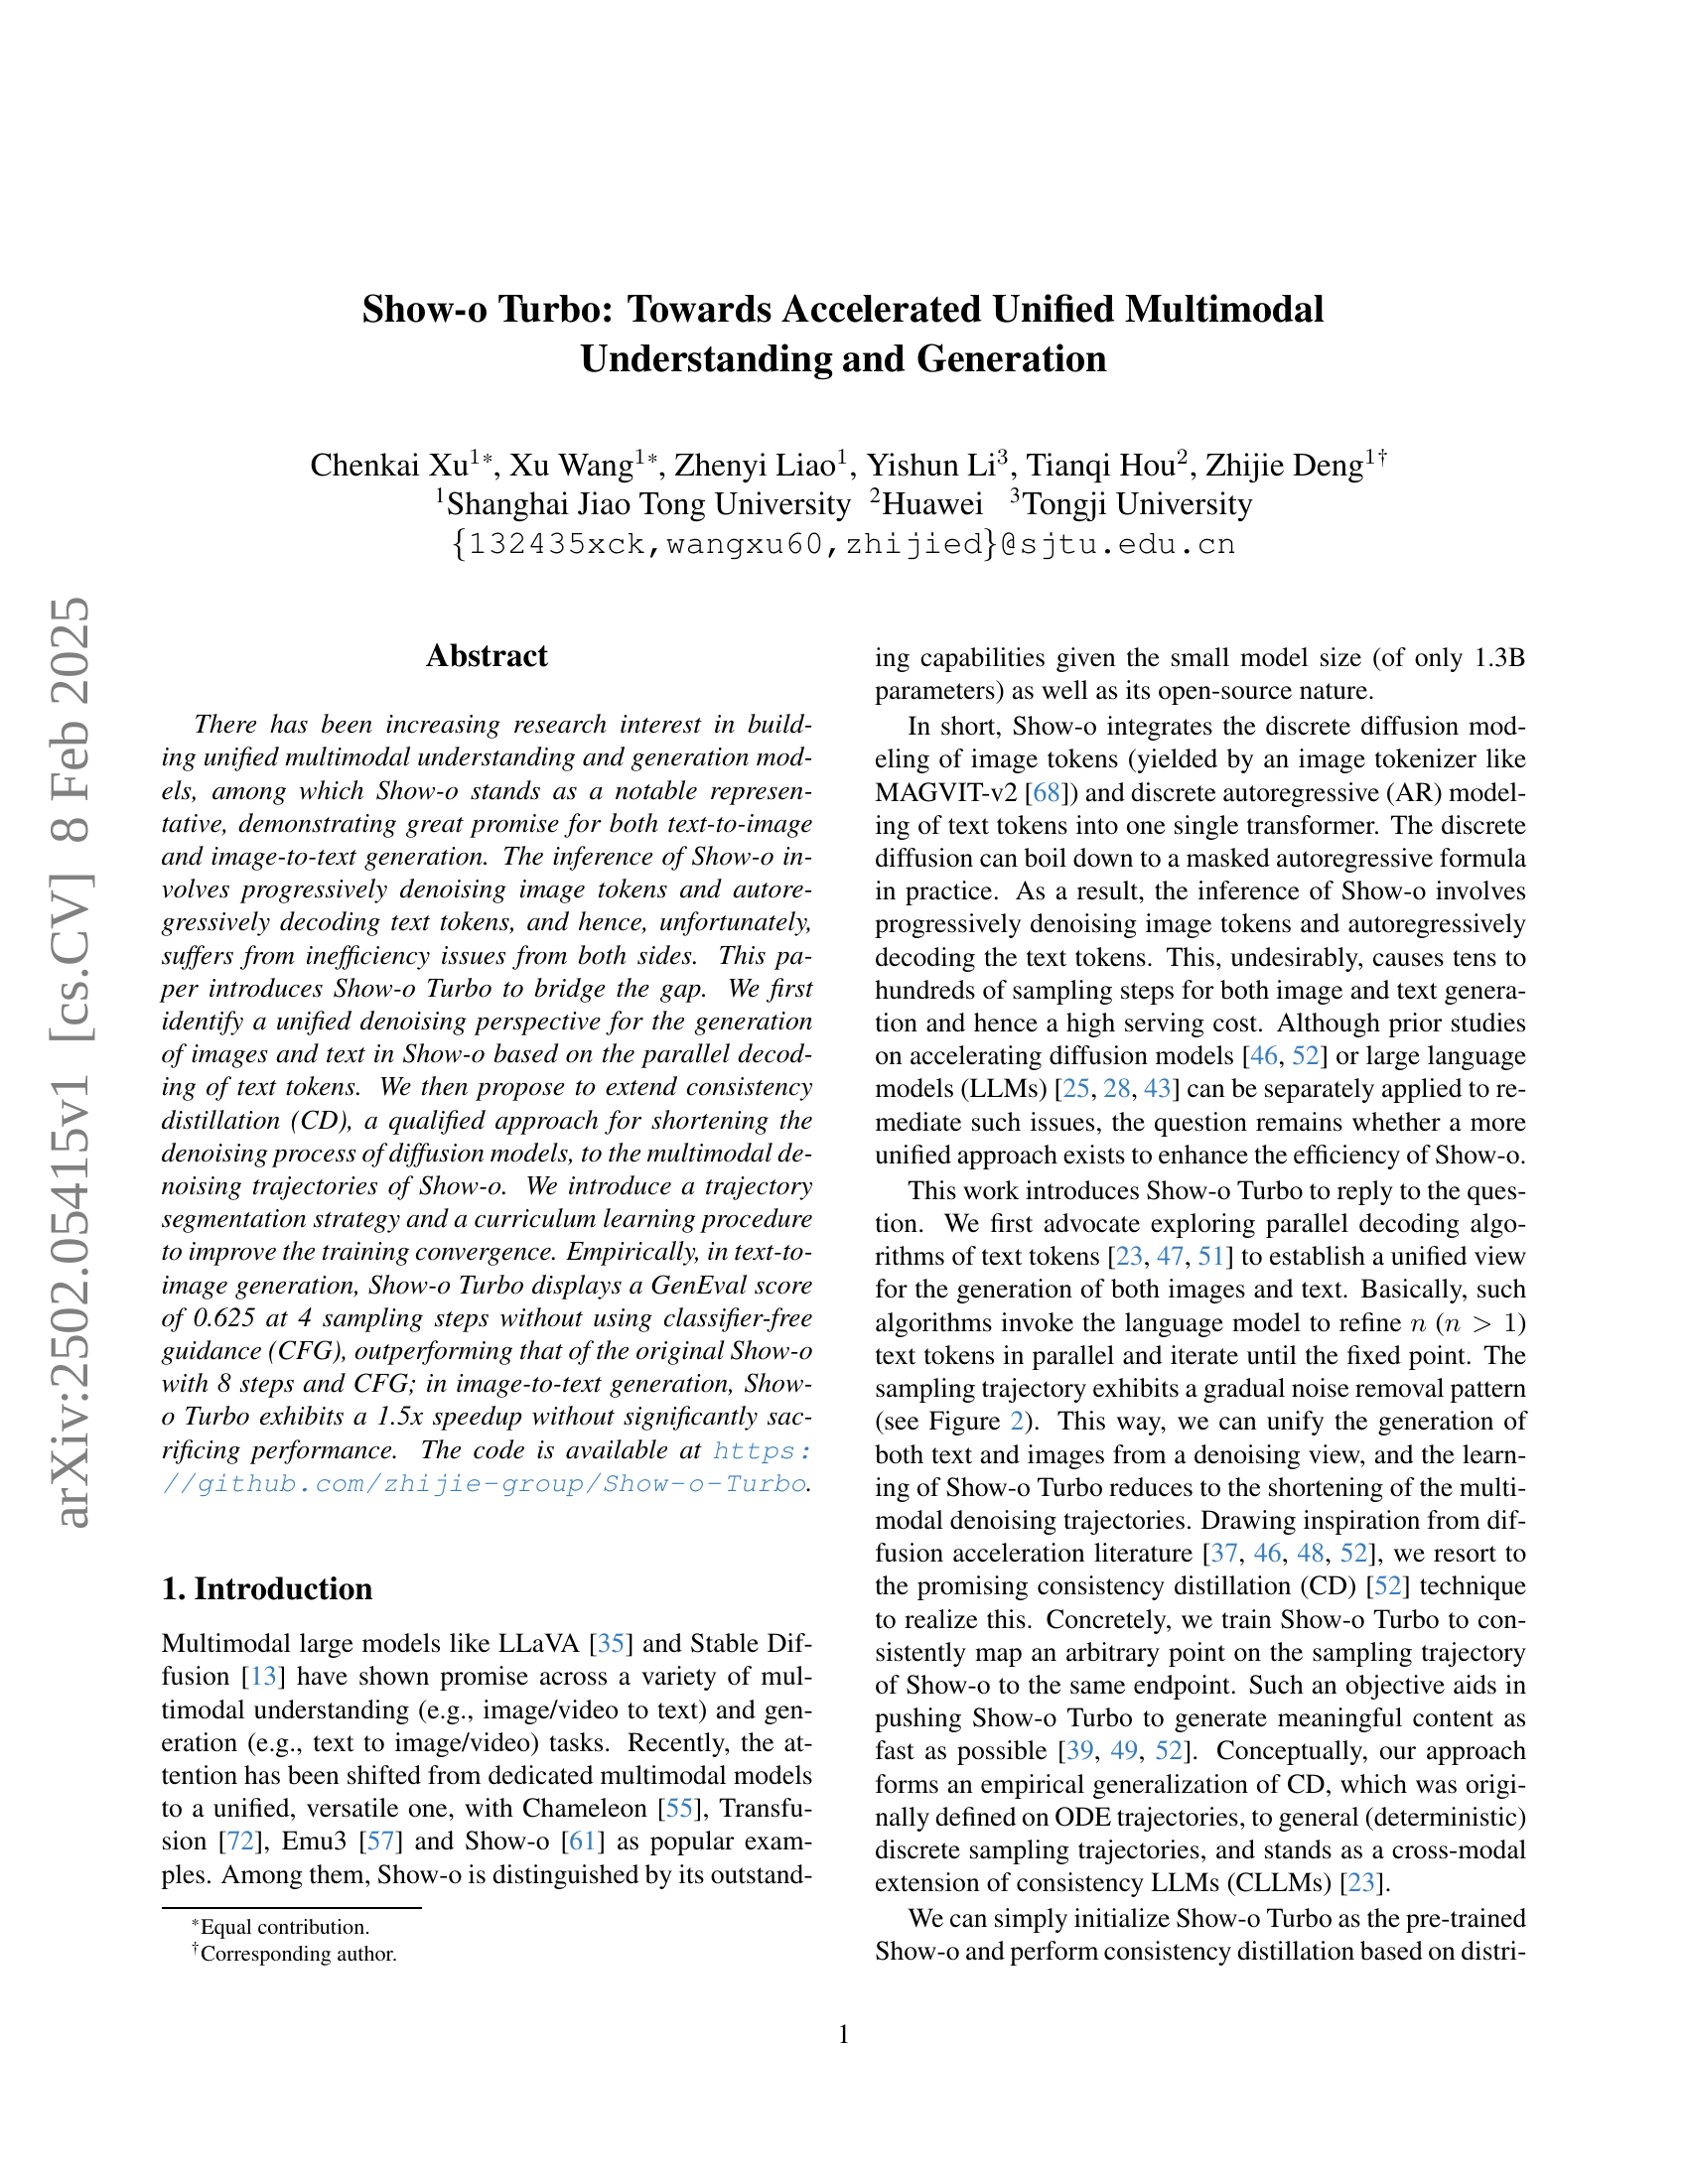
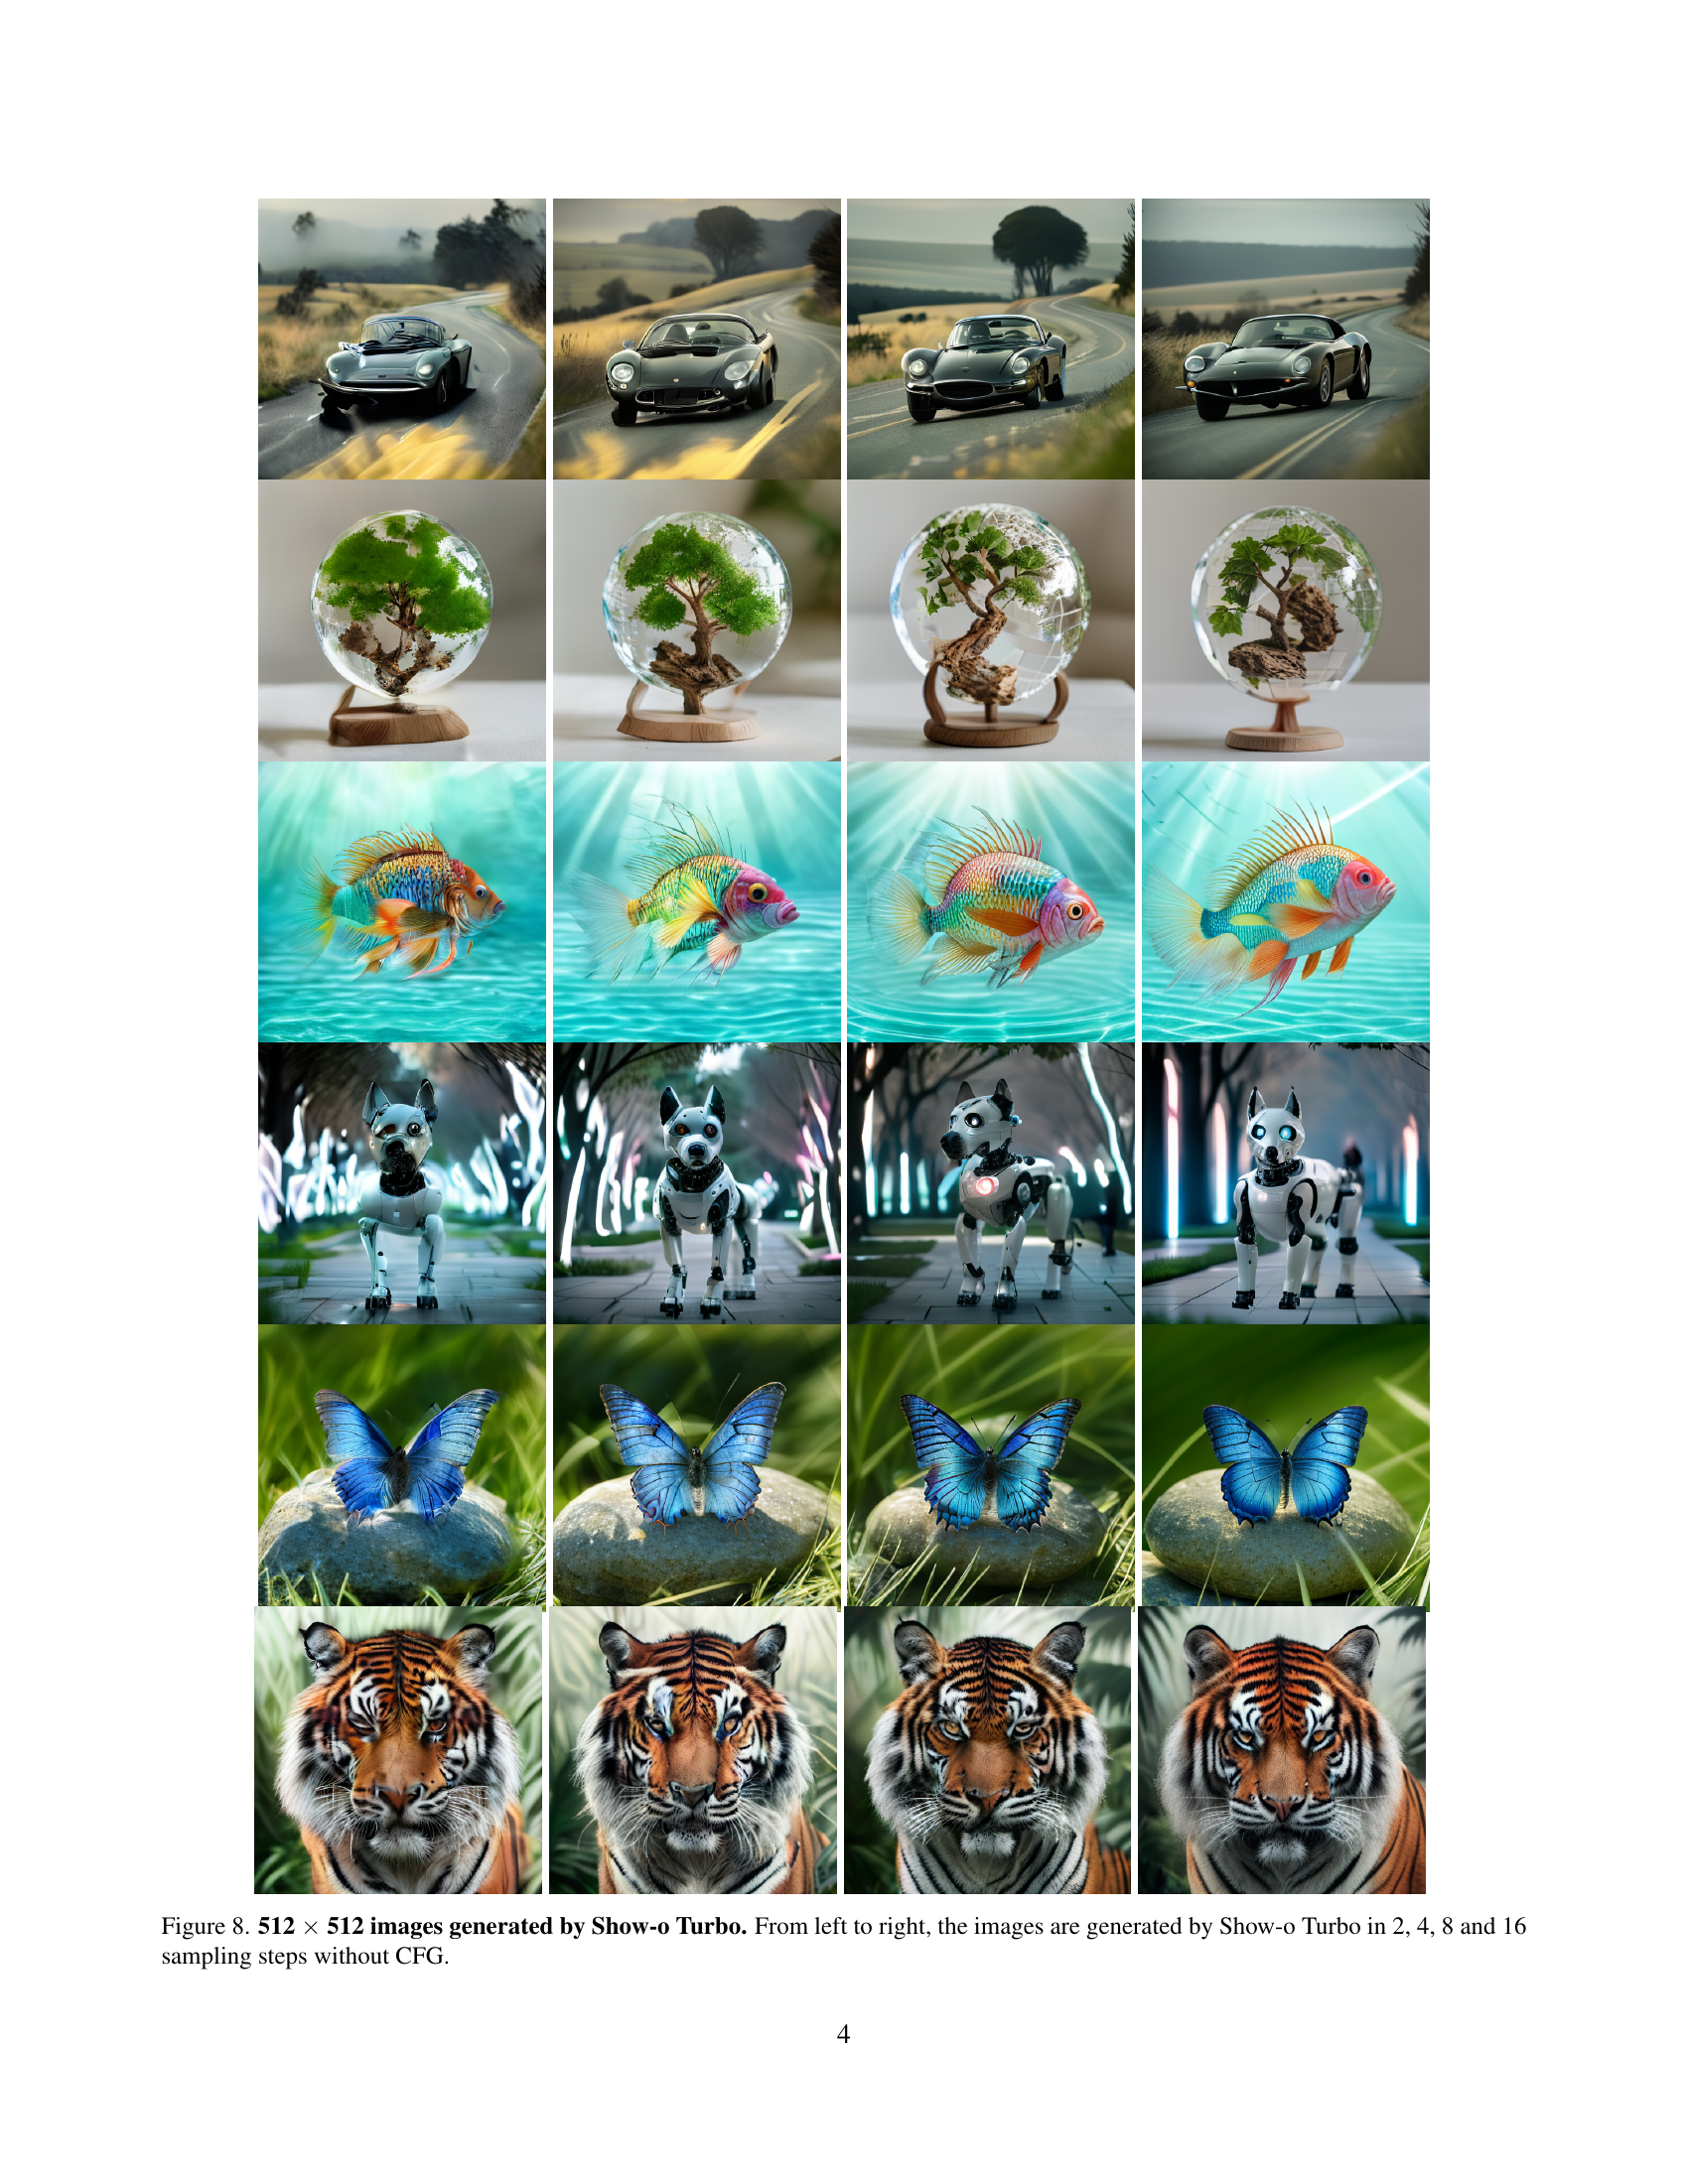
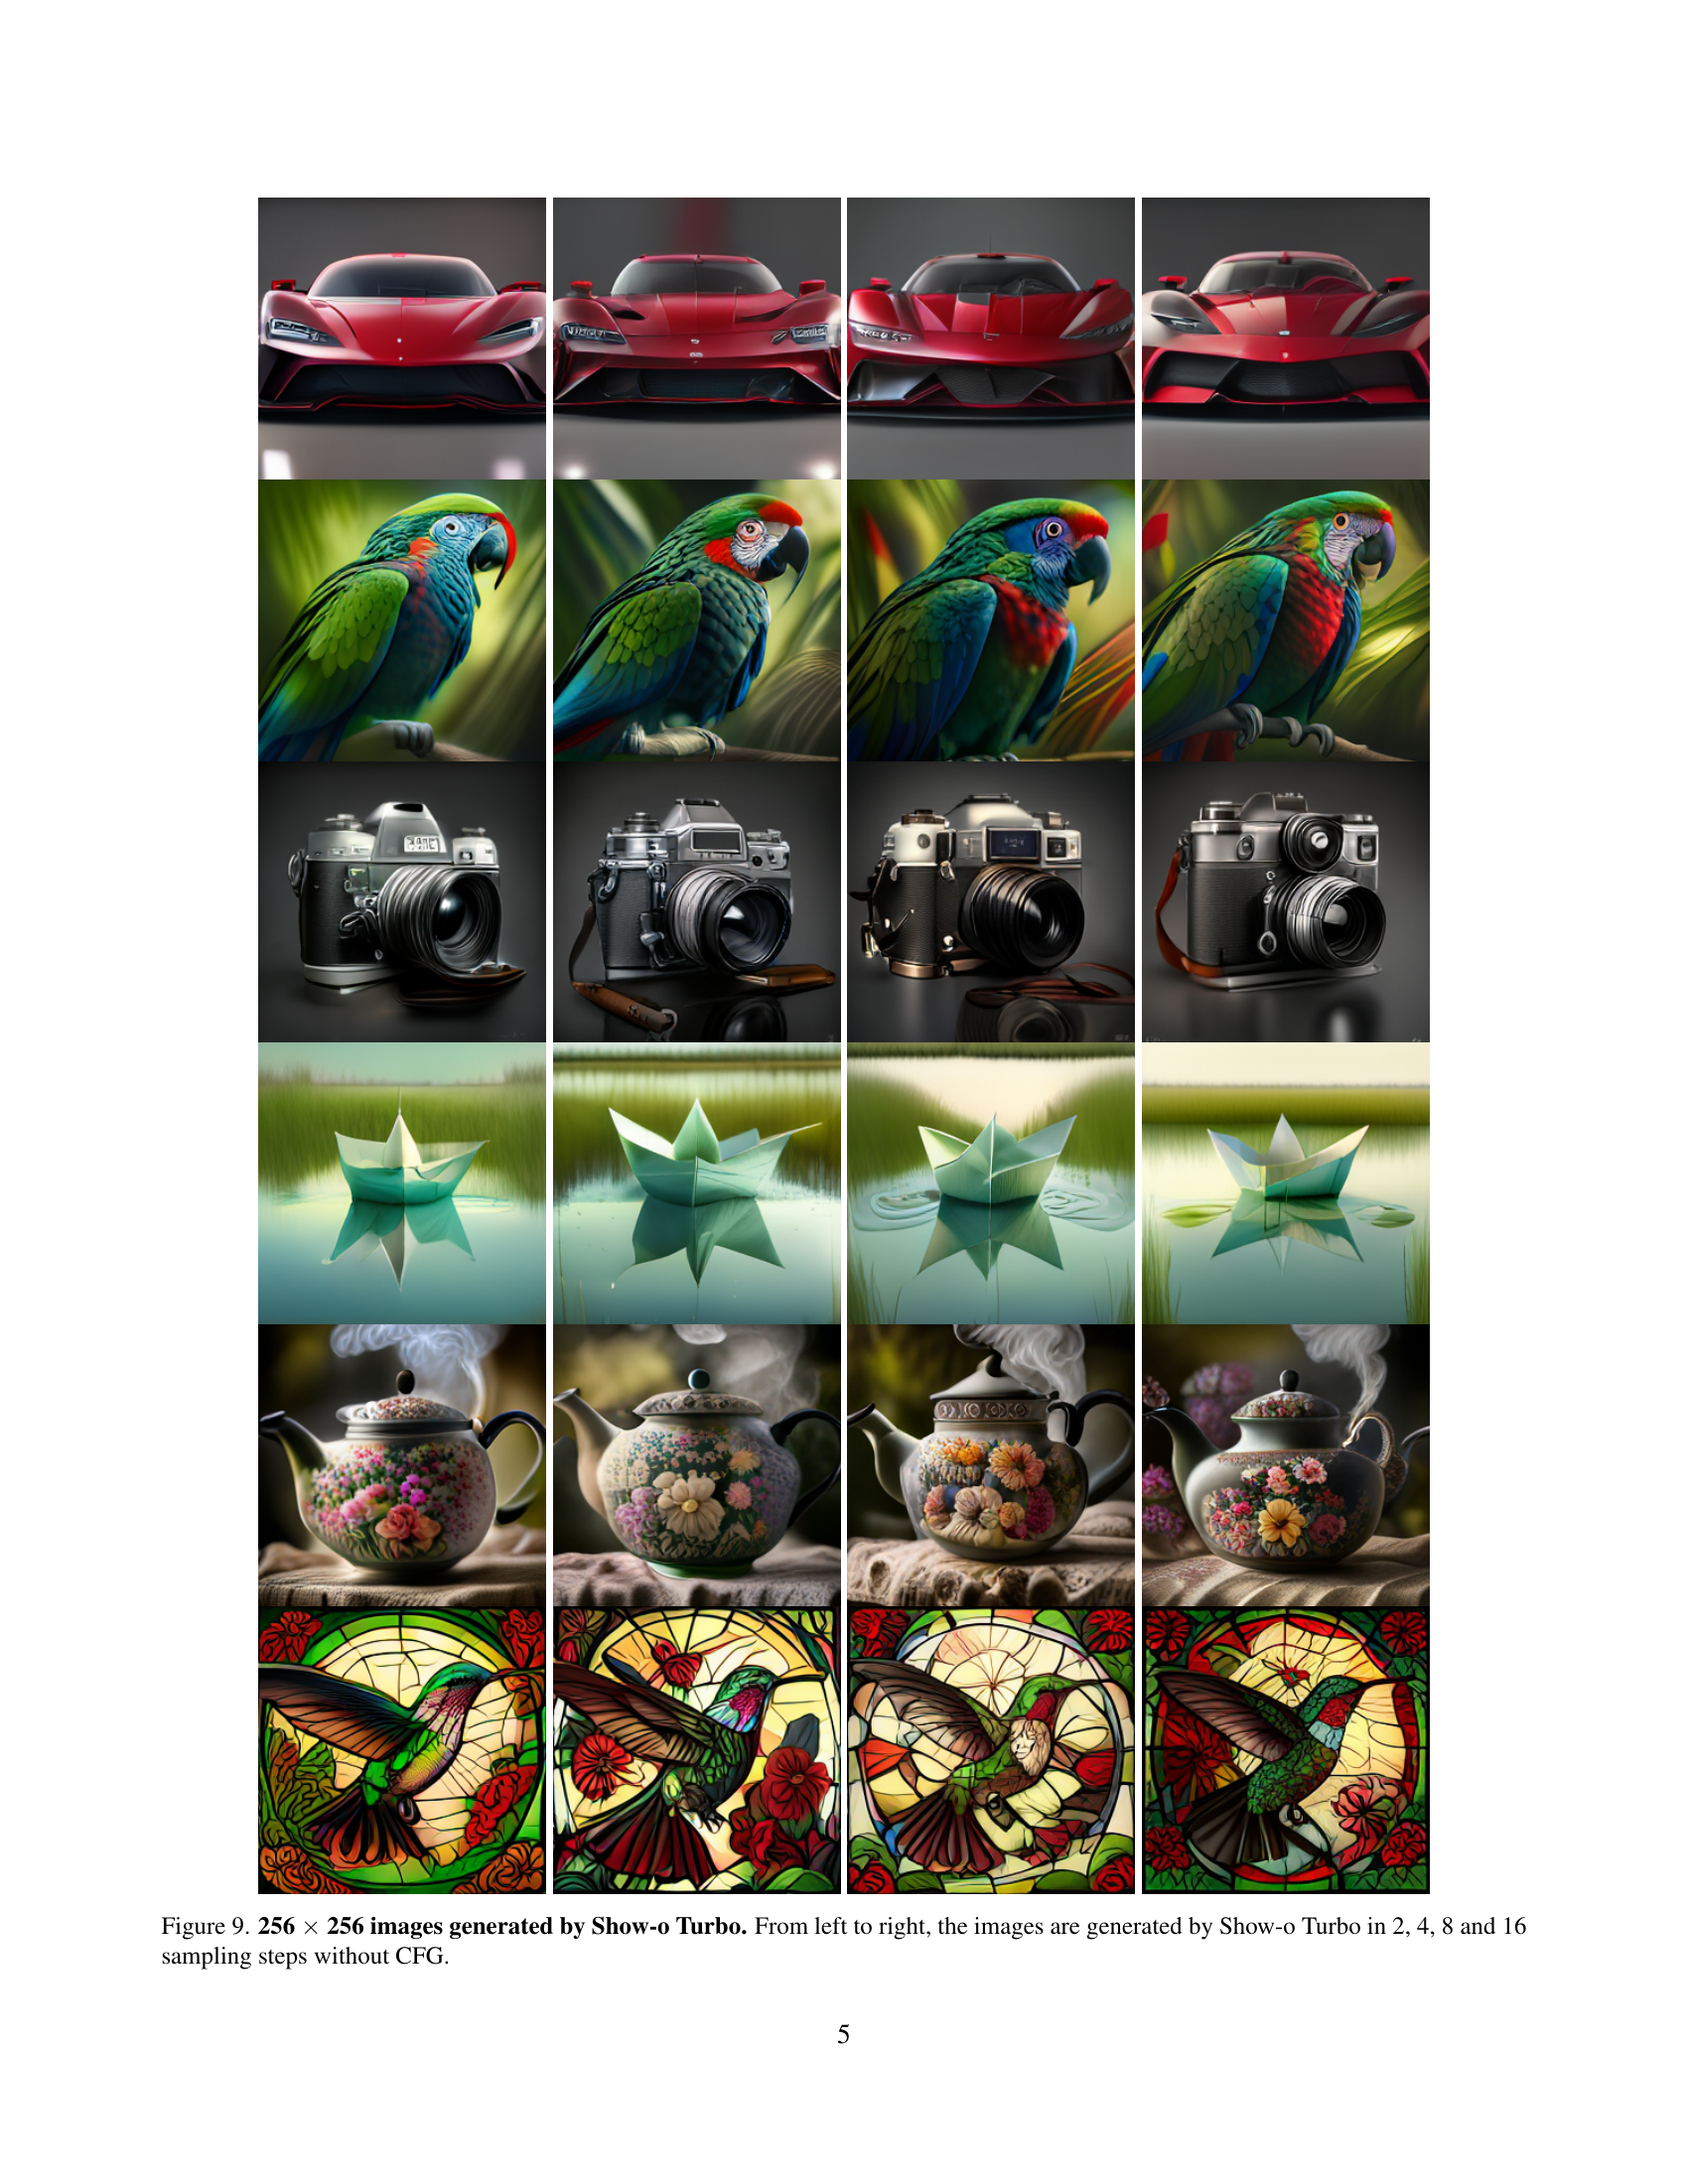
🔼 This figure showcases the image generation capabilities of Show-o Turbo, a multimodal model. It presents three sets of 512x512 pixel images, each generated from the same text prompt but with varying numbers of sampling steps (8, 4, and 2). The key takeaway is that Show-o Turbo can produce high-quality images even with a significantly reduced number of sampling steps compared to other approaches. The absence of classifier-free guidance highlights the model’s inherent capabilities.
read the caption
Figure 1: 512 ×\times× 512 images generated by Show-o Turbo given various text prompts. From top to bottom, the images are generated by Show-o Turbo in 8, 4, and 2 sampling steps without reliance on classifier-free guidance [20].
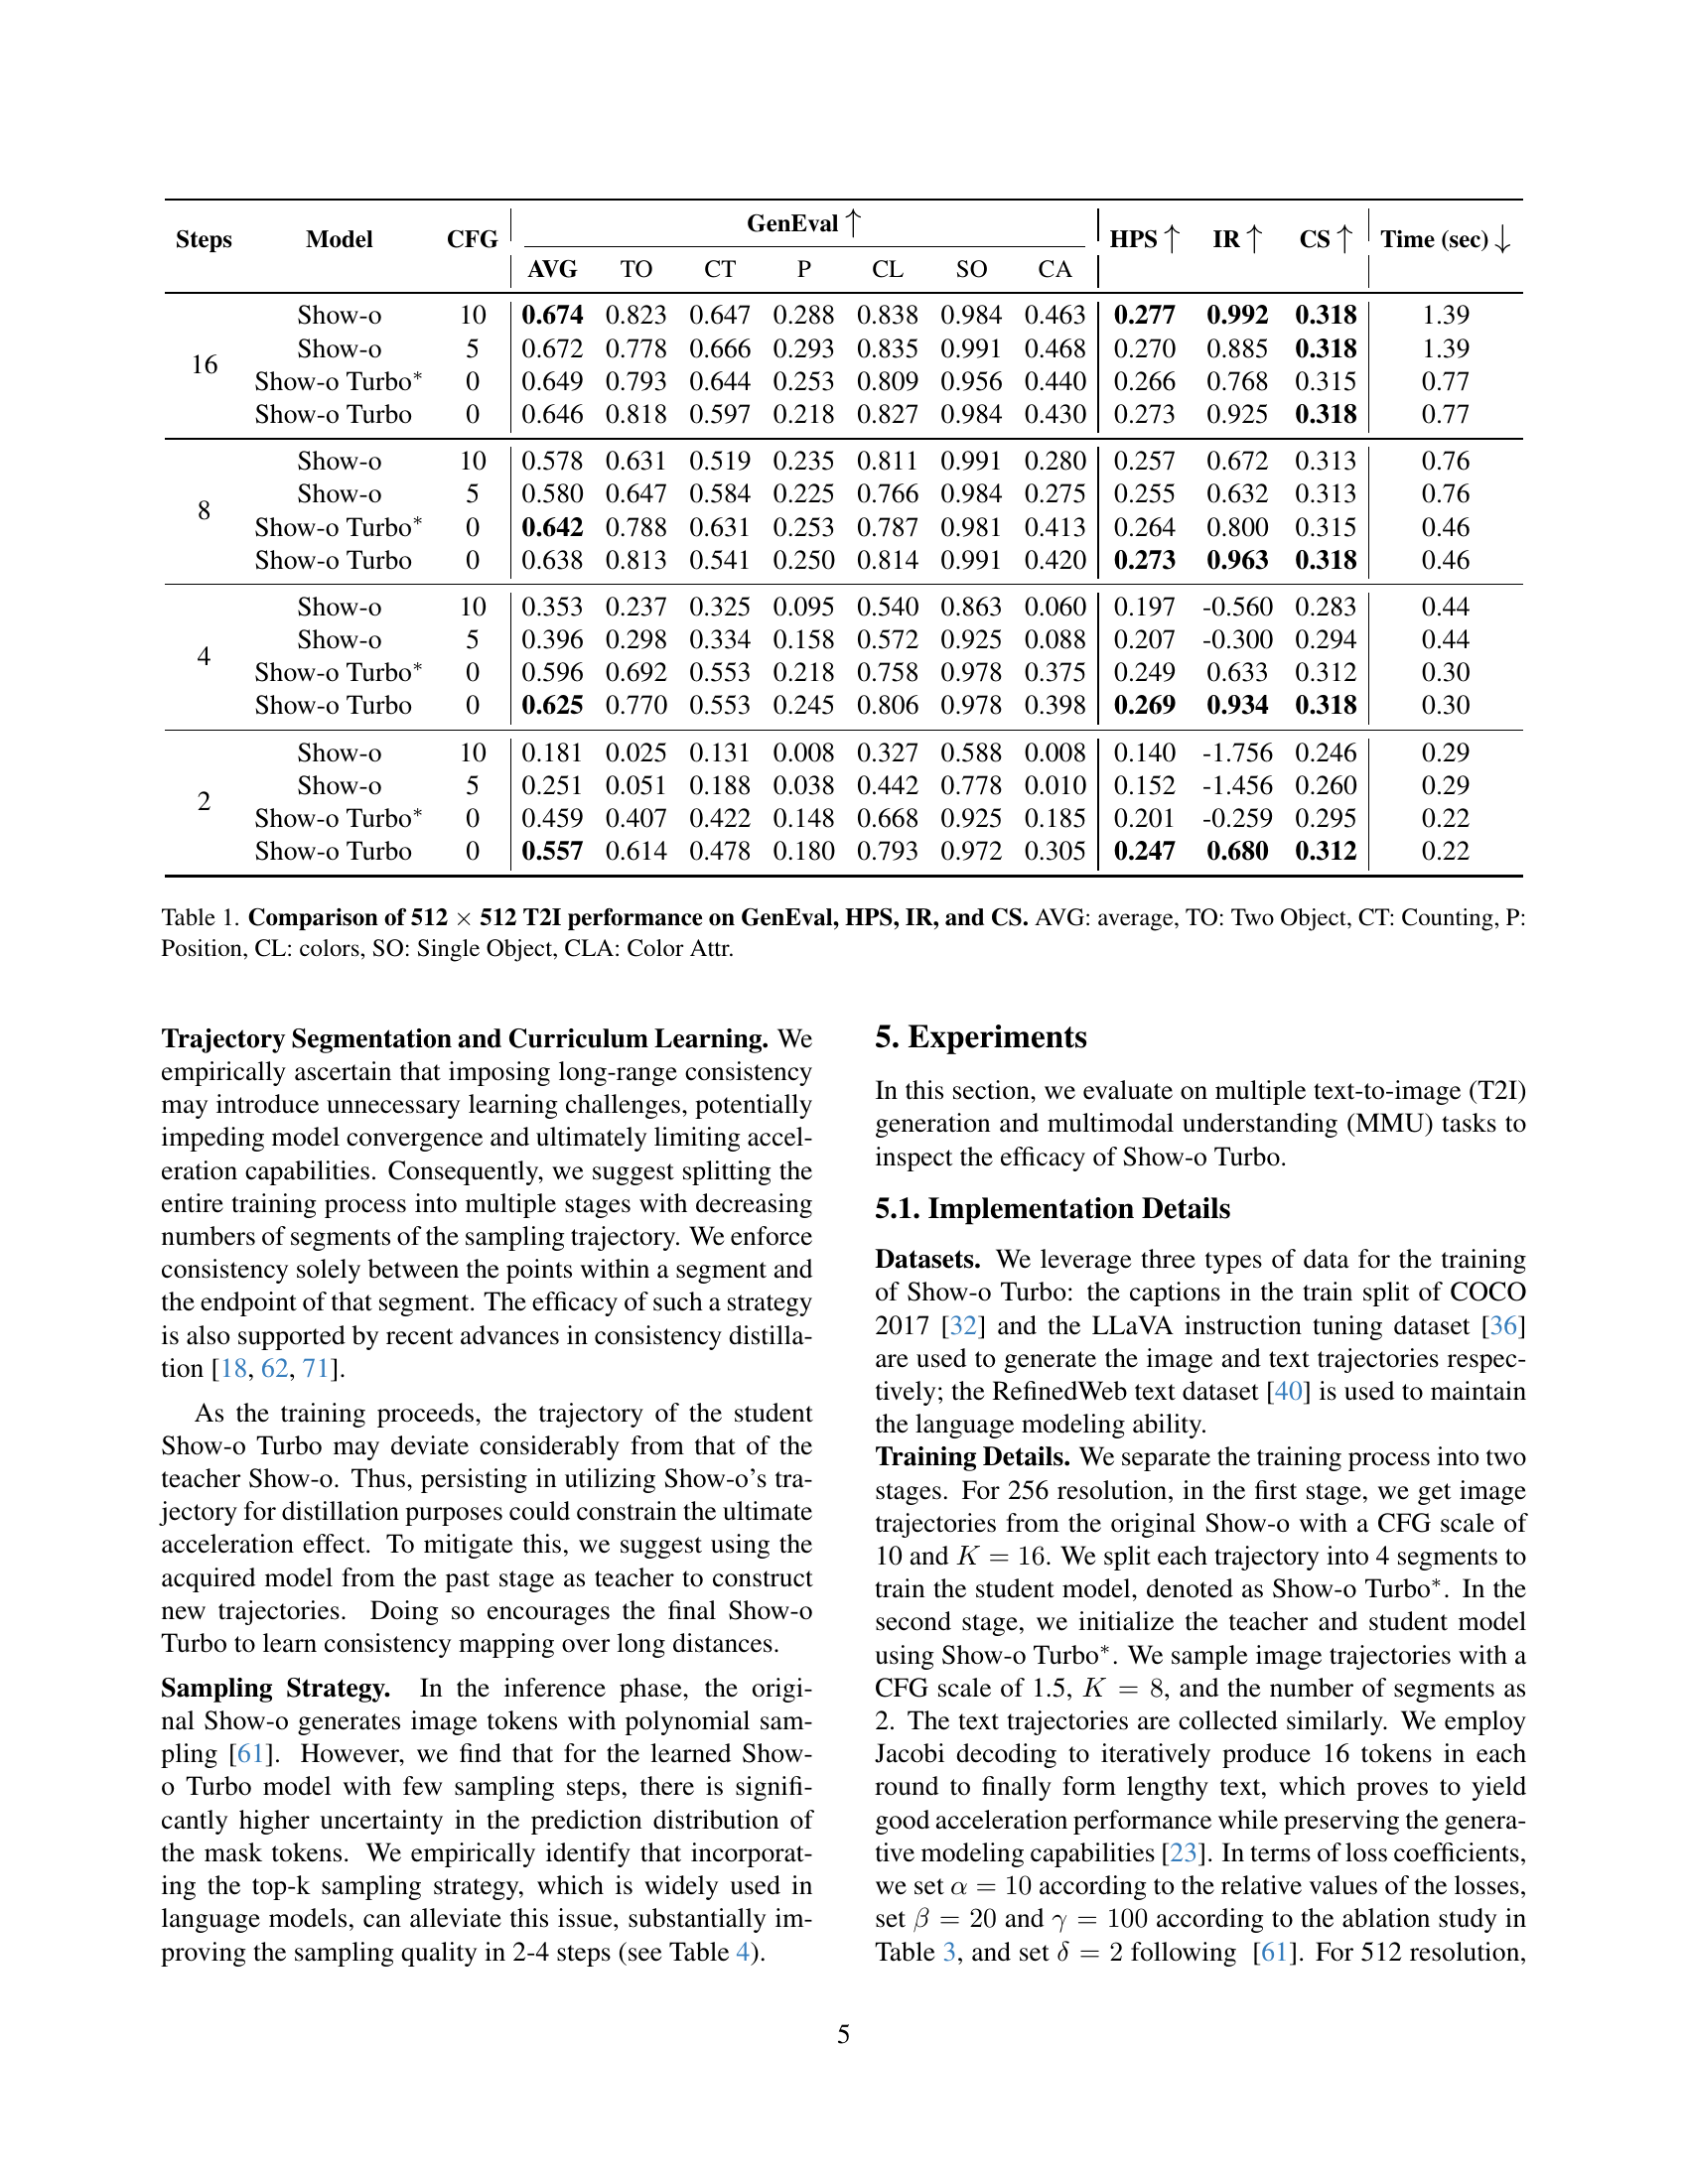
| Steps | Model | CFG | GenEval | HPS | IR | CS | Time (sec) | ||||||
|---|---|---|---|---|---|---|---|---|---|---|---|---|---|
| AVG | TO | CT | P | CL | SO | CA | |||||||
| 16 | Show-o | 10 | 0.674 | 0.823 | 0.647 | 0.288 | 0.838 | 0.984 | 0.463 | 0.277 | 0.992 | 0.318 | 1.39 |
| Show-o | 5 | 0.672 | 0.778 | 0.666 | 0.293 | 0.835 | 0.991 | 0.468 | 0.270 | 0.885 | 0.318 | 1.39 | |
| Show-o Turbo∗ | 0 | 0.649 | 0.793 | 0.644 | 0.253 | 0.809 | 0.956 | 0.440 | 0.266 | 0.768 | 0.315 | 0.77 | |
| Show-o Turbo | 0 | 0.646 | 0.818 | 0.597 | 0.218 | 0.827 | 0.984 | 0.430 | 0.273 | 0.925 | 0.318 | 0.77 | |
| 8 | Show-o | 10 | 0.578 | 0.631 | 0.519 | 0.235 | 0.811 | 0.991 | 0.280 | 0.257 | 0.672 | 0.313 | 0.76 |
| Show-o | 5 | 0.580 | 0.647 | 0.584 | 0.225 | 0.766 | 0.984 | 0.275 | 0.255 | 0.632 | 0.313 | 0.76 | |
| Show-o Turbo∗ | 0 | 0.642 | 0.788 | 0.631 | 0.253 | 0.787 | 0.981 | 0.413 | 0.264 | 0.800 | 0.315 | 0.46 | |
| Show-o Turbo | 0 | 0.638 | 0.813 | 0.541 | 0.250 | 0.814 | 0.991 | 0.420 | 0.273 | 0.963 | 0.318 | 0.46 | |
| 4 | Show-o | 10 | 0.353 | 0.237 | 0.325 | 0.095 | 0.540 | 0.863 | 0.060 | 0.197 | -0.560 | 0.283 | 0.44 |
| Show-o | 5 | 0.396 | 0.298 | 0.334 | 0.158 | 0.572 | 0.925 | 0.088 | 0.207 | -0.300 | 0.294 | 0.44 | |
| Show-o Turbo∗ | 0 | 0.596 | 0.692 | 0.553 | 0.218 | 0.758 | 0.978 | 0.375 | 0.249 | 0.633 | 0.312 | 0.30 | |
| Show-o Turbo | 0 | 0.625 | 0.770 | 0.553 | 0.245 | 0.806 | 0.978 | 0.398 | 0.269 | 0.934 | 0.318 | 0.30 | |
| 2 | Show-o | 10 | 0.181 | 0.025 | 0.131 | 0.008 | 0.327 | 0.588 | 0.008 | 0.140 | -1.756 | 0.246 | 0.29 |
| Show-o | 5 | 0.251 | 0.051 | 0.188 | 0.038 | 0.442 | 0.778 | 0.010 | 0.152 | -1.456 | 0.260 | 0.29 | |
| Show-o Turbo∗ | 0 | 0.459 | 0.407 | 0.422 | 0.148 | 0.668 | 0.925 | 0.185 | 0.201 | -0.259 | 0.295 | 0.22 | |
| Show-o Turbo | 0 | 0.557 | 0.614 | 0.478 | 0.180 | 0.793 | 0.972 | 0.305 | 0.247 | 0.680 | 0.312 | 0.22 | |
🔼 This table presents a comparison of the performance of Show-o and Show-o Turbo on text-to-image (T2I) generation tasks using 512x512 pixel images. Multiple metrics are used to evaluate the image quality and alignment with the text prompts. These metrics include the overall GenEval score, as well as individual scores related to object counting (TO), color (CL), position (P), single object (SO), color attributes (CLA), and two object (CT) aspects of image generation. Human Preference Scores (HPS) and ImageReward (IR) scores provide additional measures of image quality. Finally, CLIP Scores (CS) show the alignment of generated images with the given text prompts. The time taken for inference is also provided for Show-o and Show-o Turbo using various numbers of sampling steps (16, 8, 4, 2), with and without Classifier-Free Guidance (CFG).
read the caption
Table 1: Comparison of 512 ×\times× 512 T2I performance on GenEval, HPS, IR, and CS. AVG: average, TO: Two Object, CT: Counting, P: Position, CL: colors, SO: Single Object, CLA: Color Attr.
In-depth insights#
Unified Multimodal View#
A unified multimodal view in a research paper would likely explore the integration of diverse modalities, such as text, images, audio, and video, within a single model or framework. This contrasts with the traditional approach of training separate models for each modality. The core idea is to leverage the interdependence and synergy between different modalities to improve performance on various downstream tasks like image captioning, visual question answering, or multi-modal generation. A key challenge would be to design efficient model architectures capable of handling diverse input types and their interactions while maintaining a balance between complexity and computational feasibility. Successful implementation hinges on effective representation learning for each modality, finding efficient methods for cross-modal alignment and information fusion, and careful consideration of the trade-offs between model capacity and generalization ability. The unified view also opens opportunities for transfer learning across modalities, allowing knowledge gained from one domain to benefit another, ultimately enhancing robustness and efficiency of the overall system. Furthermore, a well-defined unified multimodal view should allow for more natural and intuitive interactions within multi-modal applications.
Consistency Distillation#
Consistency distillation is a powerful technique for accelerating diffusion models by training a smaller, faster model to mimic the behavior of a larger, slower one. The core idea is to teach the smaller model to map arbitrary points along the sampling trajectory of the larger model to the same final output. This forces the smaller model to learn the essential information needed for generating the final output more efficiently, drastically reducing the computational cost. The effectiveness of this approach relies on identifying a suitable divergence measure to quantify the difference between the trajectories and employing appropriate training strategies. Moreover, applying consistency distillation within a multimodal context, like that of Show-o Turbo, requires careful consideration of the distinct characteristics of different modalities, which is crucial for maintaining a unified training perspective while avoiding performance degradation. The success of Show-o Turbo demonstrates the potential of consistency distillation to accelerate complex multimodal generation processes, making it a vital technique for developing efficient and versatile large language models in the future.
Parallel Decoding#
Parallel decoding, in the context of large language models and multimodal generation, offers a compelling approach to accelerate inference. Instead of sequentially generating tokens one at a time, it processes multiple tokens concurrently. This drastically reduces the computational cost and latency associated with autoregressive methods, making the model significantly faster. The core idea is to utilize a fixed-point iteration or similar algorithm, where multiple tokens are refined simultaneously based on a global context. This paradigm shift moves away from the sequential nature of traditional autoregressive decoding, enabling parallelism for more efficiency. However, successfully implementing parallel decoding requires careful consideration of model architecture and training. While offering significant speed improvements, it might compromise the model’s ability to capture complex dependencies between tokens that arise from the sequential nature of language. Therefore, the balance between speed and performance needs to be carefully managed. Further research is needed to fully investigate its efficacy in various multimodal contexts and its capacity to maintain the quality of the generated outputs compared to sequential methods. Exploring different parallel decoding algorithms and their impact on various model architectures would be a key area of future research in order to fully realize the potential benefits of this technique.
Curriculum Learning#
Curriculum learning, in the context of this research paper, is a training strategy designed to improve the convergence and performance of the Show-o Turbo model. The core idea is to gradually increase the complexity of the training data or tasks presented to the model during training. This is achieved by strategically segmenting the multimodal denoising trajectories and progressively reducing the number of segments during training. Initially, the model learns to map shorter, less complex trajectory segments to their endpoints, before tackling longer, more challenging sequences. This approach helps the model learn effective intermediate representations and promotes a more stable optimization process. The curriculum learning strategy acts as a scaffolding mechanism, guiding the model through easier stages to build foundational understanding that facilitates learning of harder, later stages. By easing the model into more complex data gradually, curriculum learning aids in avoiding the pitfalls of early divergence or getting stuck in suboptimal solutions, improving both model convergence speed and overall performance. The paper’s empirical results demonstrate the substantial benefits of the curriculum learning approach in accelerating convergence without sacrificing performance on image and text generation tasks.
Show-o Turbo Limits#
Speculative analysis of hypothetical “Show-o Turbo Limits” in a research paper might reveal several key aspects. Computational cost remains a primary concern, despite improvements. While Show-o Turbo aims for acceleration, the extent of speedup might be limited by the inherent complexity of multimodal generation. Data dependency is another factor; the model’s performance is heavily reliant on training data quality and quantity. Insufficient or biased data could significantly constrain its capabilities. Generalization limitations may appear; a model trained on specific datasets might struggle with unseen data or novel tasks outside its training scope. Sampling tradeoffs between speed and quality are inherent in diffusion models. Show-o Turbo might prioritize speed, potentially sacrificing detail or precision in some generated outputs. Finally, architectural constraints of the underlying Show-o model could place inherent boundaries on how far Turbo’s enhancements can extend. Exploring these limitations offers a path towards further refining multimodal generative models. Addressing such challenges will be vital to improving the overall performance and versatility of such AI systems.
More visual insights#
More on figures

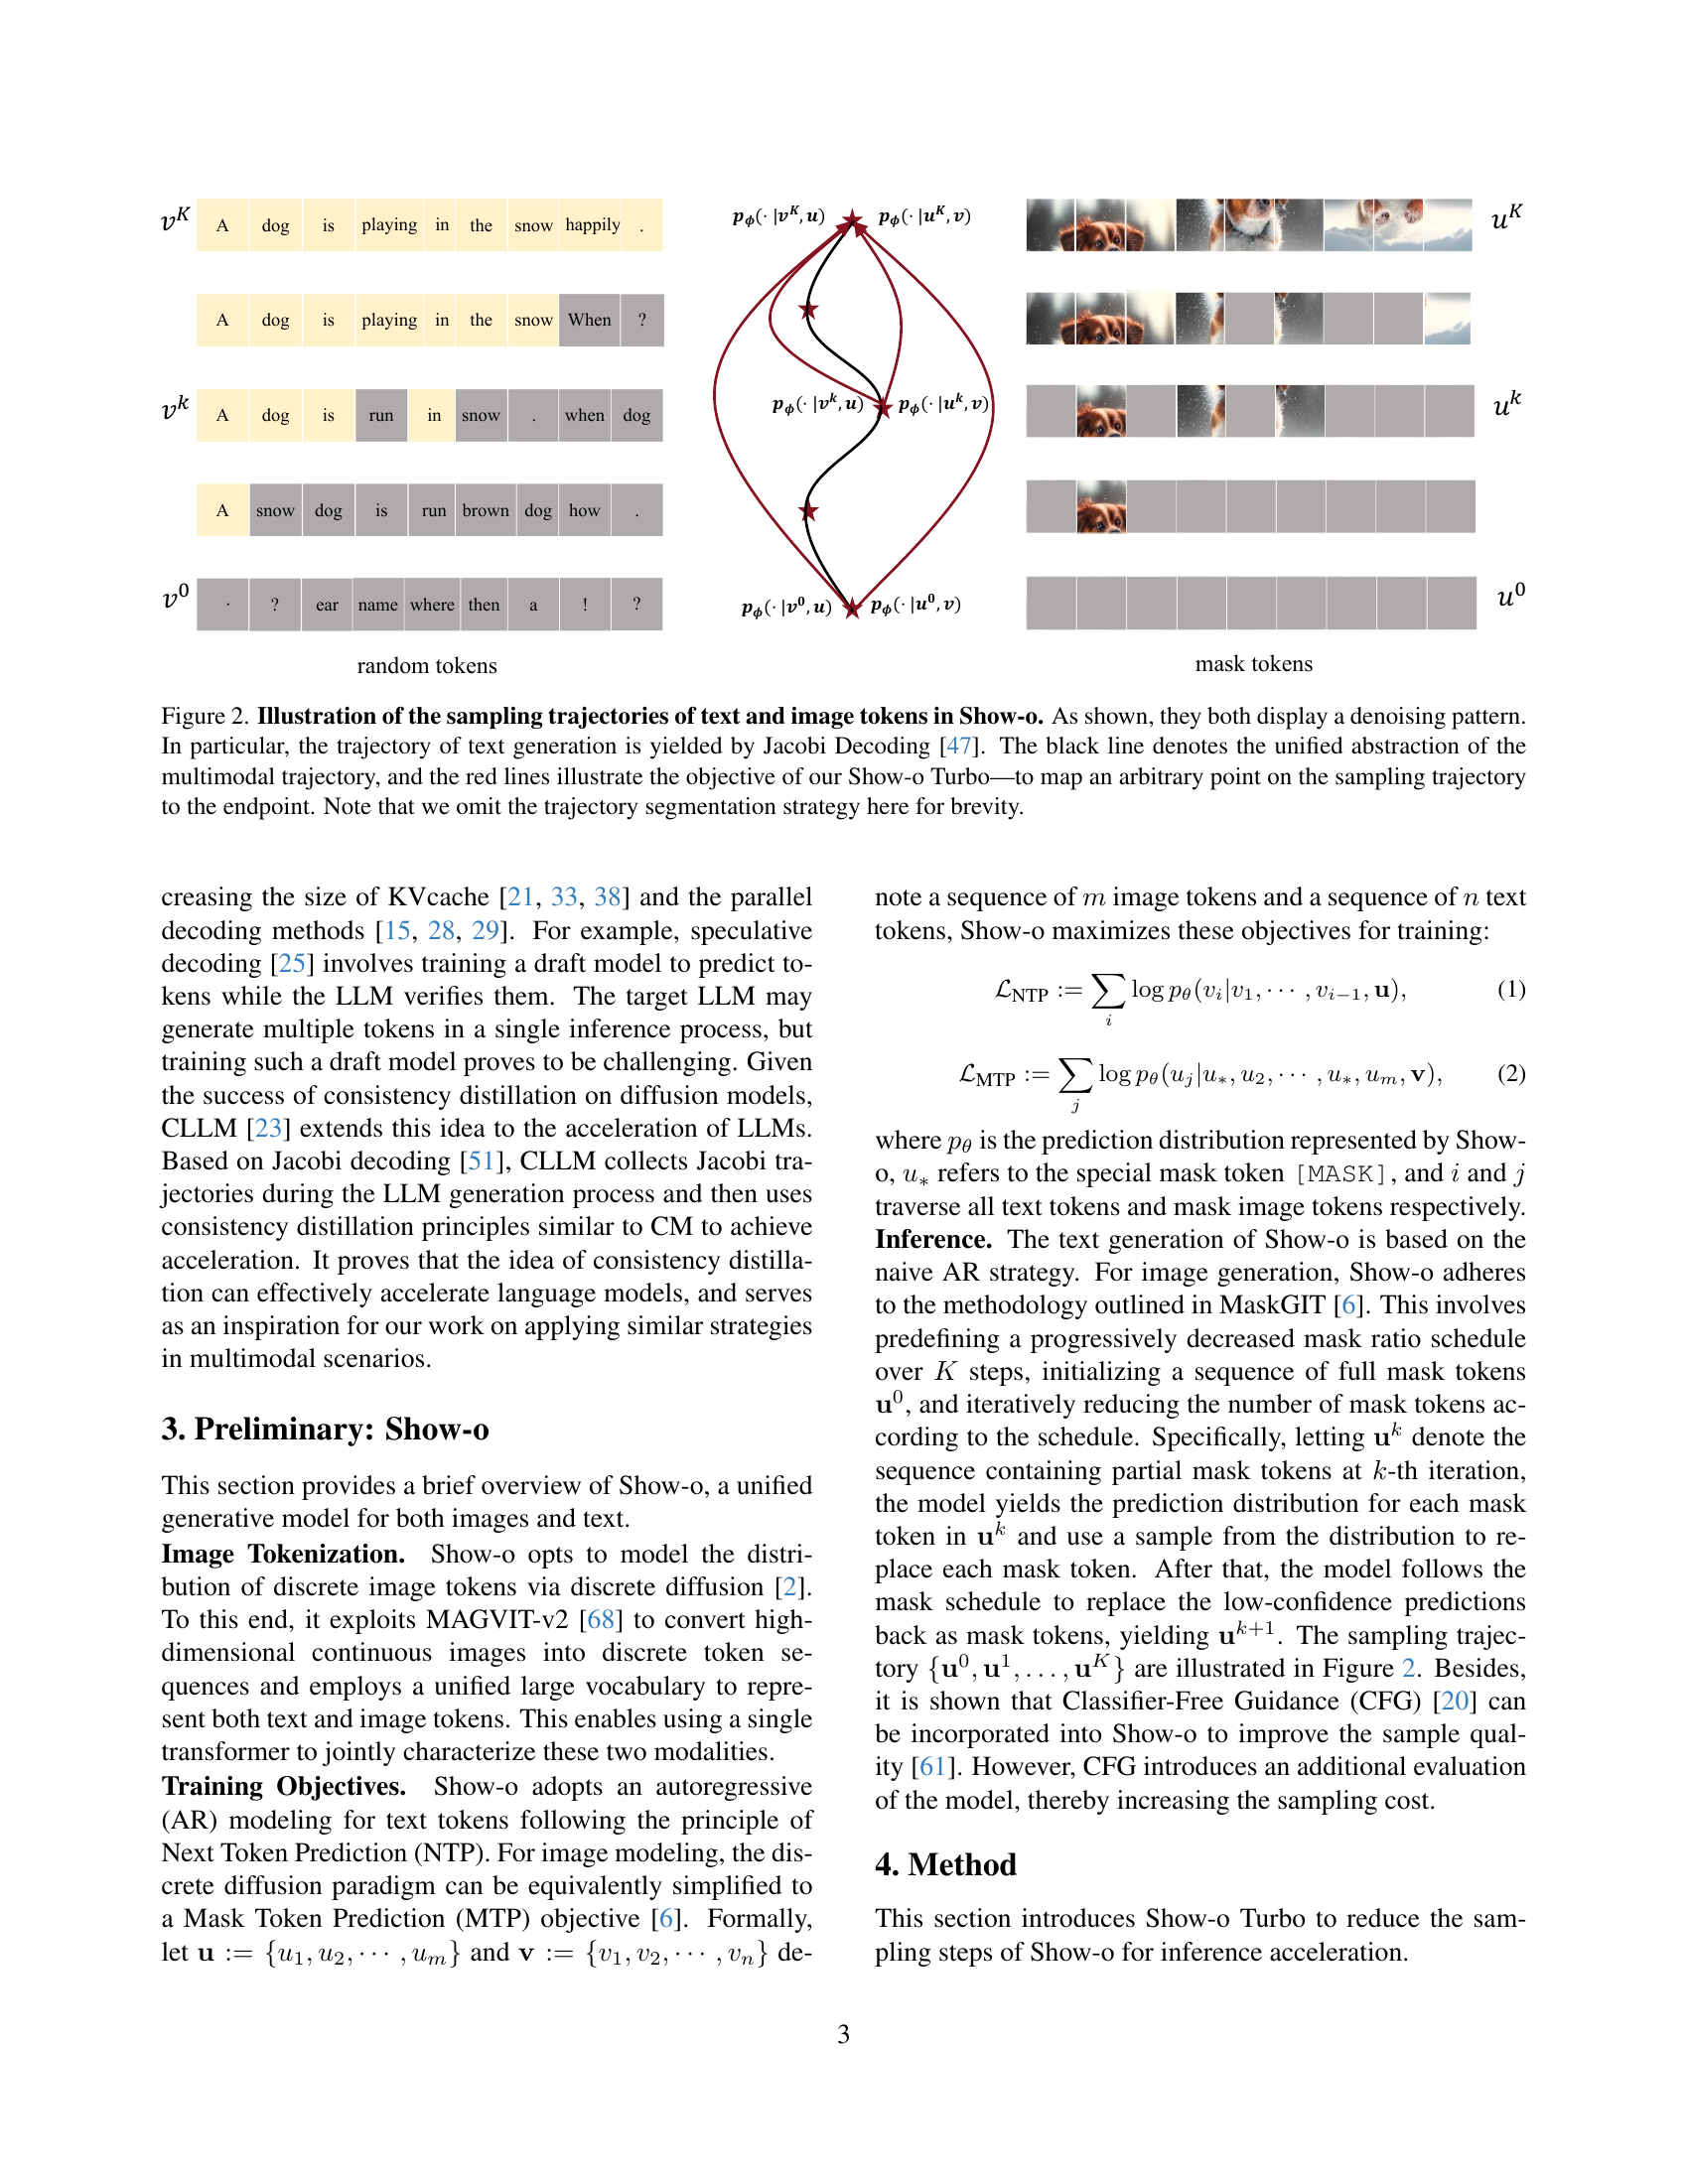
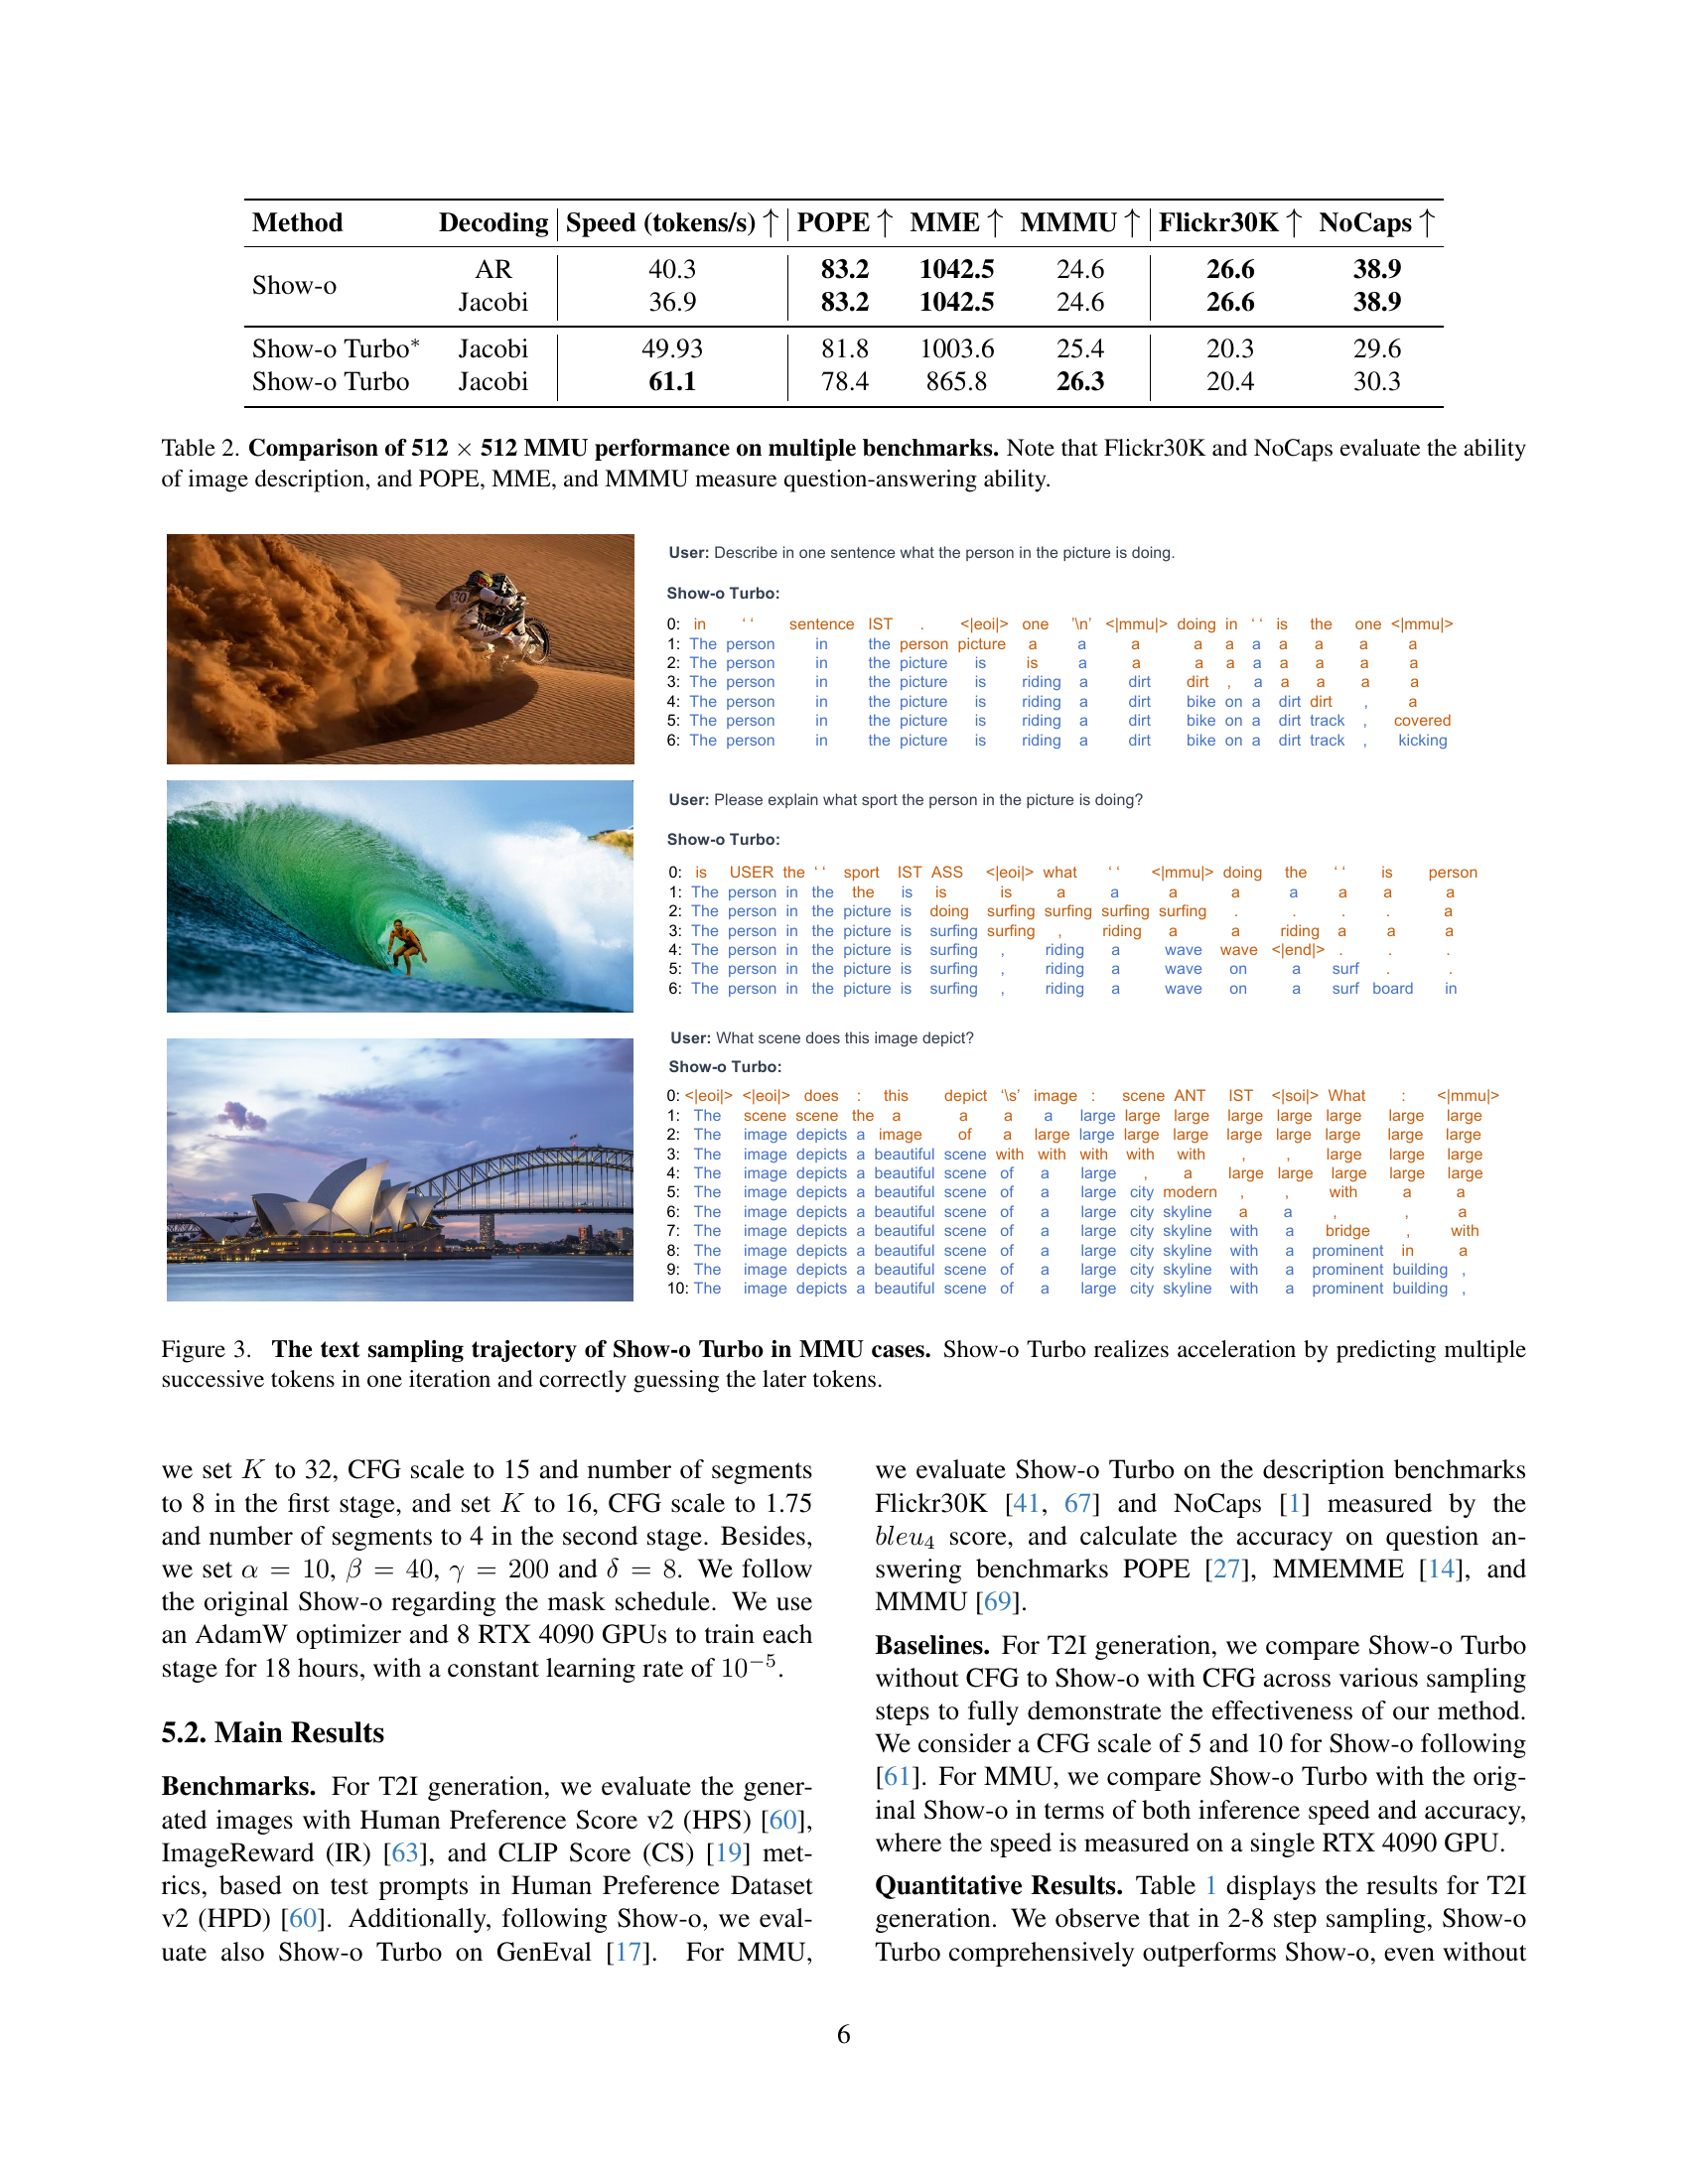
🔼 Figure 2 illustrates the process of generating text and images in the Show-o model. Both processes follow a denoising pattern, where noise is gradually removed from the initial random tokens to arrive at the final output. Text generation uses Jacobi Decoding, an iterative method refining multiple text tokens simultaneously. The black line represents a unified multimodal trajectory encompassing both image and text generation. Red lines show the goal of Show-o Turbo: to predict the final output from any point along this trajectory, thus accelerating the generation process. The figure simplifies the process by omitting trajectory segmentation details.
read the caption
Figure 2: Illustration of the sampling trajectories of text and image tokens in Show-o. As shown, they both display a denoising pattern. In particular, the trajectory of text generation is yielded by Jacobi Decoding [47]. The black line denotes the unified abstraction of the multimodal trajectory, and the red lines illustrate the objective of our Show-o Turbo—to map an arbitrary point on the sampling trajectory to the endpoint. Note that we omit the trajectory segmentation strategy here for brevity.

🔼 Show-o Turbo accelerates the text generation process in Multimodal Understanding (MMU) tasks by employing a parallel decoding strategy. Instead of generating tokens one at a time, Show-o Turbo predicts multiple tokens simultaneously in each iteration. The figure illustrates this process, showing how the model quickly converges towards the final, correct sequence of tokens. This parallel prediction significantly reduces the number of steps required for generation, leading to faster inference speeds.
read the caption
Figure 3: The text sampling trajectory of Show-o Turbo in MMU cases. Show-o Turbo realizes acceleration by predicting multiple successive tokens in one iteration and correctly guessing the later tokens.

🔼 This figure compares the image generation results of Show-o and Show-o Turbo models at 512x512 resolution using different numbers of sampling steps (16, 8, 4, 2). The images showcase various prompts and highlight the key difference: Show-o fails to generate coherent images when only two sampling steps are used, whereas Show-o Turbo produces good-quality images even with only two steps.
read the caption
Figure 4: Comparison between Show-o and Show-o Turbo on 512 resolution in T2I generation. The former crashes in two-step sampling, while the latter maintains good performance.
More on tables
| Method | Decoding | Speed (tokens/s) | POPE | MME | MMMU | Flickr30K | NoCaps |
|---|---|---|---|---|---|---|---|
| Show-o | AR | 40.3 | 83.2 | 1042.5 | 24.6 | 26.6 | 38.9 |
| Jacobi | 36.9 | 83.2 | 1042.5 | 24.6 | 26.6 | 38.9 | |
| Show-o Turbo∗ | Jacobi | 49.93 | 81.8 | 1003.6 | 25.4 | 20.3 | 29.6 |
| Show-o Turbo | Jacobi | 61.1 | 78.4 | 865.8 | 26.3 | 20.4 | 30.3 |
🔼 Table 2 presents a comprehensive evaluation of Show-o Turbo’s performance on various multimodal understanding (MMU) tasks using 512x512 images. The benchmarks are categorized into two types: image description and question answering. For image description, the table shows results on Flickr30K and NoCaps datasets, evaluating the model’s ability to generate accurate and fluent captions for given images. For question answering, the table presents results on POPE, MME, and MMMU datasets, assessing the model’s ability to correctly answer questions related to the images.
read the caption
Table 2: Comparison of 512 ×\times× 512 MMU performance on multiple benchmarks. Note that Flickr30K and NoCaps evaluate the ability of image description, and POPE, MME, and MMMU measure question-answering ability.
| Show-o (CFG=10) | Show-o Turbo |
|---|---|
16 Steps 8 Steps
 4 Steps
 2 Steps
 16 Steps
 8 Steps
 4 Steps
 2 Steps
 | |
| A cybernetic owl perched on a neon-lit branch, its mechanical feathers reflecting holographic patterns… | |


 | |
| A modern electric guitar with a flame maple top, its wood grain catching studio lights… | |


 | |
| A small succulent plant in a ceramic pot, its leaves forming a perfect geometric pattern… | |


 | |
| A traditional wooden chess piece on a marble board, its polished surface reflecting soft light… | |


 | |
| A detailed macro shot of a dragonfly perched on a thin blade of grass, its wings iridescent in the sunlight… | |


 | |
| A single, colorful autumn leaf floating on the surface of a calm pond… | |
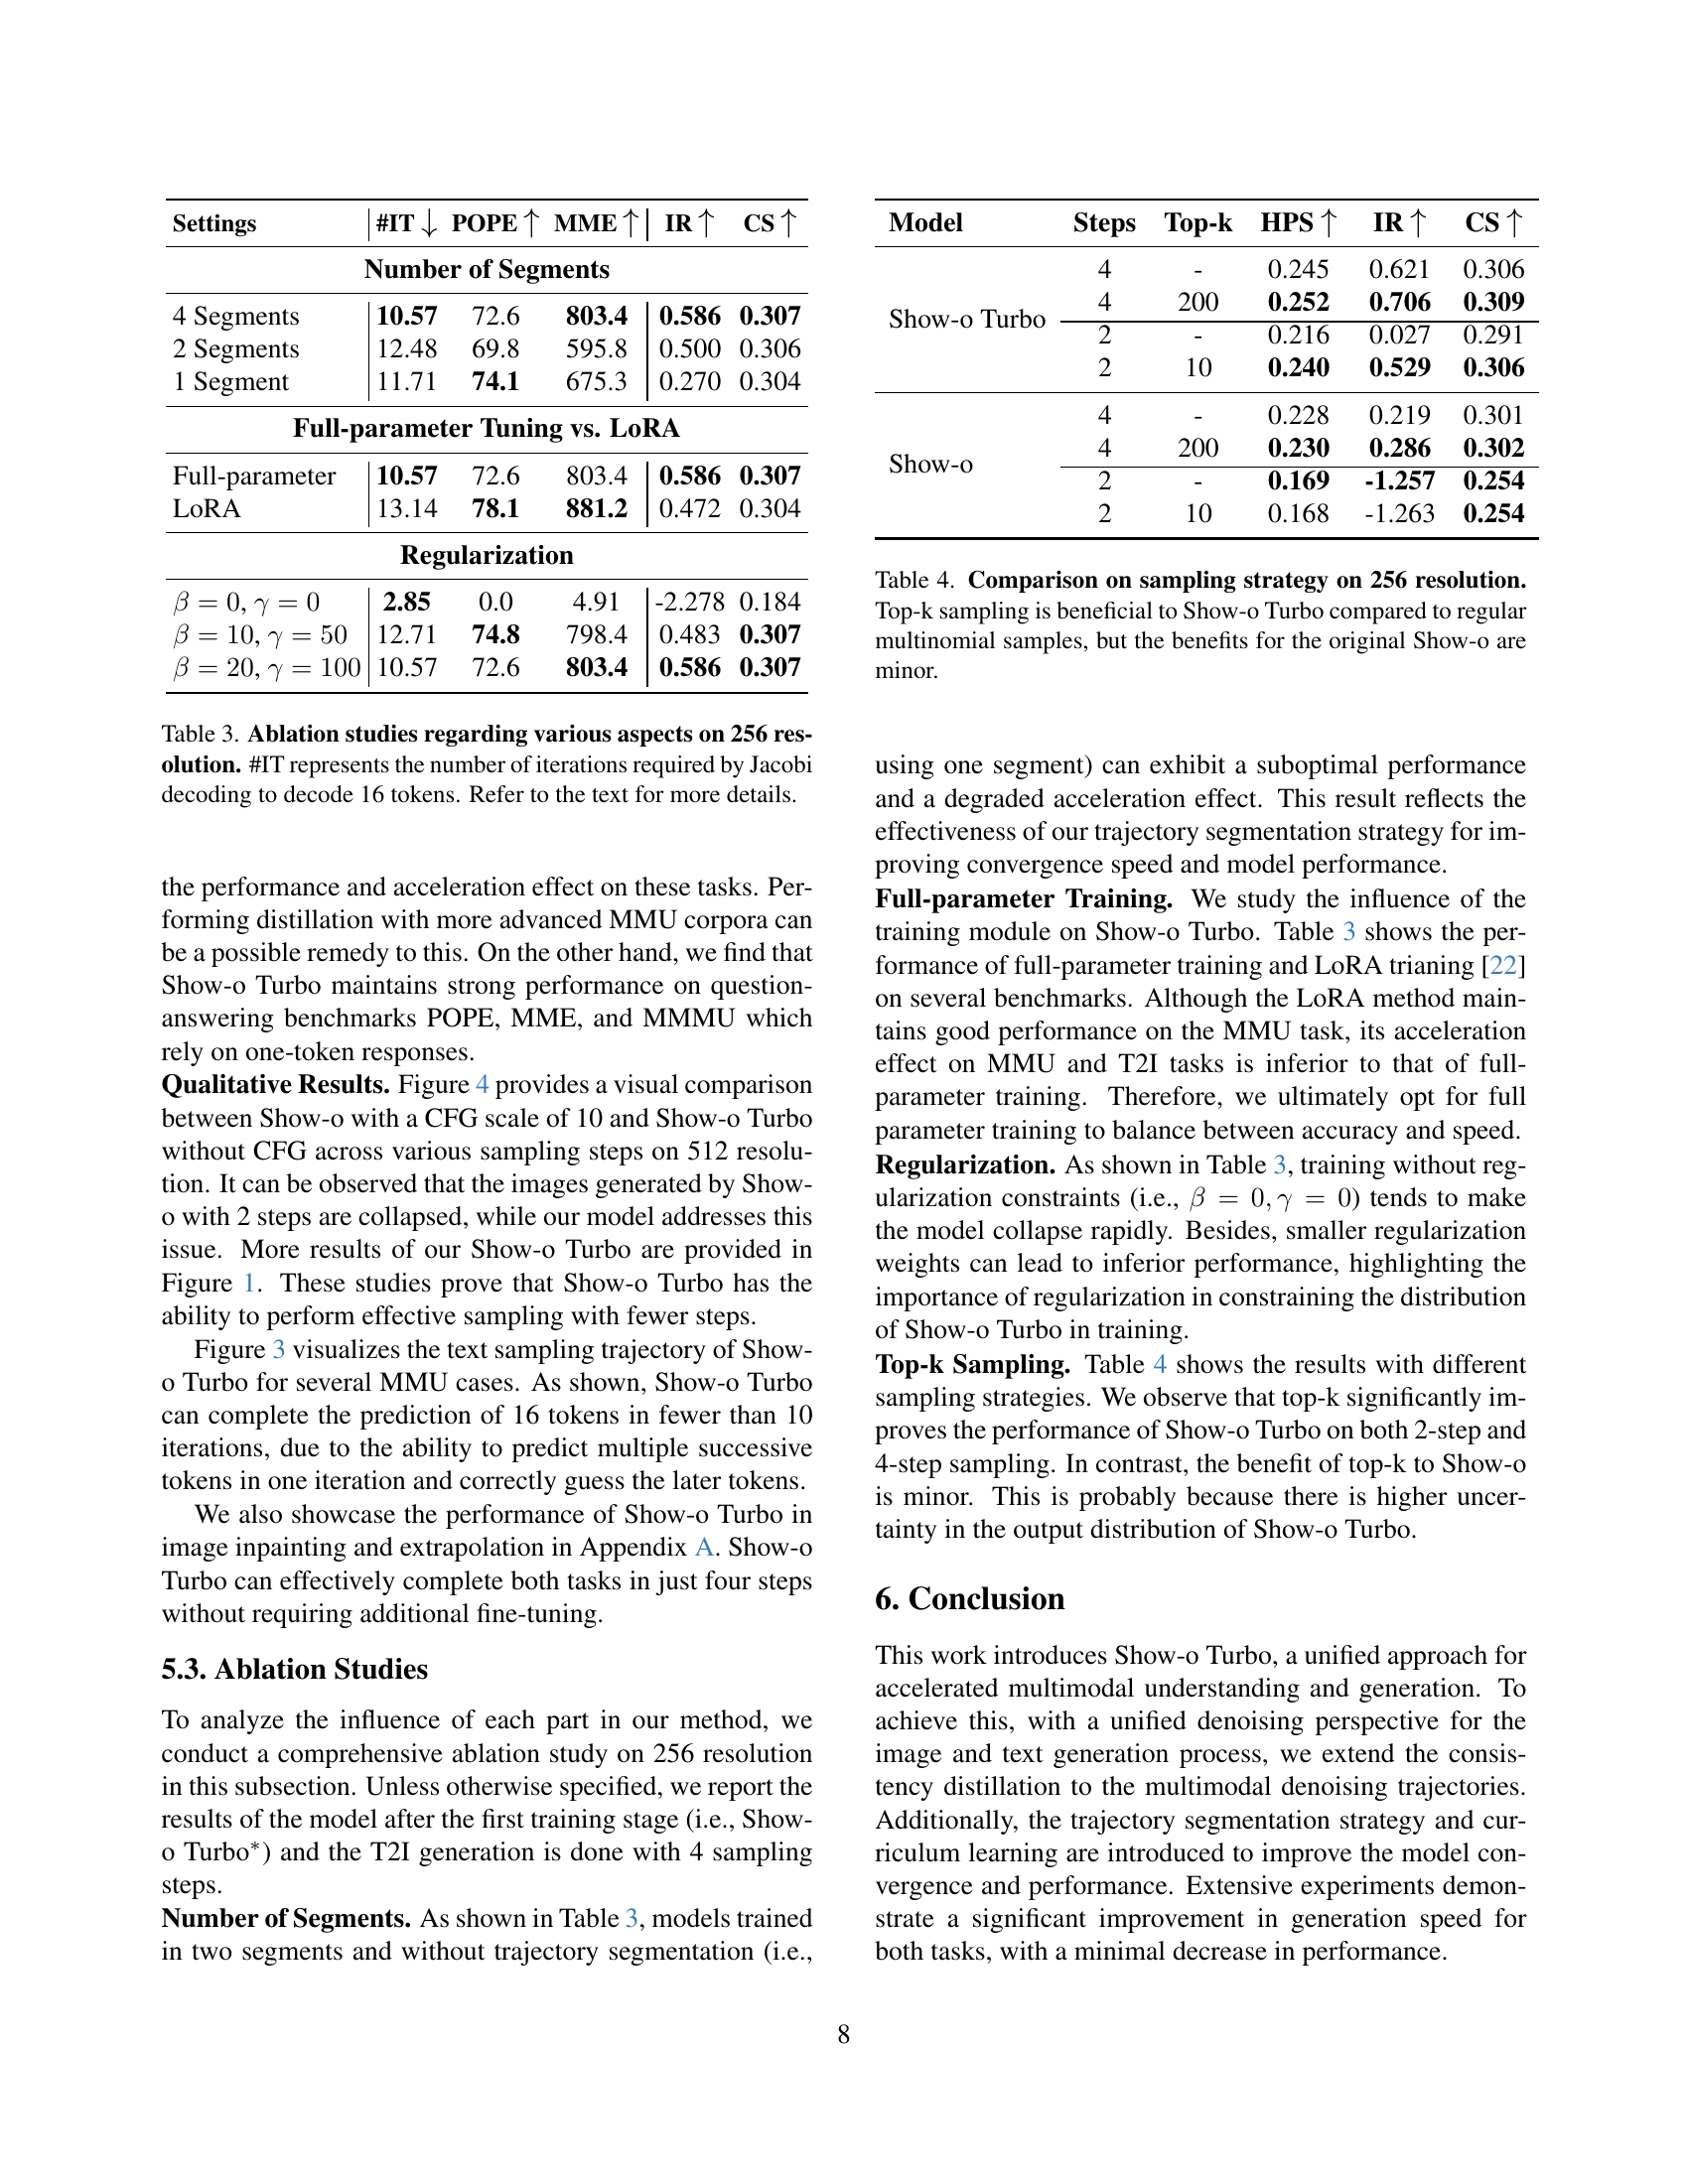
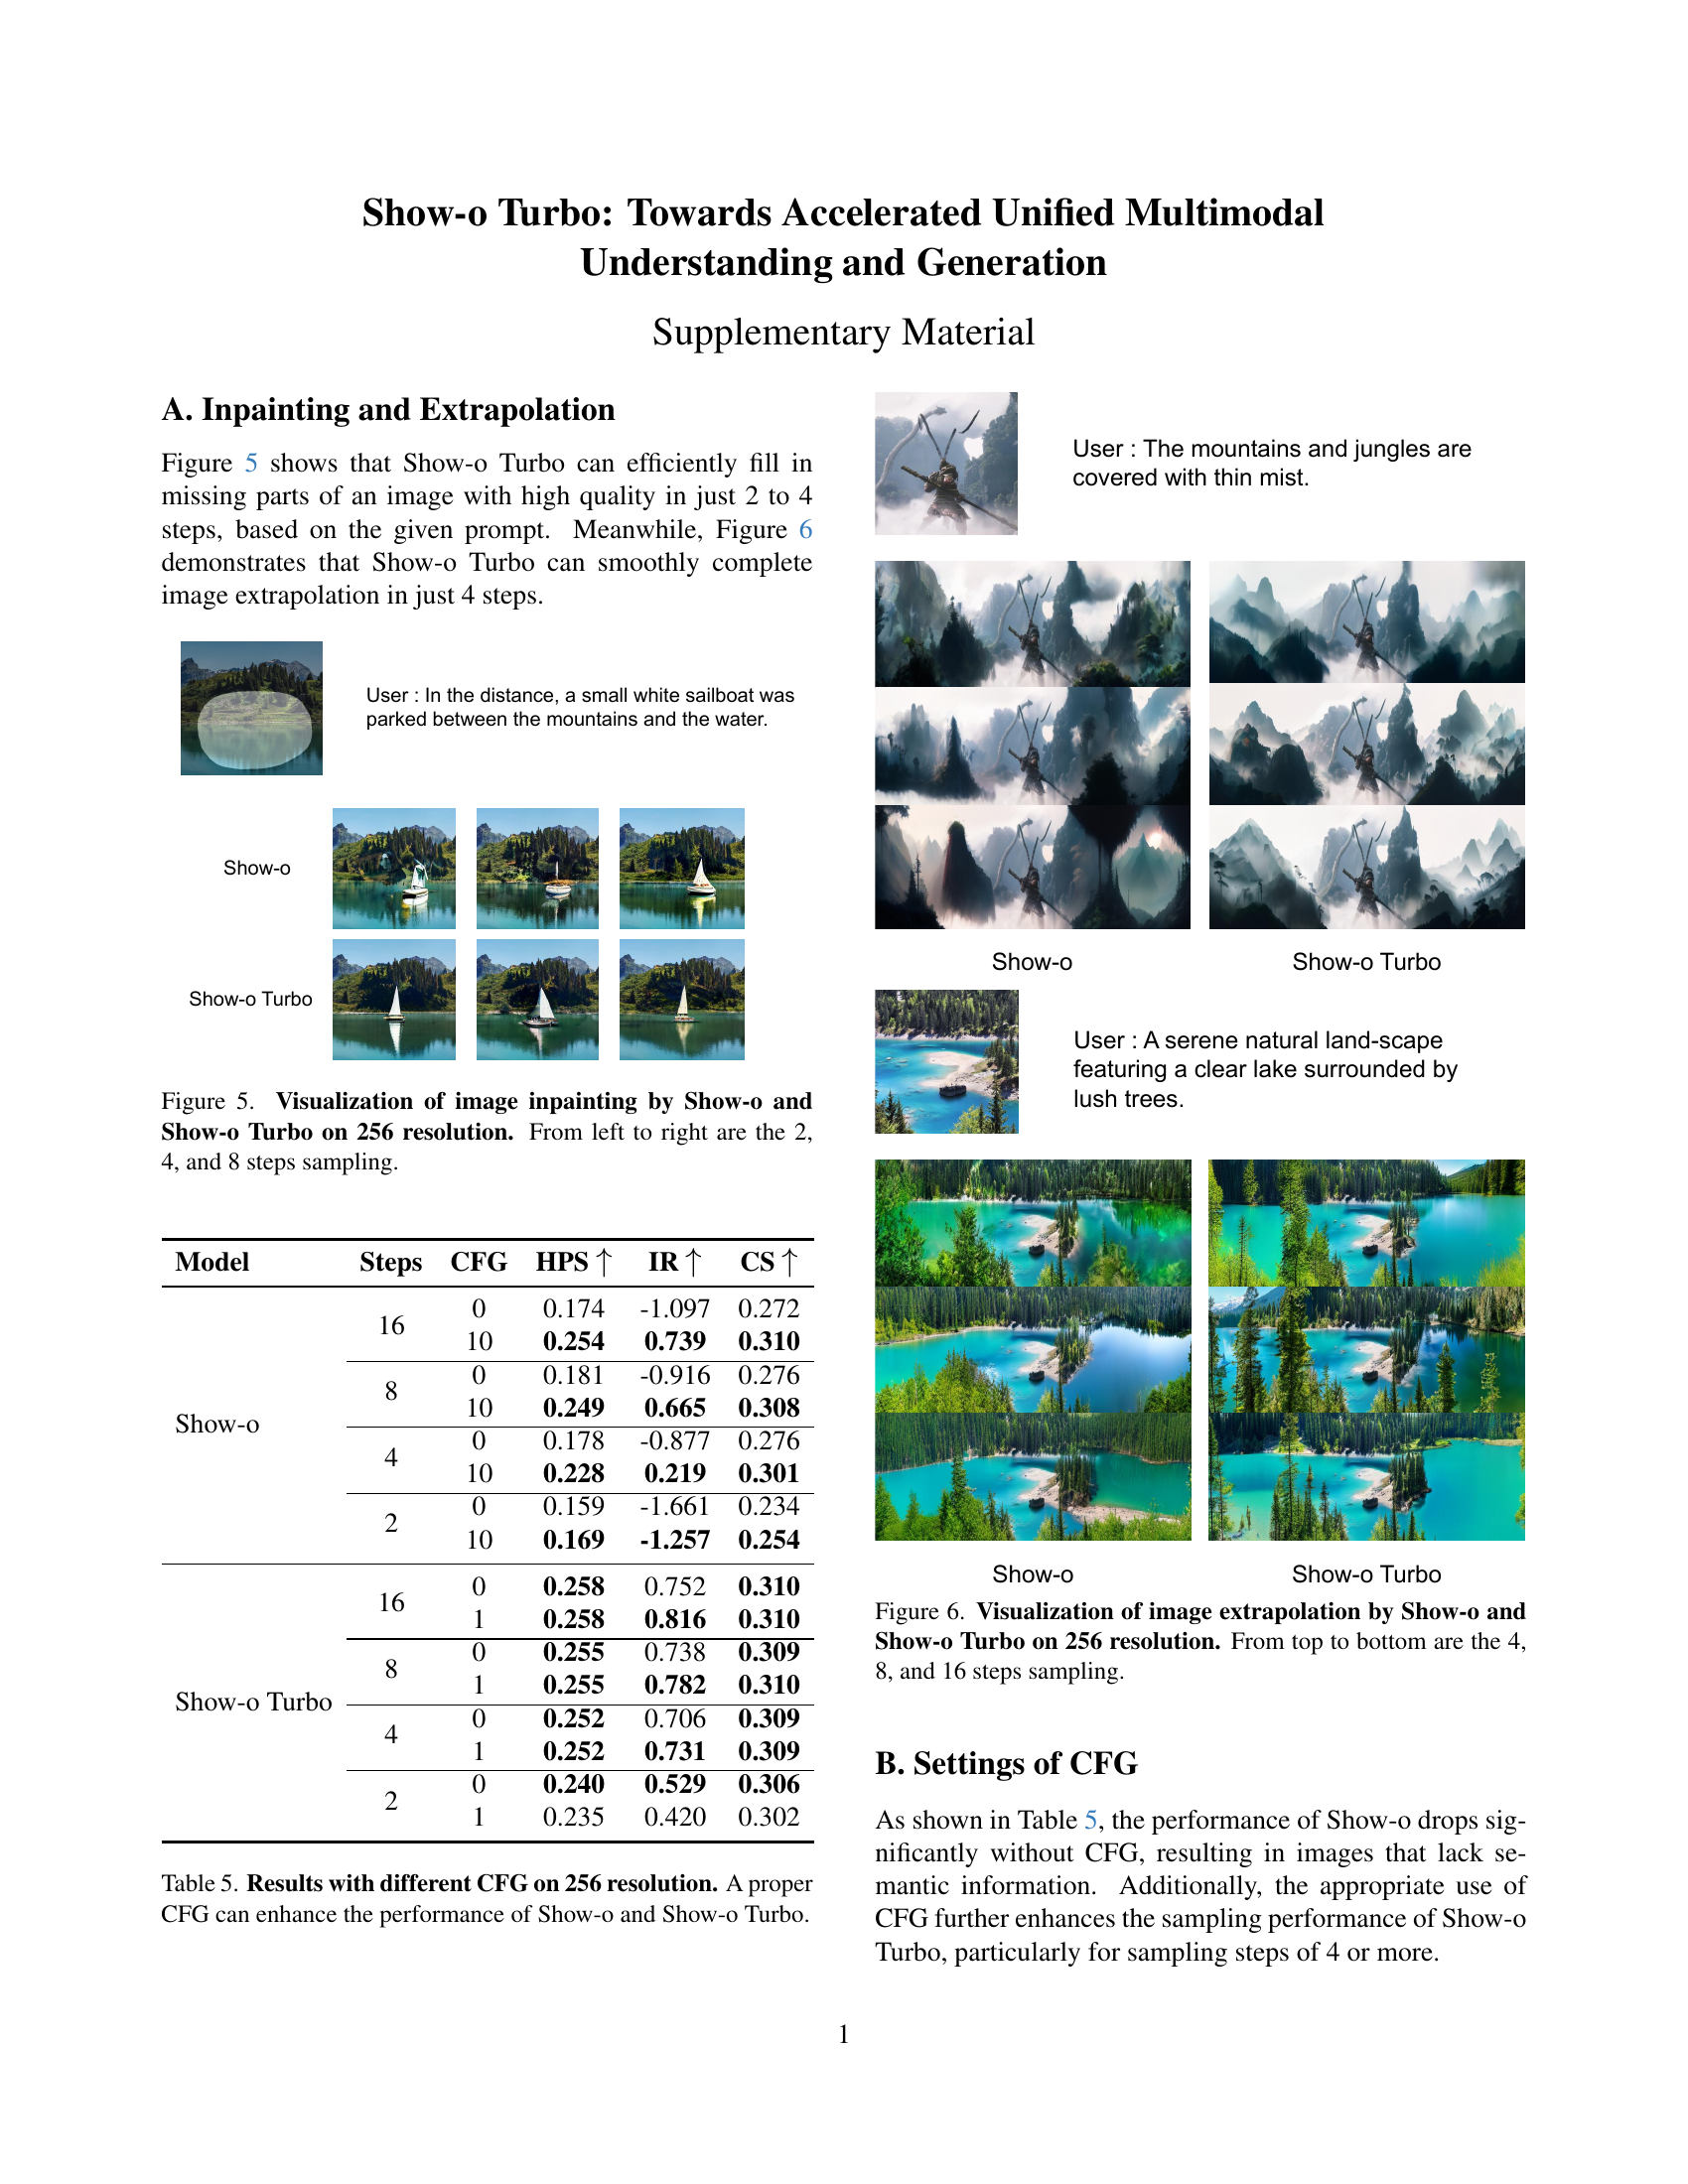
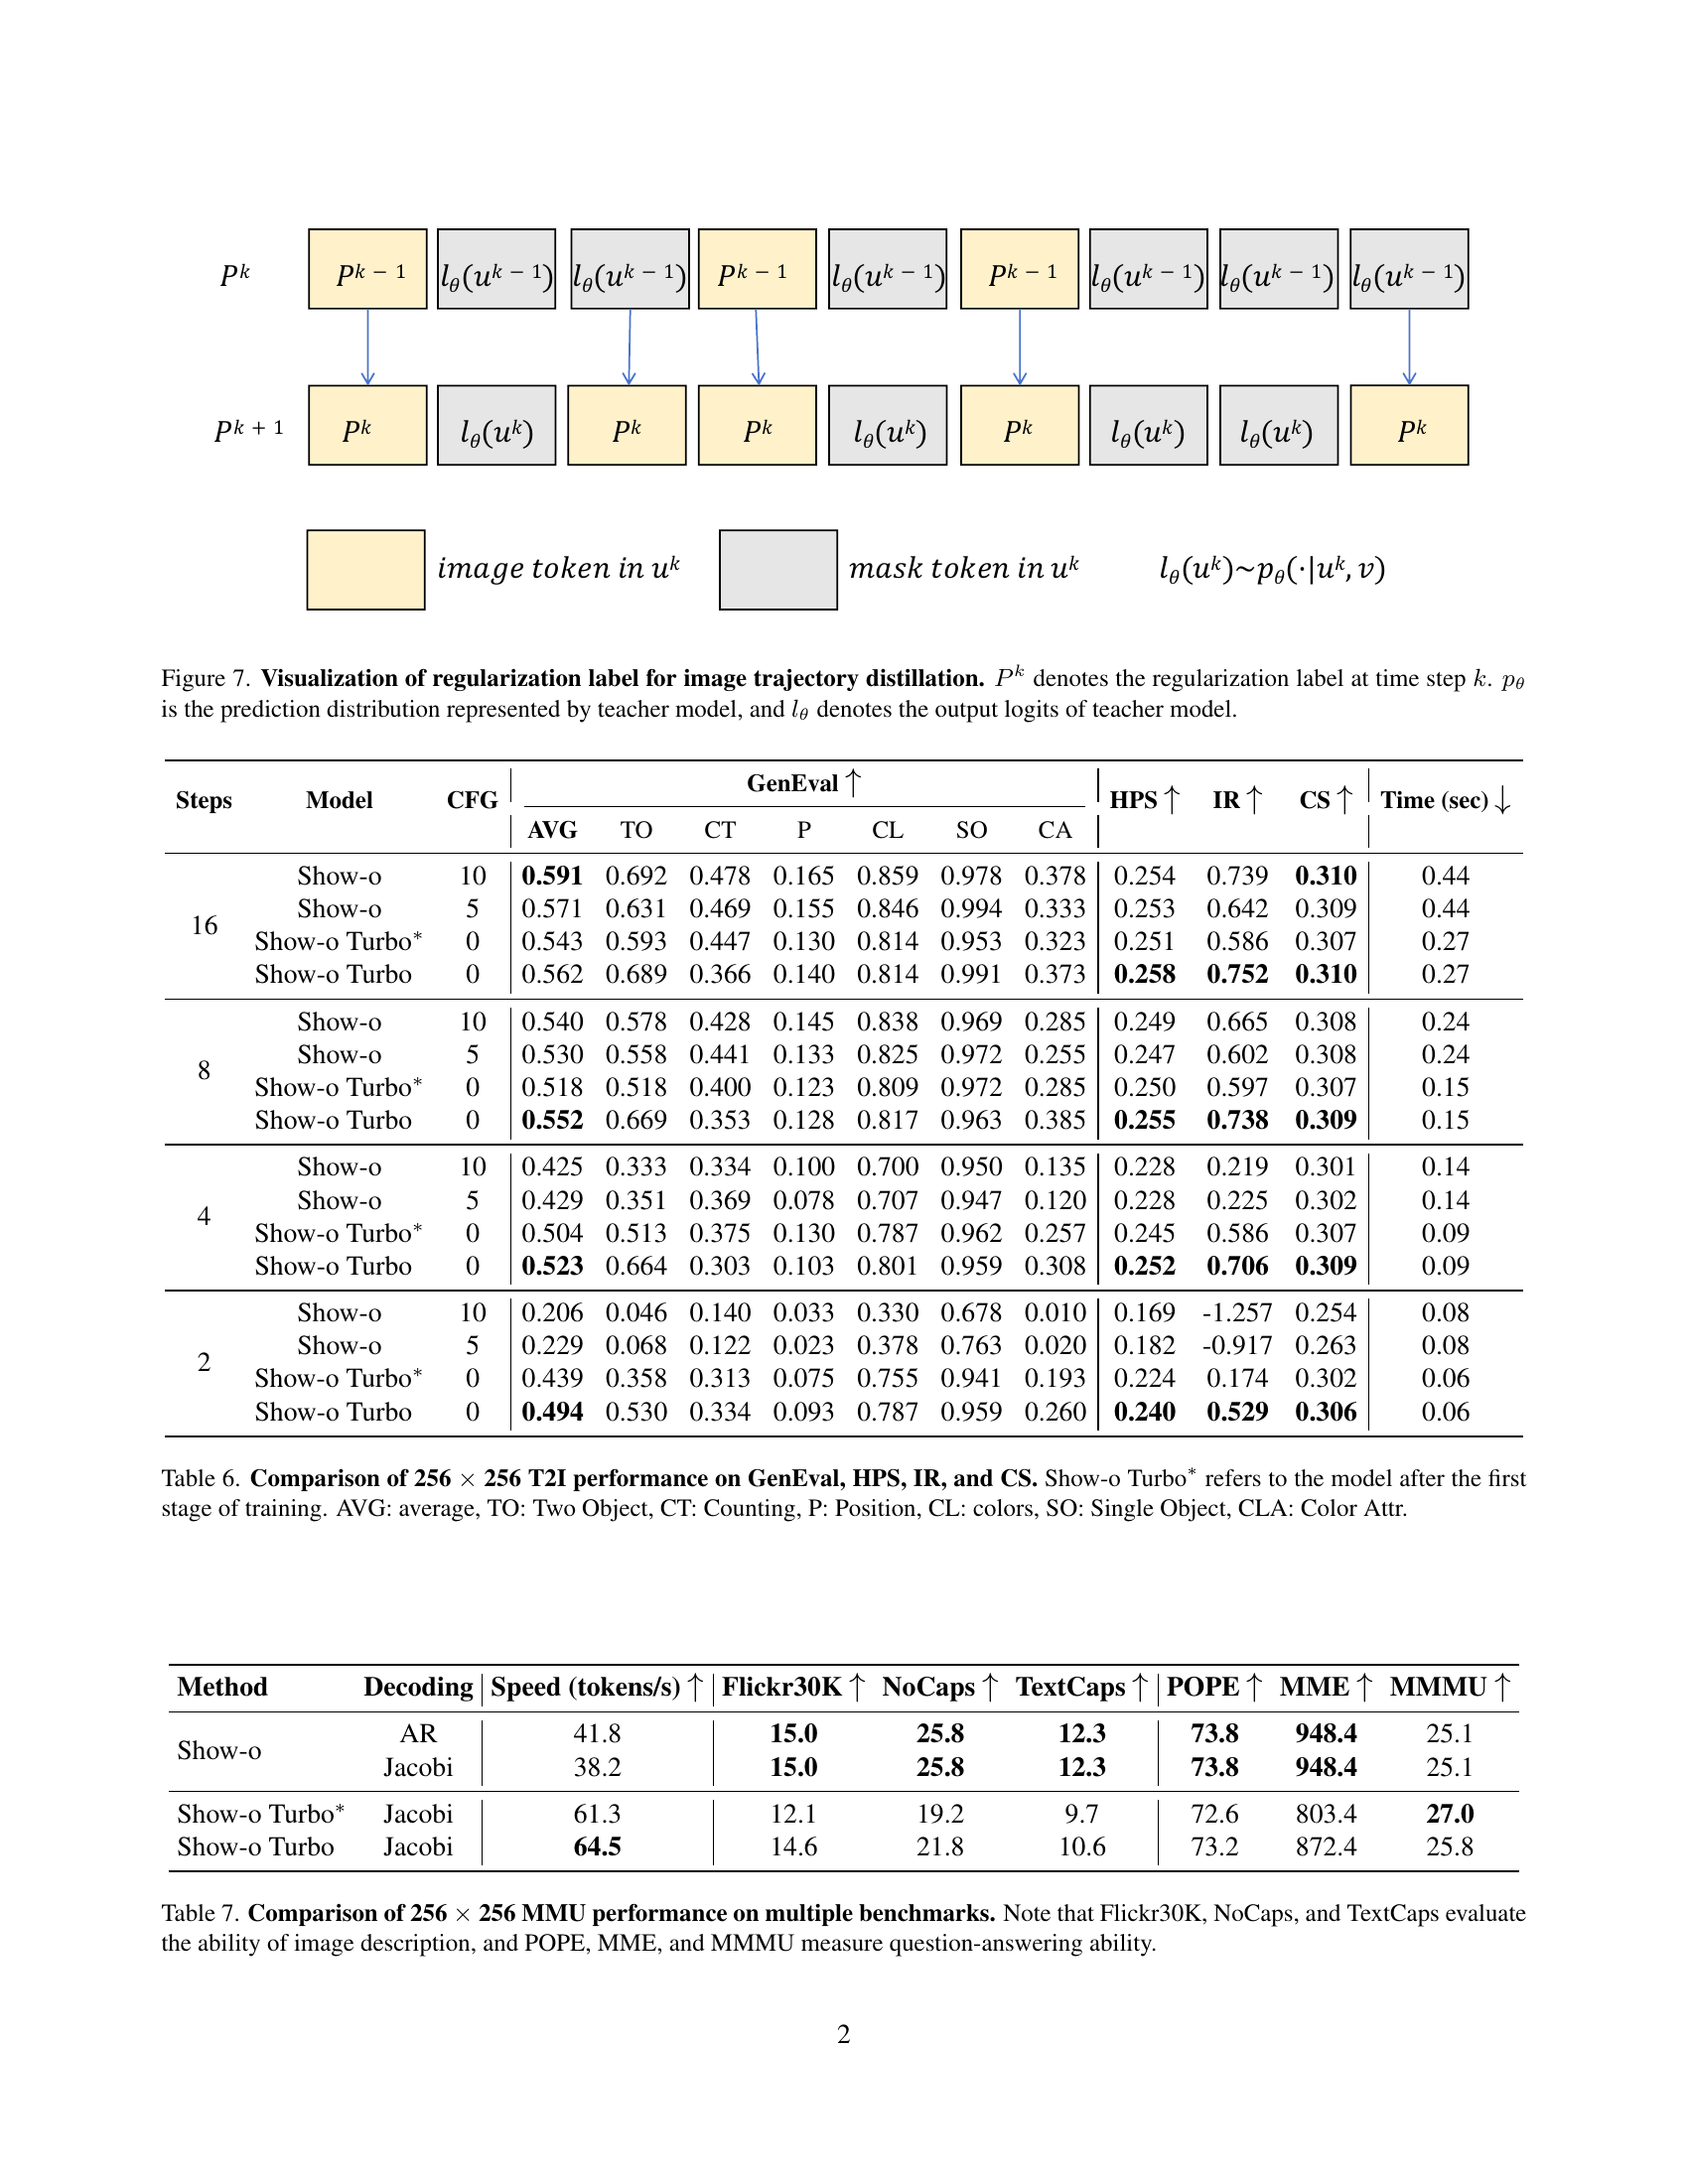
🔼 This table presents the results of ablation studies conducted on a 256-resolution model to analyze the impact of various factors on the model’s performance. These factors include the number of segments used in the trajectory segmentation, the method of parameter tuning (full parameter tuning vs. LoRA), and different regularization strategies (with varying regularization weights). The table shows how these factors affect key metrics including the number of iterations (’#IT’) needed to decode 16 tokens using Jacobi decoding, along with performance metrics on POPE, MME, IR, and CS. The results help to understand the contribution and optimal settings for each component in achieving effective model acceleration and performance.
read the caption
Table 3: Ablation studies regarding various aspects on 256 resolution. #IT represents the number of iterations required by Jacobi decoding to decode 16 tokens. Refer to the text for more details.
| Settings | #IT | POPE | MME | IR | CS |
|---|---|---|---|---|---|
| Number of Segments | |||||
| 4 Segments | 10.57 | 72.6 | 803.4 | 0.586 | 0.307 |
| 2 Segments | 12.48 | 69.8 | 595.8 | 0.500 | 0.306 |
| 1 Segment | 11.71 | 74.1 | 675.3 | 0.270 | 0.304 |
| Full-parameter Tuning vs. LoRA | |||||
| Full-parameter | 10.57 | 72.6 | 803.4 | 0.586 | 0.307 |
| LoRA | 13.14 | 78.1 | 881.2 | 0.472 | 0.304 |
| Regularization | |||||
| , | 2.85 | 0.0 | 4.91 | -2.278 | 0.184 |
| , | 12.71 | 74.8 | 798.4 | 0.483 | 0.307 |
| , | 10.57 | 72.6 | 803.4 | 0.586 | 0.307 |
🔼 Table 4 investigates the impact of different sampling strategies on the performance of Show-o and Show-o Turbo models. Specifically, it compares the results obtained using top-k sampling and regular multinomial sampling for both models. The results reveal that top-k sampling is more beneficial for Show-o Turbo, leading to improved performance compared to multinomial sampling. In contrast, the benefits of top-k sampling for the original Show-o model are less significant.
read the caption
Table 4: Comparison on sampling strategy on 256 resolution. Top-k sampling is beneficial to Show-o Turbo compared to regular multinomial samples, but the benefits for the original Show-o are minor.
| Model | Steps | Top-k | HPS | IR | CS |
|---|---|---|---|---|---|
| Show-o Turbo | 4 | - | 0.245 | 0.621 | 0.306 |
| 4 | 200 | 0.252 | 0.706 | 0.309 | |
| 2 | - | 0.216 | 0.027 | 0.291 | |
| 2 | 10 | 0.240 | 0.529 | 0.306 | |
| Show-o | 4 | - | 0.228 | 0.219 | 0.301 |
| 4 | 200 | 0.230 | 0.286 | 0.302 | |
| 2 | - | 0.169 | -1.257 | 0.254 | |
| 2 | 10 | 0.168 | -1.263 | 0.254 |
🔼 This table presents the results of experiments conducted to evaluate the impact of classifier-free guidance (CFG) on the performance of both the original Show-o model and the Show-o Turbo model. The experiments were performed at a 256x256 resolution. The table shows how different CFG settings affect key metrics, demonstrating the potential of CFG to improve the performance of both models. It highlights that a properly tuned CFG value can lead to better results in image generation for both Show-o and Show-o Turbo.
read the caption
Table 5: Results with different CFG on 256 resolution. A proper CFG can enhance the performance of Show-o and Show-o Turbo.
| Model | Steps | CFG | HPS | IR | CS |
|---|---|---|---|---|---|
| Show-o | 16 | 0 | 0.174 | -1.097 | 0.272 |
| 10 | 0.254 | 0.739 | 0.310 | ||
| 8 | 0 | 0.181 | -0.916 | 0.276 | |
| 10 | 0.249 | 0.665 | 0.308 | ||
| 4 | 0 | 0.178 | -0.877 | 0.276 | |
| 10 | 0.228 | 0.219 | 0.301 | ||
| 2 | 0 | 0.159 | -1.661 | 0.234 | |
| 10 | 0.169 | -1.257 | 0.254 | ||
| Show-o Turbo | 16 | 0 | 0.258 | 0.752 | 0.310 |
| 1 | 0.258 | 0.816 | 0.310 | ||
| 8 | 0 | 0.255 | 0.738 | 0.309 | |
| 1 | 0.255 | 0.782 | 0.310 | ||
| 4 | 0 | 0.252 | 0.706 | 0.309 | |
| 1 | 0.252 | 0.731 | 0.309 | ||
| 2 | 0 | 0.240 | 0.529 | 0.306 | |
| 1 | 0.235 | 0.420 | 0.302 |
🔼 This table presents a quantitative comparison of the performance of Show-o and Show-o Turbo on text-to-image (T2I) generation tasks using 256x256 resolution images. Multiple metrics are used for evaluation, including GenEval (overall generation quality), HPS (Human Preference Score), IR (ImageReward), and CS (CLIP Score). The results are broken down by the number of sampling steps used during inference (16, 8, 4, 2), and whether classifier-free guidance (CFG) was employed. A key distinction is made between Show-o Turbo* (trained in the first stage) and the fully trained Show-o Turbo. The caption also provides a key explaining abbreviations used in the table such as AVG (average), TO (Two Object), CT (Counting), P (Position), CL (colors), SO (Single Object), and CLA (Color Attr).
read the caption
Table 6: Comparison of 256 ×\times× 256 T2I performance on GenEval, HPS, IR, and CS. Show-o Turbo∗ refers to the model after the first stage of training. AVG: average, TO: Two Object, CT: Counting, P: Position, CL: colors, SO: Single Object, CLA: Color Attr.
| Steps | Model | CFG | GenEval | HPS | IR | CS | Time (sec) | ||||||
|---|---|---|---|---|---|---|---|---|---|---|---|---|---|
| AVG | TO | CT | P | CL | SO | CA | |||||||
| 16 | Show-o | 10 | 0.591 | 0.692 | 0.478 | 0.165 | 0.859 | 0.978 | 0.378 | 0.254 | 0.739 | 0.310 | 0.44 |
| Show-o | 5 | 0.571 | 0.631 | 0.469 | 0.155 | 0.846 | 0.994 | 0.333 | 0.253 | 0.642 | 0.309 | 0.44 | |
| Show-o Turbo∗ | 0 | 0.543 | 0.593 | 0.447 | 0.130 | 0.814 | 0.953 | 0.323 | 0.251 | 0.586 | 0.307 | 0.27 | |
| Show-o Turbo | 0 | 0.562 | 0.689 | 0.366 | 0.140 | 0.814 | 0.991 | 0.373 | 0.258 | 0.752 | 0.310 | 0.27 | |
| 8 | Show-o | 10 | 0.540 | 0.578 | 0.428 | 0.145 | 0.838 | 0.969 | 0.285 | 0.249 | 0.665 | 0.308 | 0.24 |
| Show-o | 5 | 0.530 | 0.558 | 0.441 | 0.133 | 0.825 | 0.972 | 0.255 | 0.247 | 0.602 | 0.308 | 0.24 | |
| Show-o Turbo∗ | 0 | 0.518 | 0.518 | 0.400 | 0.123 | 0.809 | 0.972 | 0.285 | 0.250 | 0.597 | 0.307 | 0.15 | |
| Show-o Turbo | 0 | 0.552 | 0.669 | 0.353 | 0.128 | 0.817 | 0.963 | 0.385 | 0.255 | 0.738 | 0.309 | 0.15 | |
| 4 | Show-o | 10 | 0.425 | 0.333 | 0.334 | 0.100 | 0.700 | 0.950 | 0.135 | 0.228 | 0.219 | 0.301 | 0.14 |
| Show-o | 5 | 0.429 | 0.351 | 0.369 | 0.078 | 0.707 | 0.947 | 0.120 | 0.228 | 0.225 | 0.302 | 0.14 | |
| Show-o Turbo∗ | 0 | 0.504 | 0.513 | 0.375 | 0.130 | 0.787 | 0.962 | 0.257 | 0.245 | 0.586 | 0.307 | 0.09 | |
| Show-o Turbo | 0 | 0.523 | 0.664 | 0.303 | 0.103 | 0.801 | 0.959 | 0.308 | 0.252 | 0.706 | 0.309 | 0.09 | |
| 2 | Show-o | 10 | 0.206 | 0.046 | 0.140 | 0.033 | 0.330 | 0.678 | 0.010 | 0.169 | -1.257 | 0.254 | 0.08 |
| Show-o | 5 | 0.229 | 0.068 | 0.122 | 0.023 | 0.378 | 0.763 | 0.020 | 0.182 | -0.917 | 0.263 | 0.08 | |
| Show-o Turbo∗ | 0 | 0.439 | 0.358 | 0.313 | 0.075 | 0.755 | 0.941 | 0.193 | 0.224 | 0.174 | 0.302 | 0.06 | |
| Show-o Turbo | 0 | 0.494 | 0.530 | 0.334 | 0.093 | 0.787 | 0.959 | 0.260 | 0.240 | 0.529 | 0.306 | 0.06 | |
🔼 Table 7 presents a comparison of the performance of different models on various multimodal understanding (MMU) benchmarks using 256x256 resolution images. The benchmarks assess two key aspects of MMU: image description and question-answering. Image description capabilities are evaluated using Flickr30K, NoCaps, and TextCaps datasets, while question-answering performance is measured using the POPE, MME, and MMMU benchmarks. The table allows for a direct comparison of the different models’ strengths and weaknesses across these diverse MMU tasks.
read the caption
Table 7: Comparison of 256 ×\times× 256 MMU performance on multiple benchmarks. Note that Flickr30K, NoCaps, and TextCaps evaluate the ability of image description, and POPE, MME, and MMMU measure question-answering ability.
Full paper#