TL;DR#
Current industrial anomaly detection datasets suffer from limitations like insufficient defect samples, unrealistic defect types and lack of real-world scenarios, hindering the development of highly accurate detection algorithms. This paper introduces a solution by creating 3CAD, a large-scale, real-world dataset of 3C products with diverse anomalies. The images in 3CAD have pixel-level anomaly labels and contain multiple anomaly types per image.
To handle the challenges posed by 3CAD, this paper also proposes a new anomaly detection framework called CFRG (Coarse-to-Fine detection paradigm with Recovery Guidance). CFRG uses a coarse-to-fine approach, leveraging heterogeneous distillation for coarse localization followed by fine localization via segmentation and a recovery network to better capture normal patterns. Experiments on 3CAD and benchmark datasets show that CFRG is competitive and provides a significant improvement compared to state-of-the-art methods. The availability of this challenging dataset will foster future research in unsupervised anomaly detection and encourage more robust solutions.
Key Takeaways#
Why does it matter?#
This paper is crucial for researchers in anomaly detection because it introduces a new, large-scale, real-world dataset (3CAD) specifically for 3C product quality control. This addresses the limitations of existing datasets which often lack real-world defects, hindering the development of robust and practical algorithms. Further, the proposed CFRG framework offers a novel approach to unsupervised anomaly detection, improving accuracy and localization. This work thus opens new avenues for algorithm development and benchmark testing, advancing the field considerably.
Visual Insights#

🔼 This figure illustrates the difference between the traditional reverse distillation method for anomaly detection and the novel approach proposed in the paper. The traditional method (left panel) involves distilling knowledge from a teacher network trained on abnormal data to a student network for anomaly detection. In contrast, the proposed method (right panel) uses a heterogeneous distillation paradigm with recovery guidance. This new method involves using both normal and abnormal samples to train teacher networks with different architectures. These teachers extract diverse features that are then combined in a student network, improving the localization of defects. Furthermore, a recovery network is used to restore the normal features from abnormal ones which helps capture normal patterns and guide the detection process. This novel approach is especially useful for detecting small defects which are commonly missed by traditional methods.
read the caption
Figure 1: Comparison of previous anomaly detection distillation paradigm with our paradigm. First row: Left: reverse distillation; Right: our proposed paradigm.
| Category |
|
|
|
|
|
|
|
| ||||||||||||||||
|---|---|---|---|---|---|---|---|---|---|---|---|---|---|---|---|---|---|---|---|---|---|---|---|---|
| ACC | 784 | 1446 | 369 | 1077 | 10 | 2881024 | 2881024 | 16/11 | ||||||||||||||||
| AI | 2096 | 2047 | 913 | 1134 | 3 | 7601024 | 6001024 | 110/12 | ||||||||||||||||
| AMF | 1548 | 1479 | 731 | 748 | 5 | 5401024 | 800950 | 19/14 | ||||||||||||||||
| ANMF | 1072 | 1406 | 670 | 736 | 6 | 4001024 | 4301024 | 16/12 | ||||||||||||||||
| ANI | 2233 | 4936 | 999 | 3937 | 4 | 4201024 | 5801024 | 123/12 | ||||||||||||||||
| AP | 1698 | 3161 | 911 | 2250 | 14 | 4301024 | 4091024 | 112/13 | ||||||||||||||||
| CS | 409 | 959 | 196 | 763 | 1 | 10241024 | 10241024 | 19/11 | ||||||||||||||||
| IS | 653 | 1112 | 295 | 817 | 4 | 10241024 | 10241024 | 112/12 | ||||||||||||||||
| All | 10493 | 16546 | 5084 | 11462 | 47 | - | - | - |
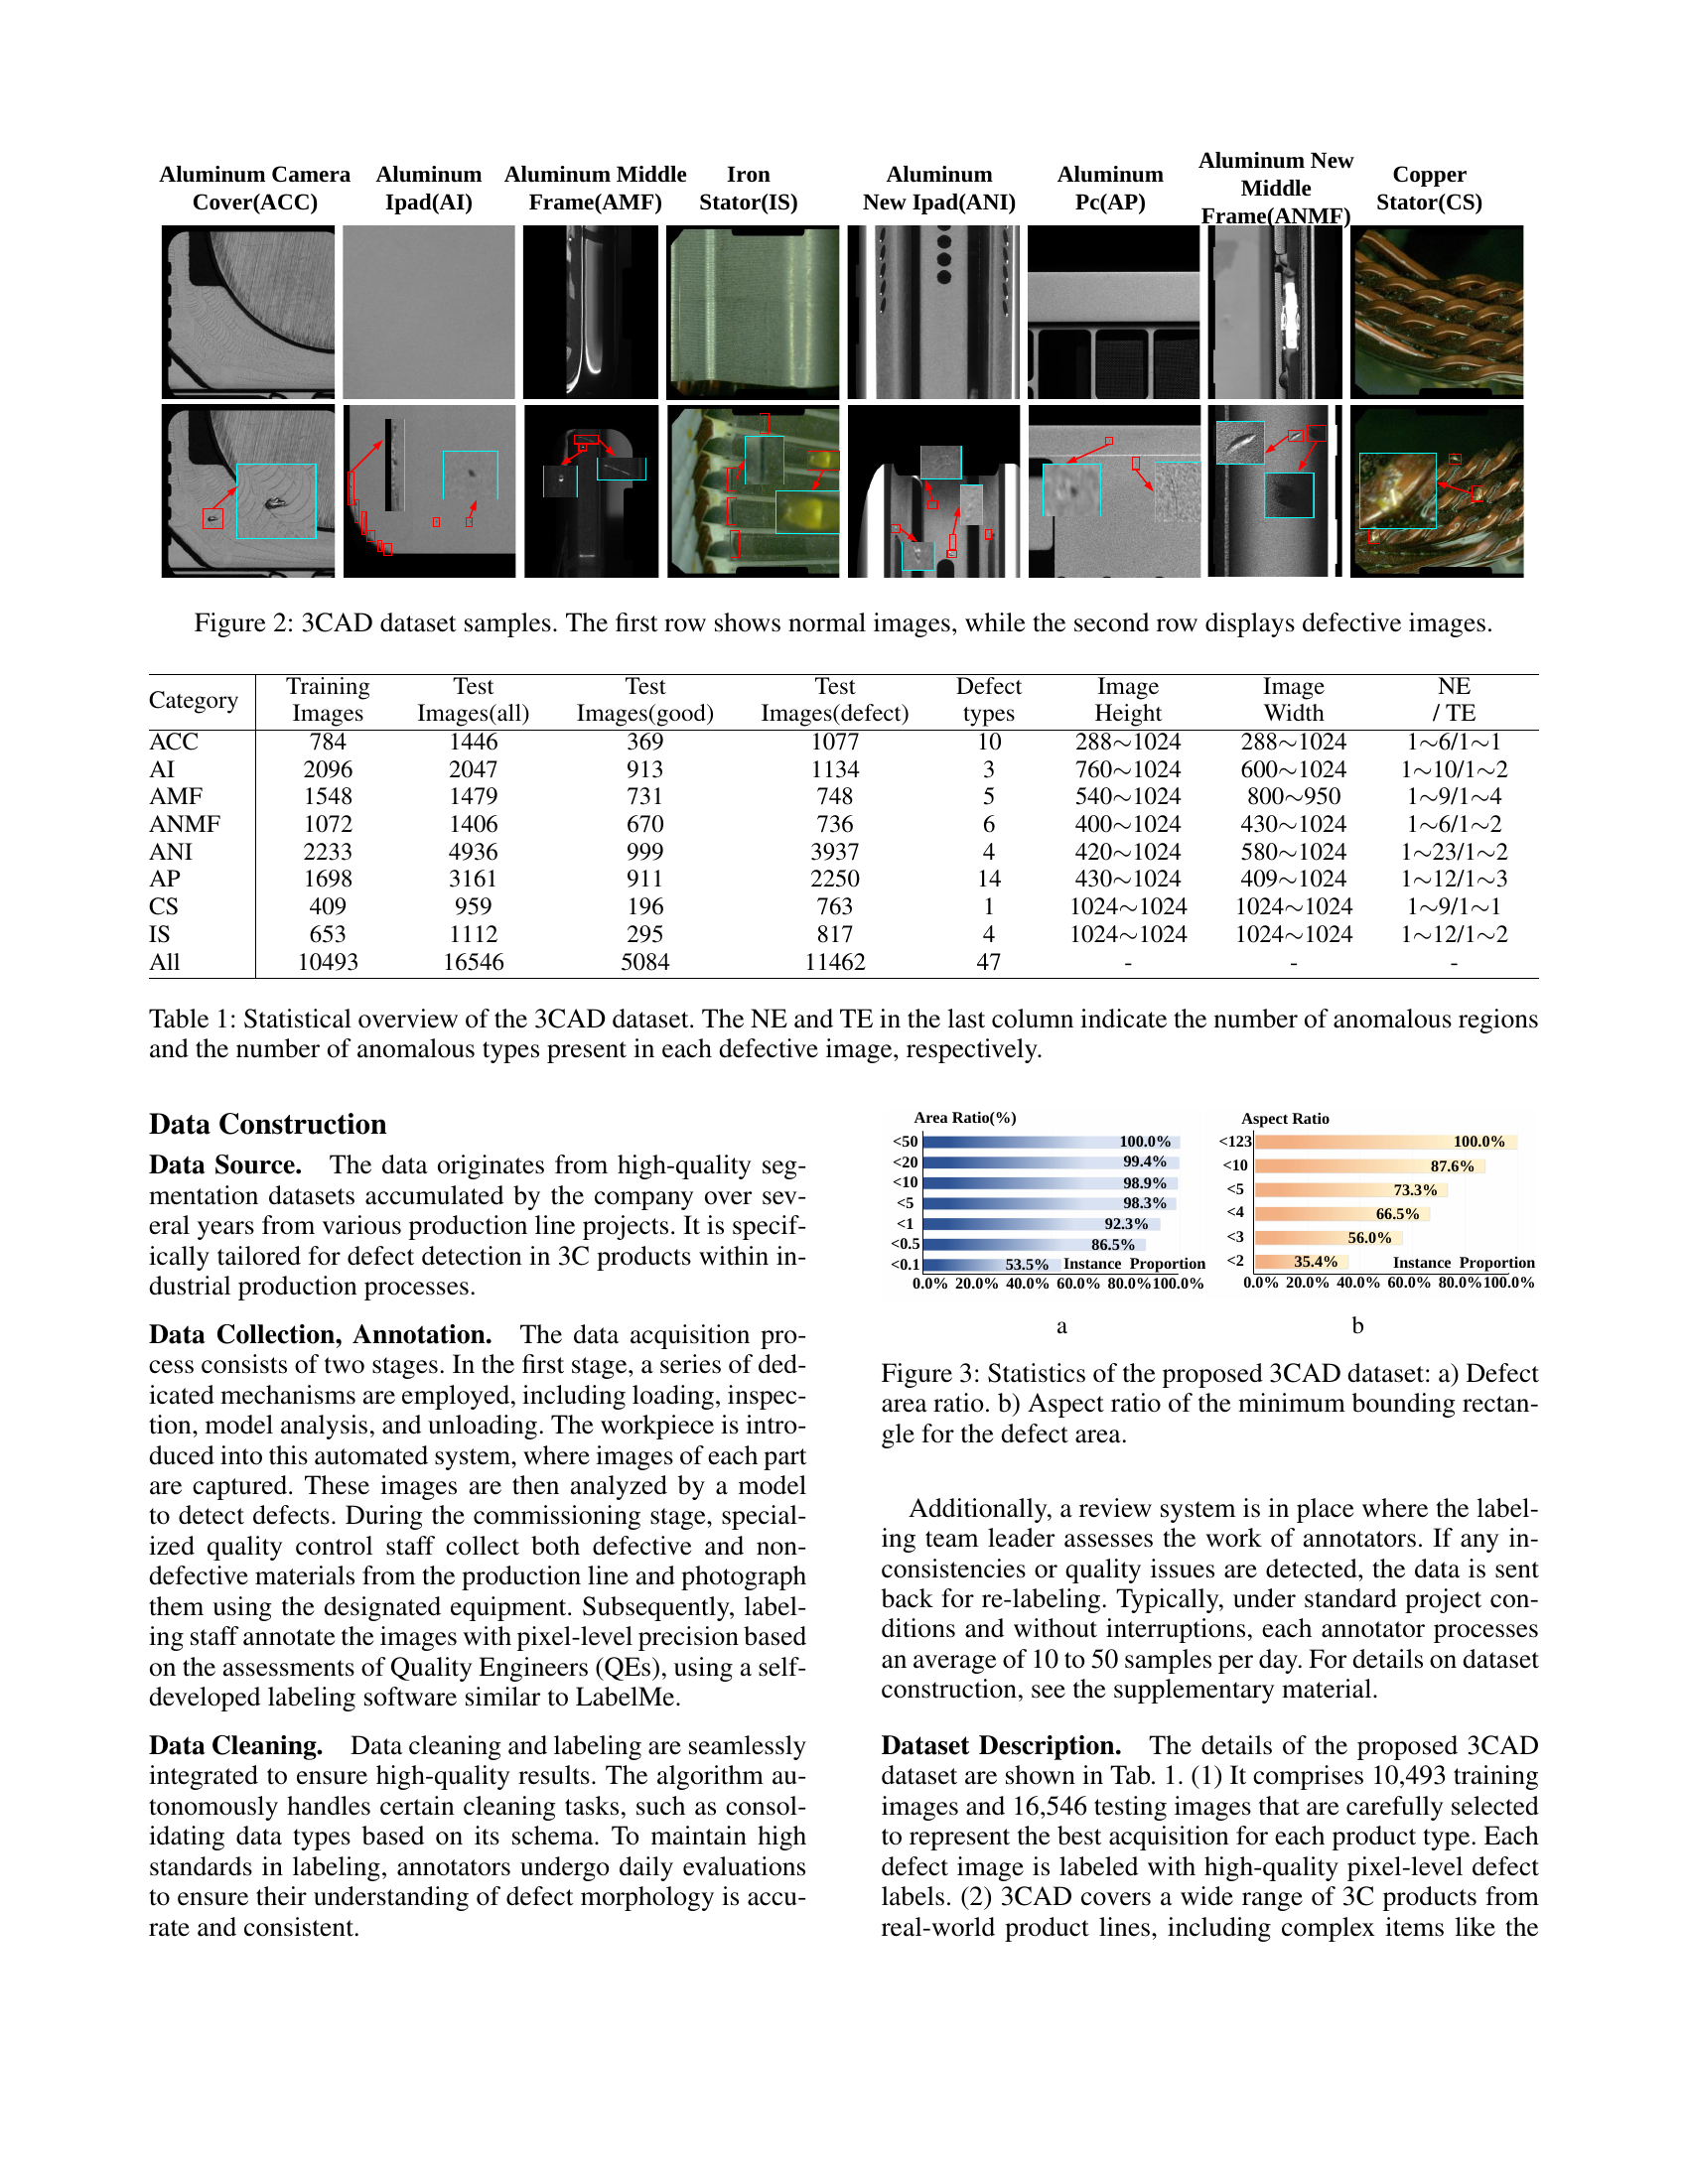
🔼 Table 1 provides a statistical summary of the 3CAD dataset, a newly introduced large-scale dataset for unsupervised anomaly detection. It details the number of images, categorized by product type, available for both training and testing. For each product category, the table shows the count of normal and defective images. Critically, the final columns (‘NE’ and ‘TE’) provide information about the complexity of defects within each defective image. ‘NE’ represents the number of anomalous regions (separate areas with defects) present in an image, while ‘TE’ indicates the number of different types of anomalies present in a single defective image. This helps quantify the difficulty of the anomaly detection task, showcasing the potential of 3CAD for benchmarking algorithm performance.
read the caption
Table 1: Statistical overview of the 3CAD dataset. The NE and TE in the last column indicate the number of anomalous regions and the number of anomalous types present in each defective image, respectively.
In-depth insights#
3C Anomaly Dataset#
The creation of a new large-scale, real-world 3C product anomaly detection dataset is a significant contribution. The 3C Anomaly Dataset addresses limitations of existing datasets, such as limited defect types and the artificial nature of anomalies. The dataset’s real-world relevance, derived from actual production lines, enhances its value for research. Its size (27,039 images) and diversity of defects (eight types, multiple anomalies per image) provide a robust benchmark for evaluating anomaly detection algorithms. The inclusion of varied defect sizes and morphologies adds complexity, making it a challenging yet valuable resource for advancing the field of unsupervised anomaly detection in industrial settings. Researchers can leverage this dataset to develop and test more robust and accurate methods for identifying subtle defects, thus improving quality control and efficiency in 3C manufacturing.
CFRG Framework#
The Coarse-to-Fine with Recovery Guidance (CFRG) framework represents a novel approach to unsupervised anomaly detection, particularly designed to address the challenges posed by datasets like 3CAD which features small and complex defects. Its core strength lies in combining heterogeneous distillation for coarse localization with a recovery network and segmentation for fine-grained localization. The heterogeneous distillation leverages the strengths of different teacher-student network architectures to capture diverse features, improving the identification of subtle anomalies. The recovery network is crucial, as it focuses on restoring normal features from abnormal ones, helping the model better understand normal patterns and reducing bias associated with the use of synthetically generated anomalies for training. Finally, the segmentation model refines localization, using the combined insights from distillation and recovery to achieve pixel-level accuracy. This multi-stage approach is particularly well-suited for complex real-world industrial datasets, demonstrating a significant advance over methods that rely solely on a single type of anomaly detection technique. The framework’s performance highlights the effectiveness of this integrated strategy in dealing with the nuanced nature of real-world anomalies.
Benchmark Results#
A dedicated ‘Benchmark Results’ section in a research paper would ideally present a rigorous comparison of the proposed method against existing state-of-the-art techniques. This would involve selecting relevant and established benchmark datasets, employing standardized evaluation metrics, and clearly presenting the quantitative results. Careful consideration of the chosen metrics is crucial, as different metrics might highlight different aspects of the method’s performance. For example, precision, recall, F1-score, and AUROC provide diverse perspectives on the model’s accuracy and robustness. Beyond simple numerical comparisons, a strong ‘Benchmark Results’ section would include insightful analysis of the results, explaining any discrepancies or unexpected findings. It should clearly articulate the strengths and weaknesses of the proposed approach compared to existing methods, perhaps in terms of computational cost, robustness to noise, or generalization ability. Visualizations, such as graphs or tables, can be powerful tools to effectively communicate complex results. Finally, discussing the limitations of the benchmark datasets and suggesting avenues for future research based on the results strengthens the overall impact of this section.
Ablation Studies#
The Ablation Studies section of a research paper is crucial for understanding the contribution of individual components within a proposed model or system. In this context, it would systematically evaluate the impact of removing or modifying specific parts of the proposed anomaly detection framework. This might include removing the recovery branch to assess its contribution to accurate localization, especially for subtle defects. Similarly, disabling the segmentation module would reveal its role in achieving fine-grained localization. Analyzing the results of these ablation experiments provides valuable insights into the design choices and their effectiveness. By comparing the performance metrics (like AUROC, P-PRO, AP) with and without these components, researchers can quantitatively demonstrate the importance of each element in achieving the overall performance. Furthermore, a study on different distillation paradigms, such as evaluating the effect of enforcing a feature distance between teacher and student networks, can further illuminate critical design decisions. Ultimately, the goal is to provide a clear, data-driven justification for the model architecture and parameter settings selected, contributing to the overall credibility and robustness of the research.
Future Work#
Future research directions stemming from this 3CAD dataset and CFRG framework could explore several promising avenues. Improving the CFRG model’s robustness to various lighting conditions and complex defect morphologies is crucial. This could involve incorporating more sophisticated feature extraction techniques or exploring advanced attention mechanisms. Another key area is expanding the dataset’s scope, including more diverse 3C product types and a broader range of defect categories, improving the model’s generalizability. Furthermore, research on more efficient anomaly detection methods is warranted, focusing on reducing computational costs and memory footprint, particularly crucial for real-time applications in manufacturing settings. Finally, investigating the integration of CFRG with other anomaly detection techniques or developing hybrid approaches could lead to further performance improvements. Specifically, exploring how the recovery guidance component of CFRG can be applied to other techniques is promising.
More visual insights#
More on figures

🔼 This figure showcases sample images from the 3CAD dataset. The top row displays examples of normal, defect-free 3C product parts. Each image represents a different product category from the dataset (e.g., aluminum camera cover, aluminum ipad, etc.). The bottom row shows corresponding images of the same products but with various types of manufacturing defects. This visual comparison highlights the differences between normal and anomalous samples within the 3CAD dataset, emphasizing the diversity of defects and their visual characteristics.
read the caption
Figure 2: 3CAD dataset samples. The first row shows normal images, while the second row displays defective images.

🔼 Figure 3 presents a statistical analysis of the 3CAD dataset, focusing on the characteristics of the defective regions. Subfigure (a) shows the distribution of the area ratio for defects, representing the proportion of the image occupied by a defect. This indicates the prevalence of small, subtle defects within the dataset. Subfigure (b) shows the aspect ratio distribution of the minimum bounding rectangles that encompass the defect areas. This aspect ratio indicates the shape of defects (whether elongated or more square) and gives insight into the diversity of shapes that exist within the dataset.
read the caption
Figure 3: Statistics of the proposed 3CAD dataset: a) Defect area ratio. b) Aspect ratio of the minimum bounding rectangle for the defect area.
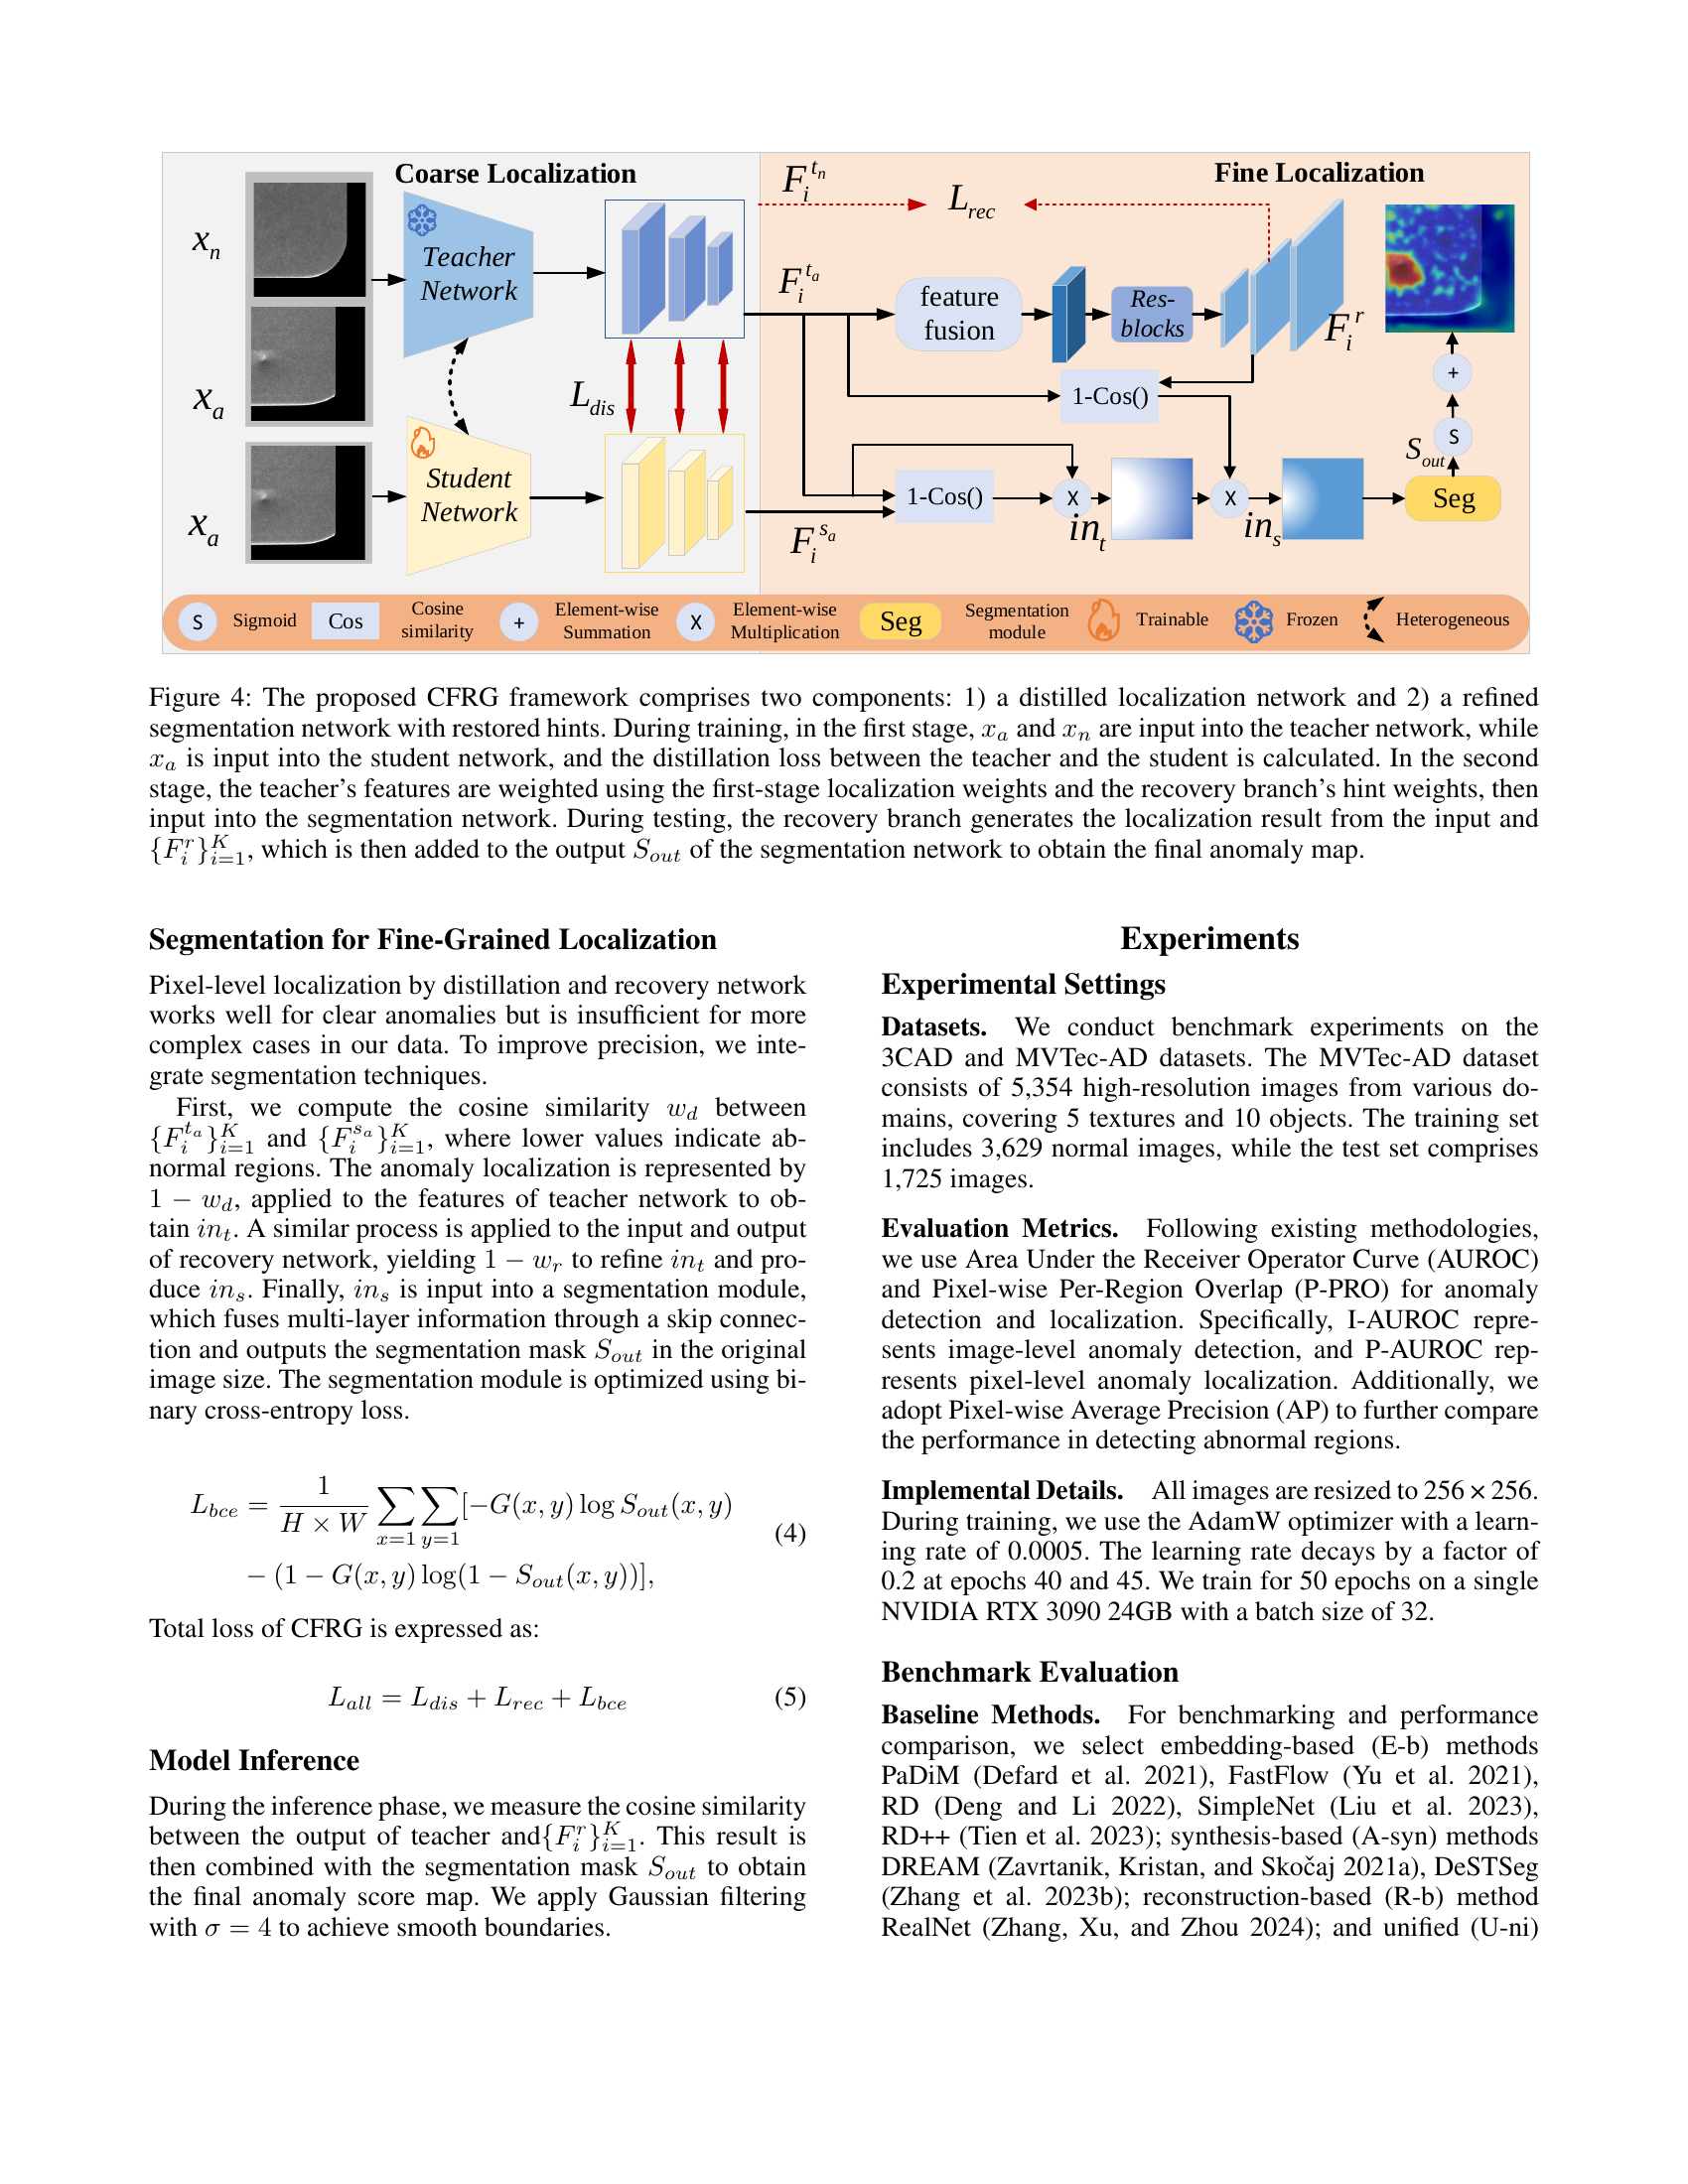
🔼 The figure illustrates the Coarse-to-Fine detection paradigm with Recovery Guidance (CFRG) framework for unsupervised anomaly detection. CFRG consists of two main stages: 1) Coarse Localization and 2) Fine Localization. The first stage uses a teacher-student network approach where both normal (xn) and anomaly (xa) images are fed into the teacher network, while only the anomaly image is fed into the student network. The distillation loss is calculated between the teacher and student networks to achieve coarse localization of the anomaly. The second stage utilizes a recovery branch which learns to reconstruct normal features from anomalous ones. The output of this recovery branch, combined with the teacher’s weighted features from the first stage, is then fed into a segmentation network to achieve a refined, pixel-level localization (final anomaly map). The output of the recovery branch during testing combines with the output of the segmentation network to achieve the final anomaly map.
read the caption
Figure 4: The proposed CFRG framework comprises two components: 1) a distilled localization network and 2) a refined segmentation network with restored hints. During training, in the first stage, xasubscript𝑥𝑎x_{a}italic_x start_POSTSUBSCRIPT italic_a end_POSTSUBSCRIPT and xnsubscript𝑥𝑛x_{n}italic_x start_POSTSUBSCRIPT italic_n end_POSTSUBSCRIPT are input into the teacher network, while xasubscript𝑥𝑎x_{a}italic_x start_POSTSUBSCRIPT italic_a end_POSTSUBSCRIPT is input into the student network, and the distillation loss between the teacher and the student is calculated. In the second stage, the teacher’s features are weighted using the first-stage localization weights and the recovery branch’s hint weights, then input into the segmentation network. During testing, the recovery branch generates the localization result from the input and {Fir}i=1Ksuperscriptsubscriptsuperscriptsubscript𝐹𝑖𝑟𝑖1𝐾\{F_{i}^{r}\}_{i=1}^{K}{ italic_F start_POSTSUBSCRIPT italic_i end_POSTSUBSCRIPT start_POSTSUPERSCRIPT italic_r end_POSTSUPERSCRIPT } start_POSTSUBSCRIPT italic_i = 1 end_POSTSUBSCRIPT start_POSTSUPERSCRIPT italic_K end_POSTSUPERSCRIPT, which is then added to the output Soutsubscript𝑆𝑜𝑢𝑡S_{out}italic_S start_POSTSUBSCRIPT italic_o italic_u italic_t end_POSTSUBSCRIPT of the segmentation network to obtain the final anomaly map.

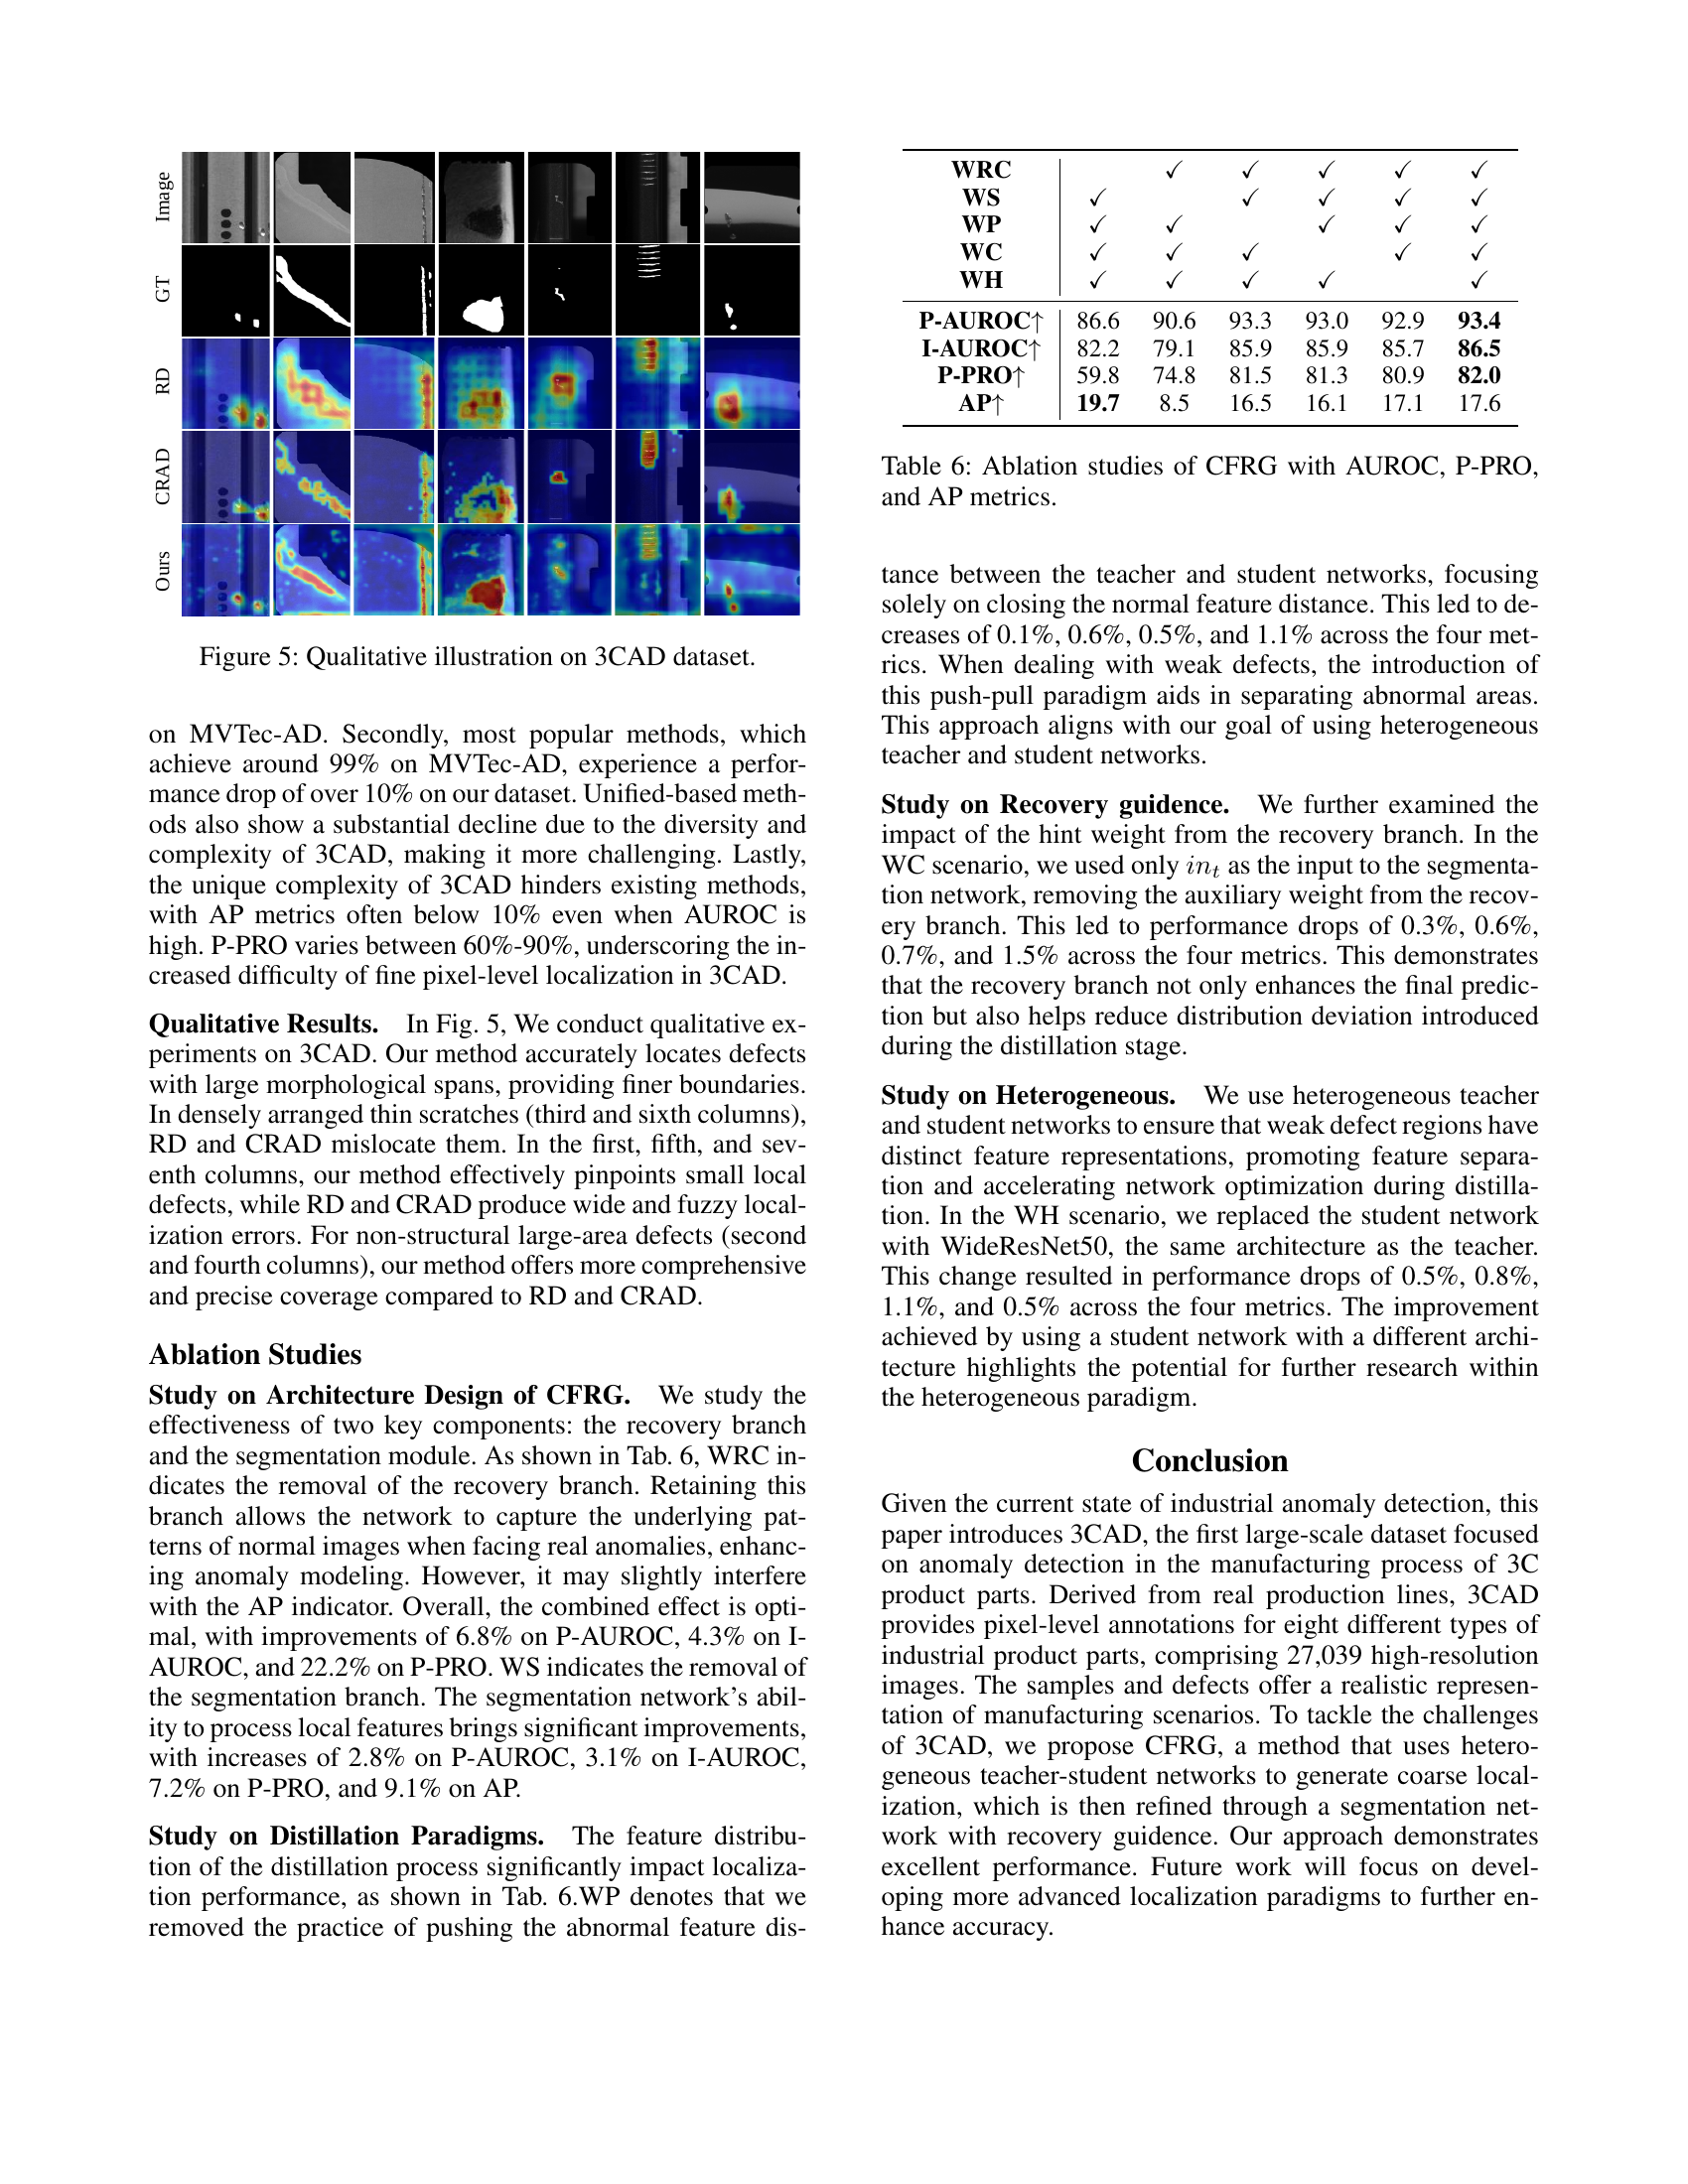
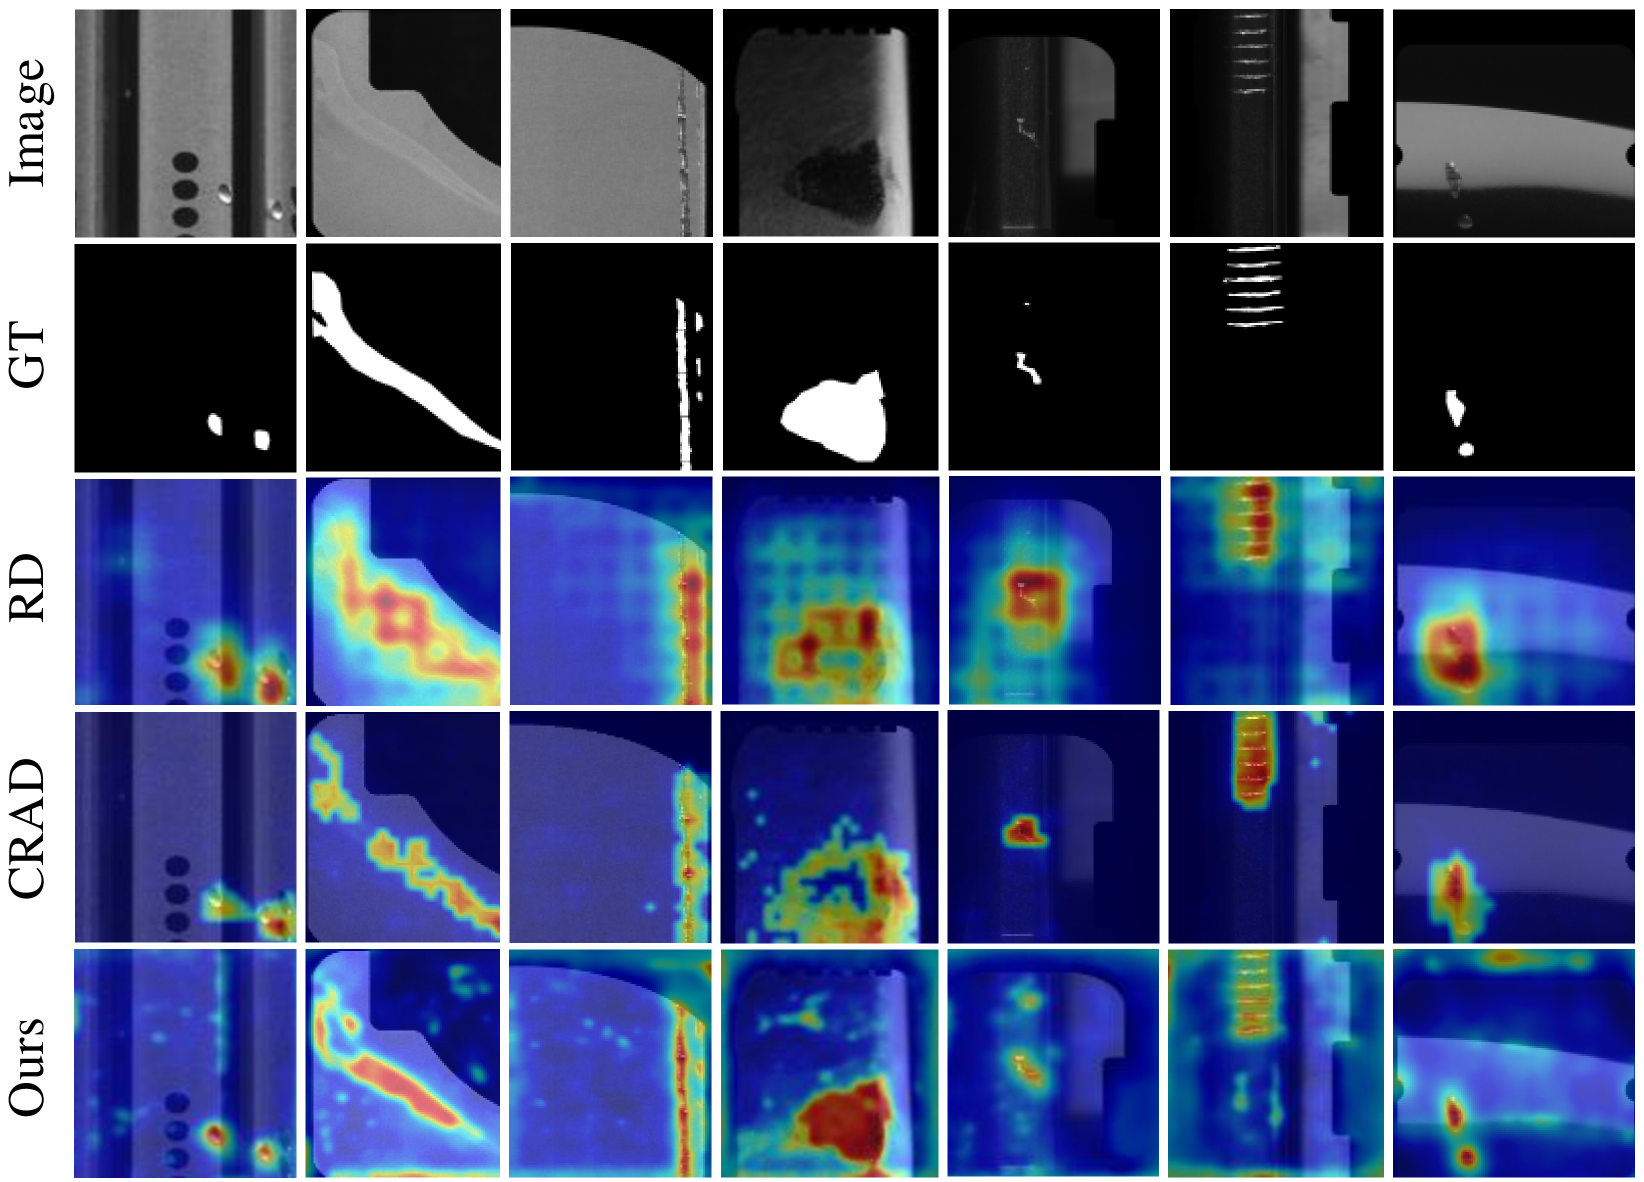
🔼 Figure 5 presents a qualitative comparison of anomaly detection results on the 3CAD dataset. It shows several examples of images with anomalies, highlighting the performance of different methods. The ground truth (GT) shows the actual anomaly locations in each image, whereas the results from the proposed method (Ours), CRAD, and RD illustrate the predicted anomaly locations. This visualization emphasizes the strength of the proposed method in localizing small and complex anomalies more accurately compared to CRAD and RD.
read the caption
Figure 5: Qualitative illustration on 3CAD dataset.

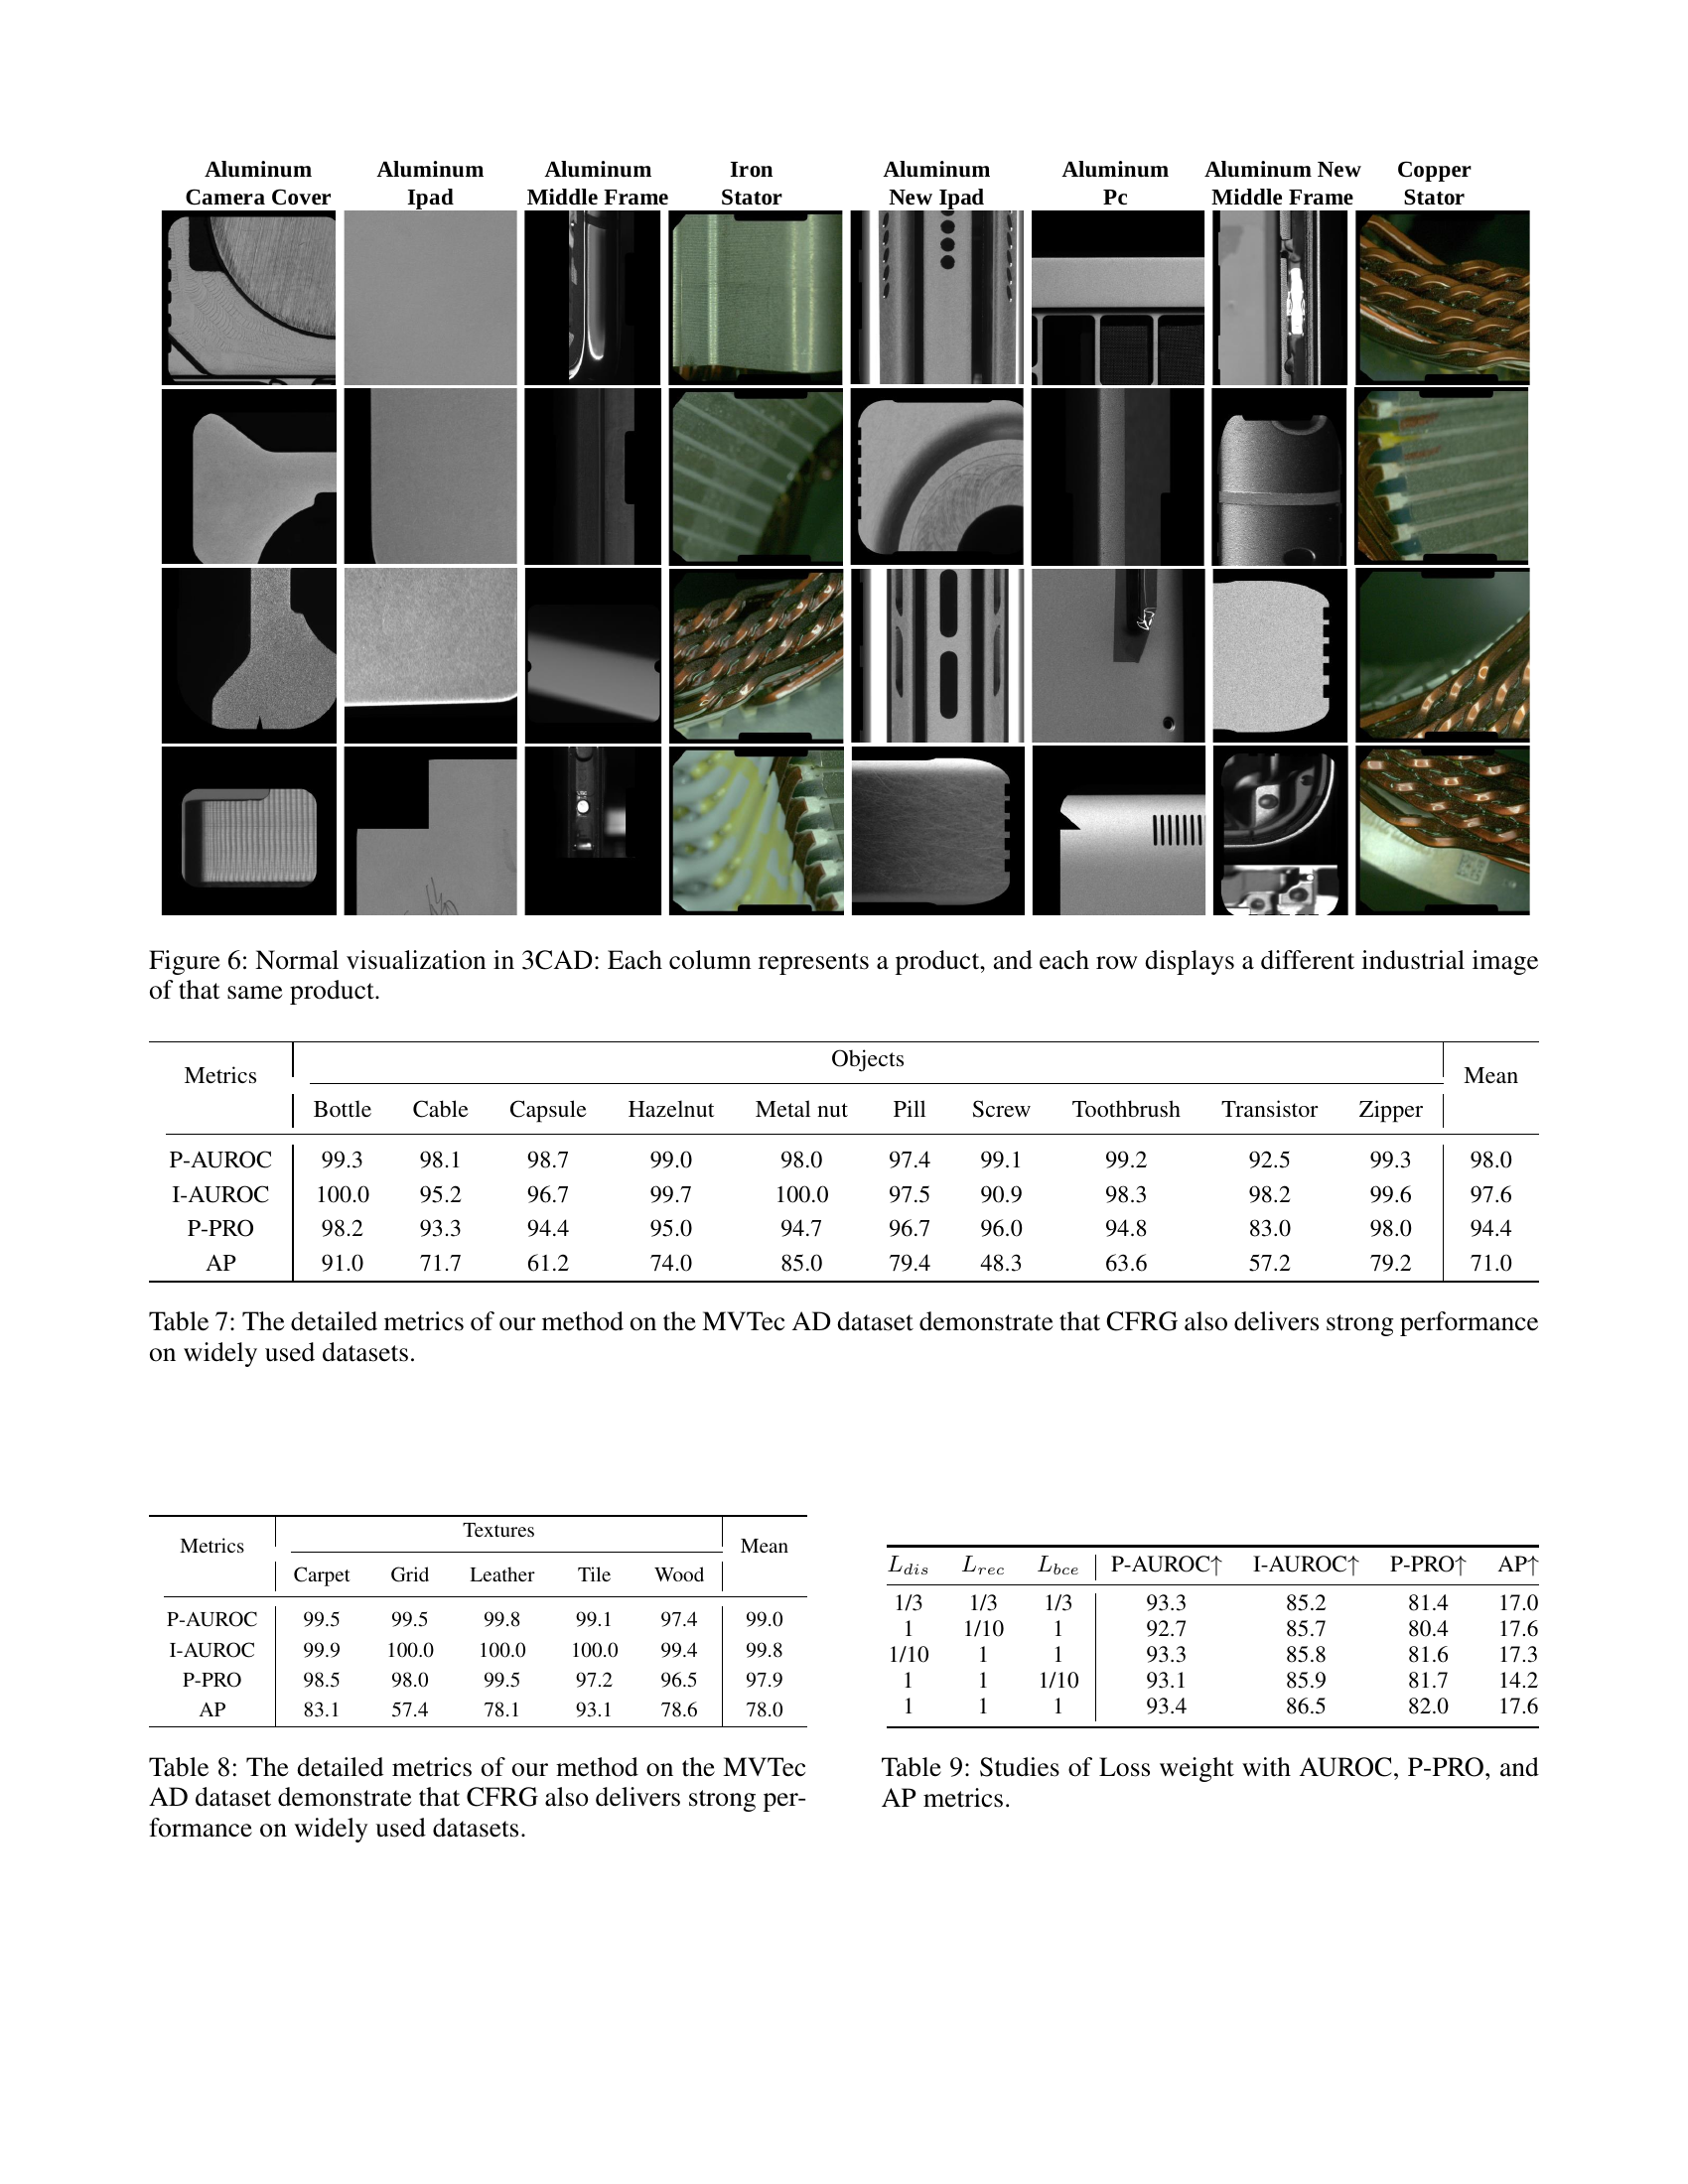
🔼 Figure 6 presents a visualization of the 3CAD dataset, focusing on the normal images of the different products. Each column represents a unique type of 3C product included in the dataset (e.g., aluminum camera cover, aluminum iPad, etc.). Within each column, multiple rows showcase different industrial images of the same product. This allows for a visual inspection of the normal appearance variations within each product category, highlighting the natural variability present even in defect-free items.
read the caption
Figure 6: Normal visualization in 3CAD: Each column represents a product, and each row displays a different industrial image of that same product.

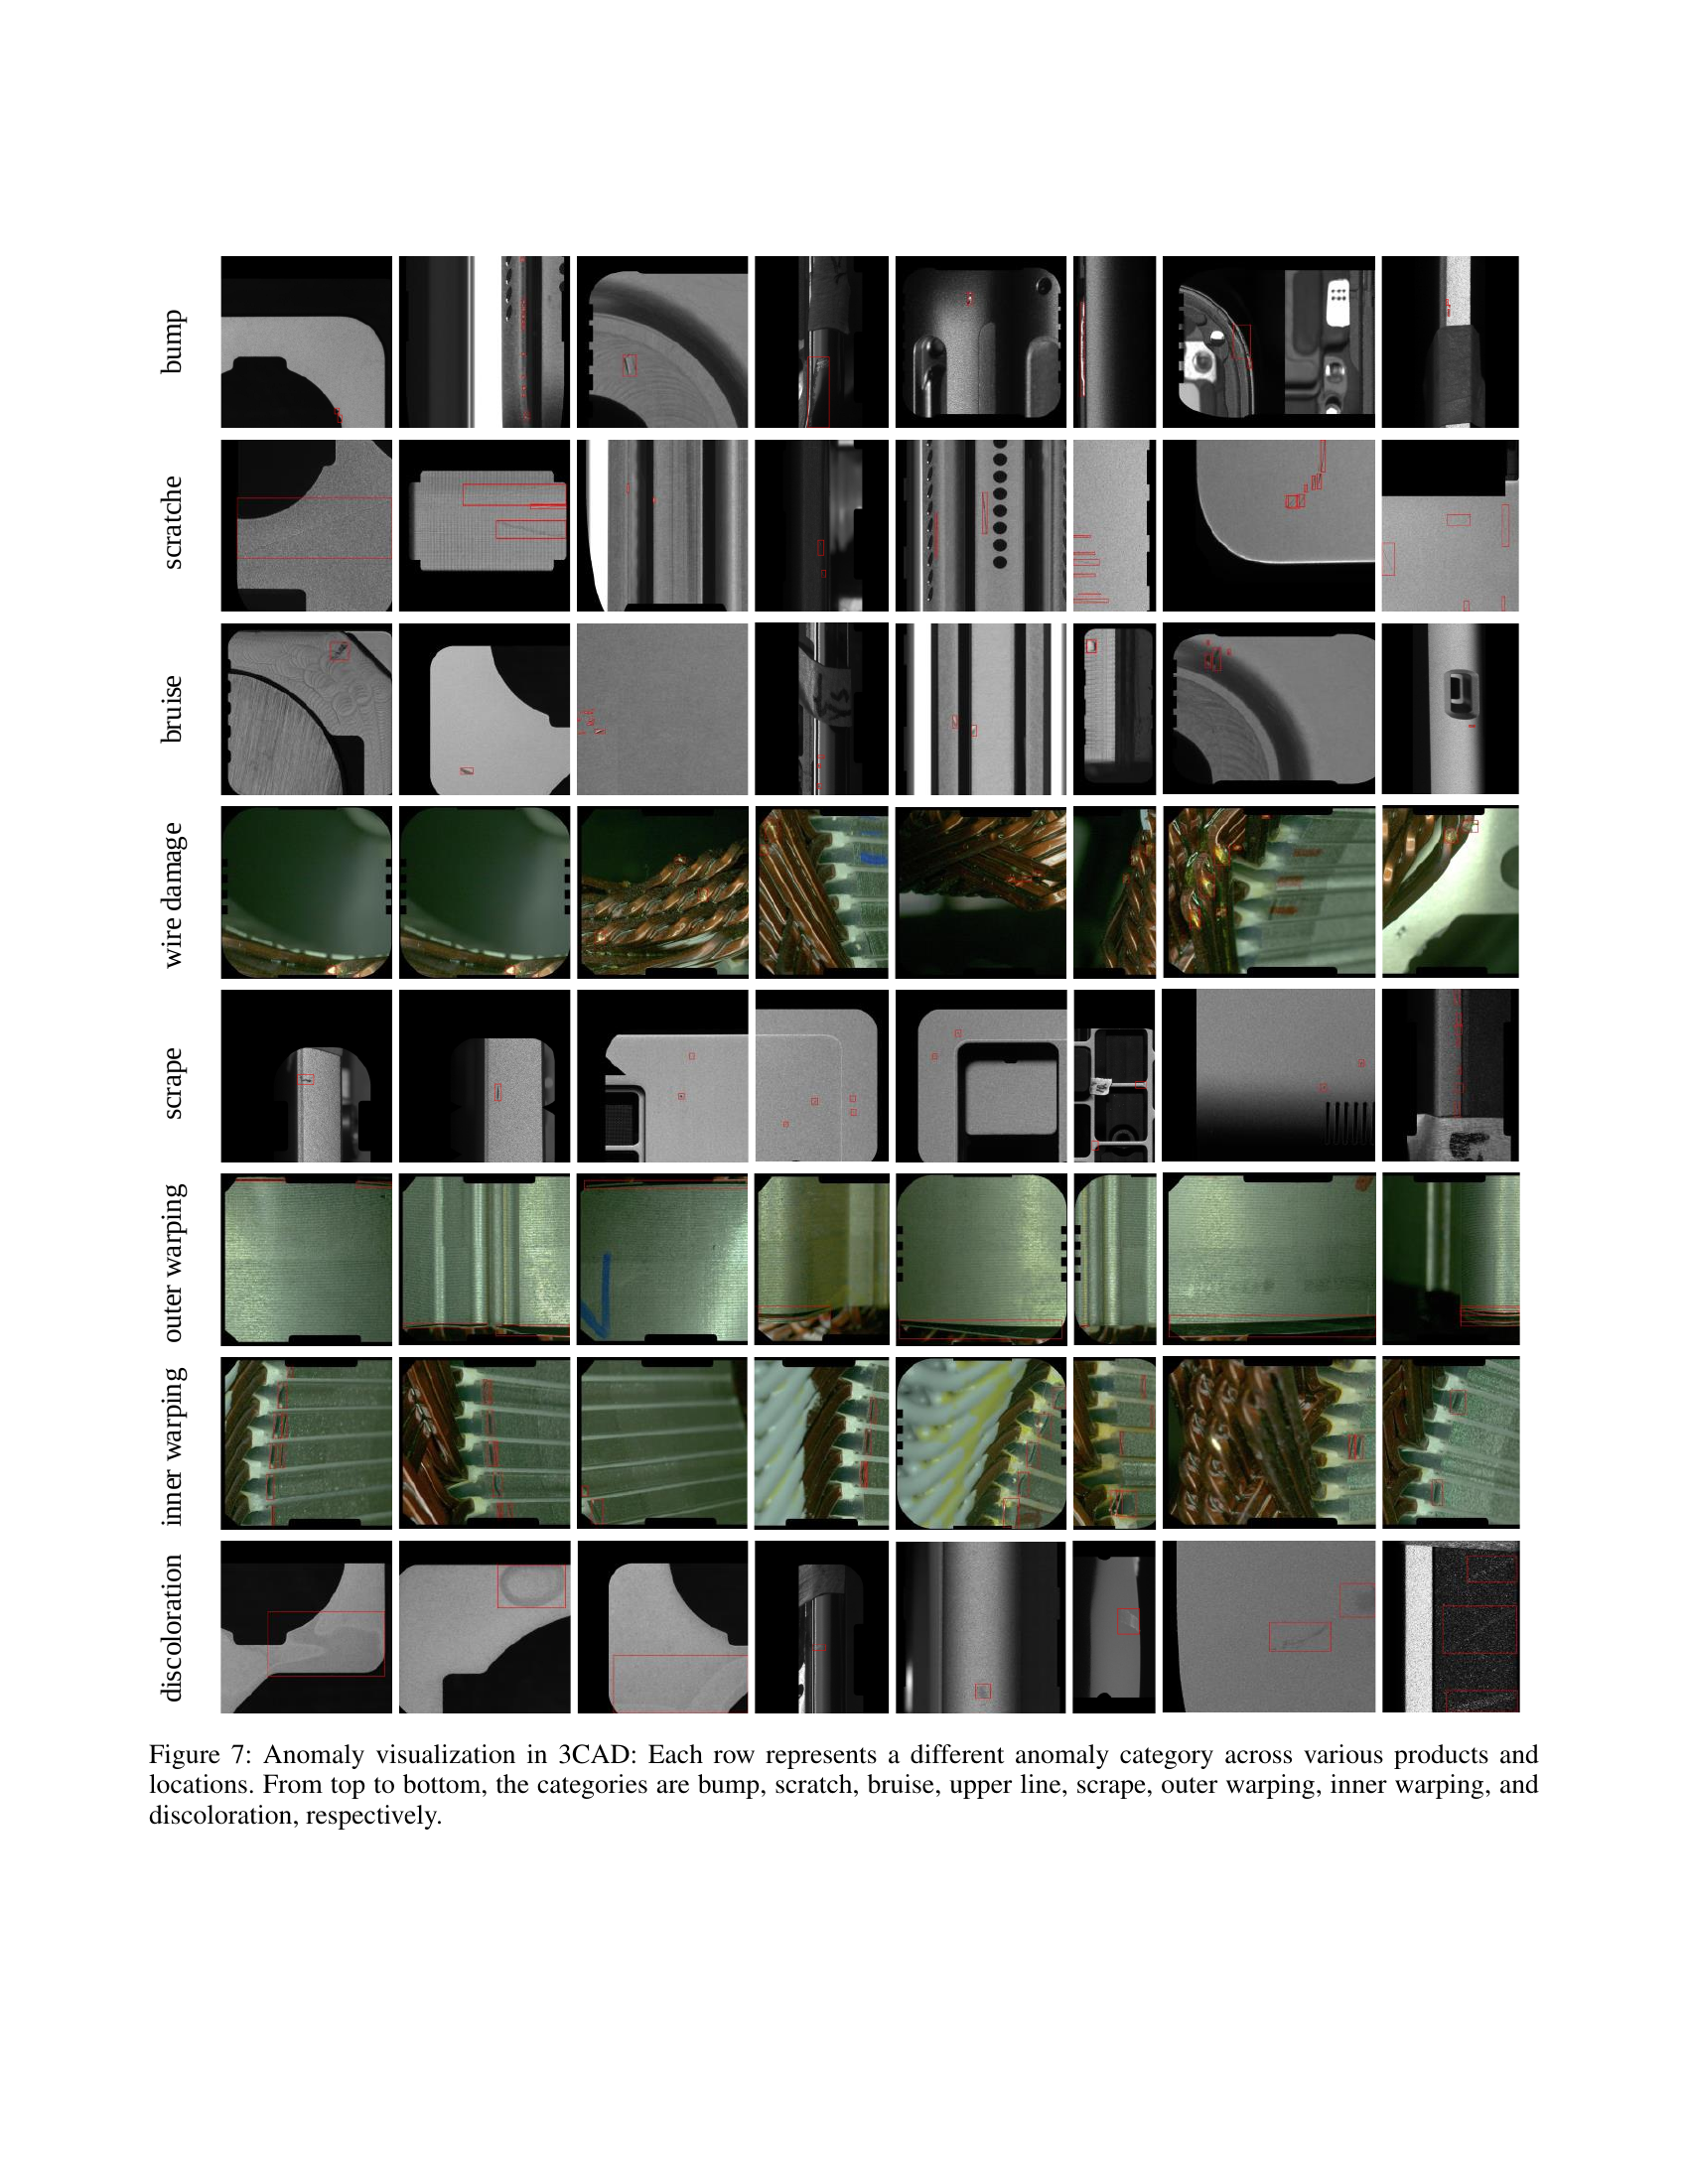
🔼 Figure 7 visualizes different types of anomalies present in the 3CAD dataset. Each row showcases a specific anomaly type (bump, scratch, bruise, upper line, scrape, outer warping, inner warping, and discoloration) across various products and locations within those products. This demonstrates the diversity of anomalies captured in the dataset, showing variations in appearance and location even within the same anomaly category.
read the caption
Figure 7: Anomaly visualization in 3CAD: Each row represents a different anomaly category across various products and locations. From top to bottom, the categories are bump, scratch, bruise, upper line, scrape, outer warping, inner warping, and discoloration, respectively.

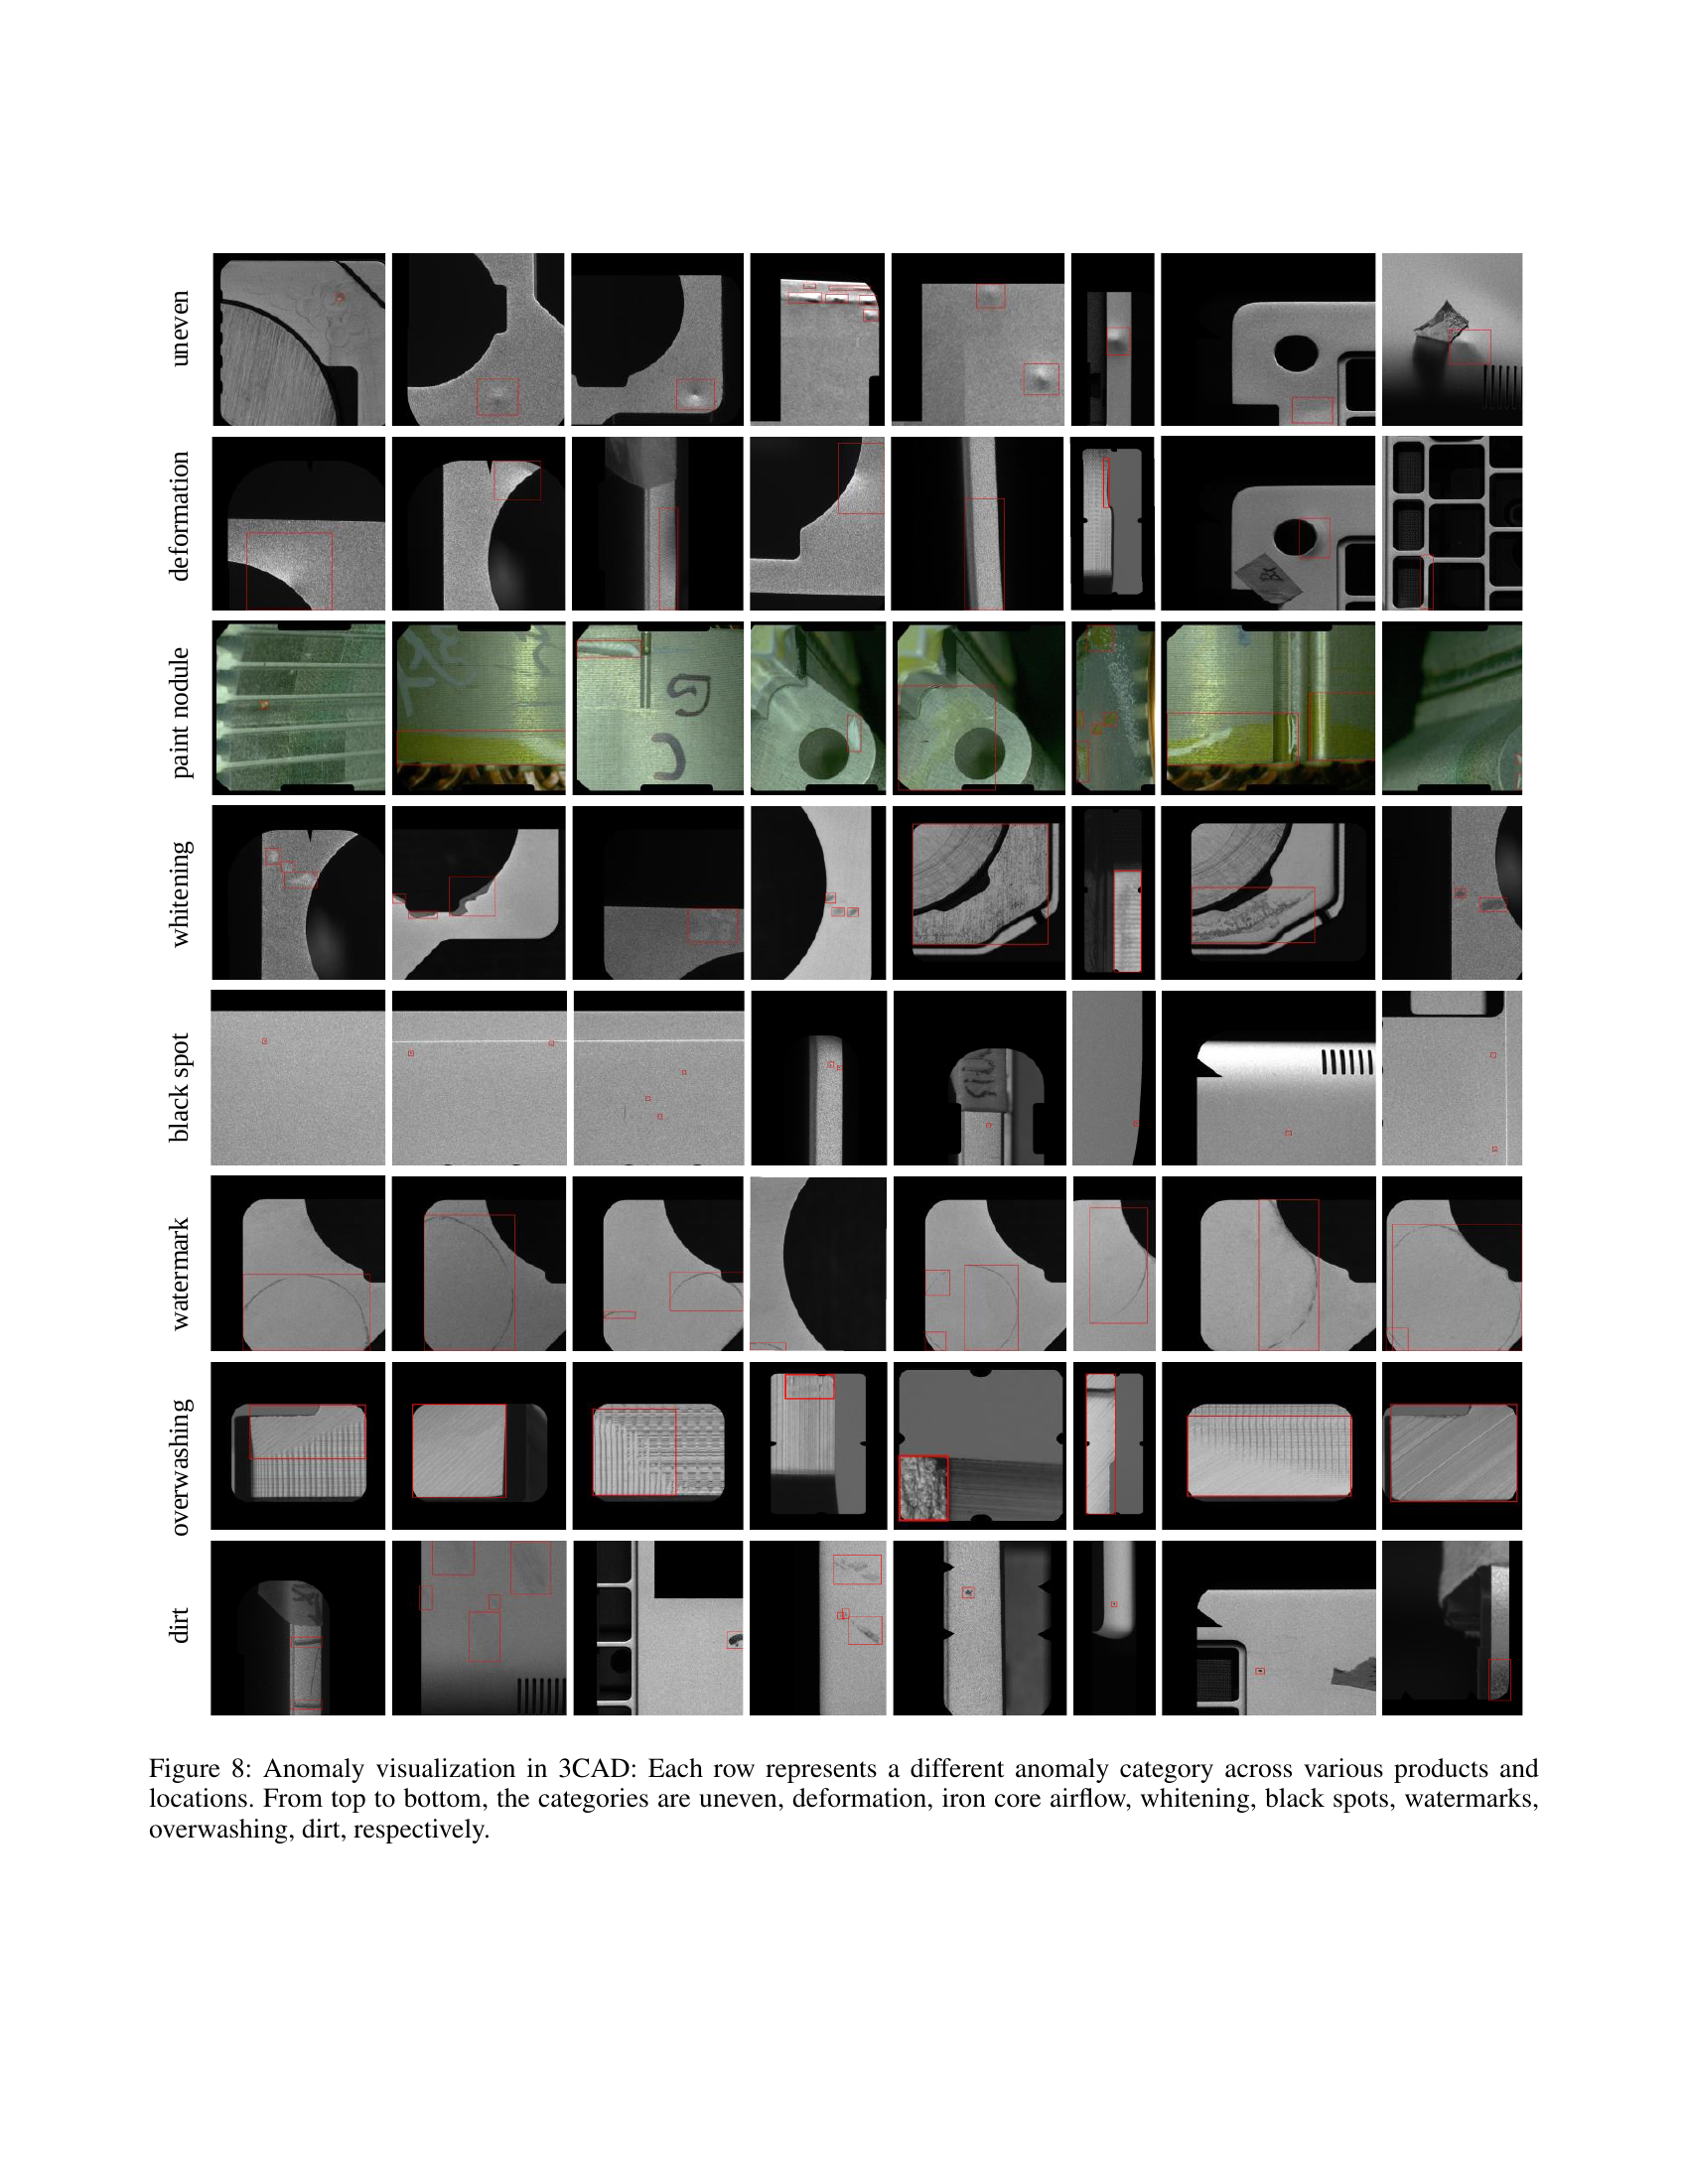
🔼 Figure 8 presents a visual representation of various anomaly types within the 3CAD dataset. Each row showcases a specific anomaly category, with multiple examples across different products and locations. The anomalies are: uneven surface, deformation, iron core airflow issues, whitening, black spots, watermarks, overwashing, and dirt. This figure highlights the dataset’s diversity in terms of defect types, their appearance on various products, and their varied locations within the products.
read the caption
Figure 8: Anomaly visualization in 3CAD: Each row represents a different anomaly category across various products and locations. From top to bottom, the categories are uneven, deformation, iron core airflow, whitening, black spots, watermarks, overwashing, dirt, respectively.
More on tables
| Training |
| Images |
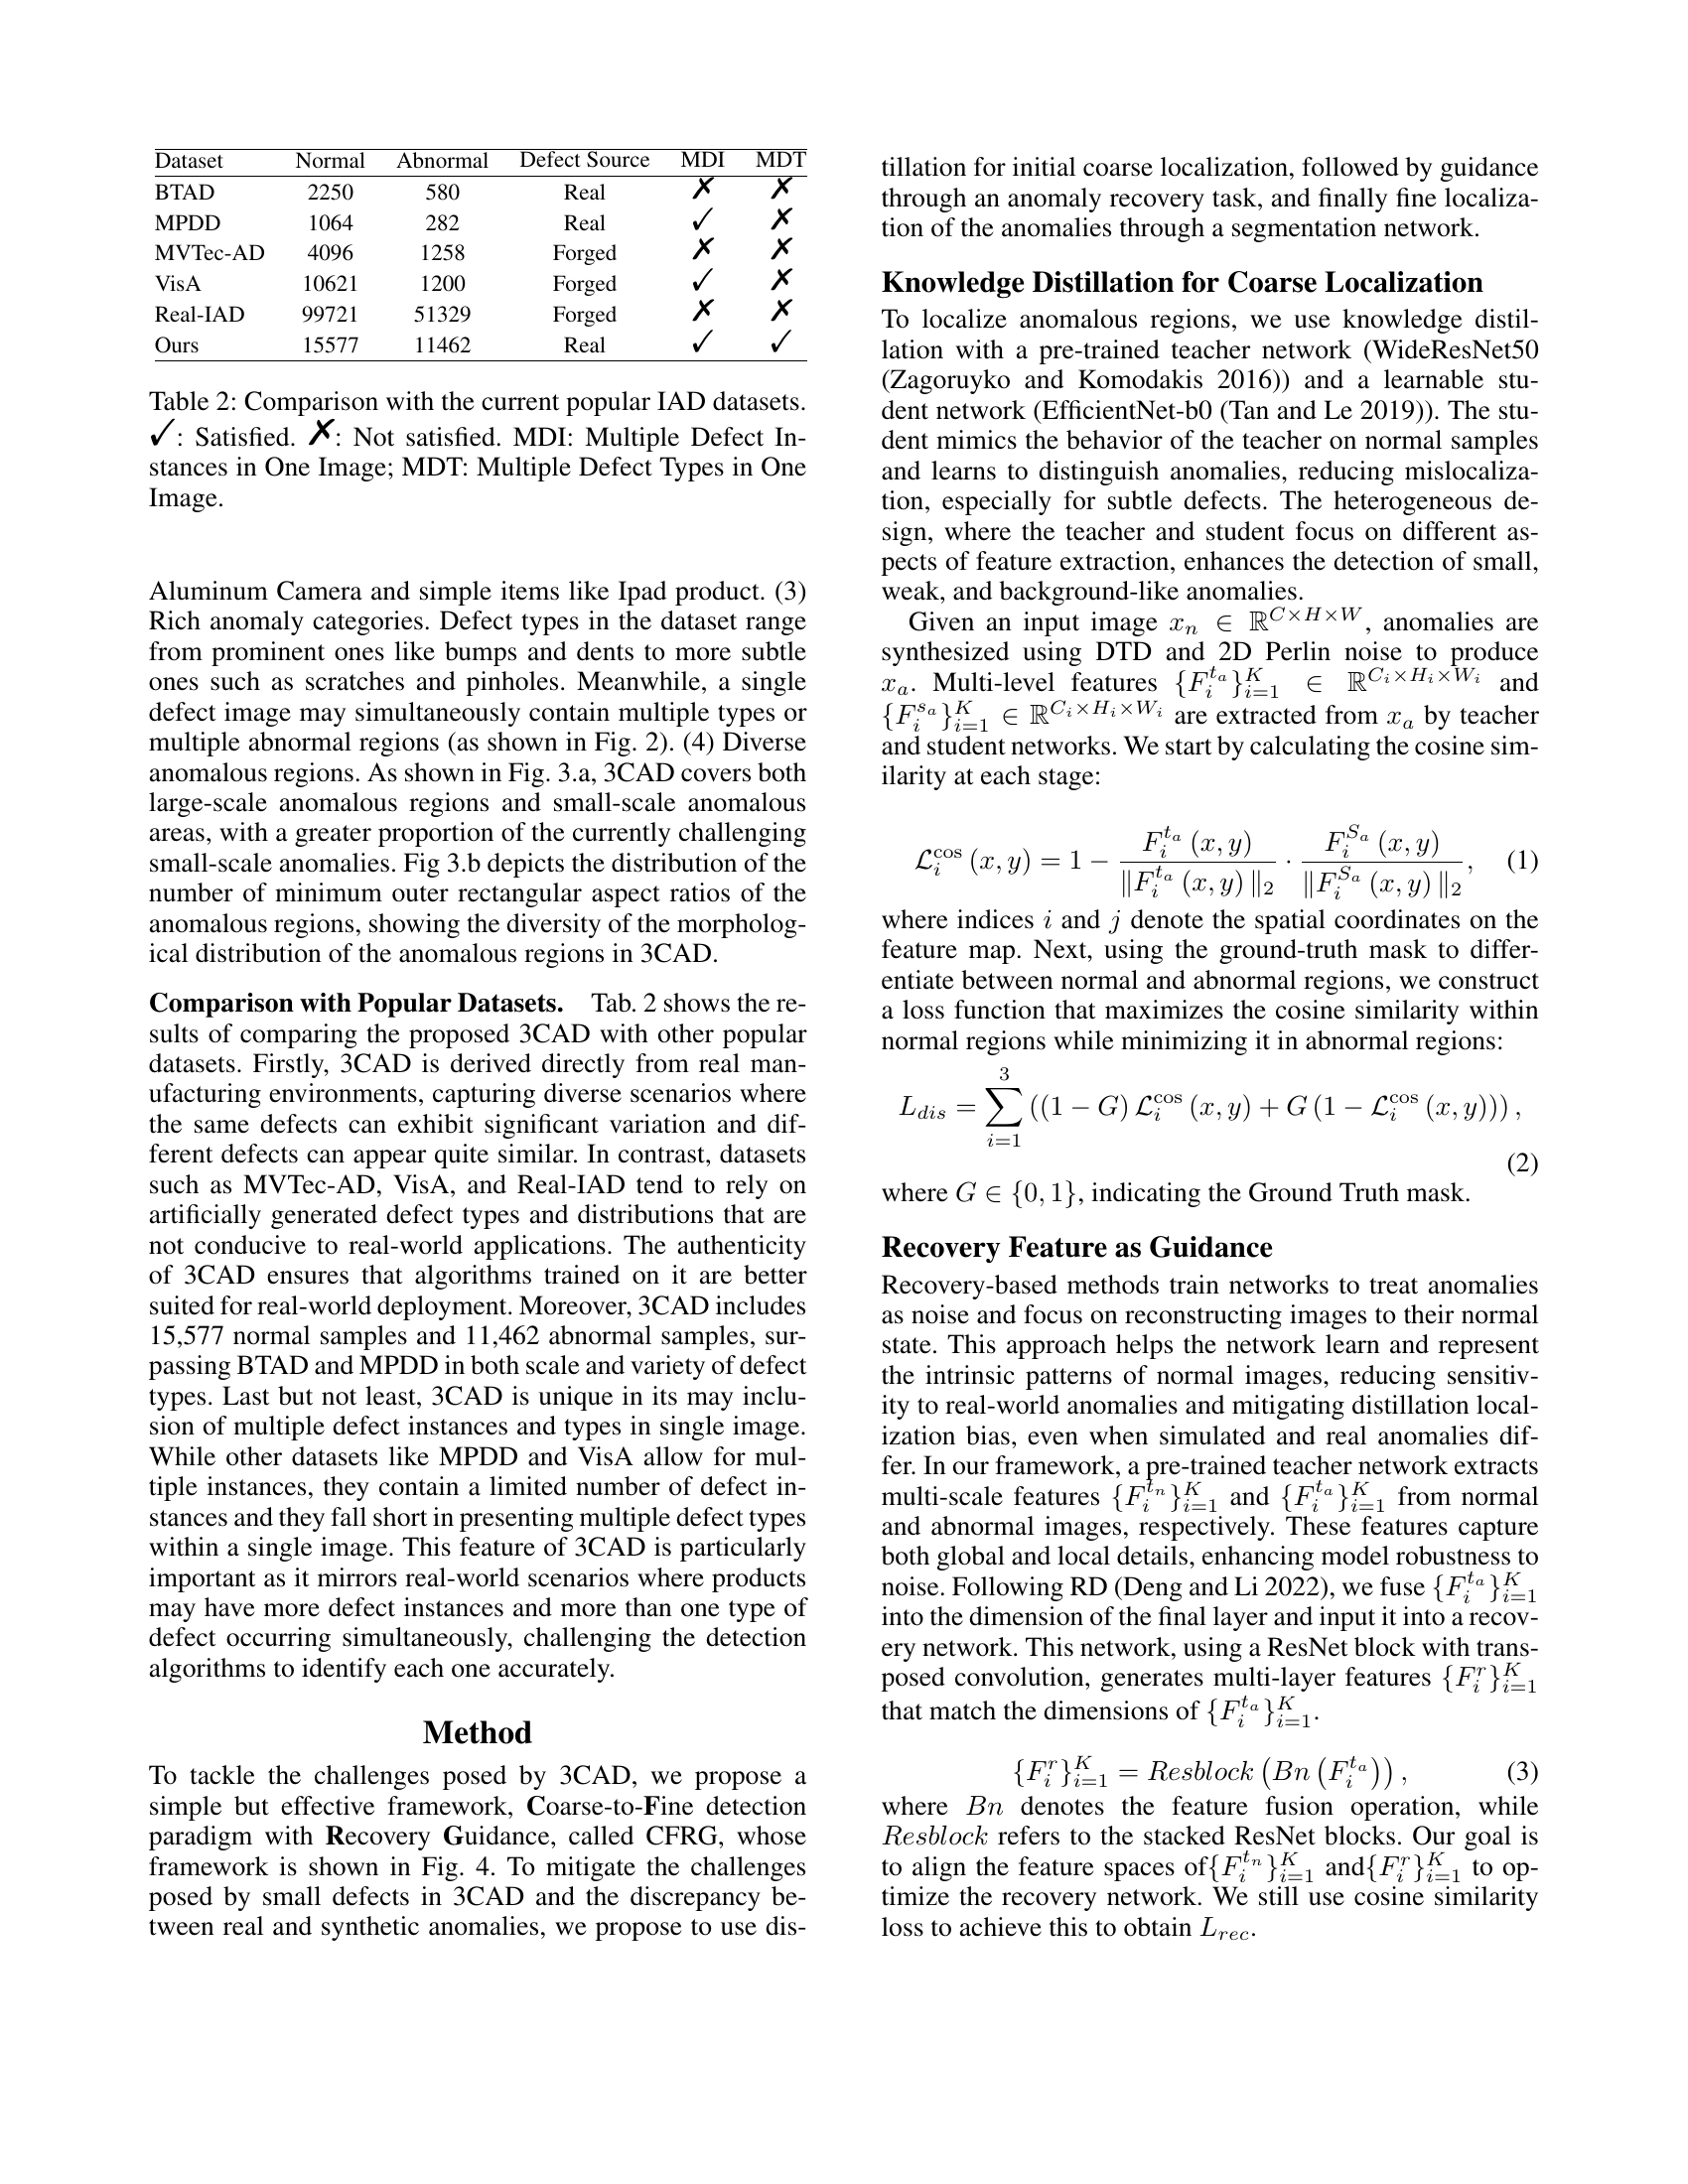
🔼 Table 2 compares the 3CAD dataset to other popular industrial anomaly detection datasets, highlighting key differences in characteristics such as data source (real-world vs. synthetic), the presence of multiple defect instances in a single image (MDI), the presence of multiple defect types in one image (MDT), and the overall dataset size. The table uses checkmarks (✓) to indicate satisfaction of a given characteristic for each dataset and ‘X’ to indicate that the characteristic is not present.
read the caption
Table 2: Comparison with the current popular IAD datasets. ✓: Satisfied. ✗: Not satisfied. MDI: Multiple Defect Instances in One Image; MDT: Multiple Defect Types in One Image.
| Test |
| Images(all) |
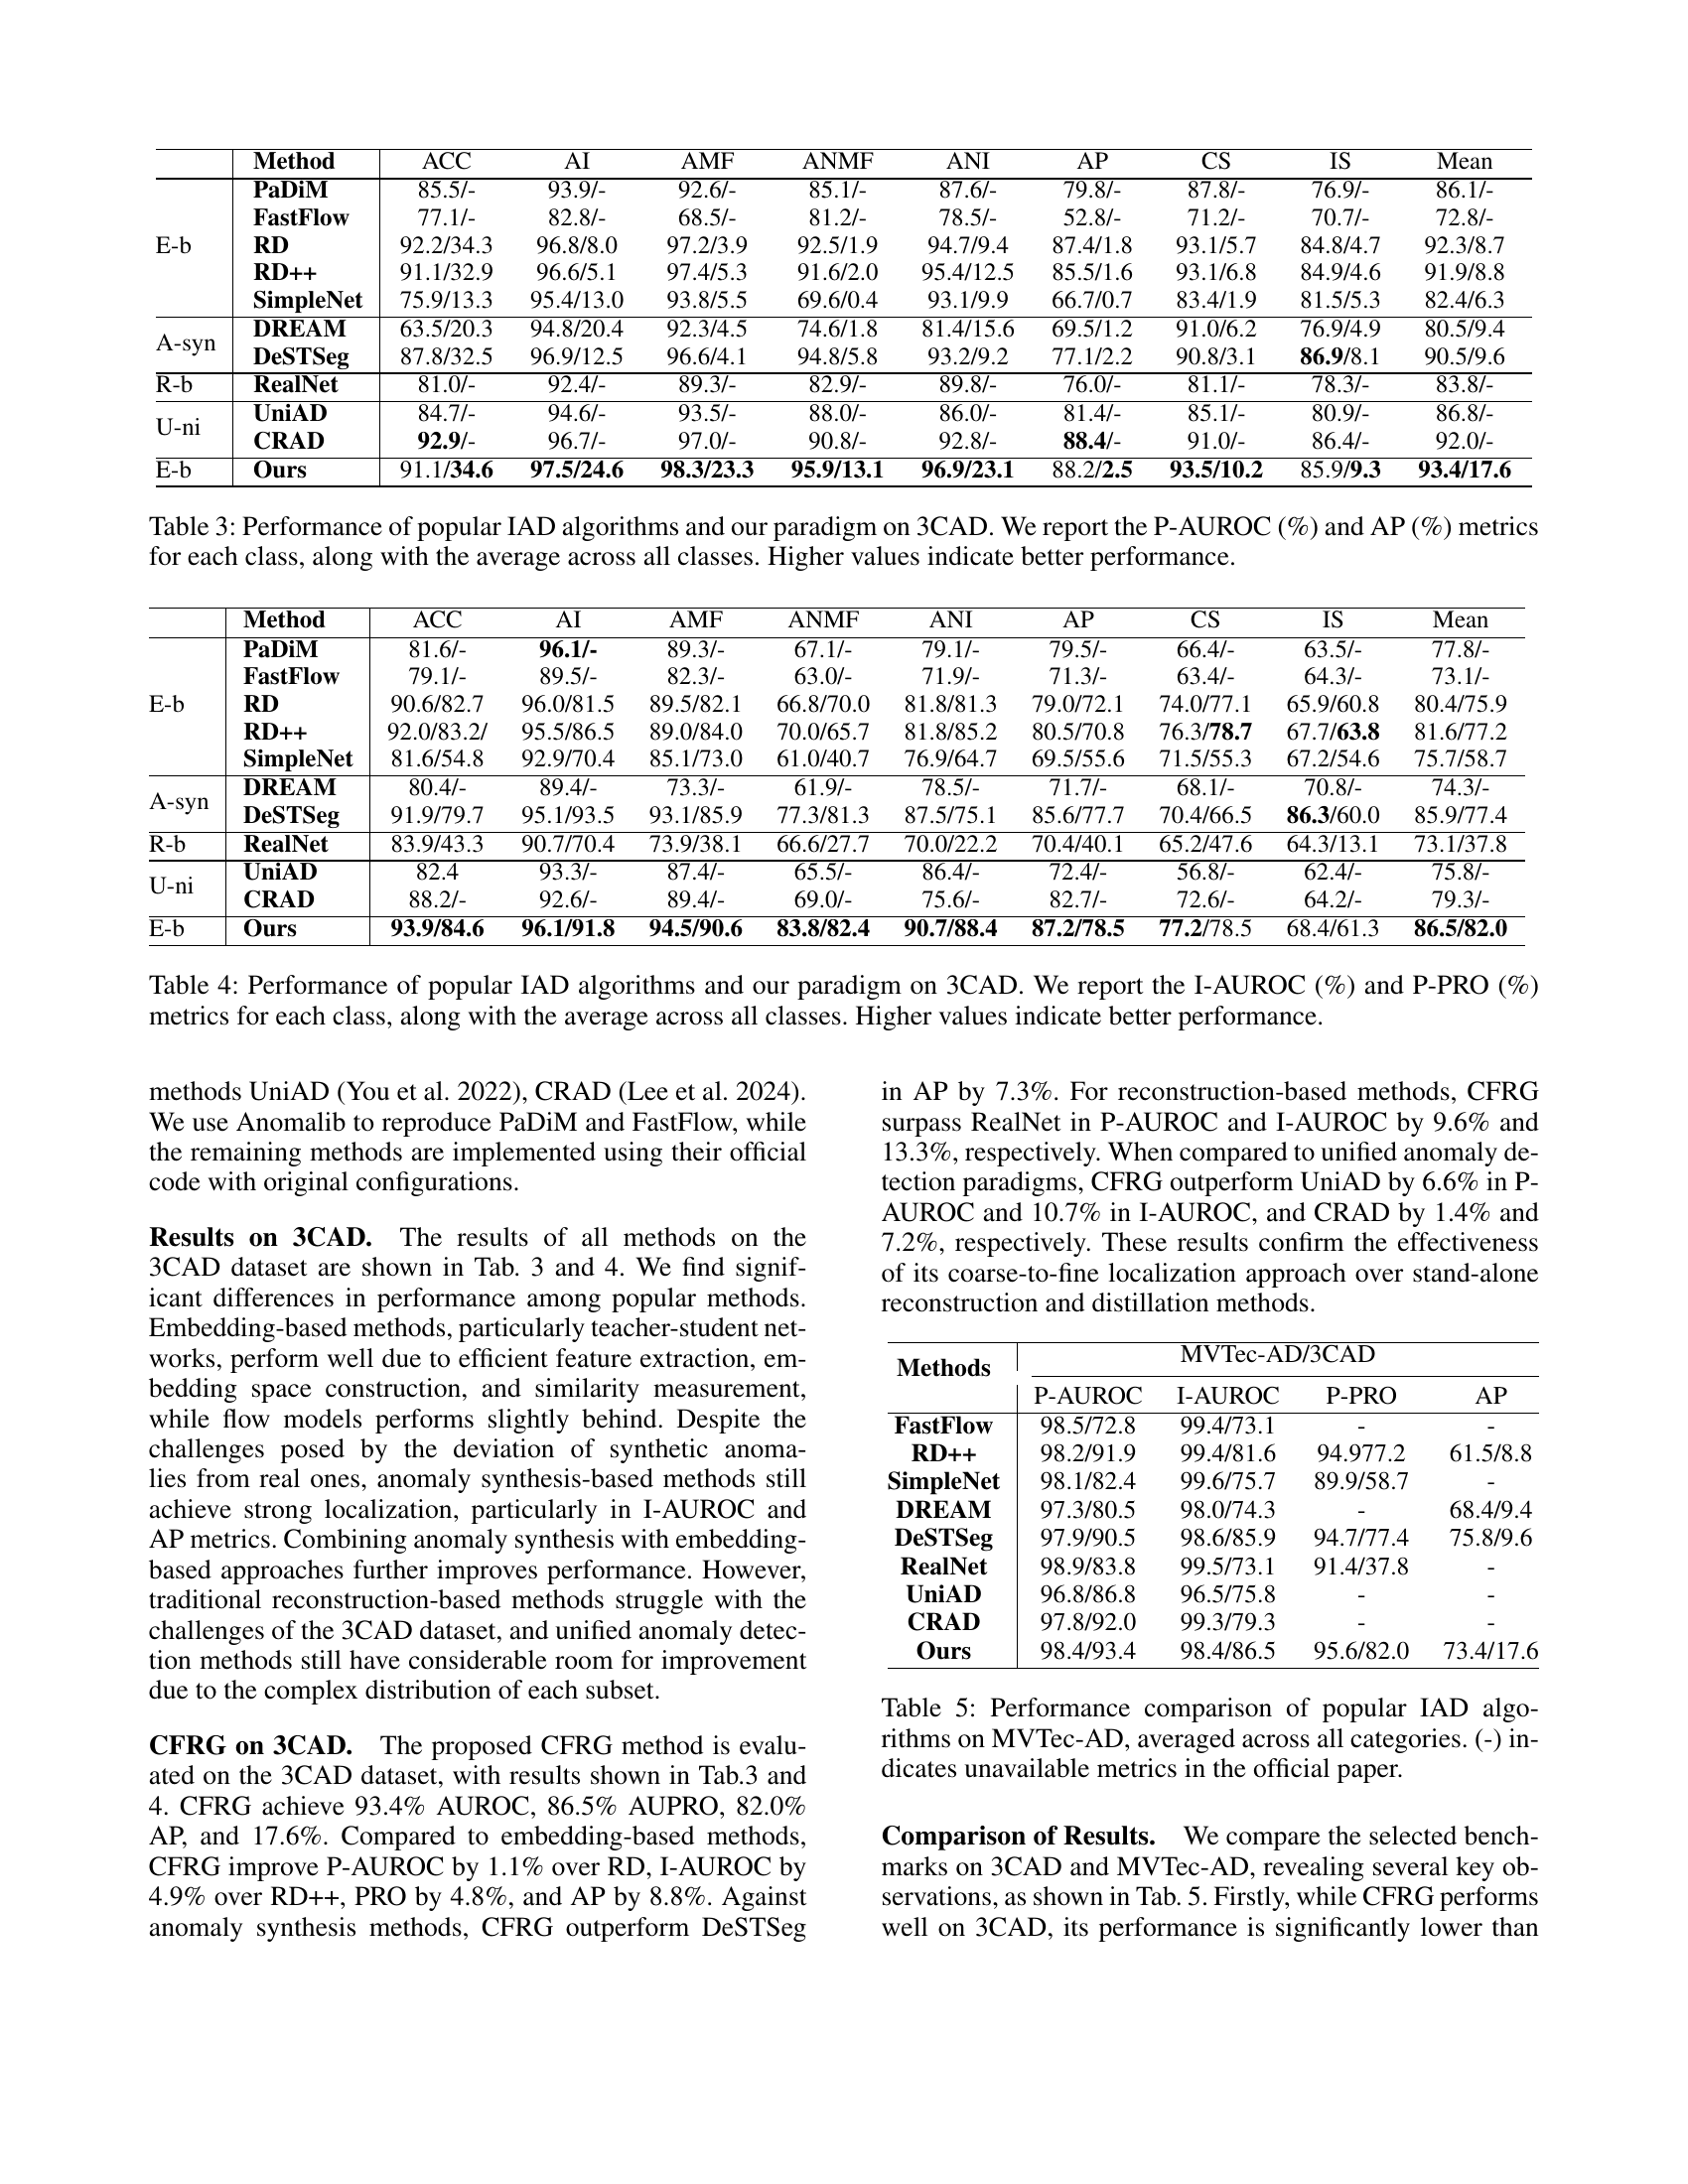
🔼 This table presents a quantitative comparison of various popular anomaly detection algorithms (including the proposed CFRG method) on the 3CAD dataset. The performance of each algorithm is evaluated for eight different product categories within 3CAD. The metrics used are P-AUROC (pixel-level Area Under the Receiver Operating Characteristic curve) and AP (Average Precision), both of which are commonly used to assess the accuracy of object detection and localization. Higher values for both metrics indicate better performance, demonstrating improved ability of an algorithm to correctly identify and locate anomalies in the images.
read the caption
Table 3: Performance of popular IAD algorithms and our paradigm on 3CAD. We report the P-AUROC (%) and AP (%) metrics for each class, along with the average across all classes. Higher values indicate better performance.
| Test |
| Images(good) |
🔼 Table 4 presents a comprehensive comparison of various popular unsupervised anomaly detection algorithms (including the proposed CFRG method) on the 3CAD dataset. For each of the eight product categories within 3CAD, the table shows the Image-level Area Under the Receiver Operating Characteristic curve (I-AUROC) and Pixel-wise Precision-Recall curve (P-PRO) metrics. These metrics assess the algorithm’s ability to accurately detect anomalies at both the image and pixel levels, respectively. The average performance across all eight categories is also provided. Higher I-AUROC and P-PRO values indicate better performance.
read the caption
Table 4: Performance of popular IAD algorithms and our paradigm on 3CAD. We report the I-AUROC (%) and P-PRO (%) metrics for each class, along with the average across all classes. Higher values indicate better performance.
| Test |
| Images(defect) |
🔼 This table compares the performance of several popular anomaly detection algorithms on the MVTec-AD dataset. The performance is averaged across all categories within the dataset. The metrics used for comparison include Area Under the Receiver Operating Characteristic Curve (AUROC), both at the image level (I-AUROC) and pixel-level (P-AUROC), Average Precision (AP), and Pixel-wise Per-Region Overlap (P-PRO). A dash (-) indicates that a specific metric was not reported in the original paper for that algorithm.
read the caption
Table 5: Performance comparison of popular IAD algorithms on MVTec-AD, averaged across all categories. (-) indicates unavailable metrics in the official paper.
| Defect |
| types |
🔼 This table presents the results of ablation studies performed on the Coarse-to-Fine detection paradigm with Recovery Guidance (CFRG) framework. It shows the impact of removing key components of the CFRG model (recovery branch, segmentation module) and altering the distillation paradigm on the model’s performance. The performance is measured using four metrics: Area Under the Receiver Operating Characteristic curve (AUROC), Pixel-wise Per-Region Overlap (P-PRO), Average Precision (AP), all indicating the effectiveness of anomaly detection and localization. The table allows for a quantitative analysis of the contribution of each component to the overall framework’s performance.
read the caption
Table 6: Ablation studies of CFRG with AUROC, P-PRO, and AP metrics.
| Image |
| Height |
🔼 Table 7 presents a detailed performance evaluation of the proposed CFRG (Coarse-to-Fine detection paradigm with Recovery Guidance) method on the widely used MVTec AD dataset. It shows the achieved metrics for each category within the dataset (bottle, cable, capsule, hazelnut, metal nut, pill, screw, toothbrush, transistor, zipper), including P-AUROC (Pixel-level Area Under the Receiver Operating Characteristic curve), I-AUROC (Image-level AUROC), P-PRO (Pixel-wise Per-Region Overlap), and AP (Average Precision). These comprehensive results demonstrate the effectiveness and robustness of the CFRG method across diverse object categories, thus highlighting its generalizability and strong performance even on benchmarks beyond the main 3CAD dataset.
read the caption
Table 7: The detailed metrics of our method on the MVTec AD dataset demonstrate that CFRG also delivers strong performance on widely used datasets.
| Image |
| Width |
🔼 Table 8 presents a detailed performance evaluation of the CFRG method on the widely used MVTec AD dataset. It provides a comprehensive breakdown of the method’s effectiveness across various metrics including P-AUROC, I-AUROC, P-PRO, and AP, for both object and texture categories within the dataset. This allows for a thorough comparison of CFRG against other state-of-the-art anomaly detection methods and showcases its robustness and generalizability.
read the caption
Table 8: The detailed metrics of our method on the MVTec AD dataset demonstrate that CFRG also delivers strong performance on widely used datasets.
| NE |
| / TE |
🔼 This table presents an ablation study on the impact of varying the loss weights (distillation loss, recovery loss, and segmentation loss) in the CFRG model. It shows how changes in the weight of each loss affect the model’s performance across different metrics: Area Under the Receiver Operator Curve (AUROC), Pixel-wise Per-Region Overlap (P-PRO), and Average Precision (AP). By examining these results, the researchers aim to identify the optimal balance of loss weights for superior anomaly detection performance.
read the caption
Table 9: Studies of Loss weight with AUROC, P-PRO, and AP metrics.
Full paper#