TL;DR#
Current video diffusion transformer models are computationally expensive, requiring significant time to generate high-fidelity videos. This is primarily due to the complexity of 3D full attention mechanisms and numerous sampling steps. The research addresses these inefficiencies by proposing a new model called EFFICIENT-VDIT. The slow inference is a major challenge hindering wider adoption of these models.
EFFICIENT-VDIT tackles this problem by developing a novel family of sparse 3D attention mechanisms that exploit inherent redundancies in video data. This significantly reduces computational complexity, resulting in faster inference speeds. Moreover, the method integrates multi-step consistency distillation to shorten the sampling process, further improving the efficiency of video generation. These combined techniques enable substantial acceleration of video generation, achieving up to a 7.8x speedup while maintaining comparable video quality. The framework, built upon the analysis of Attention Tile patterns, shows improved data efficiency and is readily adaptable to distributed inference, showcasing its effectiveness in practical applications.
Key Takeaways#
Why does it matter?#
This paper is crucial for researchers working on video generation because it significantly improves the efficiency of diffusion transformer models. Its findings on sparse attention and multi-step consistency distillation offer practical solutions to current computational bottlenecks, opening avenues for developing faster and more efficient video generation systems. The work’s focus on data efficiency and distributed inference makes it especially relevant in resource-constrained environments. It also introduces a novel “Attention Tile” concept, prompting further exploration of redundant patterns in attention mechanisms.
Visual Insights#

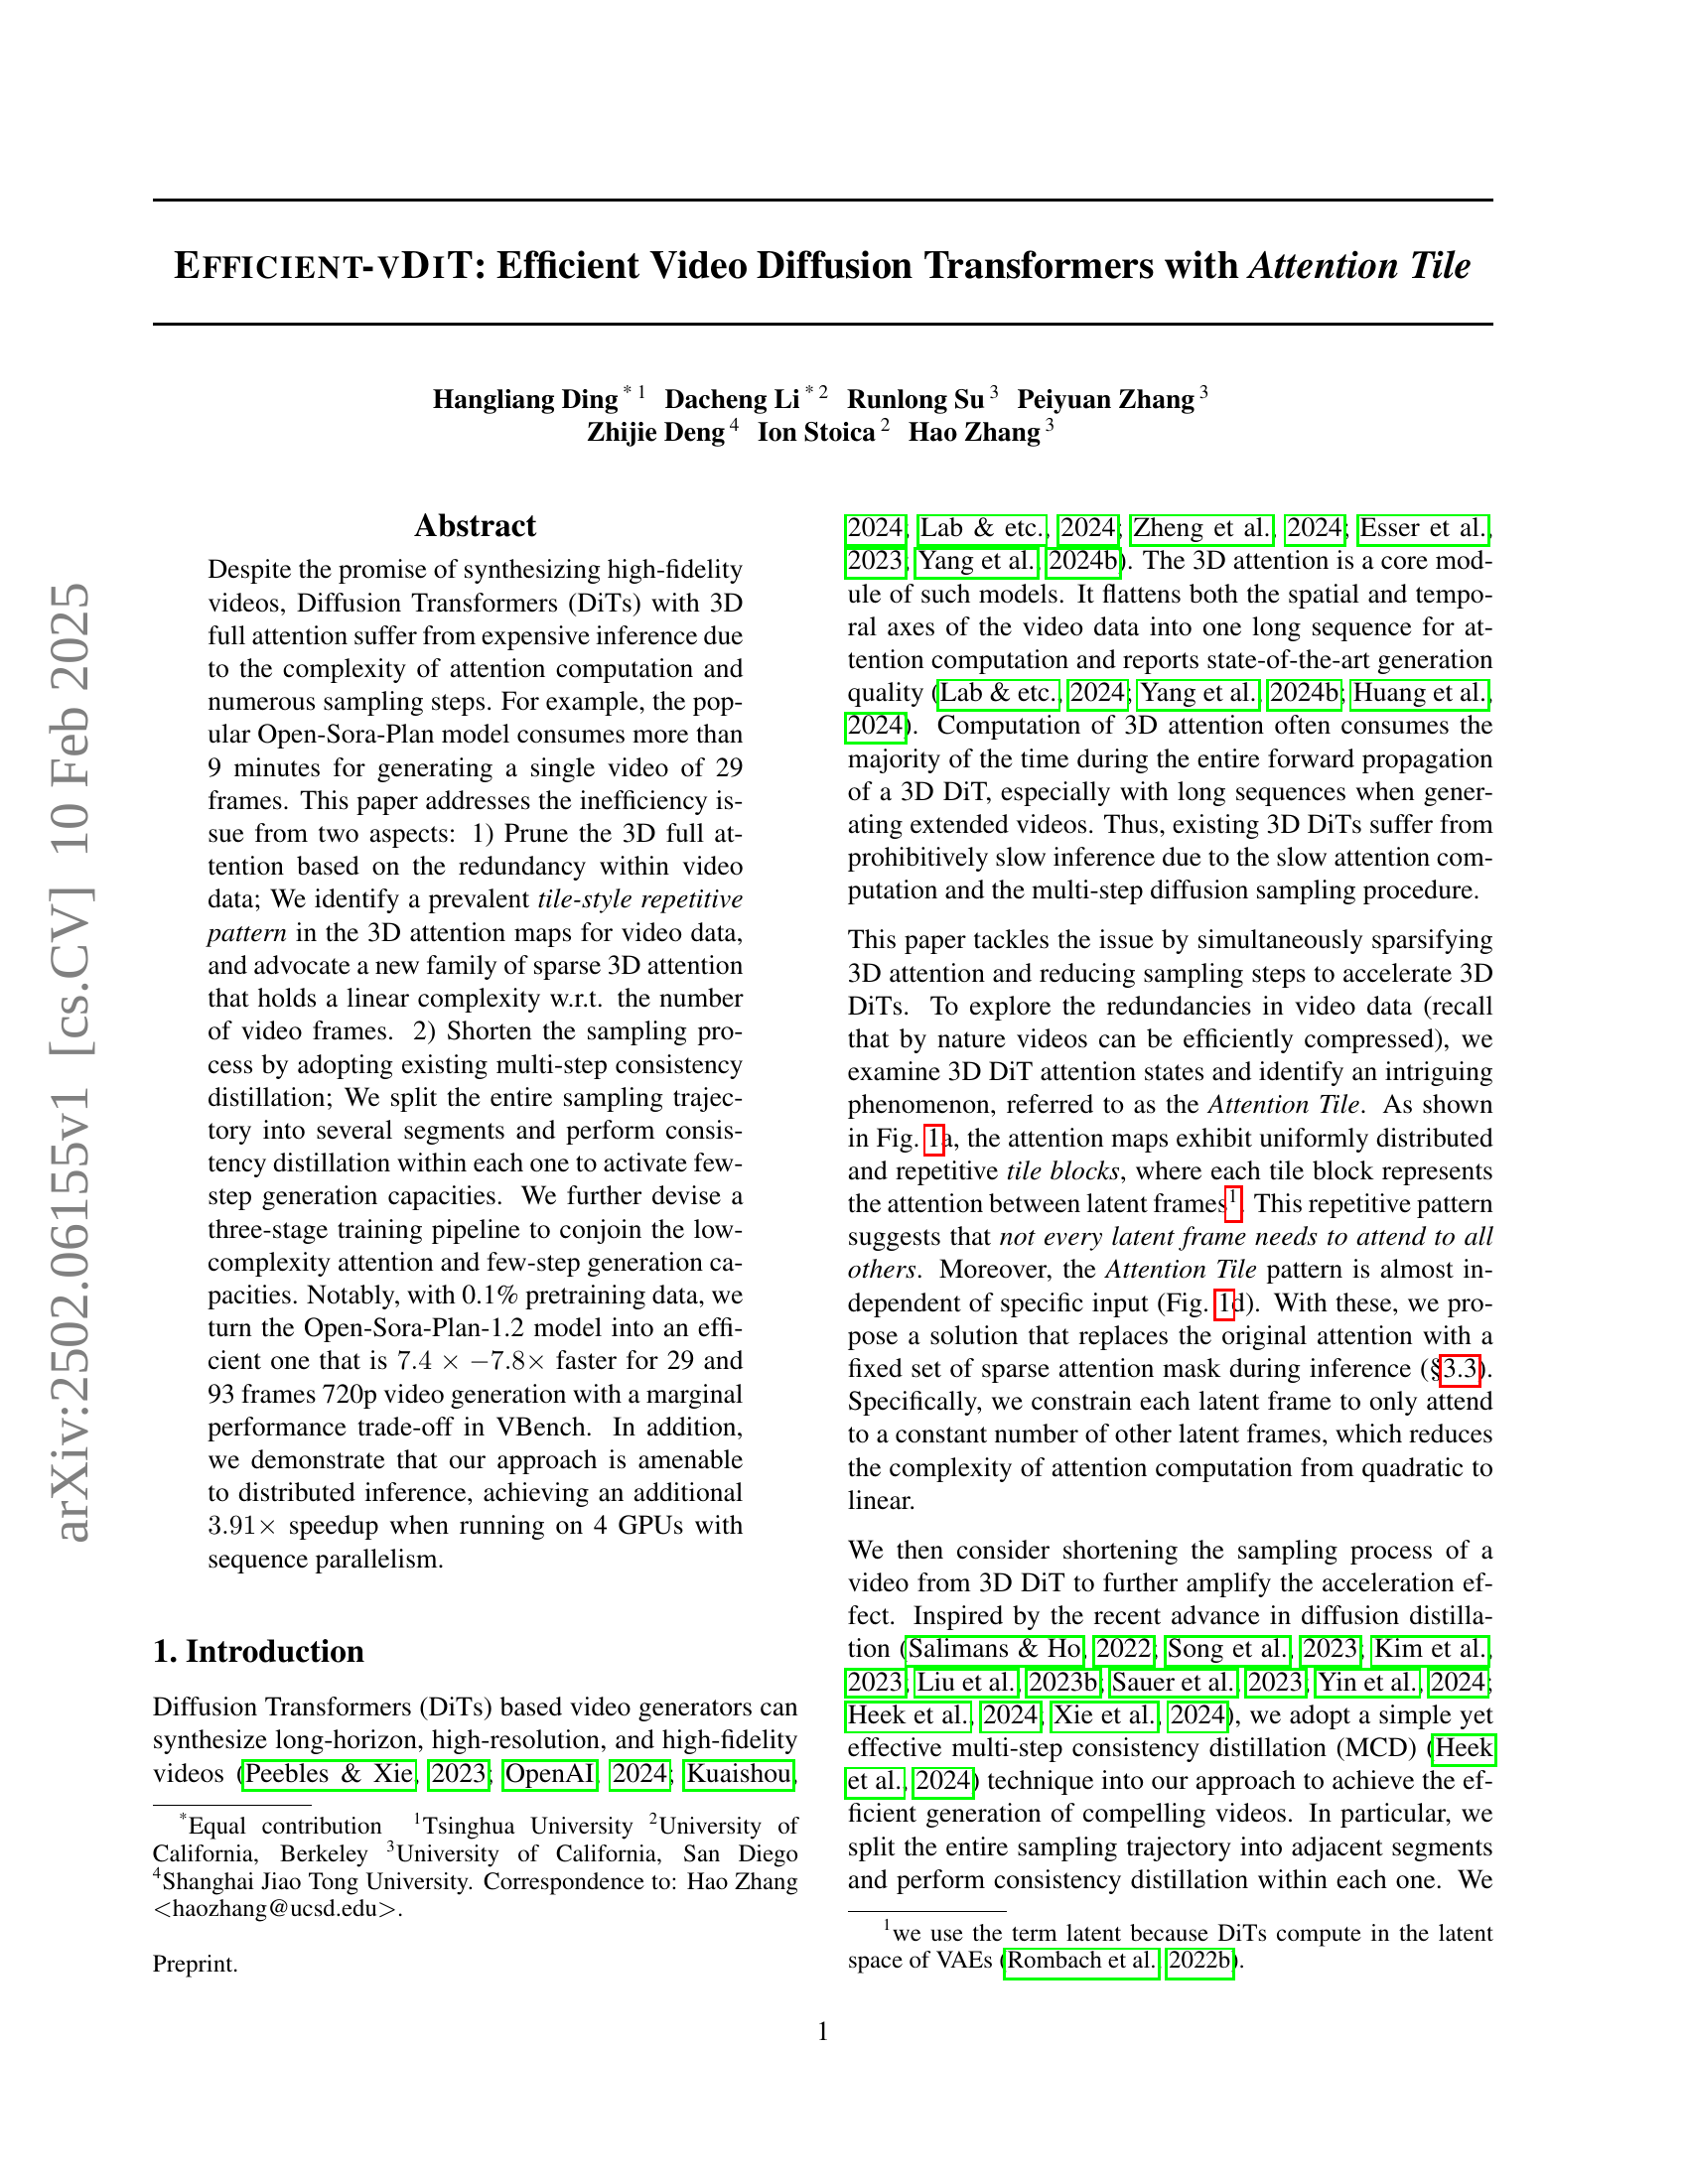
🔼 Figure 1 illustrates the ‘Attention Tile’ pattern observed in 3D Diffusion Transformers (DiTs) for video generation. Panel (a) shows that the attention maps can be decomposed into repeating blocks. Panel (b) distinguishes between diagonal blocks (stronger attention weights) and off-diagonal blocks (weaker weights). Panel (c) highlights the locality within these blocks, showing that attention decreases as the distance from the first frame increases. Panel (d) demonstrates the consistency of the block pattern across different input videos but with variations across different layers of the DiT. The analysis involved randomly selecting two video prompts (landscape and portrait orientations) and identifying the most important attention positions (those accounting for 90%, 95%, and 99% of total attention). The figure then shows the overlap of these key positions across various layers, quantifying the stability of the Attention Tile pattern.
read the caption
Figure 1: We observe the Attention Tile pattern in 3D DiTs. (a) the attention map can be broken down into smaller repetitive blocks. (b) These blocks can be classified into two types, where attention weights on the diagonal blocks are noticeably larger than on off-diagonal ones. (c) These blocks exhibit locality, where the attention score differences between the first frame and later frames gradually increases. (d) The block structure is stable across different data points, but varies across layers. We randomly select 2 prompts (one landscape and one portrait) and record the important positions in the attention map that accounted for 90% (95%, 99%) of the total. We printed the proportion of stable overlap of important positions across layers.
| Frames | Mask | Sparsity (%) | Time(ms) | Speedup |
| 29 | full | 0.00 | 58.36 | 1.00 |
| 4:4 | 17.60 | 46.52 | 1.25 | |
| 3:5 | 29.88 | 40.08 | 1.46 | |
| 2:6 | 45.47 | 31.35 | 1.86 | |
| 1:7 | 64.38 | 20.65 | 2.83 | |
| 93 | full | 0.00 | 523.61 | 1.00 |
| 12:12 | 21.51 | 397.72 | 1.32 | |
| 8:16 | 40.30 | 303.90 | 1.72 | |
| 6:18 | 51.88 | 244.13 | 2.14 | |
| 4:20 | 64.98 | 179.74 | 2.91 | |
| 3:21 | 72.05 | 142.77 | 3.67 |
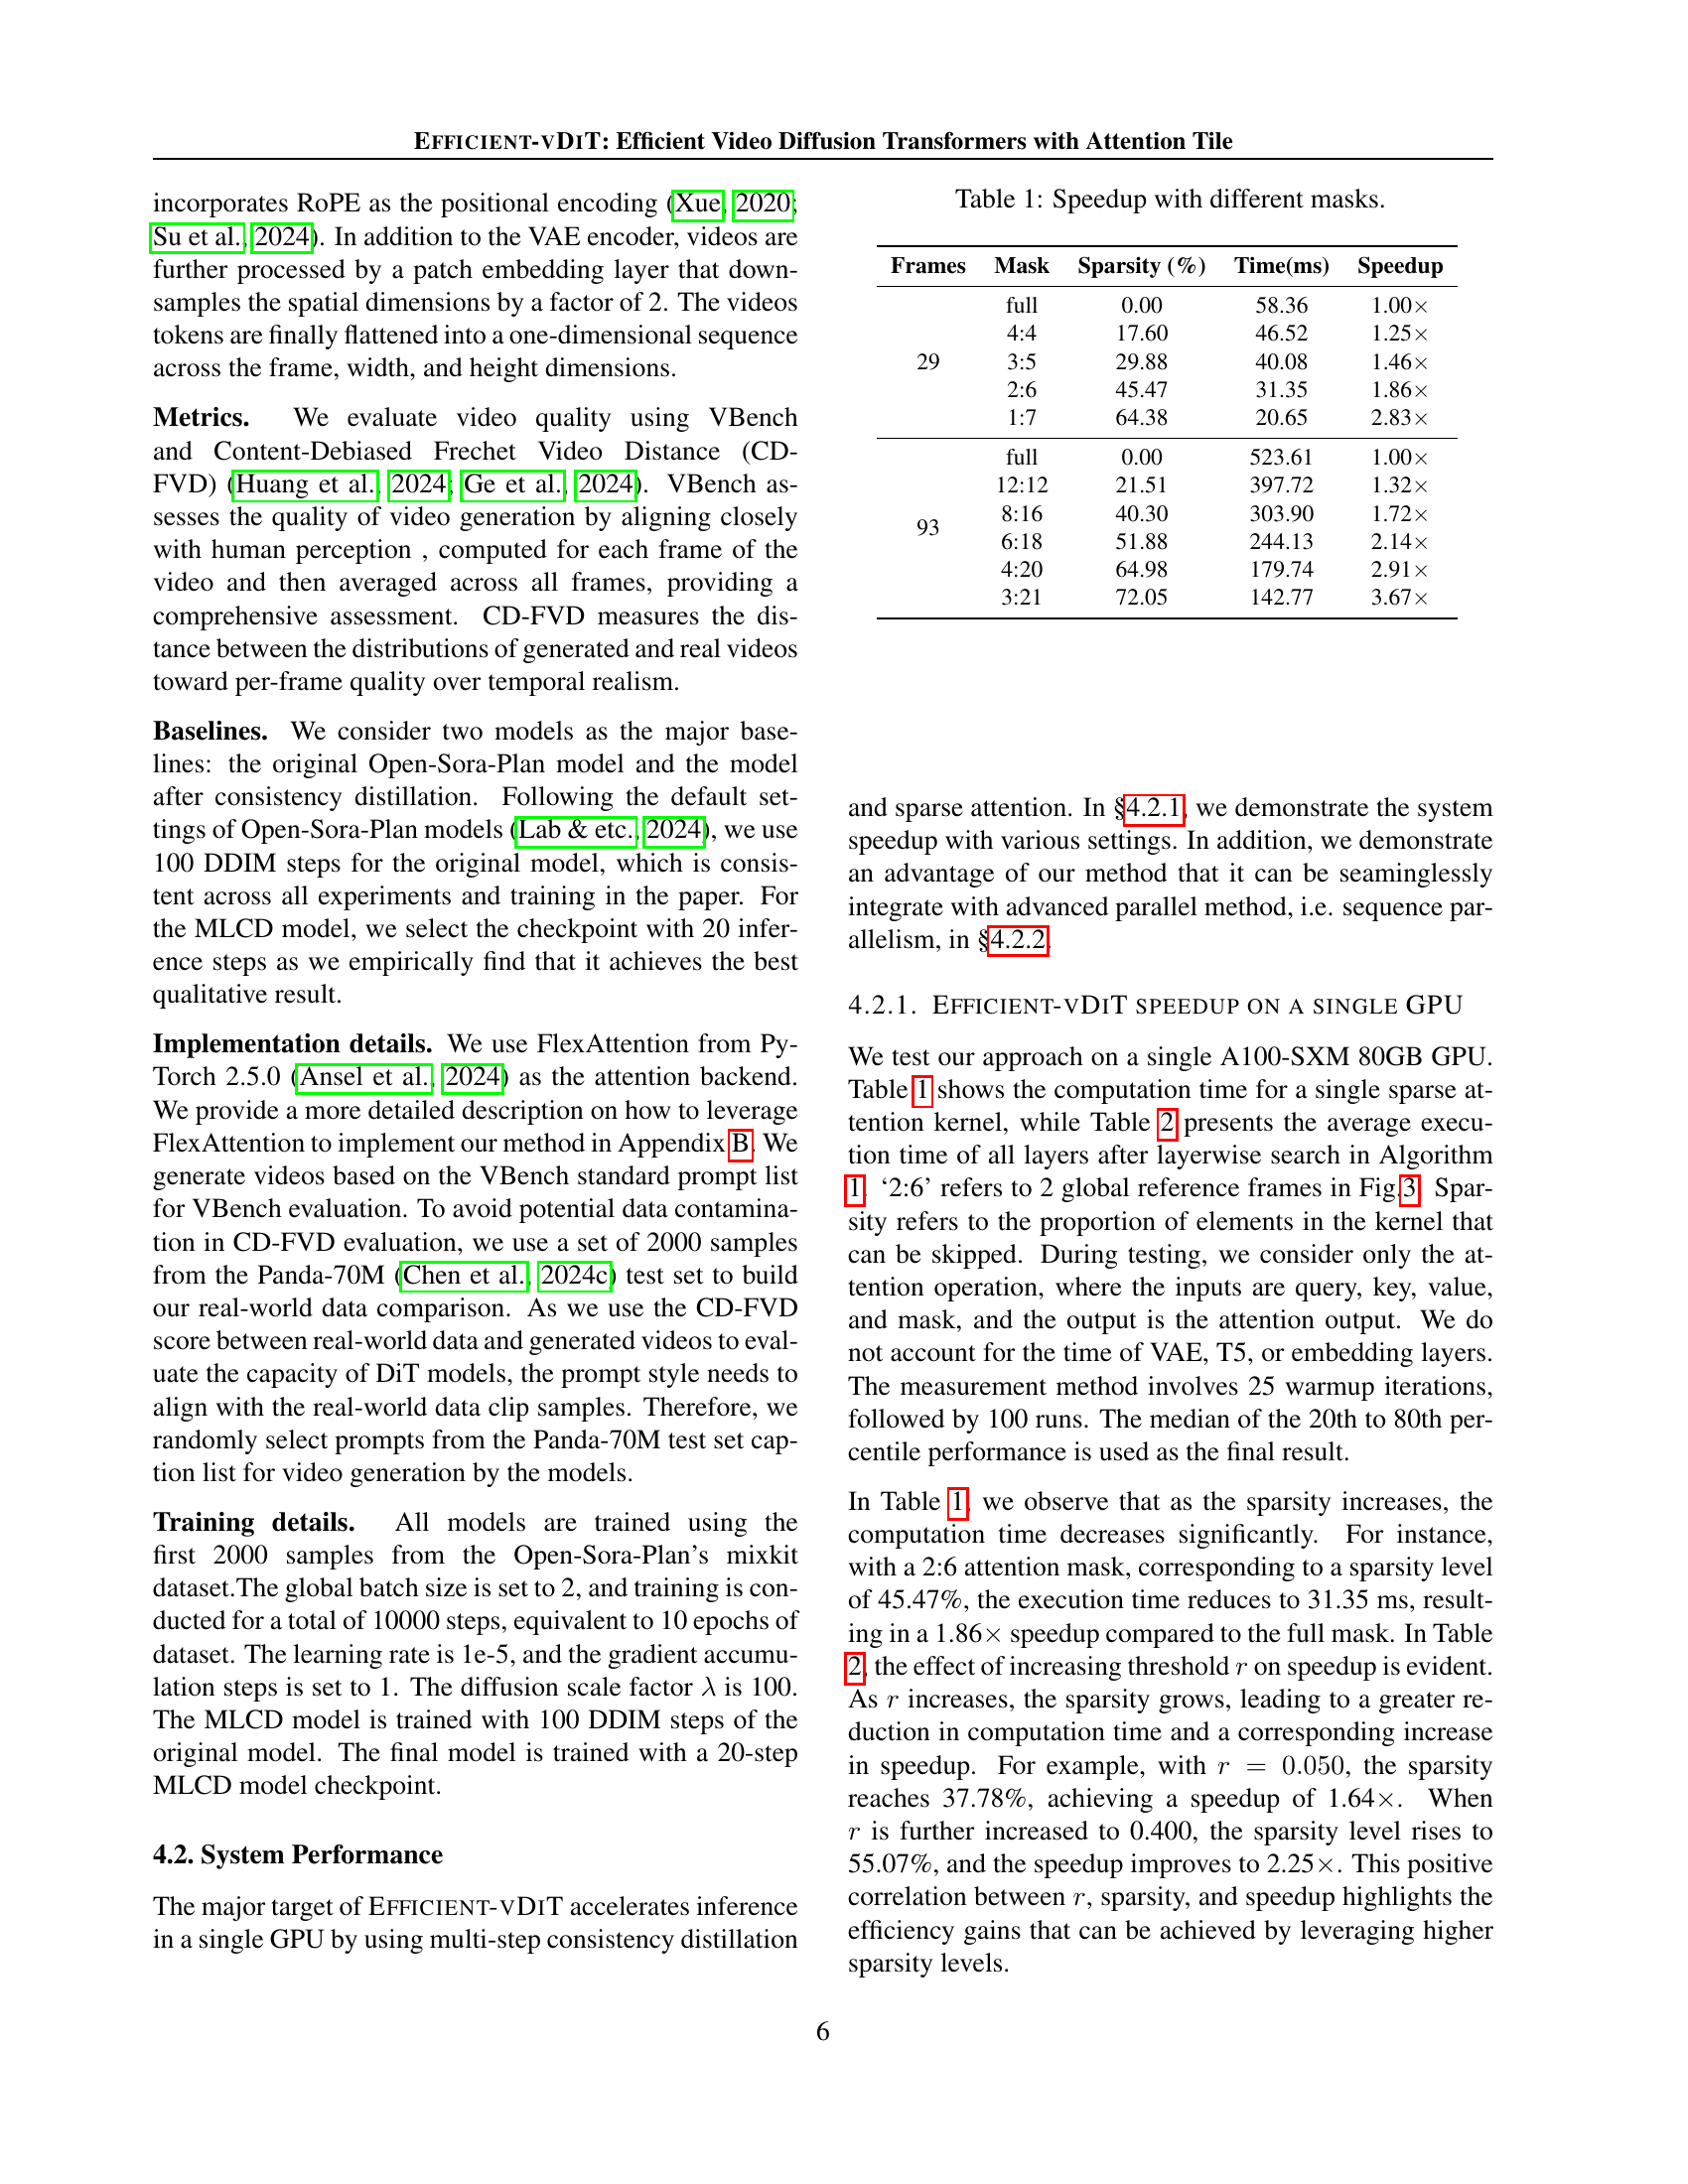
🔼 This table presents the speedup achieved by using different sparse attention masks in the EFFICIENT-VDIT model. The speedup is calculated relative to the full attention model (no sparsity). Different sparsity levels are tested, corresponding to different numbers of frames that each latent frame attends to in the attention mechanism. The results show how much faster the inference process becomes with various degrees of sparsity, and for two different video lengths (29 and 93 frames).
read the caption
Table 1: Speedup with different masks.
In-depth insights#
Attention Tile Sparsity#
The concept of “Attention Tile Sparsity” in video diffusion models centers on optimizing the computational efficiency of the attention mechanism. The authors observed a repetitive tiling pattern in the attention maps of video data, suggesting redundancy. This redundancy implies that not all frames need to attend to every other frame. Sparsity techniques are introduced to leverage this observation, reducing the quadratic complexity of full attention to a more efficient linear complexity. This is achieved by strategically pruning connections in the attention map, focusing on the most informative interactions between frames, those along the main diagonal and a limited set of other frames. The data-independent nature of this tiling pattern further enhances the practicality of this approach because it allows for the creation of fixed sparse attention masks, used consistently across different video inputs, thus preventing computationally expensive inference-time searching. The effectiveness of this approach is demonstrated through significant speedups in video generation with minimal performance trade-offs, indicating that Attention Tile Sparsity is a promising direction for enhancing the scalability of video diffusion models.
MCD for Video DiTs#
Multi-step consistency distillation (MCD) applied to video diffusion transformers (DiTs) offers a powerful technique to significantly accelerate video generation. By splitting the lengthy sampling trajectory into segments and applying consistency distillation within each segment, MCD effectively reduces the number of sampling steps required to produce high-fidelity videos, thus improving inference speed. This is particularly valuable for DiTs, which are known for their computational intensity. The inherent parallelism in MCD also makes it amenable to GPU acceleration, furthering performance improvements. However, the effectiveness of MCD depends on careful hyperparameter tuning and proper integration into the DiT architecture. The trade-off between reducing sampling steps and preserving video quality must be carefully balanced; too aggressive a reduction might compromise the output’s fidelity. Therefore, successful implementation requires a robust strategy to select optimal checkpoints for the distillation process, potentially using validation metrics to guide this selection. Combining MCD with other optimization techniques (like sparsity) could lead to even more efficient video generation models.
Efficient Training Pipeline#
An efficient training pipeline for video generation models is crucial for balancing performance and resource consumption. A three-stage approach, as suggested, would likely involve: Stage 1: Multi-step Consistency Distillation, where a teacher model’s long sampling trajectory is distilled into a student model with fewer steps, improving efficiency. Stage 2: Layer-wise Sparsity Search, which focuses on identifying and leveraging redundant patterns within the 3D attention maps of video data to create sparse attention masks, further accelerating inference. This is critical for addressing the quadratic complexity of full attention. Finally, Stage 3: Knowledge Distillation, where knowledge from the efficient student model is transferred to a final model, ensuring that the speed gains achieved in the previous stages are not at the cost of significant performance degradation. This iterative refinement process is essential for achieving a well-performing model while also maximizing computational efficiency. The success of this approach hinges on the careful selection of suitable methods at each stage and ensuring their compatibility to avoid performance bottlenecks. The choice of hyperparameters, especially the sparsity level, significantly impacts the trade-off between speed and fidelity, requiring meticulous tuning. Finally, the analysis of whether this pipeline generalizes to different architectures (e.g., MM-DiT) is key to determining its broader applicability and robustness.
Scalable Inference#
Scalable inference in large language models (LLMs) and video generation models is crucial for real-world deployment. Efficient-VDIT tackles this challenge in video diffusion transformers by addressing two key inefficiencies: the computationally expensive 3D full attention mechanism and the lengthy diffusion sampling process. The paper introduces a novel sparse attention mechanism inspired by the observed ‘Attention Tile’ pattern in attention maps, significantly reducing computational complexity. This, coupled with multi-step consistency distillation, shortens the sampling trajectory, resulting in substantial speedups. The framework’s modular design allows for seamless integration with distributed inference strategies, further enhancing scalability. Achieving linear time complexity with respect to the number of video frames, Efficient-VDIT demonstrates significant speed improvements, enabling faster video generation. The data-efficient training methodology contributes to broader accessibility. Overall, Efficient-VDIT presents a significant advancement in efficient and scalable video generation, making high-fidelity video synthesis more practical for various applications.
Future Work: MM-DiTs#
Future research into MM-DiTs (Multi-Modal Diffusion Transformers) should prioritize efficiency improvements. Current MM-DiT architectures, while capable of generating high-quality videos from text and video prompts, often suffer from computational limitations. Investigating sparse attention mechanisms tailored for multi-modal data, similar to those explored in the paper for video-only DiTs, is crucial. Combining sparse attention with techniques like multi-step consistency distillation could significantly accelerate inference. Furthermore, exploring different model architectures designed for efficient multi-modal processing, possibly leveraging techniques beyond traditional transformers, warrants investigation. The potential benefits of pre-training strategies focused on efficient multi-modal representation learning should also be assessed. Ultimately, the goal is to strike a balance between high-fidelity video generation and efficient inference, making MM-DiTs practically applicable for broader use cases.
More visual insights#
More on figures

🔼 This figure illustrates the Efficient-VDIT framework, which enhances the speed of video generation while maintaining high fidelity. It starts with a pre-trained 3D full attention Diffusion Transformer (DiT) known for its accuracy but slow inference. The framework then uses a three-stage process. Stage 1 adapts multi-step consistency distillation for video, creating a more efficient CM model. Stage 2 searches for optimal sparse attention patterns in each layer, achieving linearity in time complexity. Stage 3 uses knowledge distillation to refine the sparse model, resulting in a final DiT that is significantly faster than the original with minimal impact on video quality.
read the caption
Figure 2: Efficient-vDiT takes in a pre-trained 3D Full Attention video diffusion transformer(DiT), with slow inference speed and high fidelity. It then operates on three stages to greatly accelerate the inference while maintaining the fidelity. In Stage 1, we modify the multi-step consistency distillation framework from (Heek et al., 2024) to the video domain, which turned a DiT model to a CM model with stable training. In Stage 2, Efficient-vDiT performs a searching algorithm to find the best sparse attention pattern for each layer. In stage 3, Efficient-vDiT performs a knowledge distillation procedure to optimize the fidelity of the sparse DiT. At the end, Efficient-vDiT outputs a DiT with linear attention, high fidelity and fastest inference speed.

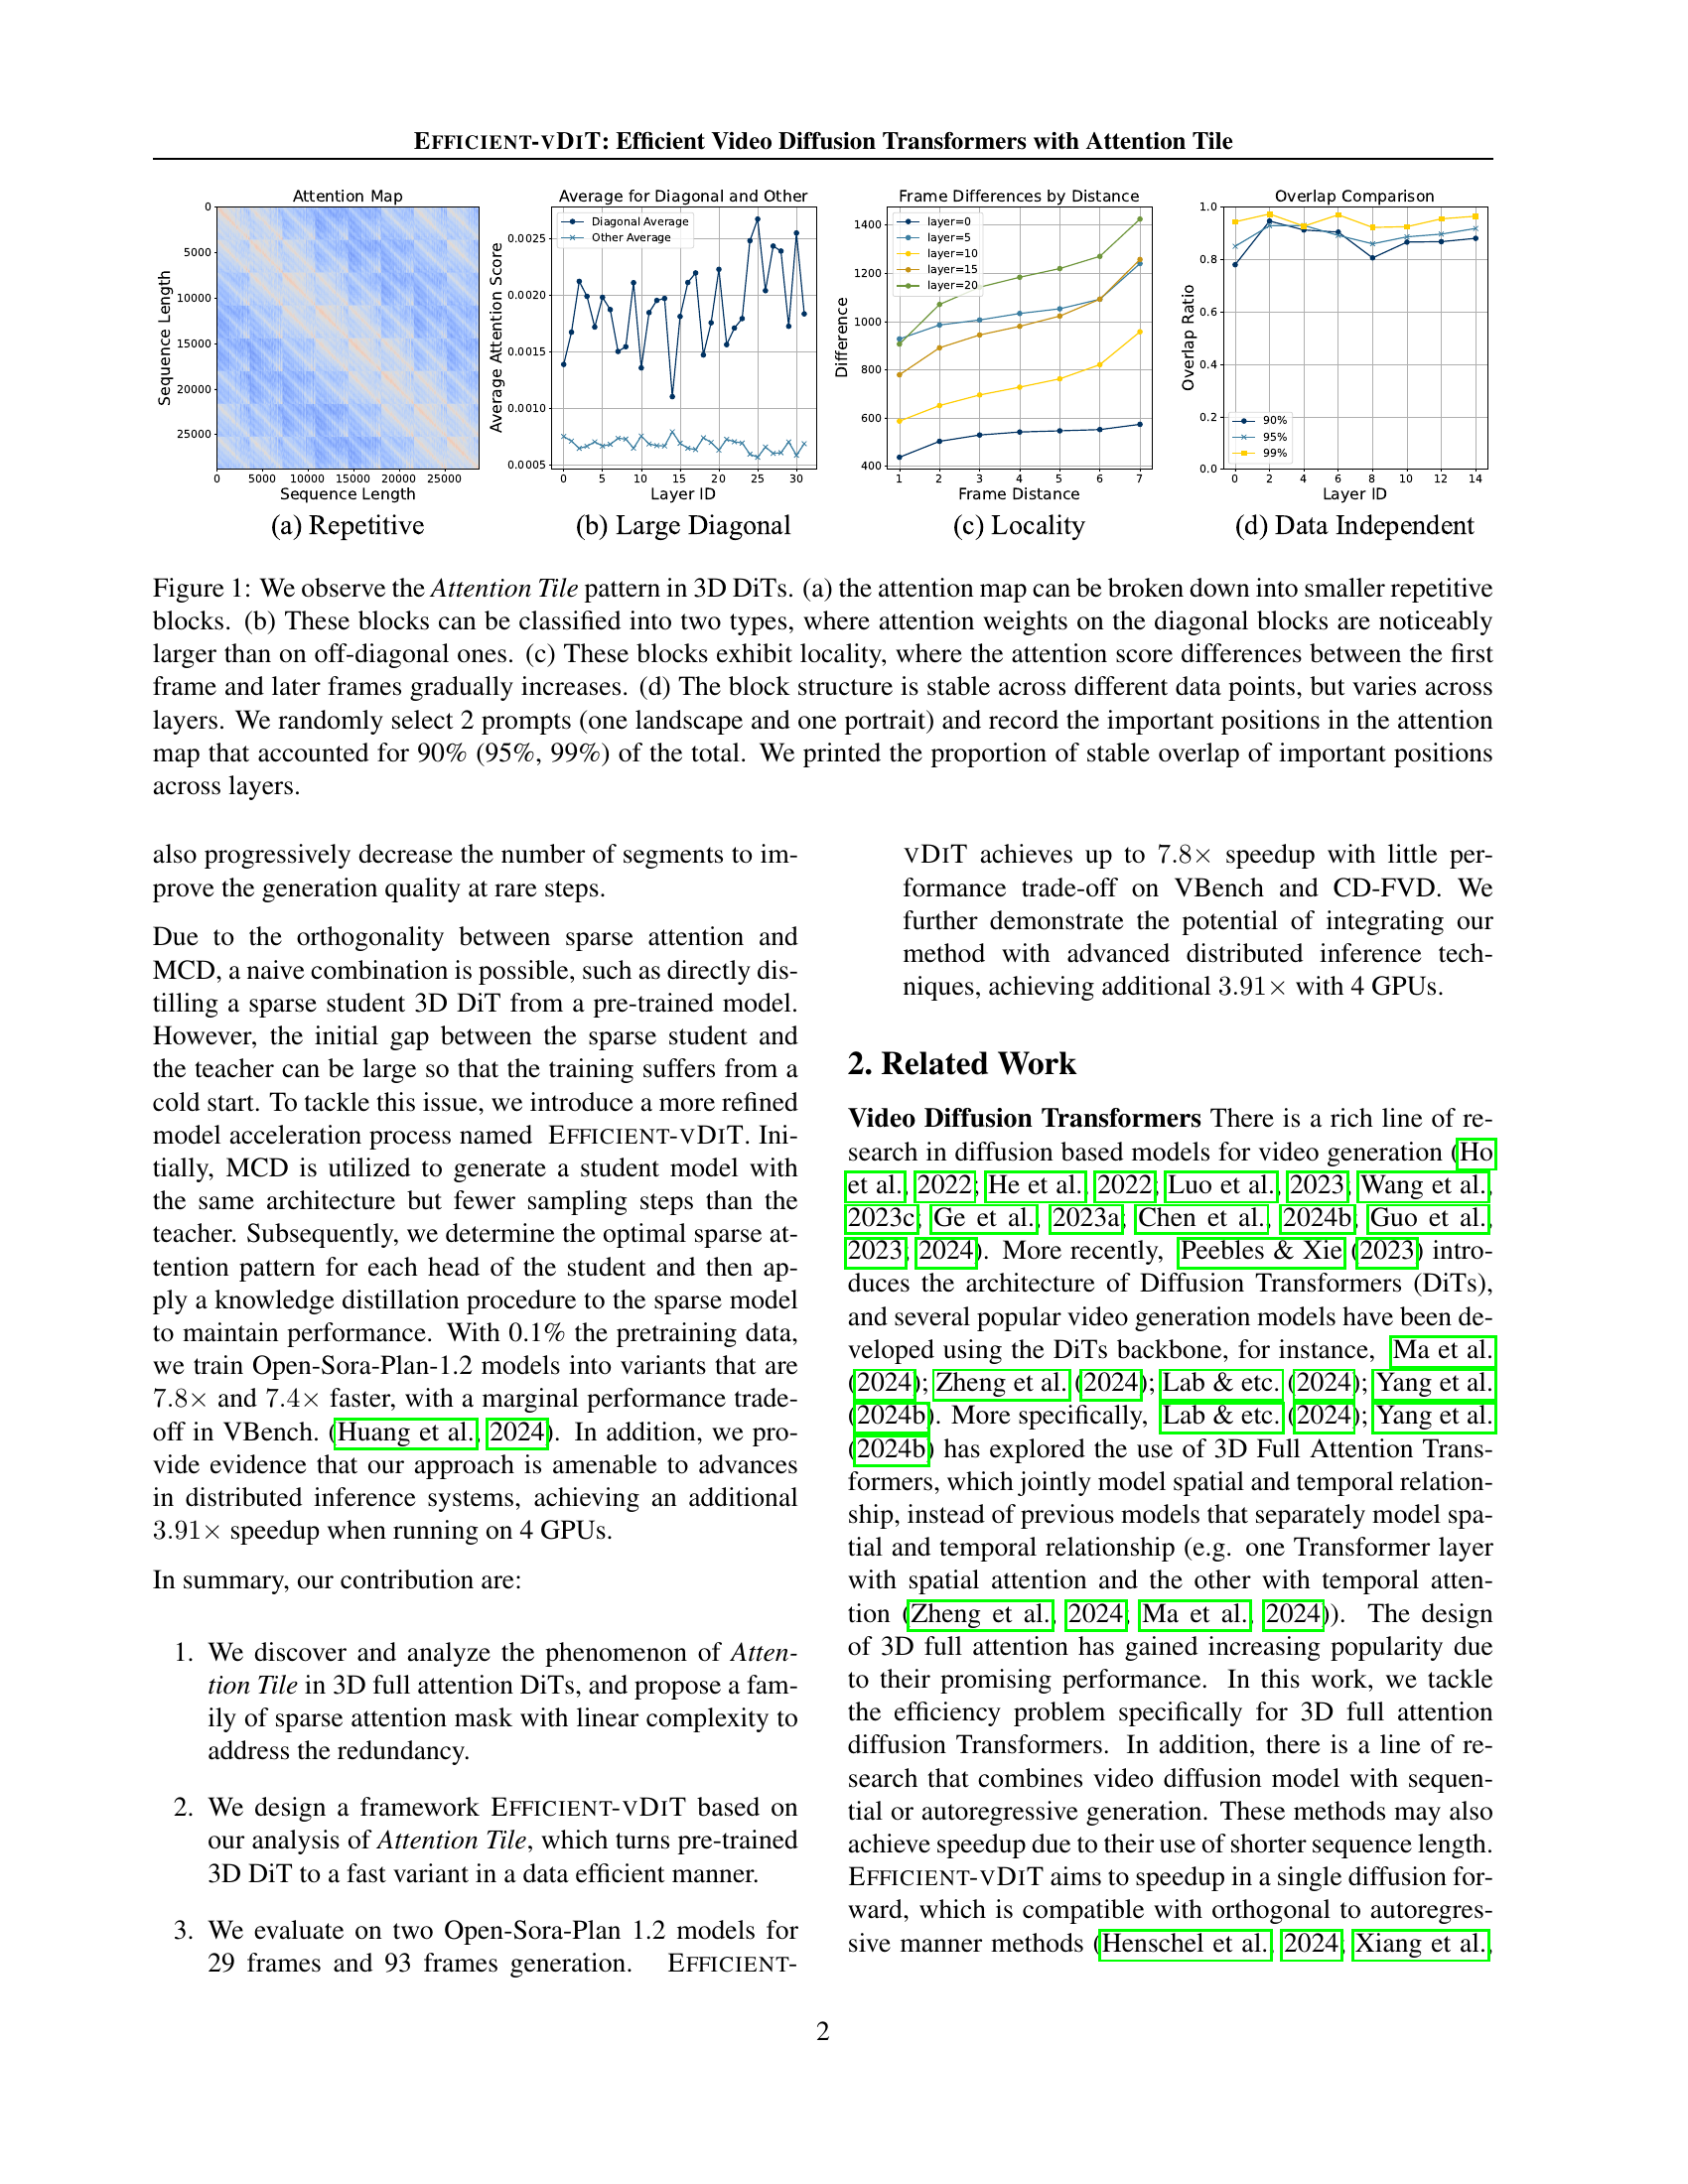
🔼 This figure showcases a sample of a sparse attention mask used in the EFFICIENT-VDIT model. The mask is represented as a grid, highlighting which latent frame connections are maintained during attention computation. The (2:6) notation signifies that each frame attends to 2 global reference frames, aside from its connections along the main diagonal. The white blocks illustrate areas where attention is pruned, reducing computational cost. This sparse attention pattern is designed to leverage the repetitive ‘Attention Tile’ structure identified in video data. By selectively pruning less important connections, the model significantly accelerates the attention mechanism while aiming to retain sufficient information for high-quality video generation.
read the caption
Figure 3: Exemplar attention mask (2:6:262:62 : 6). It maintains the attention in the main diagonals and against 2 global reference latent frames. Tile blocks in white are not computed.

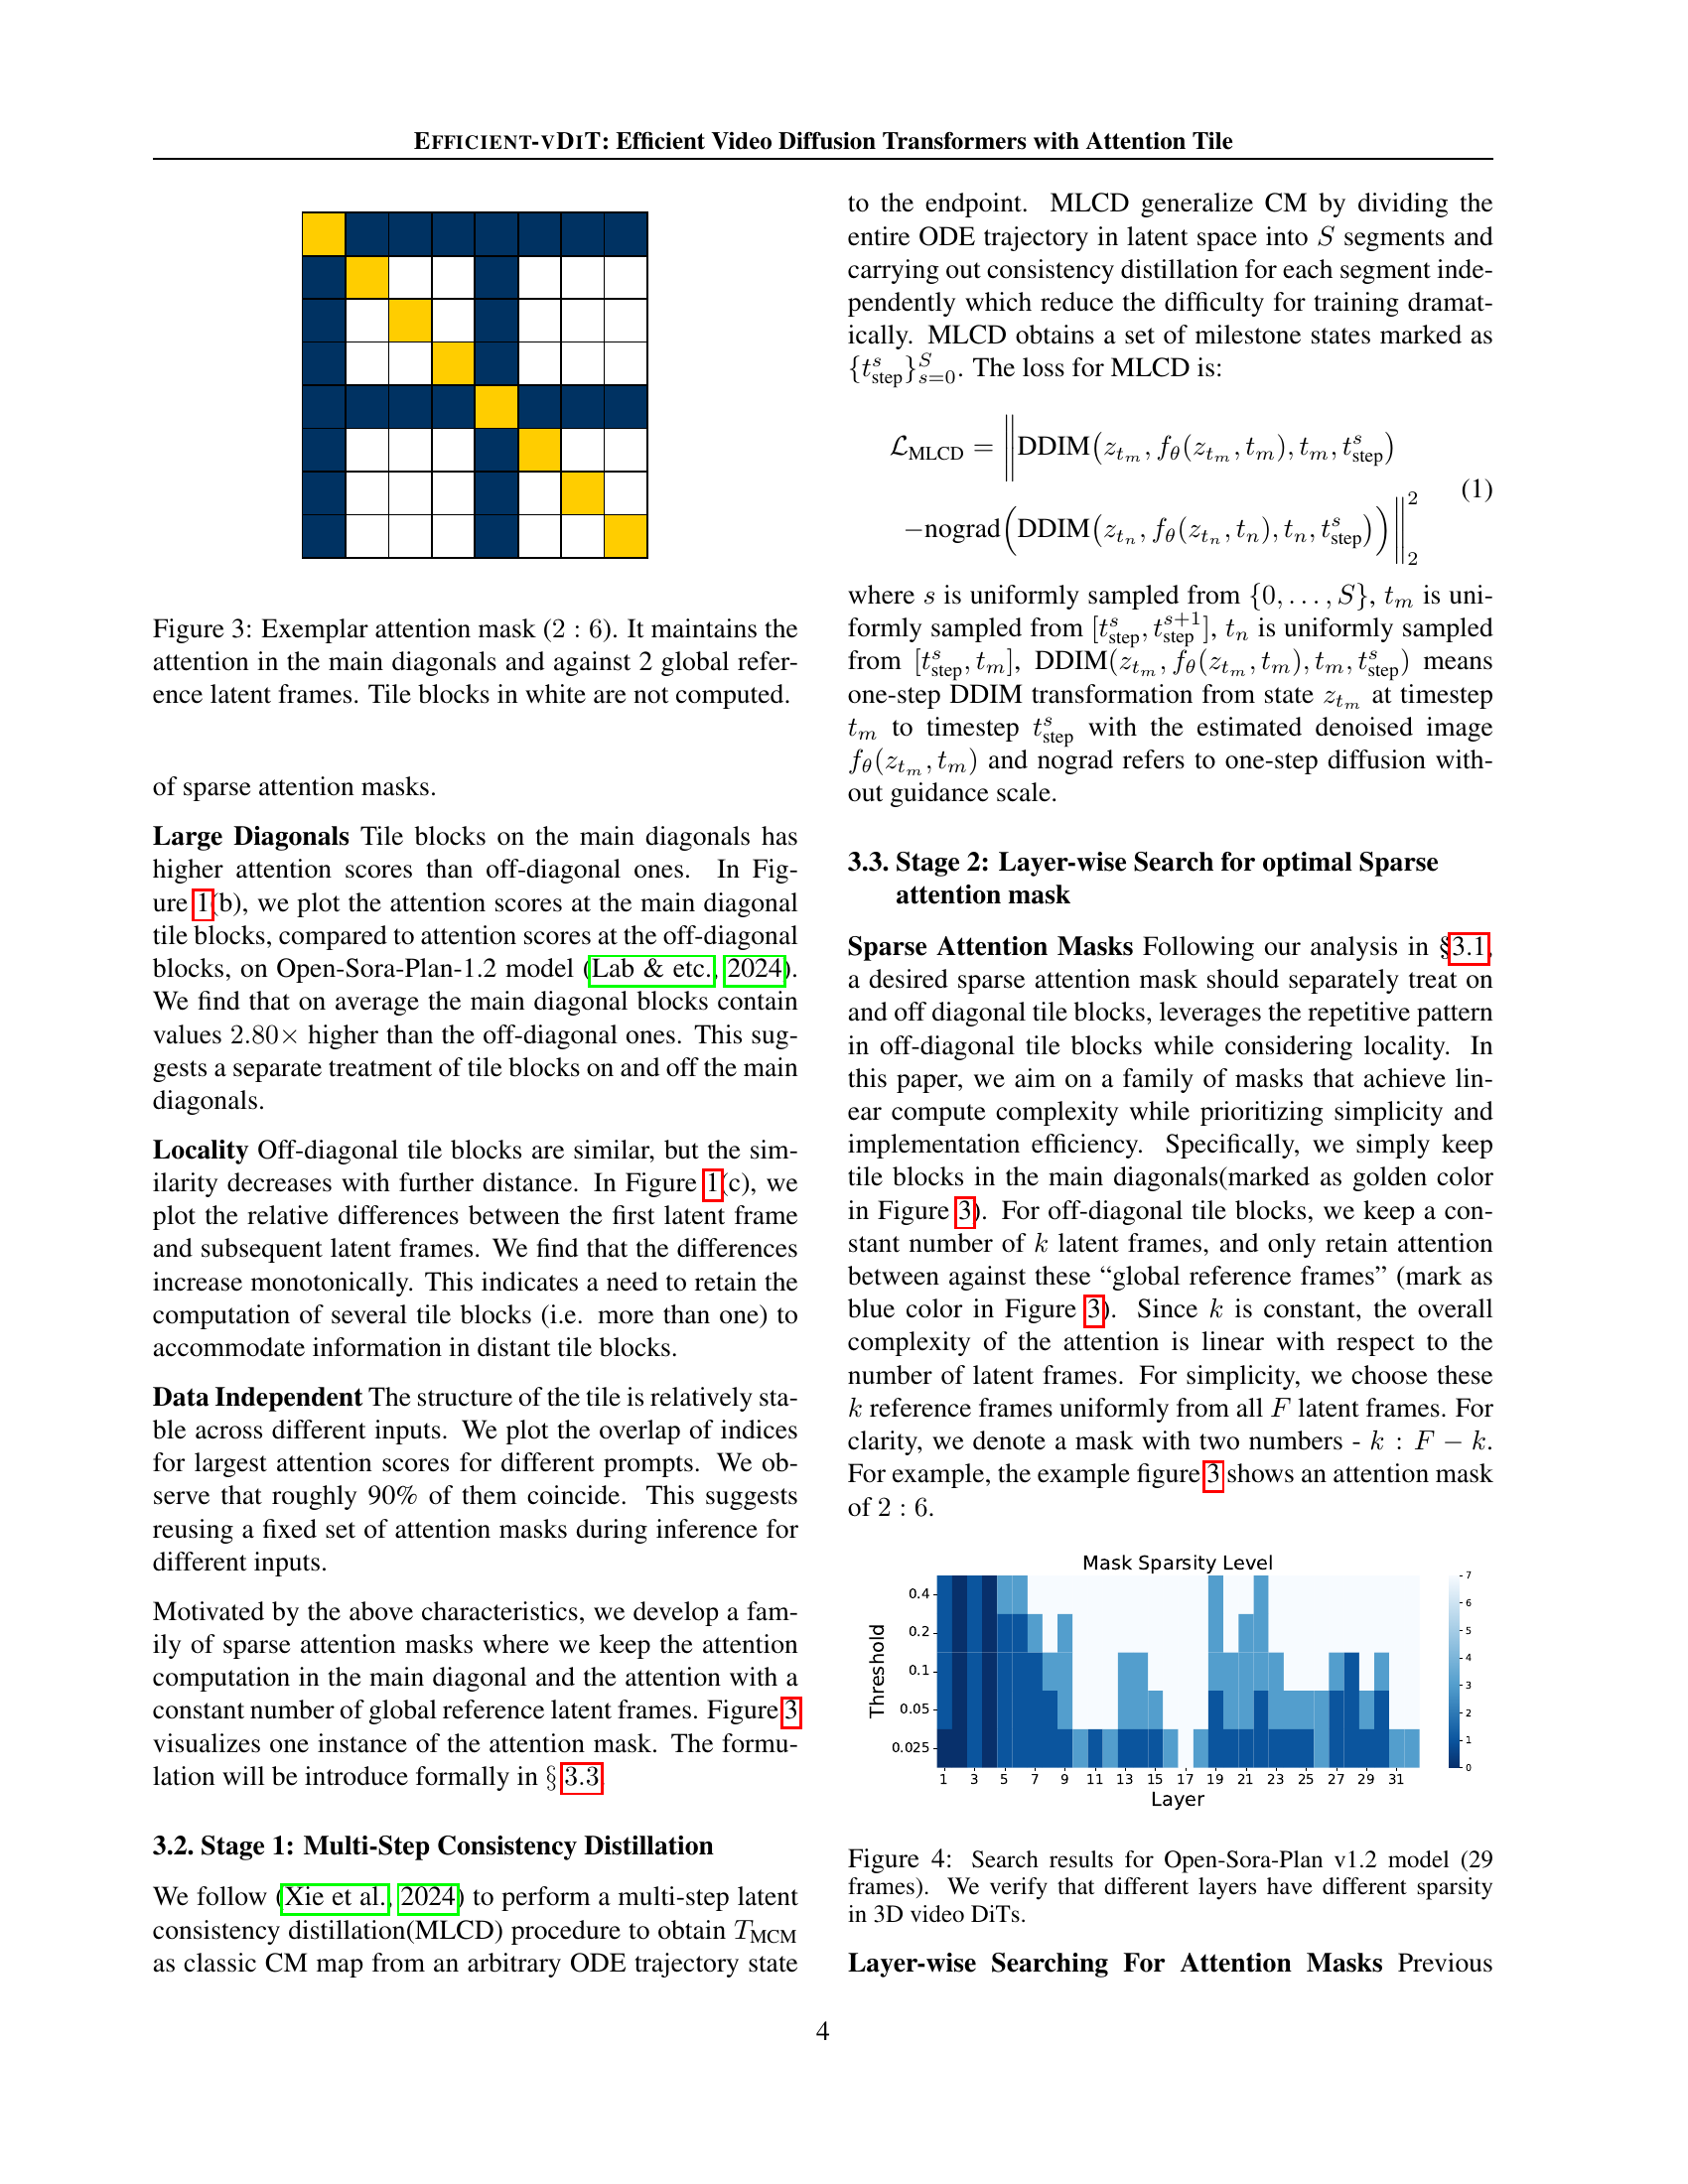
🔼 Figure 4 shows the results of an experiment to determine the optimal sparsity level for each layer in a 3D video diffusion transformer (DiT) model, specifically Open-Sora-Plan v1.2, when generating videos with 29 frames. The experiment aimed to find the appropriate balance between computational efficiency and performance. The graph displays the sparsity level (vertical axis) for each layer (horizontal axis) after an optimization process. Different layers exhibit varying levels of sparsity, indicating that some layers can tolerate more sparsity than others during inference without significantly impacting the model’s performance. This finding supports the design choice of the EFFICIENT-VDIT framework, which employs layer-wise sparsity search to optimize the trade-off between inference speed and video quality.
read the caption
Figure 4: Search results for Open-Sora-Plan v1.2 model (29 frames). We verify that different layers have different sparsity in 3D video DiTs.

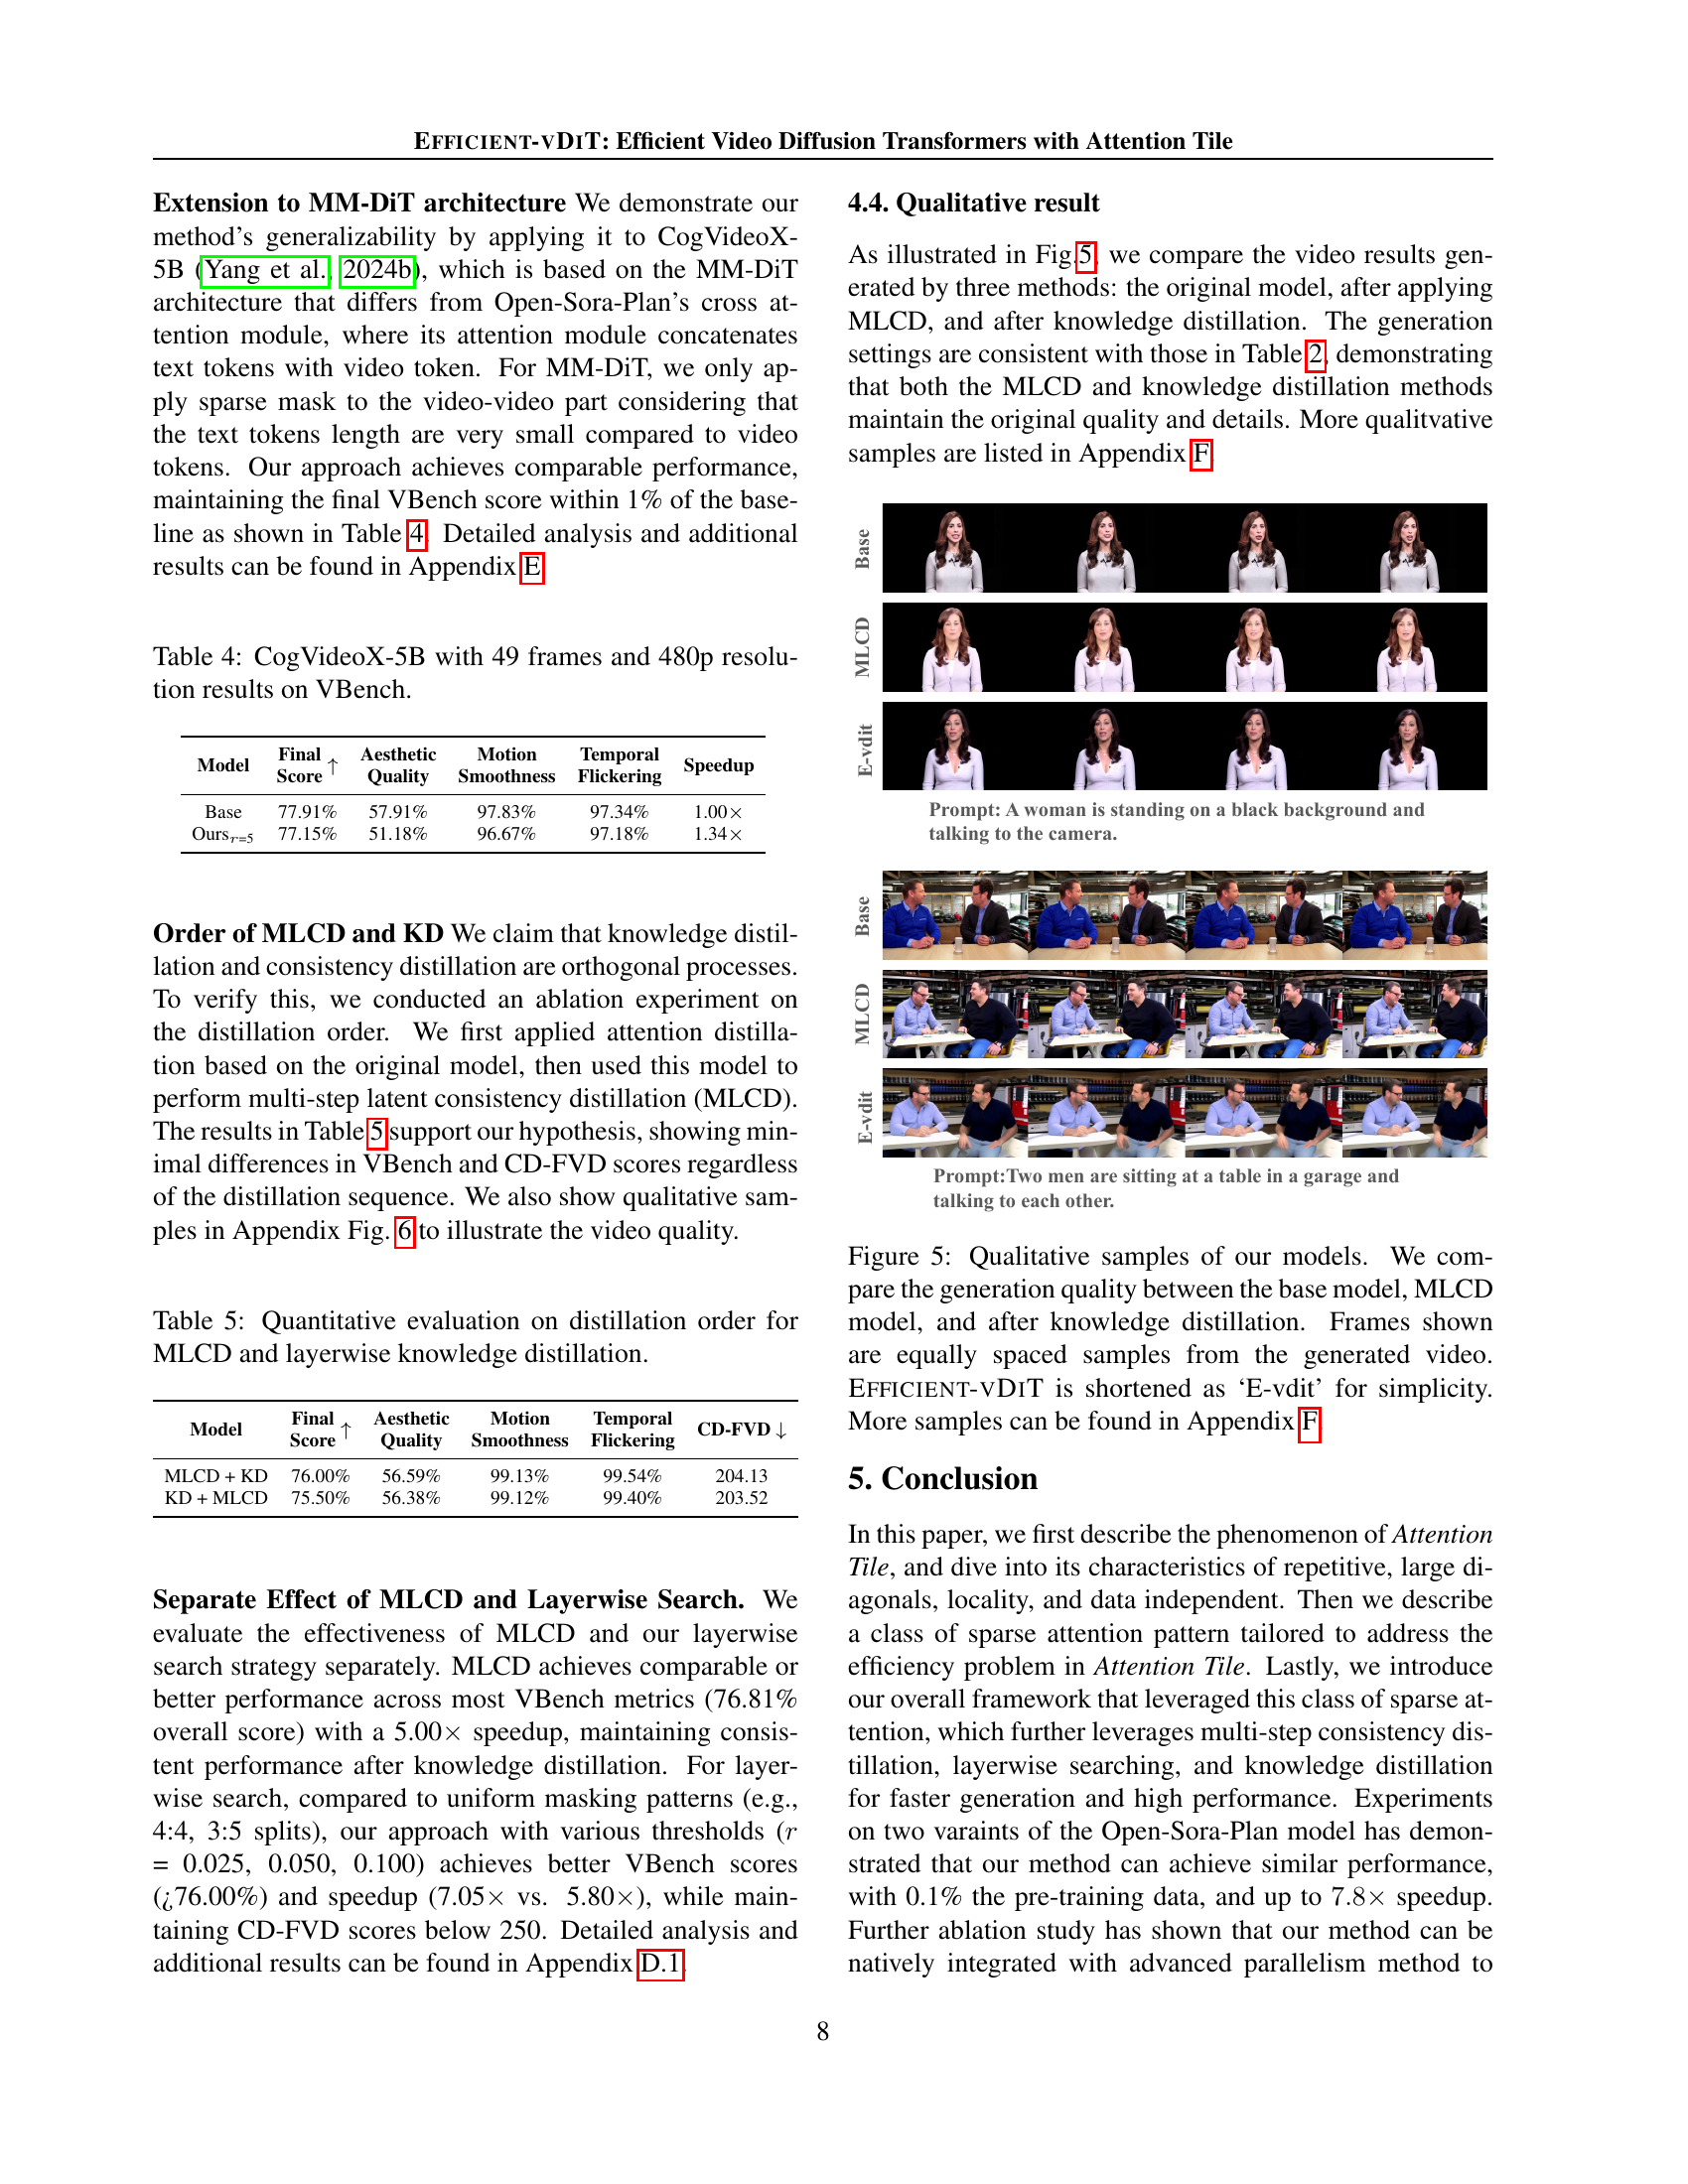
🔼 This figure displays a qualitative comparison of video generation results from three different models: the original, a model using multi-step consistency distillation (MLCD), and a model that incorporates both MLCD and knowledge distillation. The comparison showcases the visual quality of video samples generated by each model. Each row presents a video sample from the same prompt, where the columns represent the generated videos by the three models. This allows viewers to directly compare the visual fidelity, motion clarity, and overall quality achieved through the different model architectures. Additional examples are provided in Appendix F of the paper.
read the caption
Figure 5: Qualitative samples of our models. We compare the generation quality between the base model, MLCD model, and after knowledge distillation. Frames shown are equally spaced samples from the generated video. Efficient-vDiT is shortened as ‘E-vdit’ for simplicity. More samples can be found in Appendix F.

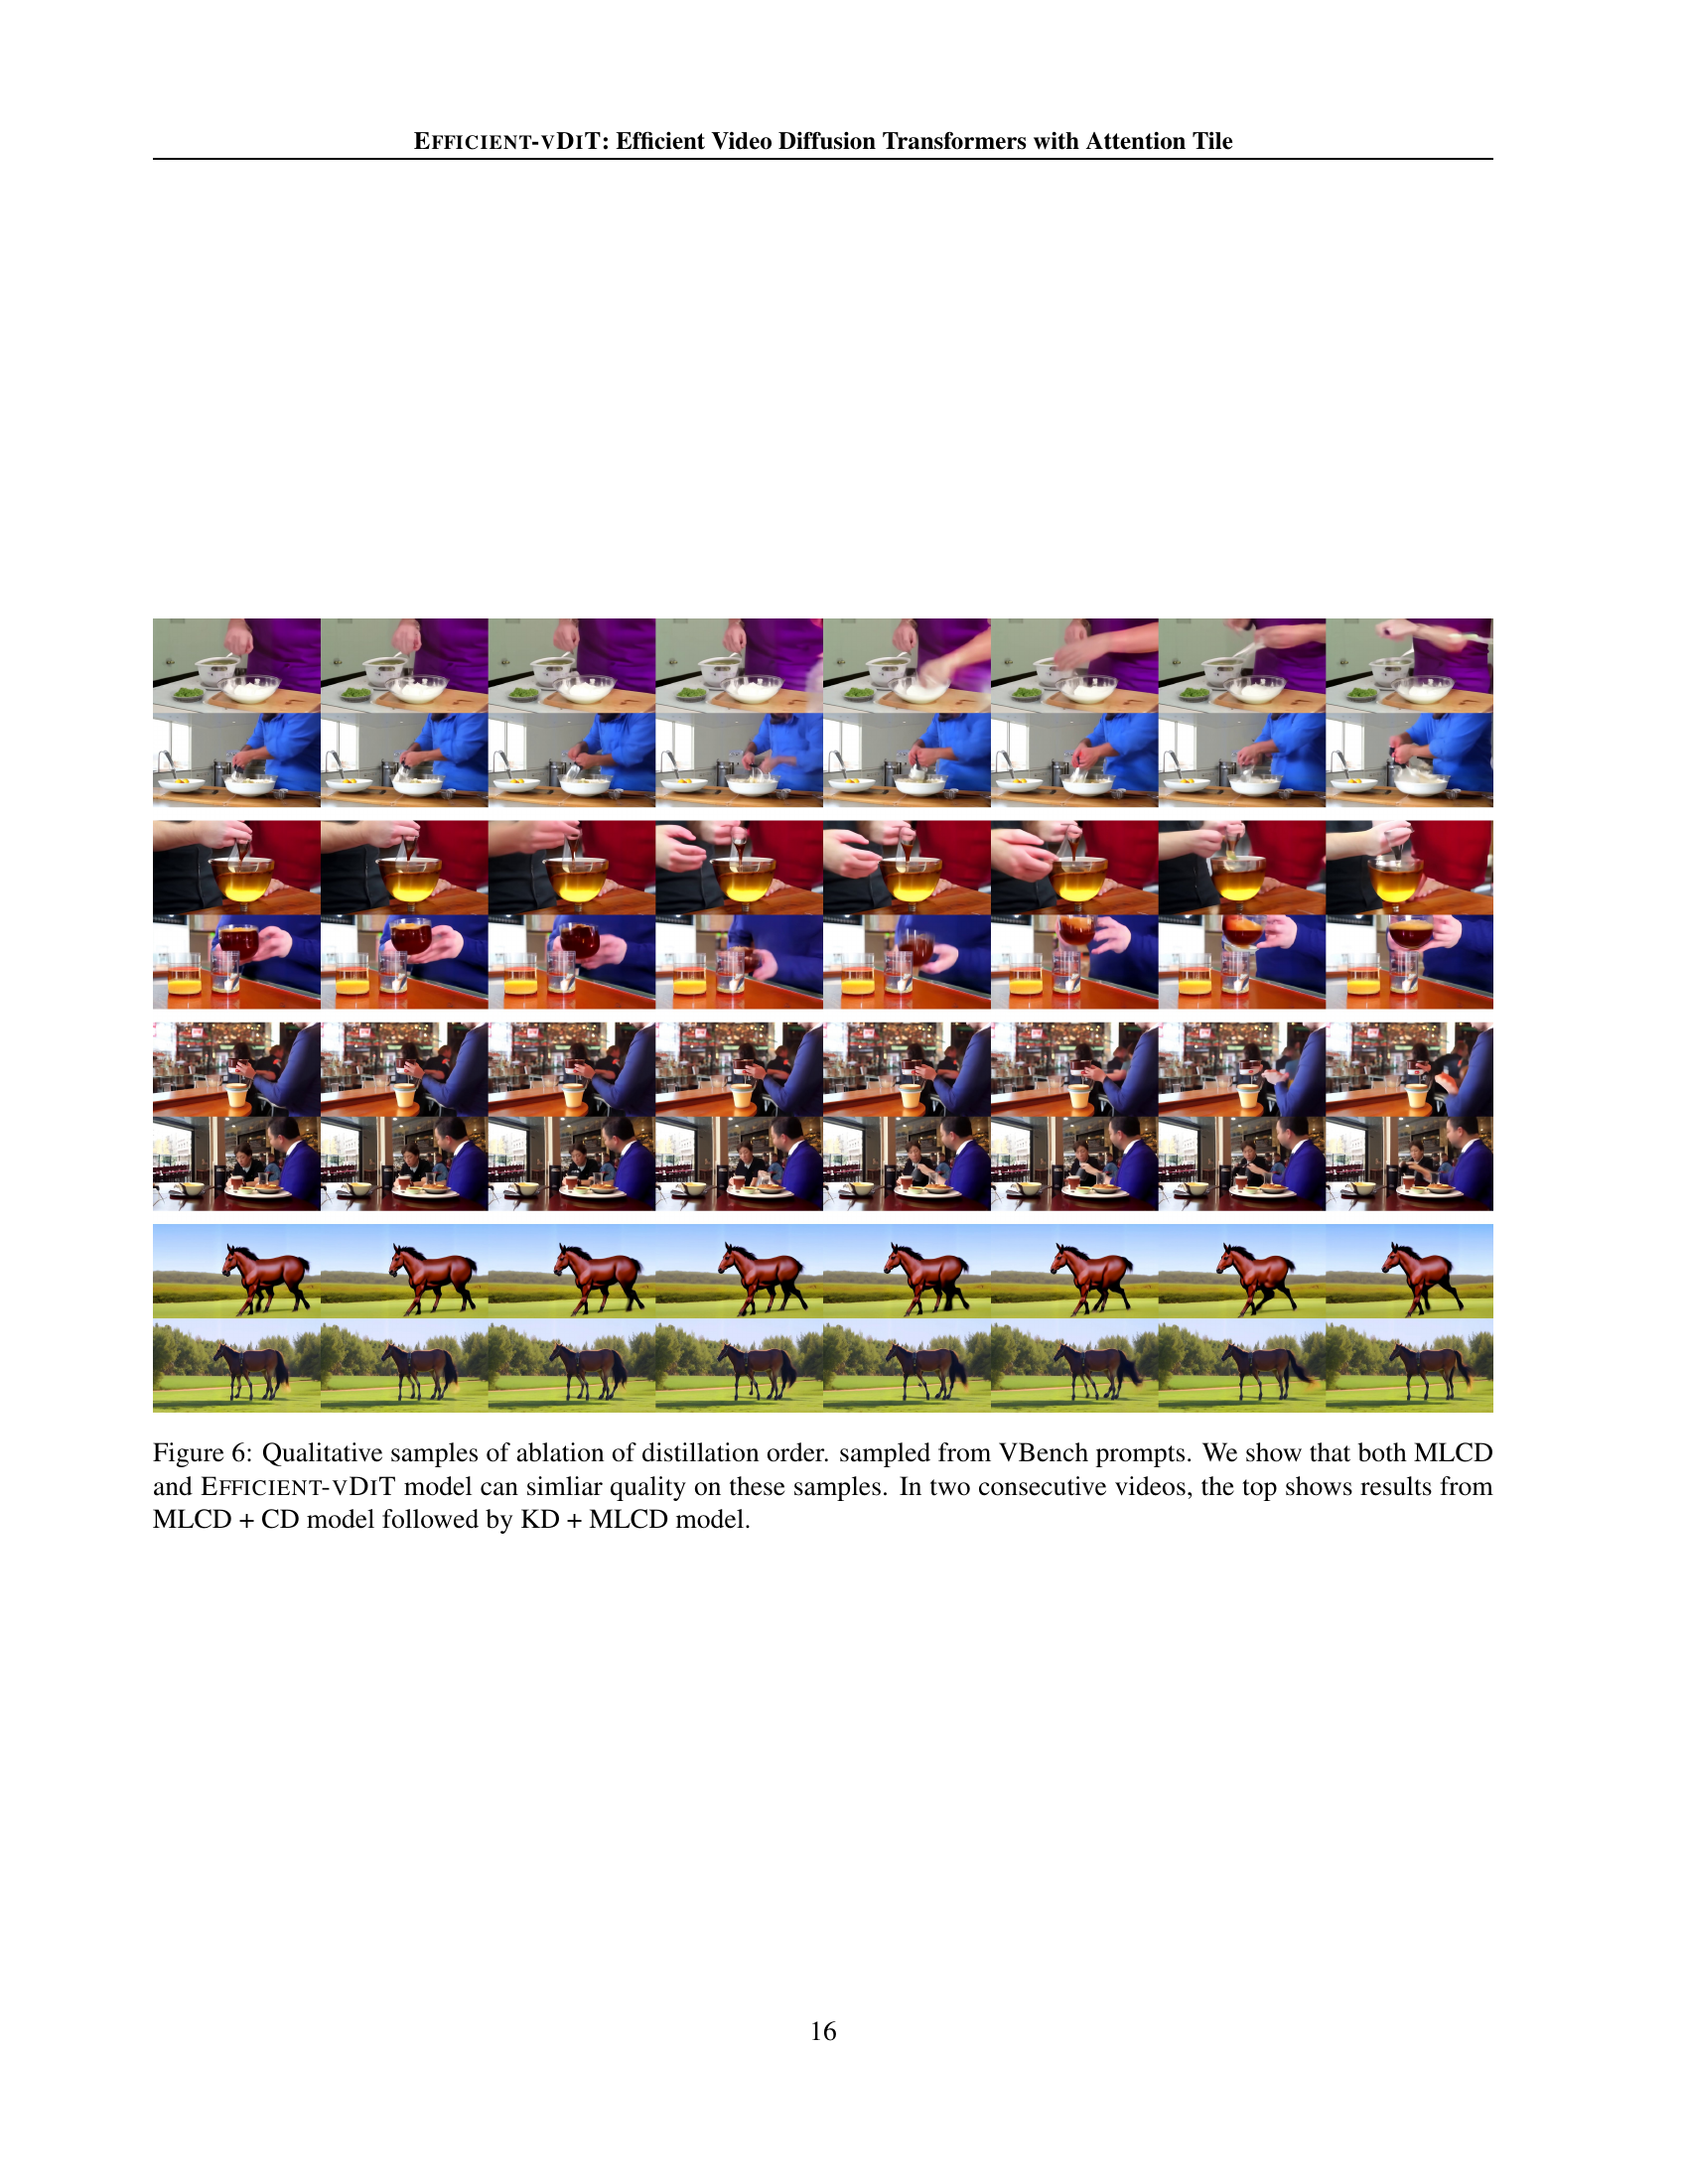
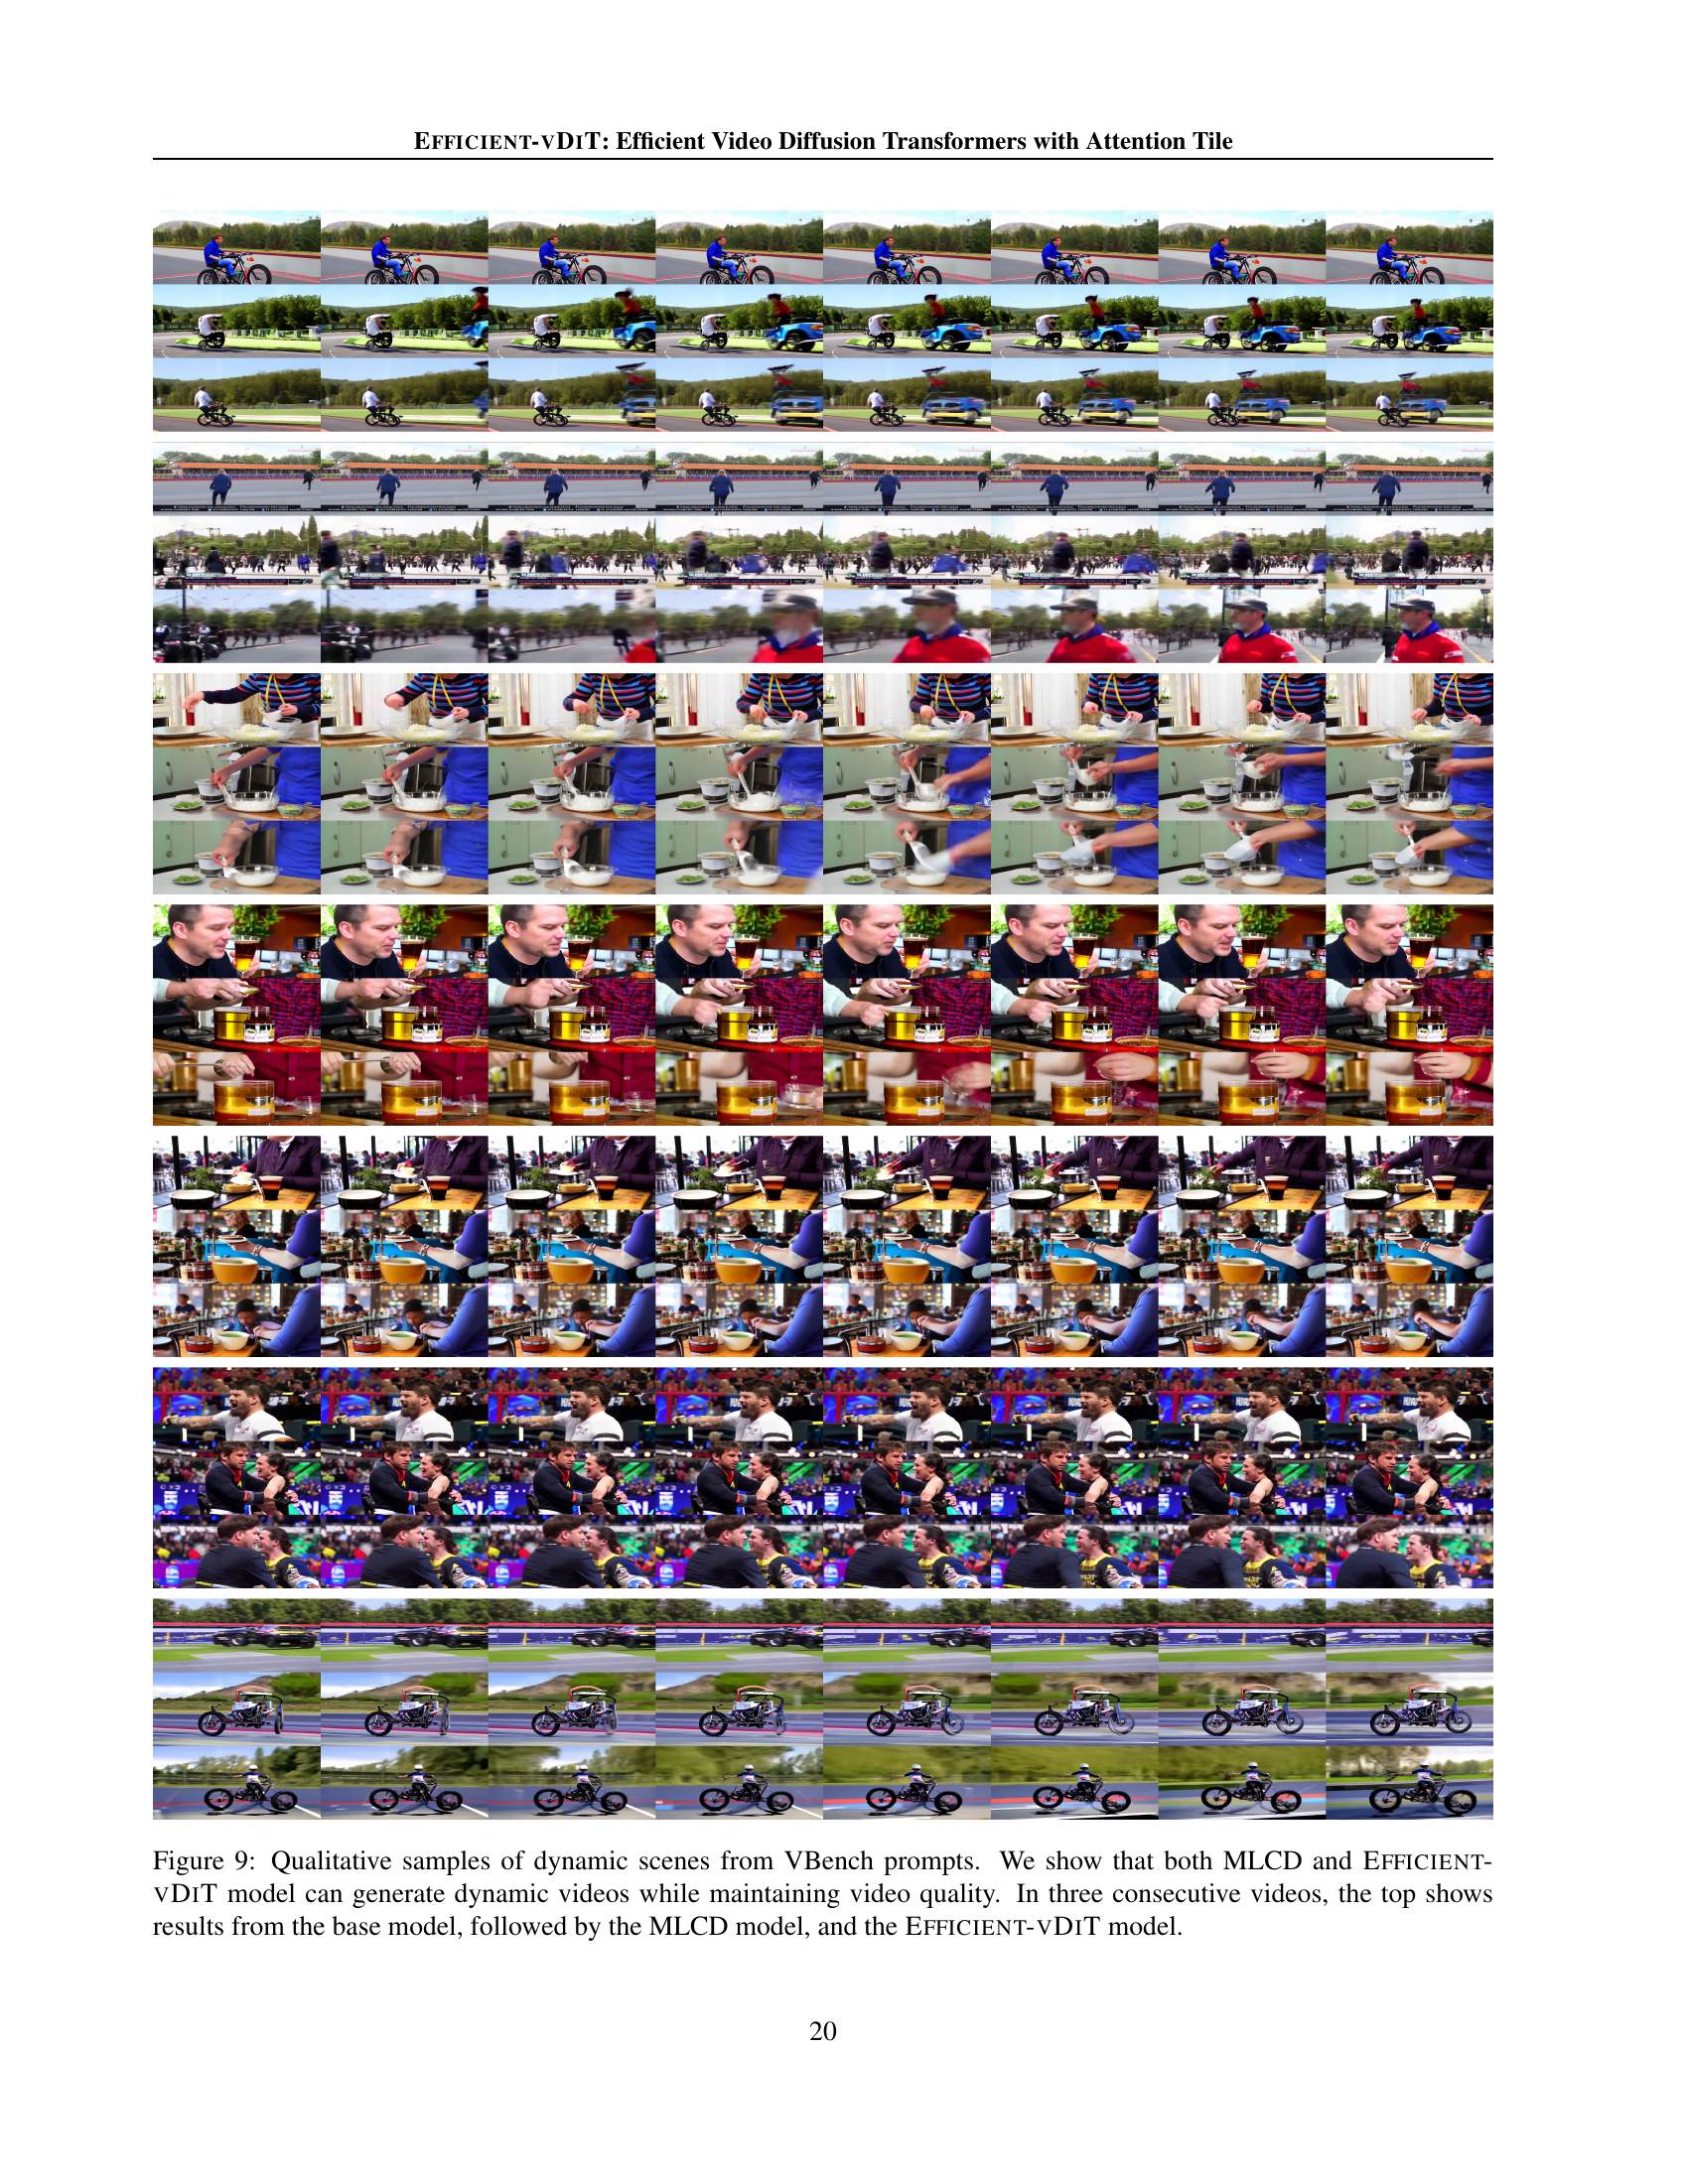
🔼 This figure displays a comparison of video generation results from different models to demonstrate the impact of distillation order on video quality. The top row of each pair of videos shows results from a model trained using multi-step consistency distillation (MLCD) followed by knowledge distillation (KD). The bottom row shows results from a model trained with the opposite order: KD followed by MLCD. The videos were generated using prompts from the VBench dataset, a standard benchmark for evaluating video generation models. The purpose is to visually show whether the order of applying these two techniques significantly affects the final video quality and to demonstrate that the order doesn’t matter much.
read the caption
Figure 6: Qualitative samples of ablation of distillation order. sampled from VBench prompts. We show that both MLCD and Efficient-vDiT model can simliar quality on these samples. In two consecutive videos, the top shows results from MLCD + CD model followed by KD + MLCD model.

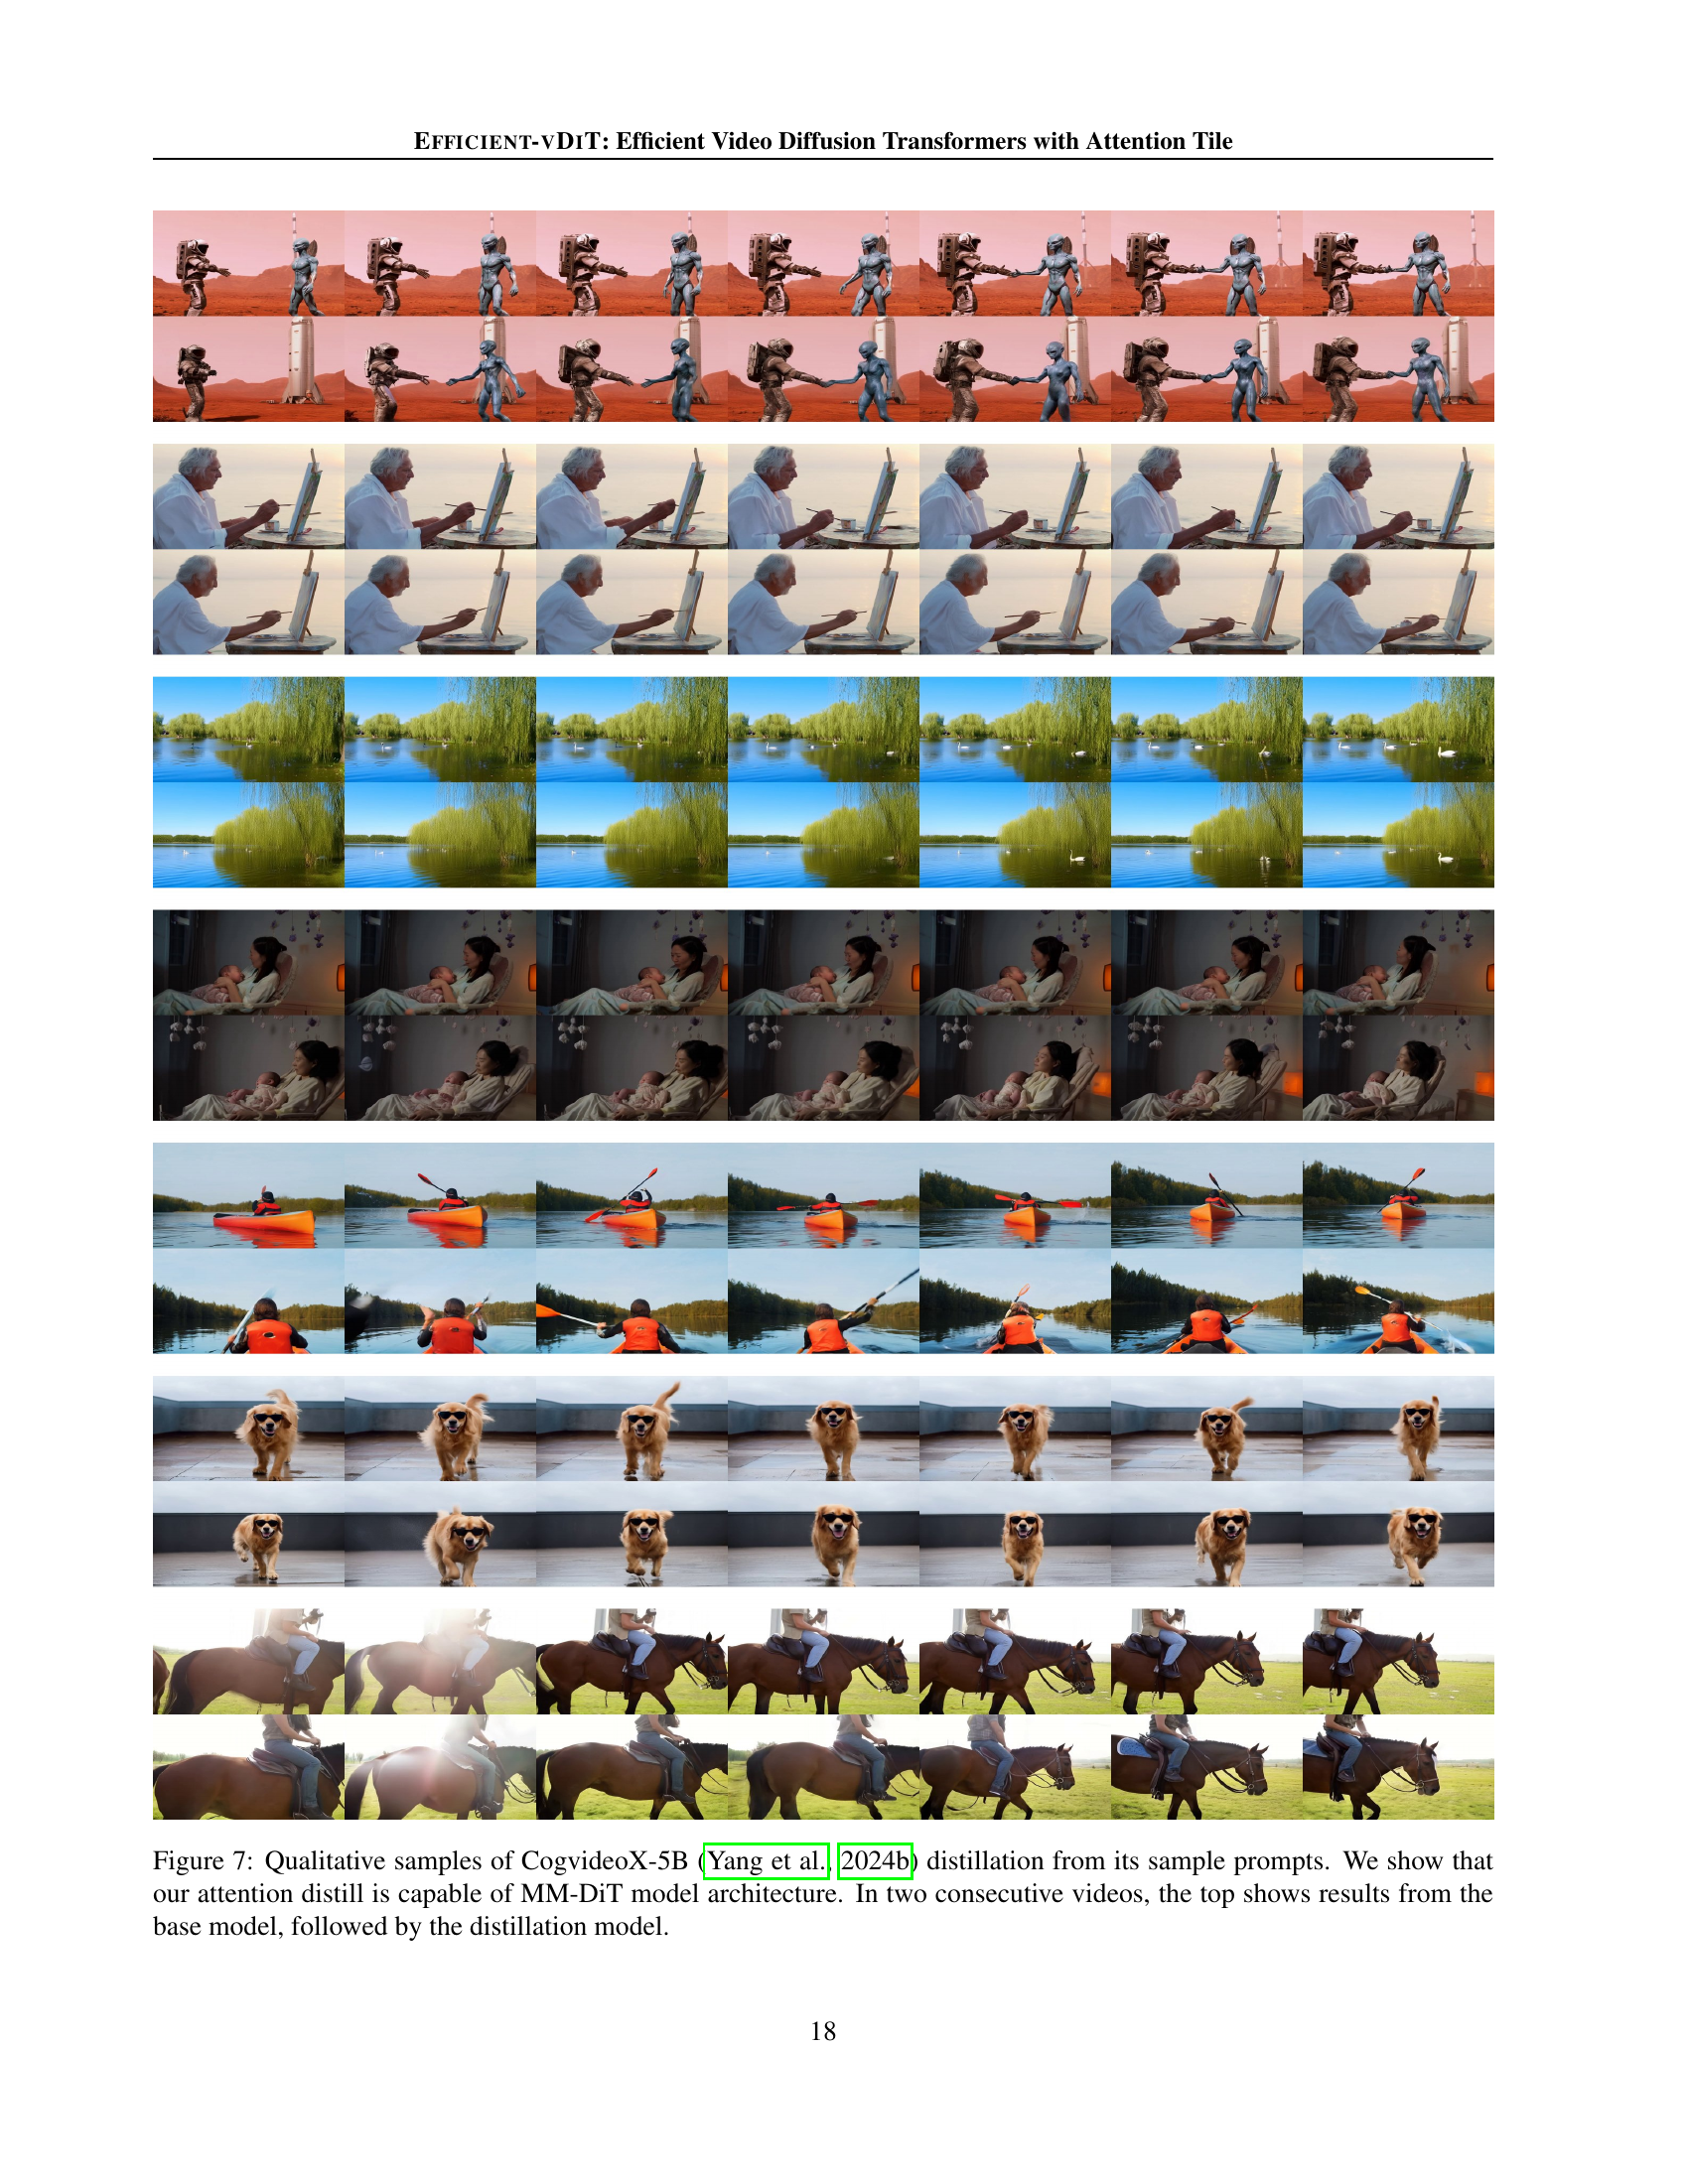
🔼 Figure 7 presents a qualitative comparison of video generation results from the base CogVideoX-5B model and a model that incorporates attention distillation. The figure demonstrates the effectiveness of the proposed attention distillation technique, showing that it can be successfully applied to the MM-DiT architecture of CogVideoX-5B. The comparison is shown in pairs of videos where the top row displays the results from the original, non-distilled model, and the bottom row shows results from the model trained with attention distillation. This visual comparison illustrates that the attention distillation method preserves the overall quality and details of the generated videos while potentially offering improved efficiency or faster generation.
read the caption
Figure 7: Qualitative samples of CogvideoX-5B (Yang et al., 2024b) distillation from its sample prompts. We show that our attention distill is capable of MM-DiT model architecture. In two consecutive videos, the top shows results from the base model, followed by the distillation model.

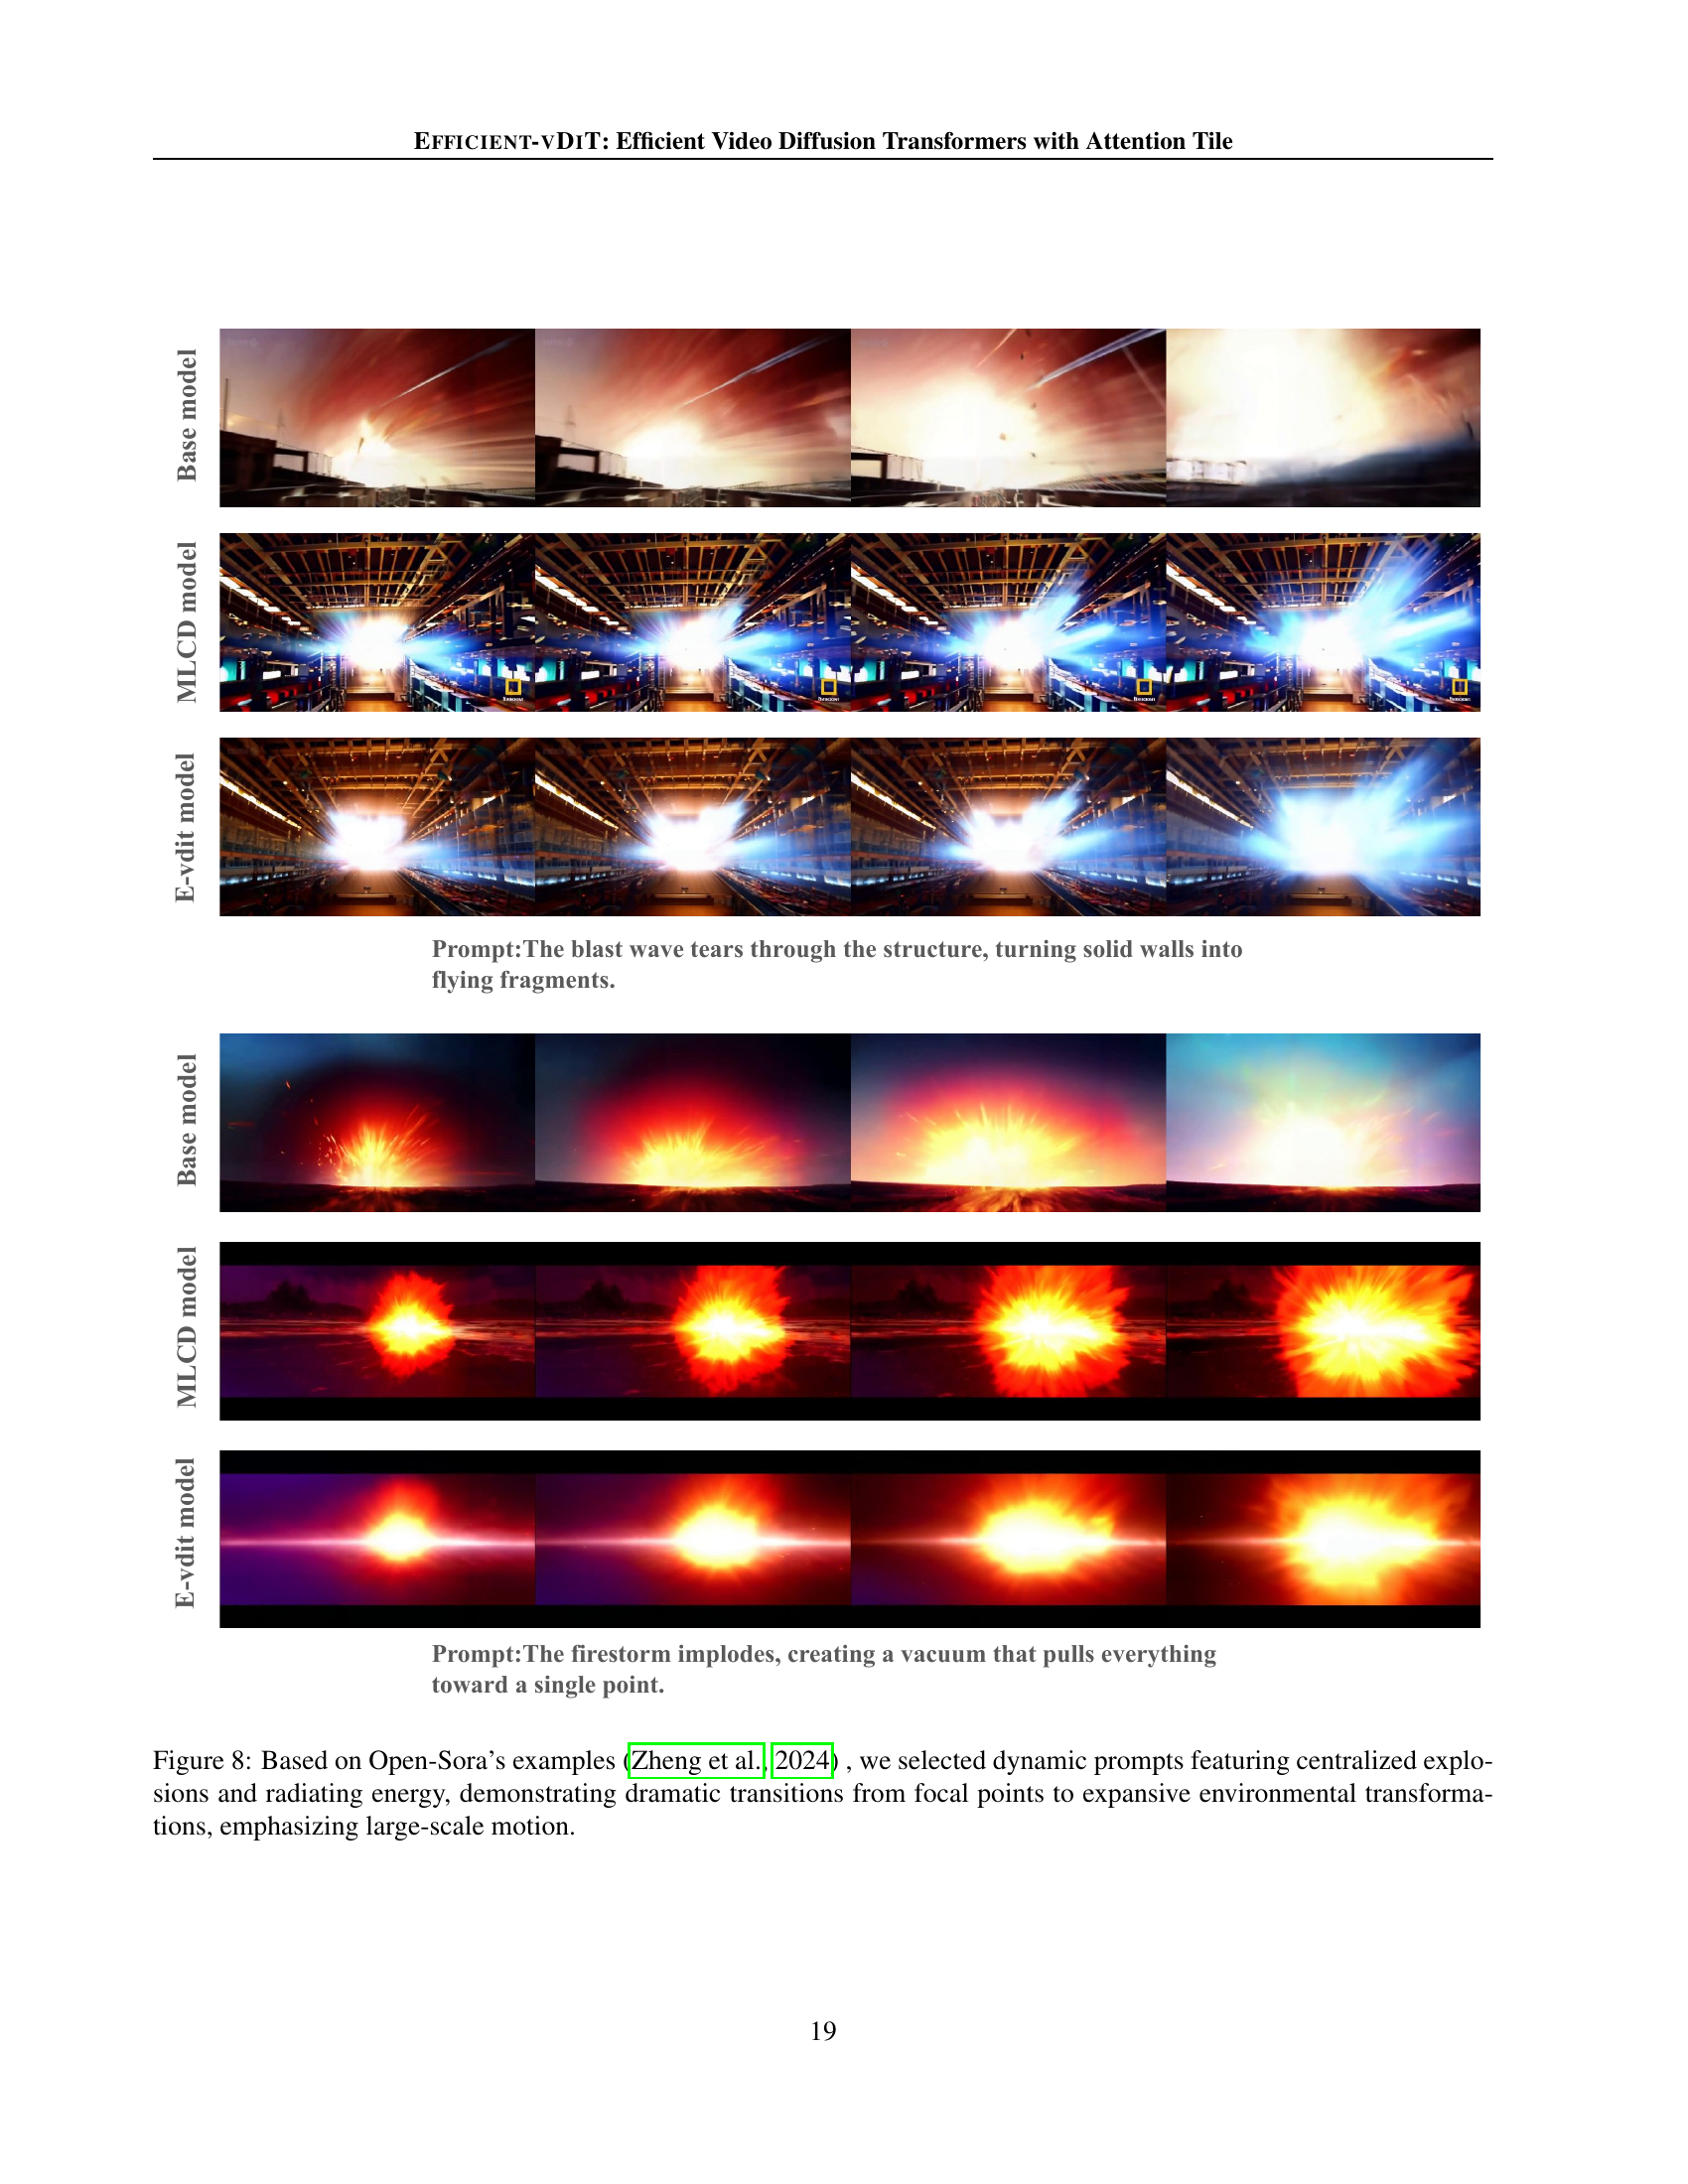
🔼 Figure 8 showcases video generation results from three models: the baseline model, a model using multi-step consistency distillation (MLCD), and the proposed EFFICIENT-VDIT model. The prompts used are dynamic and involve centralized explosions and radiating energy. The videos generated demonstrate the models’ ability to handle large-scale motion and dramatic transitions, transitioning from concentrated focal points to expansive environmental effects.
read the caption
Figure 8: Based on Open-Sora’s examples (Zheng et al., 2024) , we selected dynamic prompts featuring centralized explosions and radiating energy, demonstrating dramatic transitions from focal points to expansive environmental transformations, emphasizing large-scale motion.
More on tables
| Model | Final Score | Aesthetic Quality | Motion Smoothness | Temporal Flickering | Object Class | Subject Consistency | CD-FVD | Sparsity (%) | Kernel Time(ms) | Kernel Speedup | Speedup |
| Base | 76.12% | 58.34% | 99.43% | 99.28% | 64.72% | 98.45% | 172.64 | 0.00 | 58.36 | 1.00 | 1.00 |
| MLCD | 76.81% | 58.92% | 99.41% | 99.42% | 63.37% | 98.37% | 190.50 | 0.00 | 58.36 | 1.00 | 5.00 |
| 76.14% | 57.21% | 99.37% | 99.49% | 60.36% | 98.26% | 186.84 | 23.51 | 43.50 | 1.34 | 5.85 | |
| 76.01% | 57.57% | 99.15% | 99.56% | 58.70% | 97.58% | 195.55 | 37.78 | 35.58 | 1.64 | 6.60 | |
| 76.00% | 56.59% | 99.13% | 99.54% | 57.12% | 97.73% | 204.13 | 45.08 | 31.54 | 1.85 | 7.05 | |
| 75.02% | 55.71% | 99.03% | 99.50% | 55.22% | 97.28% | 223.75 | 51.55 | 27.91 | 2.09 | 7.50 | |
| 75.30% | 55.79% | 98.93% | 99.46% | 54.98% | 97.71% | 231.68 | 55.07 | 25.96 | 2.25 | 7.80 |
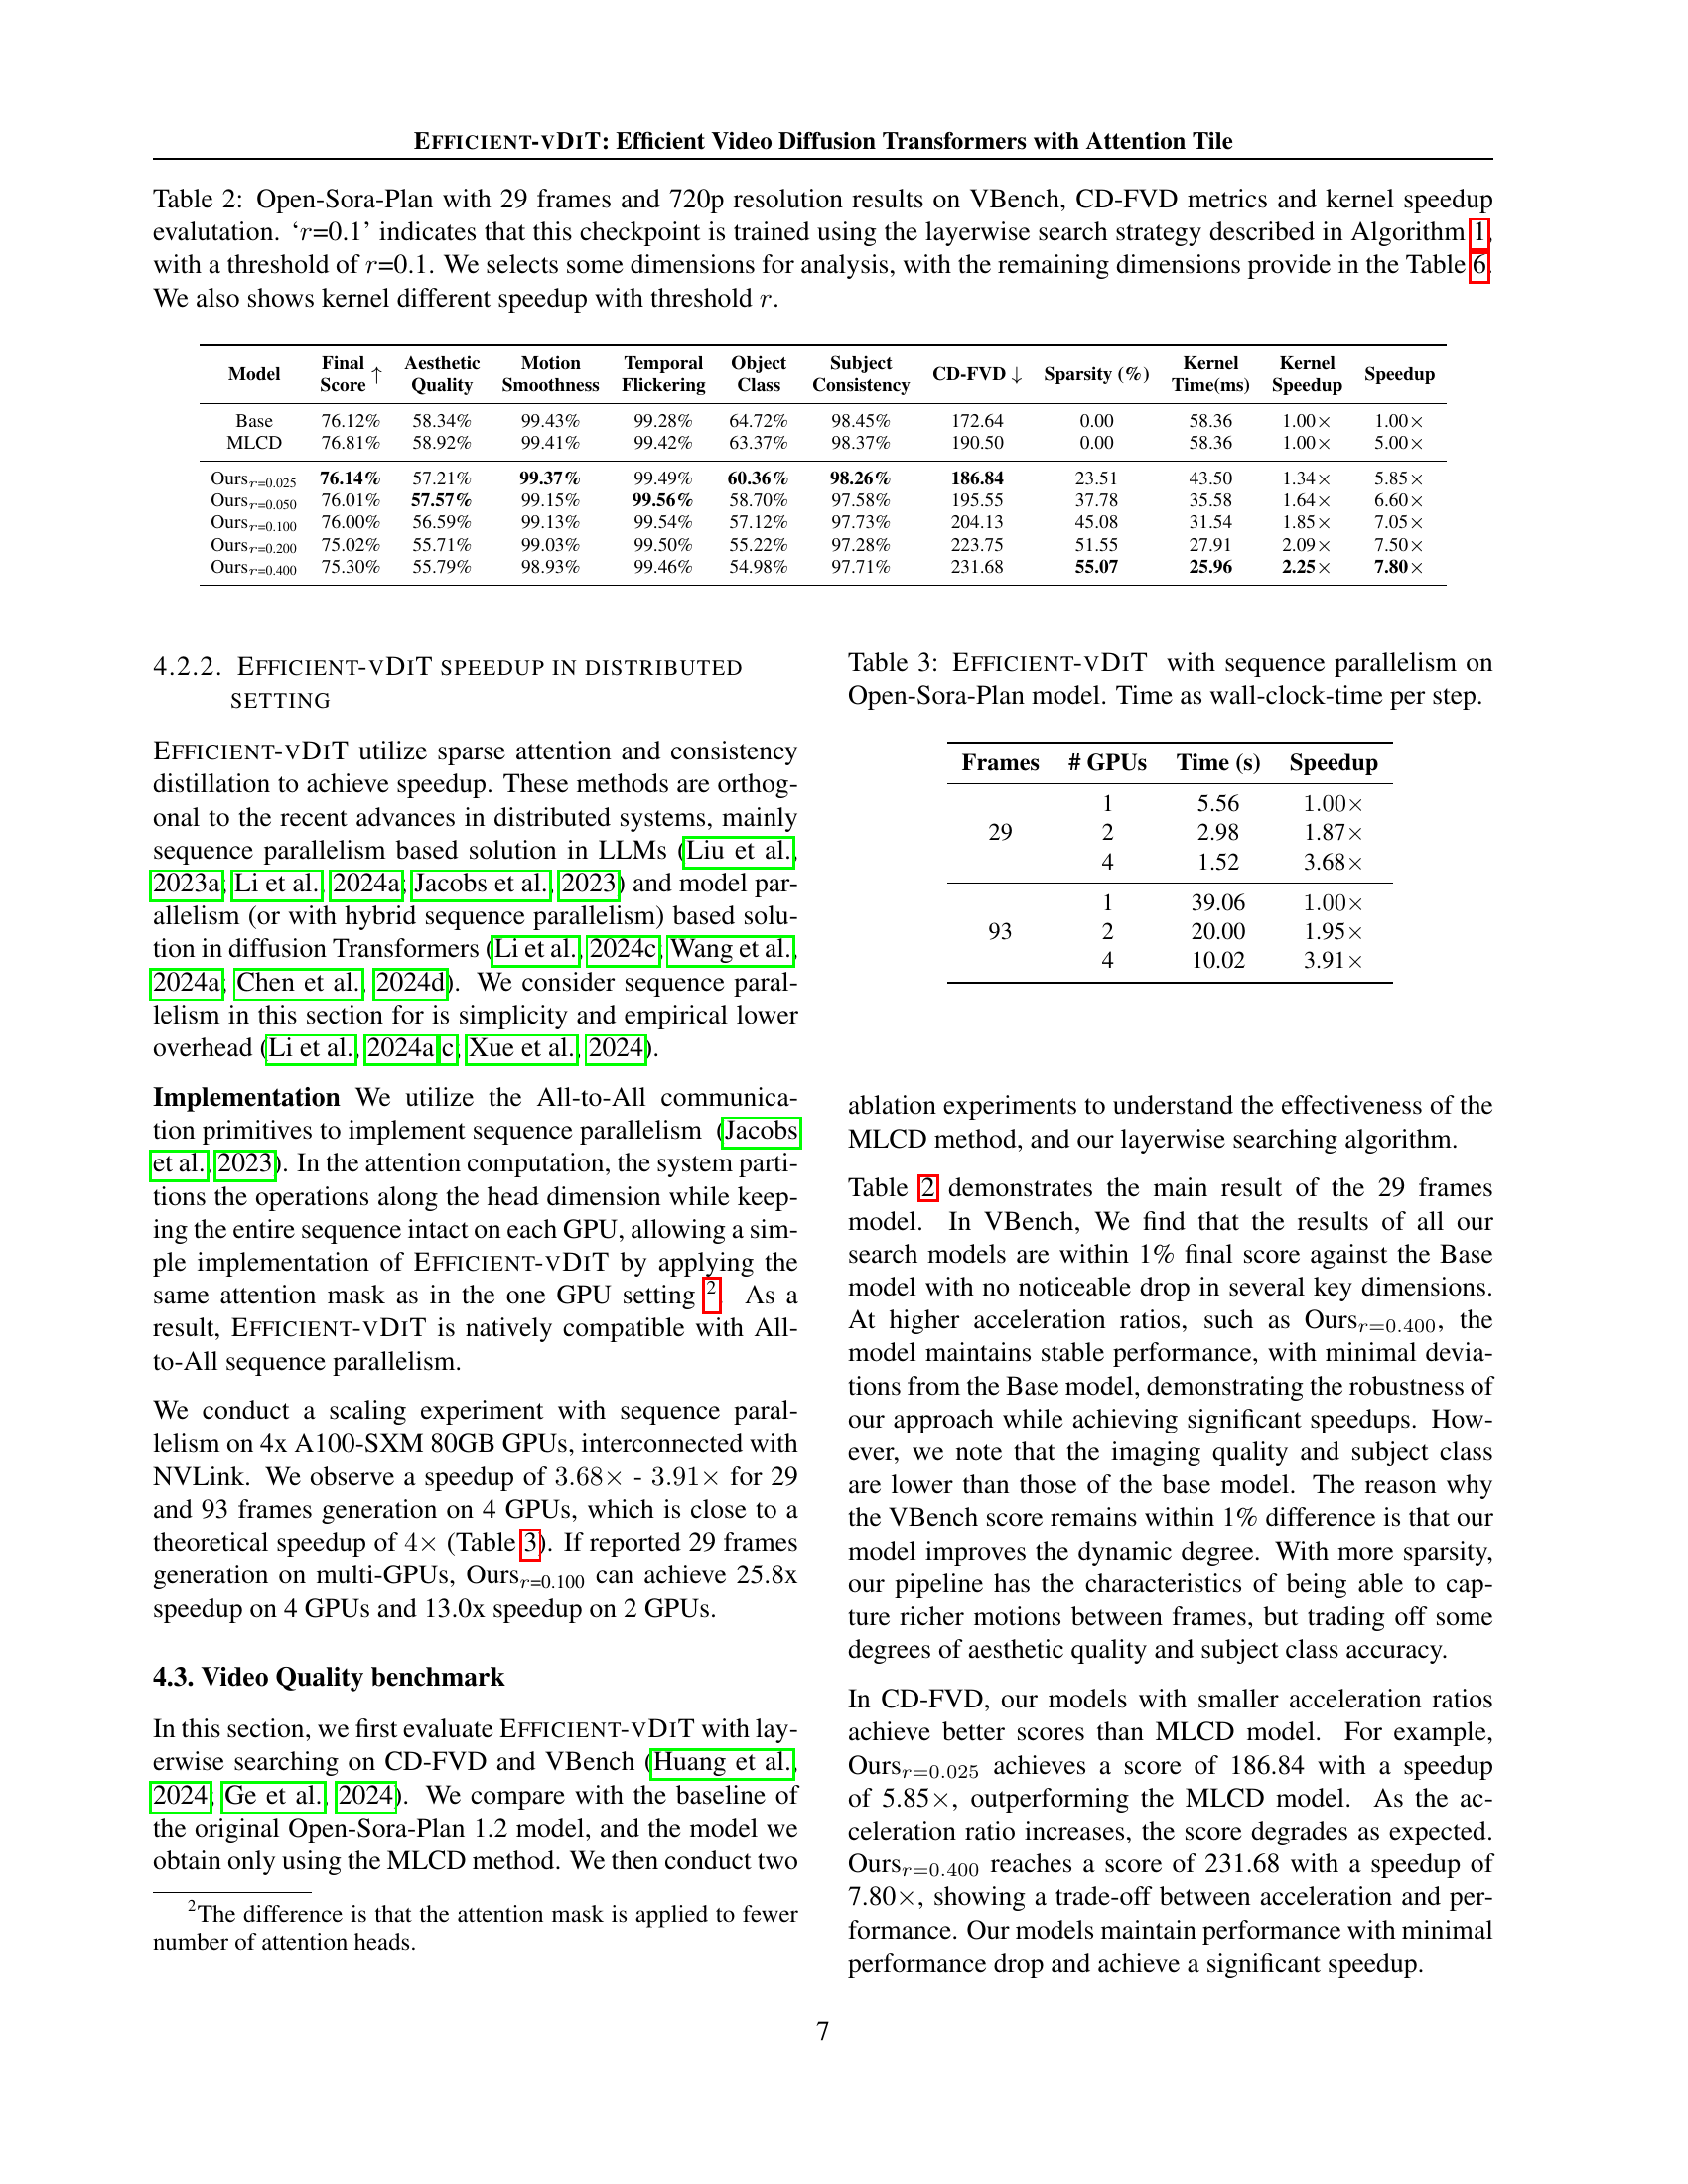
🔼 Table 2 presents a comprehensive evaluation of the Open-Sora-Plan model (29 frames, 720p resolution) using the VBench and CD-FVD metrics. It showcases the performance of different model variants, including the base model, a model trained with multi-step consistency distillation (MLCD), and several versions of the proposed EFFICIENT-VDIT model trained with varying sparsity levels (controlled by the threshold ‘r’). The table details key video quality aspects assessed by VBench (like aesthetic quality, motion smoothness, temporal consistency, etc.), along with CD-FVD scores, which measure the difference between generated and real video distributions. Crucially, it also provides kernel speedup factors for each model variant relative to the base model, illustrating the efficiency gains achieved through the MLCD method and different sparsity levels in the EFFICIENT-VDIT approach. While the table highlights selected VBench dimensions, Table 6 in the paper offers a complete breakdown of all dimensions.
read the caption
Table 2: Open-Sora-Plan with 29 frames and 720p resolution results on VBench, CD-FVD metrics and kernel speedup evalutation. ‘r𝑟ritalic_r=0.1’ indicates that this checkpoint is trained using the layerwise search strategy described in Algorithm 1, with a threshold of r𝑟ritalic_r=0.1. We selects some dimensions for analysis, with the remaining dimensions provide in the Table 6. We also shows kernel different speedup with threshold r𝑟ritalic_r.
| Frames | # GPUs | Time (s) | Speedup |
| 29 | 1 | 5.56 | |
| 2 | 2.98 | 1.87 | |
| 4 | 1.52 | 3.68 | |
| 93 | 1 | 39.06 | |
| 2 | 20.00 | 1.95 | |
| 4 | 10.02 | 3.91 |
🔼 This table presents the results of the EFFICIENT-VDIT model’s performance when employing sequence parallelism on the Open-Sora-Plan model. It displays the wall-clock time taken per step for video generation with varying numbers of GPUs. This allows assessing the model’s scalability and efficiency gains achieved through parallel processing.
read the caption
Table 3: Efficient-vDiT with sequence parallelism on Open-Sora-Plan model. Time as wall-clock-time per step.
| Model | Final Score | Aesthetic Quality | Motion Smoothness | Temporal Flickering | Speedup |
| Base | 77.91% | 57.91% | 97.83% | 97.34% | 1.00 |
| 77.15% | 51.18% | 96.67% | 97.18% | 1.34 |
🔼 This table presents the results of evaluating the CogVideoX-5B model on the VBench benchmark. CogVideoX-5B is a large video generation model based on the MM-DiT architecture. The evaluation used videos with 49 frames and a resolution of 480p. The VBench metrics assess various aspects of video generation quality including final score, aesthetic quality, motion smoothness, temporal consistency, and object class consistency, among others. The table likely shows the performance of the CogVideoX-5B model after applying the proposed sparse attention and distillation techniques, compared to the original model.
read the caption
Table 4: CogVideoX-5B with 49 frames and 480p resolution results on VBench.
| Model | Final Score | Aesthetic Quality | Motion Smoothness | Temporal Flickering | CD-FVD |
| MLCD + KD | 76.00% | 56.59% | 99.13% | 99.54% | 204.13 |
| KD + MLCD | 75.50% | 56.38% | 99.12% | 99.40% | 203.52 |
🔼 This table presents a quantitative comparison of the performance of two different approaches for training a video diffusion model: applying Multi-step Consistency Distillation (MLCD) before layerwise knowledge distillation (KD) versus applying KD before MLCD. The comparison uses metrics such as final score, aesthetic quality, motion smoothness, temporal flickering, object class consistency, subject consistency, image quality, and CD-FVD (Content-Debiased Fréchet Video Distance). This allows for assessing the impact of the order of these training stages on the overall video generation quality.
read the caption
Table 5: Quantitative evaluation on distillation order for MLCD and layerwise knowledge distillation.
| Model | Multiple Objects | Human Action | Color | Dynamic Degree | Spatial Relationship | Scene | Appearance Style | Temporal Style | Overall Consistency | Background Consistency | Imaging Quality |
| Base | 23.25% | 54.00% | 94.47% | 34.72% | 43.49% | 18.60% | 19.88% | 18.45% | 19.69% | 97.64% | 64.75% |
| MLCD | 19.21% | 56.00% | 94.12% | 41.67% | 40.57% | 22.67% | 20.46% | 18.21% | 19.77% | 97.98% | 65.55% |
| 18.83% | 55.00% | 96.25% | 52.78% | 46.02% | 12.35% | 20.31% | 18.17% | 19.11% | 97.70% | 58.90% | |
| 11.74% | 58.00% | 92.11% | 58.33% | 39.81% | 22.31% | 20.25% | 17.71% | 19.45% | 97.71% | 56.86% | |
| 18.98% | 56.00% | 93.65% | 63.89% | 43.88% | 15.77% | 20.20% | 17.98% | 19.29% | 97.55% | 54.88% | |
| 17.99% | 53.00% | 51.82% | 59.72% | 36.14% | 13.88% | 20.29% | 17.97% | 18.97% | 97.62% | 54.07% | |
| 15.32% | 54.00% | 92.64% | 65.28% | 37.05% | 12.06% | 20.24% | 18.19% | 19.22% | 97.66% | 54.36% |
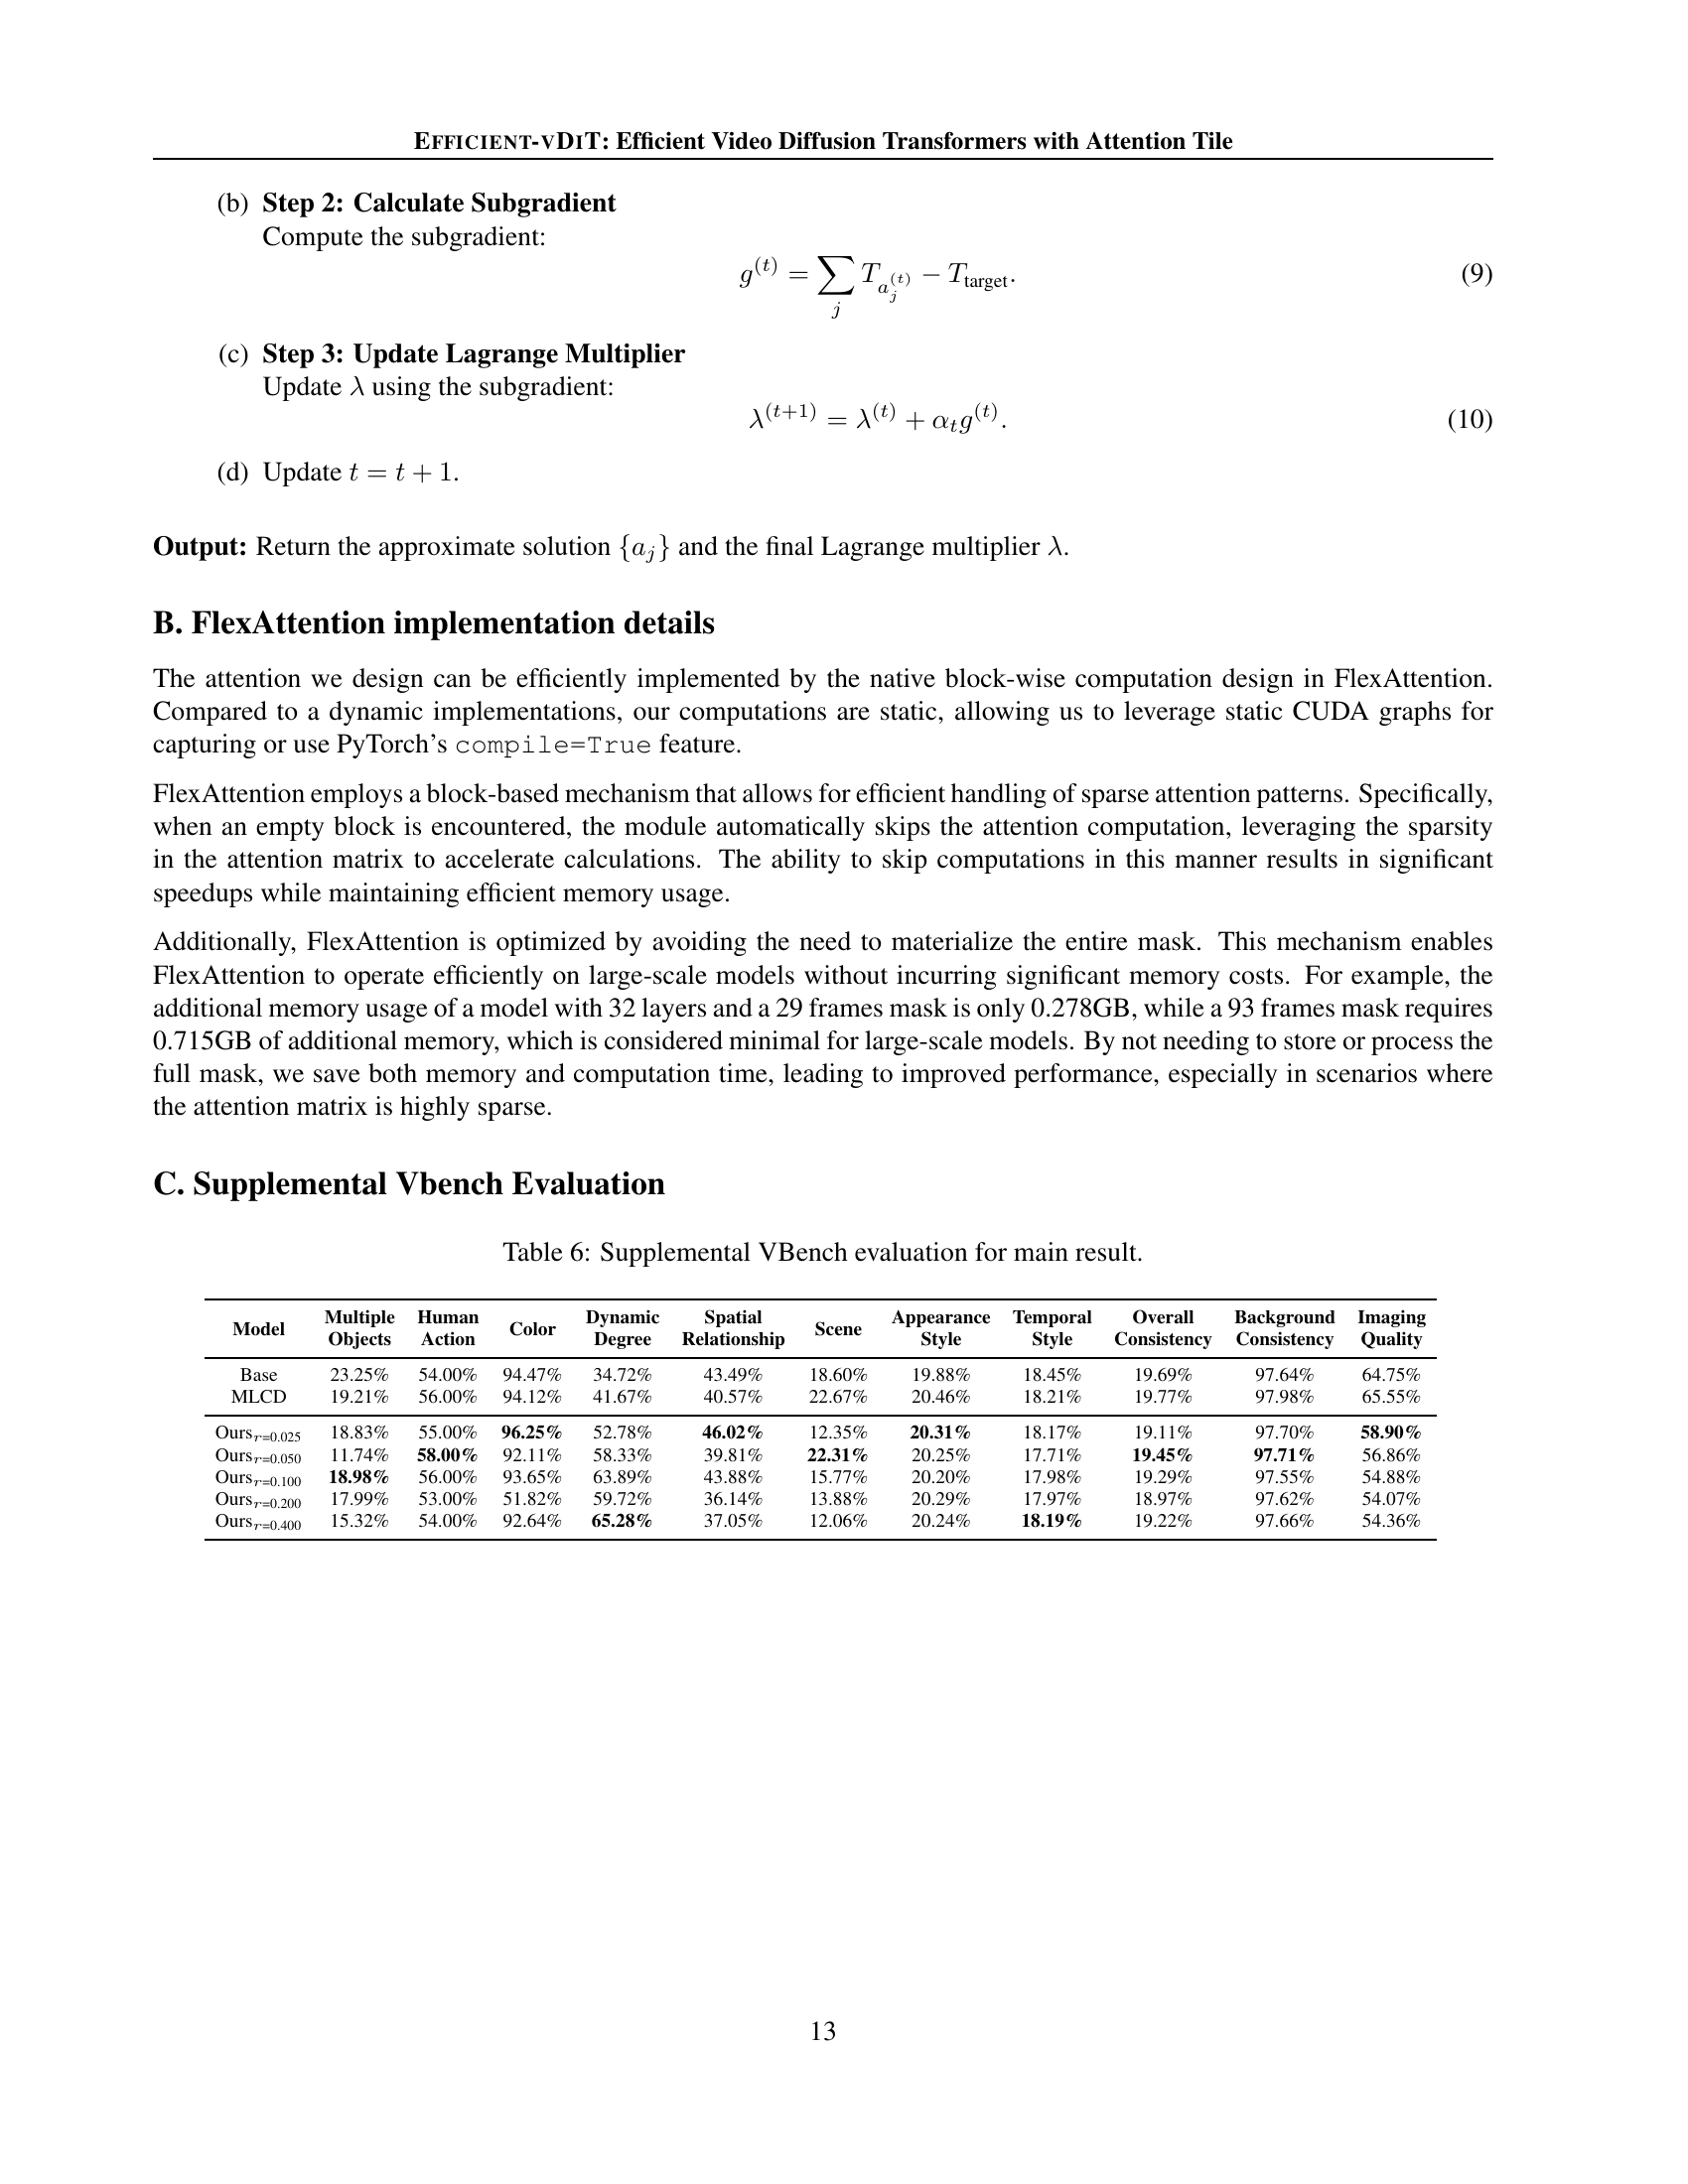
🔼 Table 6 provides a detailed breakdown of the VBench scores for various video generation models, including the baseline model and different variants of the EFFICIENT-VDIT model with varying sparsity levels. It shows a quantitative comparison across multiple aspects of video quality, such as the presence of multiple objects, human actions, color accuracy, dynamic degree, spatial relationships, scene style, appearance style, temporal consistency, overall image quality, background consistency, and overall quality score. This allows for a comprehensive assessment of the impact of different model modifications on the different facets of video quality.
read the caption
Table 6: Supplemental VBench evaluation for main result.
| Model | Final Score | Aesthetic Quality | Motion Smoothness | Temporal Flickering | Object Class | Subject Consistency | Imaging Quality | CD-FVD | Speedup |
| Base | 76.12% | 58.34% | 99.43% | 99.28% | 64.72% | 98.45% | 64.75% | 172.64 | 1.00 |
| 76.57% | 58.64% | 99.38% | 99.20% | 66.38% | 98.26% | 63.56% | 171.62 | 1.16 | |
| 75.53% | 55.47% | 99.01% | 98.96% | 62.26% | 97.42% | 59.67% | 197.35 | 1.26 | |
| 76.33% | 57.14% | 99.06% | 99.02% | 56.17% | 97.58% | 61.10% | 201.61 | 1.45 | |
| 77.15% | 57.53% | 98.67% | 98.66% | 60.68% | 96.96% | 61.91% | 322.28 | 1.77 | |
| MLCD | 76.81% | 58.92% | 99.41% | 99.42% | 63.37% | 98.37% | 65.55% | 190.50 | 5.00 |
| 75.90% | 57.84% | 99.38% | 99.50% | 63.03% | 98.21% | 58.47% | 175.47 | 5.80 | |
| 75.41% | 57.19% | 99.36% | 99.50% | 57.04% | 98.12% | 58.84% | 190.92 | 6.30 | |
| 75.23% | 57.45% | 99.29% | 99.48% | 54.59% | 98.37% | 57.35% | 213.72 | 7.25 | |
| 75.84% | 56.83% | 98.99% | 99.23% | 52.77% | 97.54% | 56.42% | 294.09 | 8.85 |
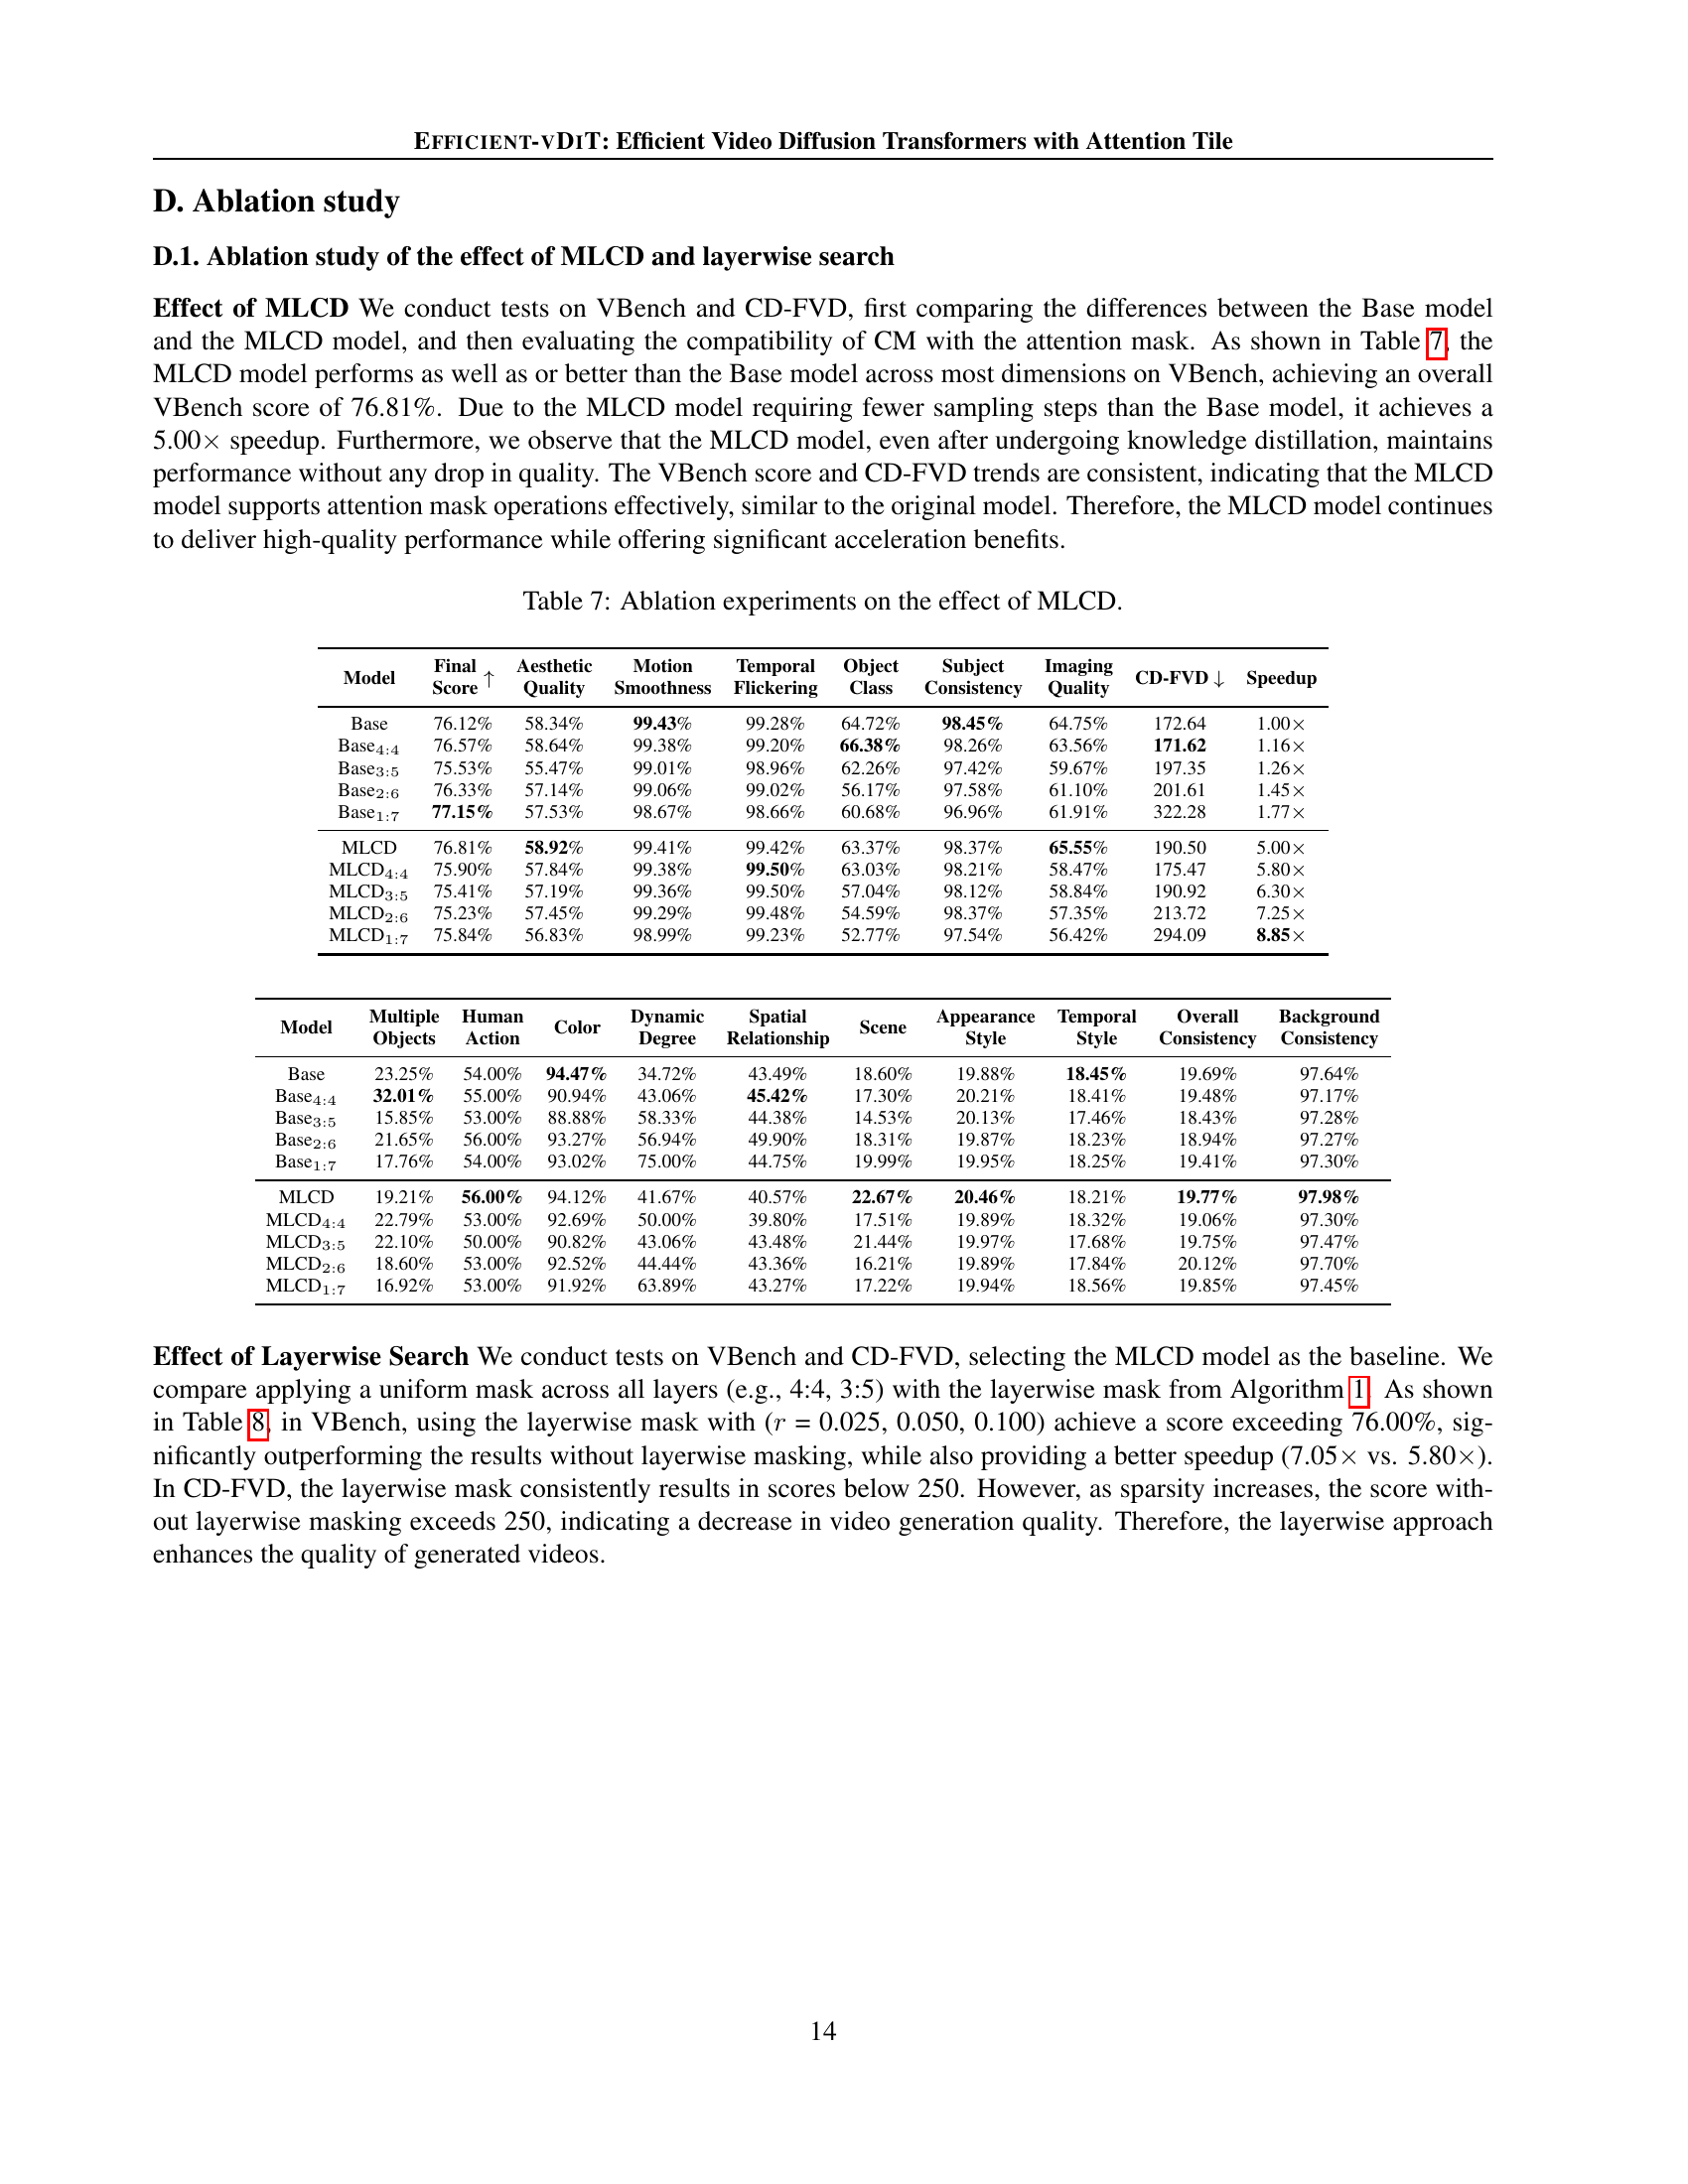
🔼 This table presents an ablation study on the impact of multi-step consistency distillation (MLCD) on video generation quality and efficiency. It compares the performance of the baseline model (Base) with the MLCD model and different sparsity levels (4:4, 3:5, 2:6, 1:7) applied to both the baseline and MLCD models. The metrics used for comparison include various aspects of video generation quality assessed by VBench (Final Score, Aesthetic Quality, Motion Smoothness, Temporal Flickering, Object Class Consistency, Subject Consistency, and Imaging Quality), as well as CD-FVD, which measures the distance between generated and real video distributions. The table also reports the kernel time and speedup achieved by each model. This ablation study isolates the effect of MLCD and its interaction with sparsity to better understand how MLCD contributes to both speed and quality improvements.
read the caption
Table 7: Ablation experiments on the effect of MLCD.
| Model | Multiple Objects | Human Action | Color | Dynamic Degree | Spatial Relationship | Scene | Appearance Style | Temporal Style | Overall Consistency | Background Consistency |
| Base | 23.25% | 54.00% | 94.47% | 34.72% | 43.49% | 18.60% | 19.88% | 18.45% | 19.69% | 97.64% |
| 32.01% | 55.00% | 90.94% | 43.06% | 45.42% | 17.30% | 20.21% | 18.41% | 19.48% | 97.17% | |
| 15.85% | 53.00% | 88.88% | 58.33% | 44.38% | 14.53% | 20.13% | 17.46% | 18.43% | 97.28% | |
| 21.65% | 56.00% | 93.27% | 56.94% | 49.90% | 18.31% | 19.87% | 18.23% | 18.94% | 97.27% | |
| 17.76% | 54.00% | 93.02% | 75.00% | 44.75% | 19.99% | 19.95% | 18.25% | 19.41% | 97.30% | |
| MLCD | 19.21% | 56.00% | 94.12% | 41.67% | 40.57% | 22.67% | 20.46% | 18.21% | 19.77% | 97.98% |
| 22.79% | 53.00% | 92.69% | 50.00% | 39.80% | 17.51% | 19.89% | 18.32% | 19.06% | 97.30% | |
| 22.10% | 50.00% | 90.82% | 43.06% | 43.48% | 21.44% | 19.97% | 17.68% | 19.75% | 97.47% | |
| 18.60% | 53.00% | 92.52% | 44.44% | 43.36% | 16.21% | 19.89% | 17.84% | 20.12% | 97.70% | |
| 16.92% | 53.00% | 91.92% | 63.89% | 43.27% | 17.22% | 19.94% | 18.56% | 19.85% | 97.45% |
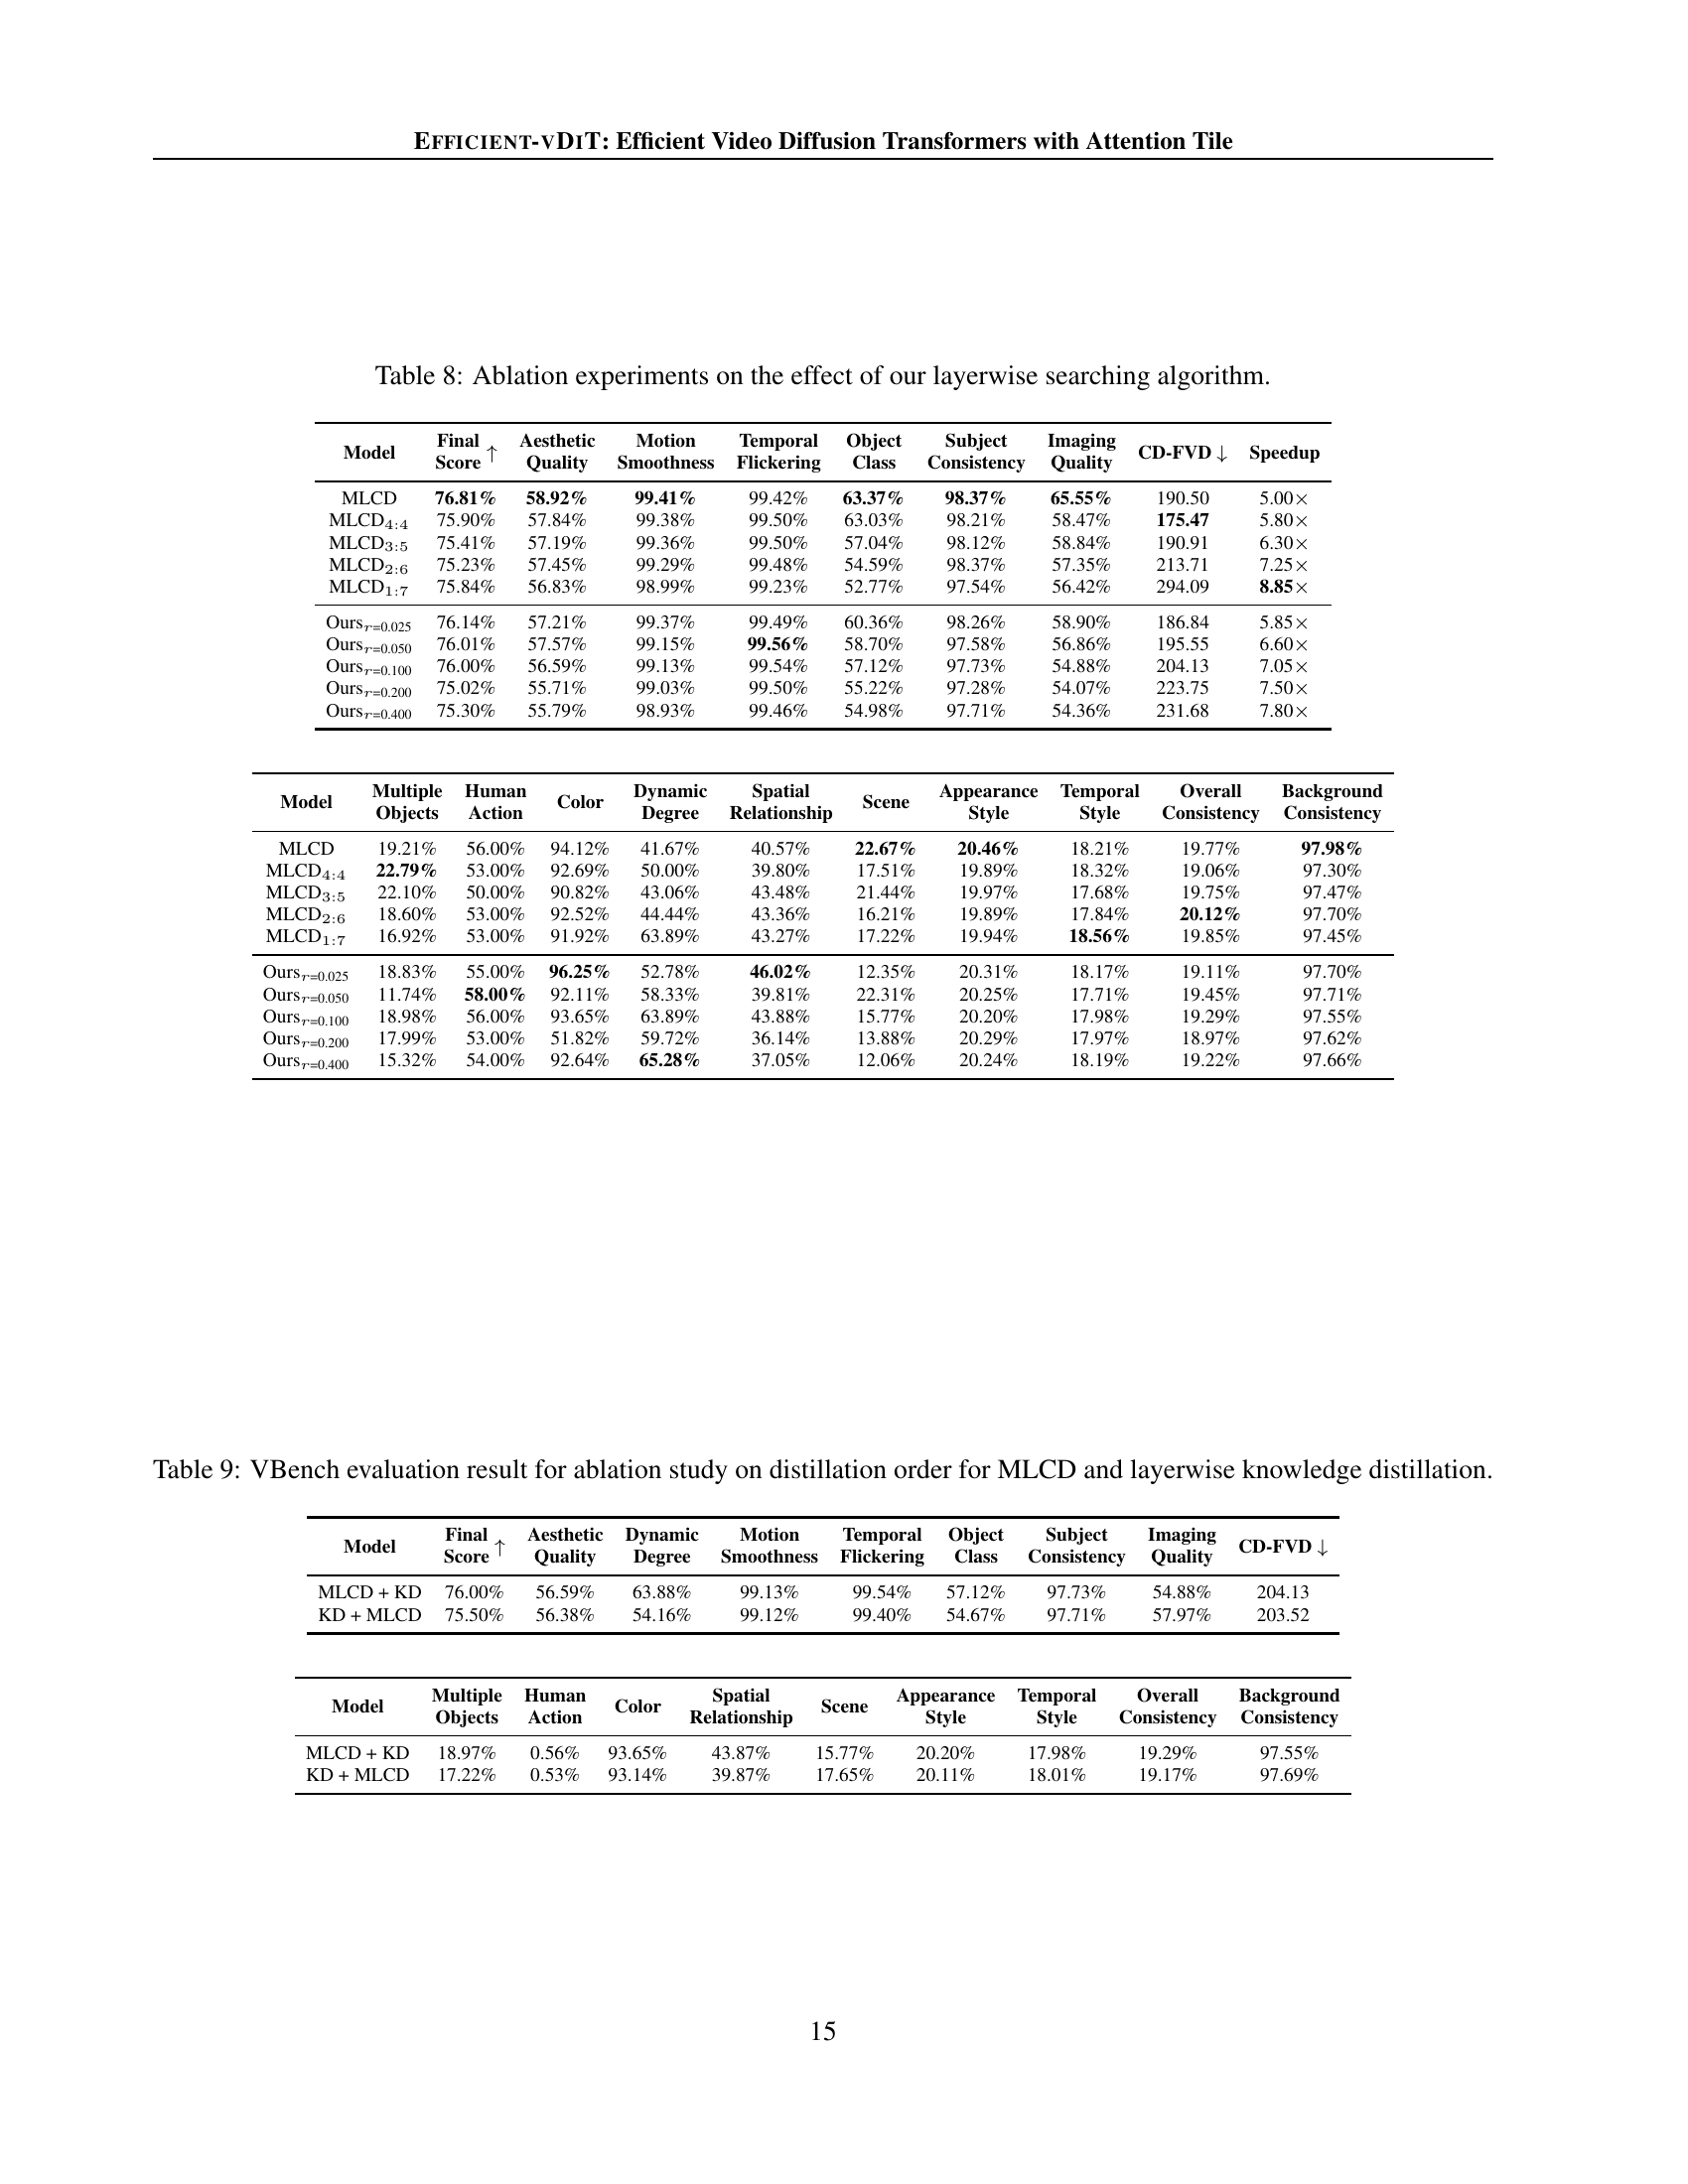
🔼 This table presents the results of ablation experiments conducted to evaluate the effectiveness of the proposed layerwise search algorithm for sparse attention masks. It compares the performance of different models: the baseline model using multi-step consistency distillation (MLCD) and variations of the model incorporating different sparsity levels of attention masks. The results are presented in terms of VBench scores (which measure video generation quality across various dimensions), CD-FVD (Content-Debiased Fréchet Video Distance, assessing the distribution difference between generated and real videos), and the speedup achieved over the base MLCD model. The comparison helps to understand the trade-off between model speed and video generation quality at various sparsity levels.
read the caption
Table 8: Ablation experiments on the effect of our layerwise searching algorithm.
| Model | Final Score | Aesthetic Quality | Motion Smoothness | Temporal Flickering | Object Class | Subject Consistency | Imaging Quality | CD-FVD | Speedup |
| MLCD | 76.81% | 58.92% | 99.41% | 99.42% | 63.37% | 98.37% | 65.55% | 190.50 | 5.00 |
| 75.90% | 57.84% | 99.38% | 99.50% | 63.03% | 98.21% | 58.47% | 175.47 | 5.80 | |
| 75.41% | 57.19% | 99.36% | 99.50% | 57.04% | 98.12% | 58.84% | 190.91 | 6.30 | |
| 75.23% | 57.45% | 99.29% | 99.48% | 54.59% | 98.37% | 57.35% | 213.71 | 7.25 | |
| 75.84% | 56.83% | 98.99% | 99.23% | 52.77% | 97.54% | 56.42% | 294.09 | 8.85 | |
| 76.14% | 57.21% | 99.37% | 99.49% | 60.36% | 98.26% | 58.90% | 186.84 | 5.85 | |
| 76.01% | 57.57% | 99.15% | 99.56% | 58.70% | 97.58% | 56.86% | 195.55 | 6.60 | |
| 76.00% | 56.59% | 99.13% | 99.54% | 57.12% | 97.73% | 54.88% | 204.13 | 7.05 | |
| 75.02% | 55.71% | 99.03% | 99.50% | 55.22% | 97.28% | 54.07% | 223.75 | 7.50 | |
| 75.30% | 55.79% | 98.93% | 99.46% | 54.98% | 97.71% | 54.36% | 231.68 | 7.80 |
🔼 This table presents the results of an ablation study investigating the impact of distillation order on the performance of the Efficient-VDIT model. Specifically, it compares the model’s performance when multi-step consistency distillation (MLCD) is applied before layerwise knowledge distillation versus the reverse order. The evaluation is performed using VBench metrics, assessing various aspects of video generation quality, such as aesthetic quality, motion smoothness, temporal consistency, and overall quality. The table helps to determine whether the order of these distillation steps affects the final model’s performance and whether there is an optimal approach.
read the caption
Table 9: VBench evaluation result for ablation study on distillation order for MLCD and layerwise knowledge distillation.
| Model | Multiple Objects | Human Action | Color | Dynamic Degree | Spatial Relationship | Scene | Appearance Style | Temporal Style | Overall Consistency | Background Consistency |
| MLCD | 19.21% | 56.00% | 94.12% | 41.67% | 40.57% | 22.67% | 20.46% | 18.21% | 19.77% | 97.98% |
| 22.79% | 53.00% | 92.69% | 50.00% | 39.80% | 17.51% | 19.89% | 18.32% | 19.06% | 97.30% | |
| 22.10% | 50.00% | 90.82% | 43.06% | 43.48% | 21.44% | 19.97% | 17.68% | 19.75% | 97.47% | |
| 18.60% | 53.00% | 92.52% | 44.44% | 43.36% | 16.21% | 19.89% | 17.84% | 20.12% | 97.70% | |
| 16.92% | 53.00% | 91.92% | 63.89% | 43.27% | 17.22% | 19.94% | 18.56% | 19.85% | 97.45% | |
| 18.83% | 55.00% | 96.25% | 52.78% | 46.02% | 12.35% | 20.31% | 18.17% | 19.11% | 97.70% | |
| 11.74% | 58.00% | 92.11% | 58.33% | 39.81% | 22.31% | 20.25% | 17.71% | 19.45% | 97.71% | |
| 18.98% | 56.00% | 93.65% | 63.89% | 43.88% | 15.77% | 20.20% | 17.98% | 19.29% | 97.55% | |
| 17.99% | 53.00% | 51.82% | 59.72% | 36.14% | 13.88% | 20.29% | 17.97% | 18.97% | 97.62% | |
| 15.32% | 54.00% | 92.64% | 65.28% | 37.05% | 12.06% | 20.24% | 18.19% | 19.22% | 97.66% |
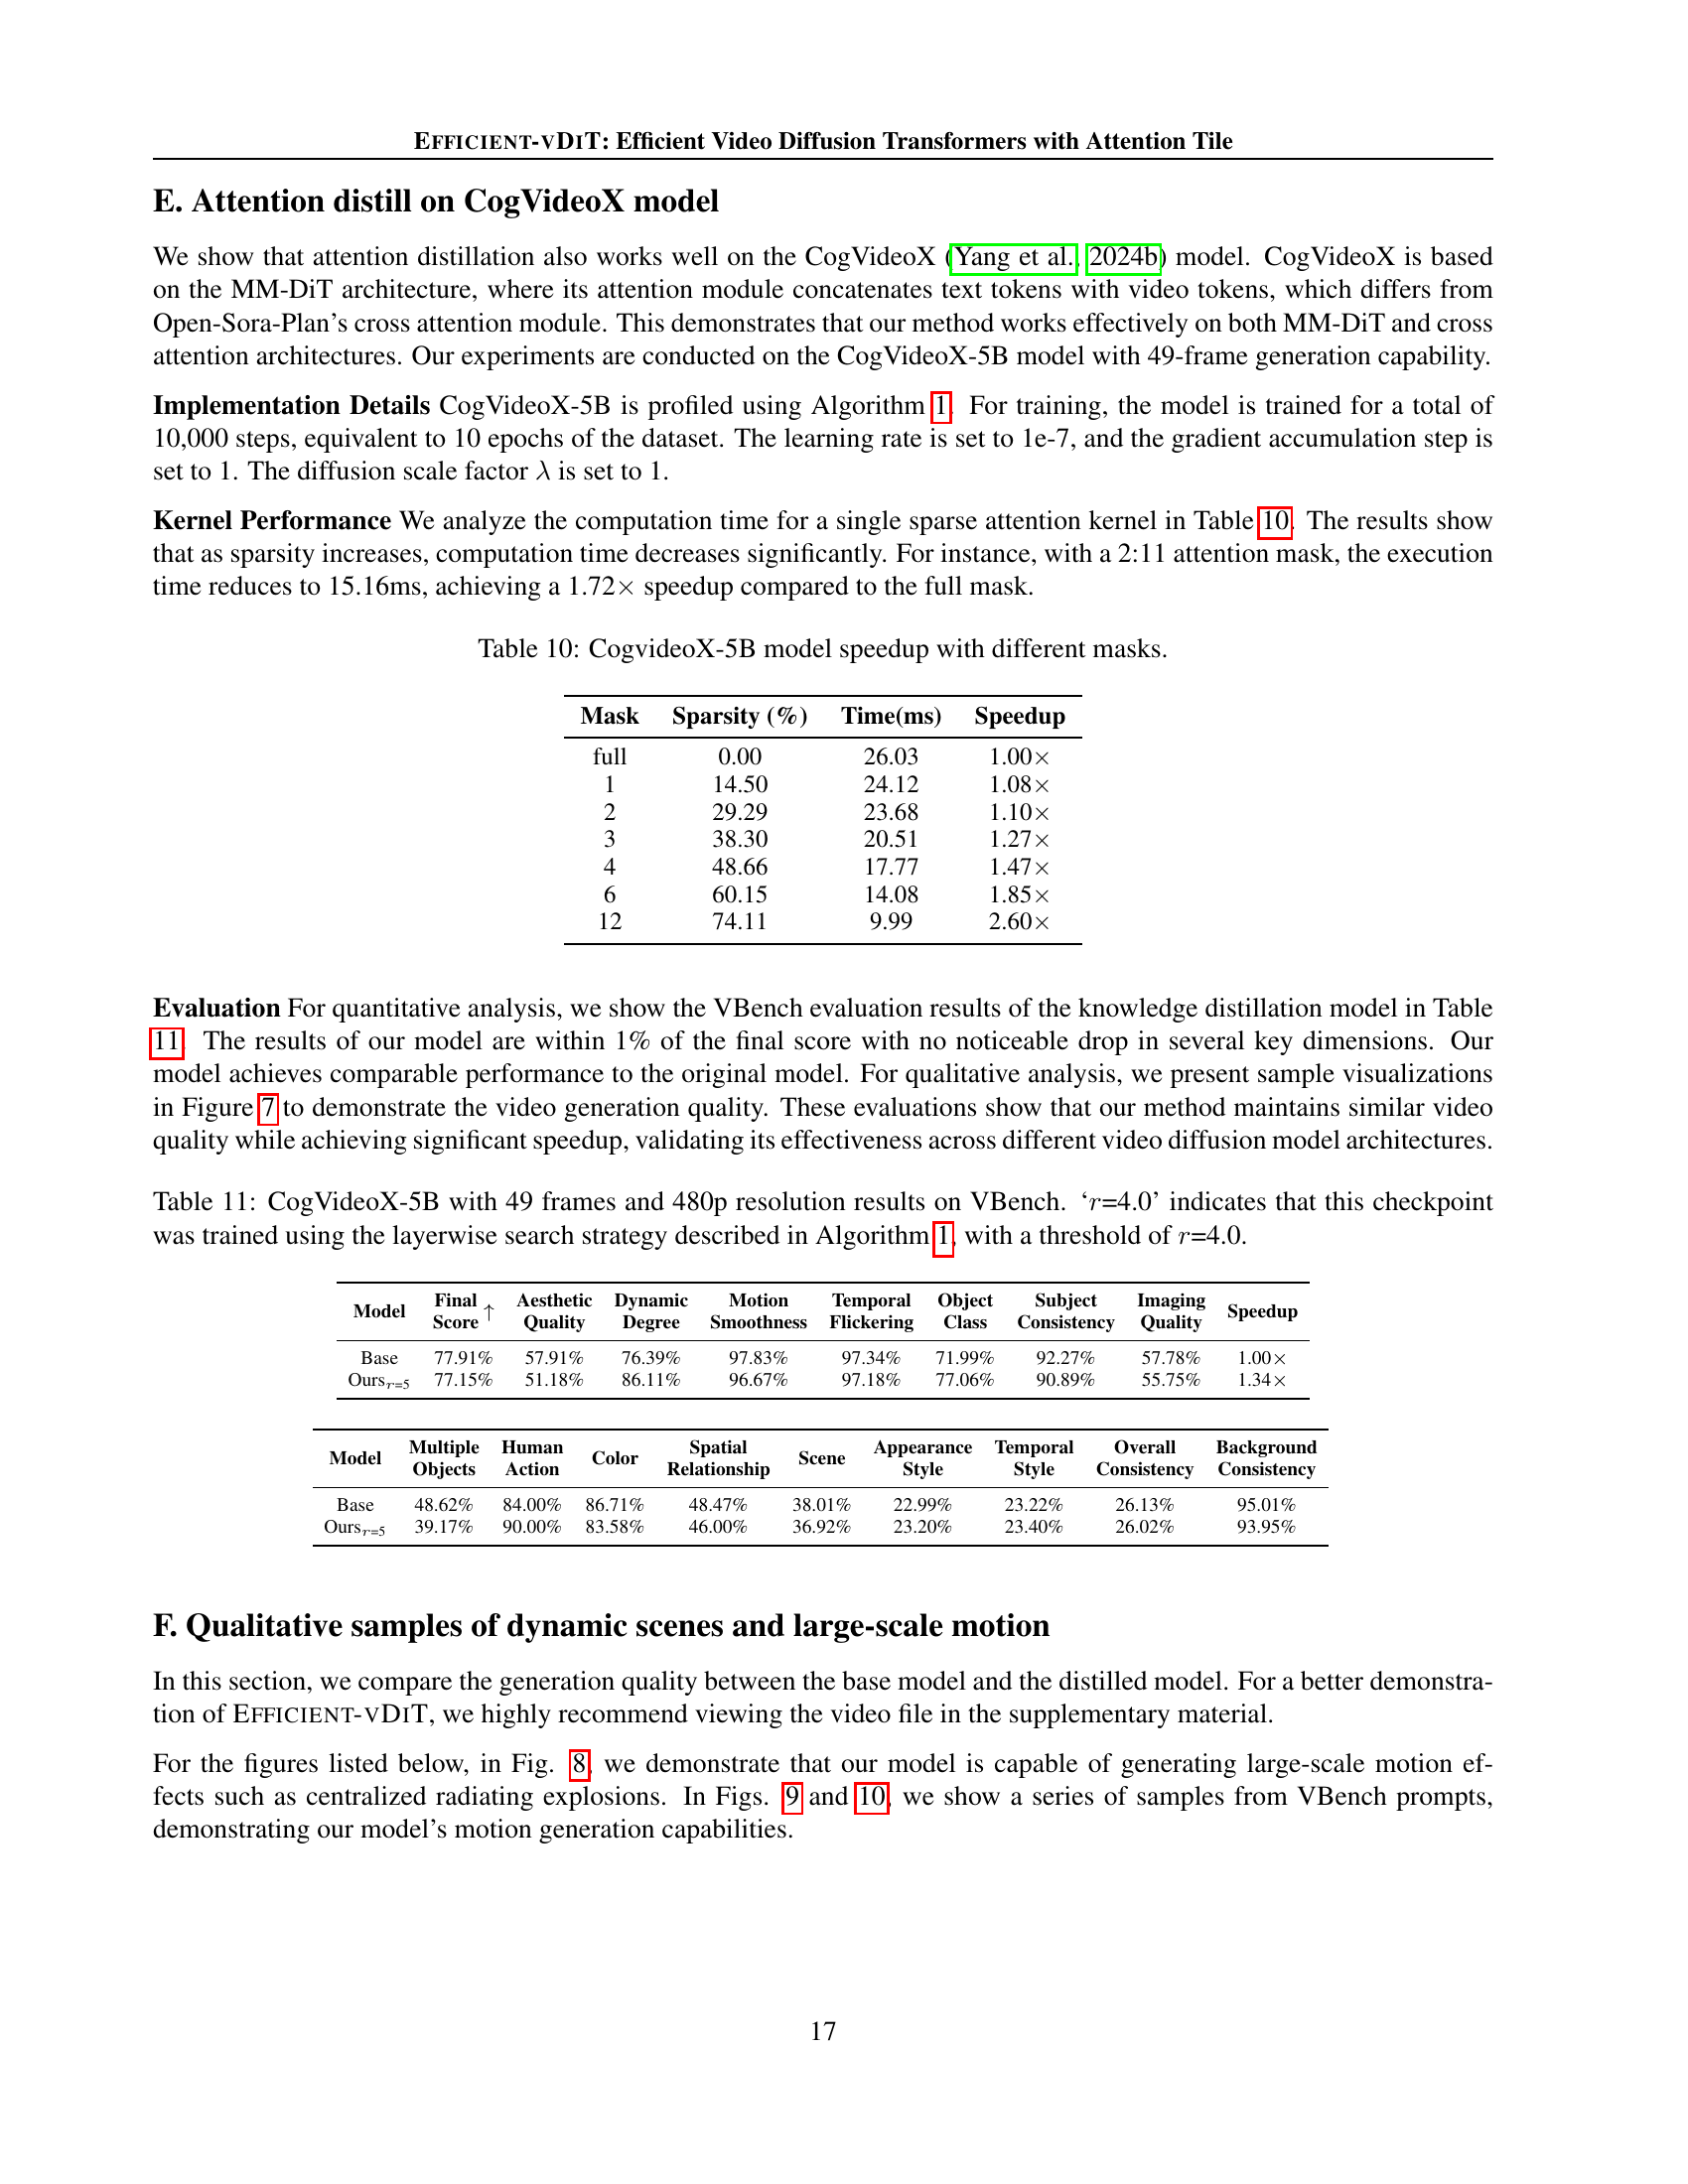
🔼 This table presents the speedup achieved by using different sparse attention masks in the CogVideoX-5B model. It shows the relationship between the sparsity of the attention mask (percentage of elements not computed), the resulting execution time (in milliseconds), and the speedup factor compared to using a full attention mask (no sparsity). The results demonstrate that increasing sparsity, while maintaining reasonable performance, significantly reduces computation time, leading to substantial speed improvements. This highlights the efficiency gains obtained by strategically applying sparse attention in video generation models.
read the caption
Table 10: CogvideoX-5B model speedup with different masks.
| Model | Final Score | Aesthetic Quality | Dynamic Degree | Motion Smoothness | Temporal Flickering | Object Class | Subject Consistency | Imaging Quality | CD-FVD |
| MLCD + KD | 76.00% | 56.59% | 63.88% | 99.13% | 99.54% | 57.12% | 97.73% | 54.88% | 204.13 |
| KD + MLCD | 75.50% | 56.38% | 54.16% | 99.12% | 99.40% | 54.67% | 97.71% | 57.97% | 203.52 |
🔼 Table 11 presents the performance of the CogVideoX-5B model (a large video generation model) on the VBench benchmark. The experiment uses videos with 49 frames and a resolution of 480p. A key aspect is the use of a layerwise search strategy (detailed in Algorithm 1 of the paper) during training. The ‘r=4.0’ in the caption specifies that a threshold of 4.0 was used during this layerwise search process which determines sparsity level in the model’s attention mechanism. The table provides a detailed breakdown of the model’s performance across various aspects of video quality, enabling a comprehensive assessment of its capabilities.
read the caption
Table 11: CogVideoX-5B with 49 frames and 480p resolution results on VBench. ‘r𝑟ritalic_r=4.0’ indicates that this checkpoint was trained using the layerwise search strategy described in Algorithm 1, with a threshold of r𝑟ritalic_r=4.0.
Full paper#