TL;DR#
Current research on Large Language Models (LLMs) often focuses on scaling up model size to improve performance. This paper investigates Test-Time Scaling (TTS), a method that enhances performance by adding computation during inference. However, existing TTS research lacks a systematic analysis of how different factors influence the optimal scaling strategy. This makes it difficult to apply TTS effectively in practice and limits our understanding of its potential.
This research addresses this gap by conducting comprehensive experiments on MATH-500 and AIME24 datasets. They explore the impact of various policy models, process reward models (PRMs), and problem difficulty levels on TTS. Their findings demonstrate that a compute-optimal TTS strategy, especially a reward-aware approach, significantly improves performance. Surprisingly, they find that smaller LLMs, using their optimized TTS approach, can even outperform much larger models. This suggests a paradigm shift in how we think about LLM scaling.
Key Takeaways#
Why does it matter?#
This paper challenges conventional wisdom in large language model (LLM) scaling by demonstrating that compute-optimal test-time scaling (TTS) can enable smaller LLMs to surpass significantly larger models in performance, opening new avenues for research and resource-efficient development of LLMs.
Visual Insights#

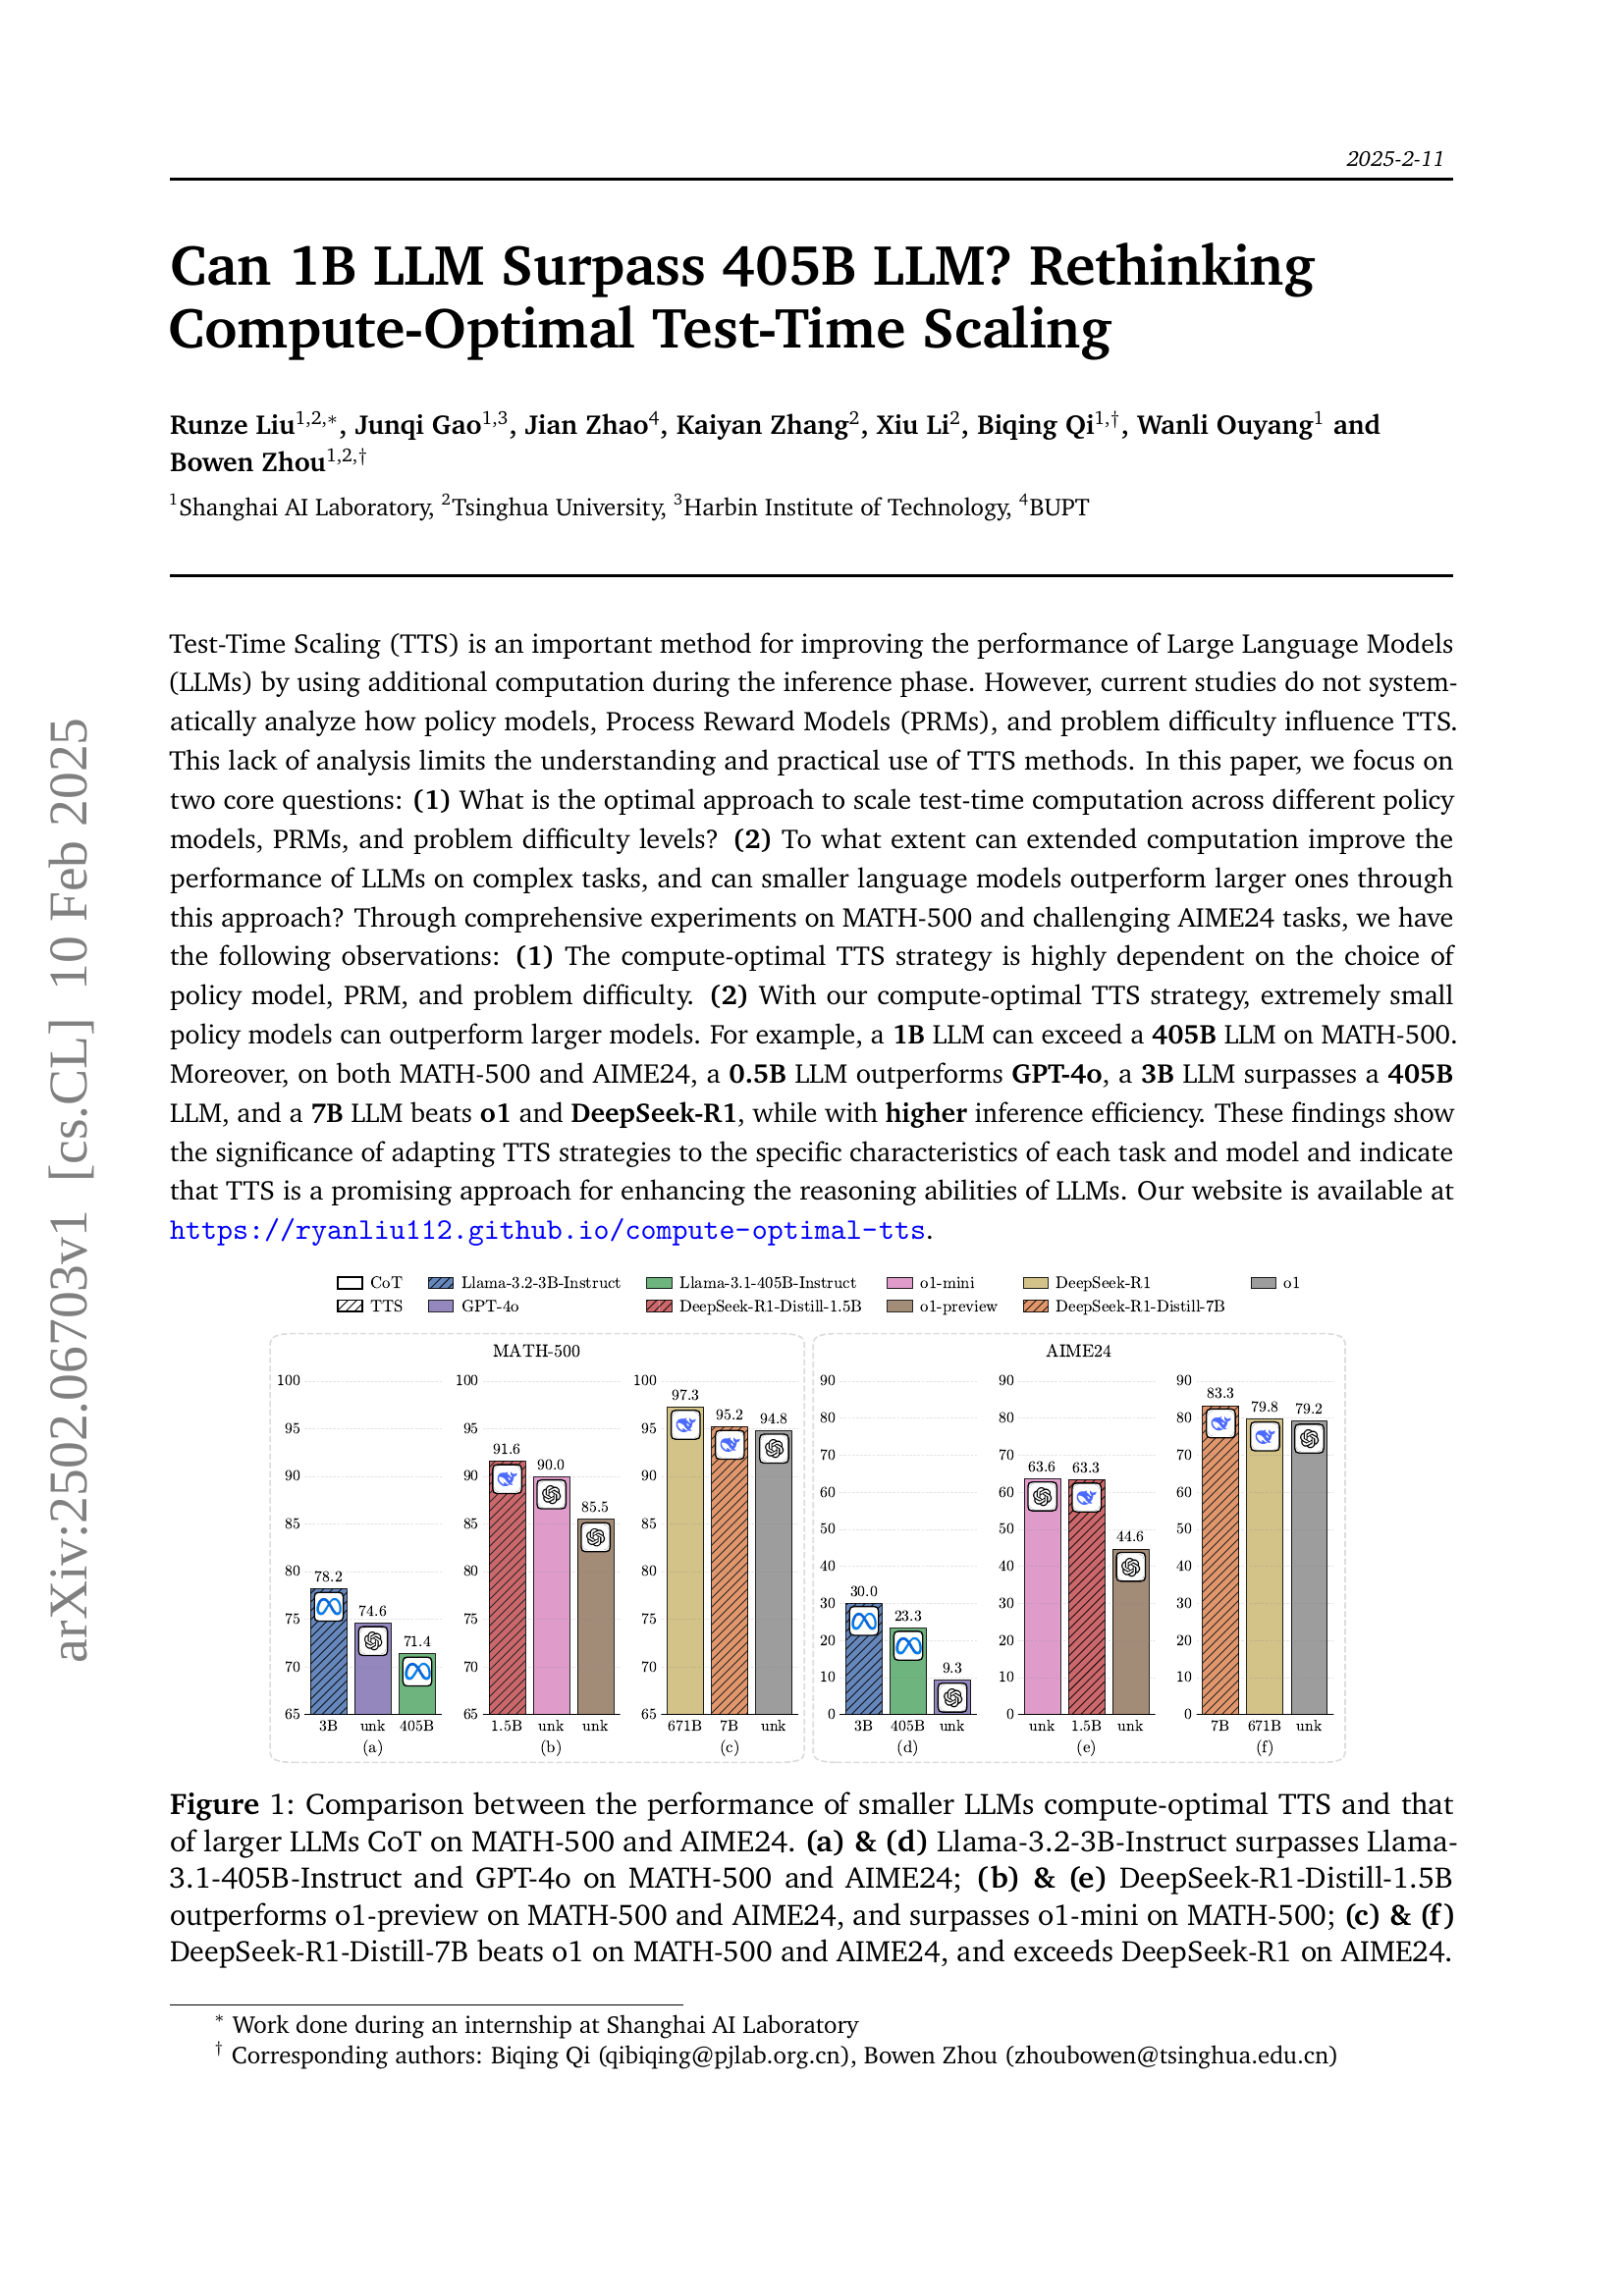
🔼 This figure compares the performance of smaller Language Models (LLMs) using compute-optimal Test-Time Scaling (TTS) against larger LLMs using Chain-of-Thought (CoT) reasoning on the MATH-500 and AIME24 datasets. It demonstrates that smaller models, when utilizing a compute-optimal TTS strategy, can sometimes surpass significantly larger models in terms of accuracy. Specifically, the figure showcases several examples: Llama-3.2-3B-Instruct outperforming Llama-3.1-405B-Instruct and GPT-4; DeepSeek-R1-Distill-1.5B outperforming o1-preview and o1-mini; and DeepSeek-R1-Distill-7B surpassing both o1 and the larger DeepSeek-R1 model. Each comparison is presented using bar charts illustrating performance on MATH-500 and AIME24.
read the caption
Figure 1: Comparison between the performance of smaller LLMs compute-optimal TTS and that of larger LLMs CoT on MATH-500 and AIME24. (a) & (d) Llama-3.2-3B-Instruct surpasses Llama-3.1-405B-Instruct and GPT-4o on MATH-500 and AIME24; (b) & (e) DeepSeek-R1-Distill-1.5B outperforms o1-preview on MATH-500 and AIME24, and surpasses o1-mini on MATH-500; (c) & (f) DeepSeek-R1-Distill-7B beats o1 on MATH-500 and AIME24, and exceeds DeepSeek-R1 on AIME24.
| Mistral-PRM-Data | Deepseek-PRM-Data | |
| Average Token per Response | 236.9 | 333.1 |
| Average Token per Step | 46.6 | 58.4 |
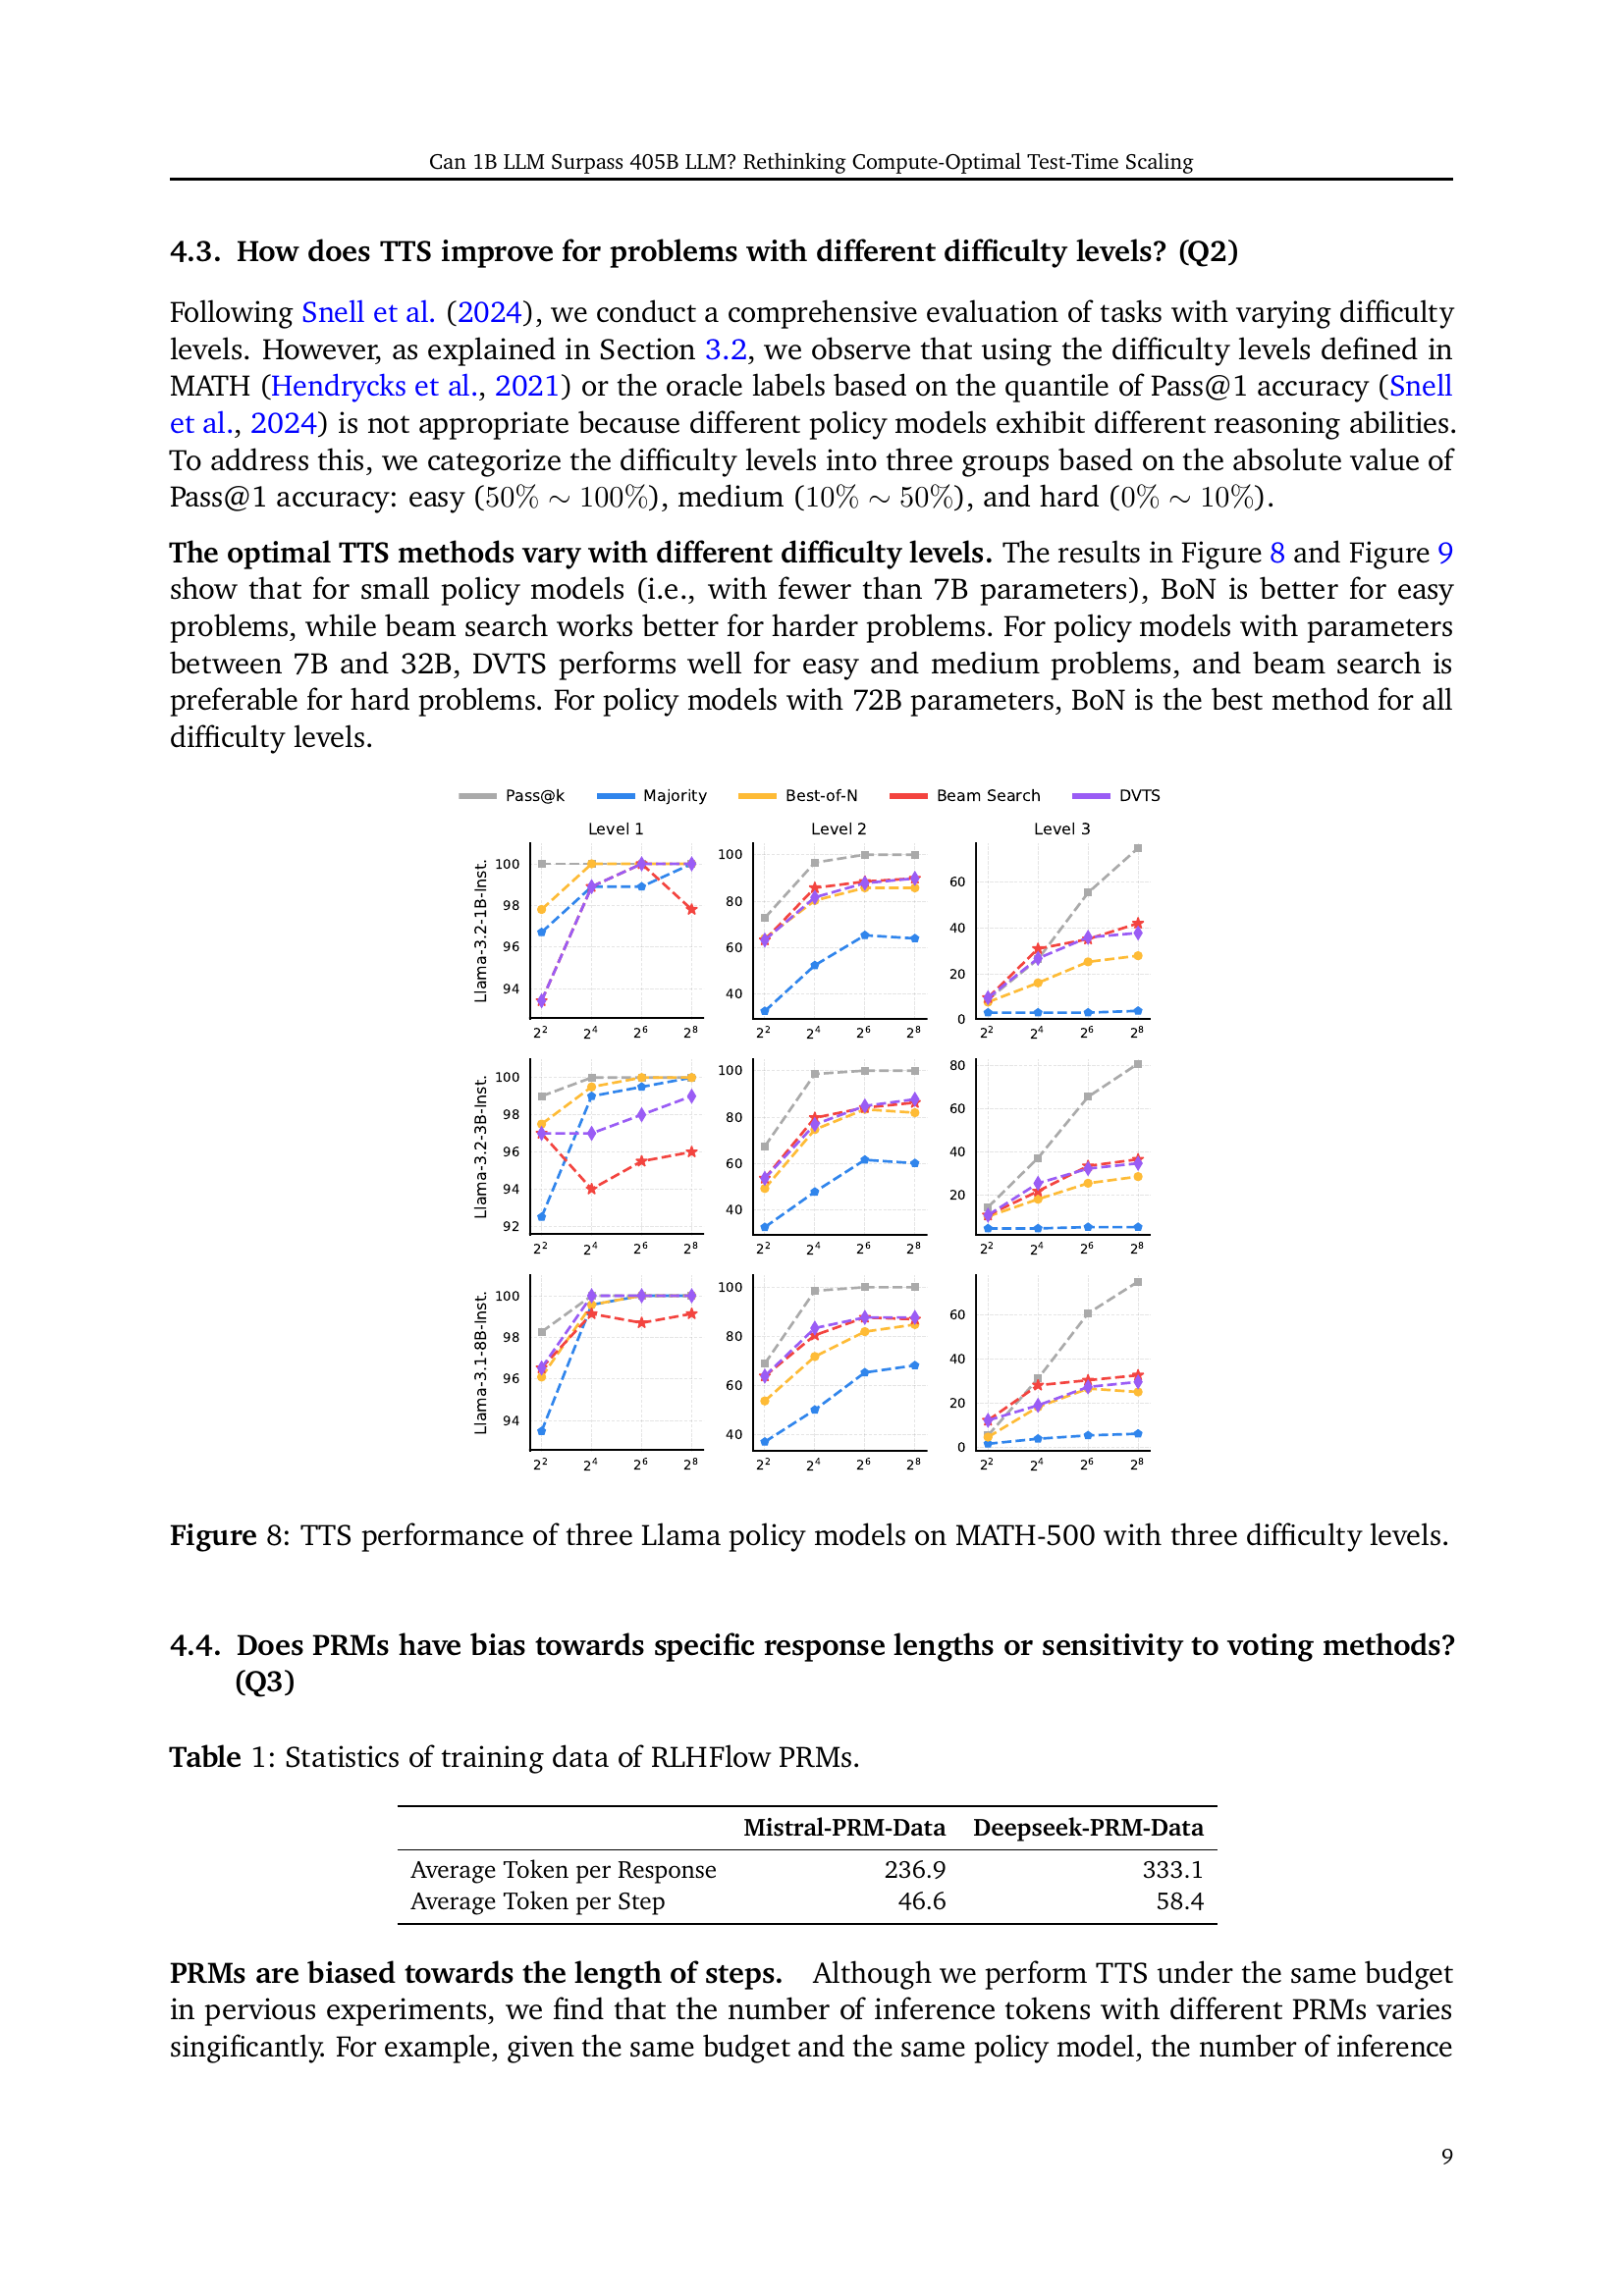
🔼 This table presents statistics of the training data used for the RLHFlow family of Process Reward Models (PRMs). Specifically, it shows the average number of tokens per response and the average number of tokens per step within the training data. This information is crucial in understanding the characteristics of these PRMs and how those characteristics might impact their performance and generalization abilities.
read the caption
Table 1: Statistics of training data of RLHFlow PRMs.
In-depth insights#
Compute-Optimal TTS#
Compute-optimal test-time scaling (TTS) aims to maximize the performance of large language models (LLMs) by dynamically allocating computation during inference. The optimal strategy is highly dependent on the interplay of several factors: the specific policy model used (the LLM generating solutions), the process reward model (PRM, which evaluates solutions), and the problem’s inherent difficulty. A key insight is that simply using more compute isn’t always better; an effective strategy must account for these interacting elements. Furthermore, the choice of PRM significantly impacts performance, highlighting the need for reward-aware compute optimization. The research demonstrates that even smaller LLMs can surprisingly outperform much larger models when a compute-optimal TTS strategy is employed, suggesting that model size alone doesn’t dictate performance. The effectiveness of the strategy, however, is also influenced by the task’s complexity, implying that the optimal scaling strategy might need further refinements for different types of reasoning challenges.
Reward-Aware TTS#
The concept of “Reward-Aware TTS” builds upon traditional Test-Time Scaling (TTS) by incorporating a reward mechanism to make the process more efficient and effective. Standard TTS methods often struggle with optimal compute allocation, especially across diverse policy models and problem difficulties. Reward-Aware TTS directly addresses this by integrating a reward function into the compute-optimal scaling strategy. This reward function guides the allocation of computational resources, dynamically adjusting based on the problem’s characteristics and the policy model used. This dynamic adjustment allows for a more optimal strategy, enhancing performance by ensuring that the compute budget is allocated effectively across diverse problem types and model architectures. The key advantage is its ability to handle out-of-distribution issues more robustly, compared to strategies relying solely on pre-trained process reward models. By accounting for the reward signal, the system makes more informed decisions, leading to improved accuracy and more efficient use of computational resources. This framework improves upon the limitations of existing methods, highlighting its potential for broader applications in various reasoning tasks.
Problem Difficulty#
The concept of ‘problem difficulty’ in evaluating large language models (LLMs) is multifaceted and crucial for assessing their capabilities. Simple quantile-based methods, dividing problems into difficulty levels based on accuracy percentiles, prove inadequate. This is because different LLMs possess varying reasoning abilities; a problem deemed ’easy’ by one LLM might be challenging for another. Therefore, a more robust approach is needed, such as employing absolute thresholds based on objective metrics like Pass@1 accuracy. This allows for a more nuanced evaluation, defining difficulty levels that are independent of the specific LLM being tested. Furthermore, problem difficulty interacts intricately with other factors, including the choice of policy model, process reward model (PRM), and the TTS strategy employed. Understanding these complex interactions is vital for developing compute-optimal strategies, as the optimal scaling method will likely depend significantly on the inherent difficulty of the problem being tackled. Finally, research needs to address how different PRMs might exhibit biases towards specific problem complexities or response lengths, which could skew the evaluation and limit the generalizability of the findings.
PRM Bias Analysis#
A PRM bias analysis in a large language model (LLM) research paper would delve into the systematic biases present in process reward models (PRMs). PRMs are crucial for guiding test-time scaling (TTS) strategies, which aim to improve LLM performance by allocating additional computation during inference. The analysis would likely focus on how PRMs influence the selection of reasoning steps and the final answer. A key aspect would be identifying and quantifying the biases introduced by PRMs, such as biases towards specific response lengths, certain problem types, or particular solution methods. This might involve analyzing the reward function used in the PRM, examining the training data, and comparing PRM outputs to those of human evaluators. The implications of PRM biases are significant; they could lead to biased, inaccurate, and less reliable LLM outputs, especially when handling complex reasoning tasks. Therefore, a thorough PRM bias analysis is critical for ensuring the fairness, accuracy, and trustworthiness of LLM applications driven by TTS.
Future of TTS#
The future of Test-Time Scaling (TTS) hinges on addressing its current limitations and exploring new avenues for improvement. Reward model development is crucial; current models suffer from over-criticism, error neglect, and localization bias, hindering optimal performance. Future work should focus on creating more robust and interpretable reward models, potentially through improved training data and architectures. Expanding TTS beyond mathematical tasks to encompass diverse domains like code and chemistry is vital to demonstrate its broader applicability. Moreover, research into more efficient compute-optimal strategies is needed. Current methods are computationally expensive, particularly for larger models, limiting practical applicability. Finally, combining TTS with other techniques like chain-of-thought prompting or self-improvement methods could unlock even greater performance gains, particularly for complex reasoning tasks. The ultimate goal is to seamlessly integrate TTS into LLMs, making it a standard inference procedure rather than a specialized technique.
More visual insights#
More on figures

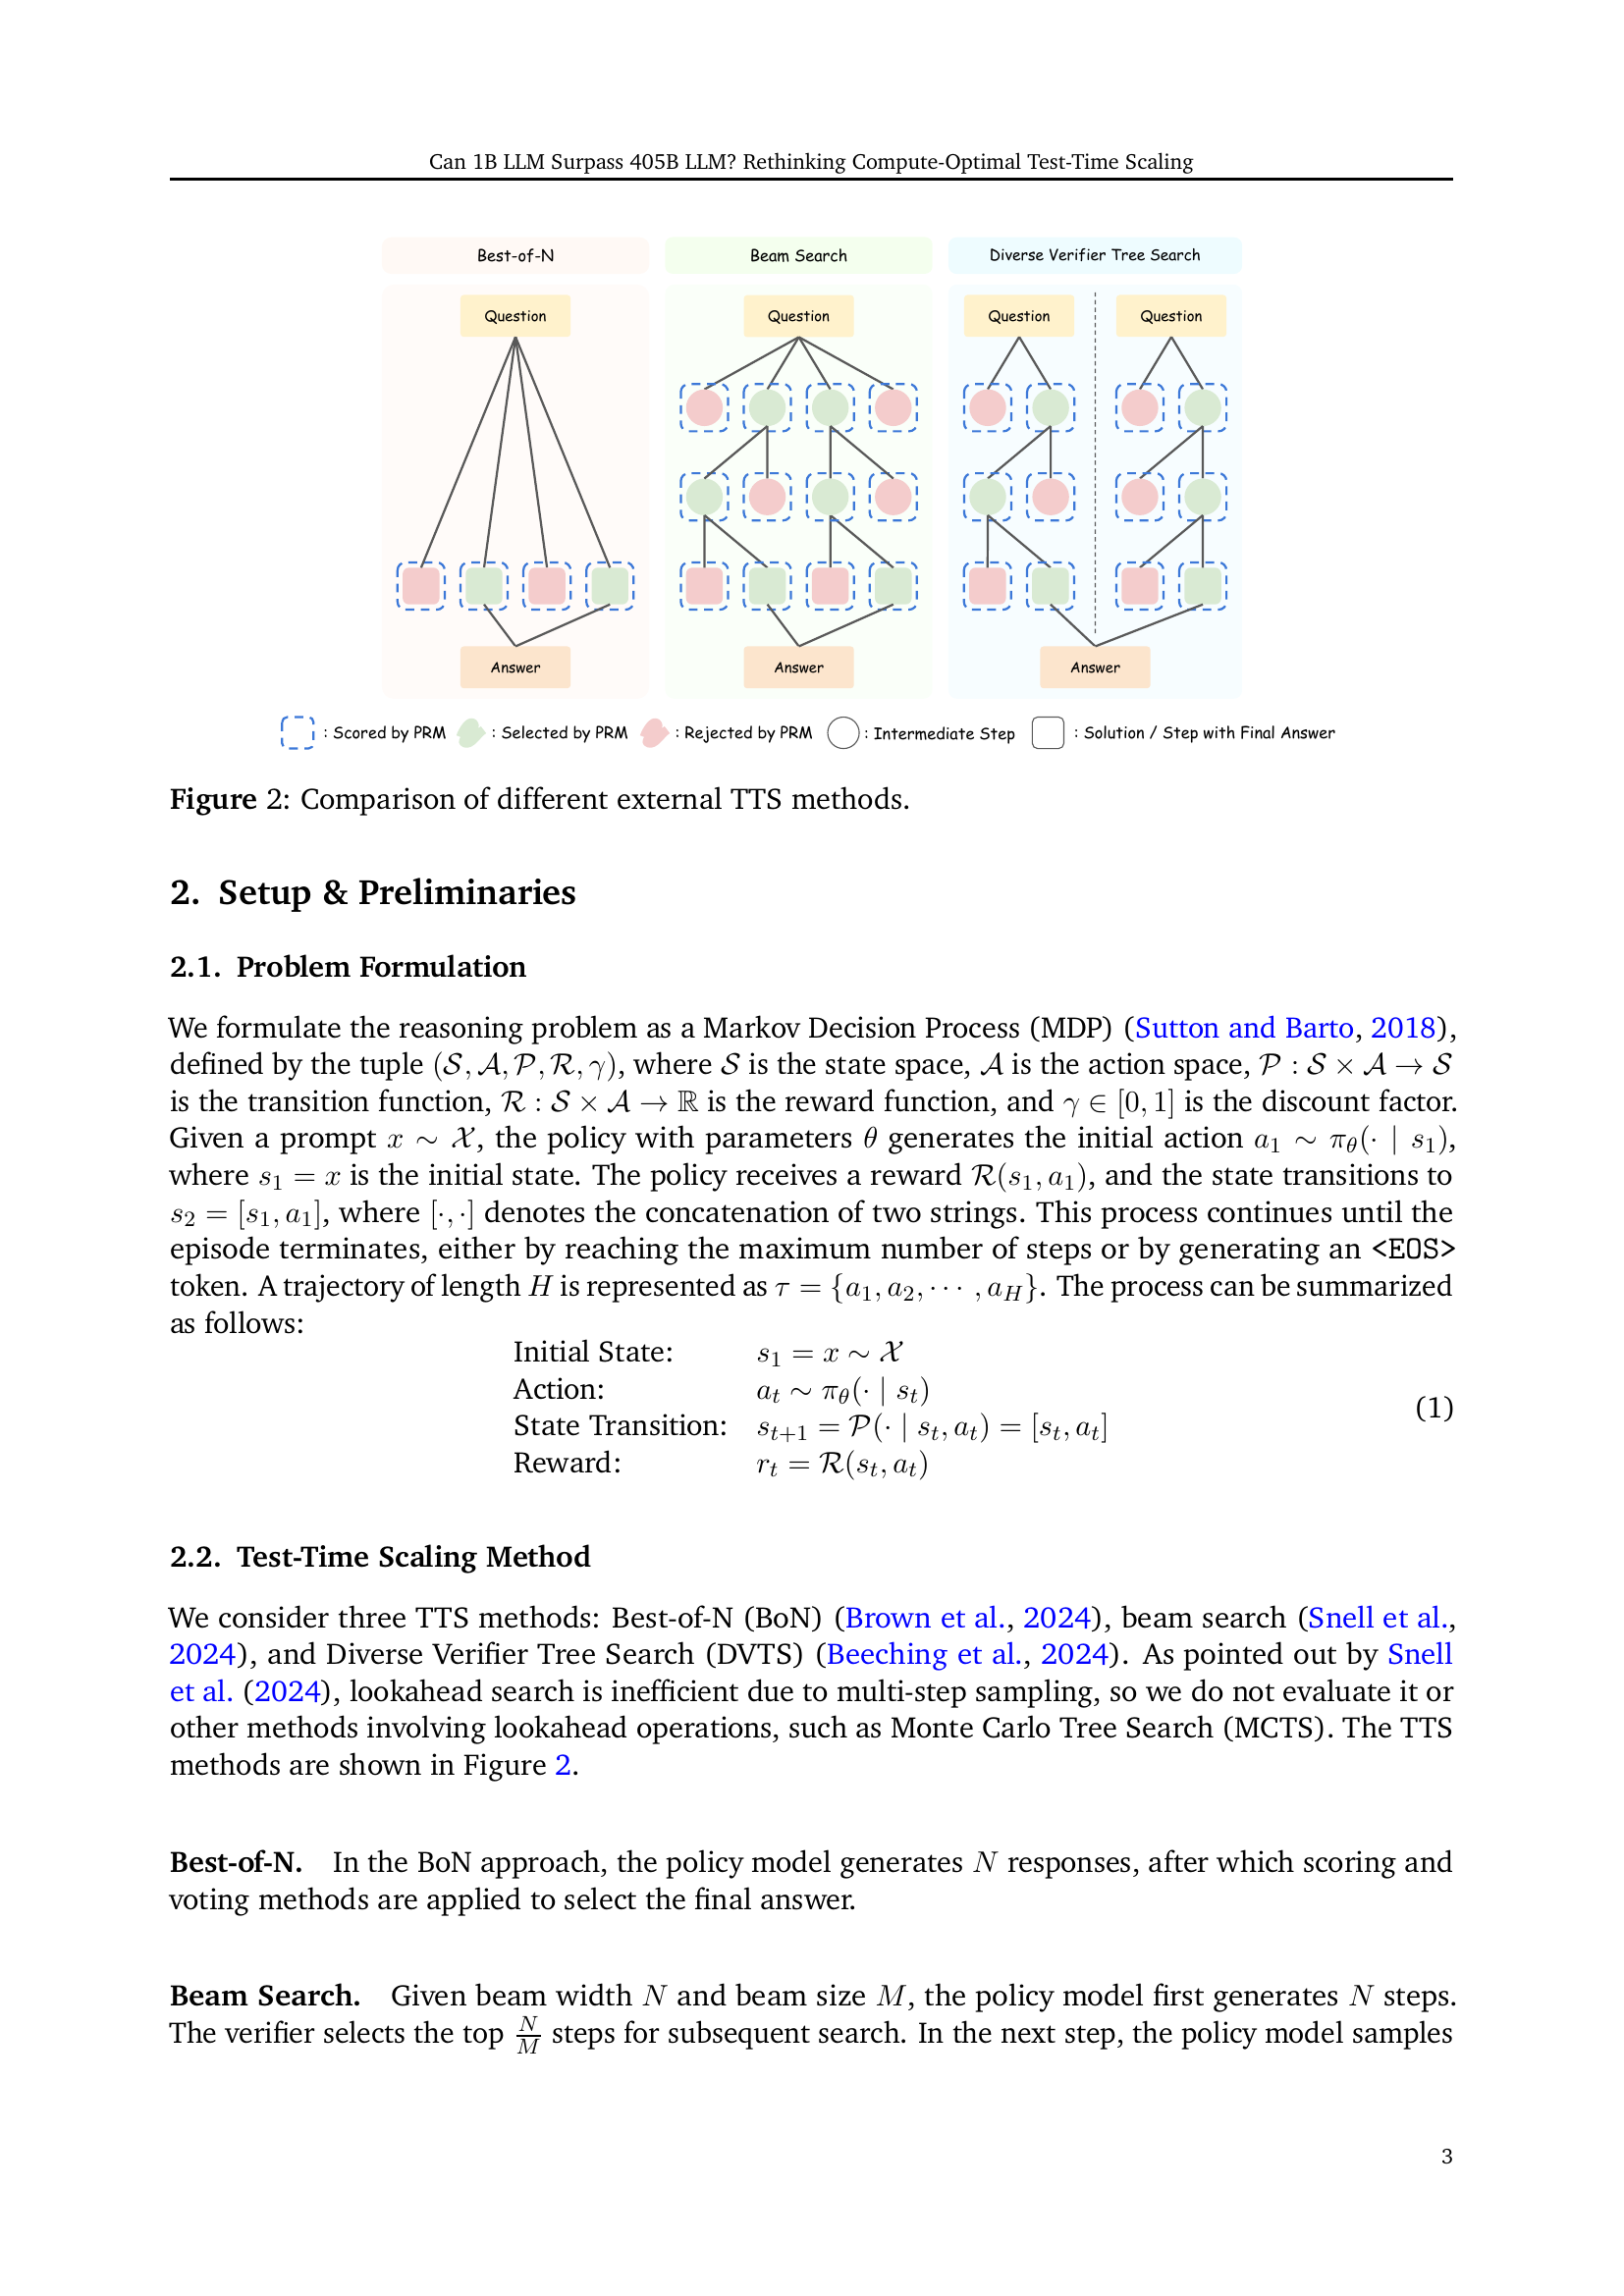
🔼 This figure compares three external Test-Time Scaling (TTS) methods: Best-of-N, Beam Search, and Diverse Verifier Tree Search. Each method uses a policy model to generate responses and a process reward model (PRM) to score them. Best-of-N generates multiple responses and selects the best one. Beam search explores multiple possible solution paths, keeping the top N most promising ones at each step. Diverse Verifier Tree Search extends beam search by dividing the search process into subtrees, exploring each independently to enhance diversity and potentially handle complex problems more effectively.
read the caption
Figure 2: Comparison of different external TTS methods.

🔼 This figure shows the distribution of Pass@1 accuracy for the Qwen2.5-72B-Instruct model on the MATH-500 dataset. The x-axis represents the Pass@1 accuracy, which is divided into five bins or ranges of accuracy. The y-axis represents the percentage of problems in each bin. The figure visually demonstrates the performance of the model across different difficulty levels within the MATH-500 dataset, showing how many problems are solved correctly at different accuracy levels.
read the caption
Figure 3: Distribution of Pass@1 accuracy of Qwen2.5-72B-Instruct on MATH-500, divided into five bins.

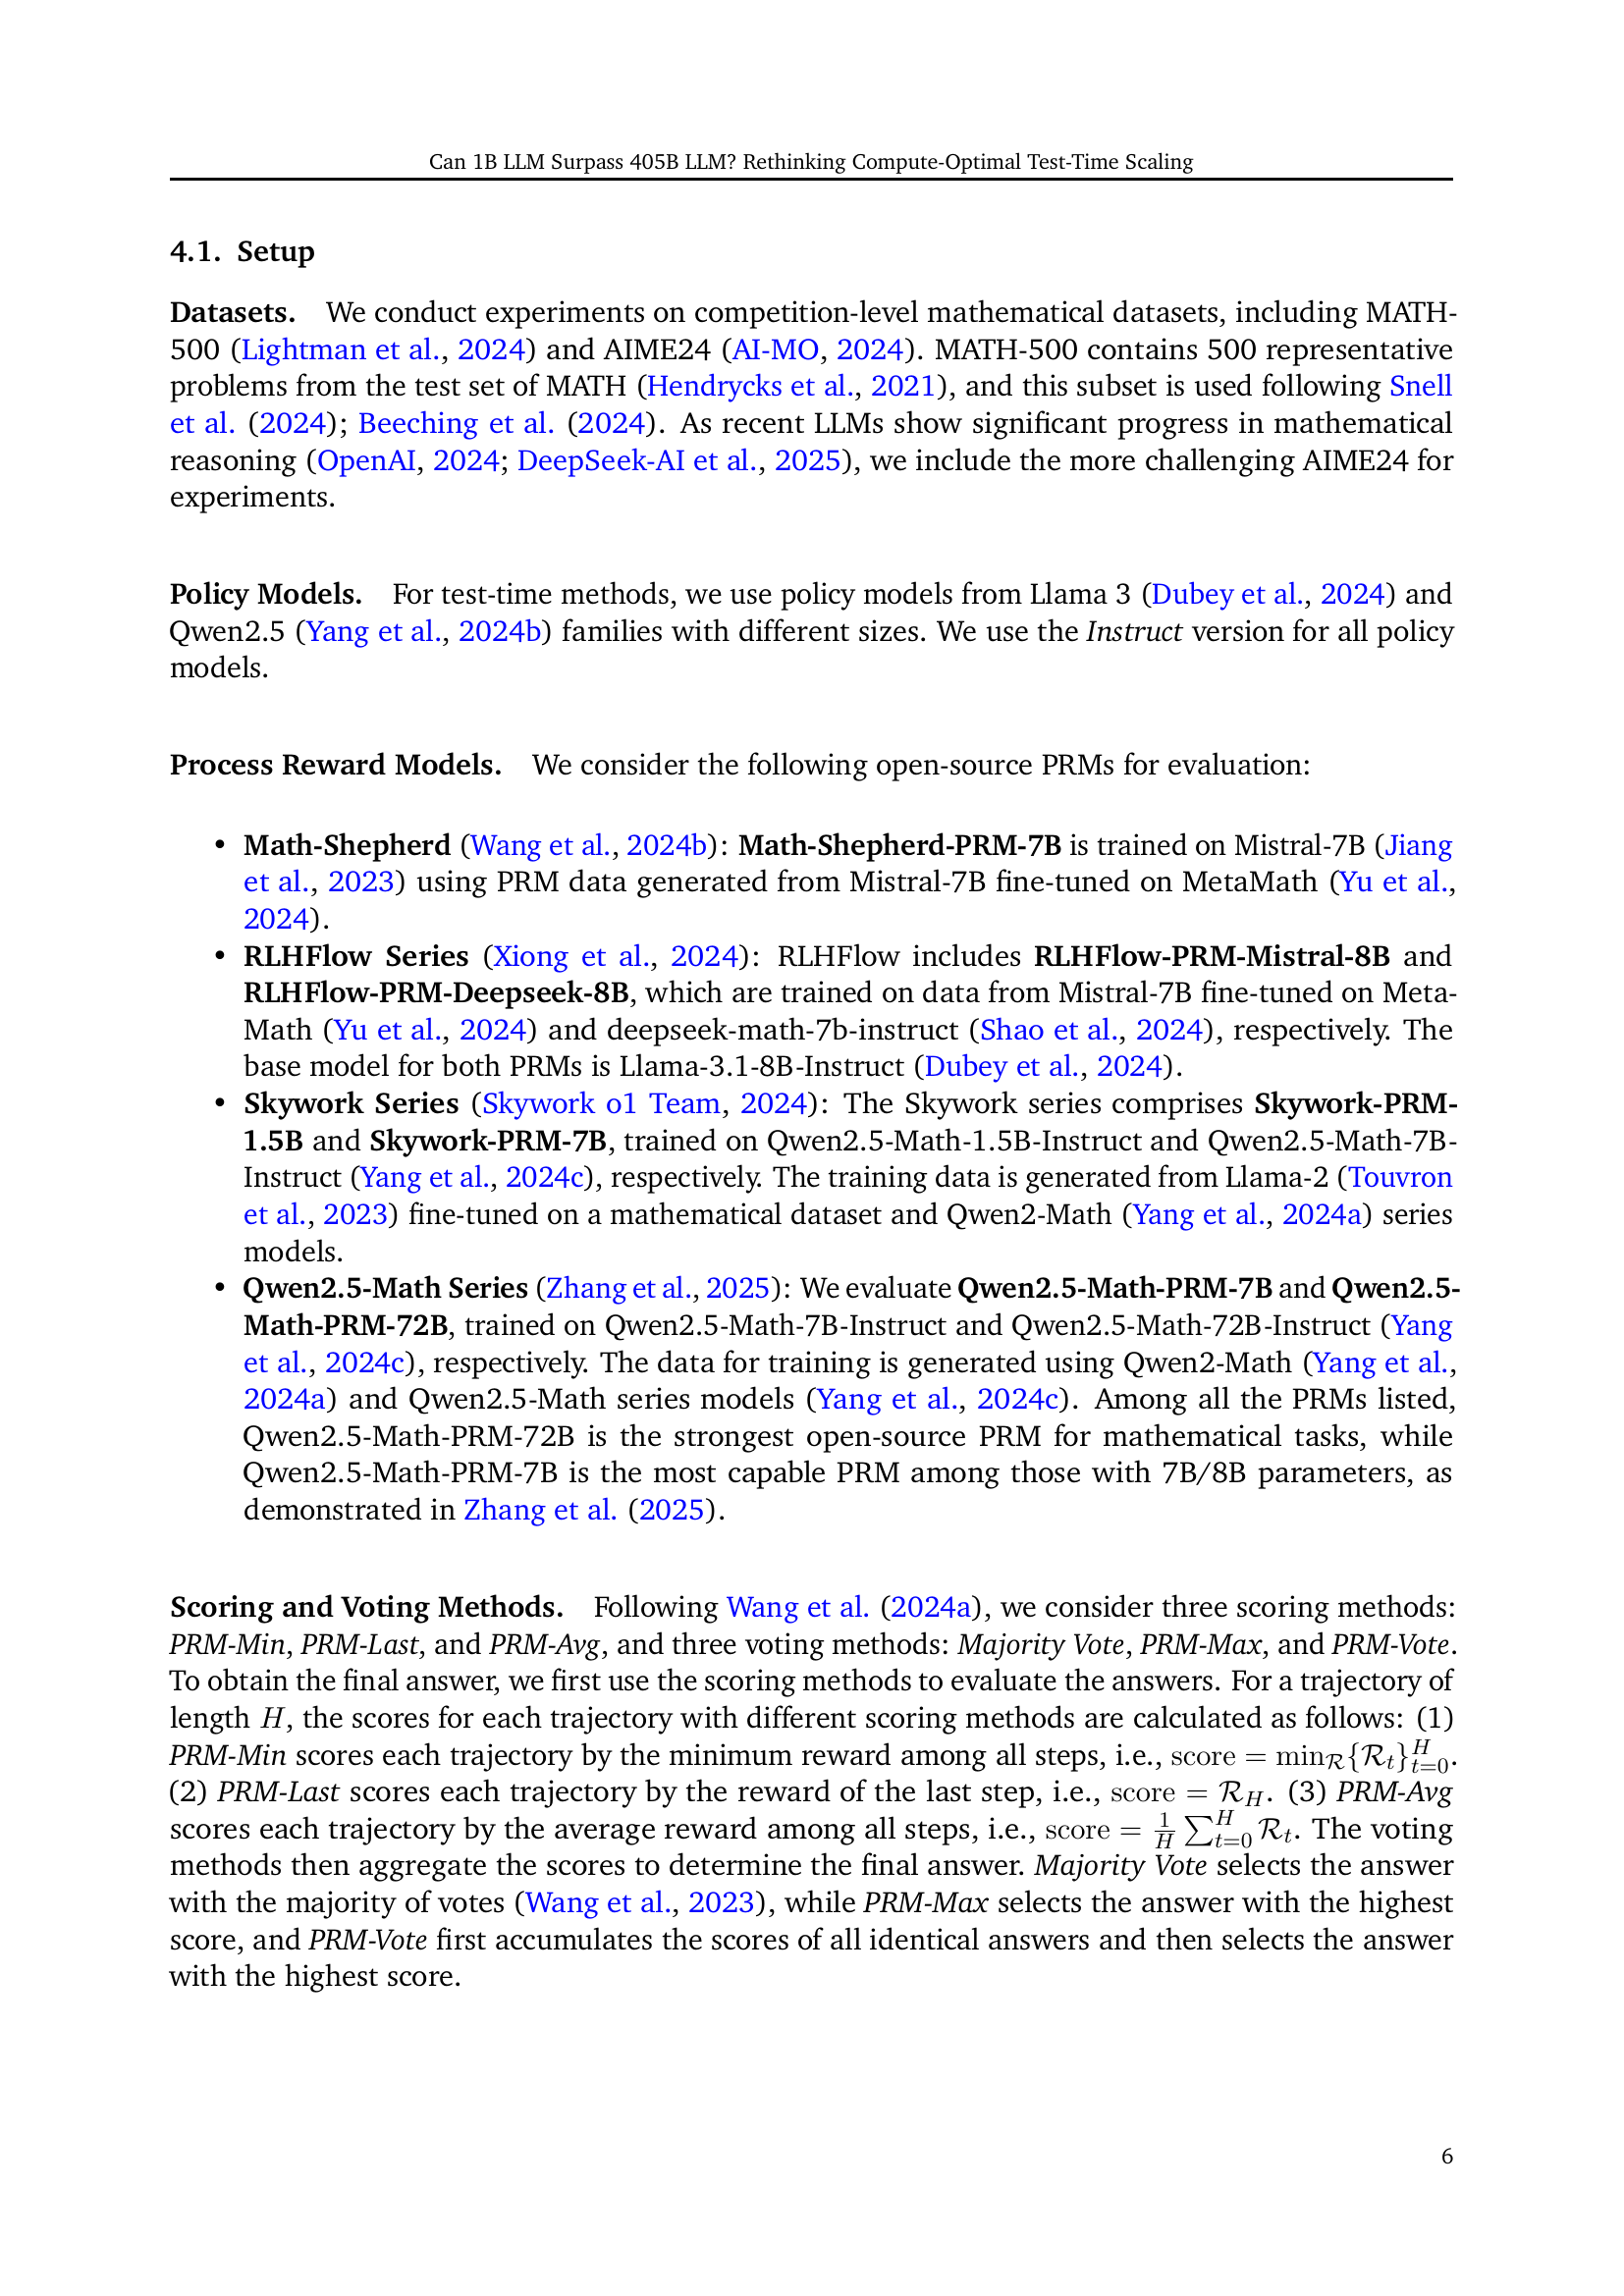
🔼 This figure showcases the performance comparison of Llama-3.1-8B-Instruct and Qwen2.5-7B-Instruct models on the MATH-500 dataset using various process reward models (PRMs) and test-time scaling (TTS) strategies. Different TTS methods, namely Majority Voting, Best-of-N, Beam Search, and Diverse Verifier Tree Search (DVTS), are applied to each model with different compute budgets. The x-axis likely represents the compute budget, while the y-axis shows the accuracy (Pass@k), illustrating the effect of PRMs and TTS strategies on the model’s performance. The purpose is to demonstrate how various PRMs and TTS techniques impact the performance of the models on the MATH-500 tasks.
read the caption
Figure 4: Performance of Llama-3.1-8B-Instruct and Qwen2.5-7B-Instruct on MATH-500 with different PRMs and TTS strategies.

🔼 This figure displays the performance comparison of Llama-3.1-8B-Instruct and Qwen2.5-7B-Instruct language models on the AIME24 dataset, using different process reward models (PRMs) and test-time scaling (TTS) strategies. It visually represents how various combinations of models, PRMs, and TTS methods affect the accuracy (Pass@k) of the language models. The graph likely shows the performance across different compute budgets, highlighting the impact of each PRM and TTS strategy on performance.
read the caption
Figure 5: Performance of Llama-3.1-8B-Instruct and Qwen2.5-7B-Instruct on AIME24 with different PRMs and TTS strategies.

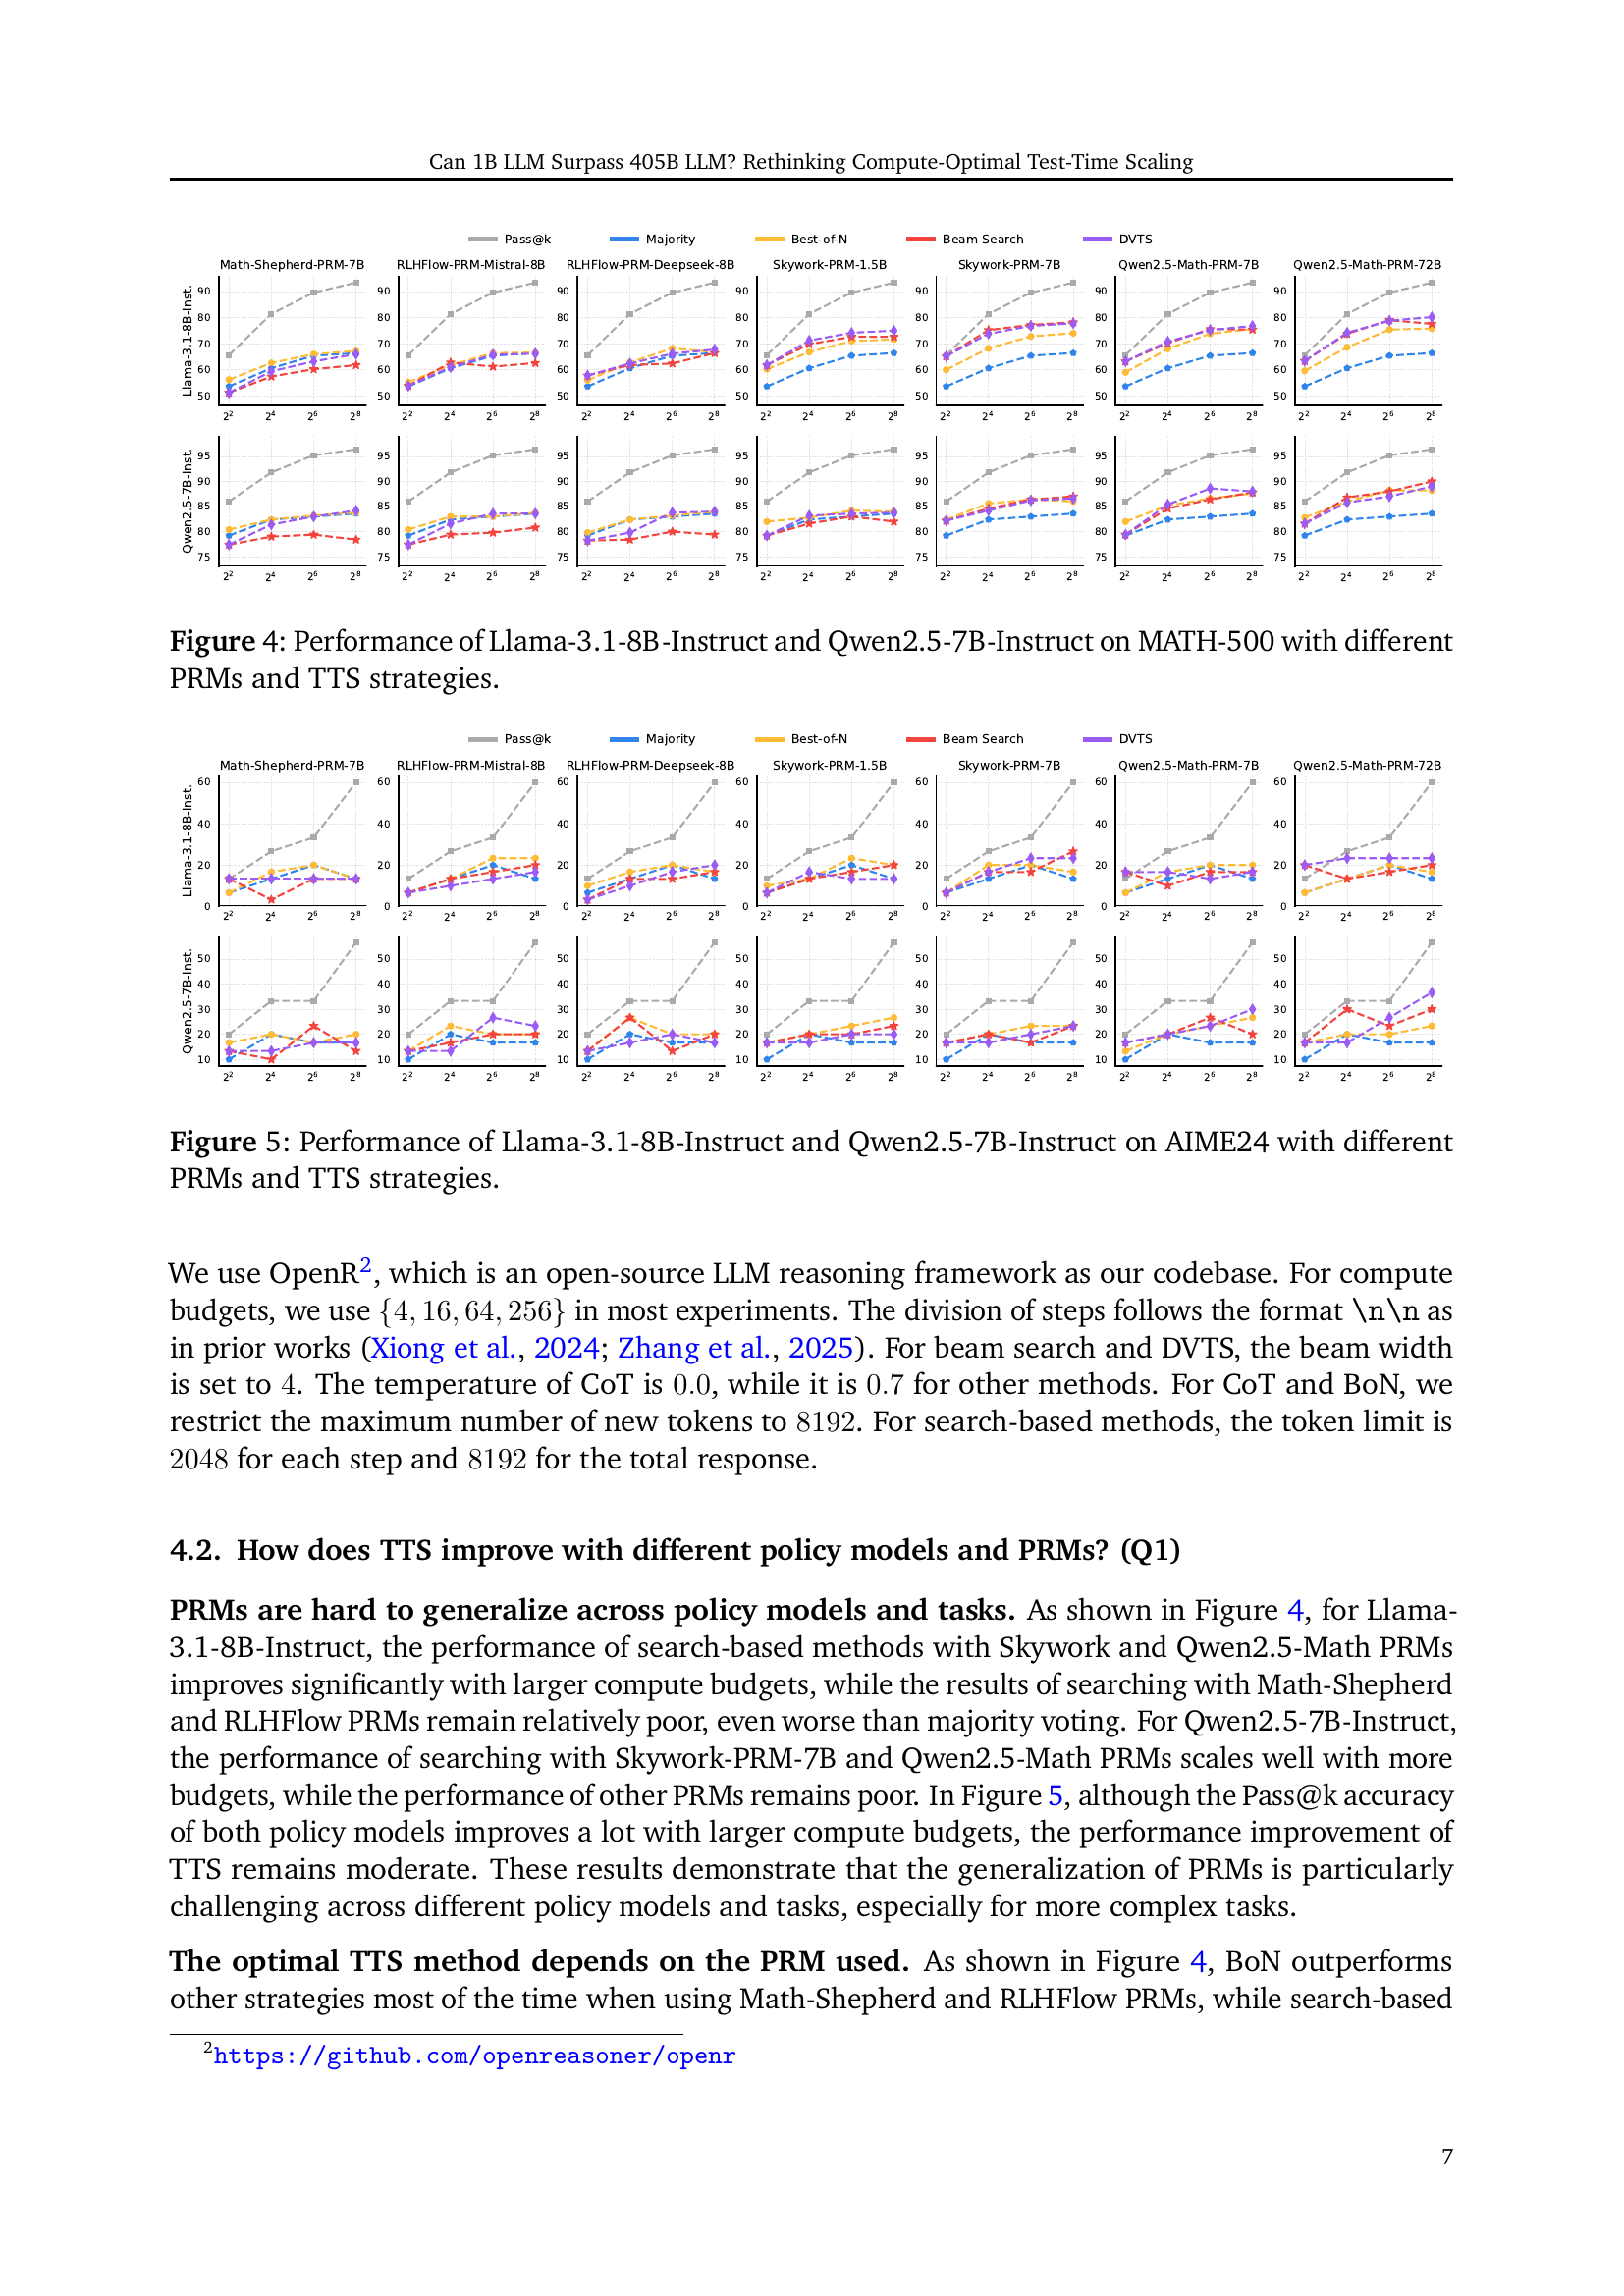
🔼 Figure 6 illustrates the correlation between the performance of Test-Time Scaling (TTS) and the process supervision capabilities of various Process Reward Models (PRMs) on the MATH dataset. The x-axis represents the process supervision ability score of each PRM, while the y-axis shows the corresponding TTS performance. Each data point is a PRM, with the circle’s size proportional to the number of parameters in that PRM. The fitted curve visually represents the trend of this relationship. This demonstrates how better process supervision provided by a PRM generally correlates with better TTS results.
read the caption
Figure 6: The relationship between TTS performance and process supervision abilities of different PRMs on MATH, where the size of each circle represents the number of parameters of the PRM and the curve represents the fitted function.

🔼 Figure 7 presents the results of applying Test-Time Scaling (TTS) strategies to various language models (LMs) of different sizes, ranging from 0.5B to 72B parameters, and evaluating their performance on the MATH-500 dataset. The figure displays how different TTS approaches (Best-of-N, Beam Search, and Diverse Verifier Tree Search) impact the accuracy of these models. The results demonstrate the relationship between model size and the optimal TTS strategy for achieving high performance on mathematical reasoning tasks. It shows that optimal TTS methods change depending on the size of the language model.
read the caption
Figure 7: TTS performance of policy models with parameters from 0.5B to 72B on MATH-500 with different scaling methods.

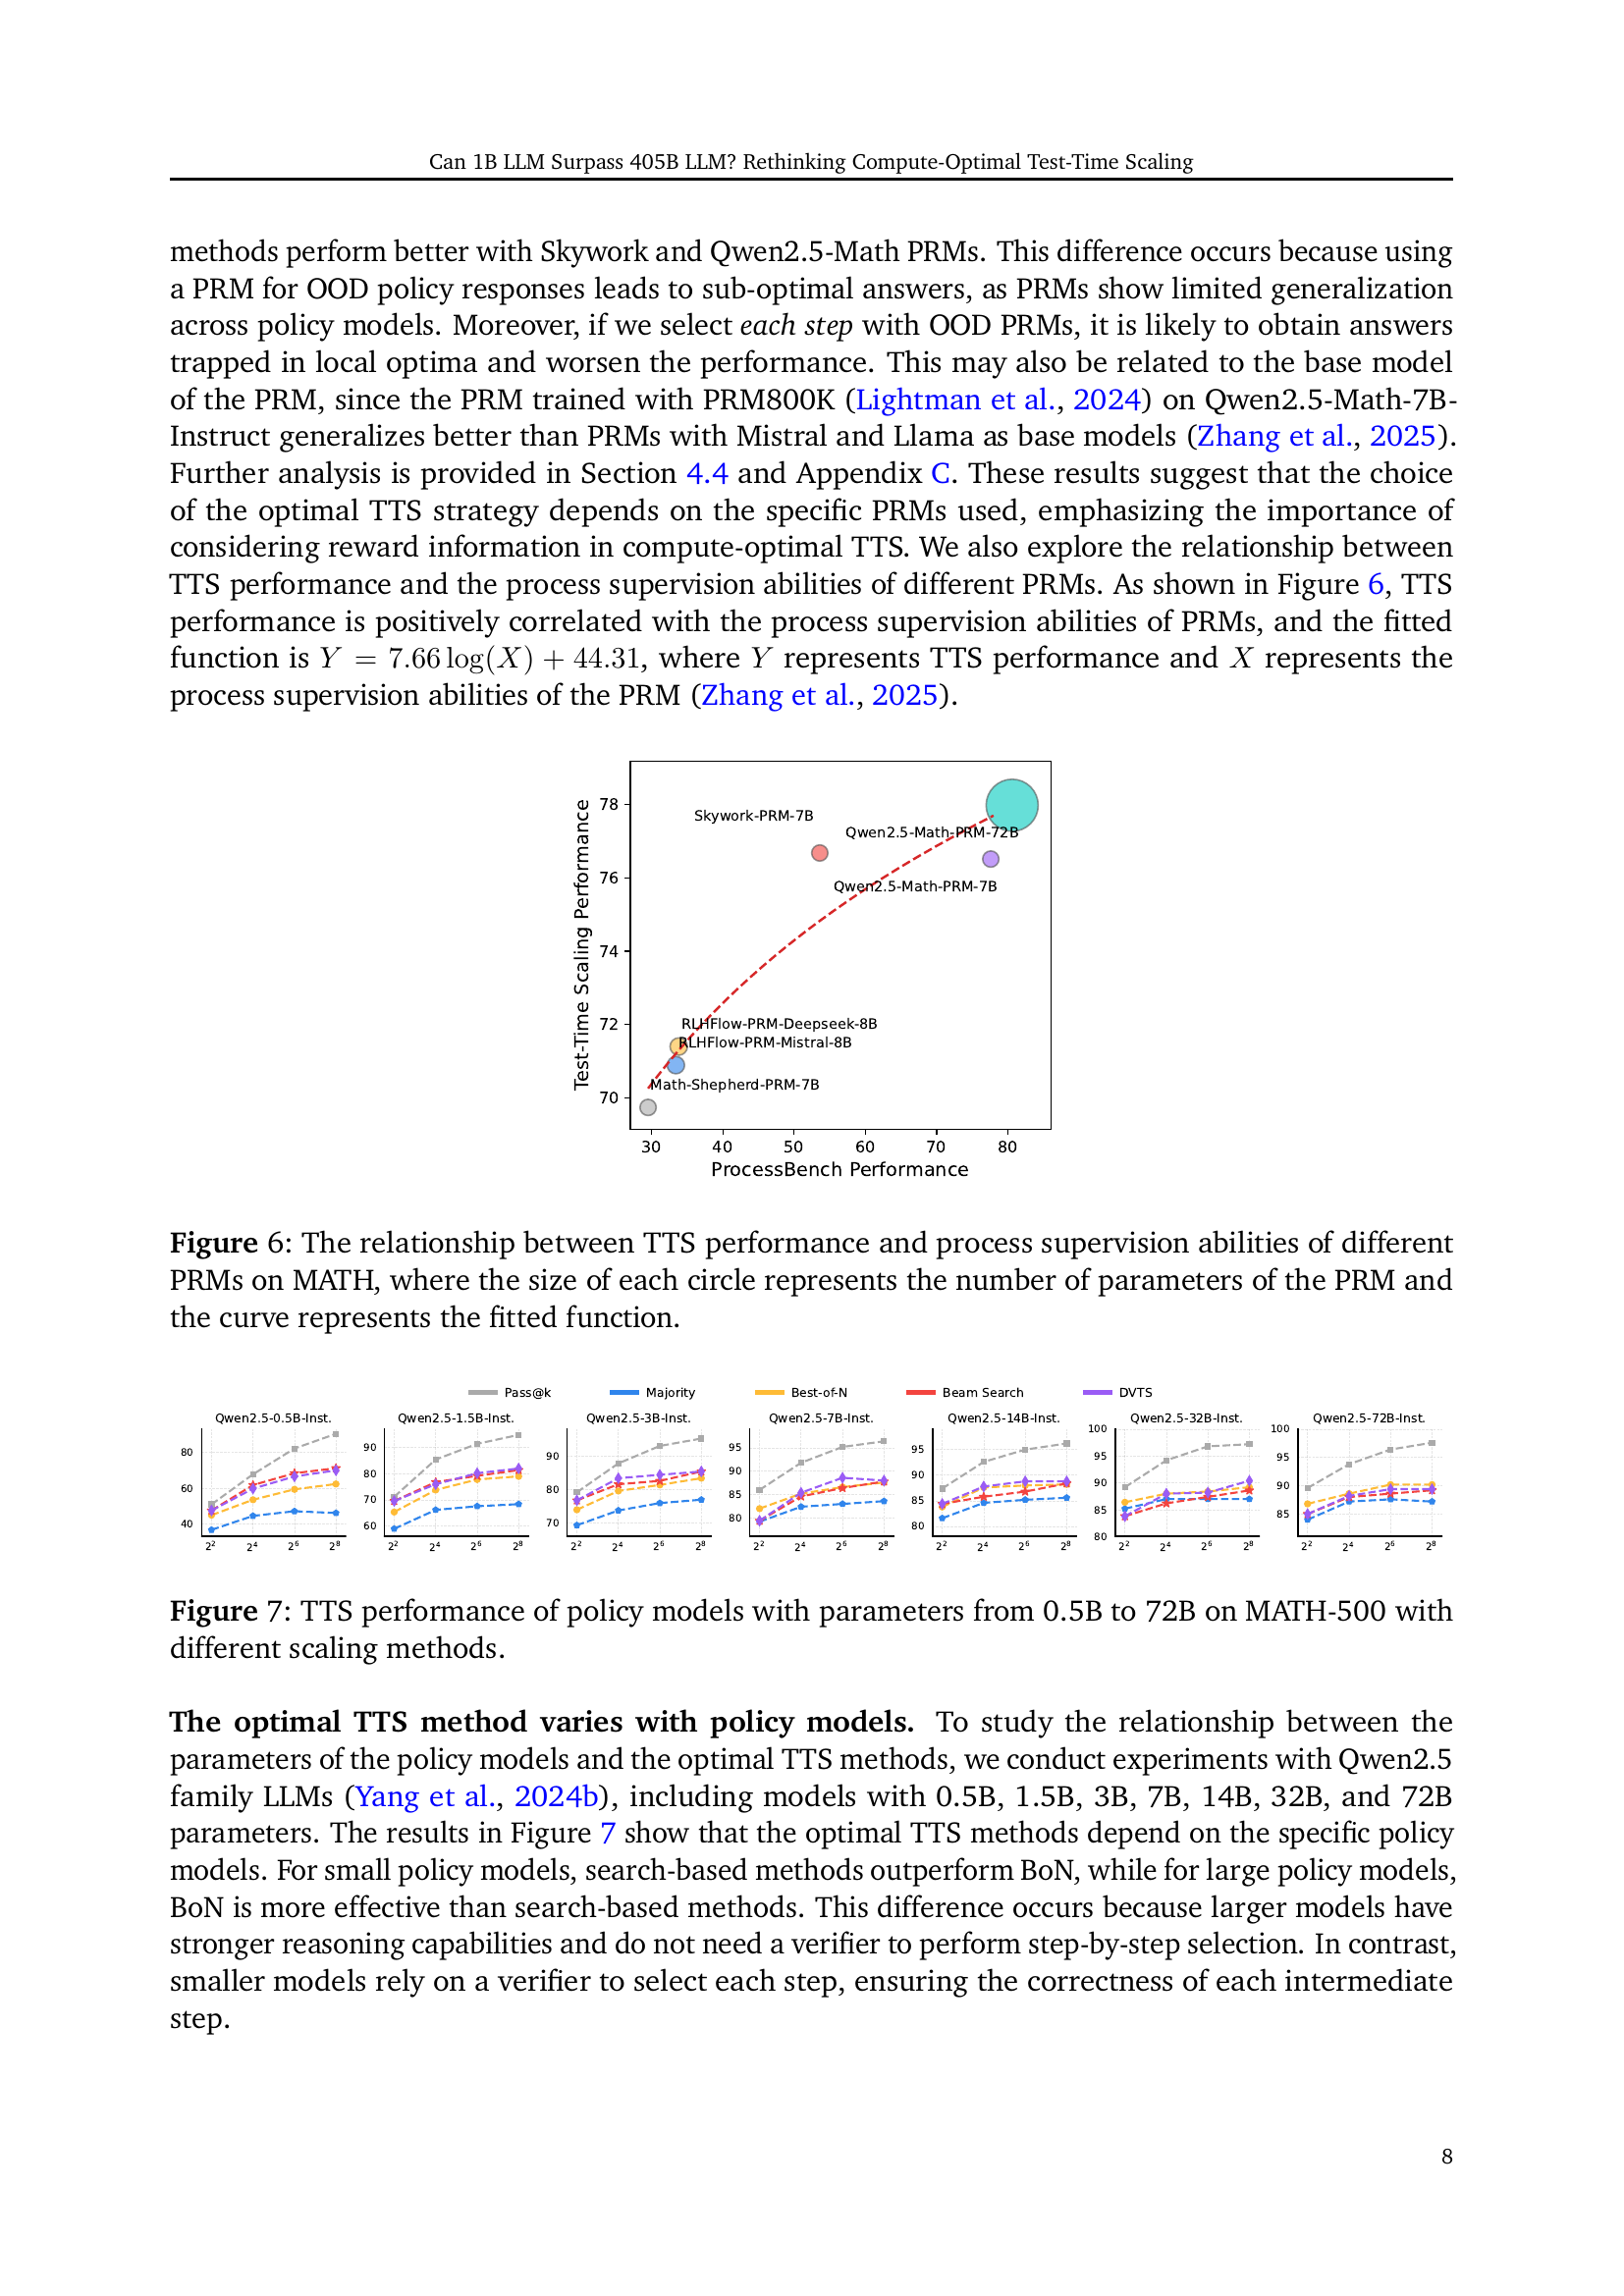
🔼 This figure displays the results of applying Test-Time Scaling (TTS) strategies to three different sized Llama language models (1B, 8B, and 72B parameters) on the MATH-500 dataset. The performance is evaluated across three difficulty levels (easy, medium, hard), each defined by a range of Pass@1 accuracy scores. For each model and difficulty level, the figure shows the Pass@k accuracy achieved by four different TTS methods (Majority Voting, Best-of-N, Beam Search, Diverse Verifier Tree Search) with varying compute budgets (represented by the x-axis). The plot visually demonstrates how the effectiveness of different TTS methods varies depending on the model size and problem difficulty. It helps to determine the best strategy based on these parameters.
read the caption
Figure 8: TTS performance of three Llama policy models on MATH-500 with three difficulty levels.

🔼 Figure 9 presents the results of Test-Time Scaling (TTS) experiments conducted on the MATH-500 dataset using three different Llama language models. The models vary in size, and the results are broken down by three difficulty levels of problems (easy, medium, hard). The plot likely shows the accuracy (Pass@k - probably Pass@1) achieved by each model at different computational budgets using several TTS strategies (Majority voting, Best-of-N, Beam Search, Diverse Verifier Tree Search). This allows for an analysis of how different TTS approaches perform under various computational costs and across problems of varying complexity, especially for smaller language models.
read the caption
Figure 9: TTS performance of three Llama policy models on MATH-500 with different difficulty levels.

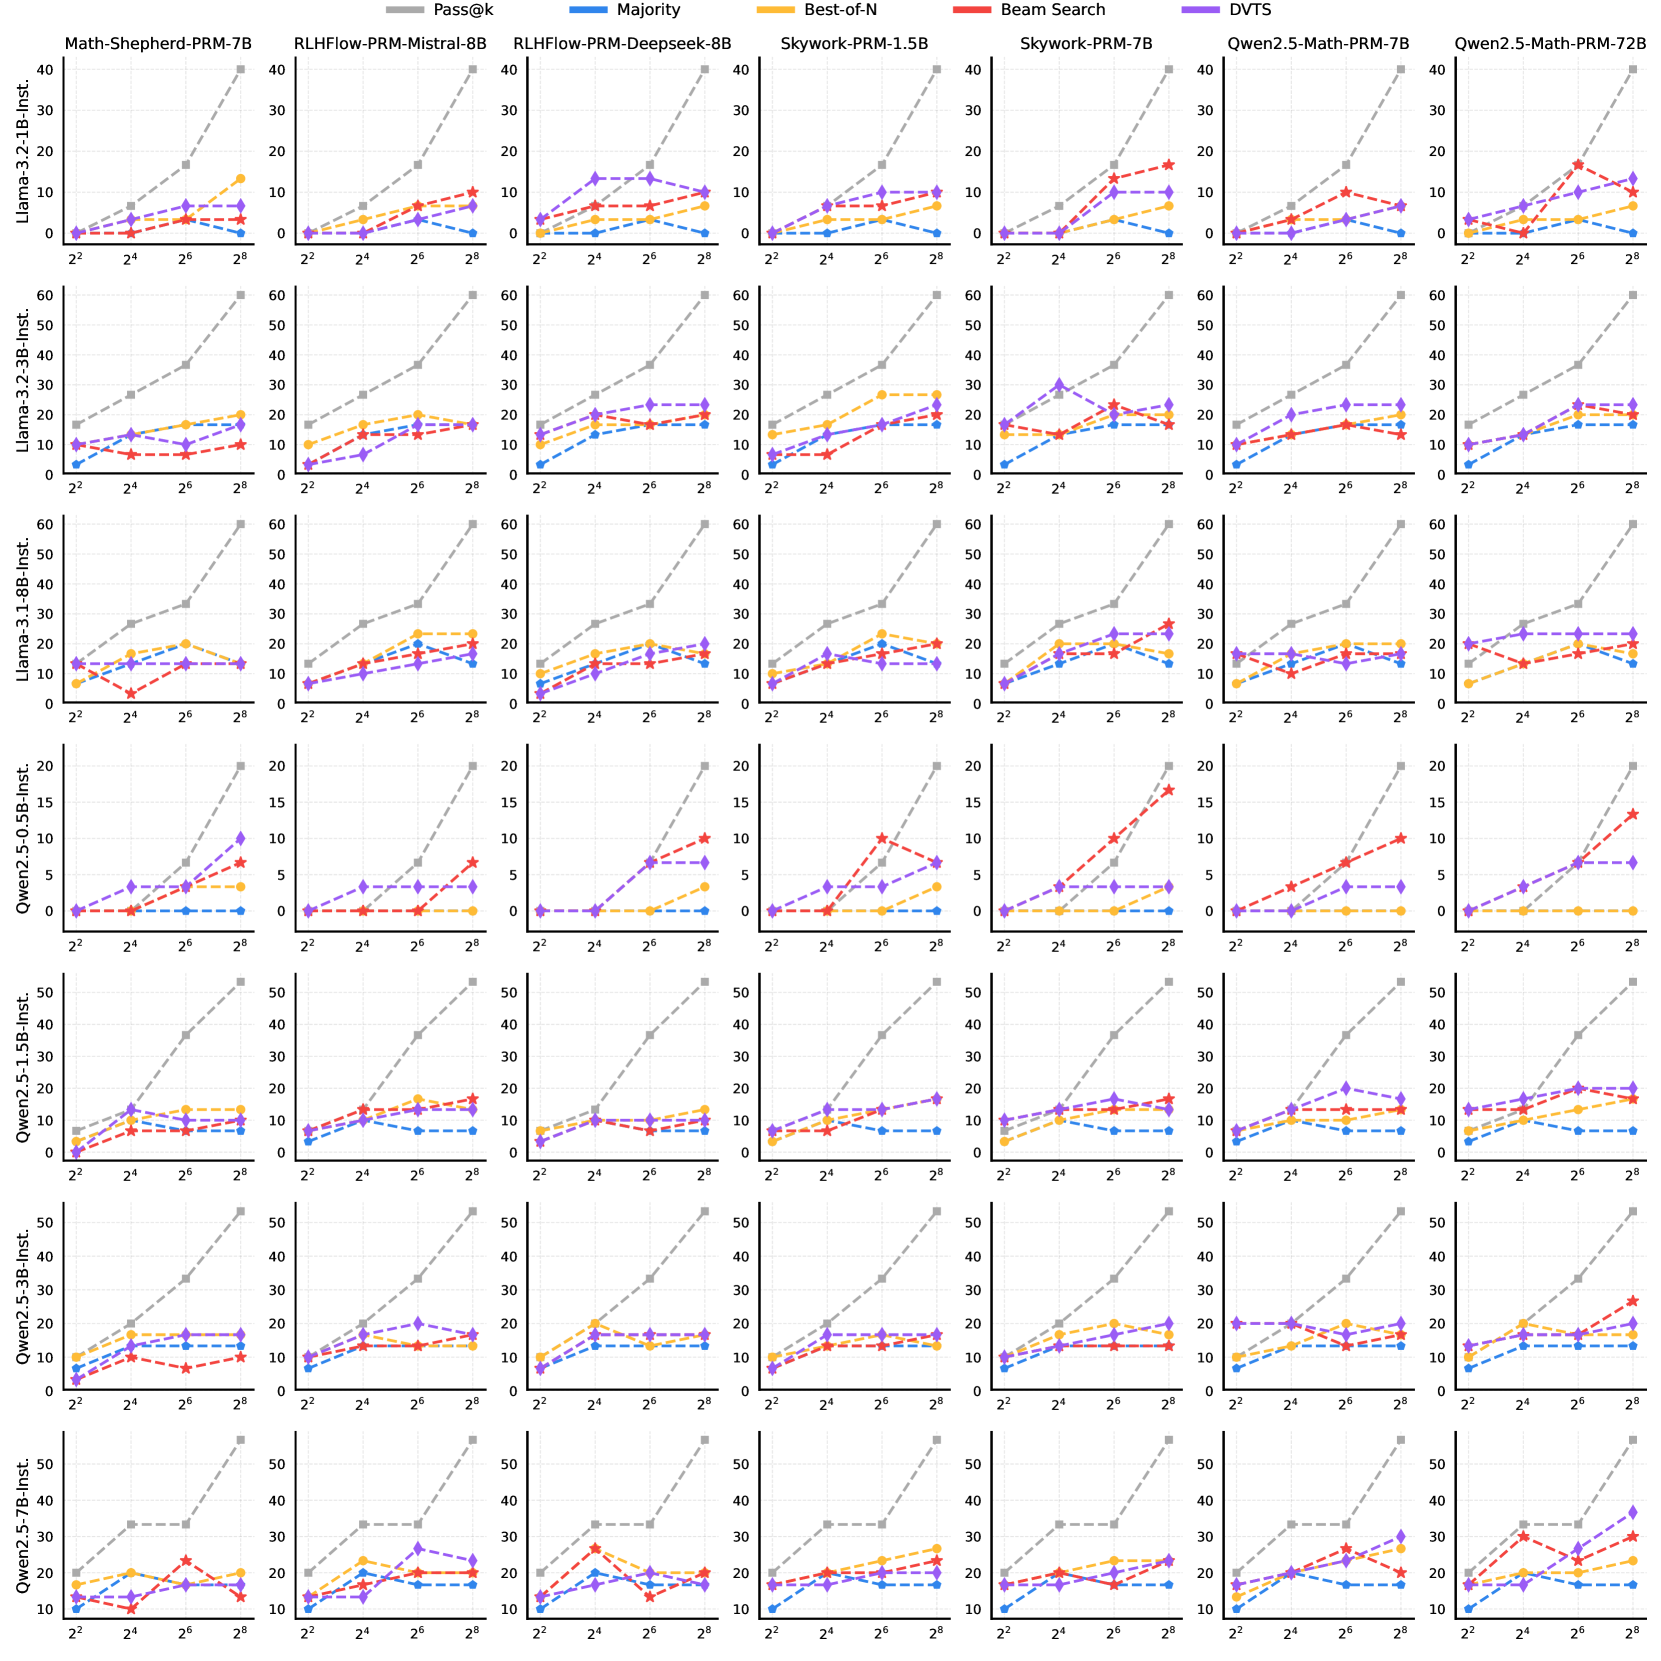
🔼 This figure displays the results of Test-Time Scaling (TTS) experiments conducted on the MATH-500 dataset. It shows how the performance (Pass@k accuracy) of various Large Language Models (LLMs, the ‘policy models’) changes when using different Process Reward Models (PRMs) and scaling strategies (such as Best-of-N, Beam Search, and Diverse Verifier Tree Search). The x-axis represents the compute budget (number of steps/tokens), while the y-axis shows the accuracy. Different colors represent different policy models, and each group of bars represents a specific PRM. This visualization helps to understand the impact of different TTS hyperparameters on the performance of various LLMs when applied to a mathematical reasoning task.
read the caption
Figure 10: TTS performance of different policy models on MATH-500 with different PRMs and scaling strategies.
🔼 Figure 11 presents a comprehensive analysis of Test-Time Scaling (TTS) performance across various Large Language Models (LLMs) on the challenging AIME24 mathematical reasoning dataset. The figure systematically evaluates different policy models (LLMs used for generating solutions), Process Reward Models (PRMs; models used for evaluating solutions), and scaling strategies (methods for allocating compute during inference). The results reveal the intricate interplay between these components and highlight the dependence of optimal TTS performance on the specific combination of policy model, PRM, and scaling method employed. This detailed breakdown offers valuable insights into the conditions under which TTS proves most effective for enhancing LLM reasoning capabilities.
read the caption
Figure 11: TTS performance of different policy models on AIME24 with different PRMs and scaling strategies.

🔼 This figure presents a toy example to illustrate the beam search process using two different process reward models (PRMs): RLHFlow-Mistral-PRM-8B and RLHFlow-Deepseek-PRM-8B. The example shows how each PRM assigns scores to intermediate steps during the beam search for a mathematical problem, ultimately leading to different final answers. This highlights the impact of PRM choice on the reasoning process and the resulting solution. The figure demonstrates the differences in the quality of intermediate steps scored by each PRM and how these differences affect the final outcome of the beam search.
read the caption
Figure 12: Toy case of beam search with RLHFlow-Mistral-PRM-8B and RLHFlow-Deepseek-PRM-8B.

🔼 This figure showcases an example of ‘Over-Criticism’ in Test-Time Scaling (TTS). The model, using the prime factorization method to simplify the square root of 242, produces mathematically correct steps. However, the Process Reward Model (PRM) assigns surprisingly low scores to these correct steps, even though the solution’s logic and calculations are sound. This illustrates a scenario where the PRM is overly critical, penalizing correct reasoning, and potentially hindering the overall performance of the TTS strategy. The low scores assigned by the PRM despite the correct steps highlight a potential flaw in the PRM’s evaluation criteria, incorrectly discounting accurate work.
read the caption
Figure 13: TTS case of Over-Criticism.

🔼 This figure shows a test-time scaling (TTS) example where the model makes a mathematical error but receives a high score from the process reward model (PRM). The problem involves finding the length of a side of a right triangle given the sine of an angle and the length of another side. The model correctly uses the sine formula but makes an error when simplifying the resulting equation, which leads to an incorrect answer, yet the PRM assigns a high score, demonstrating that the PRM has difficulty correctly identifying mathematical errors.
read the caption
Figure 14: TTS case of Error Neglect.

🔼 This figure shows a test-time scaling (TTS) example where the model makes a reasoning error but the process reward model (PRM) fails to assign a low score to it, resulting in an incorrect answer. The problem involves trigonometry, and although the model’s solution has a mathematical error (incorrect trigonometric relationship), the PRM does not give a low score. This highlights the issue of the PRM neglecting errors during the reasoning process, and demonstrates the need for more robust methods for evaluating the quality of intermediate steps in TTS.
read the caption
Figure 15: TTS case of Error Neglect.

🔼 This figure showcases a case study within the Test-Time Scaling (TTS) method, highlighting an issue called ‘Error Localization Bias’. The example problem involves finding the intersection point of tangents to a circle. The model’s reasoning process is visualized step-by-step, revealing that the reward model (PRM) assigns lower scores to intermediate steps that aren’t where the actual mathematical errors occur. This bias affects the overall accuracy of the TTS method, indicating a misalignment between where the PRM assigns low scores and the location of genuine mistakes in the reasoning. The figure demonstrates how these scoring discrepancies can lead to incorrect solutions even if other parts of the solution are mathematically sound.
read the caption
Figure 16: TTS case of Error Localization Bias.

🔼 This figure shows a specific example where the scoring system used in Test-Time Scaling (TTS) exhibits bias, unfairly penalizing correct reasoning steps. The example involves a word problem about redistributing coins across bags. The model correctly determines the solution and the steps to achieve it. However, the scoring mechanism gives low scores to several intermediate steps even though those steps are mathematically sound and contribute to the correct final answer. This bias toward certain step lengths or solution formats leads to inaccurate scoring, making the TTS process less reliable and potentially affecting the overall outcome.
read the caption
Figure 17: TTS case of Scoring Bias.

🔼 This figure shows a case where the scoring mechanism of the Test-Time Scaling (TTS) method exhibits bias. The problem involves redistributing coins among bags, and the model’s scoring reflects this bias. The model generates several steps with a higher score despite mathematical errors. The final answer is correct but the scoring does not accurately reflect the correctness of intermediate reasoning steps.
read the caption
Figure 18: TTS case of Scoring Bias.
More on tables
| Skywork-PRM-7B | Qwen2.5-Math-PRM-7B | |
| Majority Vote | 86.8 | 87.6 |
| PRM-Min-Max | 83.0 | 87.4 |
| PRM-Min-Vote | 86.6 | 87.6 |
| PRM-Last-Max | 84.4 | 87.6 |
| PRM-Last-Vote | 87.0 | 87.6 |
| PRM-Avg-Max | 85.8 | 87.8 |
| PRM-Avg-Vote | 86.8 | 87.6 |
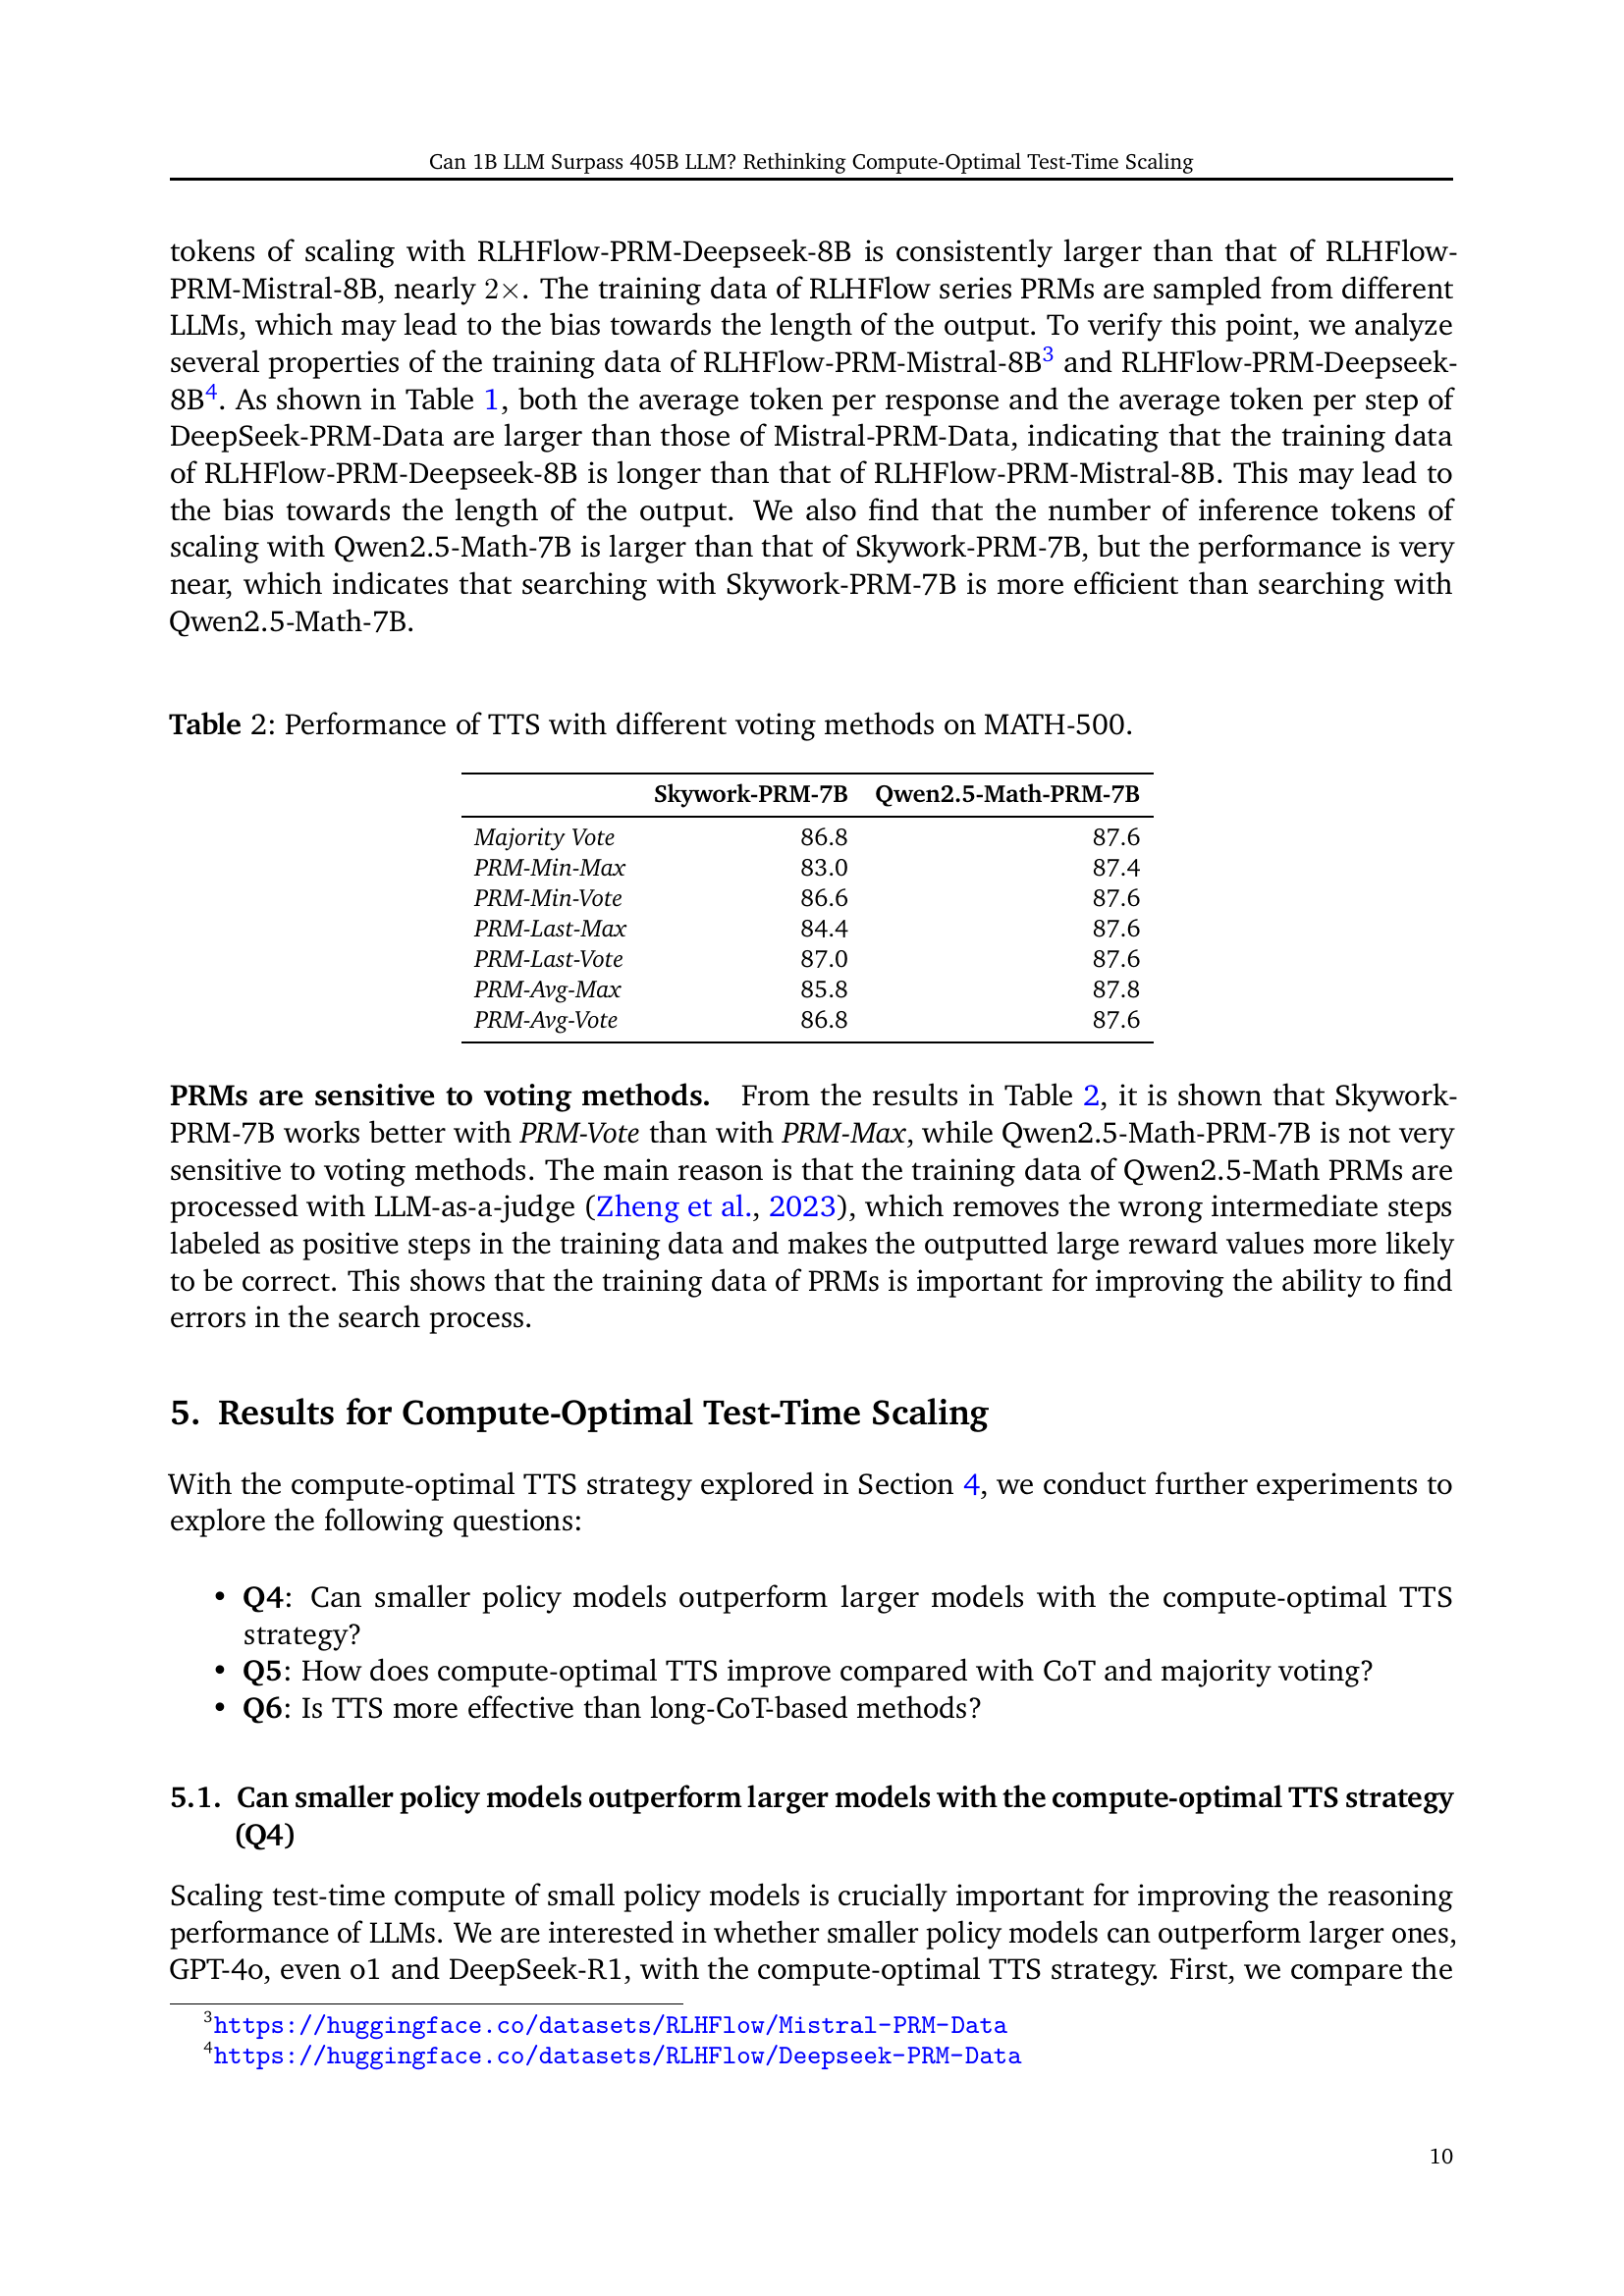
🔼 This table presents the performance comparison of different voting methods used in Test-Time Scaling (TTS) on the MATH-500 dataset. It shows the accuracy (Pass@k) achieved by different voting methods (Majority Vote, PRM-Min-Max, PRM-Min-Vote, PRM-Last-Max, PRM-Last-Vote, PRM-Avg-Max, PRM-Avg-Vote) when combined with two specific process reward models (PRMs): Skywork-PRM-7B and Qwen2.5-Math-PRM-7B. The results highlight the influence of the chosen voting method on the overall performance of the TTS strategy.
read the caption
Table 2: Performance of TTS with different voting methods on MATH-500.
| Policy Model | MATH-500 | AIME24 | Avg. |
| Proprietary LLMs (CoT) | |||
| GPT-4o | 74.6 | 9.3 | 42.0 |
| o1-preview | 85.5 | 44.6 | 65.1 |
| o1-mini | 90.0 | 63.6 | 76.8 |
| o1 | 94.8 | 79.2 | 87.0 |
| Open-Source LLMs (CoT) | |||
| Llama-3.1-70B-Inst. | 65.2 | 16.7 | 41.0 |
| Llama-3.1-405B-Inst. | 71.4 | 23.3 | 47.4 |
| QwQ-32B-Preview | 90.6 | 50.0 | 70.3 |
| DeepSeek-R1 | 97.3 | 79.8 | 88.6 |
| Open-Source LLMs (TTS) | |||
| Llama-3.2-1B-Inst. | 66.2 | 16.7 | 41.5 |
| Llama-3.2-1B-Inst. () | 72.2 | 10.0 | 41.1 |
| Llama-3.2-3B-Inst. | 75.6 | 30.0 | 52.8 |
| Qwen2.5-0.5B-Inst. | 76.4 | 10.0 | 43.2 |
| Qwen2.5-1.5B-Inst. | 81.8 | 20.0 | 50.9 |
| DeepSeek-R1-Distill-Qwen-1.5B | 91.6 | 63.3 | 77.5 |
| DeepSeek-R1-Distill-Qwen-7B | 95.2 | 83.3 | 89.3 |
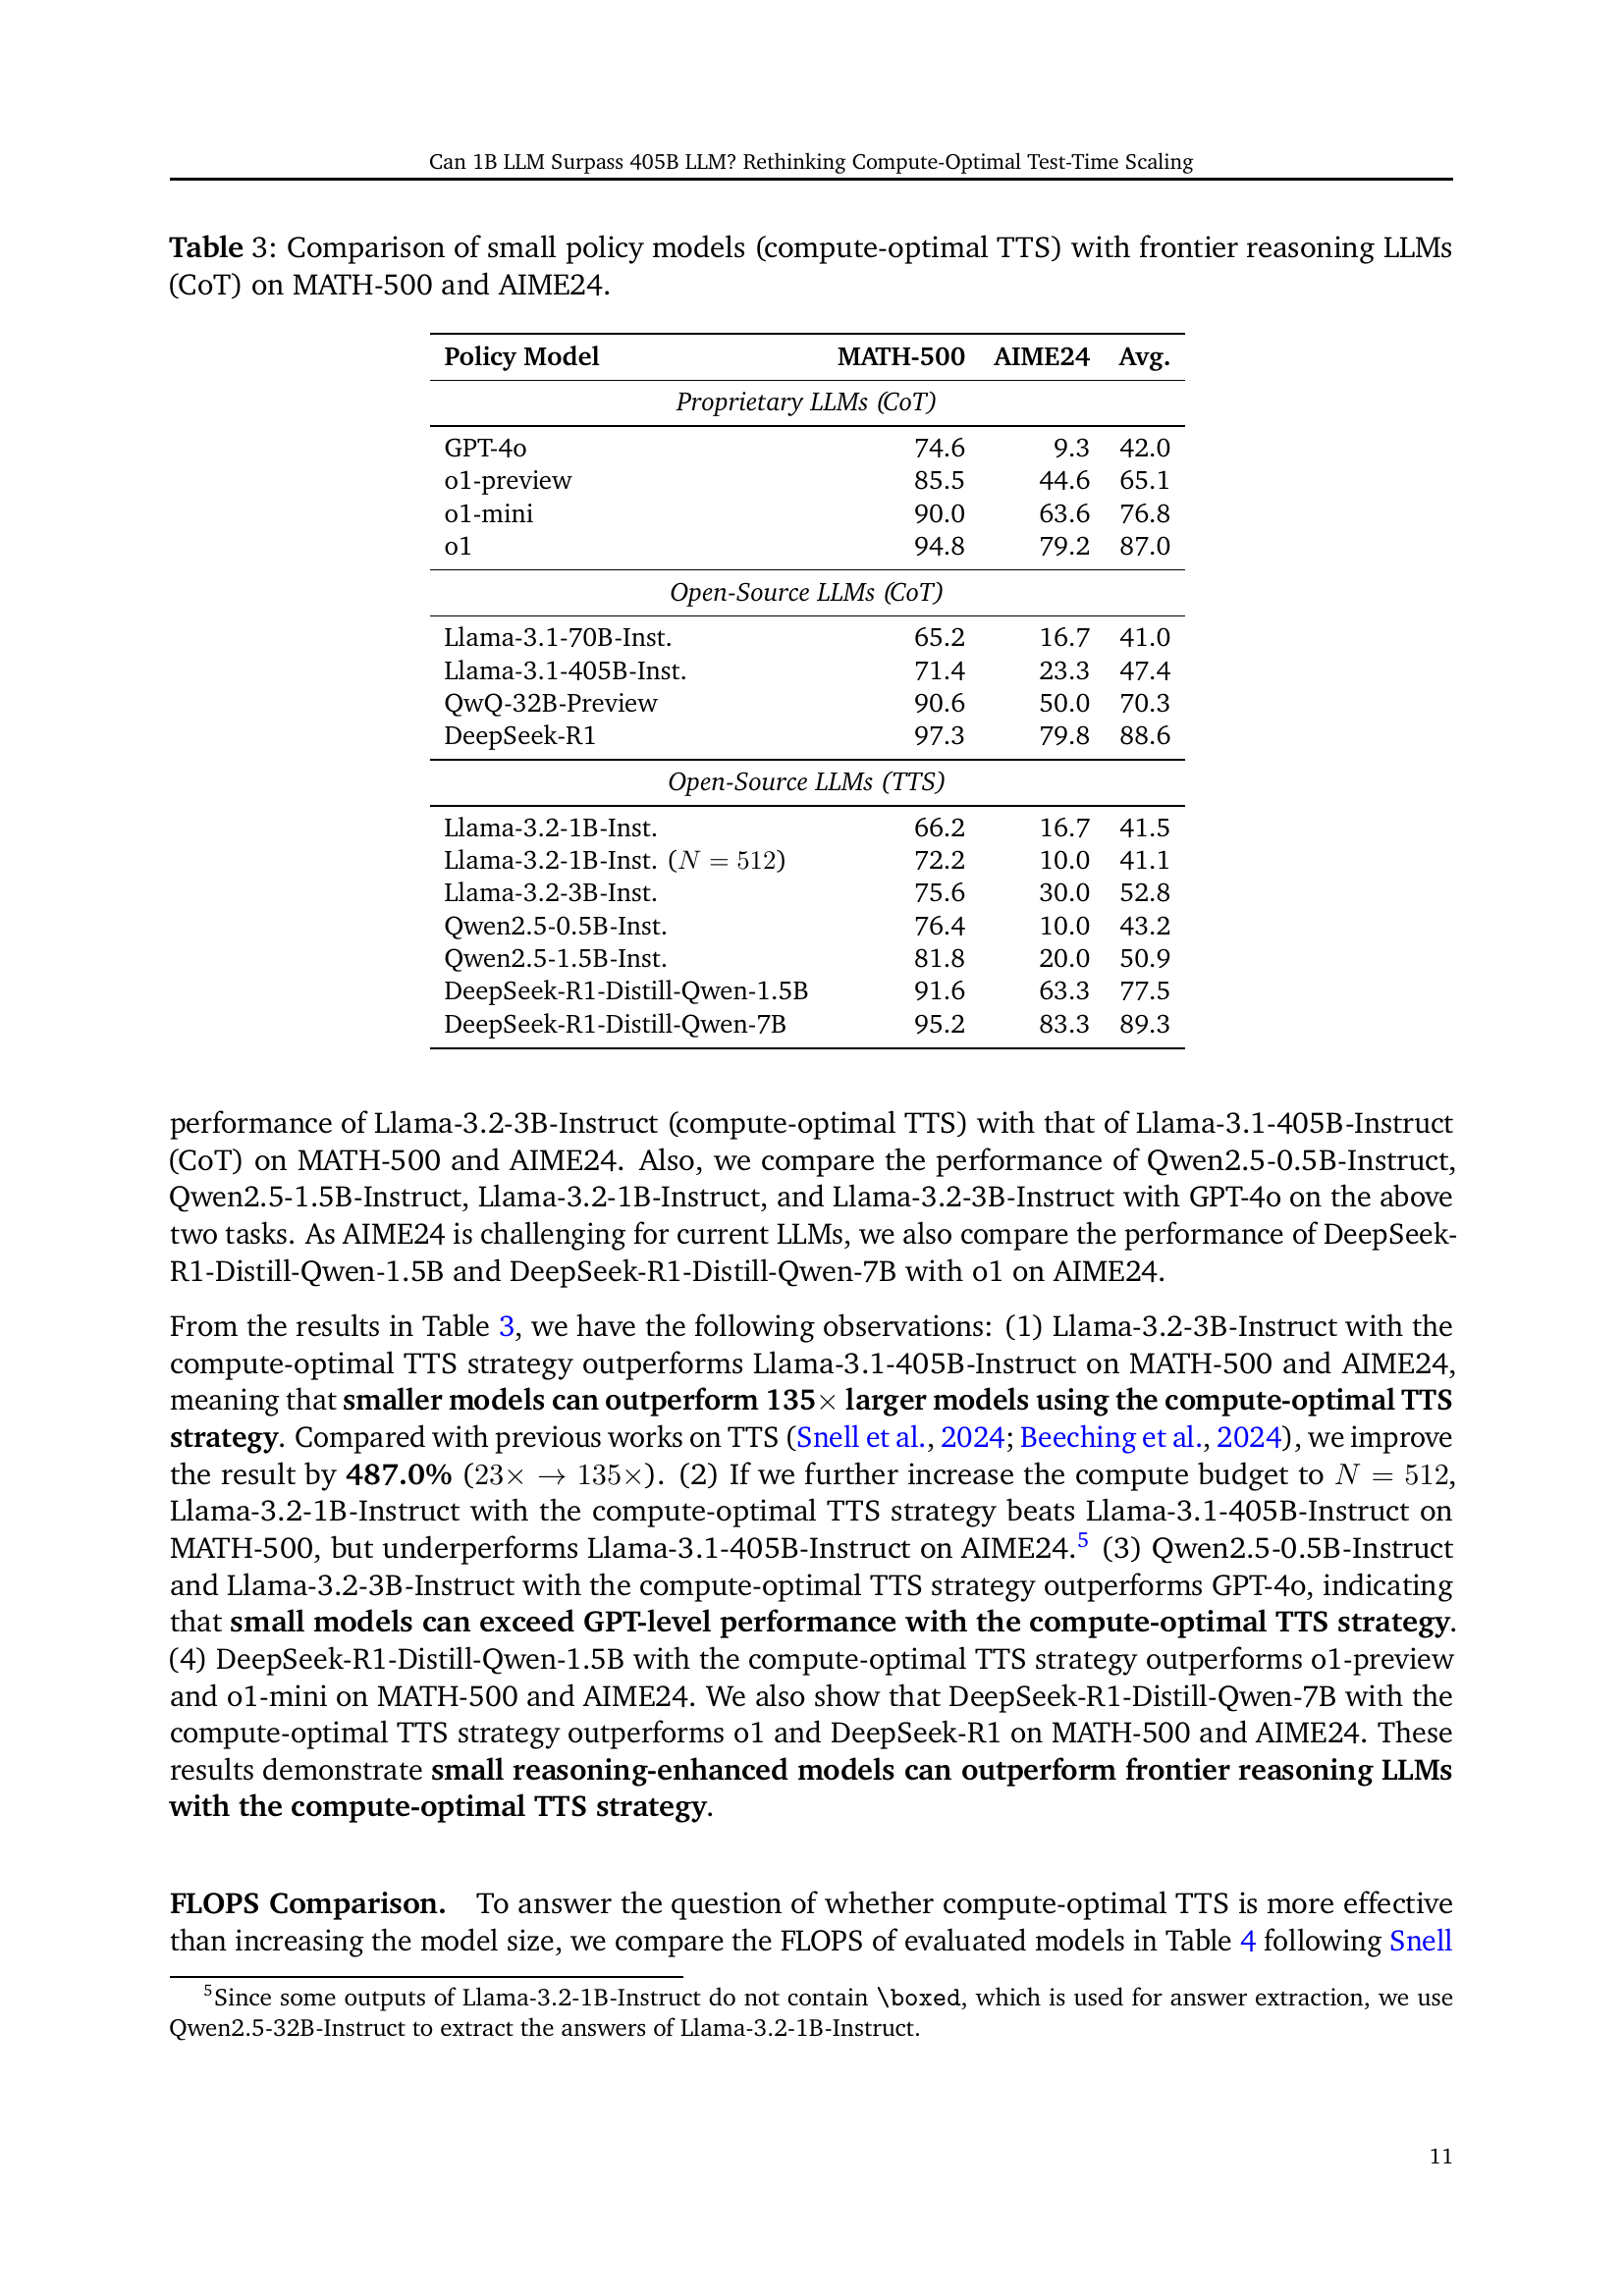
🔼 This table compares the performance of smaller language models using a compute-optimal test-time scaling (TTS) strategy against larger, state-of-the-art language models that use chain-of-thought (CoT) reasoning. The comparison is made on two challenging mathematical reasoning datasets: MATH-500 and AIME24. The results demonstrate whether smaller models, enhanced by the TTS strategy, can achieve competitive or even superior performance compared to significantly larger models relying on CoT.
read the caption
Table 3: Comparison of small policy models (compute-optimal TTS) with frontier reasoning LLMs (CoT) on MATH-500 and AIME24.
| Policy Model | Pre-training FLOPS | Inference FLOPS | Total FLOPS. |
| Llama-3.2-3B-Inst. | |||
| Llama-3.1-405B-Inst. | |||
| DeepSeek-R1-Distill-7B | |||
| DeepSeek-R1 |
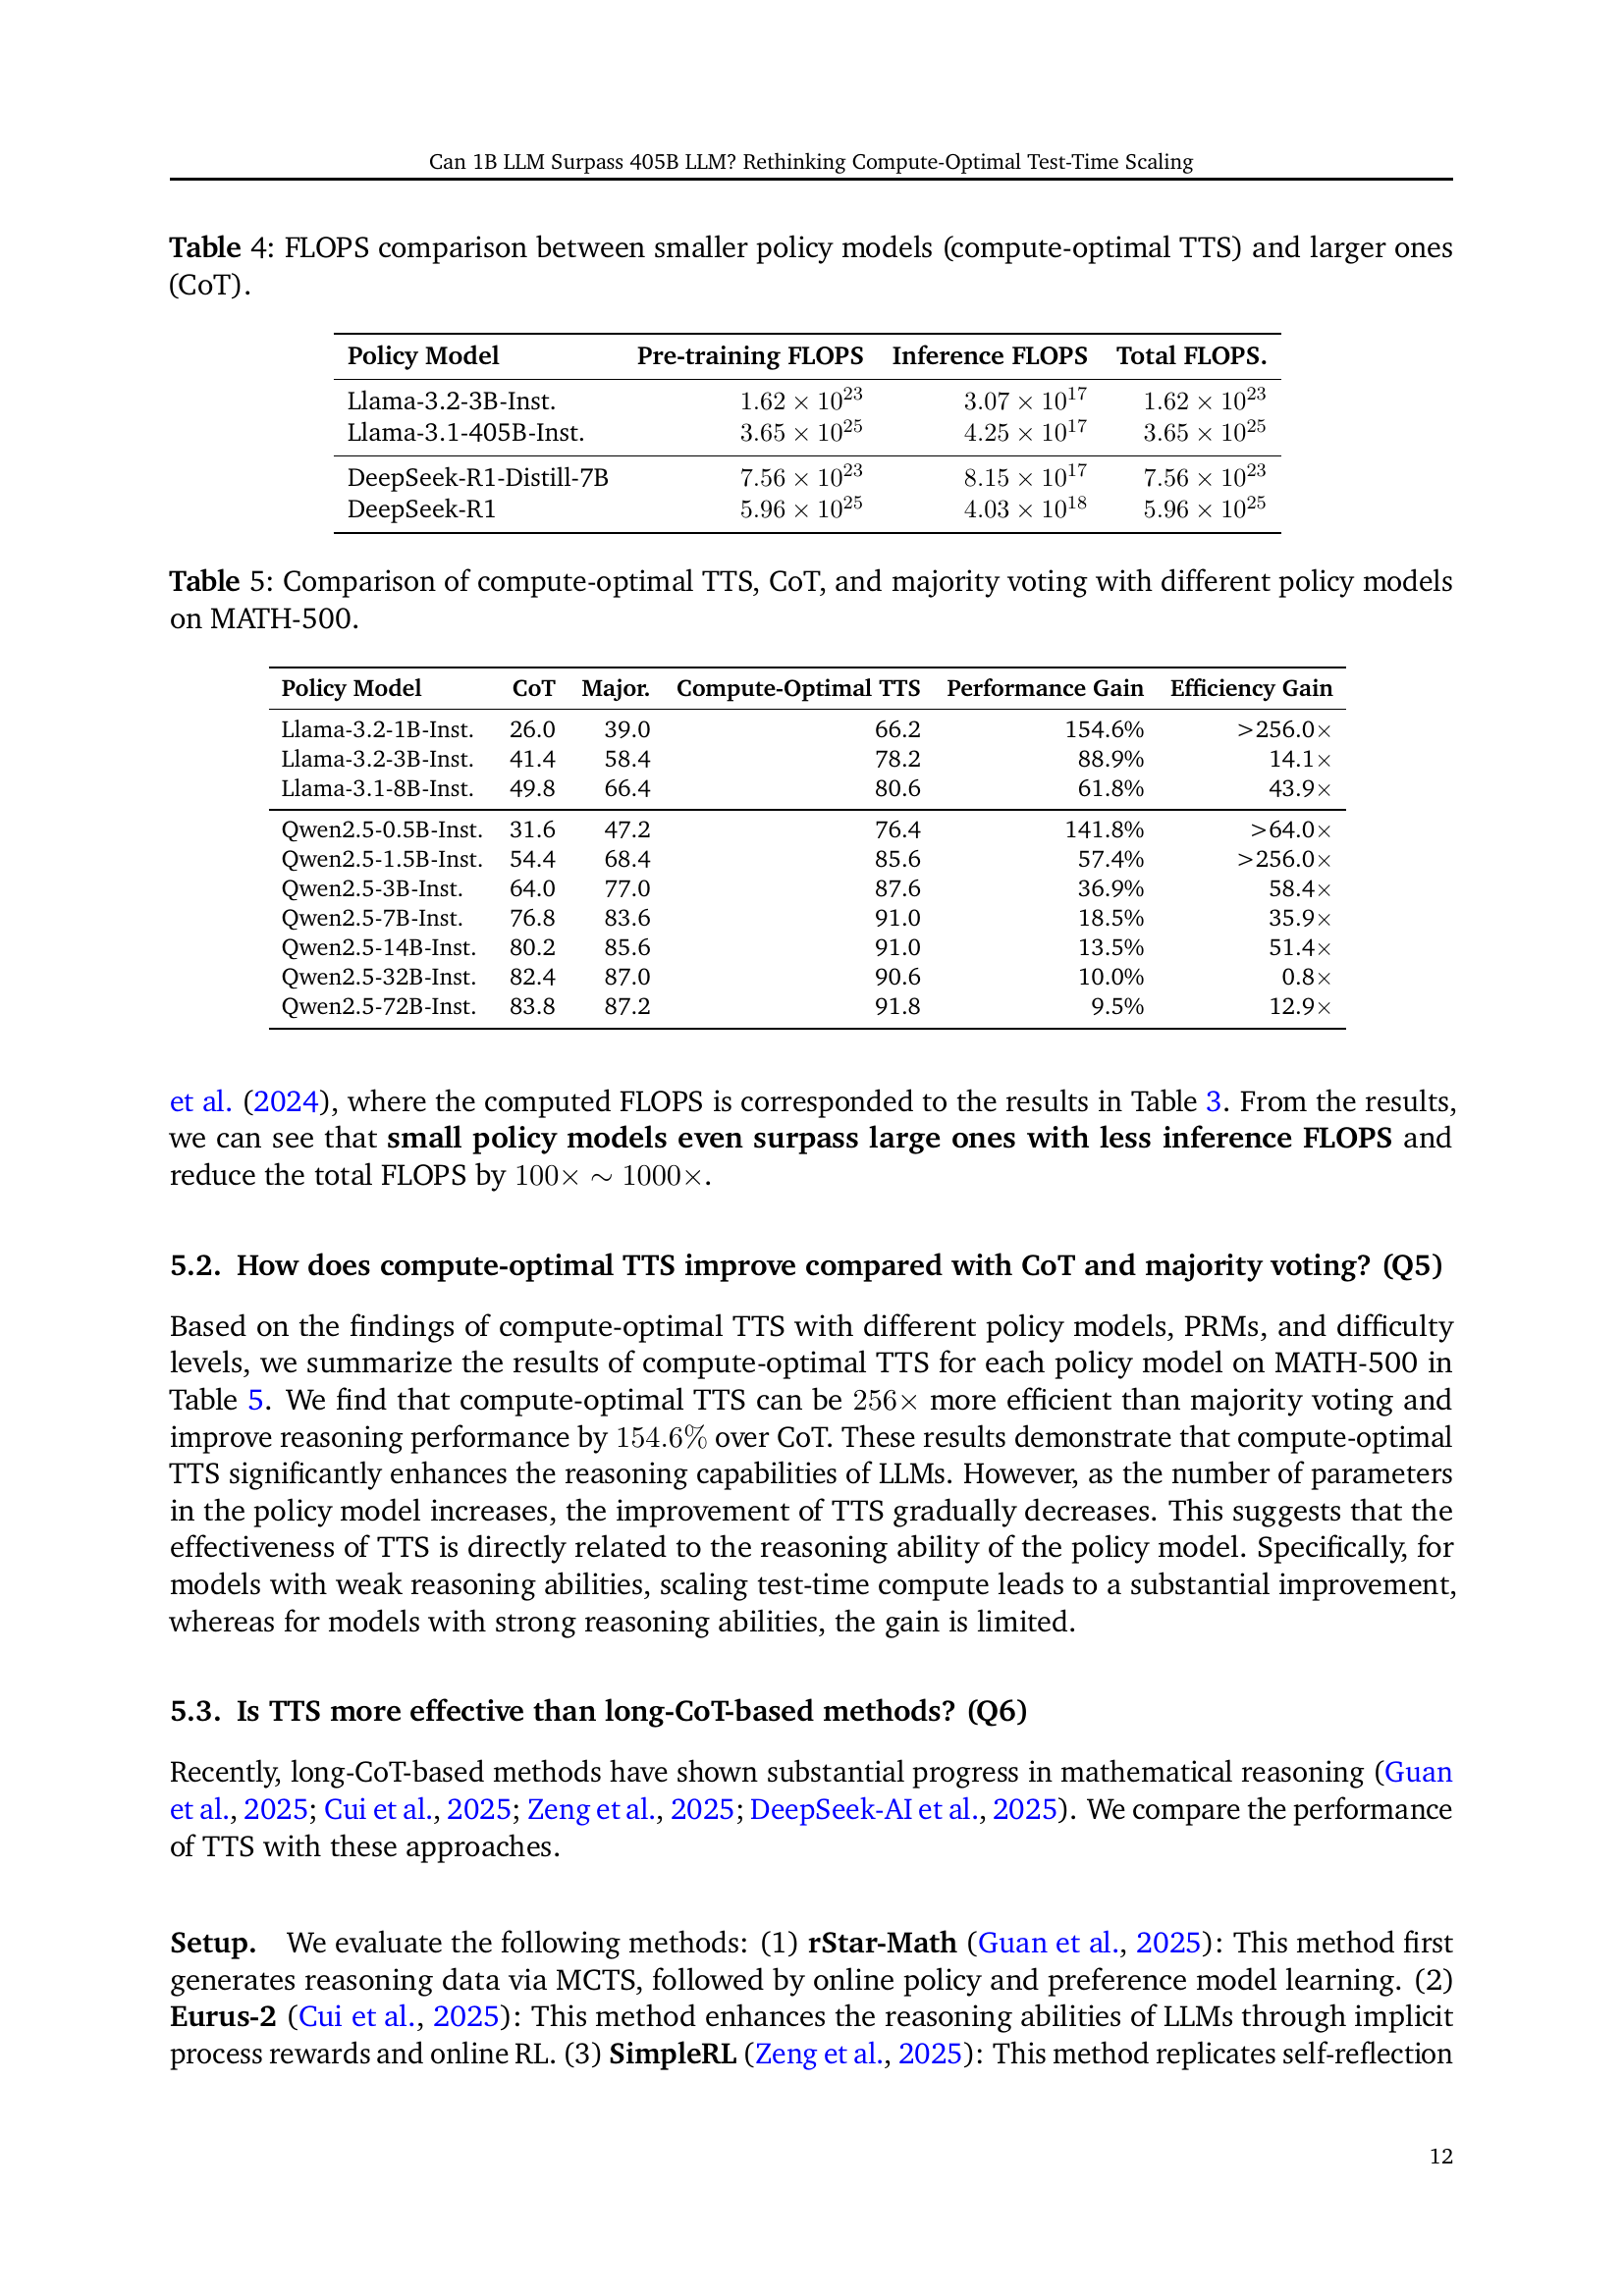
🔼 This table compares the computational cost (FLOPS) of using compute-optimal Test-Time Scaling (TTS) with smaller language models versus the traditional Chain-of-Thought (CoT) method with larger language models. It breaks down the FLOPS into pre-training and inference phases to show the overall computational efficiency gains of using compute-optimal TTS with smaller models.
read the caption
Table 4: FLOPS comparison between smaller policy models (compute-optimal TTS) and larger ones (CoT).
| Policy Model | CoT | Major. | Compute-Optimal TTS | Performance Gain | Efficiency Gain |
| Llama-3.2-1B-Inst. | 26.0 | 39.0 | 66.2 | 154.6% | >256.0 |
| Llama-3.2-3B-Inst. | 41.4 | 58.4 | 78.2 | 88.9% | 14.1 |
| Llama-3.1-8B-Inst. | 49.8 | 66.4 | 80.6 | 61.8% | 43.9 |
| Qwen2.5-0.5B-Inst. | 31.6 | 47.2 | 76.4 | 141.8% | >64.0 |
| Qwen2.5-1.5B-Inst. | 54.4 | 68.4 | 85.6 | 57.4% | >256.0 |
| Qwen2.5-3B-Inst. | 64.0 | 77.0 | 87.6 | 36.9% | 58.4 |
| Qwen2.5-7B-Inst. | 76.8 | 83.6 | 91.0 | 18.5% | 35.9 |
| Qwen2.5-14B-Inst. | 80.2 | 85.6 | 91.0 | 13.5% | 51.4 |
| Qwen2.5-32B-Inst. | 82.4 | 87.0 | 90.6 | 10.0% | 0.8 |
| Qwen2.5-72B-Inst. | 83.8 | 87.2 | 91.8 | 9.5% | 12.9 |
🔼 This table presents a comparison of three different reasoning strategies: compute-optimal Test-Time Scaling (TTS), Chain-of-Thought (CoT), and majority voting. The comparison is performed across various language models (LLMs) of different sizes, all evaluated on the MATH-500 dataset. The results show the accuracy of each method for each LLM, highlighting the performance gains achieved by compute-optimal TTS relative to the other two approaches.
read the caption
Table 5: Comparison of compute-optimal TTS, CoT, and majority voting with different policy models on MATH-500.
| Policy Model | MATH-500 | AIME24 | Avg. |
| Open-Source LLMs (CoT) | |||
| Qwen2.5-7B-Inst. | 76.8 | 13.3 | 45.1 |
| Qwen2.5-Math-7B-Inst. | 79.8 | 13.3 | 46.6 |
| Long-CoT Methods (CoT) | |||
| rStar-Math-7B | 78.4 | 26.7 | 52.6 |
| Eurus-2-7B-PRIME | 79.2 | 26.7 | 53.0 |
| Qwen2.5-7B-SimpleRL-Zero | 77.2 | 33.3 | 55.3 |
| Qwen2.5-7B-SimpleRL | 82.4 | 26.7 | 54.6 |
| Satori-Qwen-7B | 83.6 | 23.3 | 53.5 |
| DeepSeek-R1-Distill-Qwen-7B | 92.4 | 63.3 | 77.9 |
| Open-Source LLMs (TTS) | |||
| Qwen2.5-7B-Inst. w/ 7B PRM (Ours) | 88.0 | 33.3 | 60.5 |
| Qwen2.5-7B-Inst. w/ 72B PRM (Ours) | 91.0 | 36.7 | 63.9 |
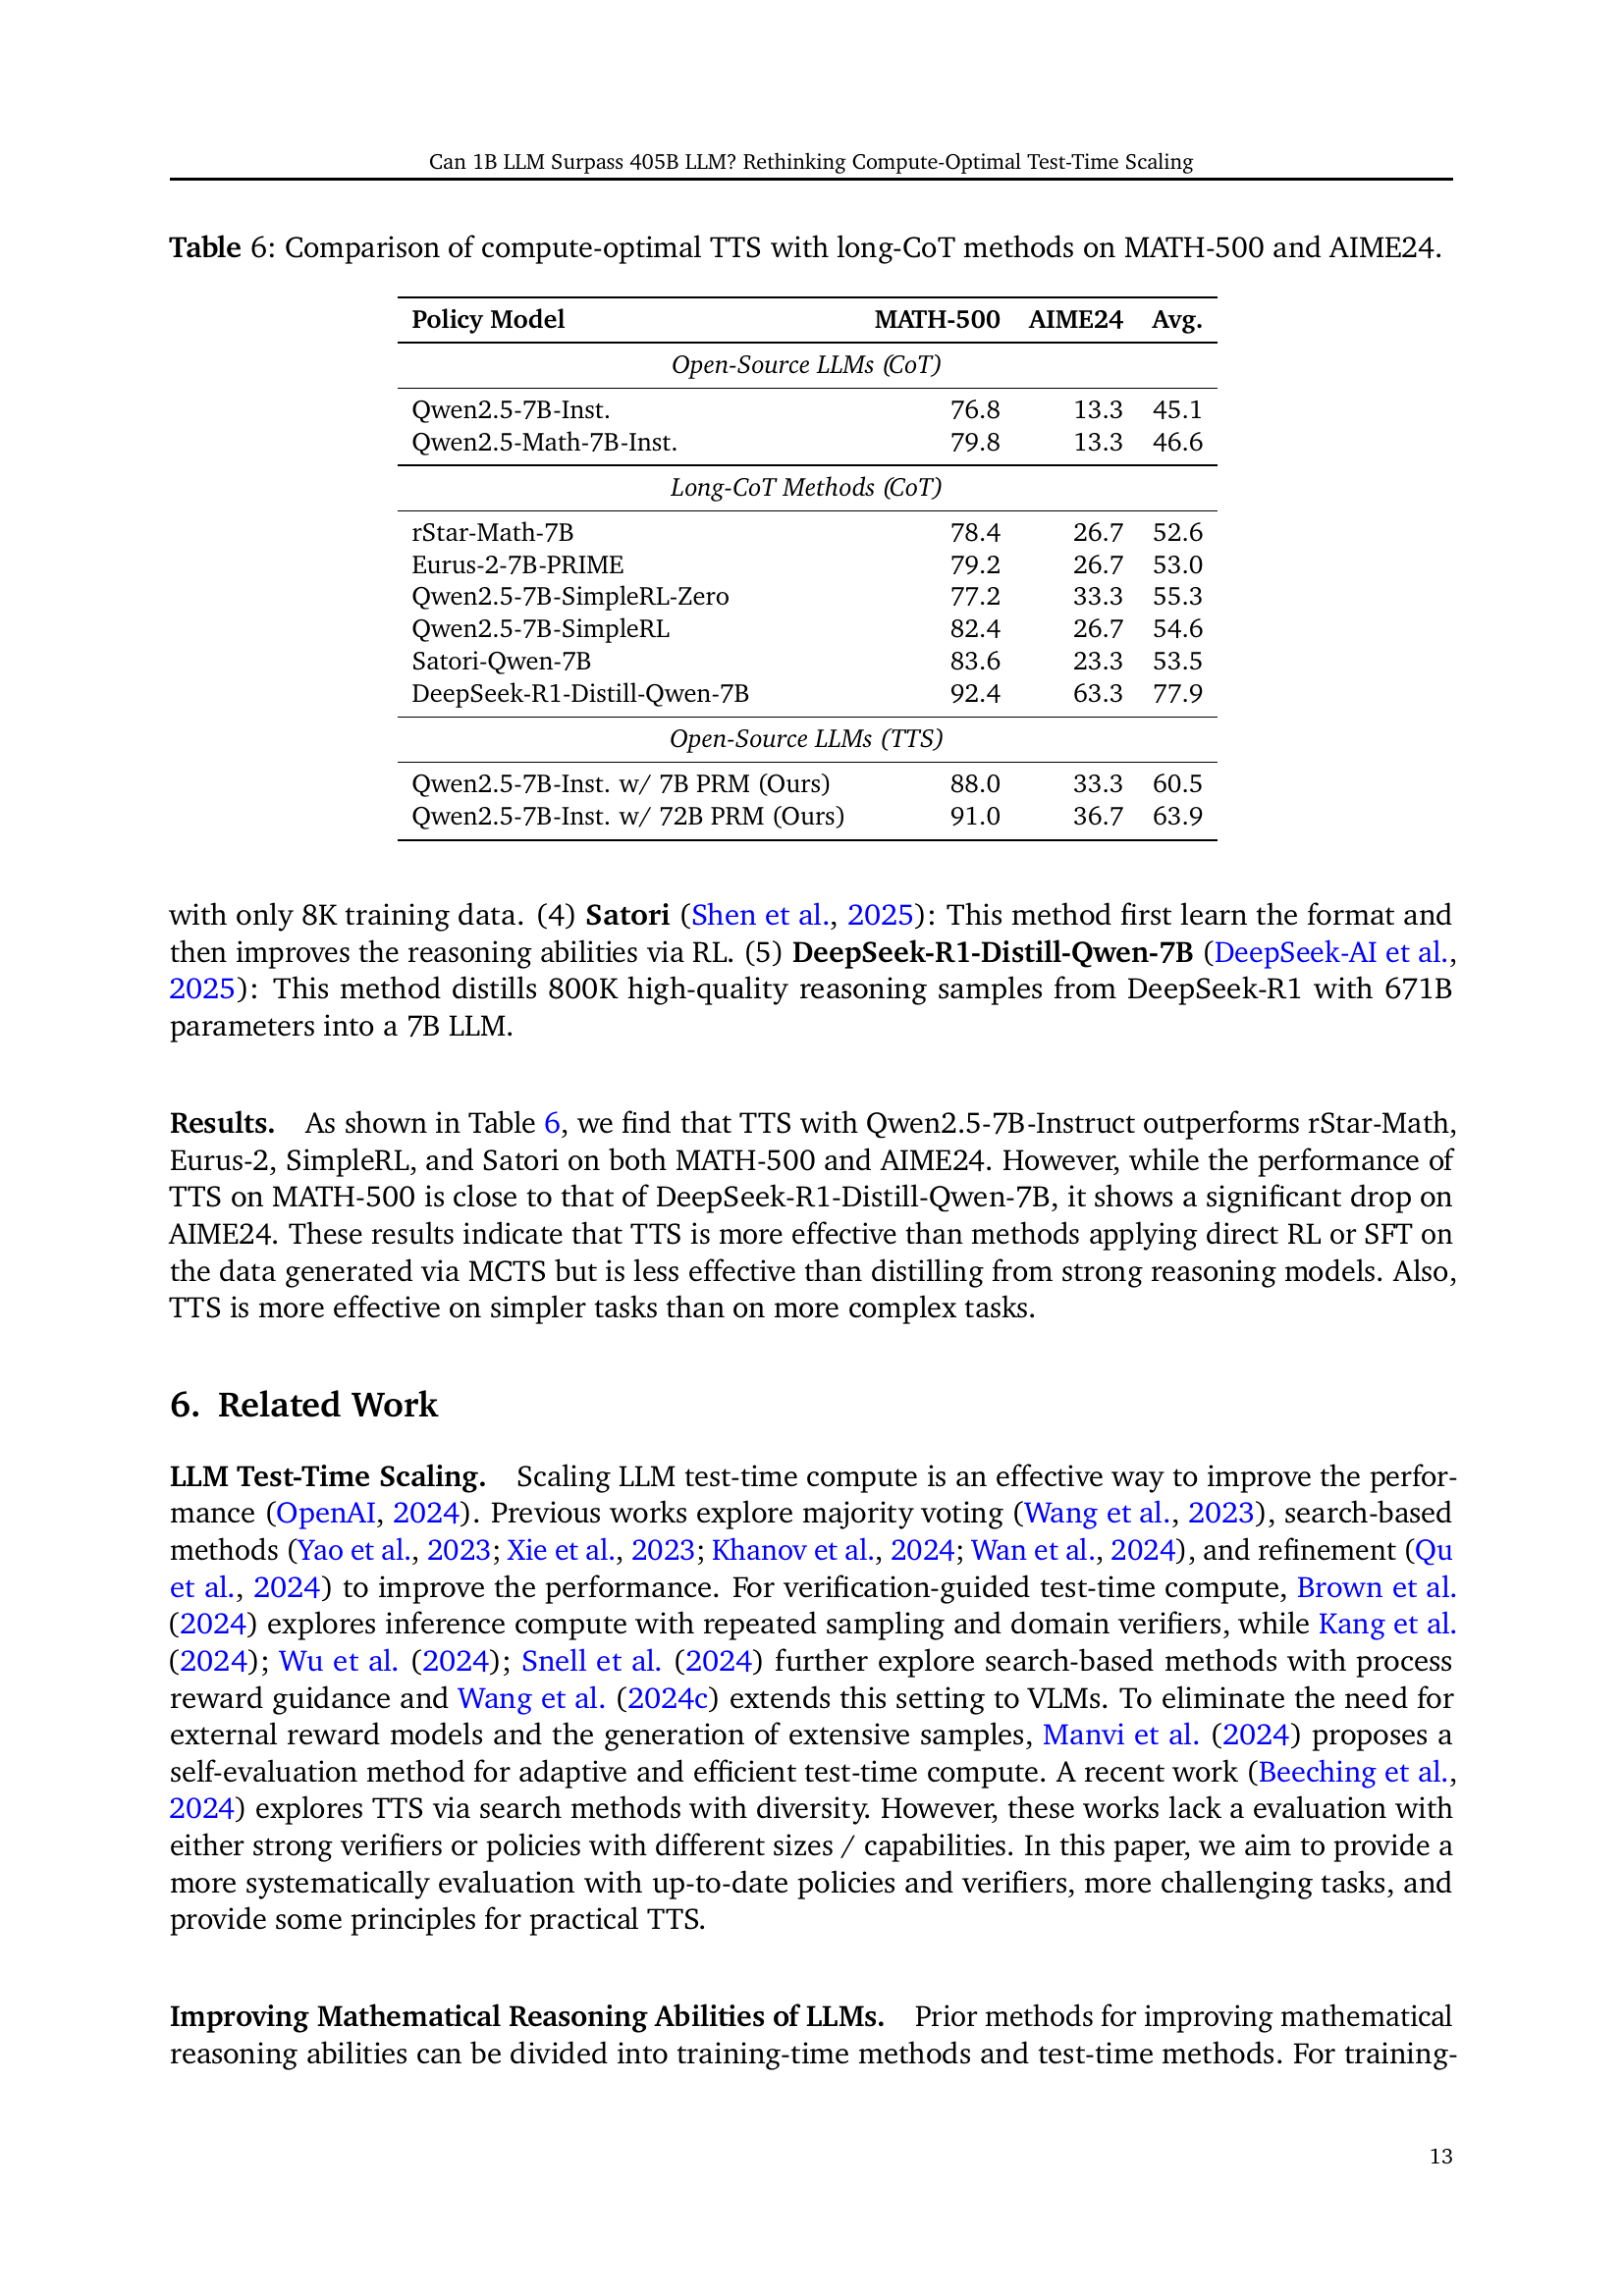
🔼 Table 6 presents a comparative analysis of the performance of compute-optimal Test-Time Scaling (TTS) against several long Chain-of-Thought (CoT) methods. The evaluation is conducted on two distinct mathematical reasoning datasets: MATH-500 and AIME24. The table allows readers to assess the relative effectiveness of the compute-optimal TTS strategy in comparison to established long-CoT approaches in terms of accuracy on both datasets. Results are provided for multiple models, facilitating a comparison of performance across different model architectures and scales.
read the caption
Table 6: Comparison of compute-optimal TTS with long-CoT methods on MATH-500 and AIME24.
Full paper#