TL;DR#
Current encoder-free vision-language models (VLMs) lag behind encoder-based counterparts in performance. This is mainly due to challenges in learning visual perception from scratch and effectively managing the interplay between visual and language information within a unified model. Existing solutions, such as visual supervision, incremental training, and Mixture-of-Expert (MoE) detachment, have shown limited success.
The paper introduces EVEv2.0, a novel encoder-free VLM that addresses these issues. EVEv2.0 uses a divide-and-conquer architecture to effectively decompose and hierarchically associate vision and language components, reducing interference. A well-designed training strategy further enhances optimization. Extensive evaluations show EVEv2.0 significantly outperforms previous encoder-free VLMs, demonstrating improved data efficiency and superior vision-reasoning capabilities, thereby narrowing the performance gap with state-of-the-art encoder-based models.
Key Takeaways#
Why does it matter?#
This paper is important because it significantly advances the field of encoder-free vision-language models, which are crucial for developing efficient and scalable multimodal AI systems. The proposed EVEv2.0 model offers a superior training strategy, demonstrating improved data efficiency and strong vision-reasoning capabilities, paving the way for future research in this promising area. The findings also highlight the importance of carefully designed architectures and training procedures for effectively managing the interplay between visual and language modalities in unified models. This work opens up new avenues for research in monolithic VLM architectures, potentially leading to more effective and resource-efficient multimodal AI.
Visual Insights#

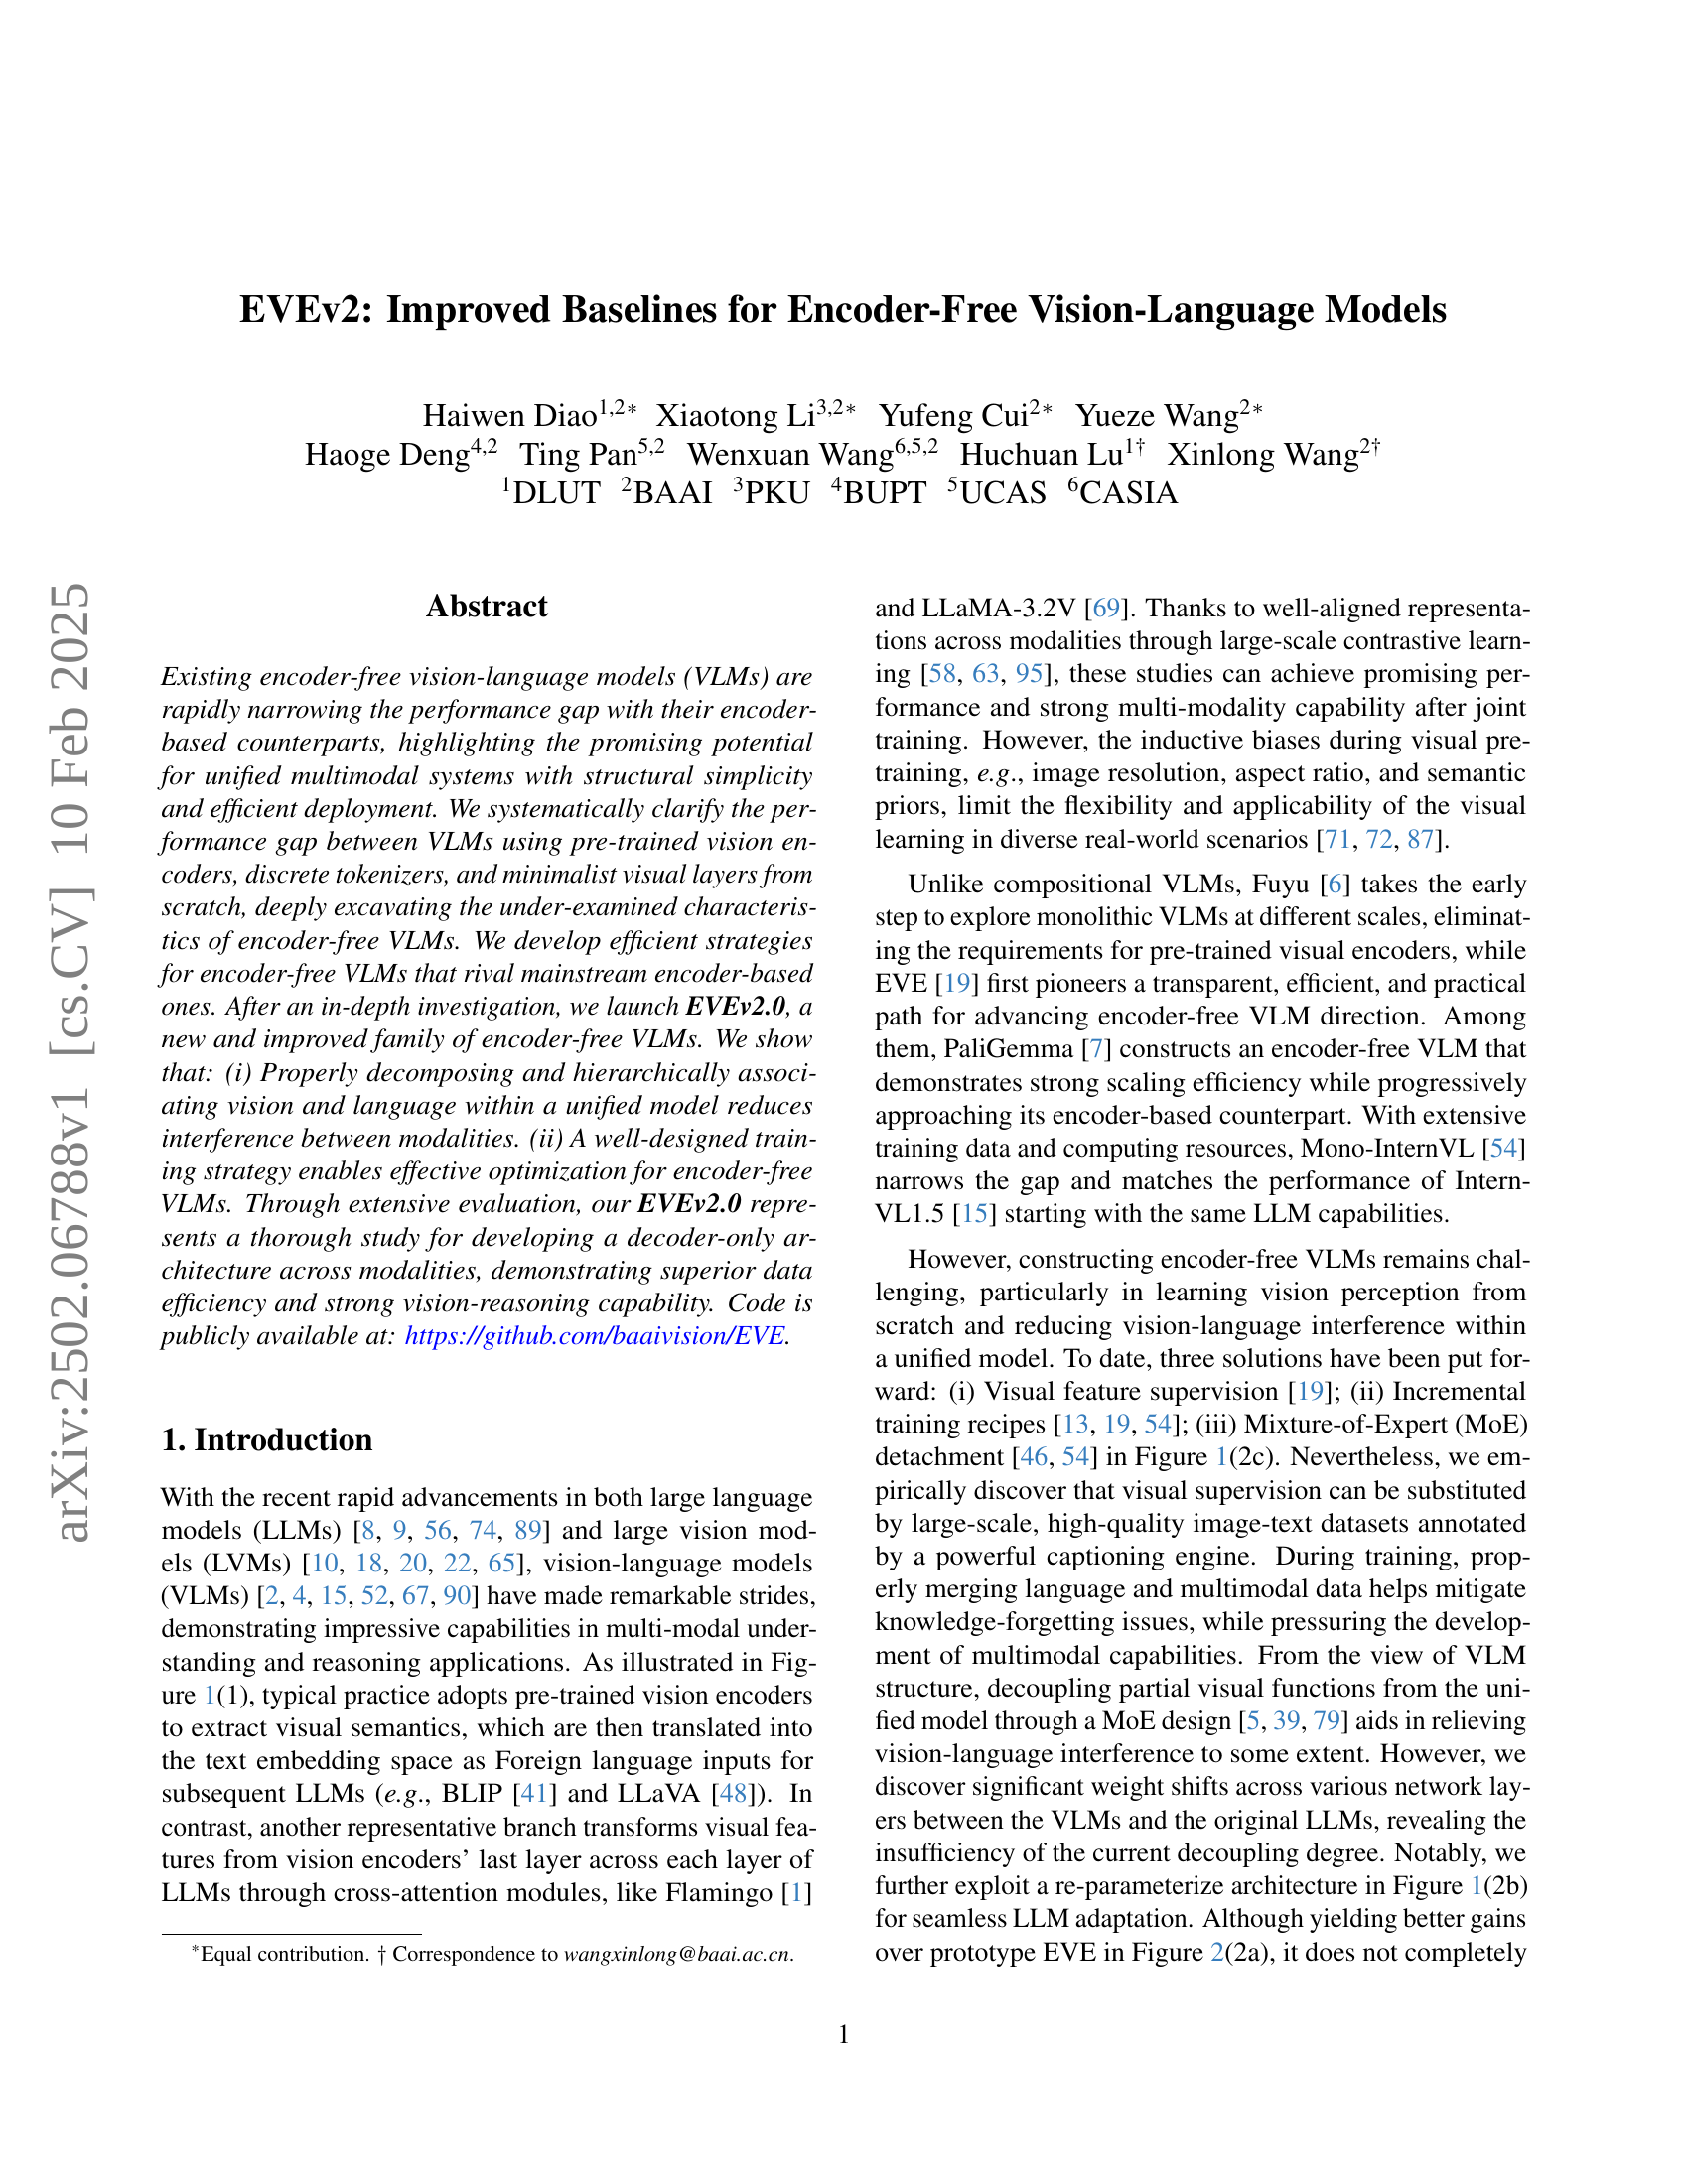
🔼 This figure provides a comprehensive overview of vision-language models (VLMs). Part (1) illustrates different methods used by existing VLMs to incorporate visual information. This includes using pre-trained vision encoders to extract visual features, which are then fed to large language models (LLMs); using cross-attention between vision encoders and LLMs at different layers; and more monolithic approaches that merge vision and language information directly within a single model. Part (2) explores various architecture designs for encoder-free VLMs, focusing on how to effectively construct visual perception within the LLM without relying on pre-trained vision encoders. These architectures range from simpler models with single visual layers to more complex designs that use re-parameterization techniques or a Mixture-of-Experts approach to manage vision-language interaction.
read the caption
Figure 1: Overview of (1) diverse vision construction inside existing VLMs and (2) potential architecture variants of Encoder-Free VLMs.
| Stage | Dataset | #Num | Total |
| 1 / 2.1 | Datacomp [24] | 44M | 77M |
| LAION [59] | 15M | ||
| SA-1B [34] | 11M | ||
| OpenImages [35] | 7M | ||
| 2.2 | Infinity-MM-GeneralQA [27] | 15M | 15M |
| 3 | LLaVA-onevision [38] | 3.5M | 7.3M |
| Infinity-MM-instruct [27] | 3.8M |
🔼 Table 1 provides details on the datasets used for training the EVEv2.0 model across its four stages. It lists the dataset name, the number of samples in each dataset, and the total number of samples used in each training stage. Importantly, it highlights the use of DenseFusion++, a custom data augmentation method developed by the authors, to enhance the quality and quantity of the web-scale image-text data used for training.
read the caption
Table 1: Details of training datasets across all stages. Note that we construct DenseFusion++ to re-caption web-scale image-text data.
In-depth insights#
Encoder-Free VLMs#
Encoder-free Vision-Language Models (VLMs) represent a significant shift in multimodal learning, aiming to eliminate the reliance on pre-trained vision encoders. This approach offers several advantages, including improved efficiency, enhanced flexibility, and reduced inductive biases. By directly processing visual input within the language model, encoder-free VLMs potentially achieve better generalization across diverse visual domains. However, building effective encoder-free VLMs presents challenges, particularly in learning robust visual perception from scratch and mitigating the interference between visual and linguistic information within a unified architecture. Innovative training strategies and carefully designed model architectures are crucial to overcoming these limitations and achieving performance comparable to encoder-based counterparts. The research on encoder-free VLMs is actively exploring efficient visual encoding techniques and strategies for minimizing modality interference, paving the way for simpler and more scalable multimodal systems.
EVEv2 Architecture#
The EVEv2 architecture represents a significant advancement in encoder-free vision-language models (VLMs). Its core innovation lies in the Divide-and-Conquer design, which meticulously separates visual and textual processing pathways within a unified decoder-only framework. This addresses the major challenge of cross-modal interference, which hampered previous models. Modality-specific weights are assigned to key components like self-attention, feed-forward layers, and normalization, ensuring efficient and independent processing of visual and textual information. This decoupling leads to enhanced scaling efficiency. Unlike previous approaches relying on re-parameterization or Mixture-of-Experts, EVEv2’s architectural choices yield superior performance with increased data efficiency, and reduced training instability. The architecture’s ability to handle high-resolution inputs, through a customized patch embedding layer that bypasses pre-trained visual encoders, is another key strength, promoting the learning of native visual perception from scratch. Furthermore, the architecture is designed for seamless adaptation with off-the-shelf LLMs, reducing the need for extensive LLM fine-tuning. The overall design of EVEv2 points towards a future of simpler, more efficient, and scalable VLMs.
Training Strategies#
Effective training strategies are crucial for the success of encoder-free vision-language models (VLMs). The paper highlights a multi-stage training process that progressively builds visual perception capabilities. Initially, the LLM is frozen, focusing on pre-training the patch embedding layer to align modalities. Then, vision layers are incrementally unfrozen, incorporating larger datasets at higher resolutions, allowing the VLM to learn progressively complex visual features. A key innovation is the use of high-quality synthetic data, generated by a custom captioning engine. This significantly improves training efficiency and model capability compared to using noisy web-scraped captions. The paper also demonstrates the importance of balancing training data across different modalities and resolutions. A divide-and-conquer architectural design further enhances the training process by reducing cross-modal interference. This staged approach, combined with data-driven refinements, showcases a highly effective training methodology for encoder-free VLMs, leading to superior performance and demonstrating the significance of a thoughtful approach to VLM training.
Ablation Study#
An ablation study systematically evaluates the contribution of individual components within a model by removing them and observing the impact on overall performance. In the context of vision-language models (VLMs), this involves removing specific modules or layers (e.g., visual encoders, attention mechanisms, specific normalization layers) to understand their individual effects on downstream tasks such as image captioning, visual question answering, or visual reasoning. The goal is to identify critical components that significantly influence performance and to understand the interplay between different modules. A well-designed ablation study provides insights into the model’s architecture and helps guide future design improvements. It’s essential to interpret results carefully, considering potential interactions and ensuring that removals are done strategically, avoiding cascading negative effects. Quantifying the performance drop for each ablation is crucial to draw meaningful conclusions. Often, researchers use ablation studies to justify design choices, demonstrate the necessity of particular components, and identify areas for future optimization or simplification.
Future VLMs#
Future vision-language models (VLMs) hold immense potential. Pushing beyond current limitations requires addressing several key challenges. Firstly, improving data efficiency is crucial; current models necessitate massive datasets, hindering accessibility and scalability. Secondly, enhancing generalization capabilities is vital; models often struggle with unseen scenarios or nuanced tasks. Developing more robust techniques for multi-modal alignment and fusion is another priority. This involves better integration of heterogeneous modalities and mitigating interference between them. Finally, focusing on resource efficiency will ensure wider accessibility and practical deployment. This includes lowering computational costs and memory demands, as well as developing models that can effectively operate on edge devices. Addressing these challenges will lead to VLMs that are not only more powerful and versatile but also practical and sustainable, leading to widespread real-world applications.
More visual insights#
More on figures
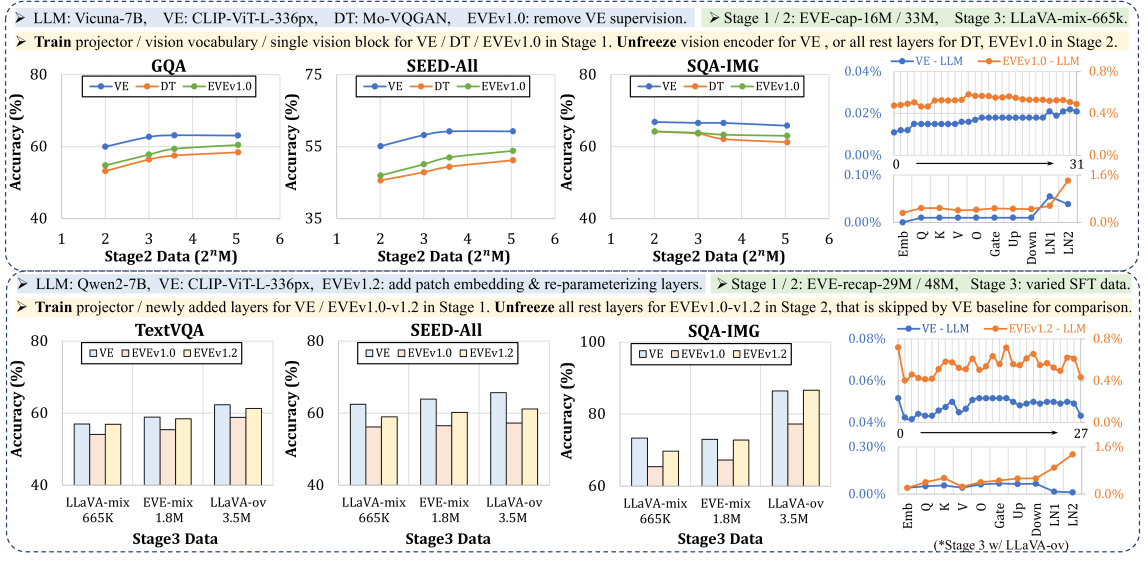
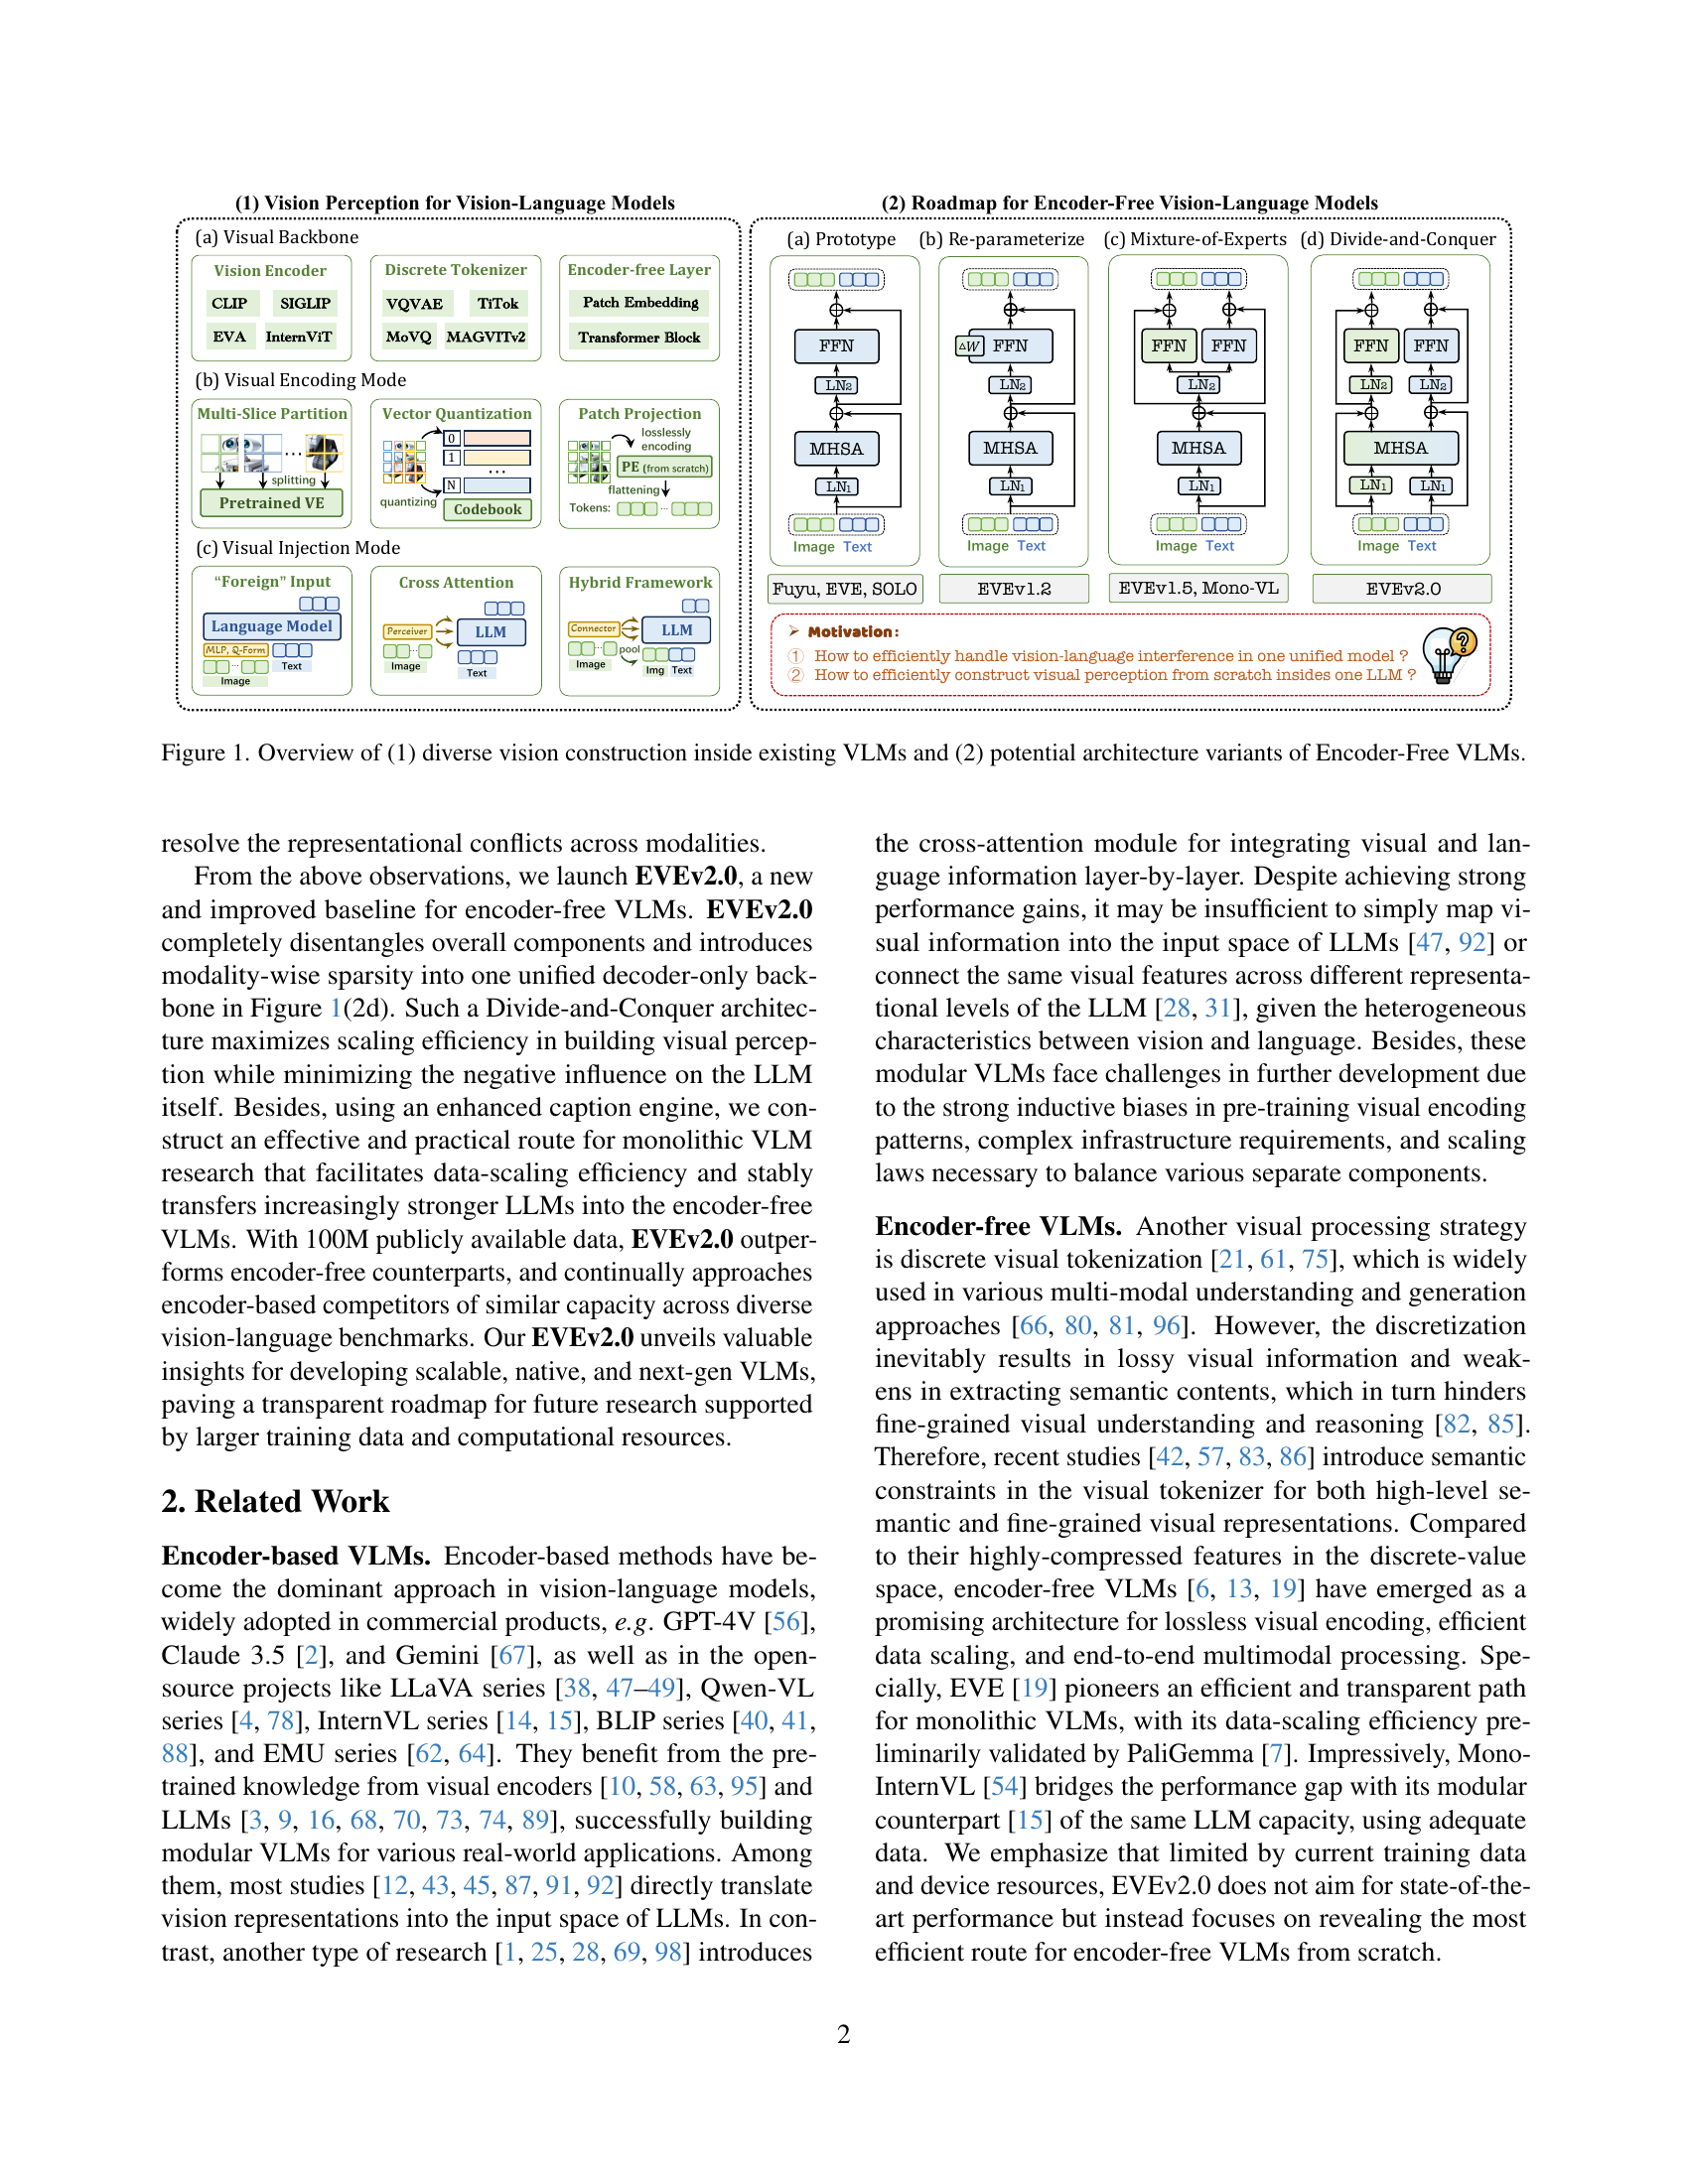
🔼 This figure compares the scaling efficiency of different vision-language models (VLMs) during pre-training and fine-tuning. Three types of VLMs are compared: those using vision encoders (VE), discrete tokenizers (DT), and encoder-free models (EVE). The models use different image downsampling rates, but the resolutions are adjusted to maintain a relatively similar number of tokens per image for fair comparison. The figure shows how the performance of each model type changes as the amount of training data increases. Weight changes between the LLMs and VLMs are quantified by averaging the absolute value of variations within specific layers. The final performance is evaluated on four benchmark datasets (GQA, SEED, TextVQA, and SQA) that test the models’ abilities across various domains, including general, open-domain, OCR-related, and text-related tasks.
read the caption
Figure 2: Preliminary analyses across various VLMs’ scaling efficiency during pre-training or fine-tuning (More details in Appendix A). Notably, VE / DT / EVE apply varying image downsampling rates (142 / 82 / 322). For fairness, we choose slightly different resolutions that yield relatively balanced token counts of 576 / 1024 / 625 tokens per image. Besides, we quantify weight changes between LLMs and VLMs by averaging absolute value variation within specific layer number or type. We report accuracy on GQA [30], SEED [26], TextVQA [60], and SQA [53] to examine VLMs’ capabilities across general in-domain, open-domain, OCR-related, and text-related knowledge tasks.

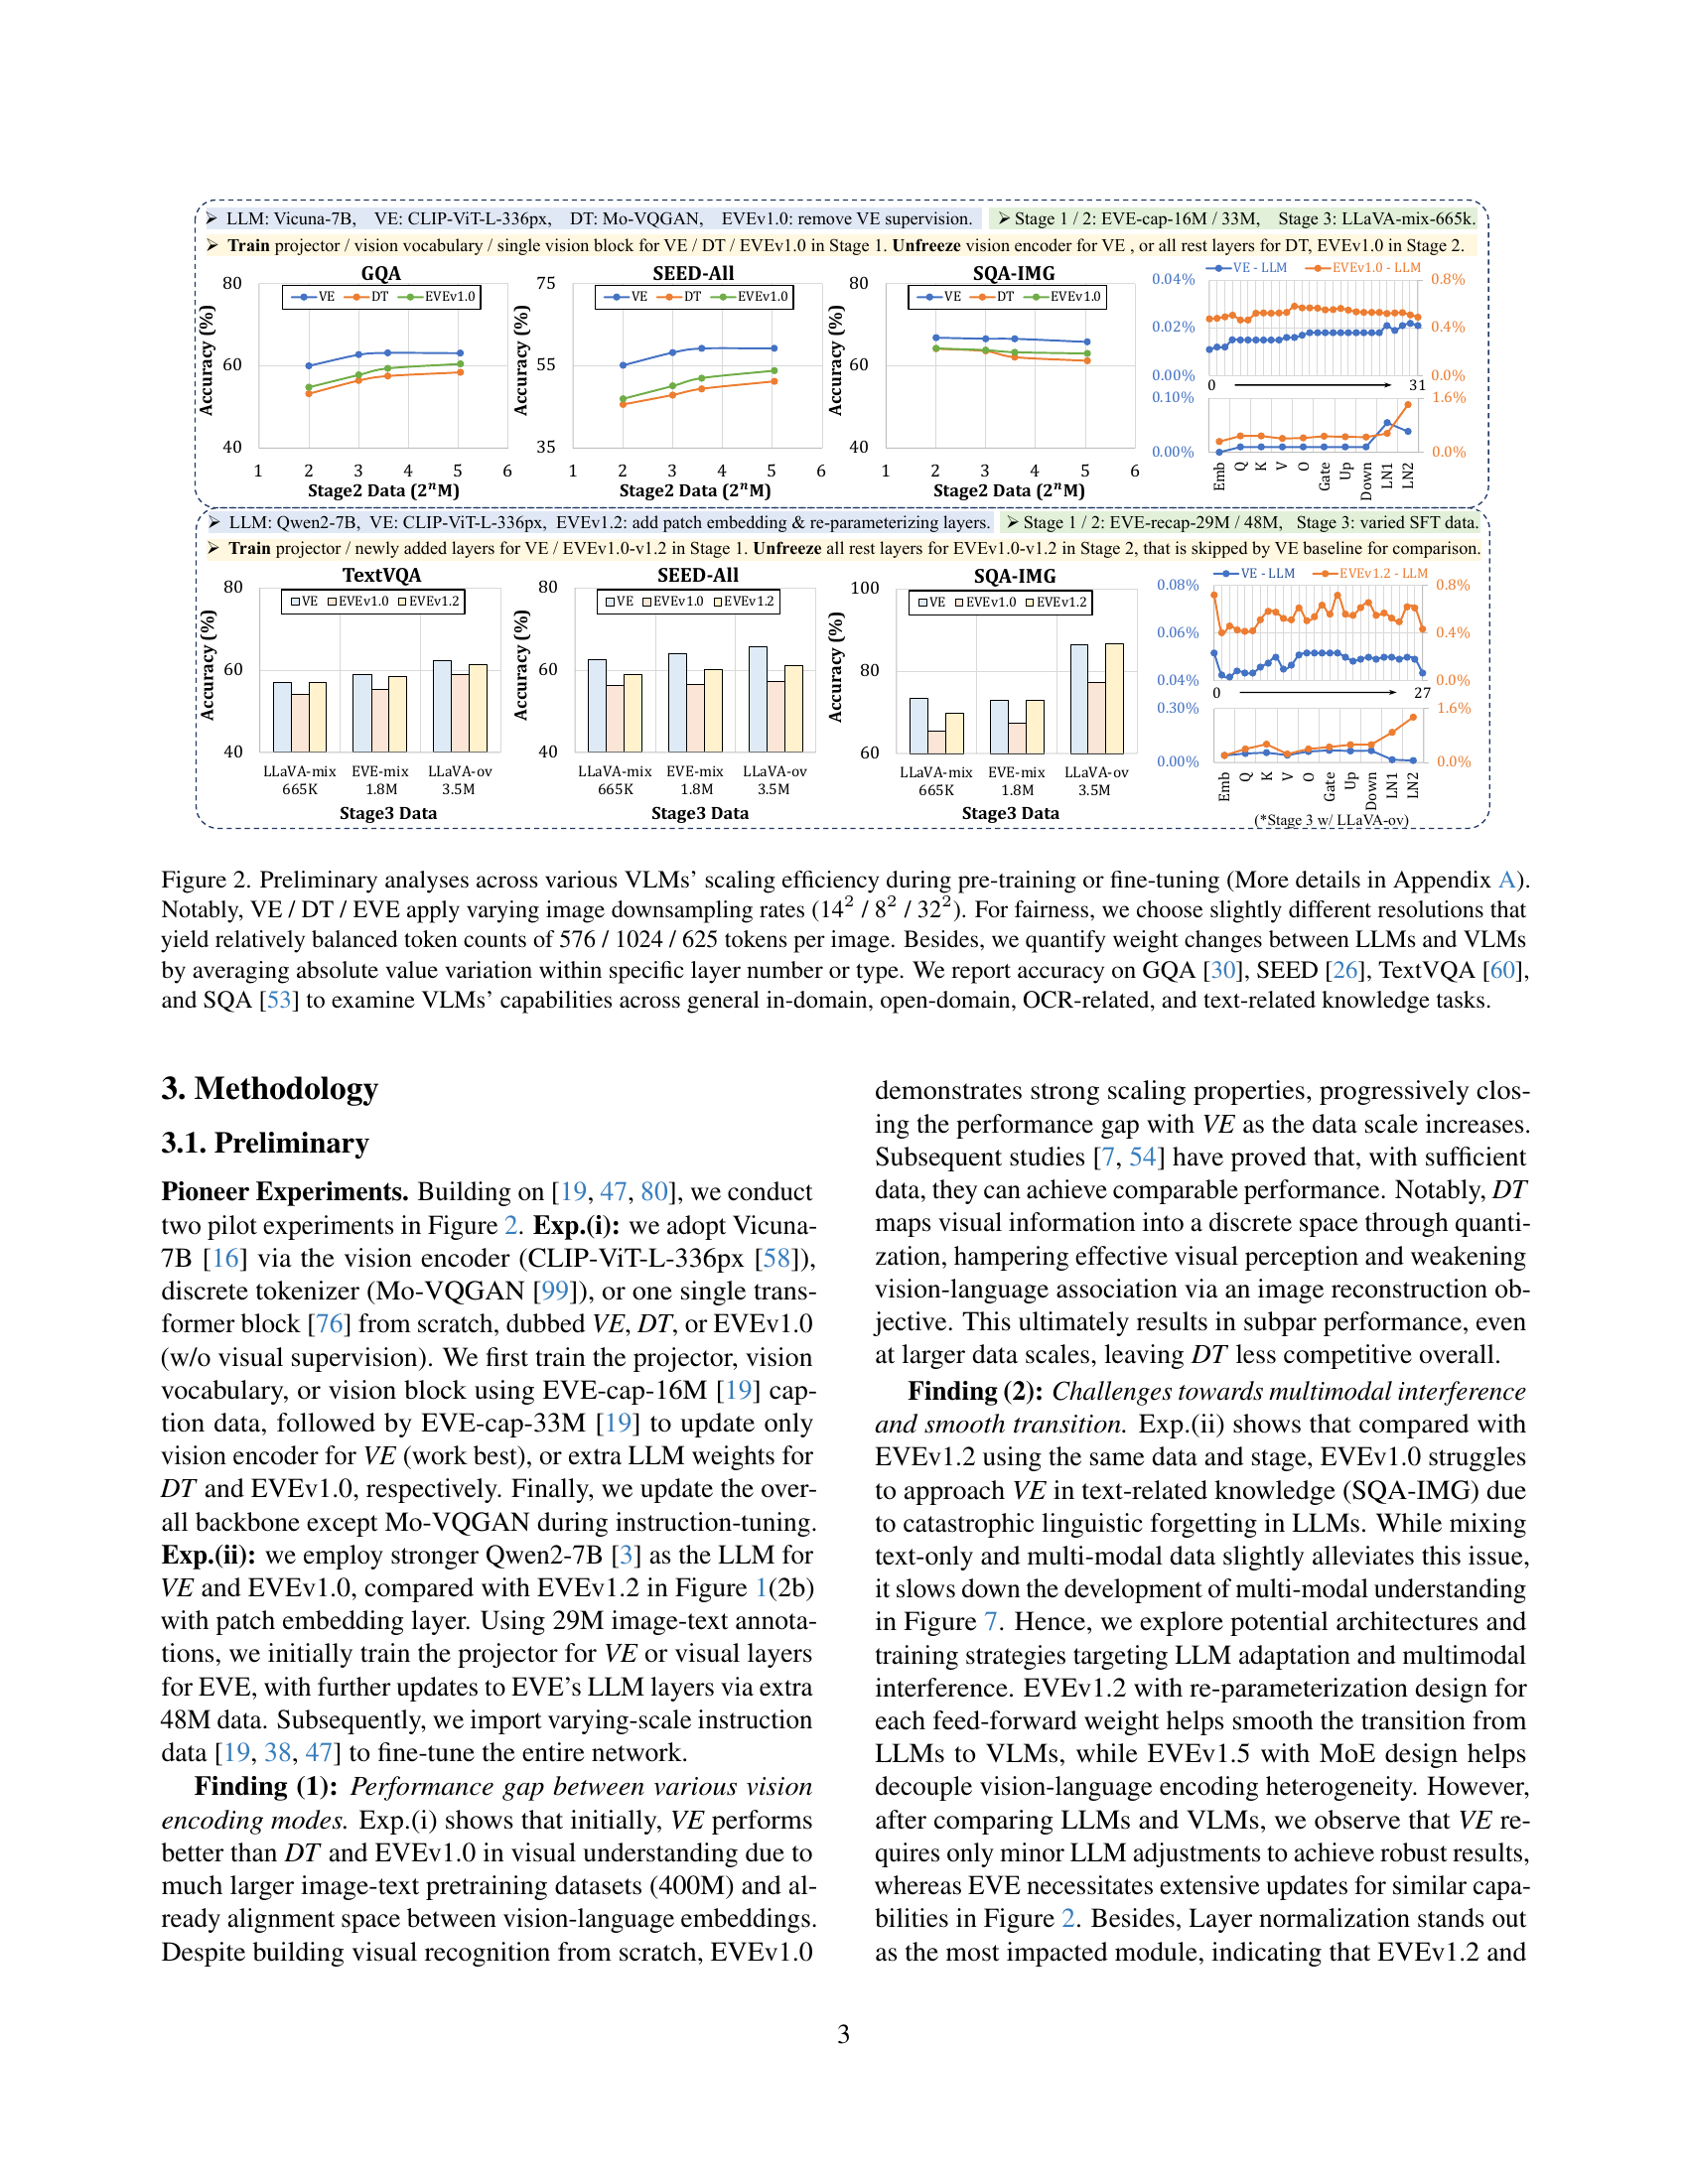
🔼 Figure 3 illustrates the architecture of EVEv2.0, a novel encoder-free vision-language model. Unlike traditional methods that rely on pre-trained vision encoders, EVEv2.0 processes images directly using a lossless patch embedding layer. This layer converts the image into a sequence of tokens, which are then combined with text tokens and fed into a unified decoder-only transformer. A key innovation is the use of modality-specific weights for various components of the transformer, including self-attention, feed-forward layers, and layer normalization. This design helps to reduce interference between the vision and language modalities and improve the model’s overall efficiency and performance. The figure visually details this process, showcasing the patch embedding layer, the concatenation of visual and text tokens, and the modality-specific components within the transformer.
read the caption
Figure 3: Overview of our proposed EVEv2.0 framework. We first adopt a patch embedding layer to encode images losslessly, and then concatenate visual and textual tokens into a unified decoder-only vision-language model. Here, it extends the standard autoregressive transformer by incorporating modality-specific weights for each multi-head self-attention layer, feed-forward layer, and layer normalization.

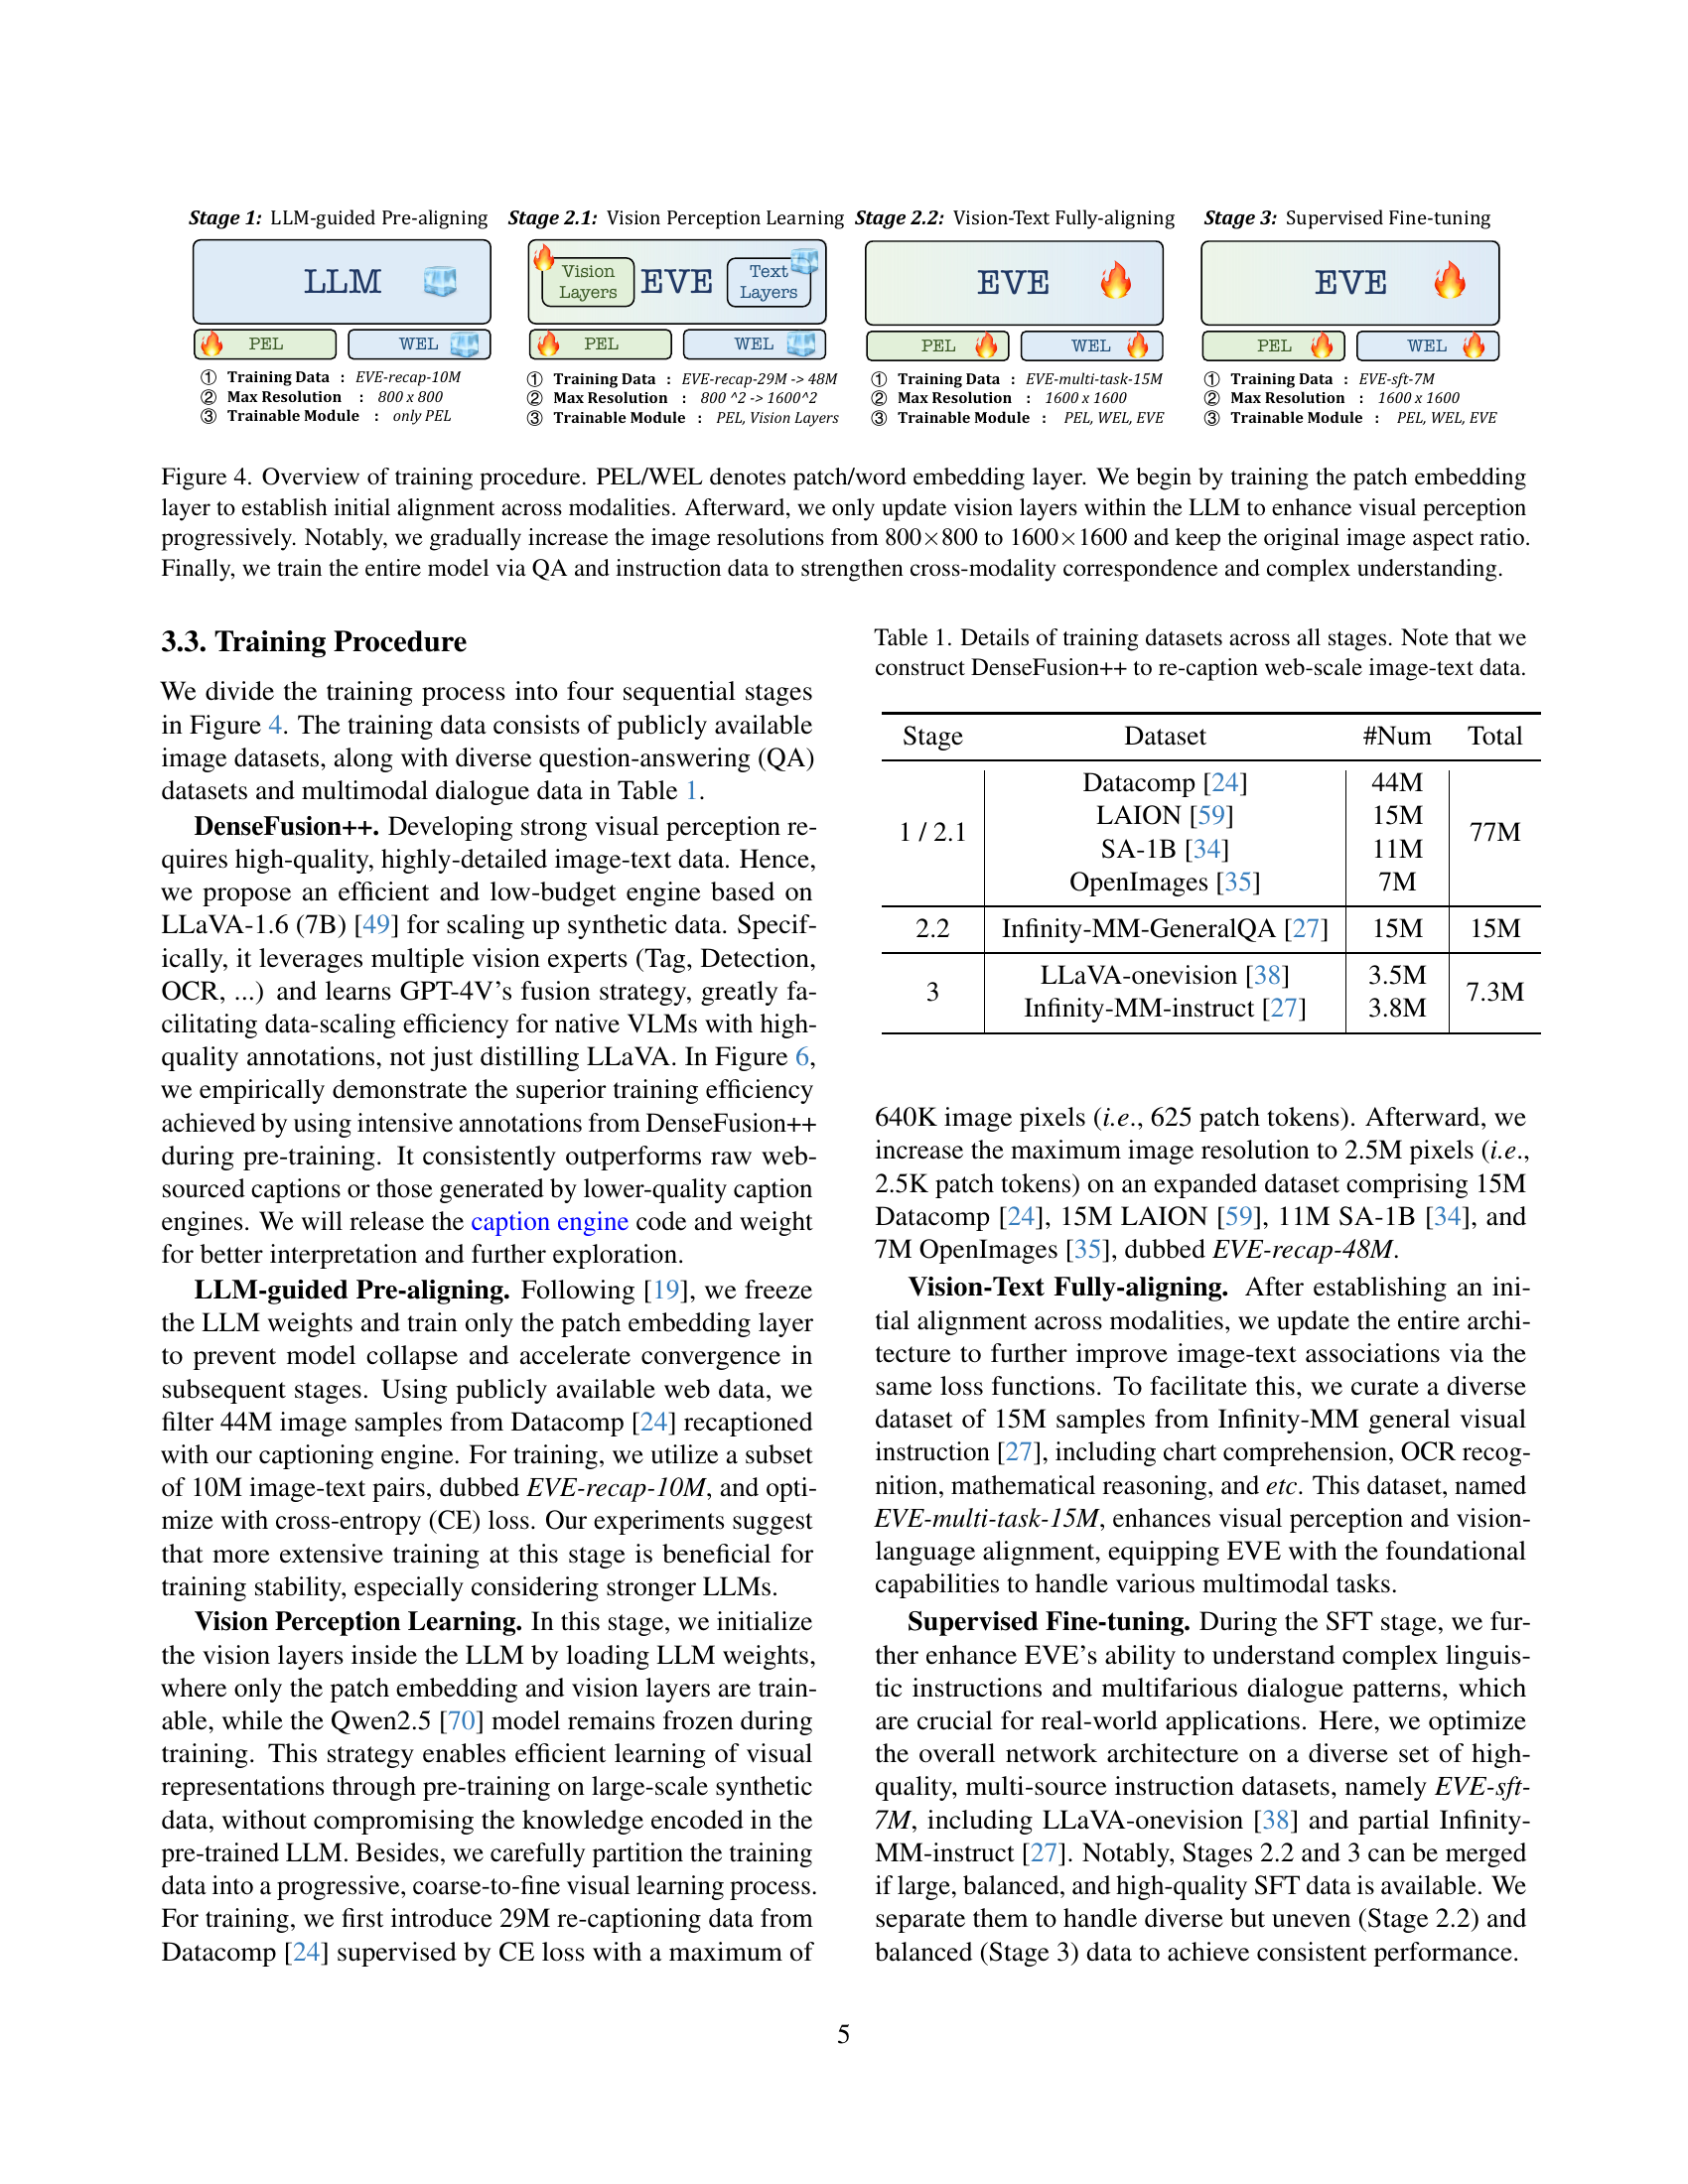
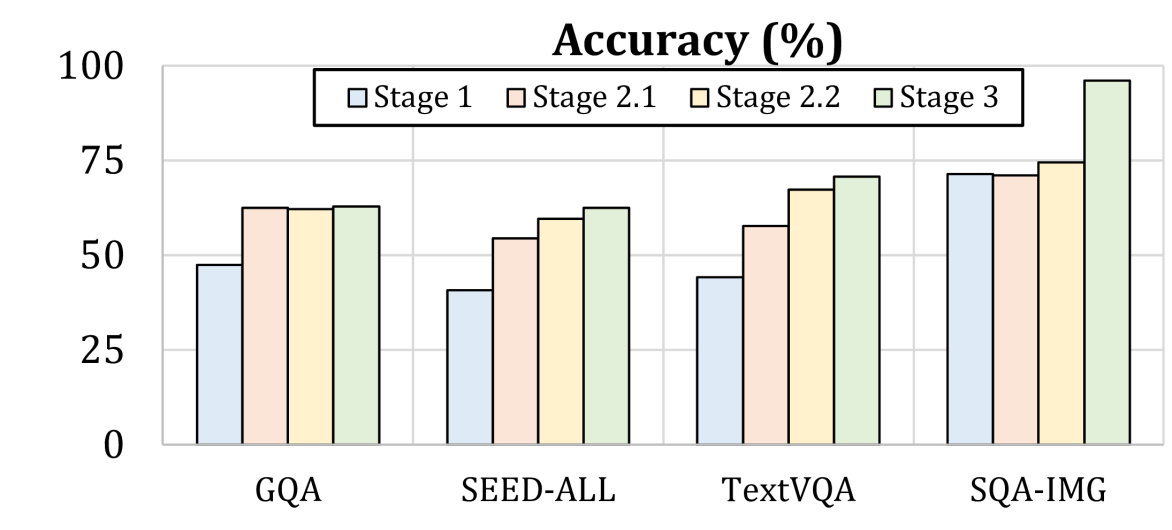
🔼 This figure illustrates the four-stage training process for the EVEv2.0 model. Stage 1 focuses on initial alignment of vision and language modalities by training only the patch embedding layer. Stage 2 progressively enhances visual perception by selectively updating vision layers within the pre-trained language model (LLM), while keeping other layers frozen. Image resolution is gradually increased from 800x800 to 1600x1600 while maintaining the aspect ratio to further improve model’s adaptability to different image sizes. In Stage 3, the entire model is fine-tuned using multi-task datasets comprising question-answering and instruction-following data. This stage aims to strengthen cross-modal correspondence and improve overall model understanding. The diagram visually represents each stage’s training data, trainable modules, and maximum image resolution.
read the caption
Figure 4: Overview of training procedure. PEL/WEL denotes patch/word embedding layer. We begin by training the patch embedding layer to establish initial alignment across modalities. Afterward, we only update vision layers within the LLM to enhance visual perception progressively. Notably, we gradually increase the image resolutions from 800×\times×800 to 1600×\times×1600 and keep the original image aspect ratio. Finally, we train the entire model via QA and instruction data to strengthen cross-modality correspondence and complex understanding.

🔼 This figure displays the training loss curves and evaluation results for different variants of the EVE model during Stage 2 of the training process. The EVE models are all based on the Qwen-2.5 (LLM) model as a baseline. The training begins in Stage 1 by training only the patch embedding layer using the EVE-recap-10M dataset. In Stage 2, the vision layers (excluding the LLM layers) are unfrozen, and training continues. The figure visually compares the performance of different model variants (EVEv1.0, EVEv1.2, EVEv1.5, and EVEv2.0) across various metrics, demonstrating the impact of different design choices on the model’s ability to learn visual representations and generalize to downstream tasks.
read the caption
Figure 5: Training loss curve and evaluation results in Stage 2. We adopt various EVE variants based on Qwen-2.5 [70] as the baseline. We first train the patch embedding layer using EVE-recap-10M in Stage 1, and further unfreeze vision layers except LLM layers in Stage 2.

🔼 Figure 6 presents a comparative analysis of the performance of EVEv1.0 (a vision-language model) trained on different image caption datasets. It compares the model’s accuracy on various vision-language benchmarks (GQA, SEED-ALL, SQA-IMG, TextVQA) when trained using different captioning methods: noisy web image captions (-raw), captions generated by LLaVA-1.5 and Emu2 (-cap), and captions generated by the modified DenseFusion++ (-recap). The figure also includes results when training data is a mixture of LAION, OpenImages, and SAM datasets (-LOS). The x-axis represents the amount of training data used (in millions), and the y-axis shows the model’s accuracy on each benchmark. This visual representation allows for a direct comparison of the impact of data source and caption quality on the performance of the EVEv1.0 model.
read the caption
Figure 6: Evaluation results of different data sources and caption engines. We utilize EVEv1.0 based on Vicuna-7B [16] as the baseline. Here ”*-raw“, ”*-cap“, or ”*-recap“ denote noisy web image captions, the samples annotated by both LLaVA-1.5 (13B) and Emu2 (17B), or modified DenseFusion++ (7B), respectively. Note that ”L.O.S.“ represents the mixture of LAION [59], OpenImages [35], and SAM [34].

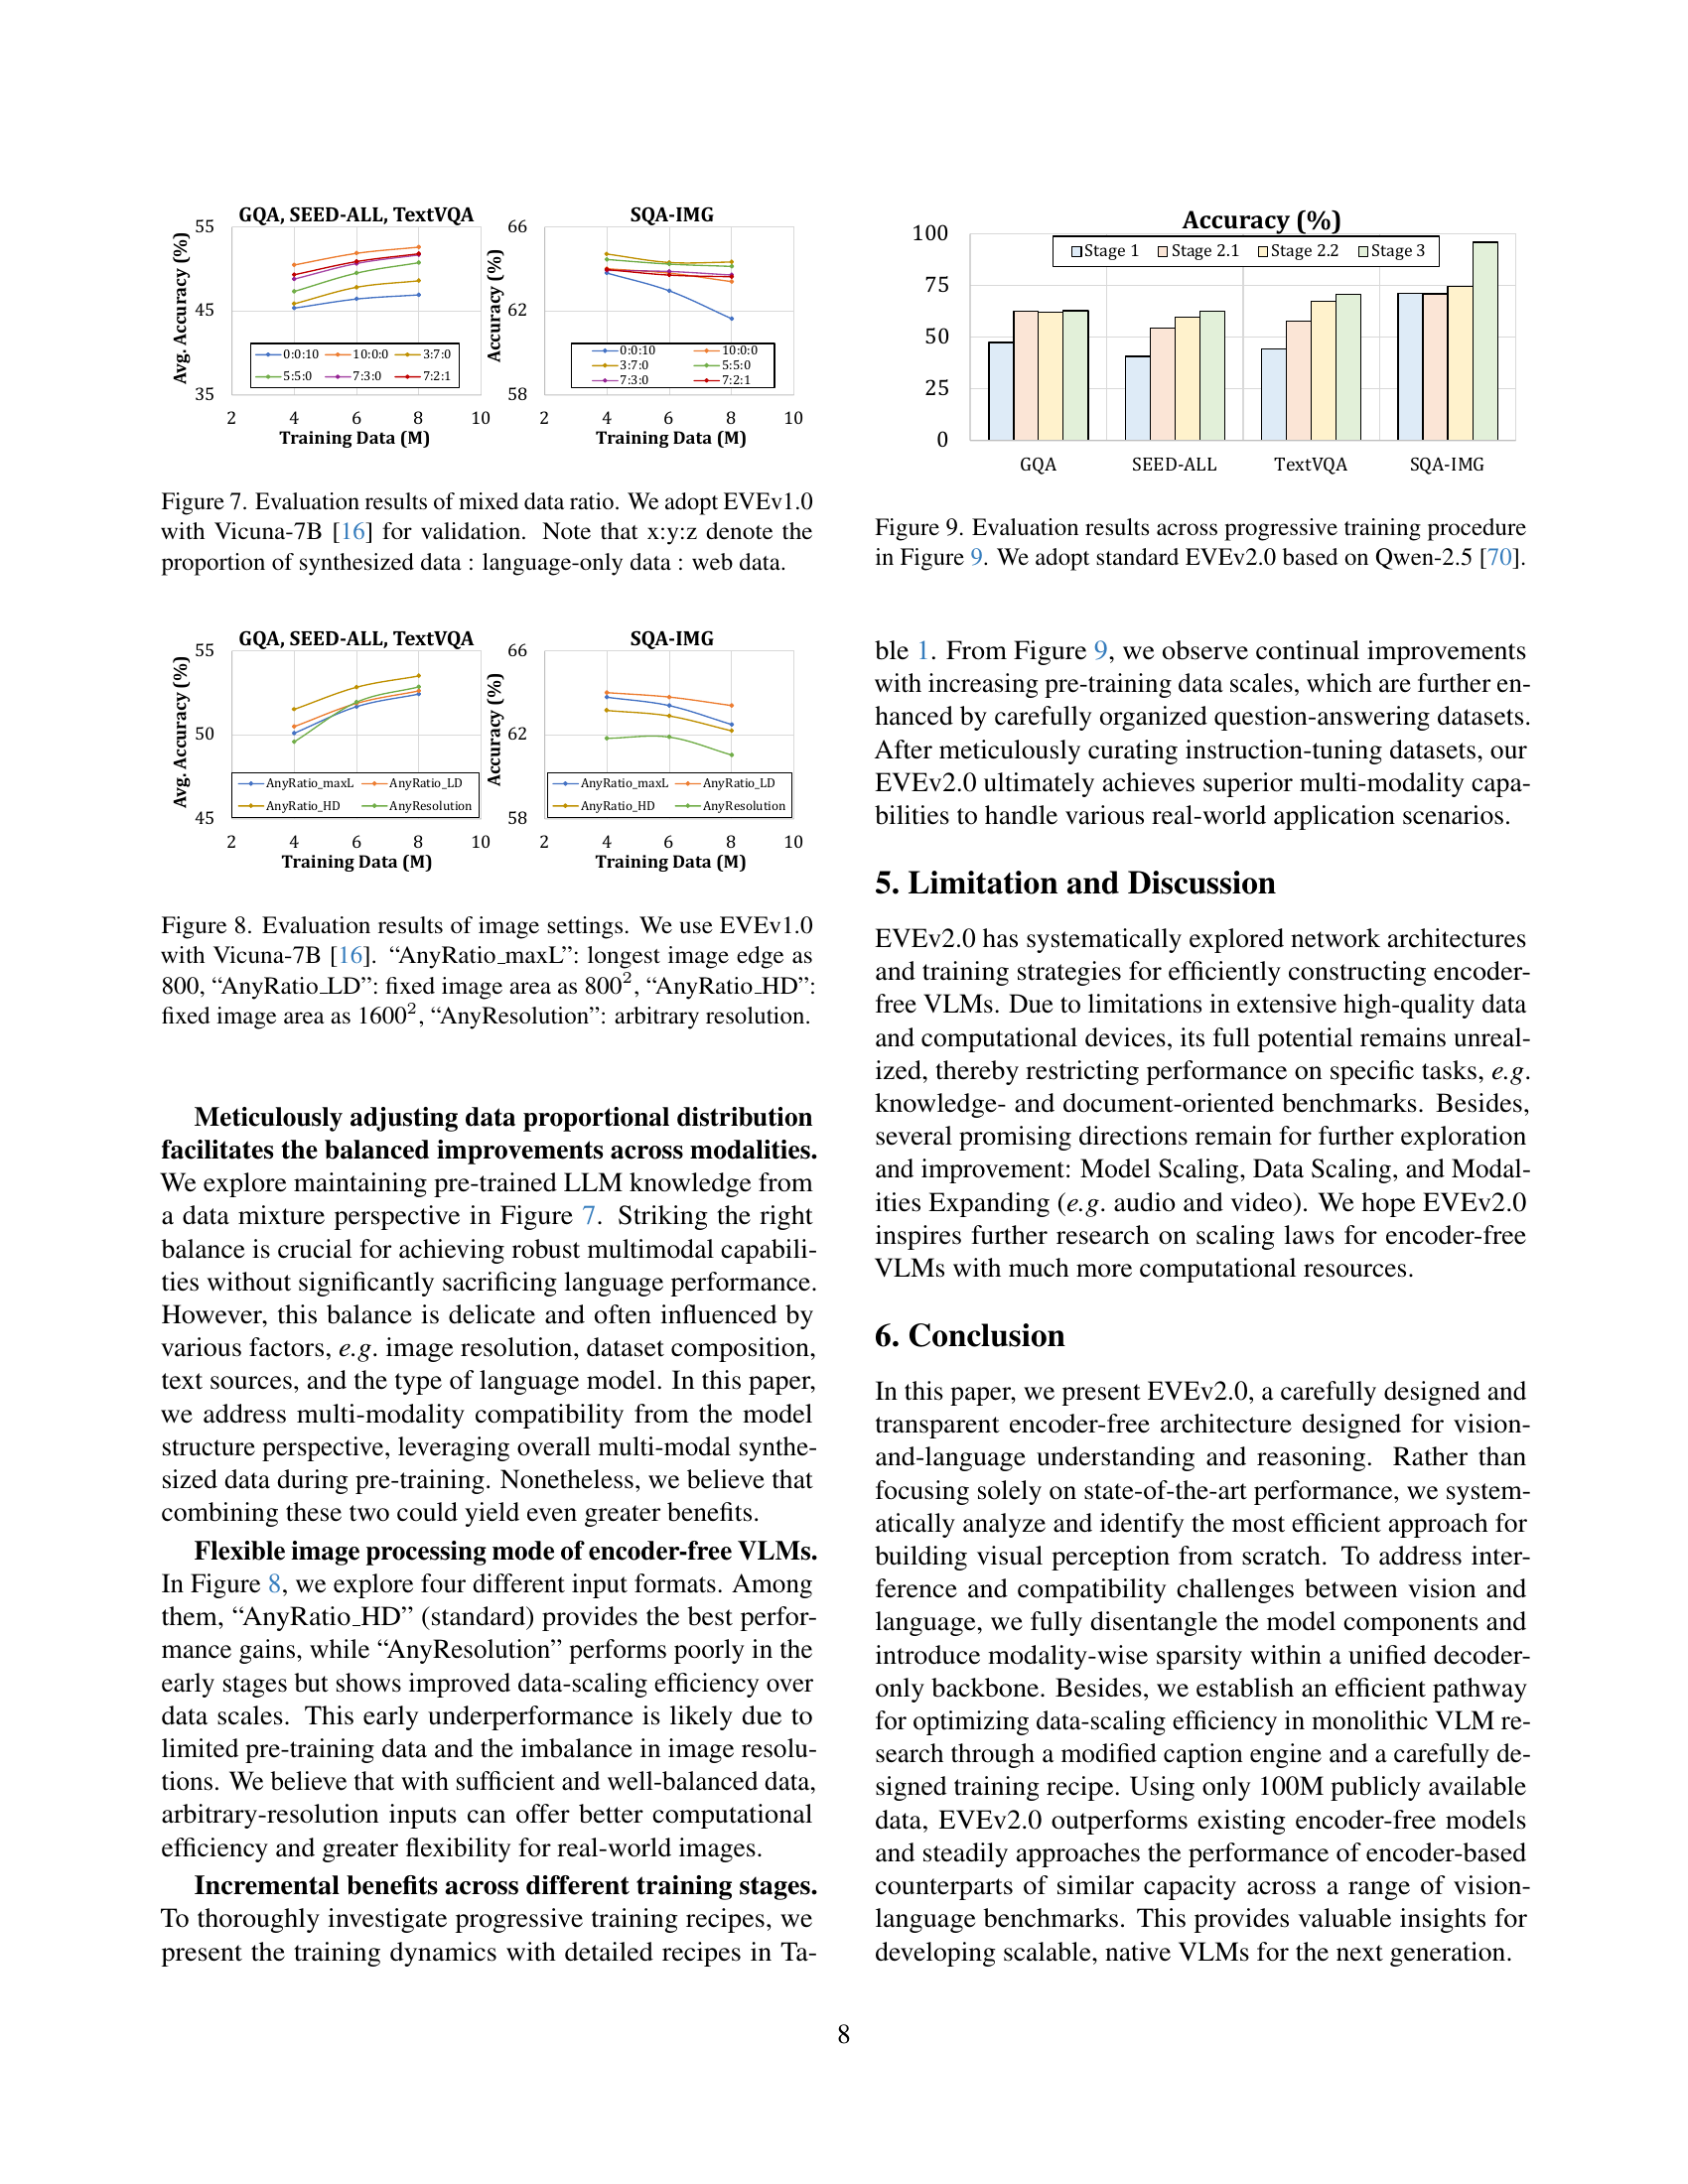
🔼 This figure displays the performance of EVEv1.0 (an encoder-free vision-language model) trained on various ratios of synthesized data, language-only data, and web data. The model is validated using the Vicuna-7B language model. The x-axis represents the training data composition (synthesized:language-only:web), and the y-axis shows the average accuracy across several benchmark datasets. The graph illustrates how different proportions of these data types impact the model’s performance on tasks requiring understanding of vision and language.
read the caption
Figure 7: Evaluation results of mixed data ratio. We adopt EVEv1.0 with Vicuna-7B [16] for validation. Note that x:y:z denote the proportion of synthesized data : language-only data : web data.
🔼 This figure displays the performance of EVEv1.0 (a vision-language model) on various vision-language benchmarks under different image input settings. Four distinct image processing strategies are compared: 1. AnyRatio_maxL: Images are resized such that the longest edge is 800 pixels. 2. AnyRatio_LD: Images are resized to maintain a fixed area of 800x800 pixels, preserving aspect ratio. 3. AnyRatio_HD: Similar to AnyRatio_LD but with a larger fixed area of 1600x1600 pixels. 4. AnyResolution: Images are processed at their original, arbitrary resolutions. The results show how the model’s performance varies with different image scaling and whether maintaining aspect ratio or using a fixed area is beneficial. The underlying language model used is Vicuna-7B.
read the caption
Figure 8: Evaluation results of image settings. We use EVEv1.0 with Vicuna-7B [16]. “AnyRatio_maxL”: longest image edge as 800, “AnyRatio_LD”: fixed image area as 8002, “AnyRatio_HD”: fixed image area as 16002, “AnyResolution”: arbitrary resolution.
More on tables
| Method | #A-Param | #Data | #Vtoken | MMMU | MMB | SEED | MMV | MME | POPE | GQA | SQA | TQA | CQA | AI2D | RWQA | OCRB |
| Encoder-based Vision-Language Models: | ||||||||||||||||
| InternVL-1.5 | 2.2B | – / – | 3328 | 34.6 | 70.9 | 69.8 | 39.3 | 1902 | 88.3 | 61.6 | 84.9 | 70.5 | 74.8 | 69.8 | – | 654 |
| QwenVL-Chat | 7B | 7.2B / 50M | 256 | 35.9 | 60.6 | 58.2 | – | 1848 | – | 57.5 | 68.2 | 61.5 | 49.8 | 45.9 | 49.3 | 488 |
| LLaVA-1.5 | 7B | 0.4B+ / 665K | 576 | 35.3 | 64.3 | 64.3 | 30.5 | 1859 | 85.9 | 62.0 | 66.8 | 46.1 | 18.2 | 54.8 | 54.8 | 318 |
| LLaVA-1.6 | 7B | 0.4B+ / 760K | 2880 | 35.1 | 67.4 | 64.7 | 43.9 | 1842 | 86.4 | 64.2 | 70.2 | 64.9 | 54.8 | 66.6 | 57.8 | 532 |
| Cambrian | 7B | 10B+ / 7M | 576 | 42.7 | 75.9 | 74.7 | – | – | – | 64.6 | 80.4 | 71.7 | 73.3 | 73.0 | 64.2 | – |
| LLaVA-OV | 7B | 10B+ / 3.2M | 7290 | 47.3 | 81.7 | 74.8 | 58.8 | 1998 | – | – | 96.6 | – | 78.8 | 81.6 | 65.5 | – |
| Encoder-free Vision-Language Models: | ||||||||||||||||
| Fuyu | 8B | – / – | – | 27.9 | 10.7 | – | 21.4 | – | – | – | – | – | – | 64.5 | – | – |
| Chameleon | 7B | 1.4B+ / 1.8M | 1024 | 25.4 | 31.1 | 30.6 | 8.3 | 170 | – | – | 47.2 | 4.8 | 2.9 | 46.0 | – | 7.0 |
| EVE | 7B | 33M / 1.8M | 2304 | 32.6 | 52.3 | 64.6 | 25.7 | 1628 | 85.0 | 62.6 | 64.9 | 56.8 | 59.1 | 61.0 | – | 398 |
| SOLO | 8B | 43.7M / 2M | 1024 | – | – | 64.4 | – | 1260 | – | – | 73.3 | – | – | 61.4 | – | – |
| Mono-InternVL | 1.8B | 1.3B / 7M | 6400 | 33.7 | 65.5 | 67.4 | 40.1 | 1875 | – | 59.5 | 93.6 | 72.6 | 73.7 | 68.6 | – | 767 |
| Emu3 | 8B | – / – | 16K | 31.6 | 58.5 | 68.2 | 37.2 | – | 85.2 | 60.3 | 89.2 | 64.7 | 68.6 | 70.0 | 57.4 | 687 |
| EVEv2.0 | 7B | 92M / 7.3M | 2500 | 39.3 | 66.3 | 71.4 | 45.0 | 1709 | 87.6 | 62.9 | 96.2 | 71.1 | 73.9 | 74.8 | 62.4 | 702 |
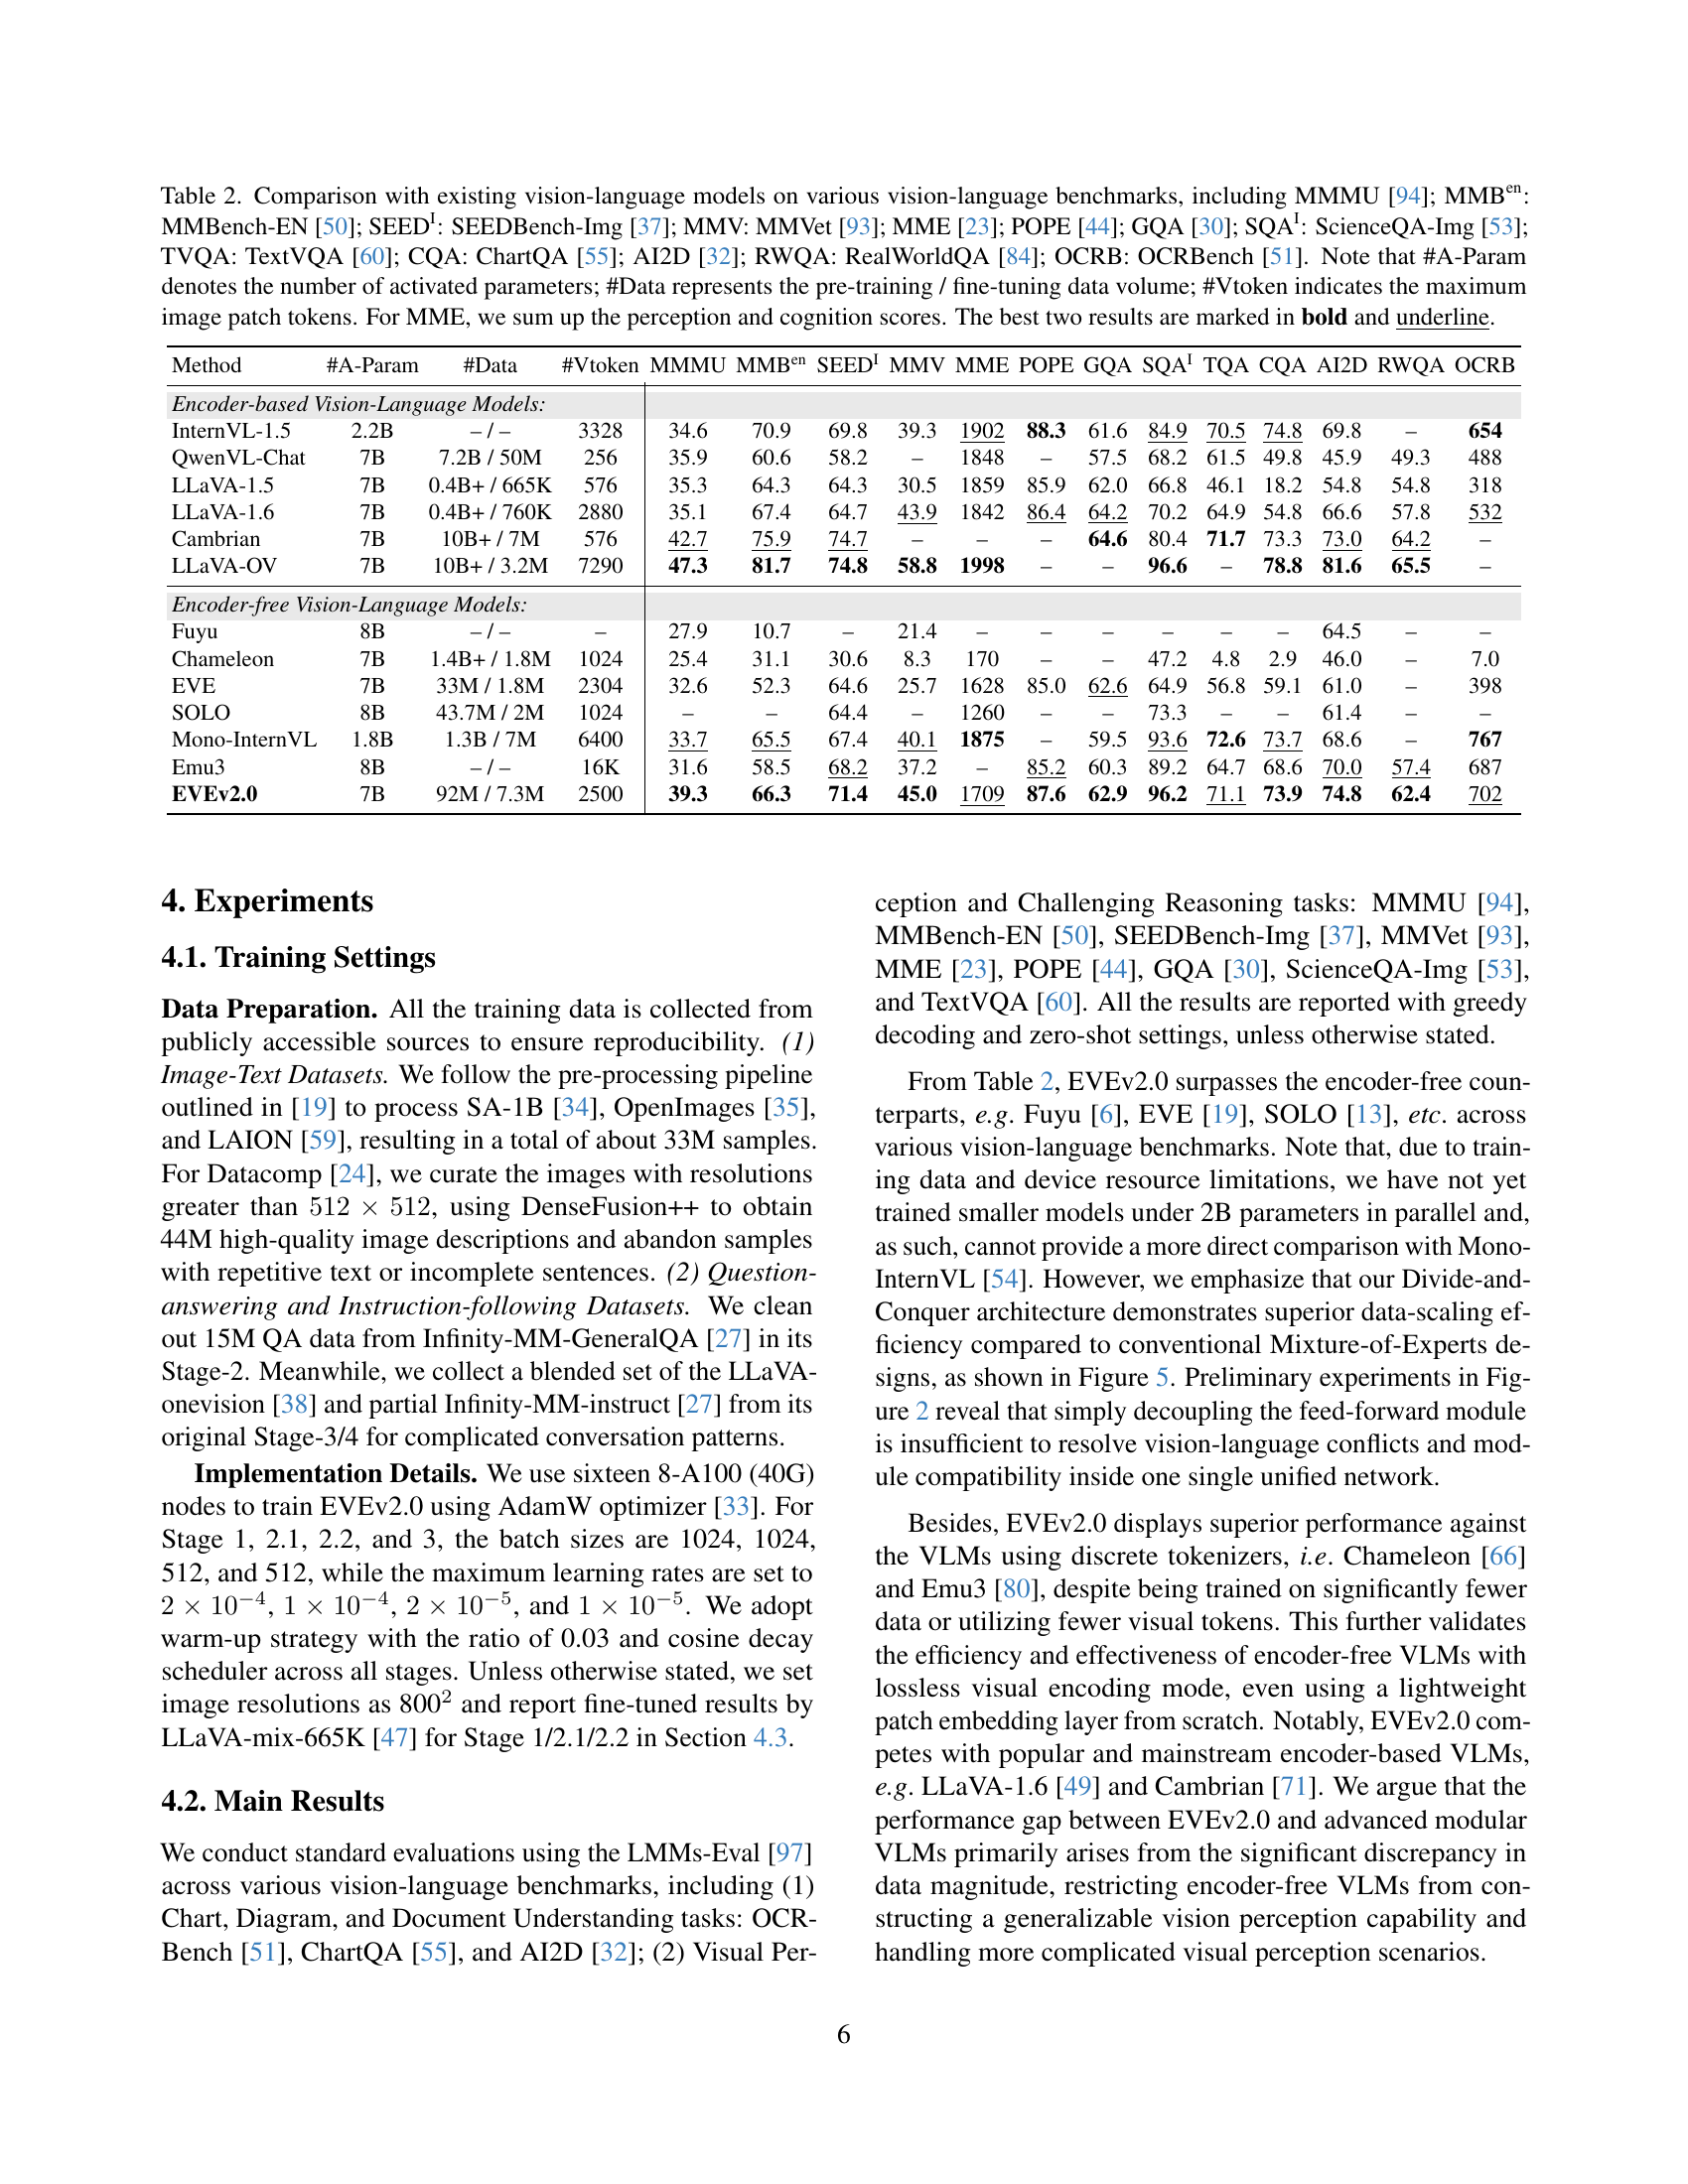
🔼 Table 2 presents a comprehensive comparison of EVEv2.0 against various state-of-the-art vision-language models across a range of benchmark datasets. These datasets assess diverse capabilities, including multimodal understanding (MMMU, MMBench-EN), visual reasoning (SEEDBench-Img, MMVet, MME, POPE, ScienceQA-Img), visual question answering (TextVQA, GQA), chart and diagram understanding (ChartQA, AI2D), and real-world question answering (RealWorldQA). The table details the number of activated parameters (#A-Param), the volume of pre-training/fine-tuning data (#Data), and the maximum number of image tokens (#Vtoken) used by each model. For the MME benchmark, the perception and cognition scores are summed for a single score. The top two performing models for each benchmark are highlighted in bold and underlined.
read the caption
Table 2: Comparison with existing vision-language models on various vision-language benchmarks, including MMMU [94]; MMBenen{}^{\text{en}}start_FLOATSUPERSCRIPT en end_FLOATSUPERSCRIPT: MMBench-EN [50]; SEEDII{}^{\text{I}}start_FLOATSUPERSCRIPT I end_FLOATSUPERSCRIPT: SEEDBench-Img [37]; MMV: MMVet [93]; MME [23]; POPE [44]; GQA [30]; SQAII{}^{\text{I}}start_FLOATSUPERSCRIPT I end_FLOATSUPERSCRIPT: ScienceQA-Img [53]; TVQA: TextVQA [60]; CQA: ChartQA [55]; AI2D [32]; RWQA: RealWorldQA [84]; OCRB: OCRBench [51]. Note that #A-Param denotes the number of activated parameters; #Data represents the pre-training / fine-tuning data volume; #Vtoken indicates the maximum image patch tokens. For MME, we sum up the perception and cognition scores. The best two results are marked in bold and underline.
| Exp. | Model | LLM | Stage 1 | Stage 2 | Stage 3 | |||||
| Data | T.M. | Training Data | Trainable Module | Data | T.M. | |||||
| Fig.2 (i) | EVEv1.0 | Vicuna-7B | EVE-cap-16M | PEL | EVE-cap-33M | PEL, LLM | LLaVA-mix-665k | PEL, LLM | ||
| \hdashlineFig.5 | EVEv1.0 | Qwen2.5-7B | EVE-recap-10M | PEL | EVE-recap-8/29M | PEL | LLaVA-mix-665k | PEL, LLM | ||
| EVEv1.2 | Qwen2.5-7B | EVE-recap-10M | PEL | EVE-recap-8/29M | PEL, VLayers | LLaVA-mix-665k | PEL, LLM | |||
| EVEv1.5 | Qwen2.5-7B | EVE-recap-10M | PEL | EVE-recap-8/29M | PEL, VLayers | LLaVA-mix-665k | PEL, LLM | |||
| EVEv2.0 | Qwen2.5-7B | EVE-recap-10M | PEL | EVE-recap-8/29M | PEL, VLayers | LLaVA-mix-665k | PEL, LLM | |||
| \hdashlineFig.6 | EVEv1.0 | Vicuna-7B | 10M varied data | PEL | 8M same data from Stage 1 | PEL, LLM | LLaVA-mix-665k | PEL, LLM | ||
| \hdashlineFig.7 | EVEv1.0 | Vicuna-7B | 10M varied data | PEL | 8M same data from Stage 1 | PEL, LLM | LLaVA-mix-665k | PEL, LLM | ||
| \hdashlineFig.8 | EVEv1.0 | Vicuna-7B | EVE-recap-10M | PEL | EVE-recap-8/29M | PEL, LLM | LLaVA-mix-665k | PEL, LLM | ||
| Exp. | Model | LLM | Stage 1 | Stage 2.1 | Stage 2.2 | Stage 3 | ||||
| Data | T.M. | Data | T.M. | Data | T.M. | Data | T.M. | |||
| Fig.2 (ii) | EVEv1.0 | Qwen2-7B | EVE-recap-10M | PEL | EVE-recap-29M | PEL | EVE-recap-48M | PEL, LLM | Various SFT data | PEL, LLM |
| EVEv1.2 | Qwen2-7B | EVE-recap-10M | PEL | EVE-recap-29M | PEL, VLayers | EVE-recap-48M | PEL, LLM | Various SFT data | PEL, LLM | |
| \hdashlineTab.2 | EVEv2.0 | Qwen2.5-7B | EVE-recap-10M | PEL | EVE-recap-77M | PEL, VLayers | EVE-multi-task-15M | PEL, LLM | EVE-sft-7M | PEL, LLM |
| \hdashlineFig.9 | EVEv2.0 | Qwen2.5-7B | EVE-recap-10M | PEL | EVE-recap-77M | PEL, VLayers | EVE-multi-task-15M | PEL, LLM | EVE-sft-7M | PEL, LLM |
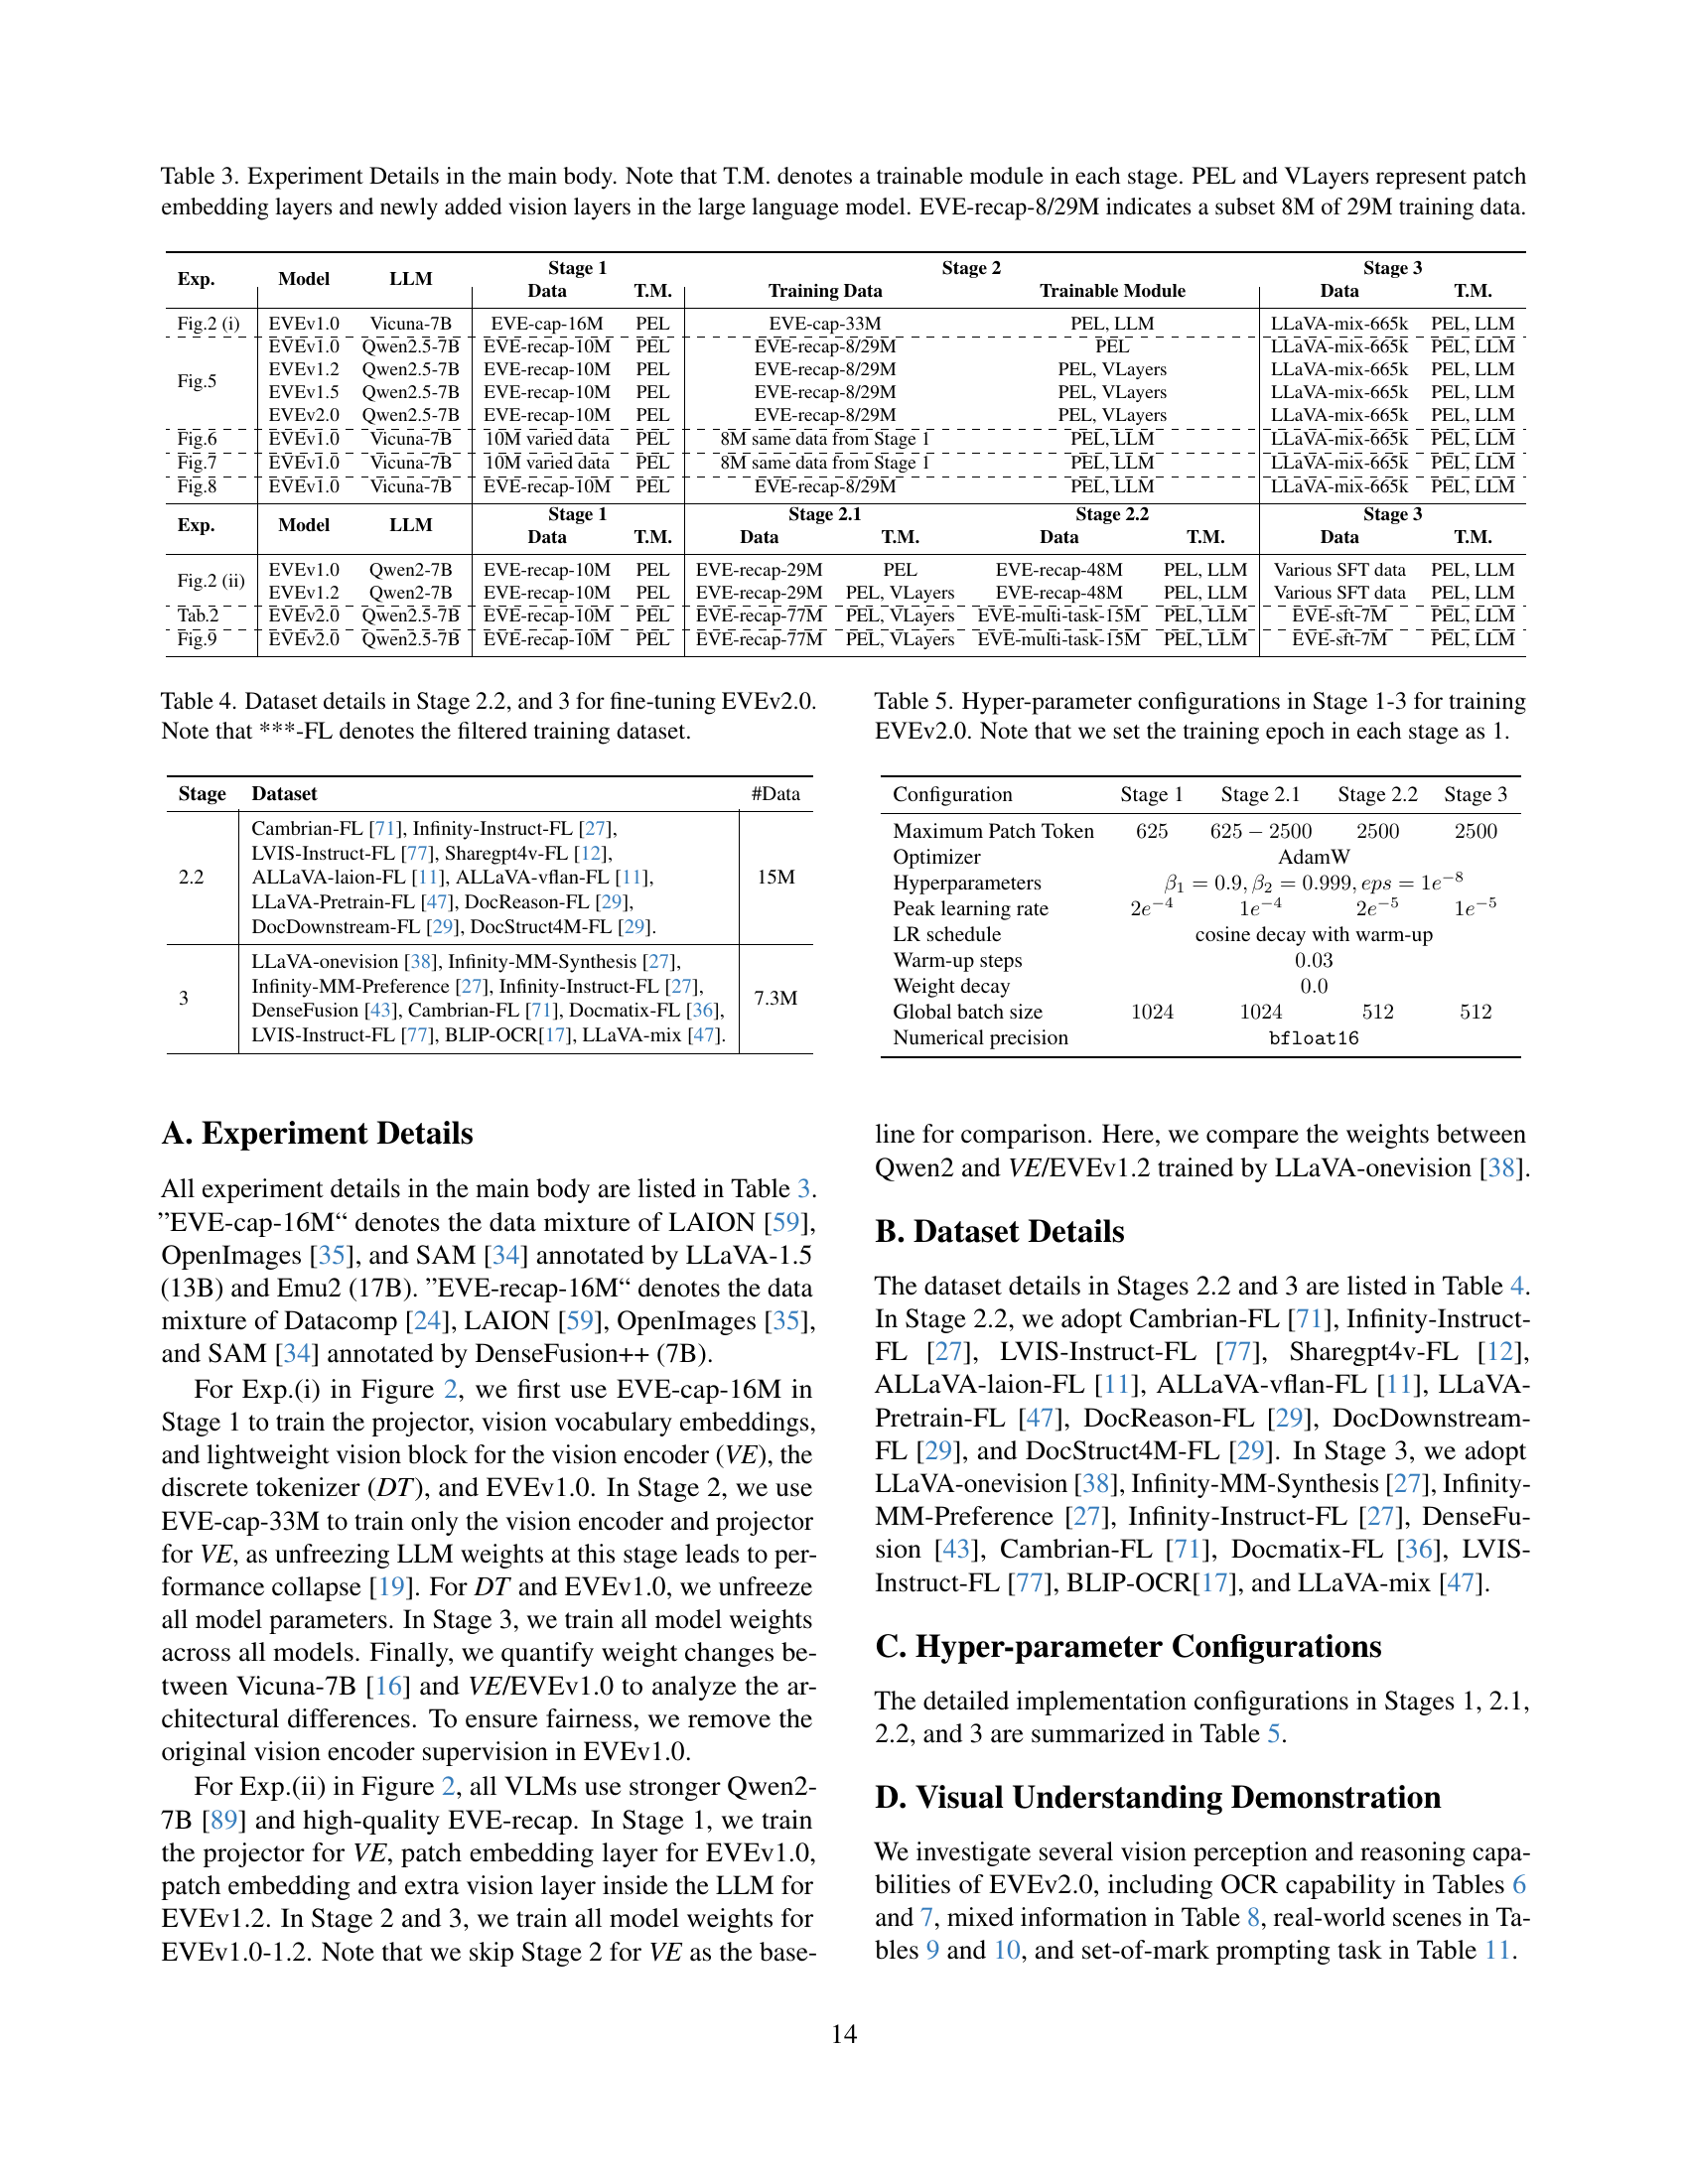
🔼 Table 3 details the experimental setup across three stages of training for various vision-language models. It shows the model used (e.g., EVEv1.0, EVEv1.2), the large language model (LLM) employed (e.g., Vicuna-7B, Qwen2-5-7B), the training data used in each stage, which modules were trainable (T.M. - Trainable Module) and the specific data used for training those modules. ‘PEL’ represents the patch embedding layer, and ‘VLayers’ refers to newly added visual layers within the LLM. ‘EVE-recap-8/29M’ denotes a subset of the data used, indicating that only 8 million samples out of 29 million were employed in that specific training phase. The table provides a clear overview of the model architectures and training procedures for different experiments.
read the caption
Table 3: Experiment Details in the main body. Note that T.M. denotes a trainable module in each stage. PEL and VLayers represent patch embedding layers and newly added vision layers in the large language model. EVE-recap-8/29M indicates a subset 8M of 29M training data.
| Stage | Dataset | #Data |
| 2.2 | Cambrian-FL [71], Infinity-Instruct-FL [27], | 15M |
| LVIS-Instruct-FL [77], Sharegpt4v-FL [12], | ||
| ALLaVA-laion-FL [11], ALLaVA-vflan-FL [11], | ||
| LLaVA-Pretrain-FL [47], DocReason-FL [29], | ||
| DocDownstream-FL [29], DocStruct4M-FL [29]. | ||
| 3 | LLaVA-onevision [38], Infinity-MM-Synthesis [27], | 7.3M |
| Infinity-MM-Preference [27], Infinity-Instruct-FL [27], | ||
| DenseFusion [43], Cambrian-FL [71], Docmatix-FL [36], | ||
| LVIS-Instruct-FL [77], BLIP-OCR[17], LLaVA-mix [47]. |
🔼 Table 4 details the datasets used in stages 2.2 and 3 of the EVEv2.0 model training. Stage 2.2 focuses on vision-text alignment, utilizing datasets like Cambrian-FL, Infinity-Instruct-FL, and LVIS-Instruct-FL, among others. These datasets contain diverse data types, encompassing general question-answering, instruction-following tasks, and more. Stage 3 is focused on supervised fine-tuning and uses datasets like LLaVA-onevision and Infinity-MM-Instruct, all designed to further improve the model’s understanding of vision and language. The ‘FL’ suffix indicates that these datasets have undergone a filtering process to enhance data quality.
read the caption
Table 4: Dataset details in Stage 2.2, and 3 for fine-tuning EVEv2.0. Note that ***-FL denotes the filtered training dataset.
| Configuration | Stage 1 | Stage 2.1 | Stage 2.2 | Stage 3 |
| Maximum Patch Token | ||||
| Optimizer | AdamW | |||
| Hyperparameters | ||||
| Peak learning rate | ||||
| LR schedule | cosine decay with warm-up | |||
| Warm-up steps | ||||
| Weight decay | ||||
| Global batch size | ||||
| Numerical precision | ||||
🔼 This table details the hyperparameters used during the three training stages of the EVEv2.0 model. It shows the settings for various aspects of the training process, including the optimizer used (AdamW), learning rates, learning rate scheduling (cosine decay with warm-up), weight decay, batch size, and numerical precision. Each stage represents a distinct phase in the training, each having its own set of hyperparameter configurations. The number of training epochs for each stage is also noted (1 epoch per stage).
read the caption
Table 5: Hyper-parameter configurations in Stage 1-3 for training EVEv2.0. Note that we set the training epoch in each stage as 1.
![[Uncaptioned image]](extracted/6191103/figures/examples/MAR.jpg) | |
| User | Please output all the text information. |
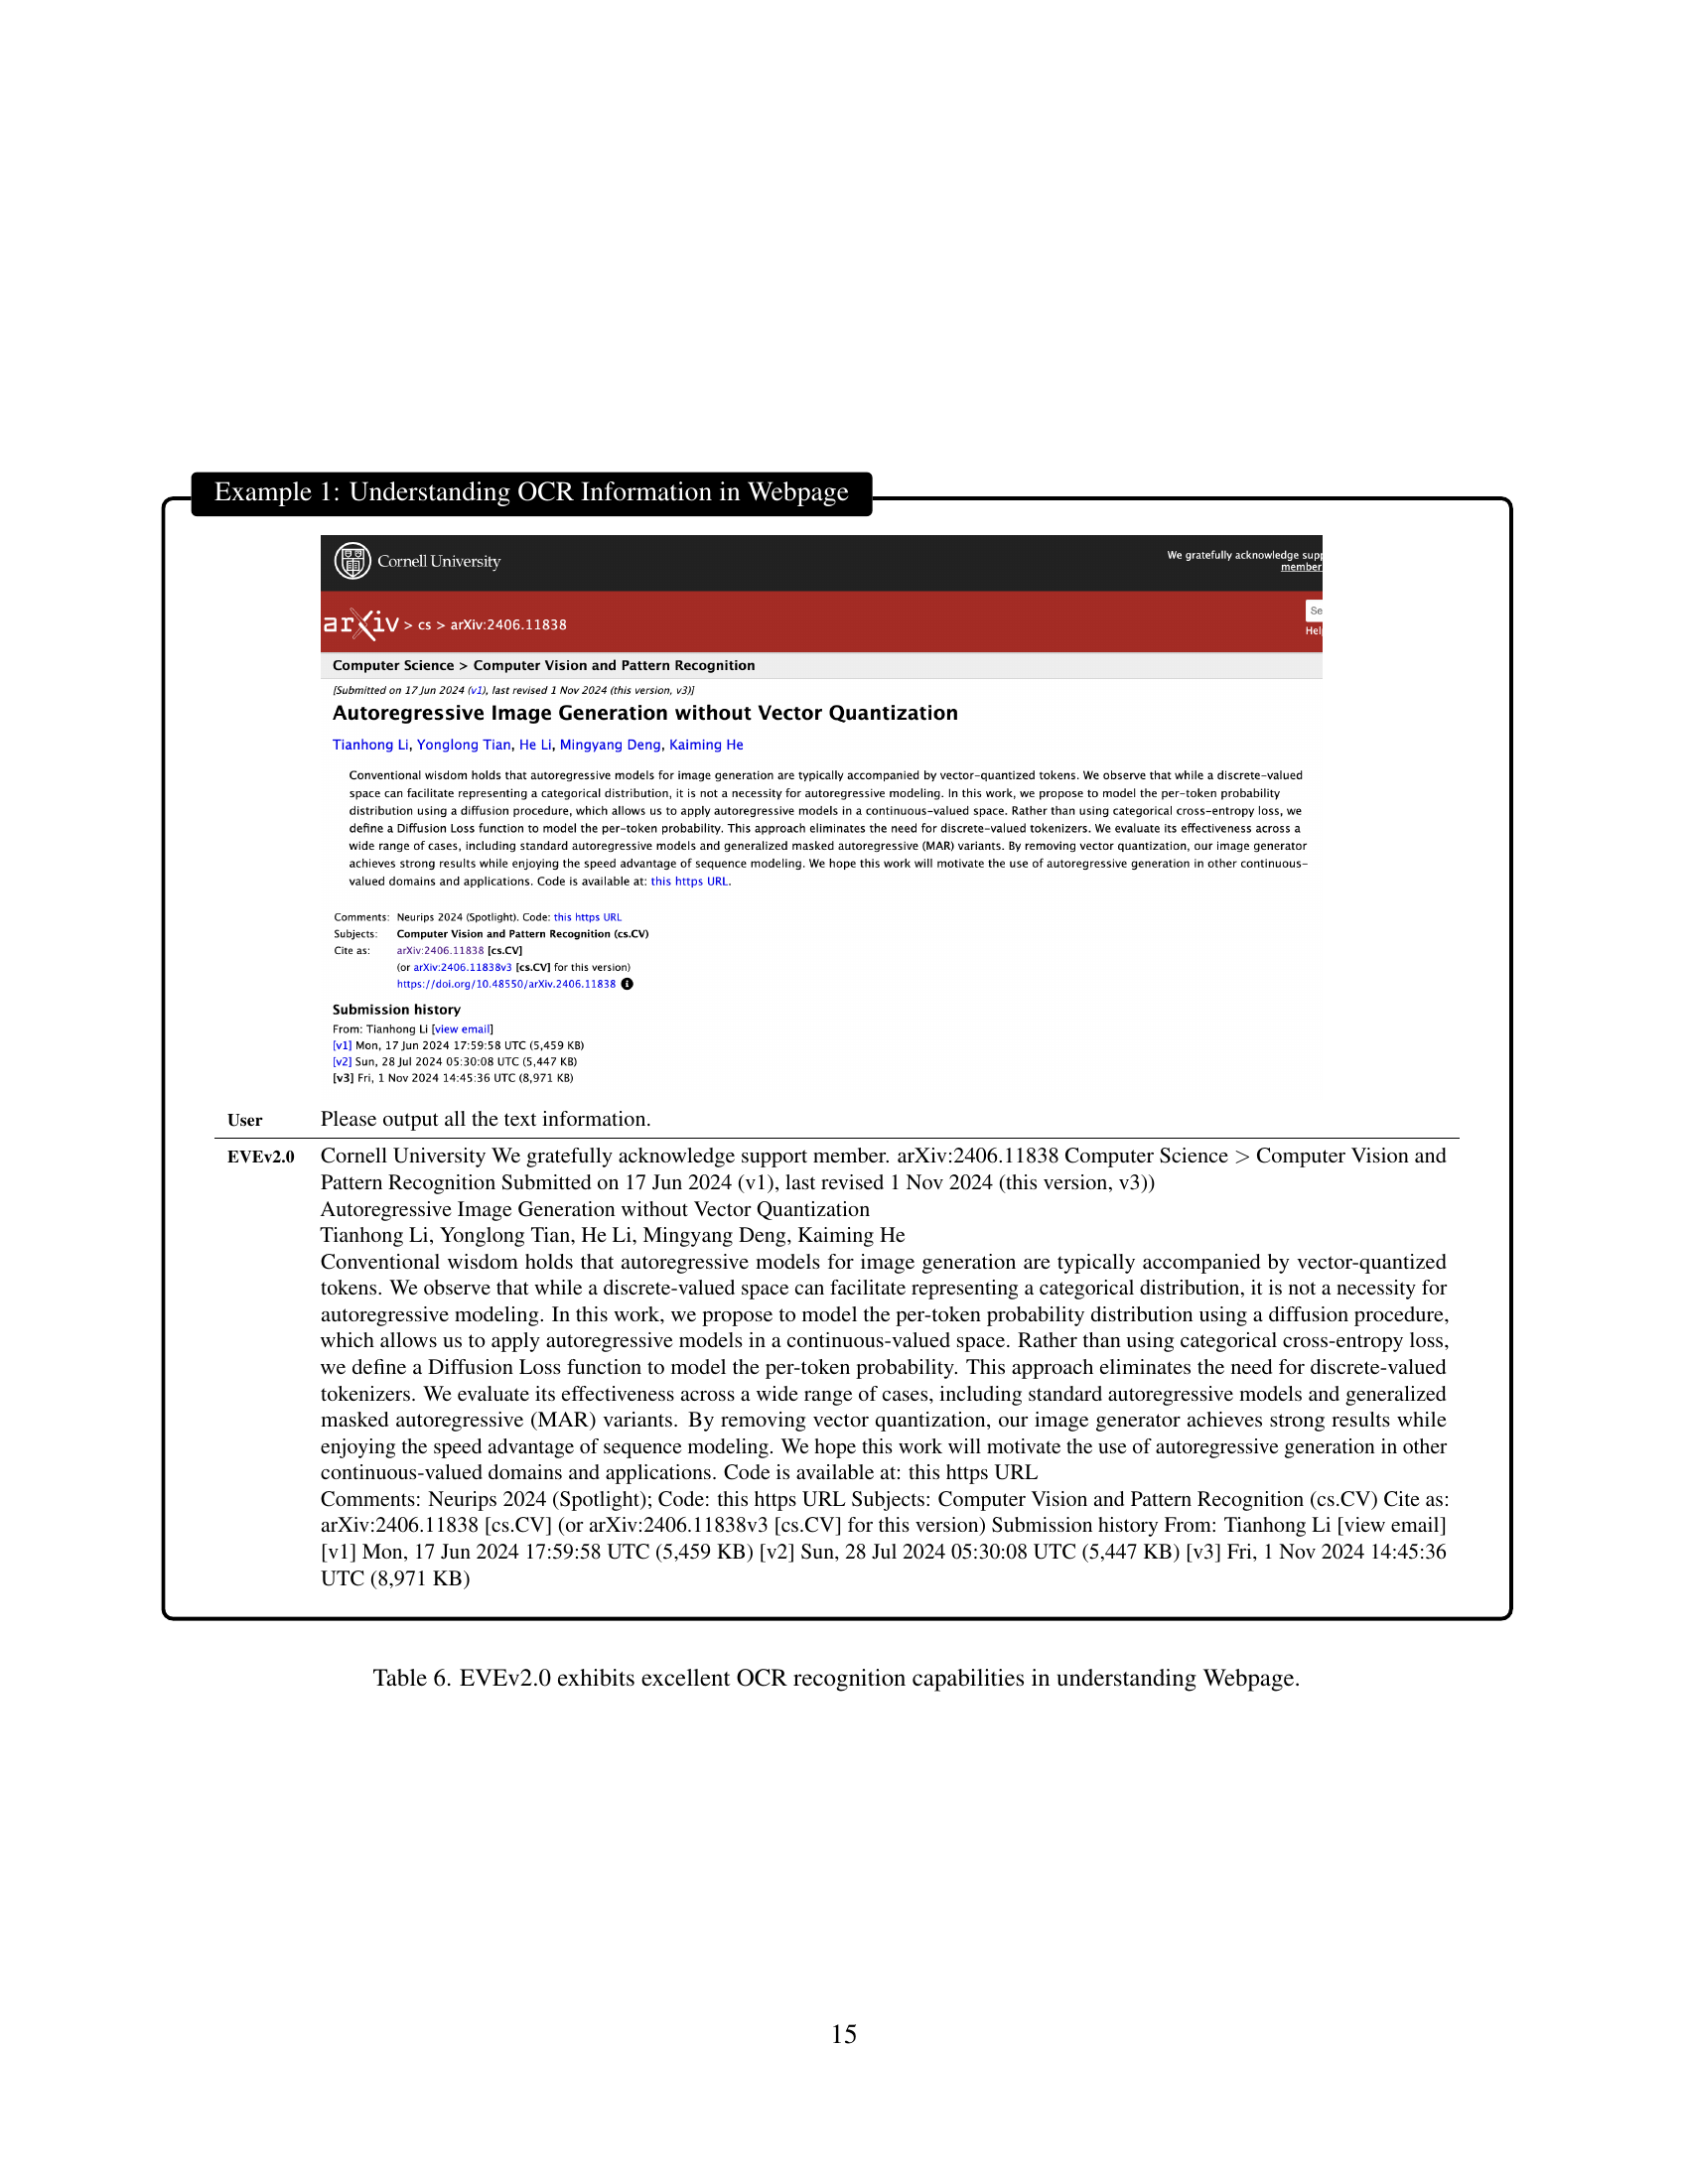
| EVEv2.0 | Cornell University We gratefully acknowledge support member. arXiv:2406.11838 Computer Science Computer Vision and Pattern Recognition Submitted on 17 Jun 2024 (v1), last revised 1 Nov 2024 (this version, v3)) Autoregressive Image Generation without Vector Quantization Tianhong Li, Yonglong Tian, He Li, Mingyang Deng, Kaiming He Conventional wisdom holds that autoregressive models for image generation are typically accompanied by vector-quantized tokens. We observe that while a discrete-valued space can facilitate representing a categorical distribution, it is not a necessity for autoregressive modeling. In this work, we propose to model the per-token probability distribution using a diffusion procedure, which allows us to apply autoregressive models in a continuous-valued space. Rather than using categorical cross-entropy loss, we define a Diffusion Loss function to model the per-token probability. This approach eliminates the need for discrete-valued tokenizers. We evaluate its effectiveness across a wide range of cases, including standard autoregressive models and generalized masked autoregressive (MAR) variants. By removing vector quantization, our image generator achieves strong results while enjoying the speed advantage of sequence modeling. We hope this work will motivate the use of autoregressive generation in other continuous-valued domains and applications. Code is available at: this https URL Comments: Neurips 2024 (Spotlight); Code: this https URL Subjects: Computer Vision and Pattern Recognition (cs.CV) Cite as: arXiv:2406.11838 [cs.CV] (or arXiv:2406.11838v3 [cs.CV] for this version) Submission history From: Tianhong Li [view email] [v1] Mon, 17 Jun 2024 17:59:58 UTC (5,459 KB) [v2] Sun, 28 Jul 2024 05:30:08 UTC (5,447 KB) [v3] Fri, 1 Nov 2024 14:45:36 UTC (8,971 KB) |
🔼 Table 6 demonstrates EVEv2.0’s capacity to accurately extract text information from a webpage. It showcases the model’s ability to perform Optical Character Recognition (OCR) and accurately interpret the extracted text within the context of the webpage. This highlights the model’s strong vision and language understanding capabilities, particularly in complex scenarios.
read the caption
Table 6: EVEv2.0 exhibits excellent OCR recognition capabilities in understanding Webpage.
![[Uncaptioned image]](extracted/6191103/figures/examples/ocr_beijing.jpg) | |
| User | Please describe the image in detail. |
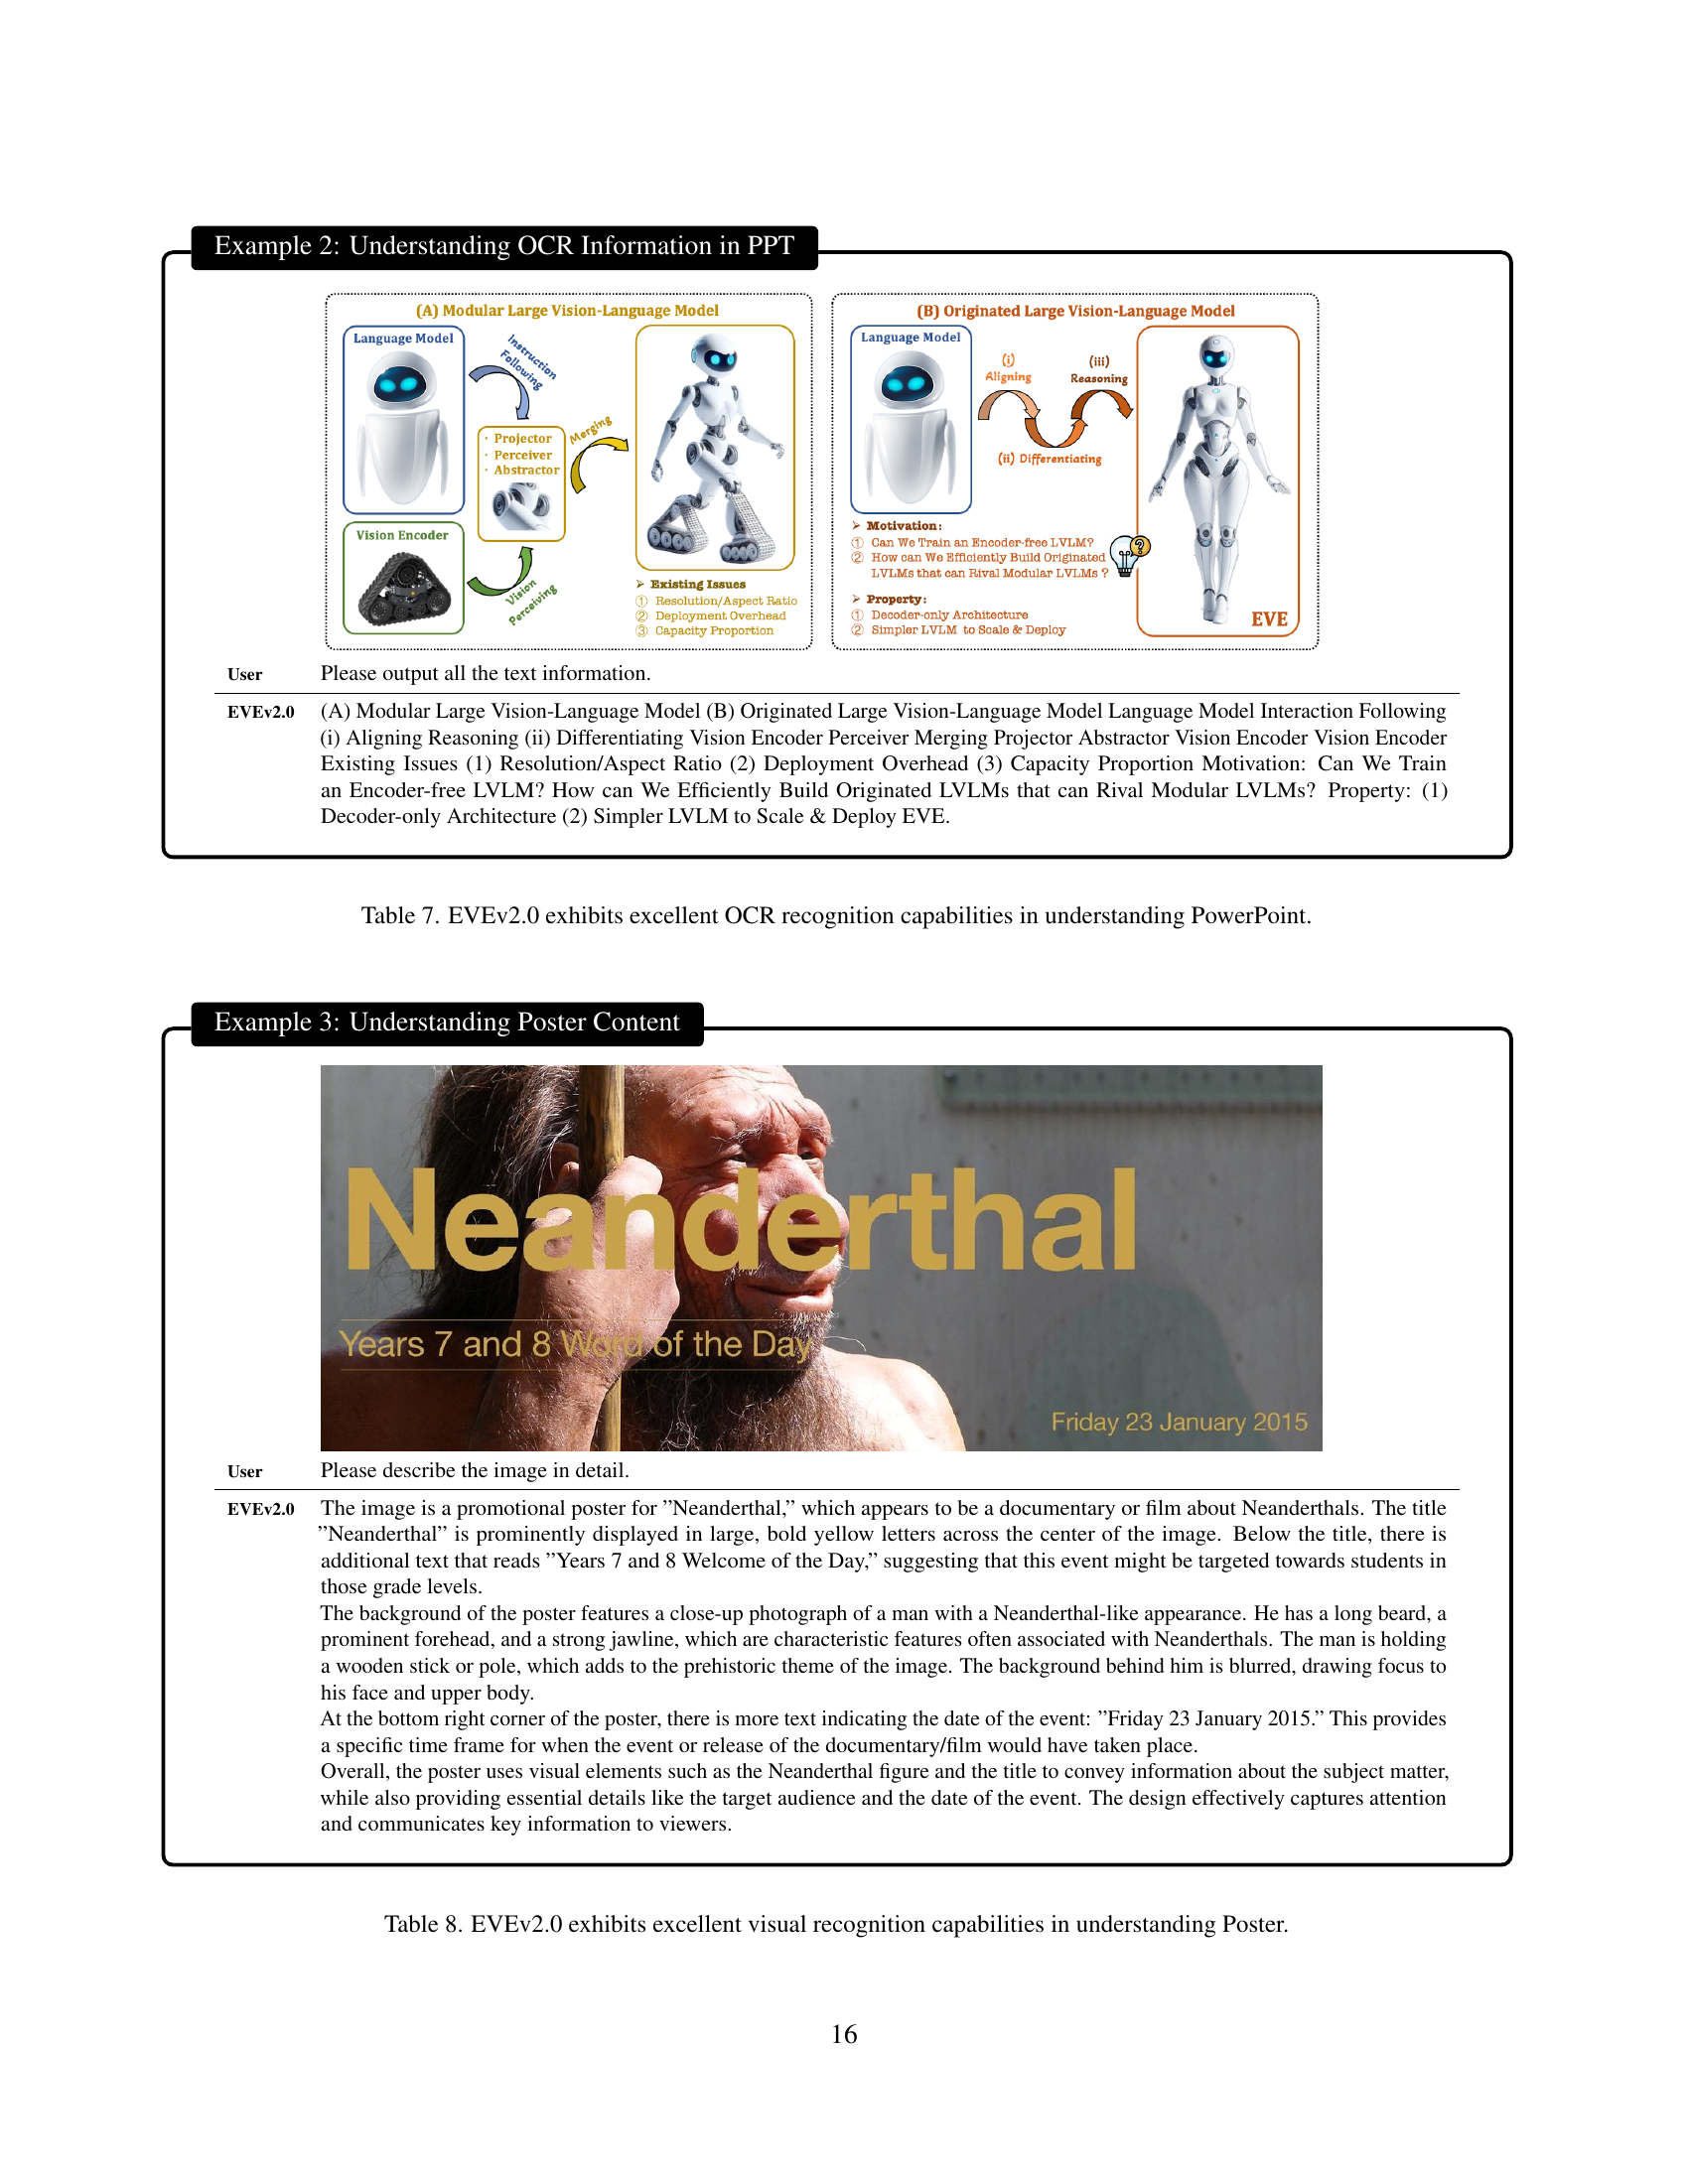
| EVEv2.0 | The image is a promotional poster for ”Neanderthal,” which appears to be a documentary or film about Neanderthals. The title ”Neanderthal” is prominently displayed in large, bold yellow letters across the center of the image. Below the title, there is additional text that reads ”Years 7 and 8 Welcome of the Day,” suggesting that this event might be targeted towards students in those grade levels. The background of the poster features a close-up photograph of a man with a Neanderthal-like appearance. He has a long beard, a prominent forehead, and a strong jawline, which are characteristic features often associated with Neanderthals. The man is holding a wooden stick or pole, which adds to the prehistoric theme of the image. The background behind him is blurred, drawing focus to his face and upper body. At the bottom right corner of the poster, there is more text indicating the date of the event: ”Friday 23 January 2015.” This provides a specific time frame for when the event or release of the documentary/film would have taken place. Overall, the poster uses visual elements such as the Neanderthal figure and the title to convey information about the subject matter, while also providing essential details like the target audience and the date of the event. The design effectively captures attention and communicates key information to viewers. |
🔼 Table 7 demonstrates EVEv2.0’s capability to accurately extract text information from PowerPoint slides. It showcases the model’s proficiency in Optical Character Recognition (OCR), a crucial aspect of multimodal understanding where the model needs to correctly identify and interpret text within images. The table likely contains examples of PowerPoint slides and the corresponding text extracted by EVEv2.0, highlighting the model’s ability to handle various formatting styles and layouts commonly encountered in presentations.
read the caption
Table 7: EVEv2.0 exhibits excellent OCR recognition capabilities in understanding PowerPoint.
![[Uncaptioned image]](extracted/6191103/figures/examples/background.jpg) | |
| User | Please describe the image in detail. |
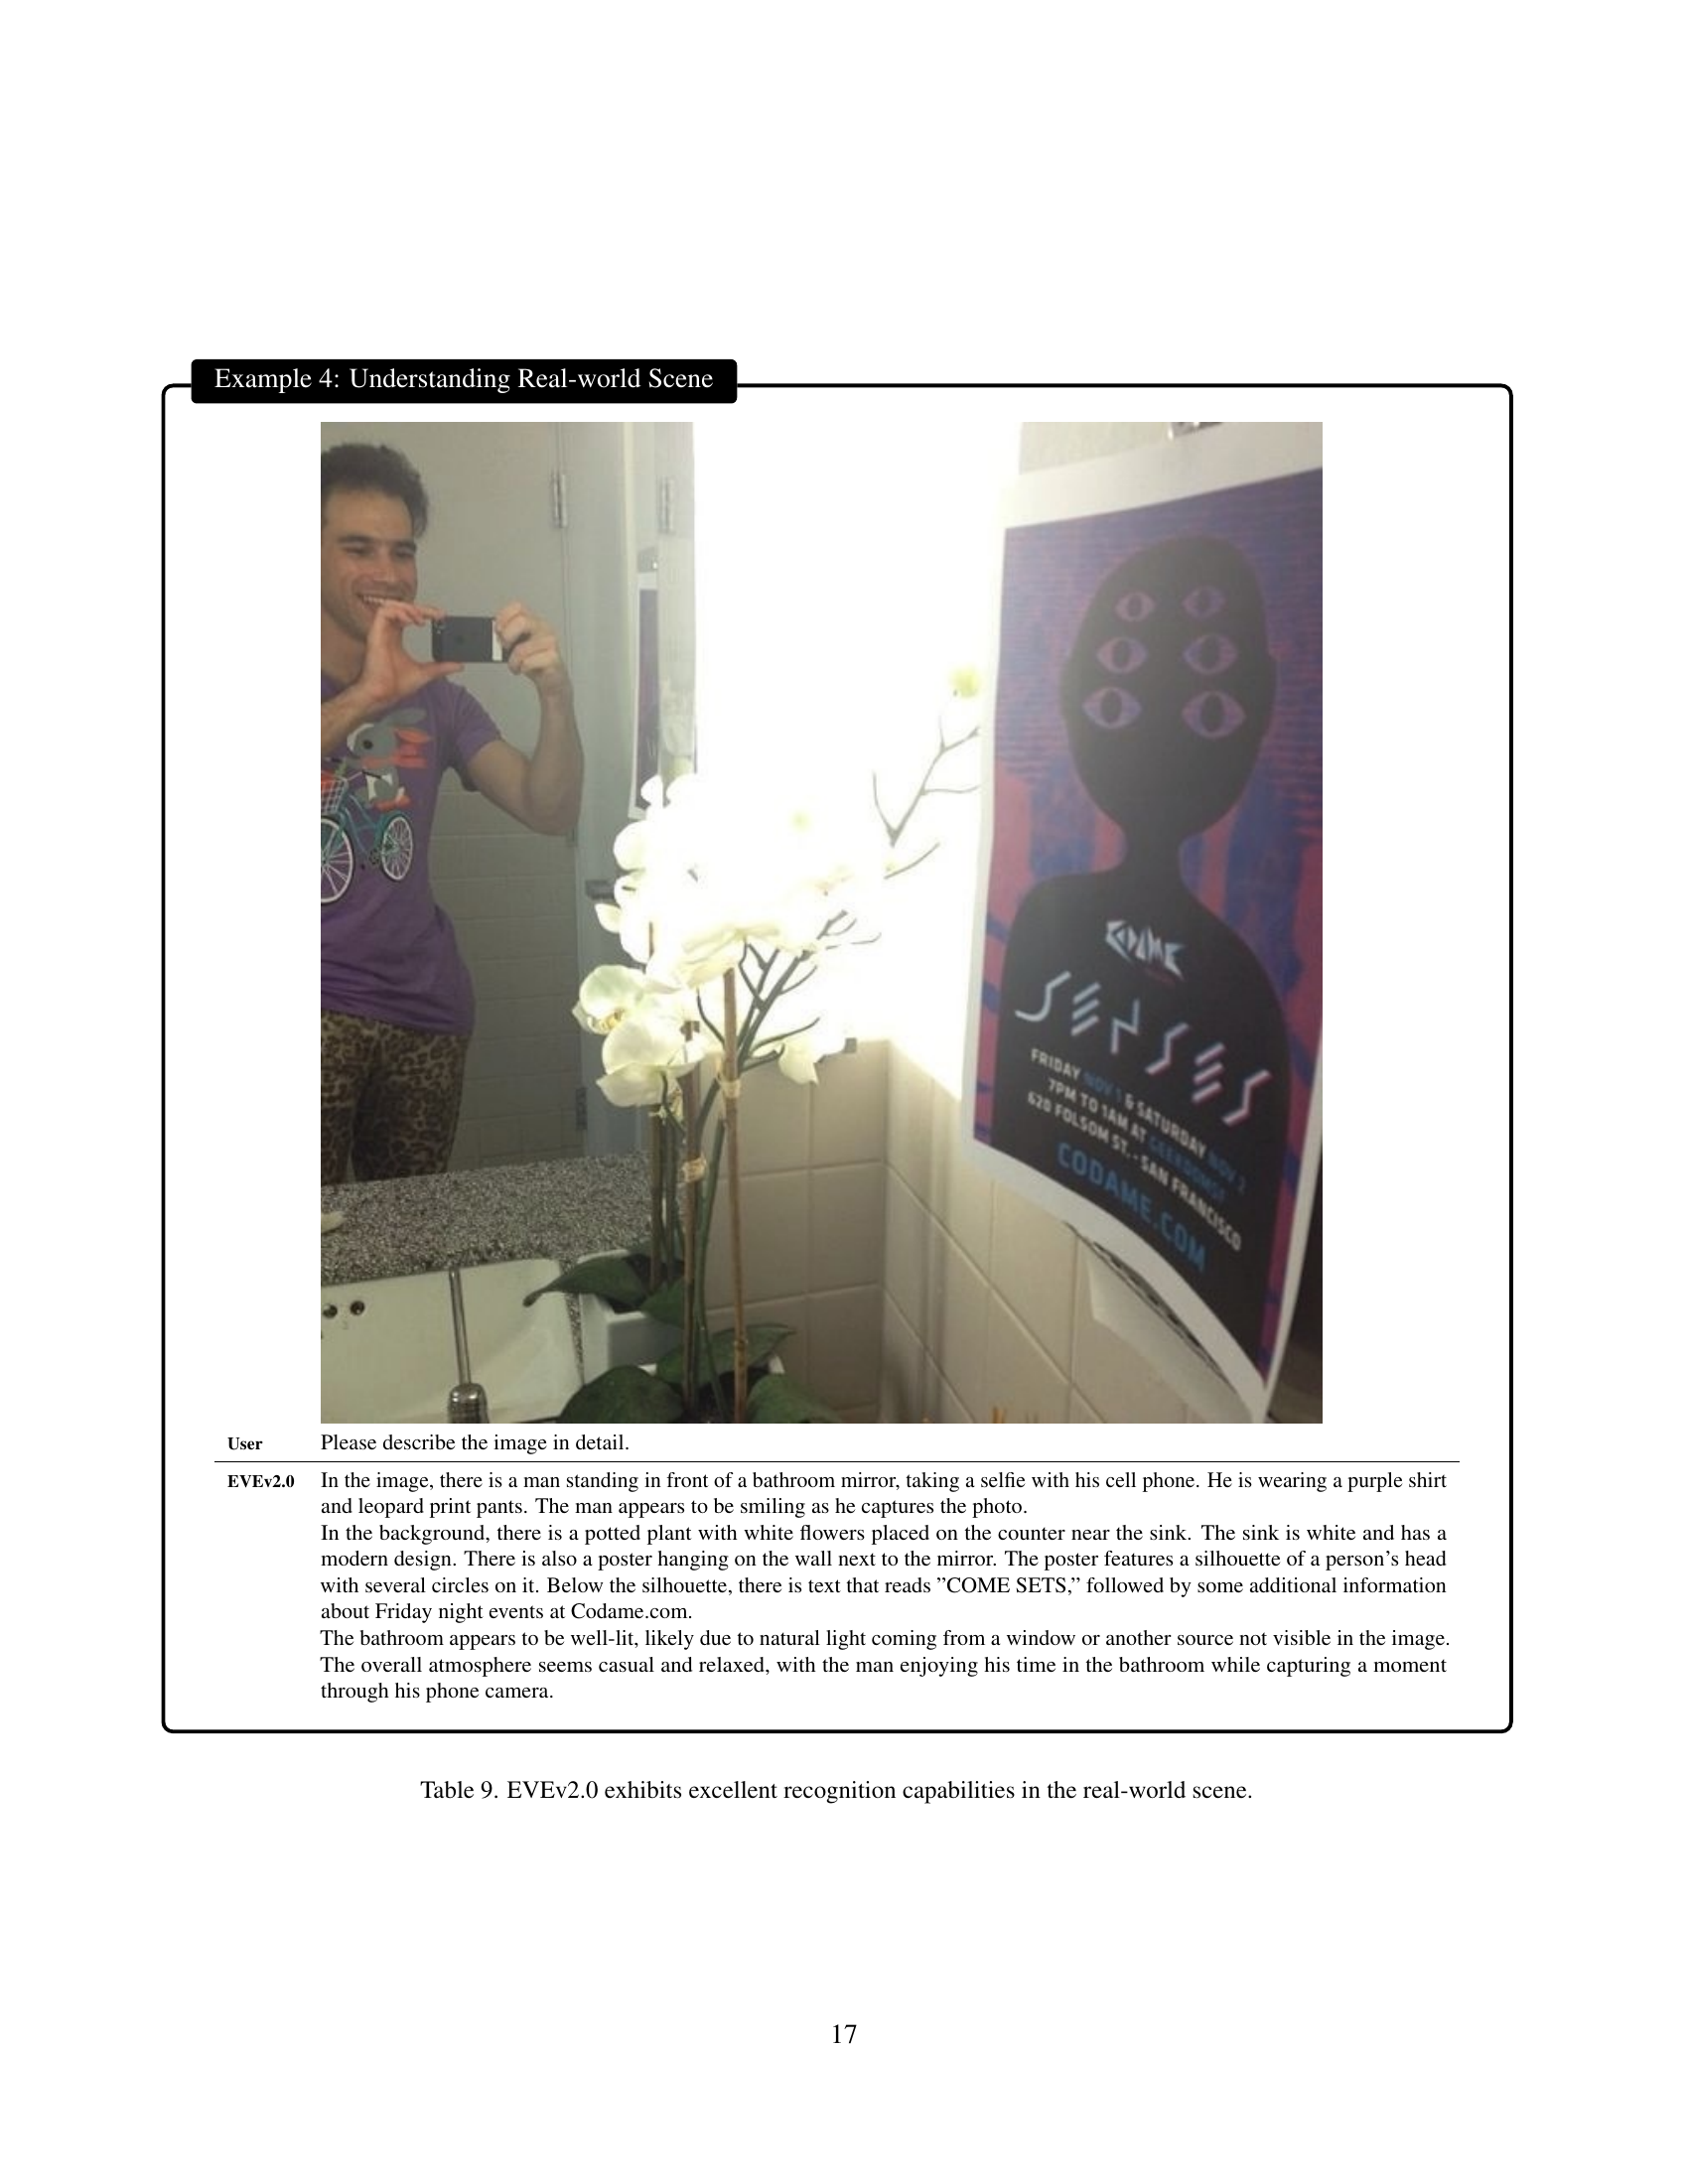
| EVEv2.0 | In the image, there is a man standing in front of a bathroom mirror, taking a selfie with his cell phone. He is wearing a purple shirt and leopard print pants. The man appears to be smiling as he captures the photo. In the background, there is a potted plant with white flowers placed on the counter near the sink. The sink is white and has a modern design. There is also a poster hanging on the wall next to the mirror. The poster features a silhouette of a person’s head with several circles on it. Below the silhouette, there is text that reads ”COME SETS,” followed by some additional information about Friday night events at Codame.com. The bathroom appears to be well-lit, likely due to natural light coming from a window or another source not visible in the image. The overall atmosphere seems casual and relaxed, with the man enjoying his time in the bathroom while capturing a moment through his phone camera. |
🔼 Table 8 showcases EVEv2.0’s capacity to thoroughly grasp the visual details of a poster. It demonstrates the model’s ability to not only identify the main components (title, text, image) but also accurately describe their content and context, including the subject of the poster (Neanderthals), its likely target audience (students), and even subtle details such as the date and style. This example highlights the model’s advanced visual recognition capabilities and its capacity for complex scene understanding.
read the caption
Table 8: EVEv2.0 exhibits excellent visual recognition capabilities in understanding Poster.
![[Uncaptioned image]](extracted/6191103/figures/examples/mac.jpg) | |
| User | Please describe the image in detail. |
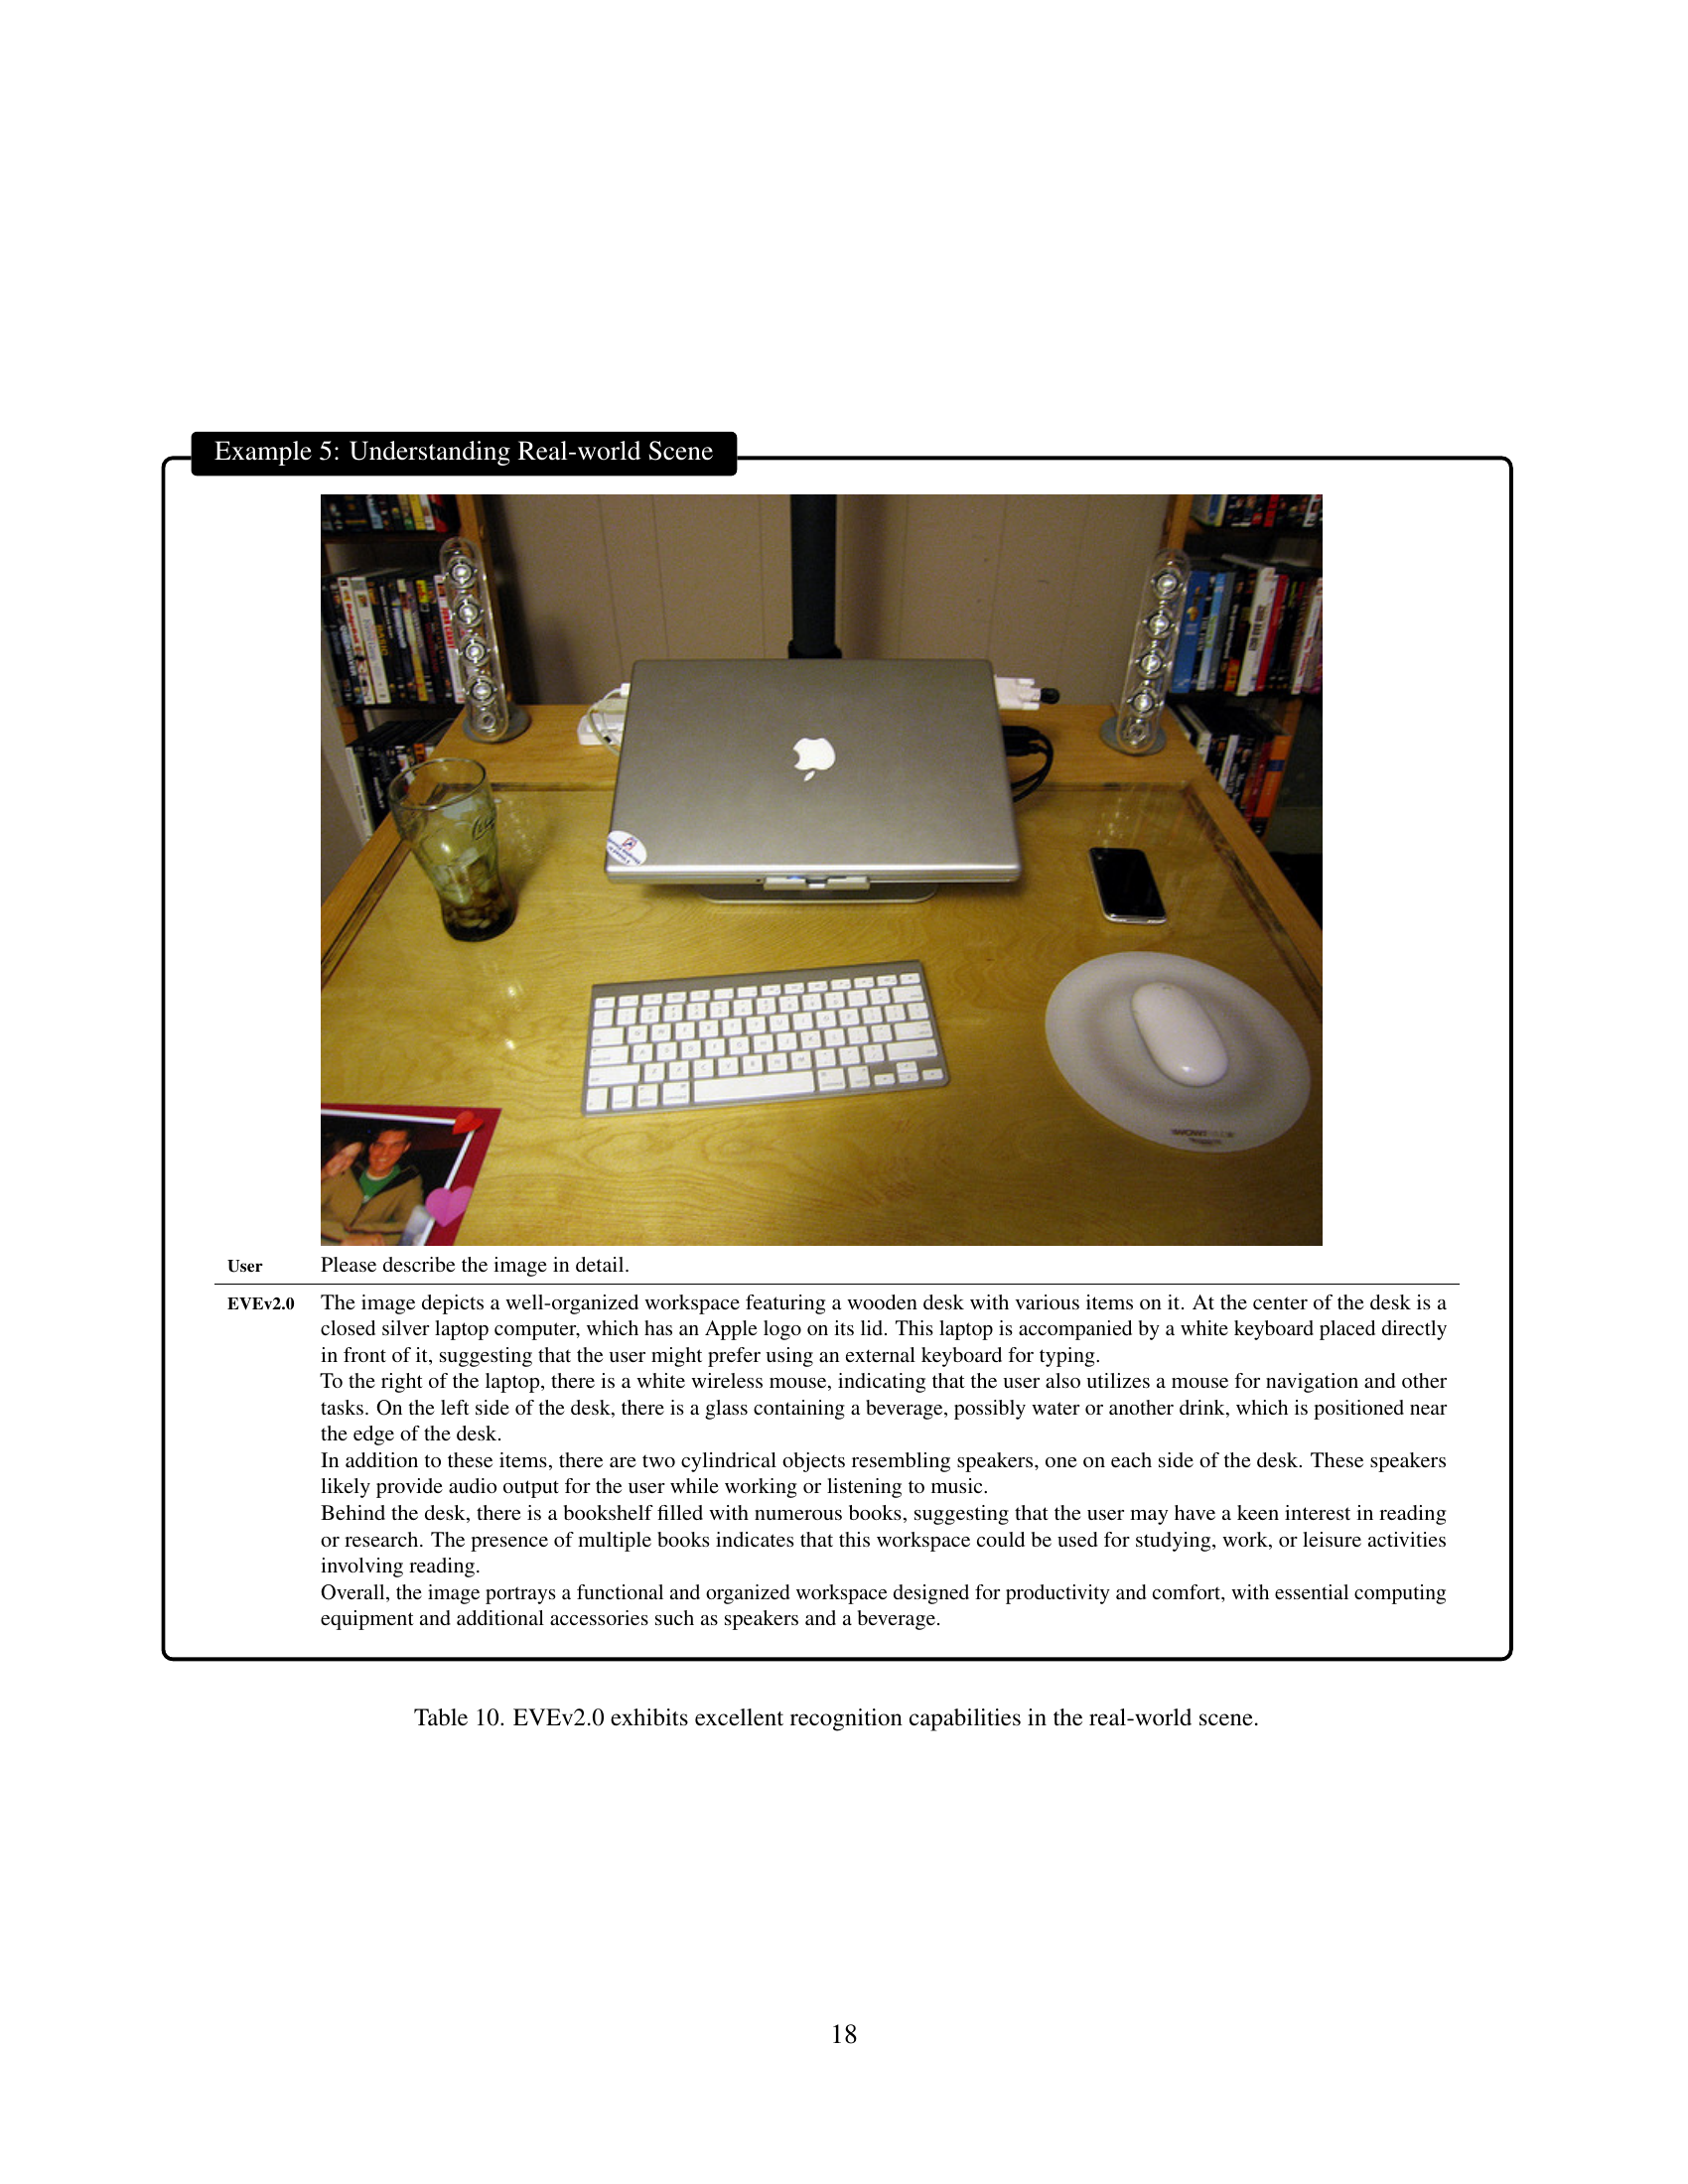
| EVEv2.0 | The image depicts a well-organized workspace featuring a wooden desk with various items on it. At the center of the desk is a closed silver laptop computer, which has an Apple logo on its lid. This laptop is accompanied by a white keyboard placed directly in front of it, suggesting that the user might prefer using an external keyboard for typing. To the right of the laptop, there is a white wireless mouse, indicating that the user also utilizes a mouse for navigation and other tasks. On the left side of the desk, there is a glass containing a beverage, possibly water or another drink, which is positioned near the edge of the desk. In addition to these items, there are two cylindrical objects resembling speakers, one on each side of the desk. These speakers likely provide audio output for the user while working or listening to music. Behind the desk, there is a bookshelf filled with numerous books, suggesting that the user may have a keen interest in reading or research. The presence of multiple books indicates that this workspace could be used for studying, work, or leisure activities involving reading. Overall, the image portrays a functional and organized workspace designed for productivity and comfort, with essential computing equipment and additional accessories such as speakers and a beverage. |
🔼 Table 9 showcases EVEv2.0’s performance on a real-world image understanding task. The image depicts a person taking a selfie in a bathroom. The model accurately identifies various objects in the scene, including the person, their clothing, a plant, a sink, and a poster on the wall, demonstrating its capacity for detailed visual recognition and comprehension.
read the caption
Table 9: EVEv2.0 exhibits excellent recognition capabilities in the real-world scene.
![[Uncaptioned image]](extracted/6191103/figures/examples/som.png) | |
| User | Here is an image with objects labeled in numbers. Please describe the objects that are marked as 9, 12 and 15. |
| EVEv2.0 | In the image, there are three objects marked with numbers: 9, 12, and 15. Object 9: A laptop computer is placed on the desk. It appears to be open and ready for use. Object 12: A lamp is situated near the desk, providing light for the workspace. It has a sleek design and complements the overall aesthetic of the room. Object 15: A potted plant is located on the desk, adding a touch of greenery and life to the space. It contributes to creating a more pleasant and inviting atmosphere in the room. |
🔼 Table 10 showcases EVEv2.0’s performance on a real-world image. The image contains a variety of common household items arranged on a desk, including a laptop, keyboard, mouse, drink, speakers, and a bookshelf in the background. The caption highlights that the model successfully identifies and describes these objects, demonstrating its ability to understand complex and diverse real-world scenes.
read the caption
Table 10: EVEv2.0 exhibits excellent recognition capabilities in the real-world scene.
Full paper#