TL;DR#
Dexterous robotic manipulation remains a challenge due to complex dynamics and the need for adaptability. Current methods, such as reinforcement learning and trajectory optimization, often fall short due to dependence on task-specific rewards or precise models. This necessitates a novel approach that can handle the intricacies of contact-rich scenarios and generalize across diverse objects and tasks.
DexTrack addresses this challenge by leveraging a data-driven approach. It uses a large-scale dataset of human demonstrations paired with corresponding robot actions to train a neural tracking controller. The approach further refines these demonstrations through an iterative process involving reinforcement and imitation learning. This ensures both high quality and diversity of training data, enhancing the controller’s ability to generalize across diverse manipulation tasks. Results show significant improvement over baselines in both simulated and real-world experiments, showcasing the generalizability, adaptability, and robustness of DexTrack.
Key Takeaways#
Why does it matter?#
This paper is important because it presents DexTrack, a novel approach to dexterous robot manipulation that significantly improves upon existing methods. Its iterative training and homotopy optimization techniques are highly relevant to current research trends in robotics, and its generalizability and robustness offer exciting possibilities for future research. The results achieved, especially the 10% improvement in success rates, are impressive and provide a strong foundation for future work in complex, real-world manipulation.
Visual Insights#

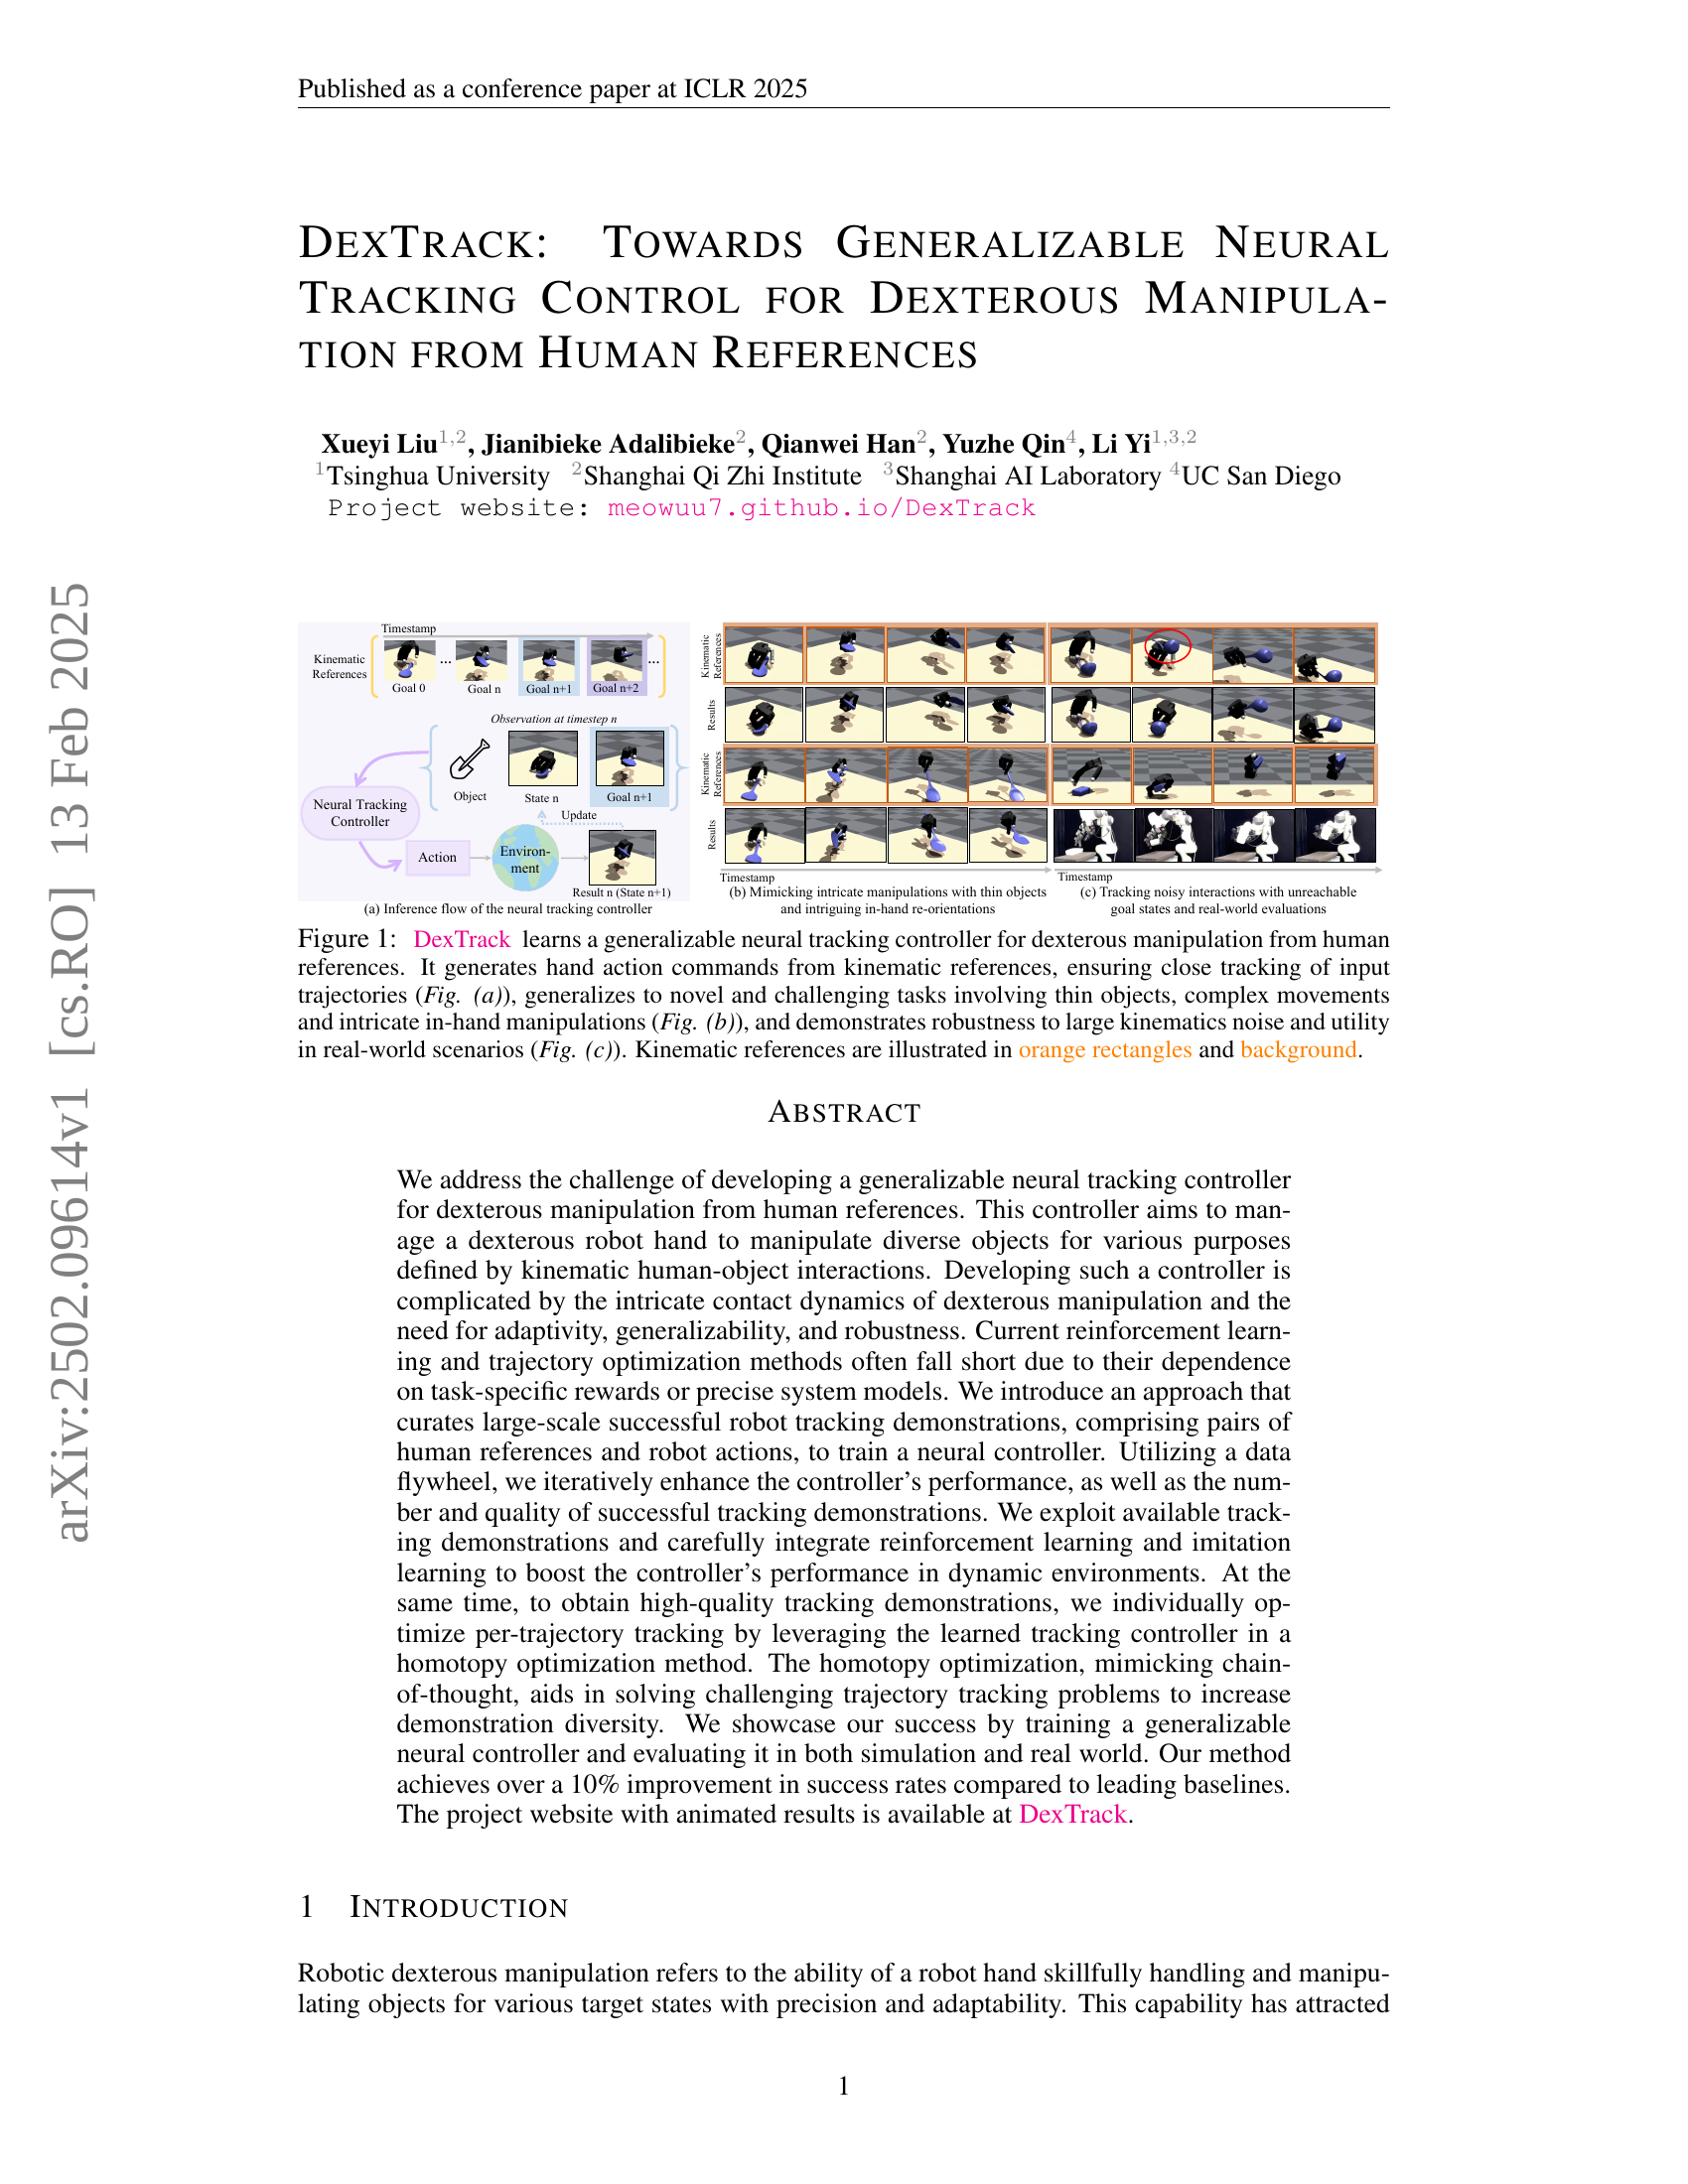
🔼 This figure illustrates DexTrack’s neural tracking controller, trained on human-demonstrated dexterous manipulations. Panel (a) shows the controller’s inference process, generating hand commands from kinematic references to closely track input trajectories. Panel (b) highlights DexTrack’s ability to generalize to complex, novel tasks involving thin objects and intricate in-hand manipulations. Panel (c) demonstrates the controller’s robustness to noisy kinematic data and its effectiveness in real-world settings. Orange rectangles in the figure represent kinematic references.
read the caption
Figure 1: DexTrack learns a generalizable neural tracking controller for dexterous manipulation from human references. It generates hand action commands from kinematic references, ensuring close tracking of input trajectories (Fig. (a)), generalizes to novel and challenging tasks involving thin objects, complex movements and intricate in-hand manipulations (Fig. (b)), and demonstrates robustness to large kinematics noise and utility in real-world scenarios (Fig. (c)). Kinematic references are illustrated in orange rectangles and background.
| Dataset | Method | () | () | () | () | Success Rate () |
| GRAB | DGrasp | 0.4493 | 6.75 | 0.1372 | 0.6039 | 34.52/52.79 |
| PPO (OmniGrasp rew.) | 0.4404 | 6.69 | 0.1722 | 0.6418 | 35.53/54.82 | |
| PPO (w/o sup., tracking rew.) | 0.3945 | 6.11 | 0.1076 | 0.5899 | 38.58/54.82 | |
| Ours (w/o data, w/o homotopy) | 0.3443 | 7.81 | 0.1225 | 0.5218 | 39.59/57.87 | |
| Ours (w/o data) | 0.3415 | 4.97 | 0.1483 | 0.5264 | 43.15/62.44 | |
| Ours | 0.3303 | 4.53 | 0.1118 | 0.5048 | 46.70/65.48 | |
| TACO | DGrasp | 0.5021 | 5.04 | 0.1129 | 0.4737 | 38.42/47.78 |
| PPO (OmniGrasp rew.) | 0.5174 | 5.43 | 0.1279 | 0.4945 | 33.5/46.31 | |
| PPO (w/o sup., tracking rew.) | 0.4815 | 4.82 | 0.1195 | 0.4682 | 34.98/57.64 | |
| Ours (w/o data, w/o homotopy) | 0.4444 | 2.33 | 0.1782 | 0.5438 | 44.83/67.00 | |
| Ours (w/o data) | 0.4854 | 2.21 | 0.1698 | 0.4772 | 47.78/72.41 | |
| Ours | 0.4953 | 2.10 | 0.1510 | 0.4661 | 48.77/74.38 |
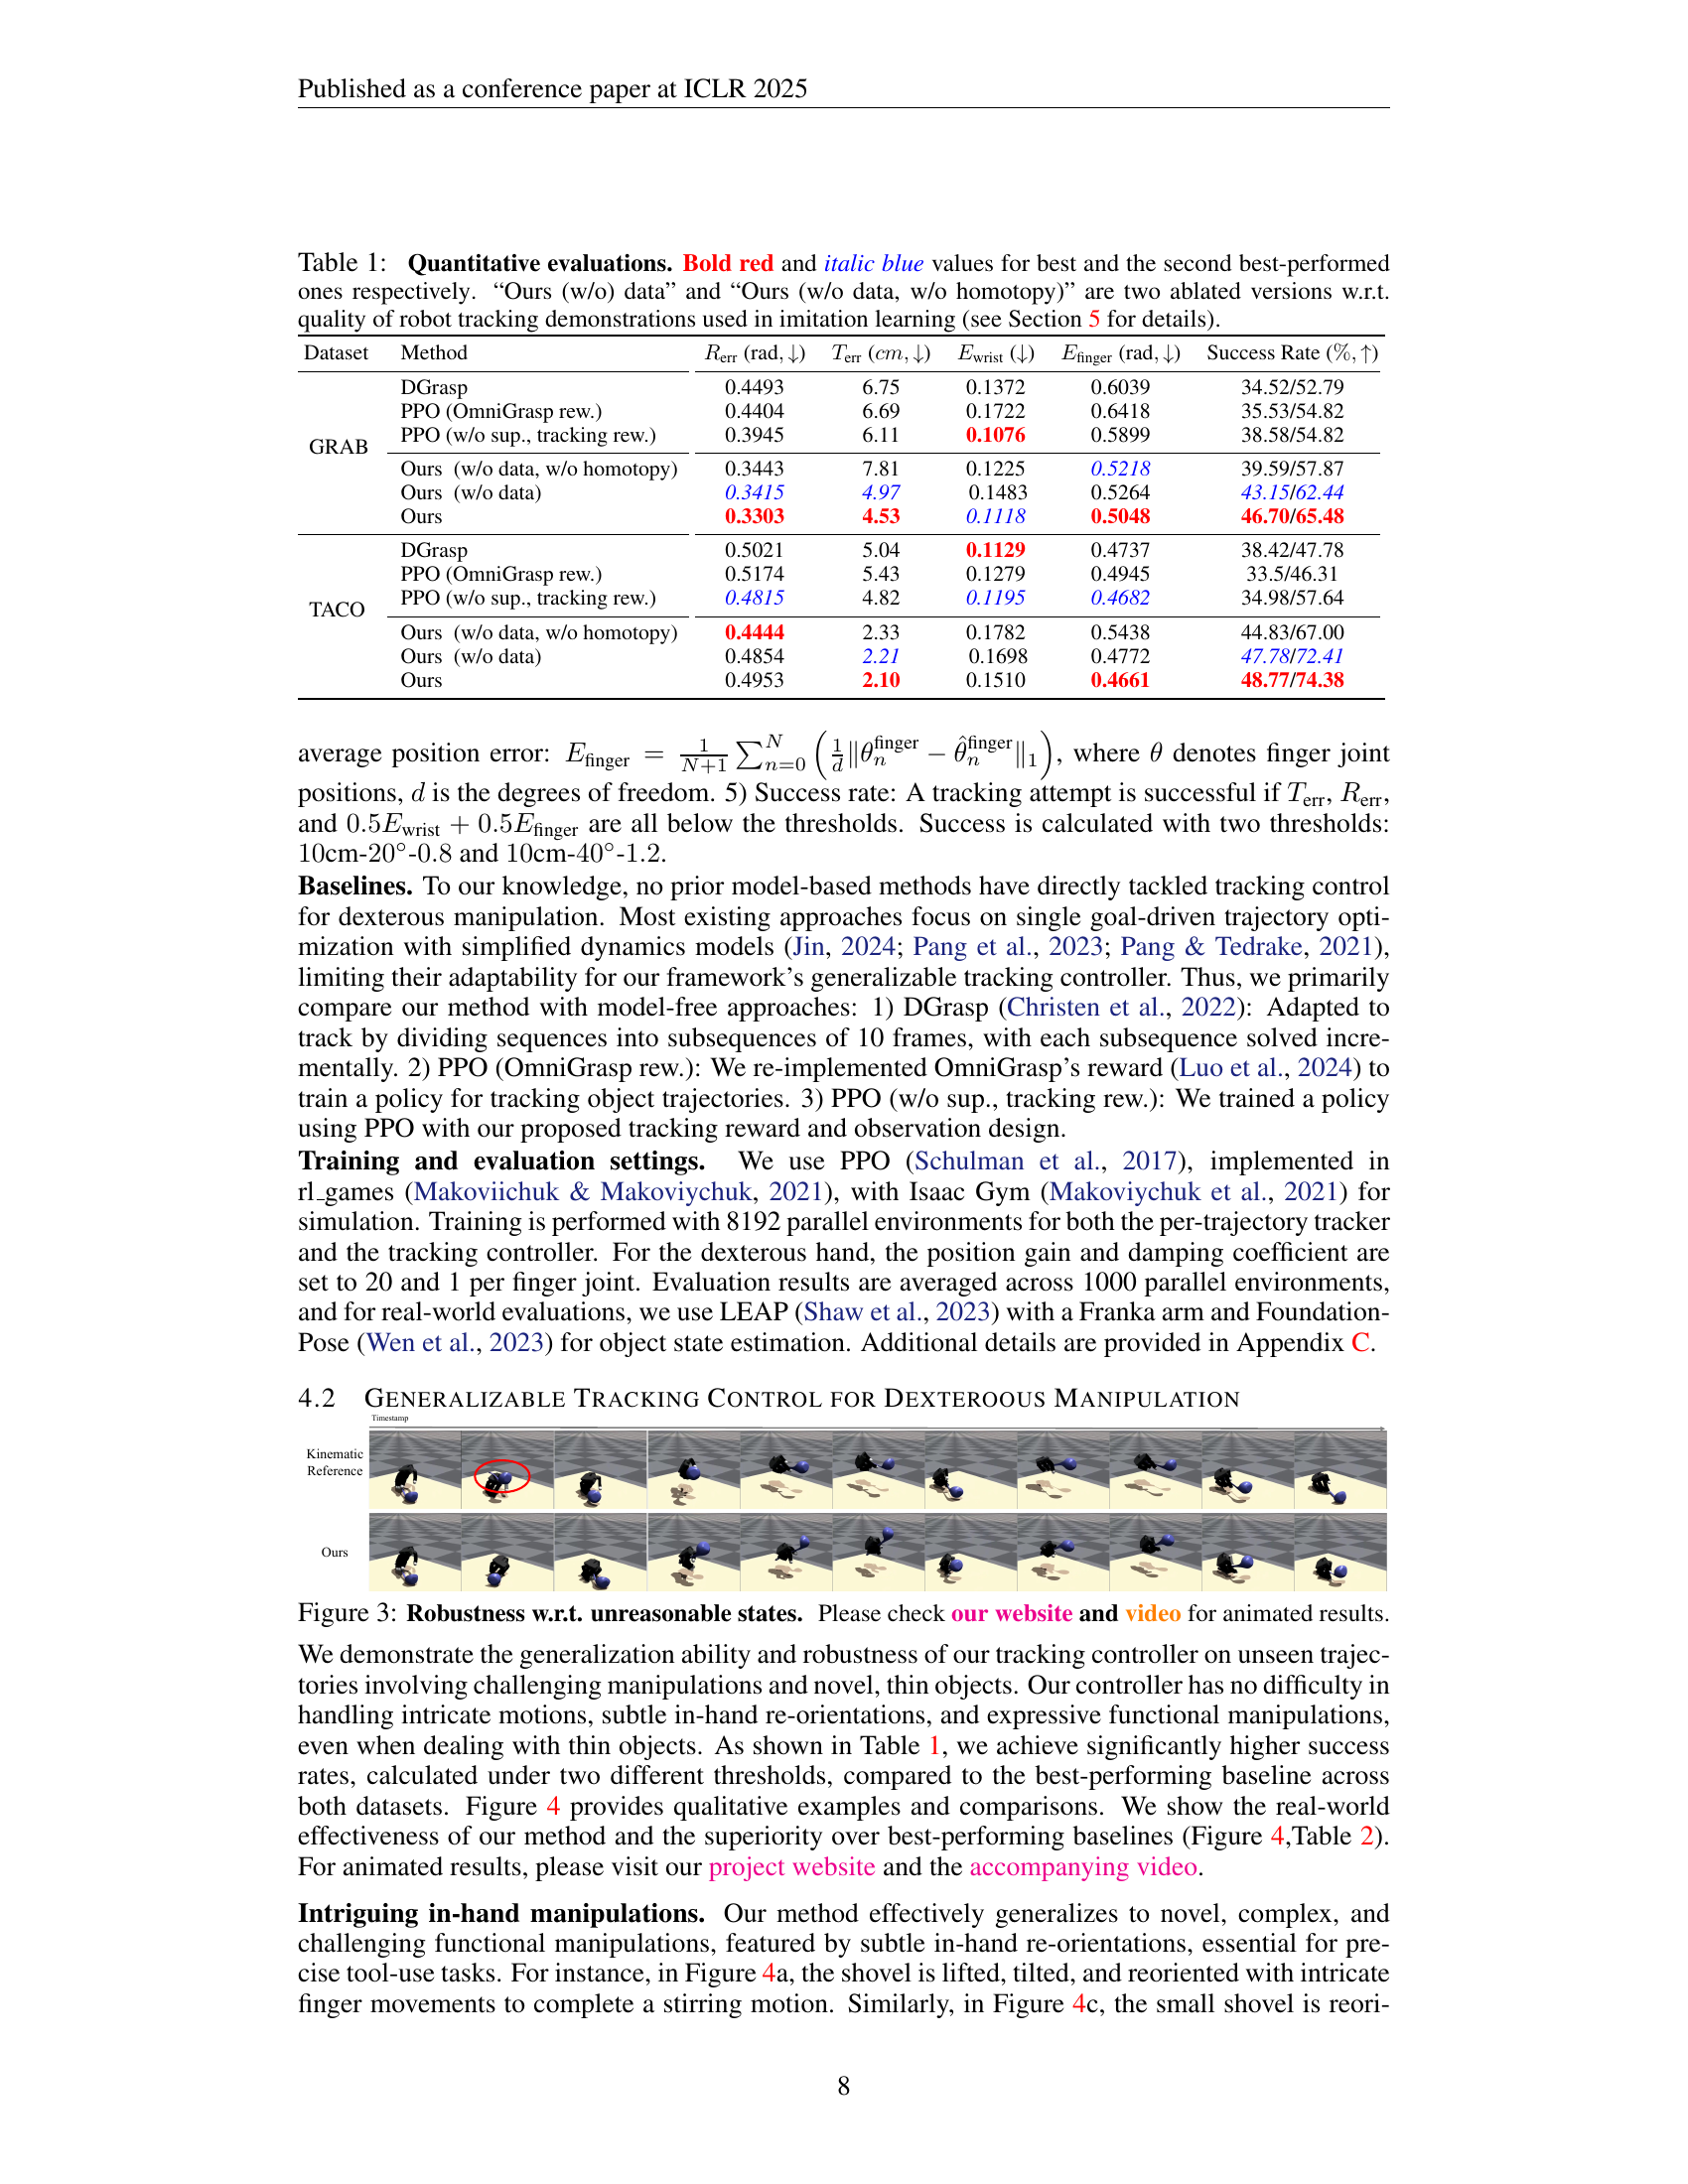
🔼 This table presents a quantitative comparison of different methods for dexterous manipulation tracking control, focusing on their performance across various metrics. The metrics evaluated include per-frame errors for object rotation and translation, as well as wrist and finger joint errors. The success rate of each method is also provided. For the proposed method (‘Ours’), ablation studies are included, demonstrating the impact of using high-quality robot tracking demonstrations (‘Ours (w/o data)’, ‘Ours (w/o data, w/o homotopy)’) during imitation learning. The results show the superior performance of the proposed method compared to several baseline methods across both datasets, indicating its better generalization and robustness.
read the caption
Table 1: Quantitative evaluations. Bold red and italic blue values for best and the second best-performed ones respectively. “Ours (w/o) data” and “Ours (w/o data, w/o homotopy)” are two ablated versions w.r.t. quality of robot tracking demonstrations used in imitation learning (see Section 5 for details).
In-depth insights#
DexTrack’s Design#
DexTrack’s design is a sophisticated iterative approach to neural tracking control for dexterous manipulation. It cleverly integrates reinforcement learning (RL) and imitation learning (IL), leveraging a data flywheel to iteratively improve both the controller’s performance and the quality of its training data. The core of DexTrack is a neural network controller trained on high-quality robot tracking demonstrations, carefully curated to showcase diverse and complex manipulation skills. A key innovation is the use of homotopy optimization, a chain-of-thought style approach that simplifies challenging tracking problems into a series of progressively easier subproblems, thereby enriching the dataset with complex successful trajectories. This iterative refinement process ensures that DexTrack not only learns from successful demonstrations but also actively generates new, high-quality data, leading to superior generalization and robustness. The use of a residual action space in the RL training further enhances sample efficiency. The design successfully addresses the challenges of contact-rich dynamics and noisy kinematic references, leading to a general-purpose controller applicable to a wide array of objects and manipulation tasks.
Data Flywheel’s Role#
The concept of a ‘Data Flywheel’ in the context of this research paper centers on an iterative process of data collection and model refinement. It’s a virtuous cycle, where initial demonstrations of dexterous manipulation, acquired through human reference, are used to train a neural tracking controller. This controller then becomes a tool to generate higher-quality and more diverse demonstrations by improving the accuracy and handling of complex scenarios. These new, improved demonstrations are fed back into the system to further refine the controller’s capabilities. This iterative feedback loop is crucial to overcoming the limitations of traditional reinforcement learning and imitation learning approaches that often struggle with complex dynamics and limited data. The flywheel accelerates progress beyond what could be achieved with a single training pass, resulting in a significantly more robust and generalized neural tracking controller. The key is the synergistic interaction between data generation and model refinement, showcasing how high-quality data drives improved performance, which in turn enables the acquisition of even better data.
Homotopy Optimization#
The concept of “Homotopy Optimization” in the context of the research paper suggests a novel approach to enhance the quality and diversity of robot tracking demonstrations. The core idea revolves around iteratively solving challenging trajectory tracking problems by gradually simplifying them, mimicking a ‘chain-of-thought’ process. This is achieved by leveraging a learned tracking controller to generate a series of intermediate, progressively easier-to-track trajectories, effectively creating a homotopy path from a complex reference trajectory to a simplified one. The homotopy optimization scheme significantly aids in generating higher-quality demonstrations by easing the difficulty of directly tracking noisy or complex human references. This approach not only enhances data quality but also allows the generation of more diverse data, thereby improving the generalization capabilities of the trained neural controller. The iterative process, combining the homotopy optimization with reinforcement and imitation learning, constitutes a data flywheel, improving the controller and demonstration quality mutually. While computationally more expensive, the results suggest that this method contributes significantly to enhanced performance, exceeding leading baselines in success rates for dexterous manipulation tasks.
Generalization Ability#
The concept of “Generalization Ability” in a machine learning context, specifically within the scope of dexterous robotic manipulation, is crucial. It refers to a model’s capacity to successfully perform tasks beyond those explicitly seen during training. The paper likely assesses this by testing the trained neural controller on unseen object geometries, novel manipulation sequences, or even real-world scenarios with noisy sensory inputs. High generalization ability suggests robustness, meaning the system isn’t brittle and can adapt to variations in the environment or task parameters. Quantitative metrics, such as success rates across diverse test sets or error rates in novel situations, would be used to evaluate this ability. A qualitative assessment, perhaps through visual observation of the robot’s performance, may also be included to provide a richer understanding. The degree of generalization directly impacts the practical applicability of the controller, as real-world scenarios inherently involve uncertainty and variability. Successfully generalizing to a wide range of tasks is a key benchmark for the practicality and future development of such technology.
Future Work#
Future work in dexterous manipulation should prioritize improving data efficiency and generalization. Developing more efficient methods for data collection and annotation, such as sim-to-real transfer techniques, will be crucial. Addressing the challenge of long-horizon planning in dynamic environments through advanced reinforcement learning or hierarchical approaches is vital. Exploration of novel reward functions that effectively capture intricate manipulation skills and complex task objectives is needed. Furthermore, research into more robust and adaptable controllers that can handle unexpected disturbances and diverse object properties is essential. Finally, transferring learned skills to different robotic platforms and investigating the integration of tactile sensing for enhanced dexterity will significantly advance the field.
More visual insights#
More on figures

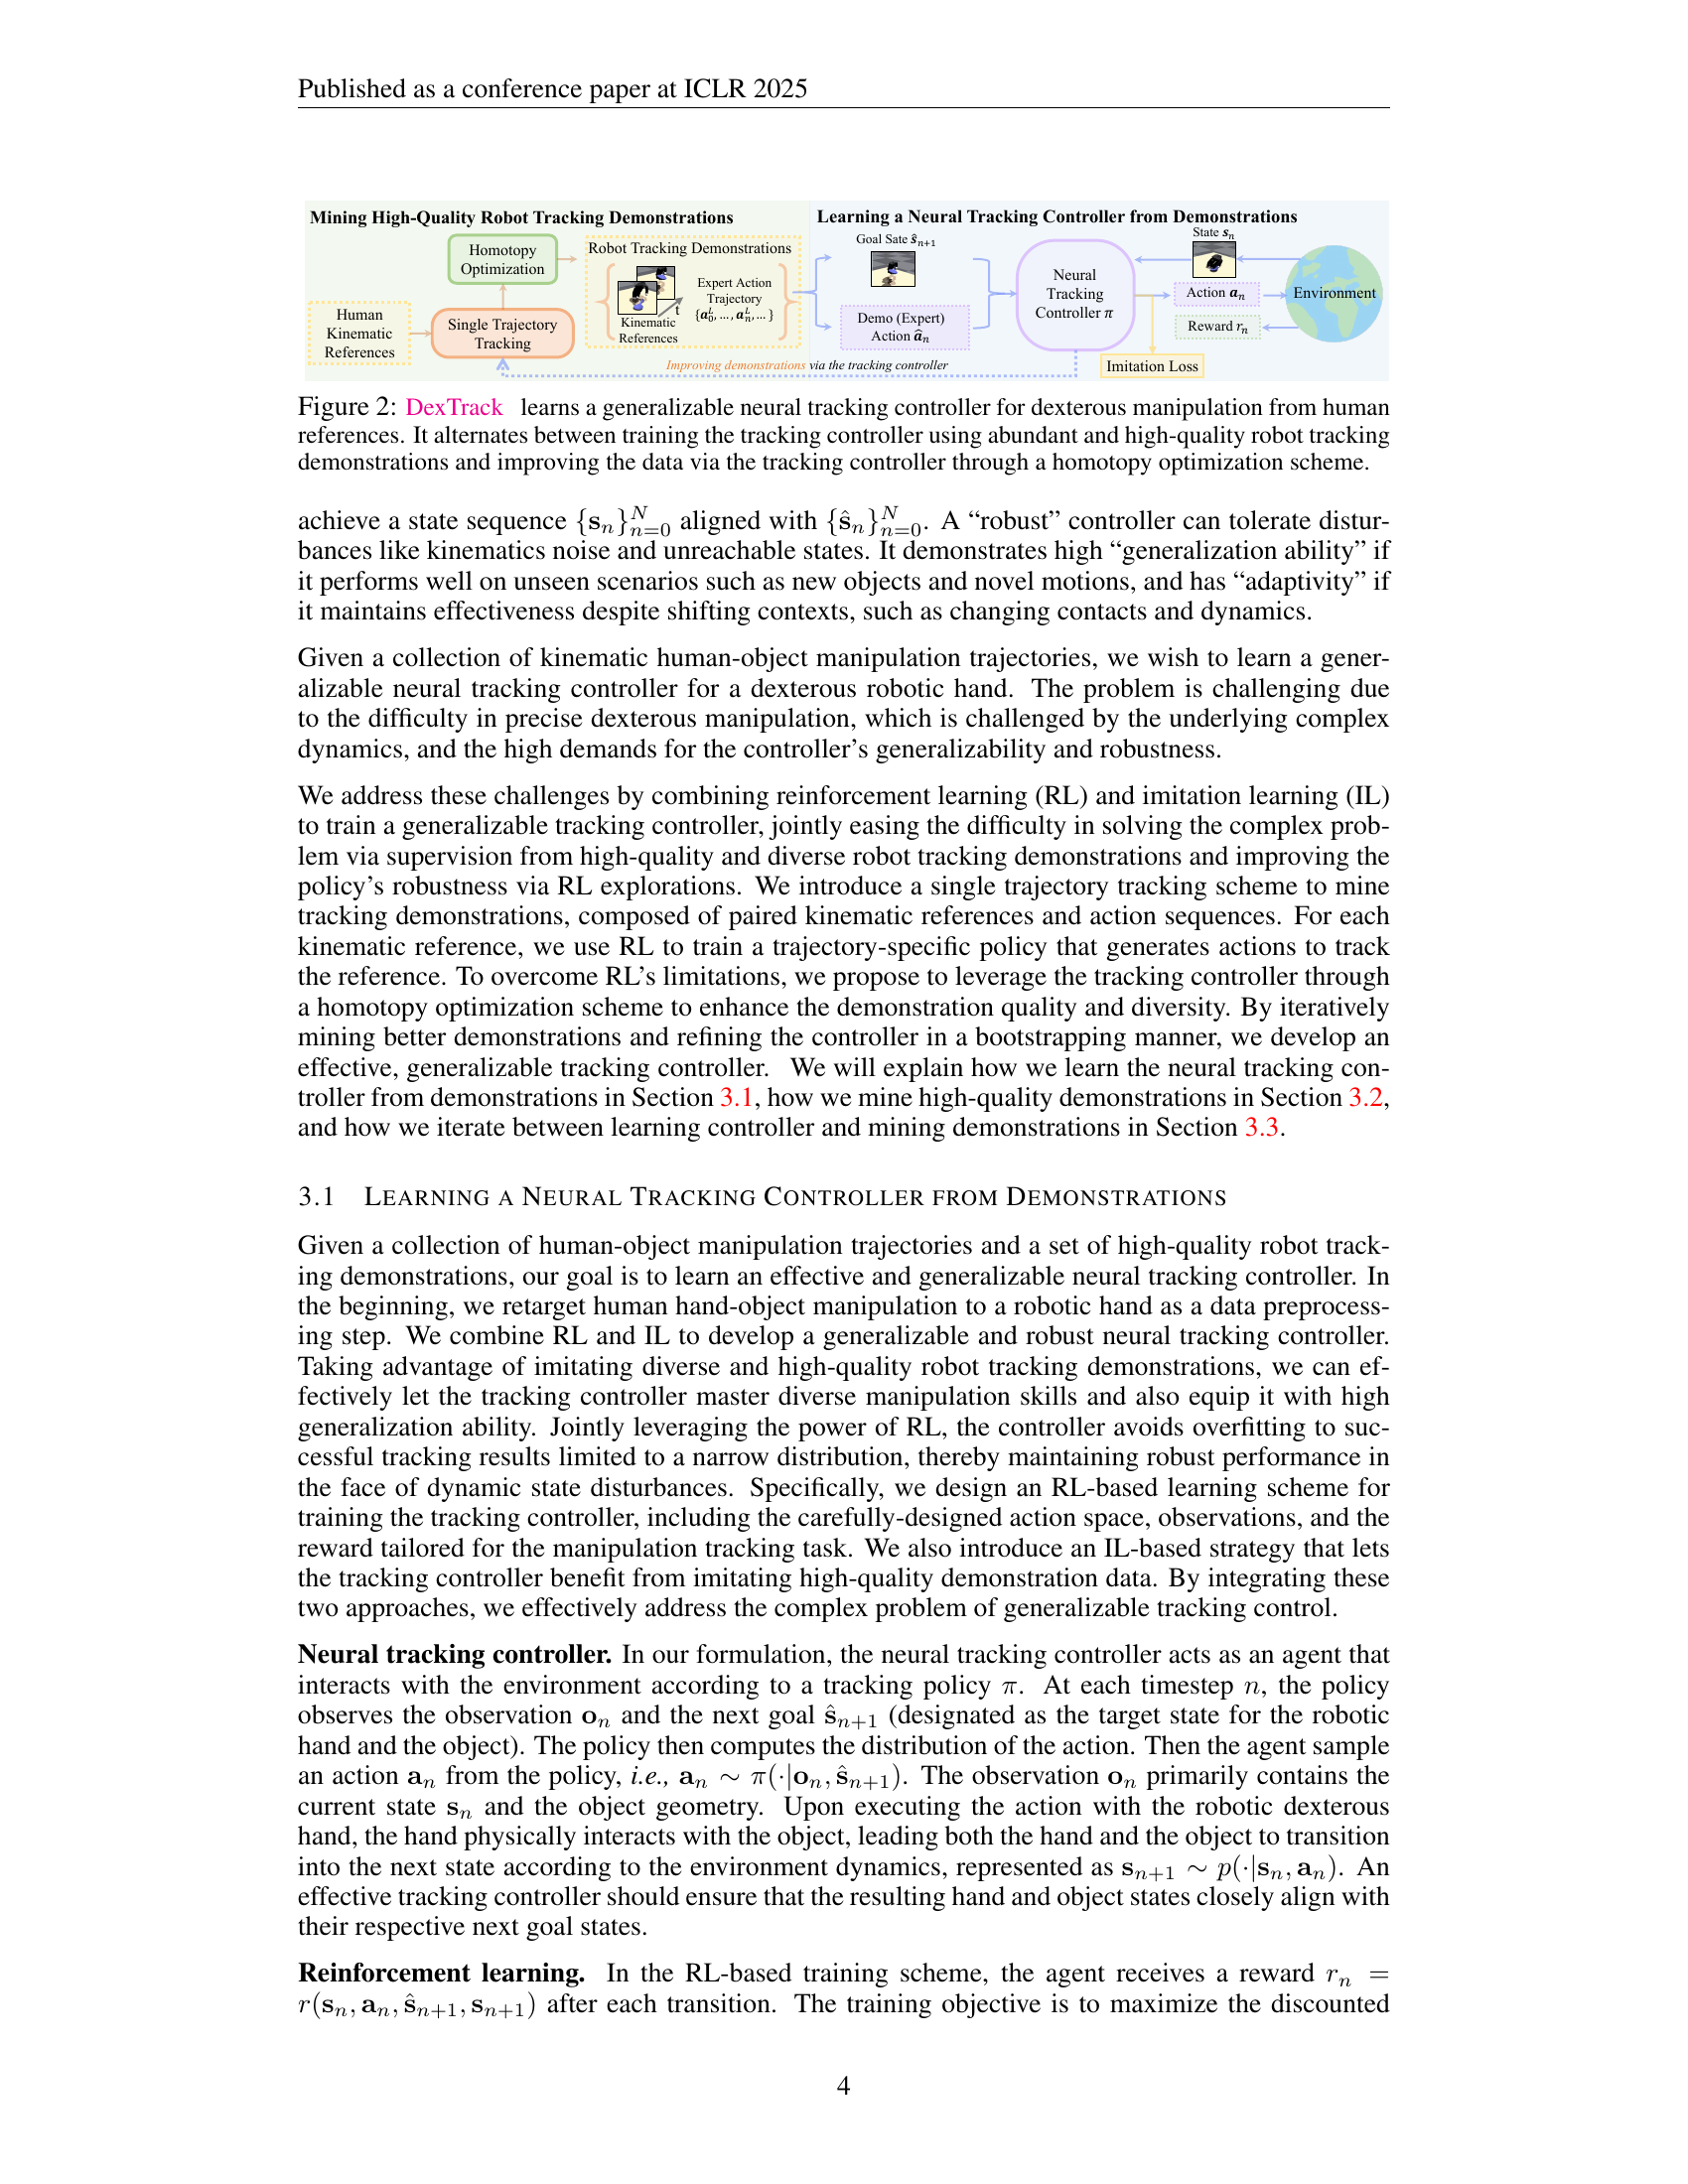
🔼 DexTrack uses a neural network to control a robot hand’s dexterous manipulation by learning from human-demonstrated examples. The system iteratively improves its performance by alternating between two phases: (1) Training the neural tracking controller using a large dataset of high-quality robot demonstrations of dexterous manipulations; and (2) Enhancing the dataset through a homotopy optimization scheme, where the controller itself guides the generation of improved demonstrations by solving challenging trajectory tracking problems. This iterative approach leads to a more robust and generalizable controller.
read the caption
Figure 2: DexTrack learns a generalizable neural tracking controller for dexterous manipulation from human references. It alternates between training the tracking controller using abundant and high-quality robot tracking demonstrations and improving the data via the tracking controller through a homotopy optimization scheme.

🔼 This figure demonstrates the robustness of DexTrack, the neural tracking controller, when handling unreasonable states. It showcases scenarios where the robot hand encounters significant deviations from expected kinematic references, such as deep penetrations or impossible configurations. The caption encourages viewers to visit the project website and accompanying video for a dynamic demonstration of the controller’s ability to successfully track and complete the manipulation task despite these challenging conditions.
read the caption
Figure 3: Robustness w.r.t. unreasonable states. Please check our website and video for animated results.

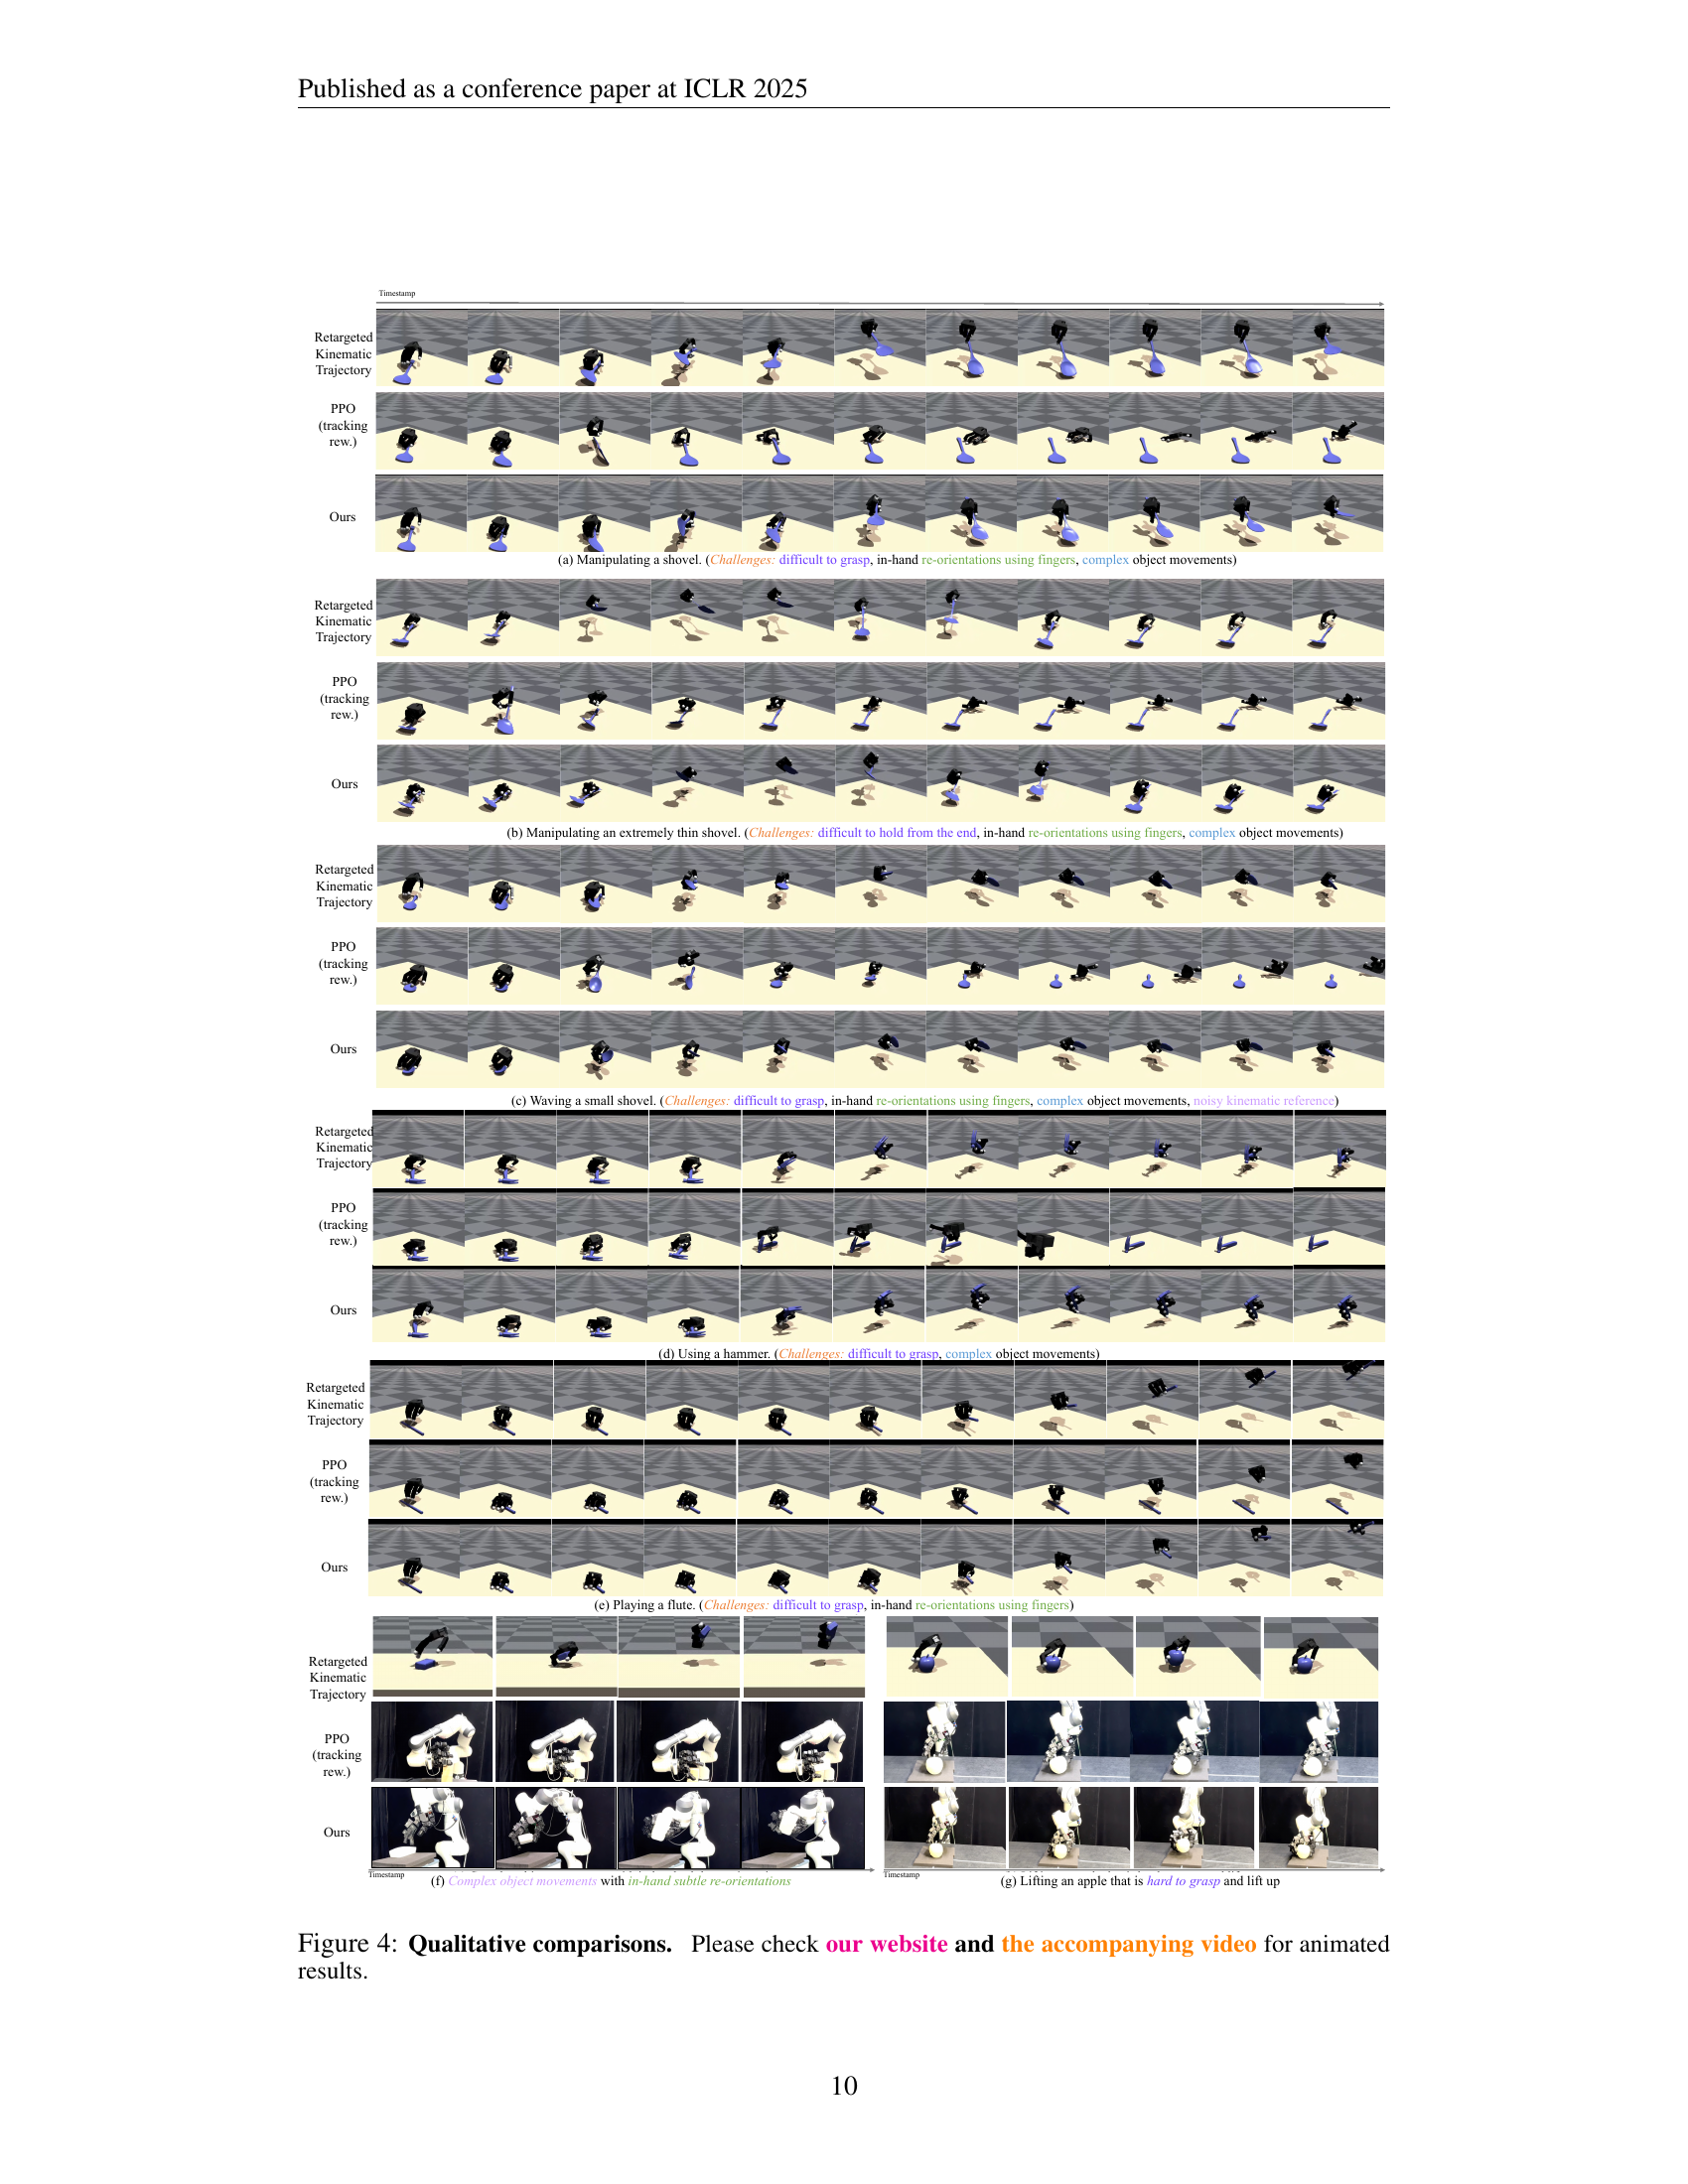
🔼 This figure presents a qualitative comparison of the proposed DexTrack method against two baseline methods (PPO with OmniGrasp reward and PPO without supervision, using a tracking reward) across various dexterous manipulation tasks. Each row shows a different manipulation task involving a variety of objects and movements, including in-hand object reorientations and interactions with thin objects. The images showcase the resulting robot hand and object trajectories generated by each method, highlighting DexTrack’s superior ability to accurately track the human-demonstrated kinematic references. For a complete and dynamic view of these results, the authors recommend visiting their website and accompanying video.
read the caption
Figure 4: Qualitative comparisons. Please check our website and the accompanying video for animated results.

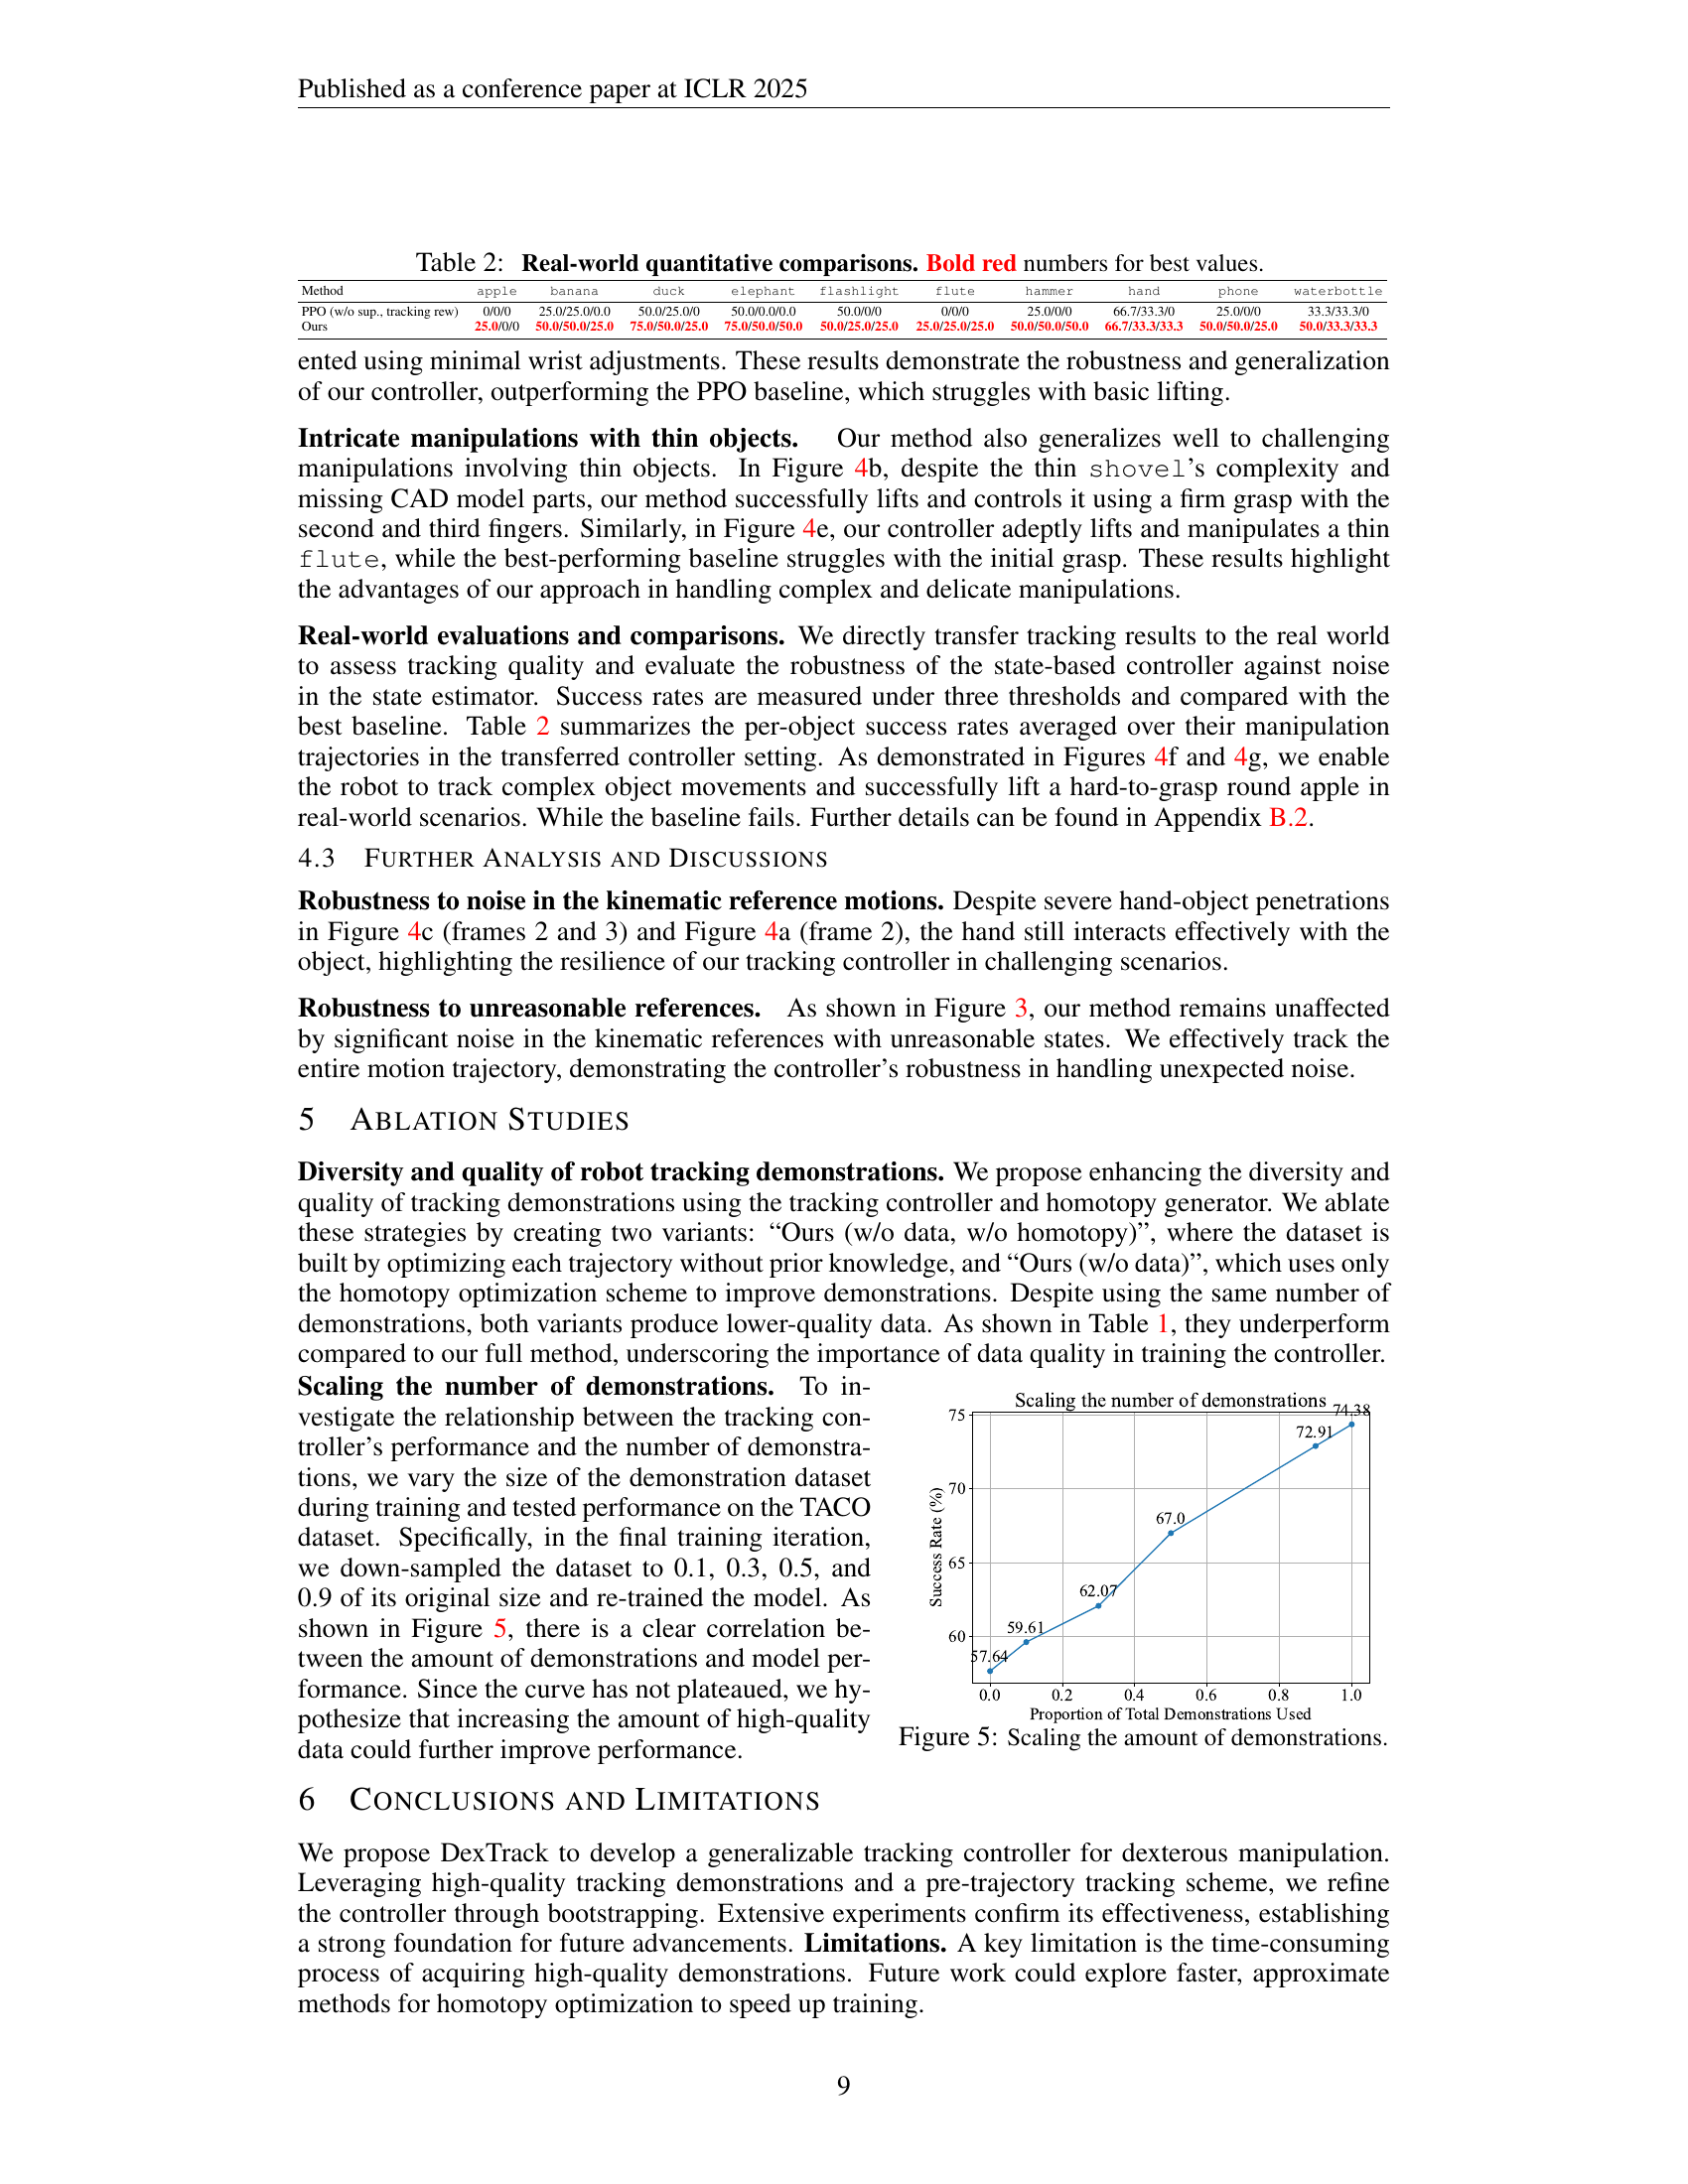
🔼 This figure shows a plot illustrating the relationship between the number of demonstrations used to train the model and the model’s performance on the TACO dataset. The x-axis represents the proportion of the total demonstrations used for training, ranging from 0 to 1. The y-axis displays the success rate achieved by the model. The plot demonstrates a clear upward trend, indicating that increasing the number of demonstrations improves the model’s success rate in dexterous manipulation tasks. The plot suggests that even with a large number of demonstrations, there might still be room for improvement in the model’s performance.
read the caption
Figure 5: Scaling the amount of demonstrations.

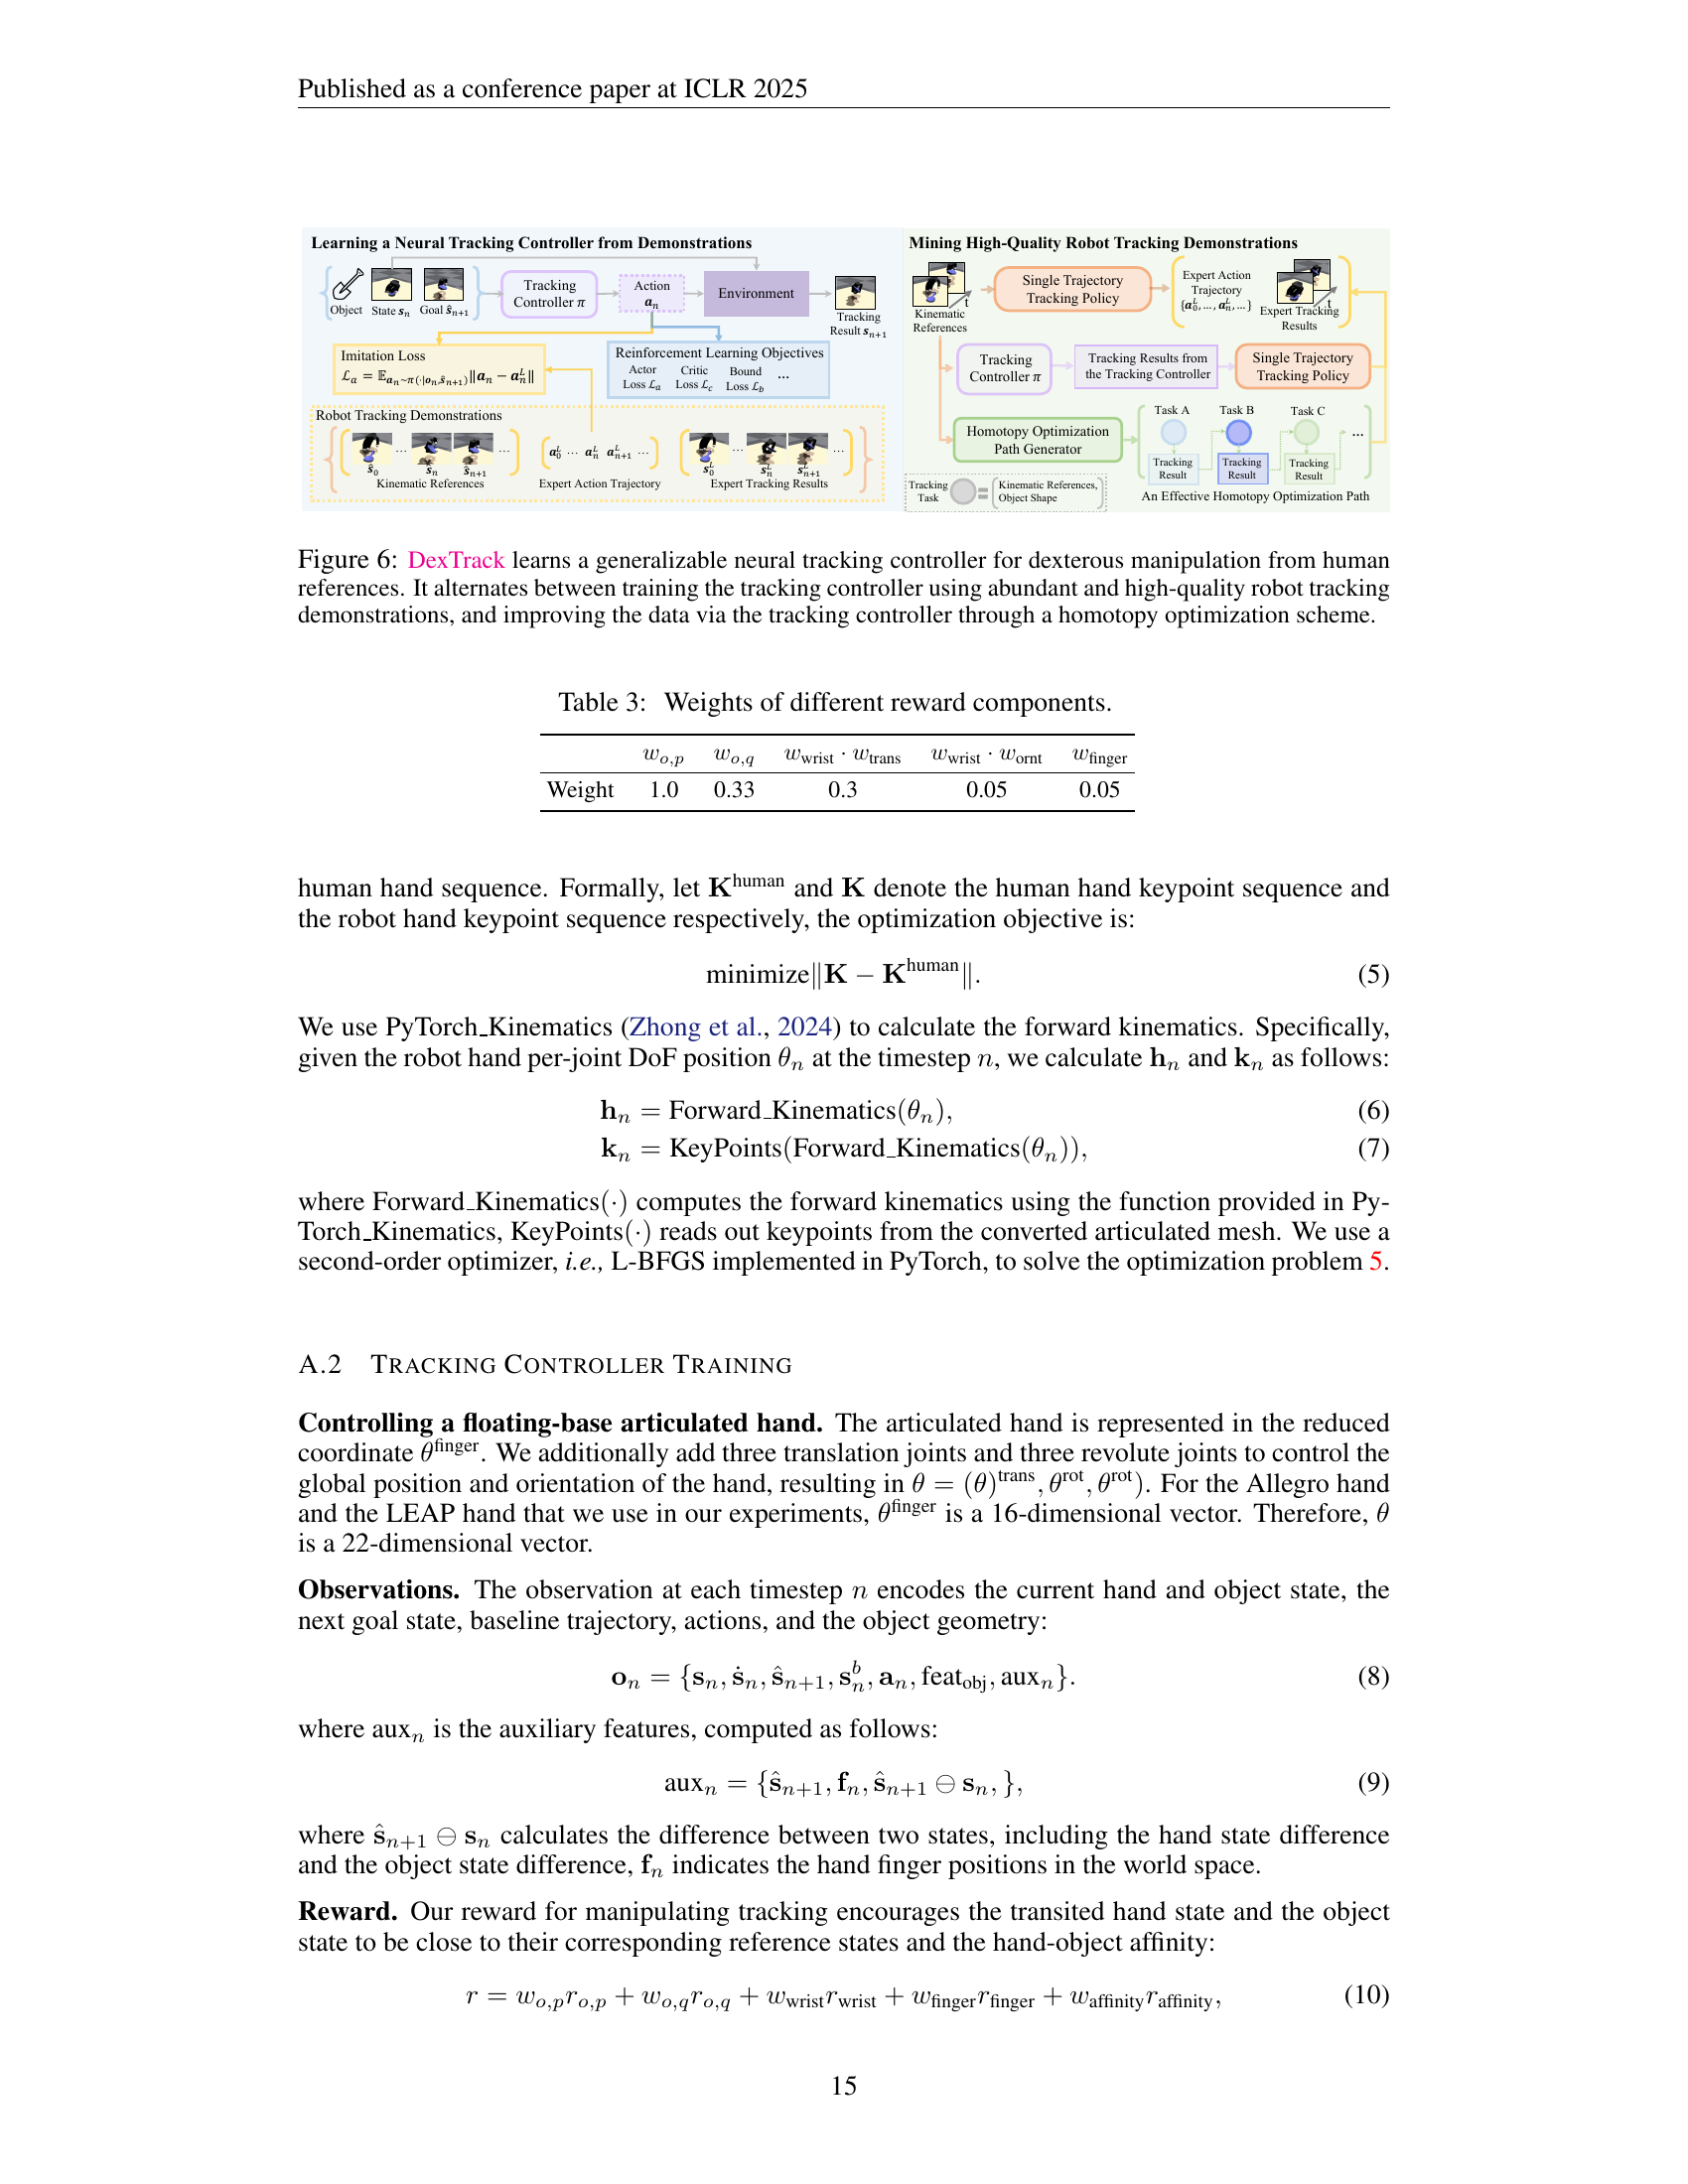
🔼 This figure illustrates the DexTrack framework, which learns a neural tracking controller for dexterous manipulation using human references. The process involves two alternating stages: (1) Training the controller using many high-quality robot tracking demonstrations. These demonstrations consist of paired human kinematic references (showing desired hand and object movements) and corresponding robot actions. (2) Improving the quality of the demonstrations themselves by using the already trained controller in a homotopy optimization scheme. This scheme refines the trajectories, making them more suitable for controller training and improving the controller’s ability to generalize to novel tasks.
read the caption
Figure 6: DexTrack learns a generalizable neural tracking controller for dexterous manipulation from human references. It alternates between training the tracking controller using abundant and high-quality robot tracking demonstrations, and improving the data via the tracking controller through a homotopy optimization scheme.

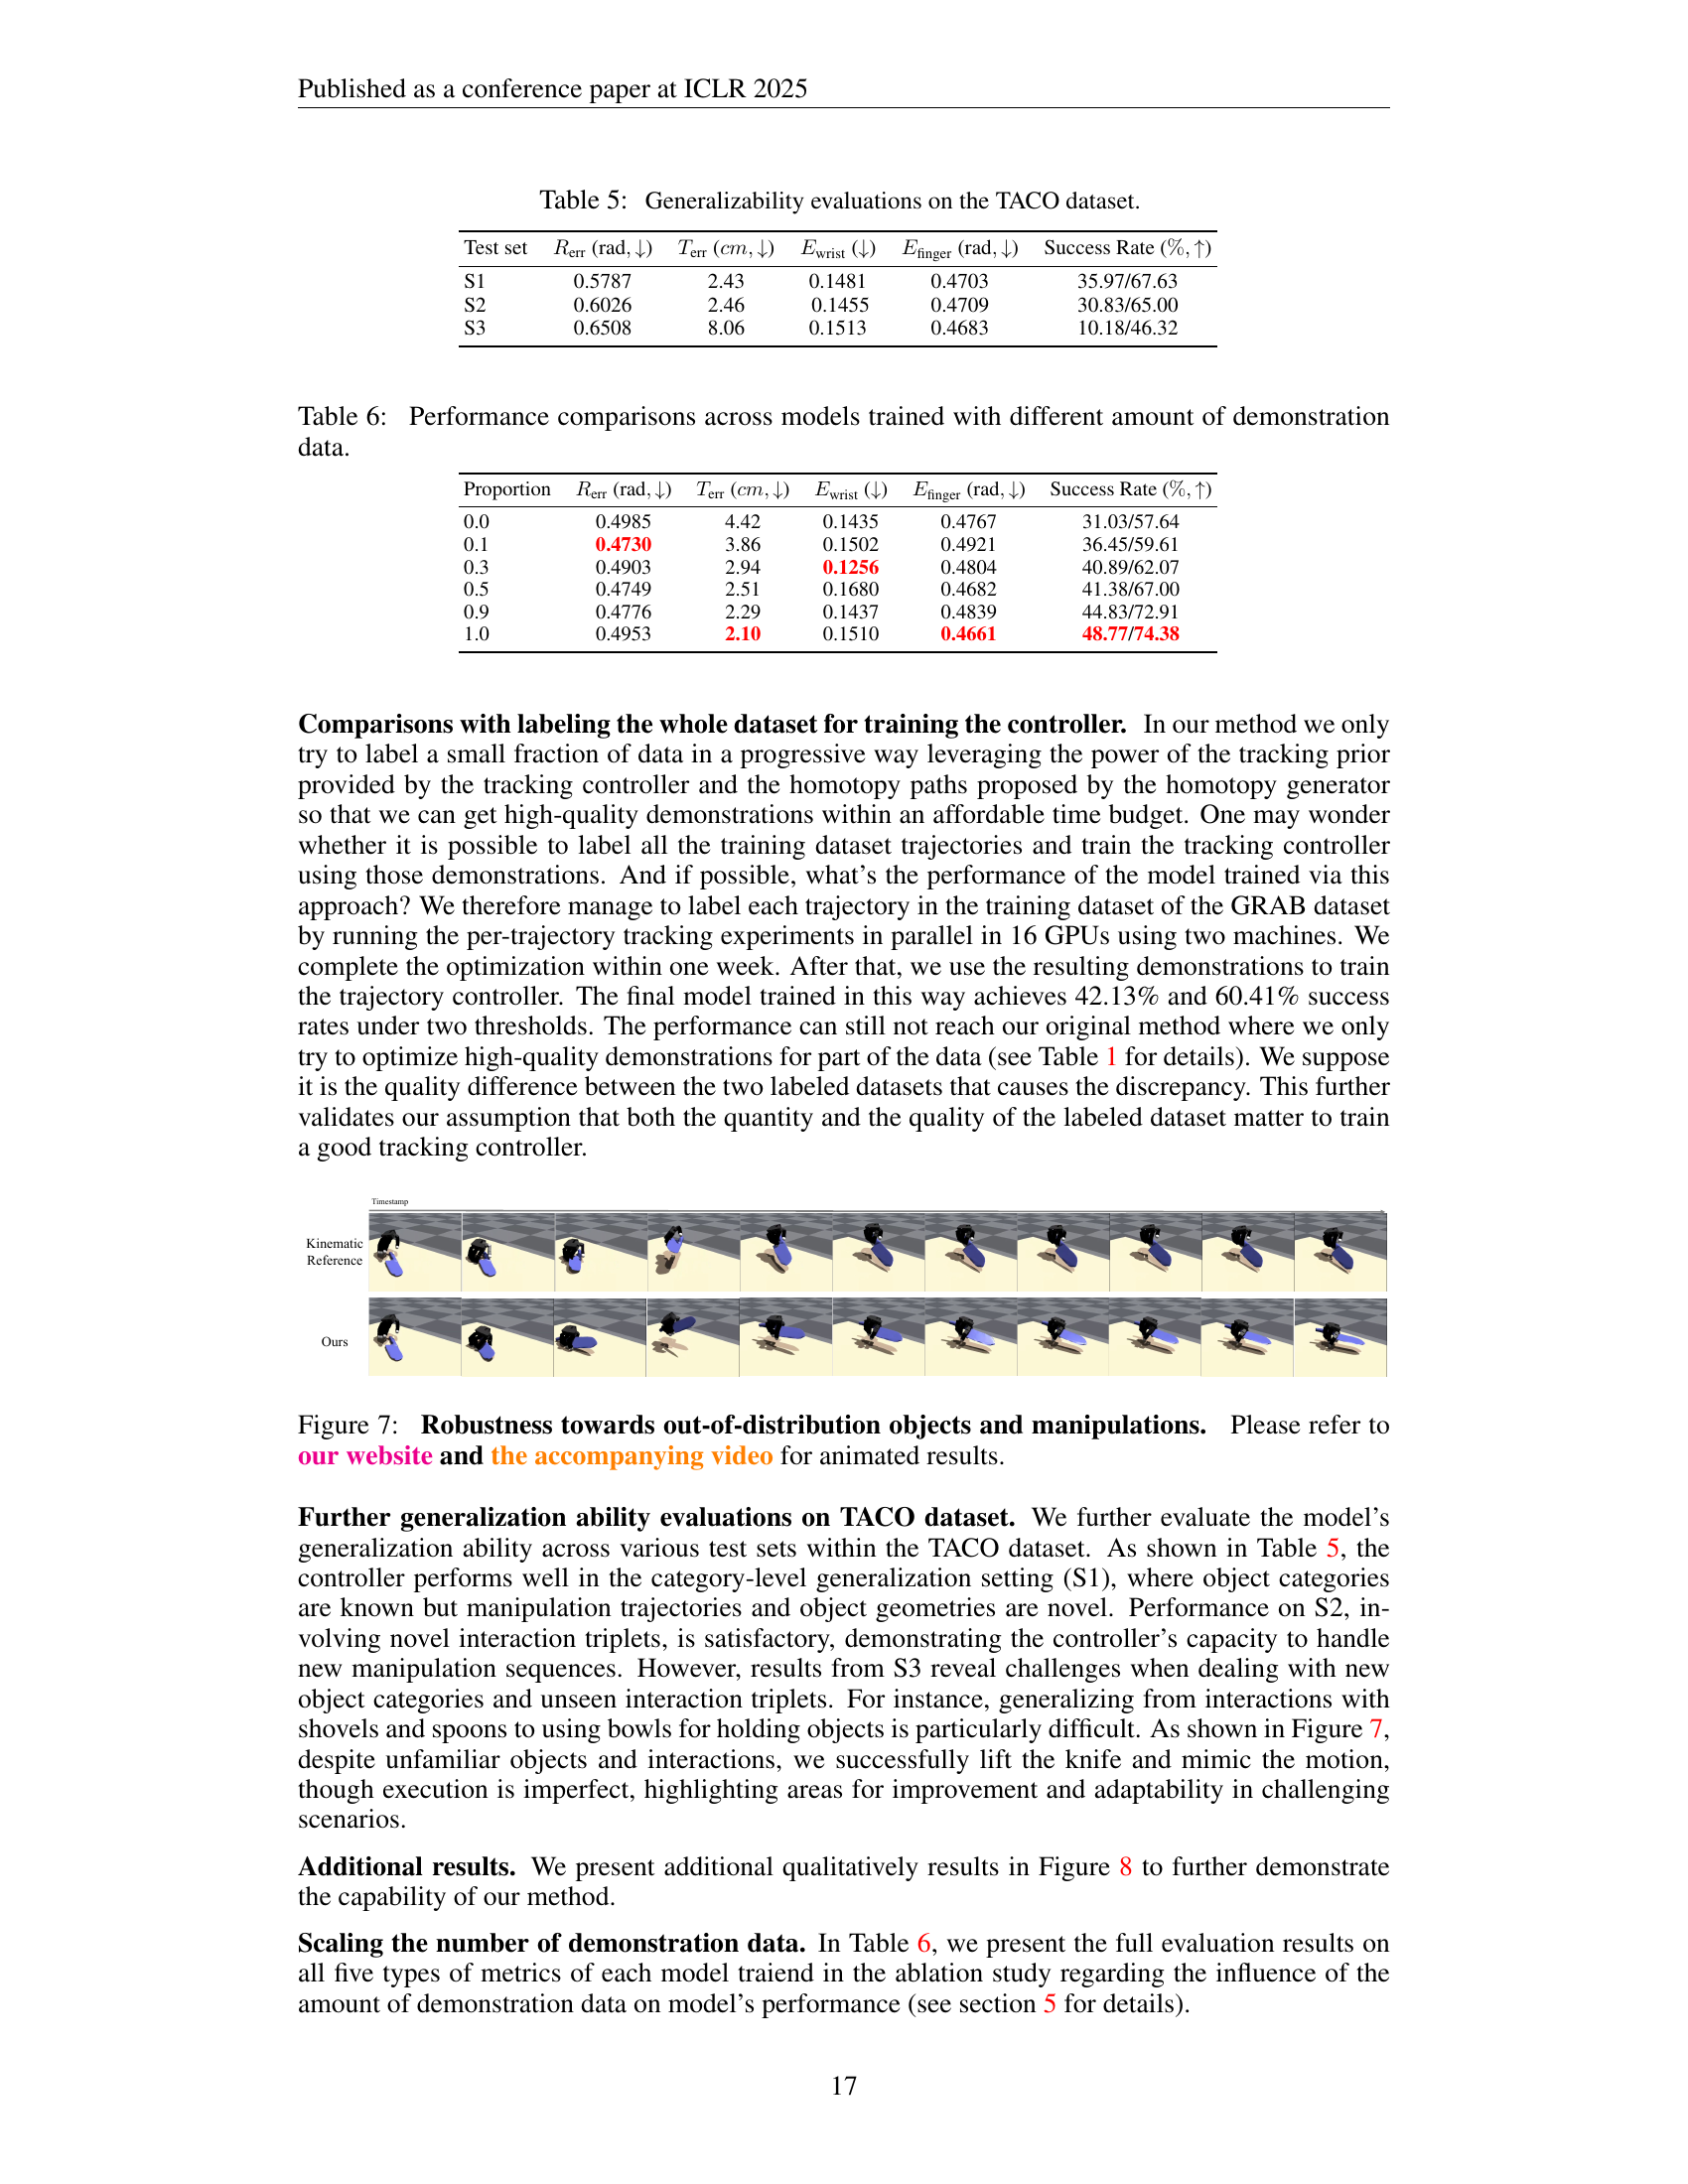
🔼 This figure demonstrates the robustness of the DexTrack neural tracking controller when handling objects and manipulations unseen during training. The controller successfully tracks diverse, complex movements involving novel objects with varied shapes and sizes, including thin and delicate objects. The video and website provide additional context and animated results for a more thorough understanding of the controller’s capabilities.
read the caption
Figure 7: Robustness towards out-of-distribution objects and manipulations. Please refer to our website and the accompanying video for animated results.

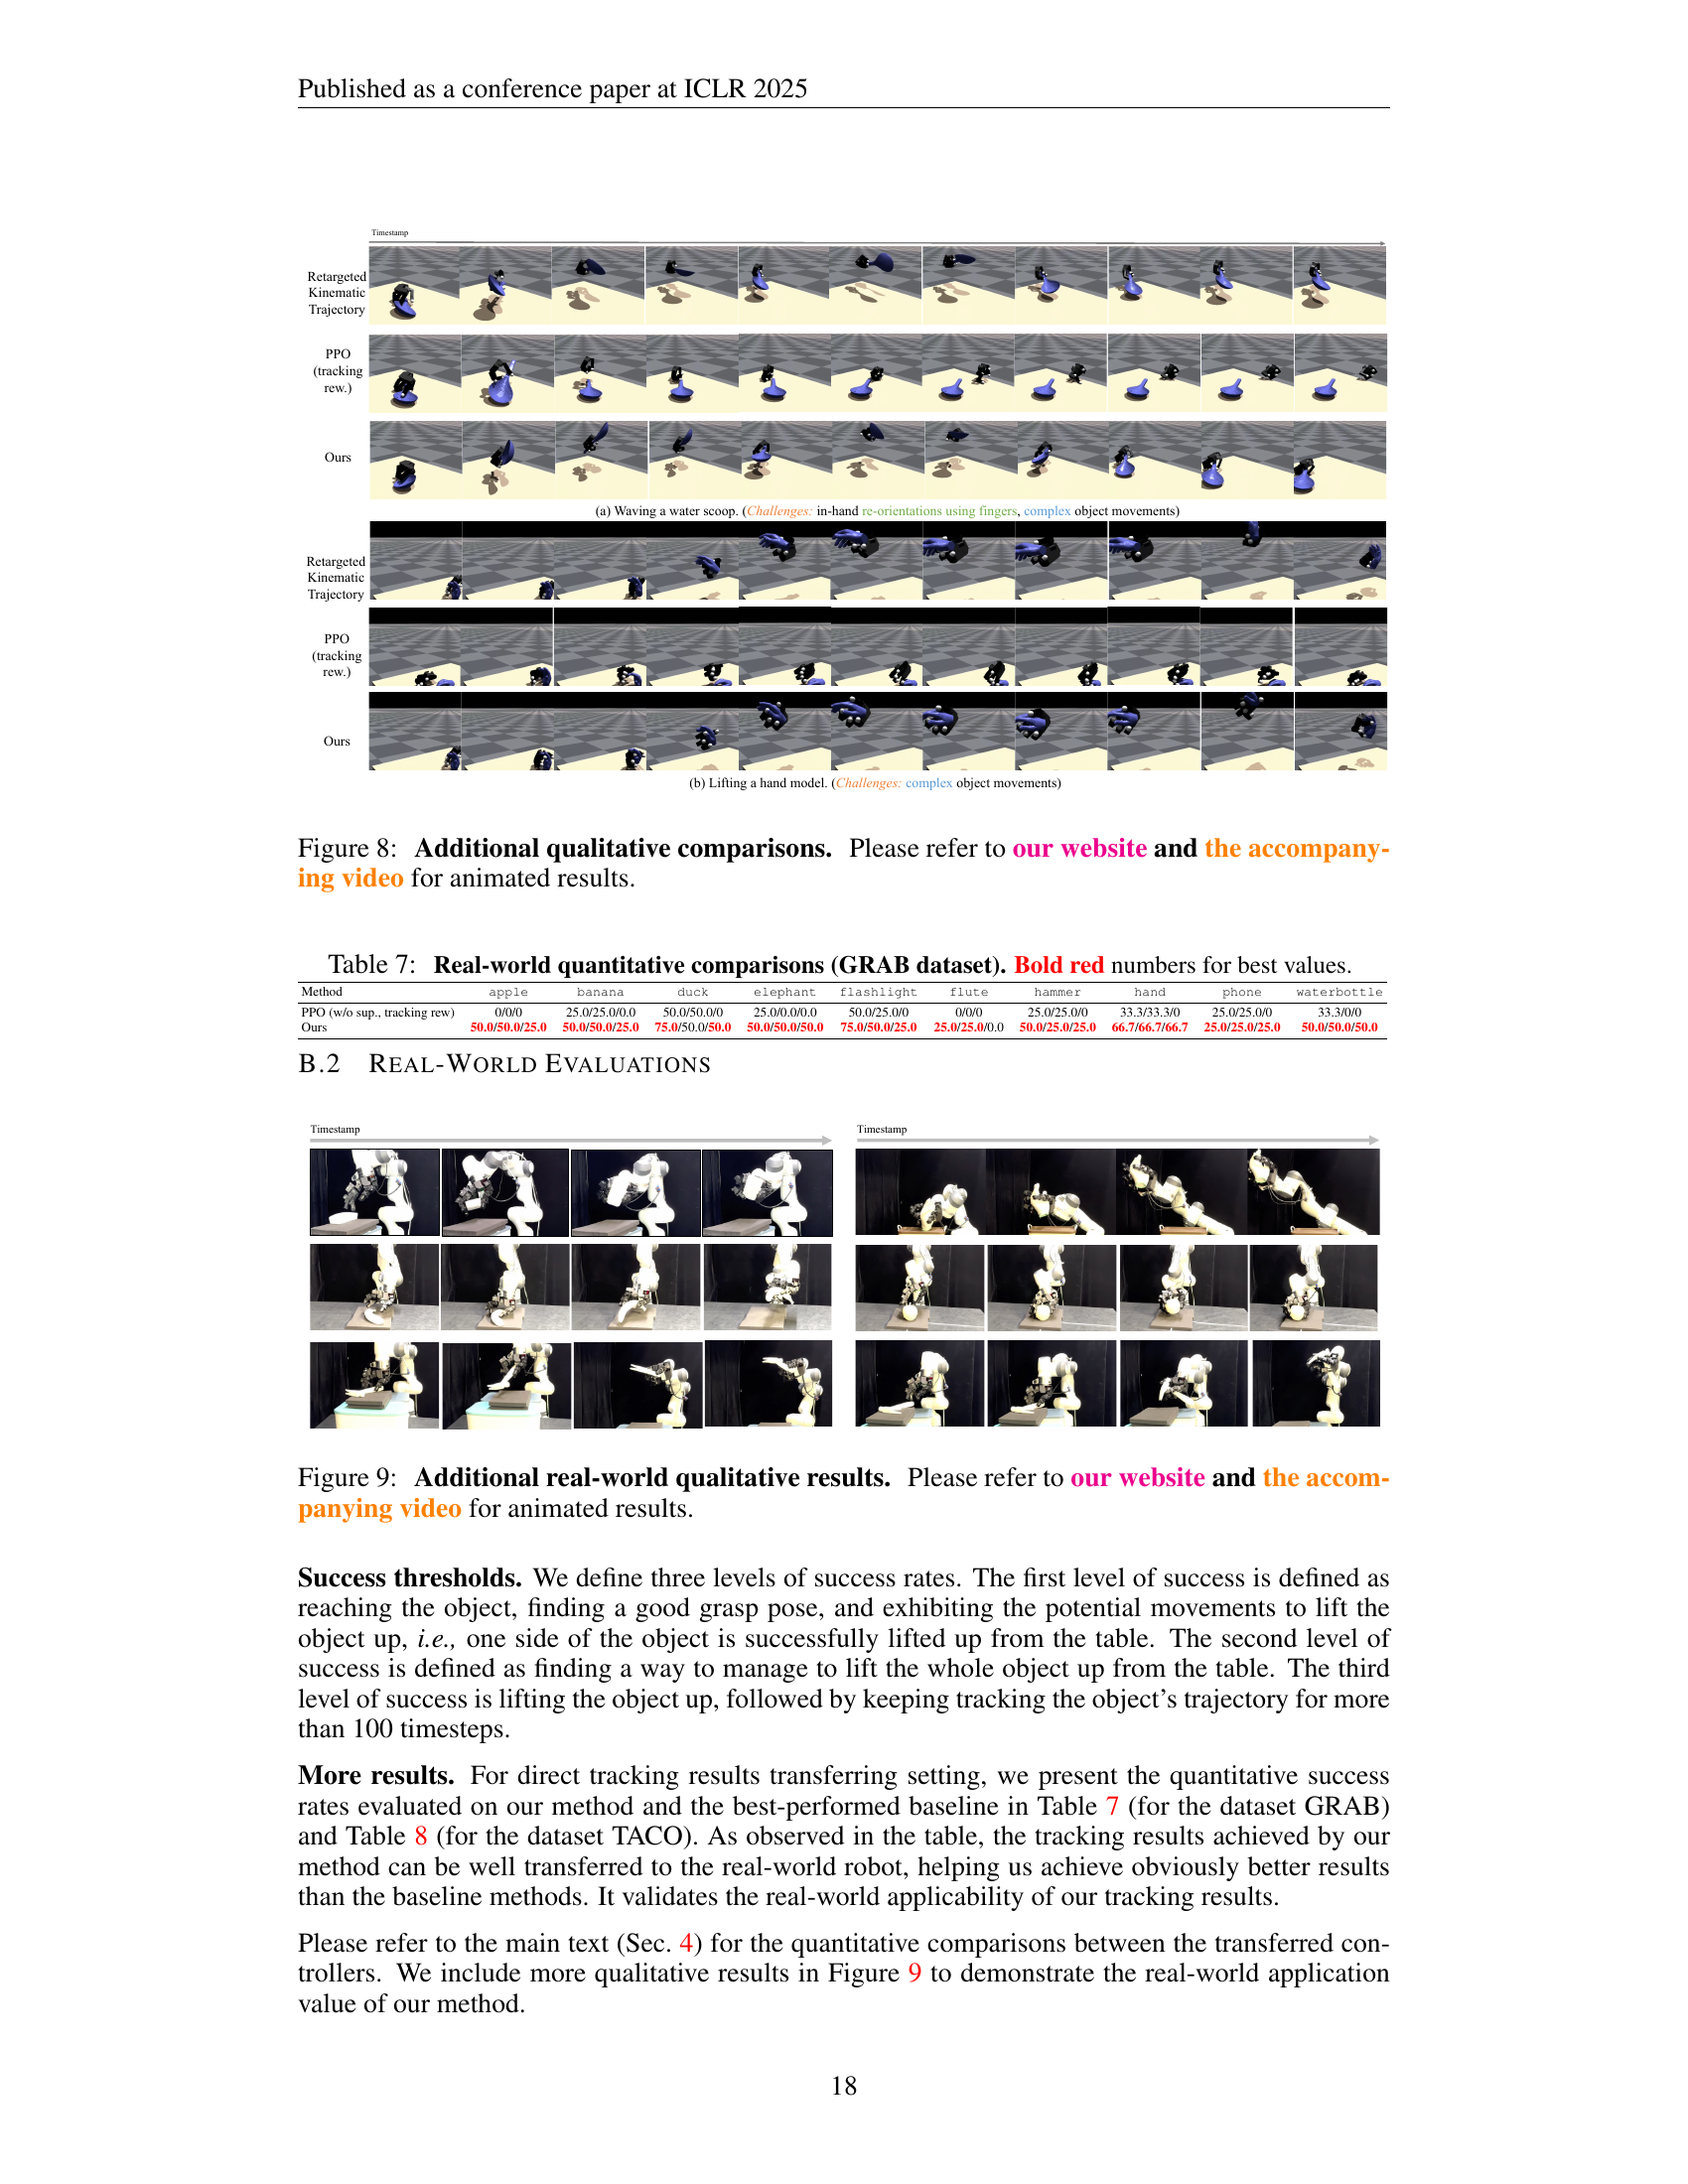
🔼 This figure provides additional qualitative comparisons of the DexTrack method’s performance against a baseline method on various dexterous manipulation tasks. The tasks showcase the model’s ability to handle complex in-hand object reorientations, interactions with thin objects, and other challenging manipulation scenarios. Because the image itself is limited, the caption directs the reader to the project website and accompanying video for a complete and dynamic visualization of the results.
read the caption
Figure 8: Additional qualitative comparisons. Please refer to our website and the accompanying video for animated results.

🔼 This figure shows additional qualitative results from real-world experiments. It provides a visual comparison of the DexTrack controller’s performance against a baseline method on various dexterous manipulation tasks. The images showcase the robot’s ability to handle complex movements, intricate in-hand object reorientations, and interactions with thin objects. Because the still images don’t fully capture the dynamic nature of the robot’s movements, the caption suggests referring to the accompanying video and project website for a better understanding of the results.
read the caption
Figure 9: Additional real-world qualitative results. Please refer to our website and the accompanying video for animated results.

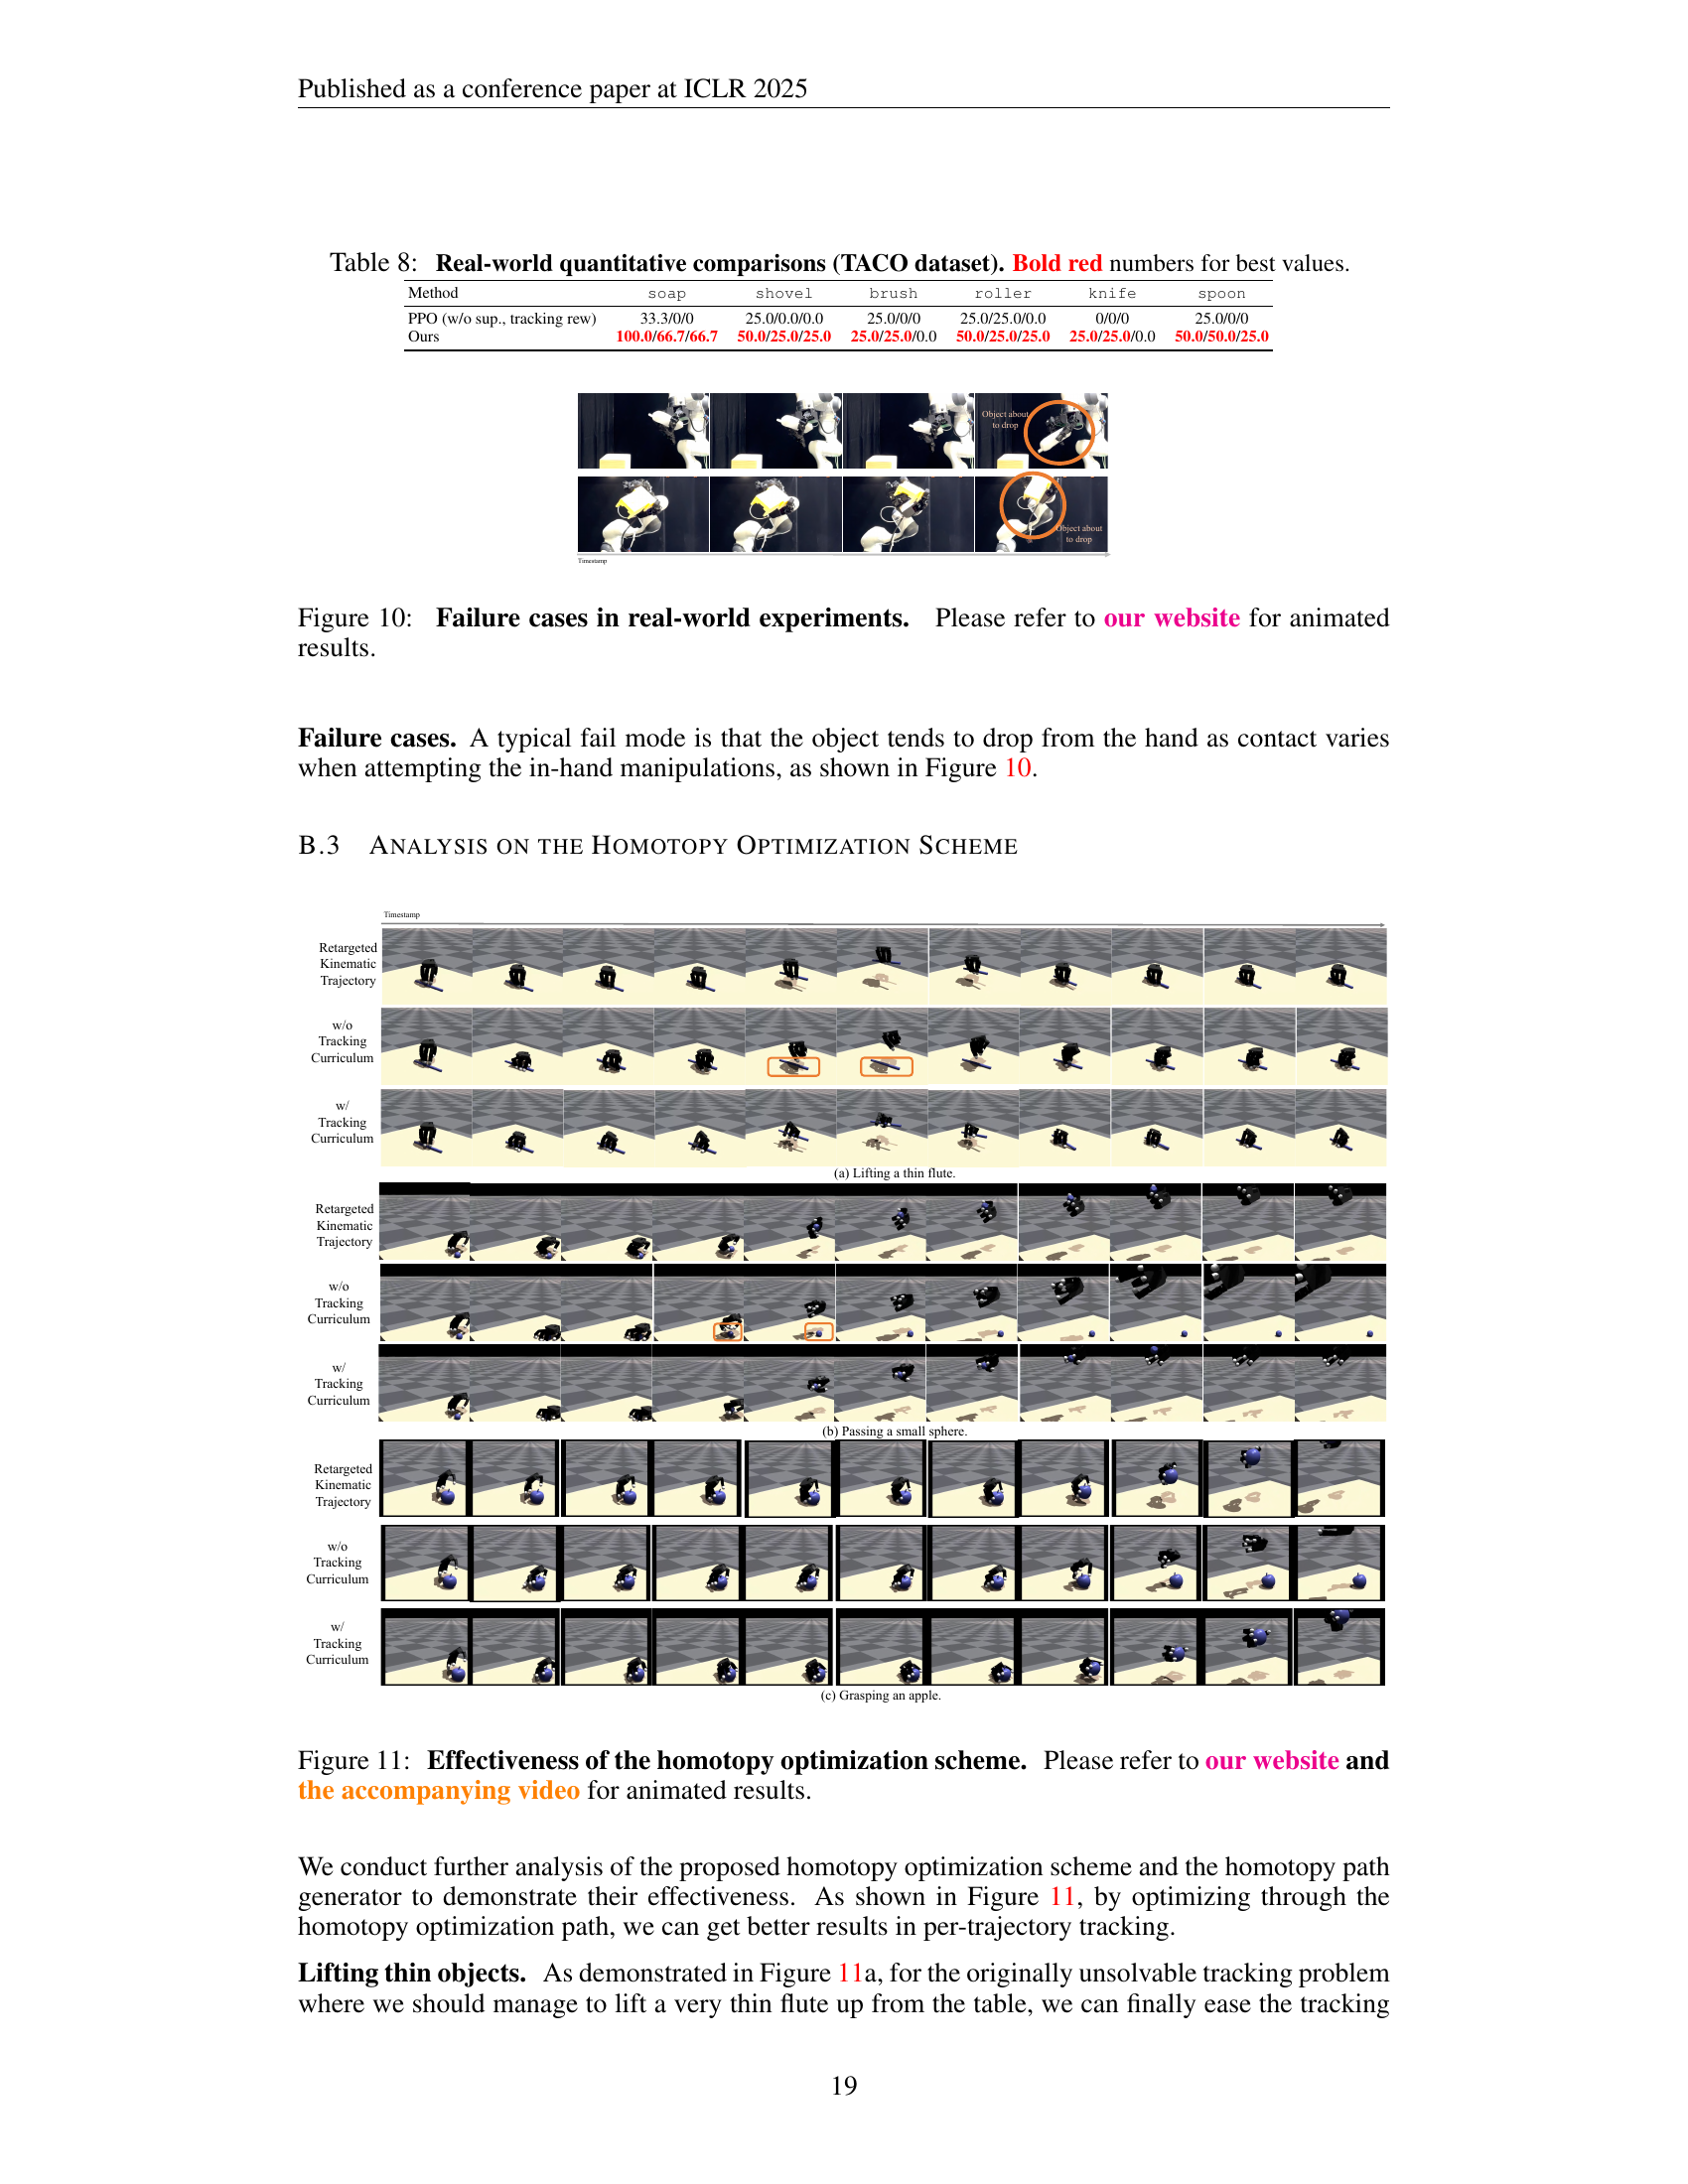
🔼 This figure showcases instances where the DexTrack system failed during real-world experiments. The failures primarily involve the object dropping from the robot’s grasp due to variations in contact. These failures highlight the challenges of applying a simulated controller to the real-world’s unpredictable dynamics and underscore areas for future improvement in robustness and contact management. The animated results on the project website provide further visual detail.
read the caption
Figure 10: Failure cases in real-world experiments. Please refer to our website for animated results.

🔼 Figure 11 demonstrates the effectiveness of the homotopy optimization scheme by comparing the results of lifting a thin flute, passing a small sphere, and grasping an apple with and without the scheme. The homotopy optimization scheme helps the model achieve better tracking results, particularly in challenging scenarios. The accompanying video on the project website provides animated results for a better understanding.
read the caption
Figure 11: Effectiveness of the homotopy optimization scheme. Please refer to our website and the accompanying video for animated results.

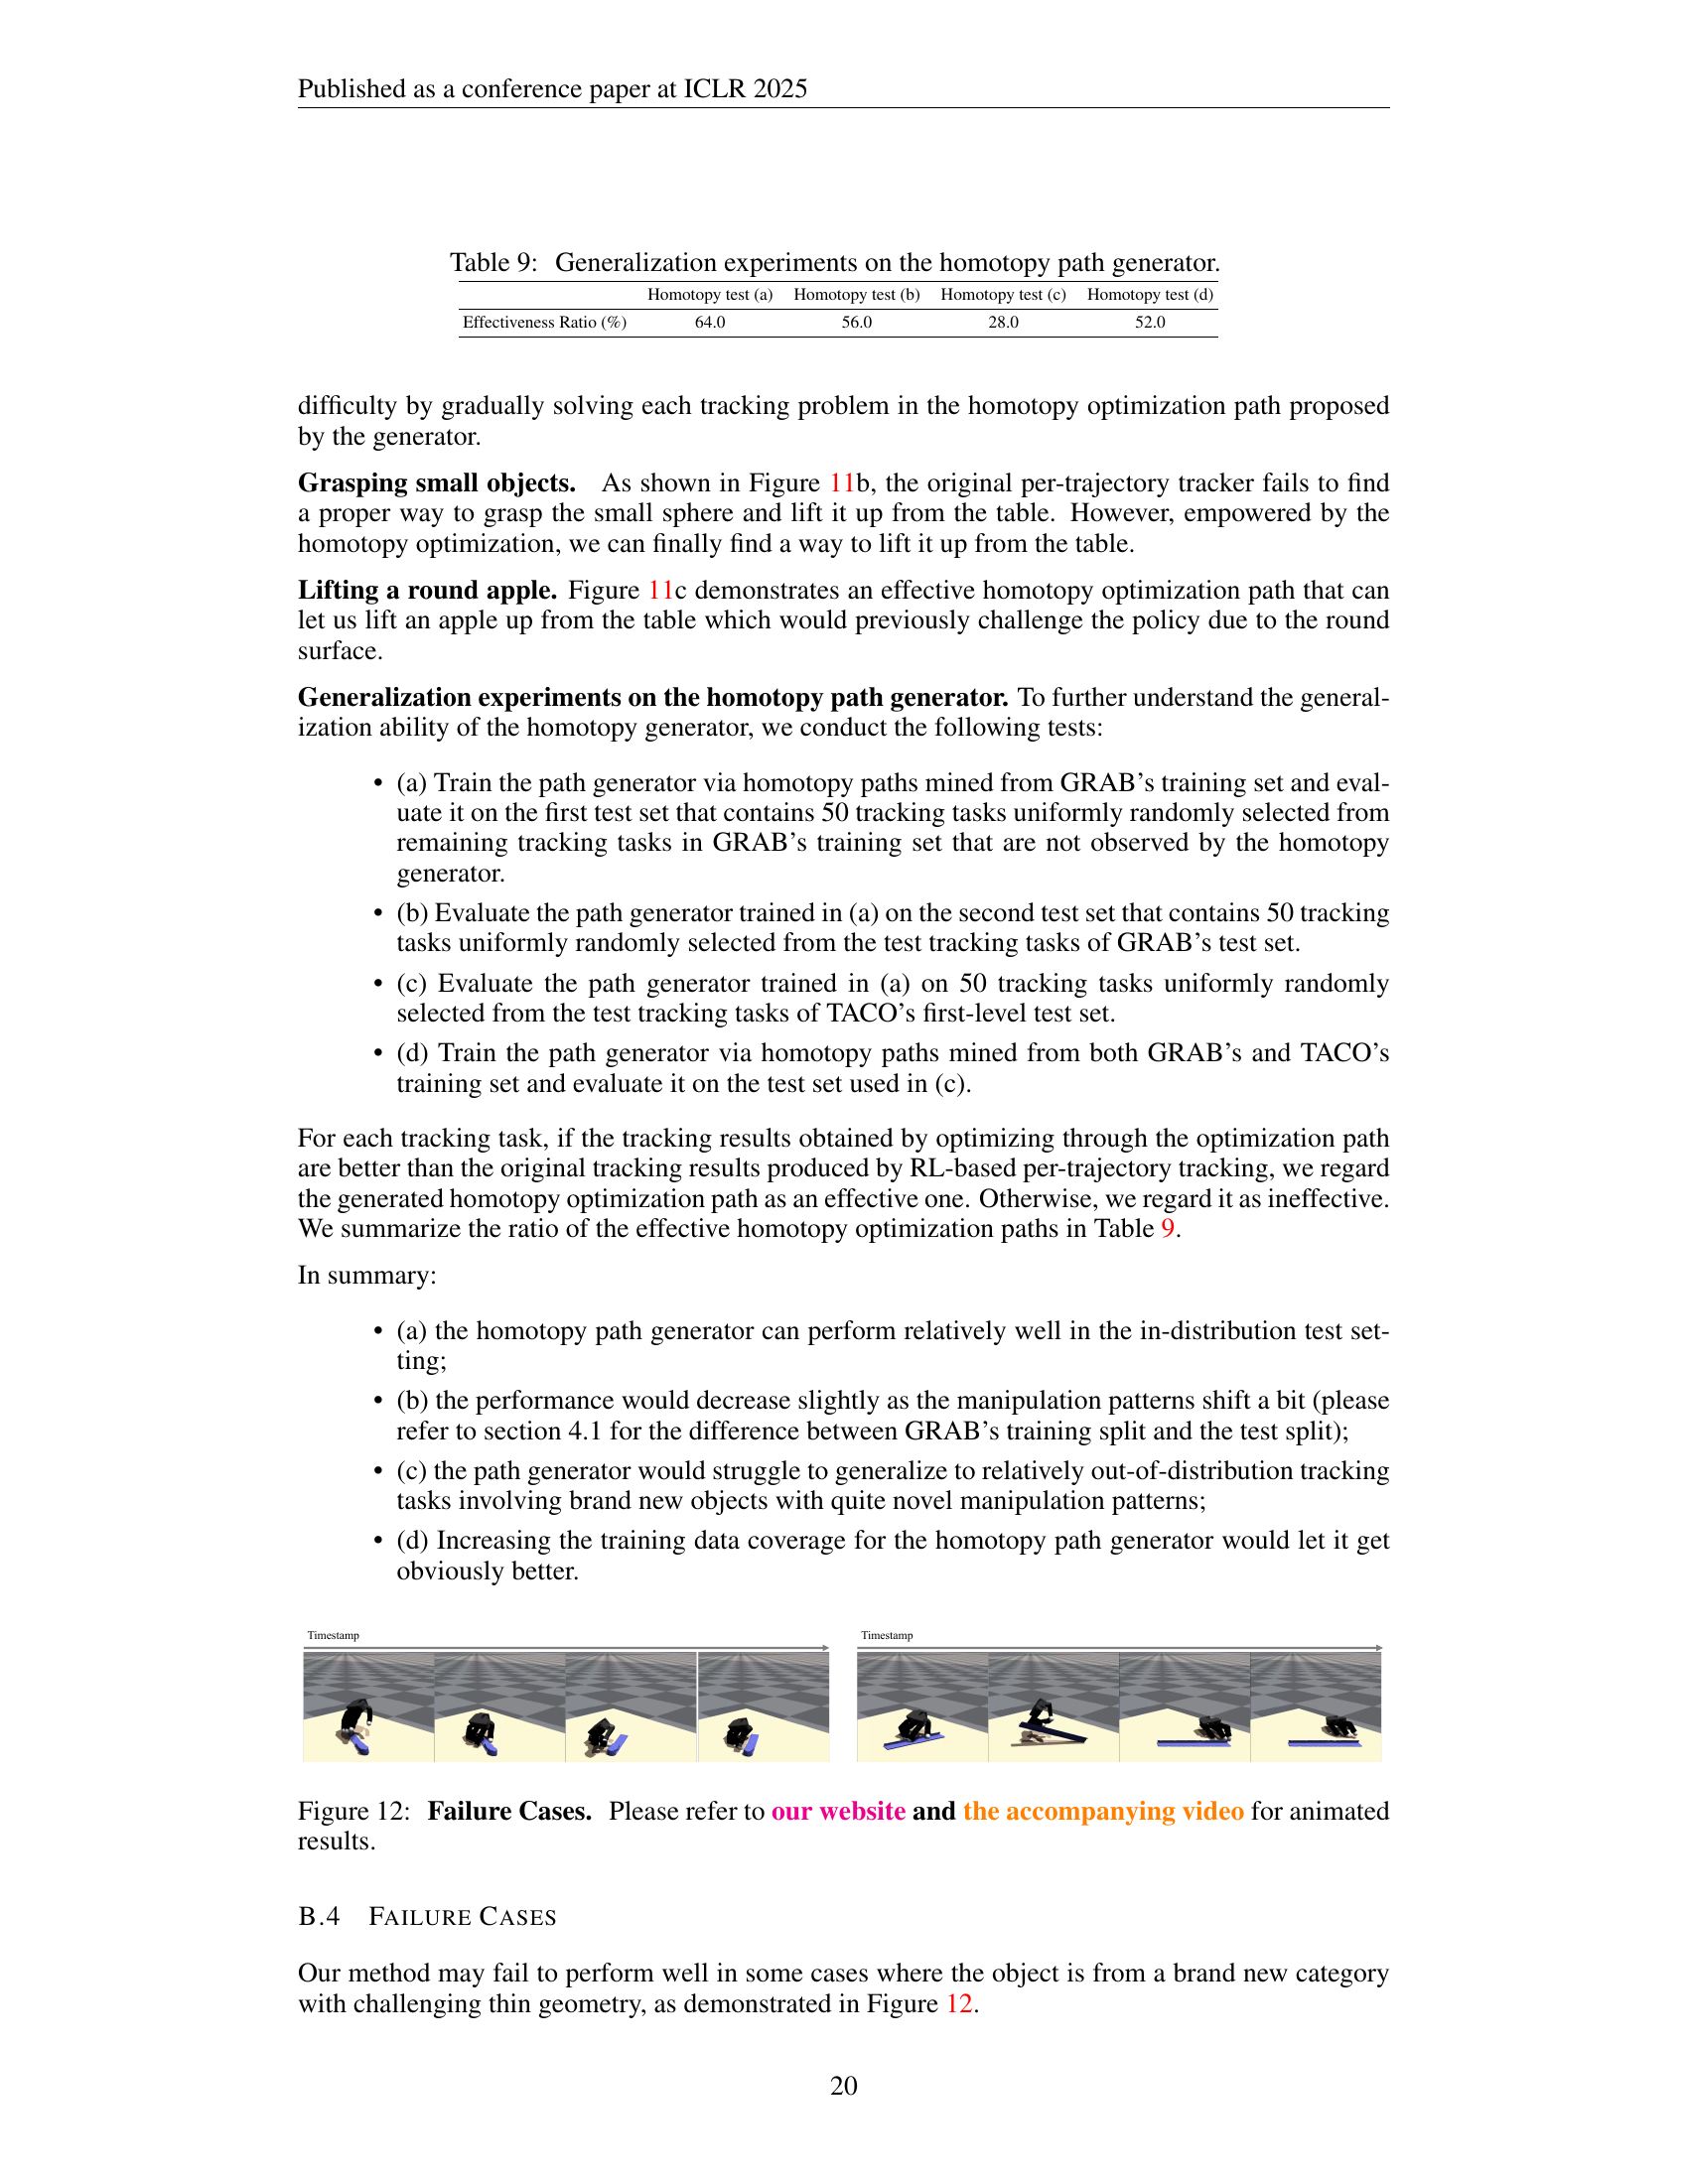
🔼 This figure showcases instances where the DexTrack method struggles. The scenarios depicted involve objects from novel categories or situations with challenging thin geometries that the model has not been adequately trained to handle. The accompanying video and website provide animated demonstrations to illustrate these failures more comprehensively.
read the caption
Figure 12: Failure Cases. Please refer to our website and the accompanying video for animated results.

🔼 This figure displays various novel objects from the TACO dataset that belong to object categories already present in the training set. This showcases the model’s ability to generalize to new objects within familiar categories, demonstrating the impact of the data augmentation technique used in the paper.
read the caption
Figure 13: Examples of novel objects from the seen object category (TACO).

🔼 This figure shows examples of objects from categories not seen during the training of the dexterous manipulation model. These objects are used to test the model’s ability to generalize to unseen object types, highlighting its capacity for handling novel manipulation tasks and showcasing its adaptability beyond objects encountered during the training process.
read the caption
Figure 14: Examples of objects from new object categories (TACO).
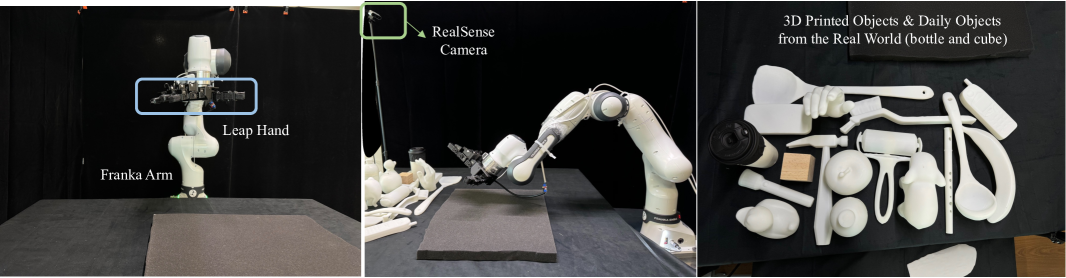
🔼 The figure shows the setup for real-world experiments. A Franka Emika Panda robot arm is used, equipped with a LEAP hand to interact with real-world objects. A RealSense camera provides the necessary visual information for object pose estimation (using FoundationPose). The setup demonstrates the transfer of the learned tracking controller from simulation to the real world.
read the caption
Figure 15: Real-world experiment setup.
More on tables
| Method | apple | banana | duck | elephant | flashlight | flute | hammer | hand | phone | waterbottle |
| PPO (w/o sup., tracking rew) | 0/0/0 | 25.0/25.0/0.0 | 50.0/25.0/0 | 50.0/0.0/0.0 | 50.0/0/0 | 0/0/0 | 25.0/0/0 | 66.7/33.3/0 | 25.0/0/0 | 33.3/33.3/0 |
| Ours | 25.0/0/0 | 50.0/50.0/25.0 | 75.0/50.0/25.0 | 75.0/50.0/50.0 | 50.0/25.0/25.0 | 25.0/25.0/25.0 | 50.0/50.0/50.0 | 66.7/33.3/33.3 | 50.0/50.0/25.0 | 50.0/33.3/33.3 |
🔼 This table presents a comparison of the success rates achieved by different methods on real-world dexterous manipulation tasks. The tasks involve interacting with various objects, including those requiring intricate movements and/or precise manipulation. Success is measured across three levels of difficulty, representing increasingly complex manipulation requirements. The table highlights the superior performance of the proposed method compared to baseline approaches.
read the caption
Table 2: Real-world quantitative comparisons. Bold red numbers for best values.
| Weight | 1.0 | 0.33 | 0.3 | 0.05 | 0.05 |
🔼 This table lists the weights assigned to different components of the reward function used in reinforcement learning to train the neural tracking controller. The reward function guides the controller’s learning process by assigning different importance levels to various aspects of successful trajectory tracking, such as how well the object’s position, orientation, and the robot’s hand and finger positions match the reference trajectory, and the overall hand-object interaction affinity.
read the caption
Table 3: Weights of different reward components.
| Dataset | Method | () | () | () | () | Success Rate () |
| GRAB | PPO (w/o sup., tracking rew.) | 0.5813 | 6.03 | 0.1730 | 0.5439 | 36.04/55.84 |
| Ours | 0.4515 | 4.82 | 0.14574 | 0.4574 | 42.64/61.42 | |
| TACO | PPO (w/o sup., tracking rew.) | 0.6751 | 6.37 | 0.1264 | 0.5443 | 21.67/50.25 |
| Ours | 0.4782 | 3.94 | 0.1329 | 0.4228 | 32.02/62.07 |
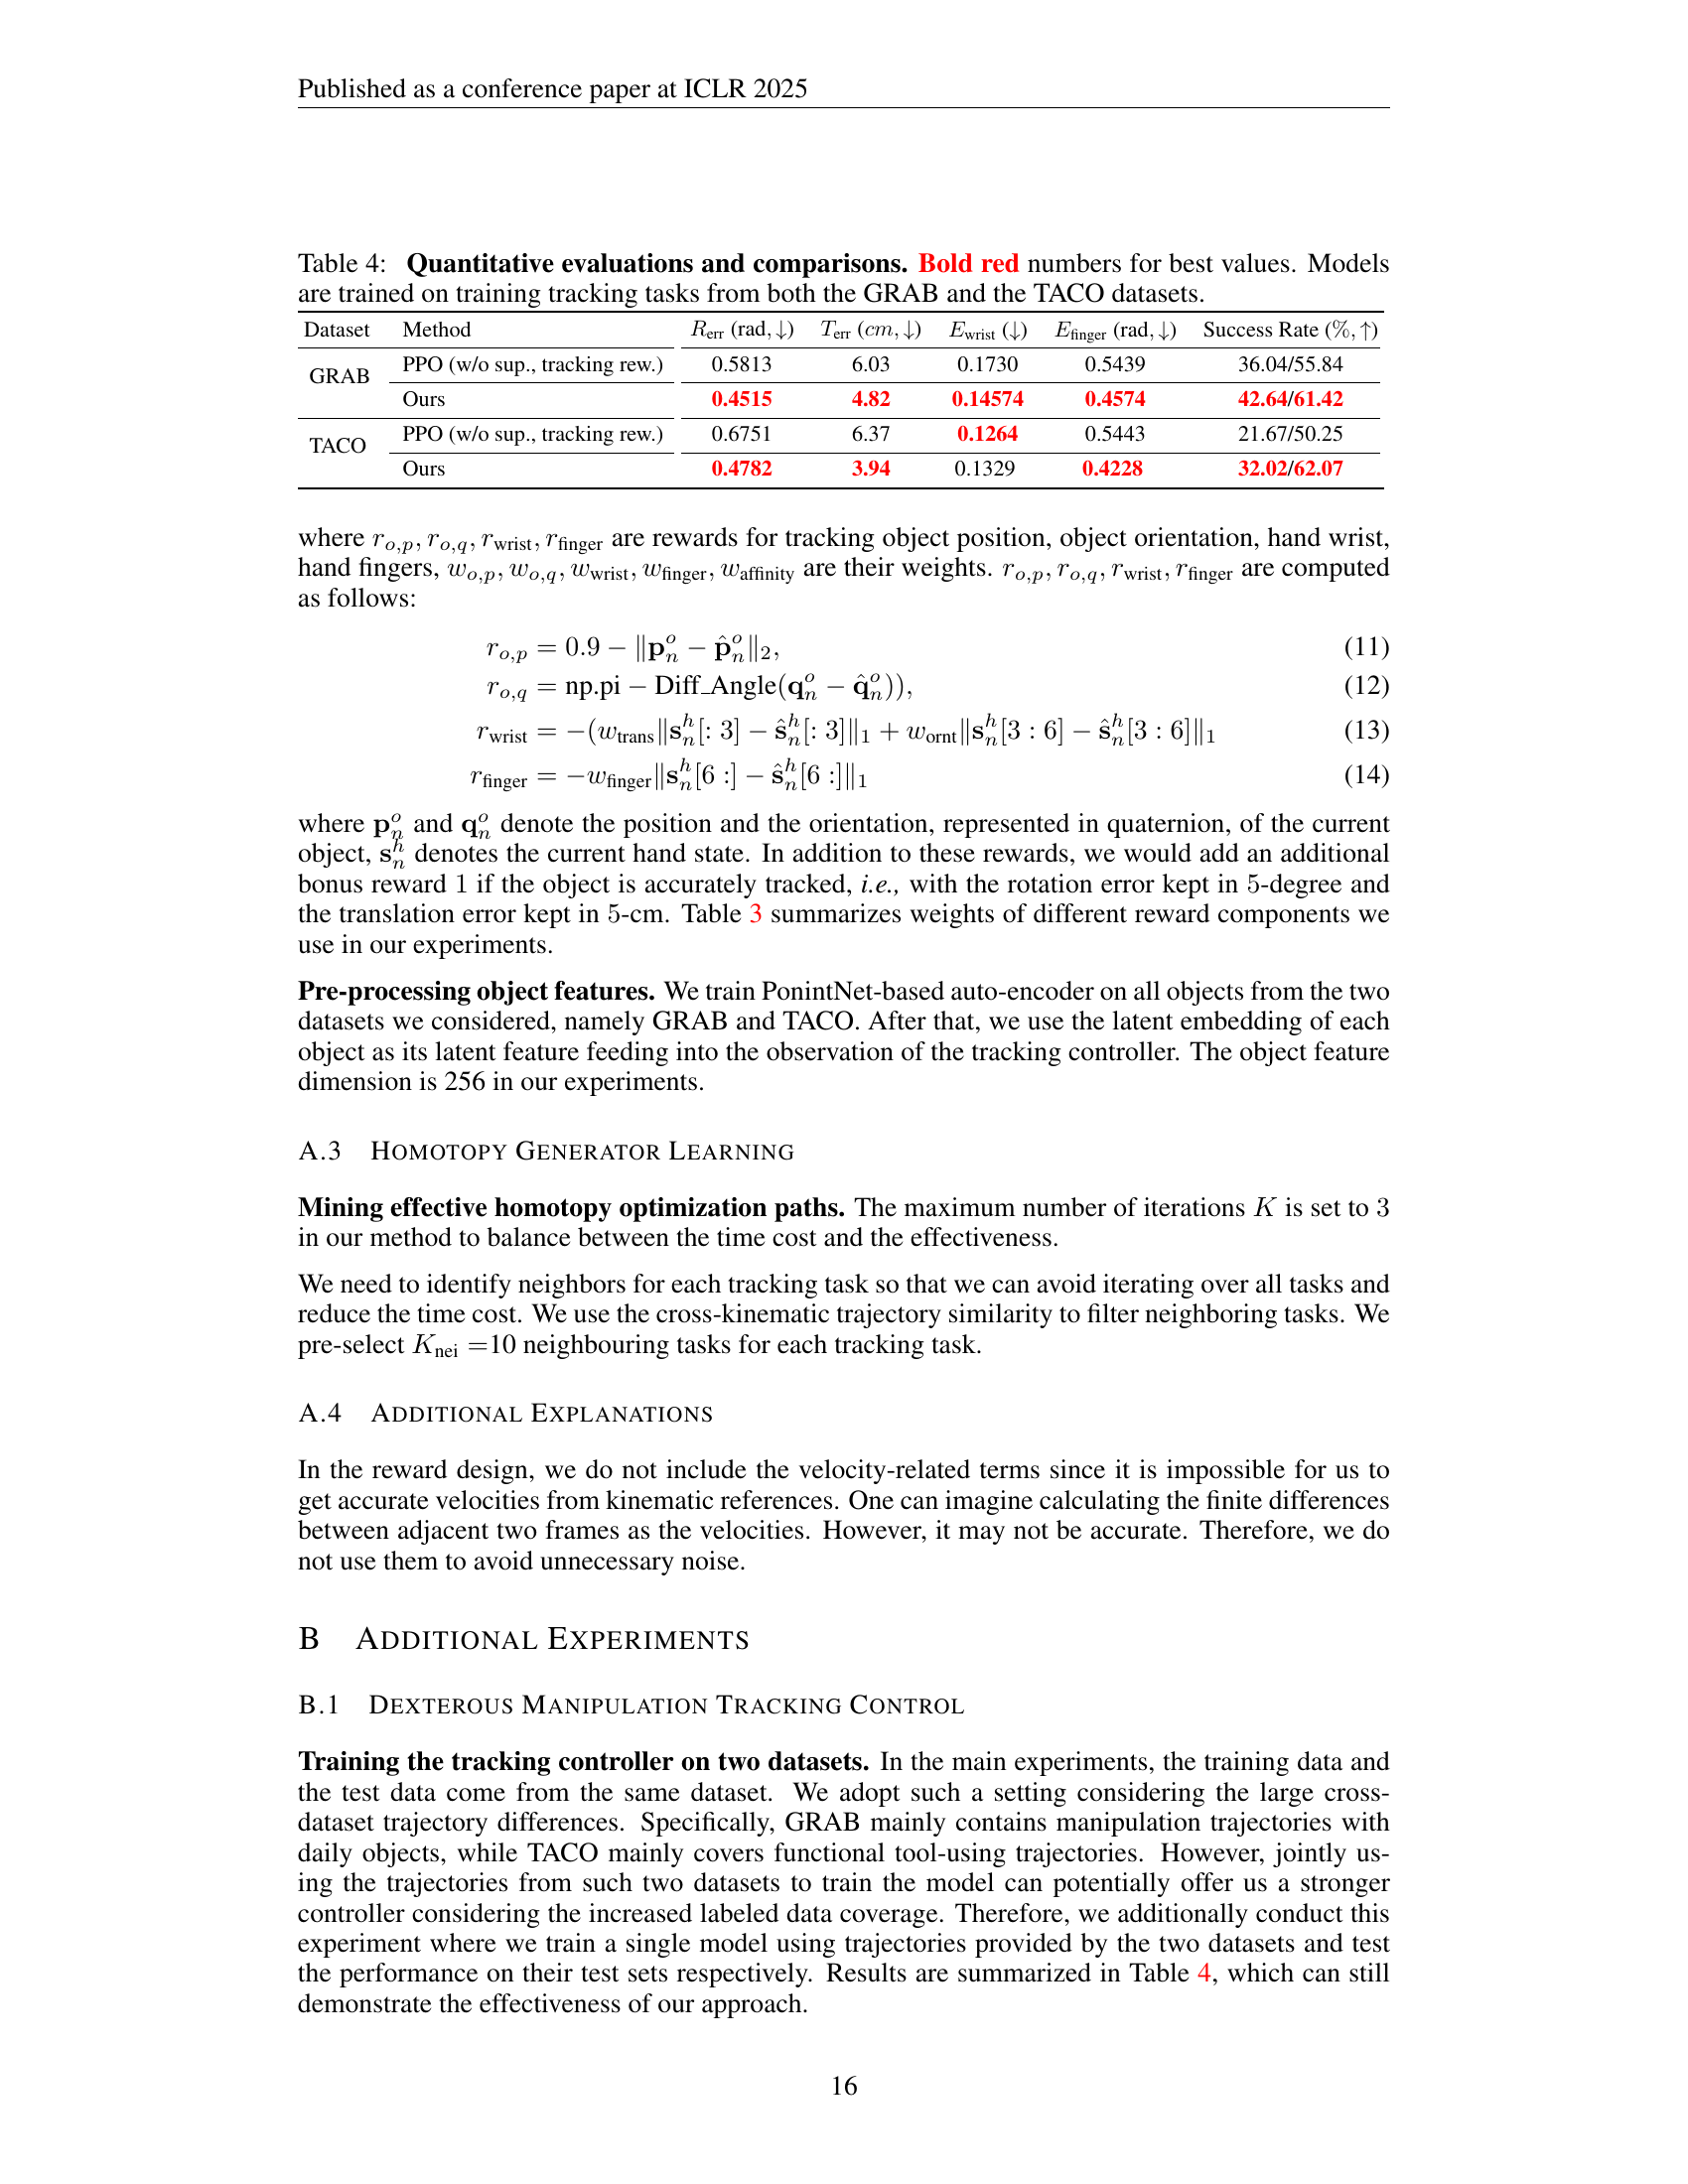
🔼 This table presents a quantitative comparison of different methods for dexterous manipulation tracking control. The results are shown for two datasets, GRAB and TACO. Metrics evaluated include the average object rotation error (Rerr), average object translation error (Terr), average wrist error (Ewrist), average finger error (Efinger), and success rate. The methods compared are: PPO (without supervision, tracking reward), and the proposed DexTrack method (with and without data and homotopy optimization). Bold red numbers highlight the best results for each metric and dataset.
read the caption
Table 4: Quantitative evaluations and comparisons. Bold red numbers for best values. Models are trained on training tracking tasks from both the GRAB and the TACO datasets.
| Test set | () | () | () | () | Success Rate () |
| S1 | 0.5787 | 2.43 | 0.1481 | 0.4703 | 35.97/67.63 |
| S2 | 0.6026 | 2.46 | 0.1455 | 0.4709 | 30.83/65.00 |
| S3 | 0.6508 | 8.06 | 0.1513 | 0.4683 | 10.18/46.32 |
🔼 This table presents a quantitative evaluation of the DexTrack model’s generalizability on the TACO dataset. It assesses the model’s performance across four test sets with varying levels of difficulty. Each test set differs in the novelty of tools, the types of interactions, and the combination of both. The table shows the model’s performance in terms of rotation error, translation error, wrist error, finger error, and success rate for each test set.
read the caption
Table 5: Generalizability evaluations on the TACO dataset.
| Proportion | () | () | () | () | Success Rate () |
| 0.0 | 0.4985 | 4.42 | 0.1435 | 0.4767 | 31.03/57.64 |
| 0.1 | 0.4730 | 3.86 | 0.1502 | 0.4921 | 36.45/59.61 |
| 0.3 | 0.4903 | 2.94 | 0.1256 | 0.4804 | 40.89/62.07 |
| 0.5 | 0.4749 | 2.51 | 0.1680 | 0.4682 | 41.38/67.00 |
| 0.9 | 0.4776 | 2.29 | 0.1437 | 0.4839 | 44.83/72.91 |
| 1.0 | 0.4953 | 2.10 | 0.1510 | 0.4661 | 48.77/74.38 |
🔼 This table presents a comparison of the performance of models trained using varying amounts of demonstration data. It shows how the success rate, rotation error, translation error, and other key metrics change as the amount of training data increases. This allows assessment of the impact of data scaling on the model’s performance and generalization ability.
read the caption
Table 6: Performance comparisons across models trained with different amount of demonstration data.
| Method | apple | banana | duck | elephant | flashlight | flute | hammer | hand | phone | waterbottle |
| PPO (w/o sup., tracking rew) | 0/0/0 | 25.0/25.0/0.0 | 50.0/50.0/0 | 25.0/0.0/0.0 | 50.0/25.0/0 | 0/0/0 | 25.0/25.0/0 | 33.3/33.3/0 | 25.0/25.0/0 | 33.3/0/0 |
| Ours | 50.0/50.0/25.0 | 50.0/50.0/25.0 | 75.0/50.0/50.0 | 50.0/50.0/50.0 | 75.0/50.0/25.0 | 25.0/25.0/0.0 | 50.0/25.0/25.0 | 66.7/66.7/66.7 | 25.0/25.0/25.0 | 50.0/50.0/50.0 |
🔼 This table presents a quantitative comparison of the performance of different methods on real-world dexterous manipulation tasks using the GRAB dataset. The methods are compared across various metrics, including success rates (with two different thresholds), object rotation error, object translation error, and hand wrist/finger errors. Bold red numbers highlight the best-performing method for each metric.
read the caption
Table 7: Real-world quantitative comparisons (GRAB dataset). Bold red numbers for best values.
| Method | soap | shovel | brush | roller | knife | spoon |
| PPO (w/o sup., tracking rew) | 33.3/0/0 | 25.0/0.0/0.0 | 25.0/0/0 | 25.0/25.0/0.0 | 0/0/0 | 25.0/0/0 |
| Ours | 100.0/66.7/66.7 | 50.0/25.0/25.0 | 25.0/25.0/0.0 | 50.0/25.0/25.0 | 25.0/25.0/0.0 | 50.0/50.0/25.0 |
🔼 This table presents a quantitative comparison of the performance of the proposed DexTrack method and baseline methods on real-world dexterous manipulation tasks from the TACO dataset. The results are broken down by object category, showing success rates (with success defined by three levels of increasing difficulty), along with per-frame error metrics (for object rotation, object translation, and wrist/finger joint positions). Bold red numbers highlight the best performance for each object. This illustrates DexTrack’s generalization capability and robustness in real-world scenarios.
read the caption
Table 8: Real-world quantitative comparisons (TACO dataset). Bold red numbers for best values.
| Homotopy test (a) | Homotopy test (b) | Homotopy test (c) | Homotopy test (d) | |
| Effectiveness Ratio (%) | 64.0 | 56.0 | 28.0 | 52.0 |
🔼 This table presents the results of generalization experiments conducted on the homotopy path generator, a key component of the DexTrack method. The generator aims to find effective paths for solving challenging trajectory tracking problems. The experiments evaluate how well the generator generalizes to unseen tasks by testing its performance on trajectory tracking problems drawn from different sets: tasks within the training distribution, tasks unseen during training but from the same dataset, and tasks from a different dataset. The results are presented as the effectiveness ratio, indicating the percentage of tracking tasks where the homotopy paths generated by the model result in better performance compared to a baseline approach.
read the caption
Table 9: Generalization experiments on the homotopy path generator.
| PPO (w/o sup) | Ours (w/o prior., w/o curri.) | Ours (w/o prior) | Ours | |
| Time | 1 day | 2 days | 4 days | 4 days |
🔼 This table details the training time taken for different configurations of the DexTrack model on the TACO dataset. It compares the time taken for training using Proximal Policy Optimization (PPO) without supervision, PPO with a tracking reward, and three variations of the DexTrack approach: one without a data flywheel and homotopy optimization, one without a data flywheel, and the complete DexTrack model. The times are given in days and reflect the computation time needed for each training run.
read the caption
Table 10: Total training time consumption (TACO dataset).
| Method | DGrasp | PPO (OmniGrasp rew.) | PPO (w/o sup., tracking rew.) | Ours (w/o data, w/o homotopy) | Ours (w/o data) | Ours |
| 2.424 | 2.389 | 2.688 | 2.725 | 3.050 | 3.251 |
🔼 This table presents the generalization scores achieved by different methods on the GRAB dataset. The generalization score quantifies a model’s ability to generalize from seen to unseen data. Higher scores indicate better generalization performance. The scores are broken down by method and show the performance across different aspects of generalization.
read the caption
Table 11: Generlaization score (GRAB dataset). Bold red numbers for best values.
| Method | PPO (w/o sup., tracking rew.) | Ours |
| 2.665 | 3.276 |
🔼 This table presents a quantitative comparison of the robustness of different methods for dexterous manipulation tracking control on the GRAB dataset. Robustness is evaluated by comparing the performance of each method on tasks with high-quality kinematic trajectories versus those with added noise or disturbances. Higher scores indicate greater robustness.
read the caption
Table 12: Robustness score (GRAB dataset). Bold red numbers for best values.
| Method | PPO (w/o sup., tracking rew.) | Ours |
| 0.317/0.098/0.0 | 0.537/0.415/0.293 |
🔼 This table presents a quantitative comparison of the adaptativity of different methods on the GRAB dataset. Adaptativity is evaluated using three metrics: smoothness, consistency, and penetrations, which measure the quality of kinematic manipulation trajectories. The results show the scores for each of these metrics for different methods, highlighting the superior adaptativity of the proposed method.
read the caption
Table 13: Adaptativity score (GRAB dataset). Bold red numbers for best values.
| Method | PPO (w/o sup., tracking rew.) | Ours |
| 0.317/0.098/0.0 | 0.537/0.415/0.293 |
🔼 This table presents the generalization scores achieved by different methods on the GRAB dataset. The generalization score quantifies how well a model trained on one set of manipulation tasks generalizes to unseen tasks. Higher scores indicate better generalization. The table compares the performance of the proposed method (‘Ours’) against several baseline methods, highlighting the superior generalization ability of the proposed approach.
read the caption
Table 14: Generlaization score (GRAB dataset). Bold red numbers for best values.
| GRAB | 3.426 | 1.641 | 0.275 |
| TACO | 1.978 | 2.285 | 0.497 |
🔼 This table presents a quantitative analysis of trajectory difficulty across two datasets, GRAB and TACO, used in the paper’s experiments. It uses three key metrics to assess this difficulty: 1) Ssmooth (m.s⁻²): quantifies trajectory smoothness by measuring average object acceleration per frame; 2) Ucontact: measures the rate of hand-object contact map changes per frame, indicating contact dynamics complexity; and 3) Sshape (cm⁻¹): assesses object shape complexity using the z-axis extent of the object’s bounding box. Higher values in each metric generally indicate more difficult-to-track trajectories.
read the caption
Table 15: Trajectory difficulty statistics.
Full paper#