TL;DR#
Current autonomous driving systems heavily rely on individual vehicle sensors, leading to safety issues when sensors malfunction or are occluded. Cooperative perception methods using vehicle-to-vehicle communication improve this but are largely limited to detection and tracking, leaving overall cooperative planning performance underexplored. This paper aims to address these limitations.
The paper proposes V2V-LLM, a novel method that integrates a large language model (LLM) into vehicle-to-vehicle cooperative autonomous driving. It introduces a new dataset (V2V-QA) for this problem setting and benchmarks V2V-LLM against baseline methods with various fusion approaches. Results show that V2V-LLM effectively fuses perception information from multiple vehicles and outperforms other methods in critical tasks like notable object identification and planning, paving the way for safer and more efficient autonomous driving.
Key Takeaways#
Why does it matter?#
This paper is important because it introduces a novel problem setting for cooperative autonomous driving using LLMs, which is a significant advancement in the field. It also presents a new benchmark dataset (V2V-QA) and a strong baseline method (V2V-LLM), which will allow other researchers to easily compare their methods. Lastly, it opens up new research avenues for improving safety and efficiency of autonomous driving systems.
Visual Insights#

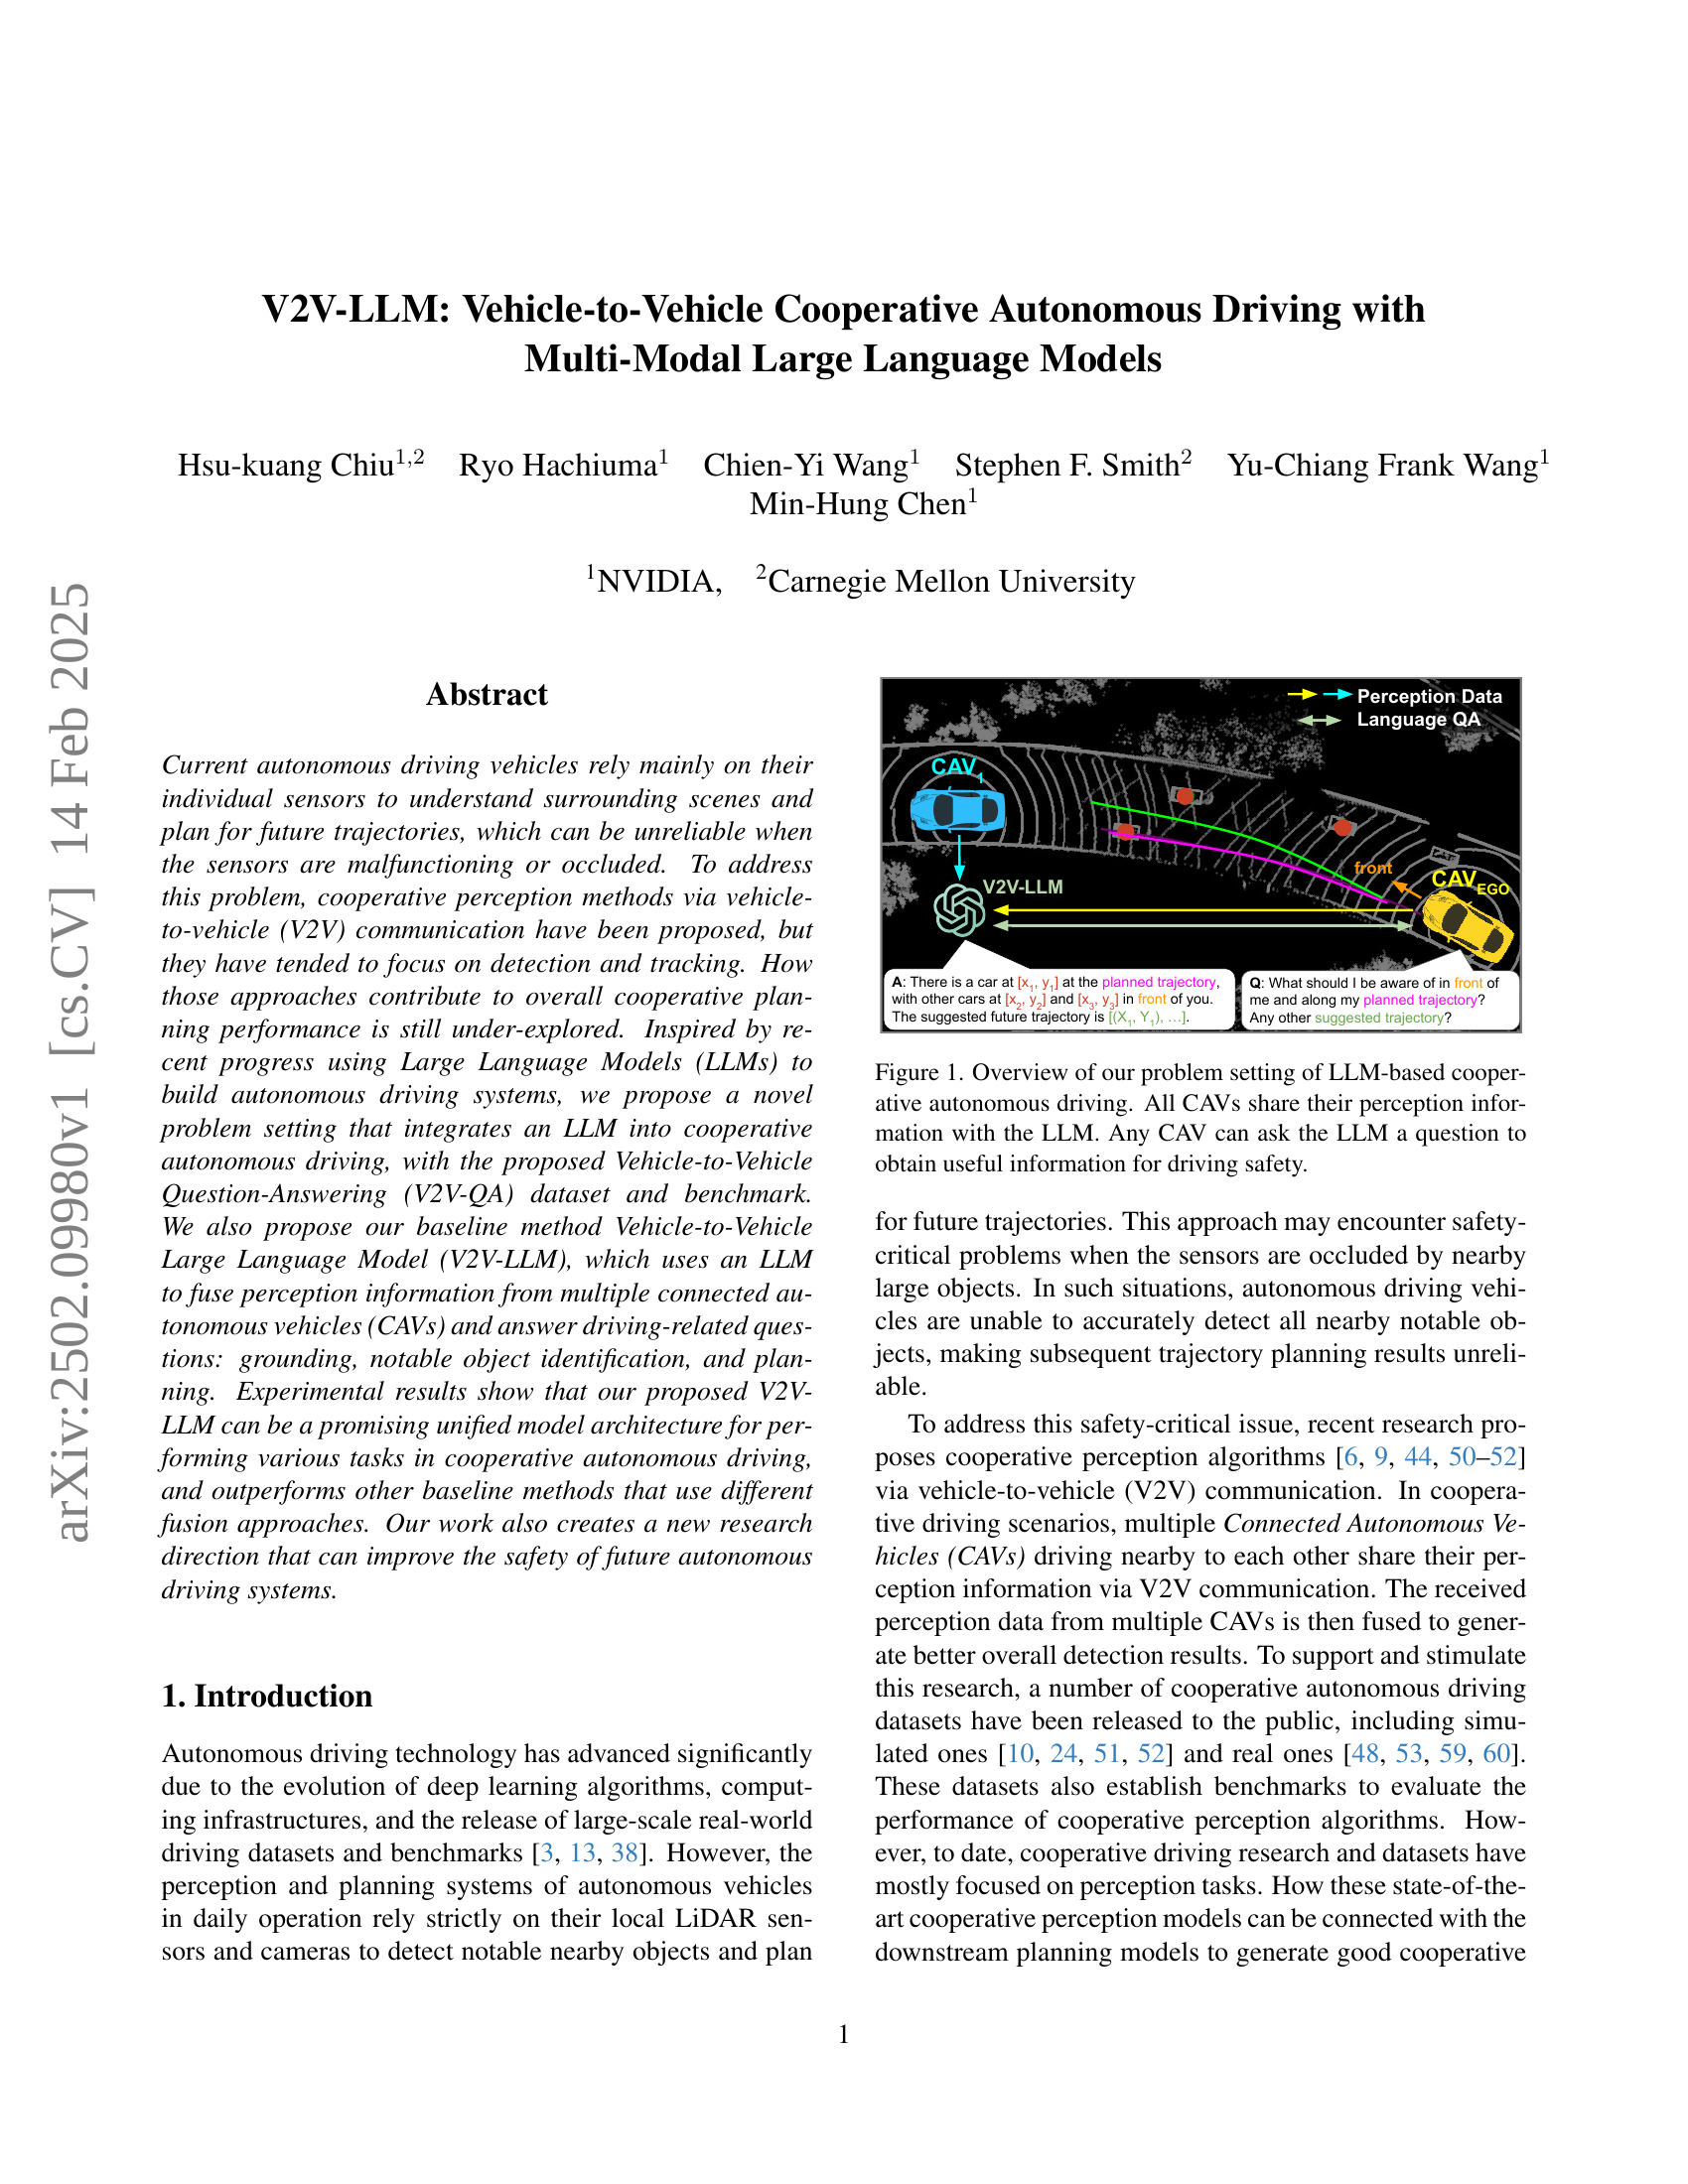
🔼 This figure illustrates the system architecture of V2V-LLM, a novel approach to cooperative autonomous driving that leverages large language models (LLMs). Multiple connected autonomous vehicles (CAVs) simultaneously share their perception data (e.g., sensor readings, object detections) with a central LLM. Any CAV can then query the LLM in natural language about aspects of the driving environment, such as potential hazards or optimal trajectories. The LLM processes the aggregated perception data from all CAVs to answer the query, providing helpful information to improve driving safety and decision-making. This cooperative perception system aims to enhance the reliability of autonomous driving, especially in situations where individual vehicle sensors may be unreliable or limited.
read the caption
Figure 1: Overview of our problem setting of LLM-based cooperative autonomous driving. All CAVs share their perception information with the LLM. Any CAV can ask the LLM a question to obtain useful information for driving safety.
| Dataset | Publication | # CAVs | Sim/Real | # Frames | # QA | # QA/frame | Point Cloud | Planning |
| AD | ||||||||
| NuScenes [3] | CVPR 2020 | - | Real | 400K | - | - | ✓ | |
| Waymo [38] | CVPR 2020 | - | Real | 200K | - | - | ✓ | |
| Cooperative perception in AD | ||||||||
| OPV2V [52] | ICRA 2022 | 2-7 | Sim | 11K | - | - | ✓ | |
| V2XSet [51] | ECCV 2022 | 2-5 | Sim | 11K | - | - | ✓ | |
| V2V4Real [53] | CVPR 2023 | 2 | Real | 20K† | - | - | ✓ | |
| V2X-Real [48]‡ | ECCV 2024 | 2 | Real | 33K | - | - | ✓ | |
| LLM-based AD | ||||||||
| NuScenes-QA [35] | AAAI 2024 | - | Real | 34K | 460K | 13.5 | ✓ | |
| Lingo-QA [33] | ECCV 2024 | - | Real | 28K | 420K | 15.3 | ✓ | |
| MAPLM-QA [4] | CVPR 2024 | - | Real | 14K | 61K | 4.4 | ✓ | |
| DriveLM [37] | ECCV 2024 | - | Sim+Real | 69K | 2M | 29.1 | ✓ | |
| TOKEN [39] | CoRL 2024 | - | Real | 28K | 434K | 15.5 | ✓ | |
| OmniDrive-nuScenes [43] | arXiv 2024 | - | Real | 34K | 450K | 13.2 | ✓ | |
| V2V-QA (Ours) | - | 2 | Real | 18K | 577K | 31.7 | ✓ | ✓ |
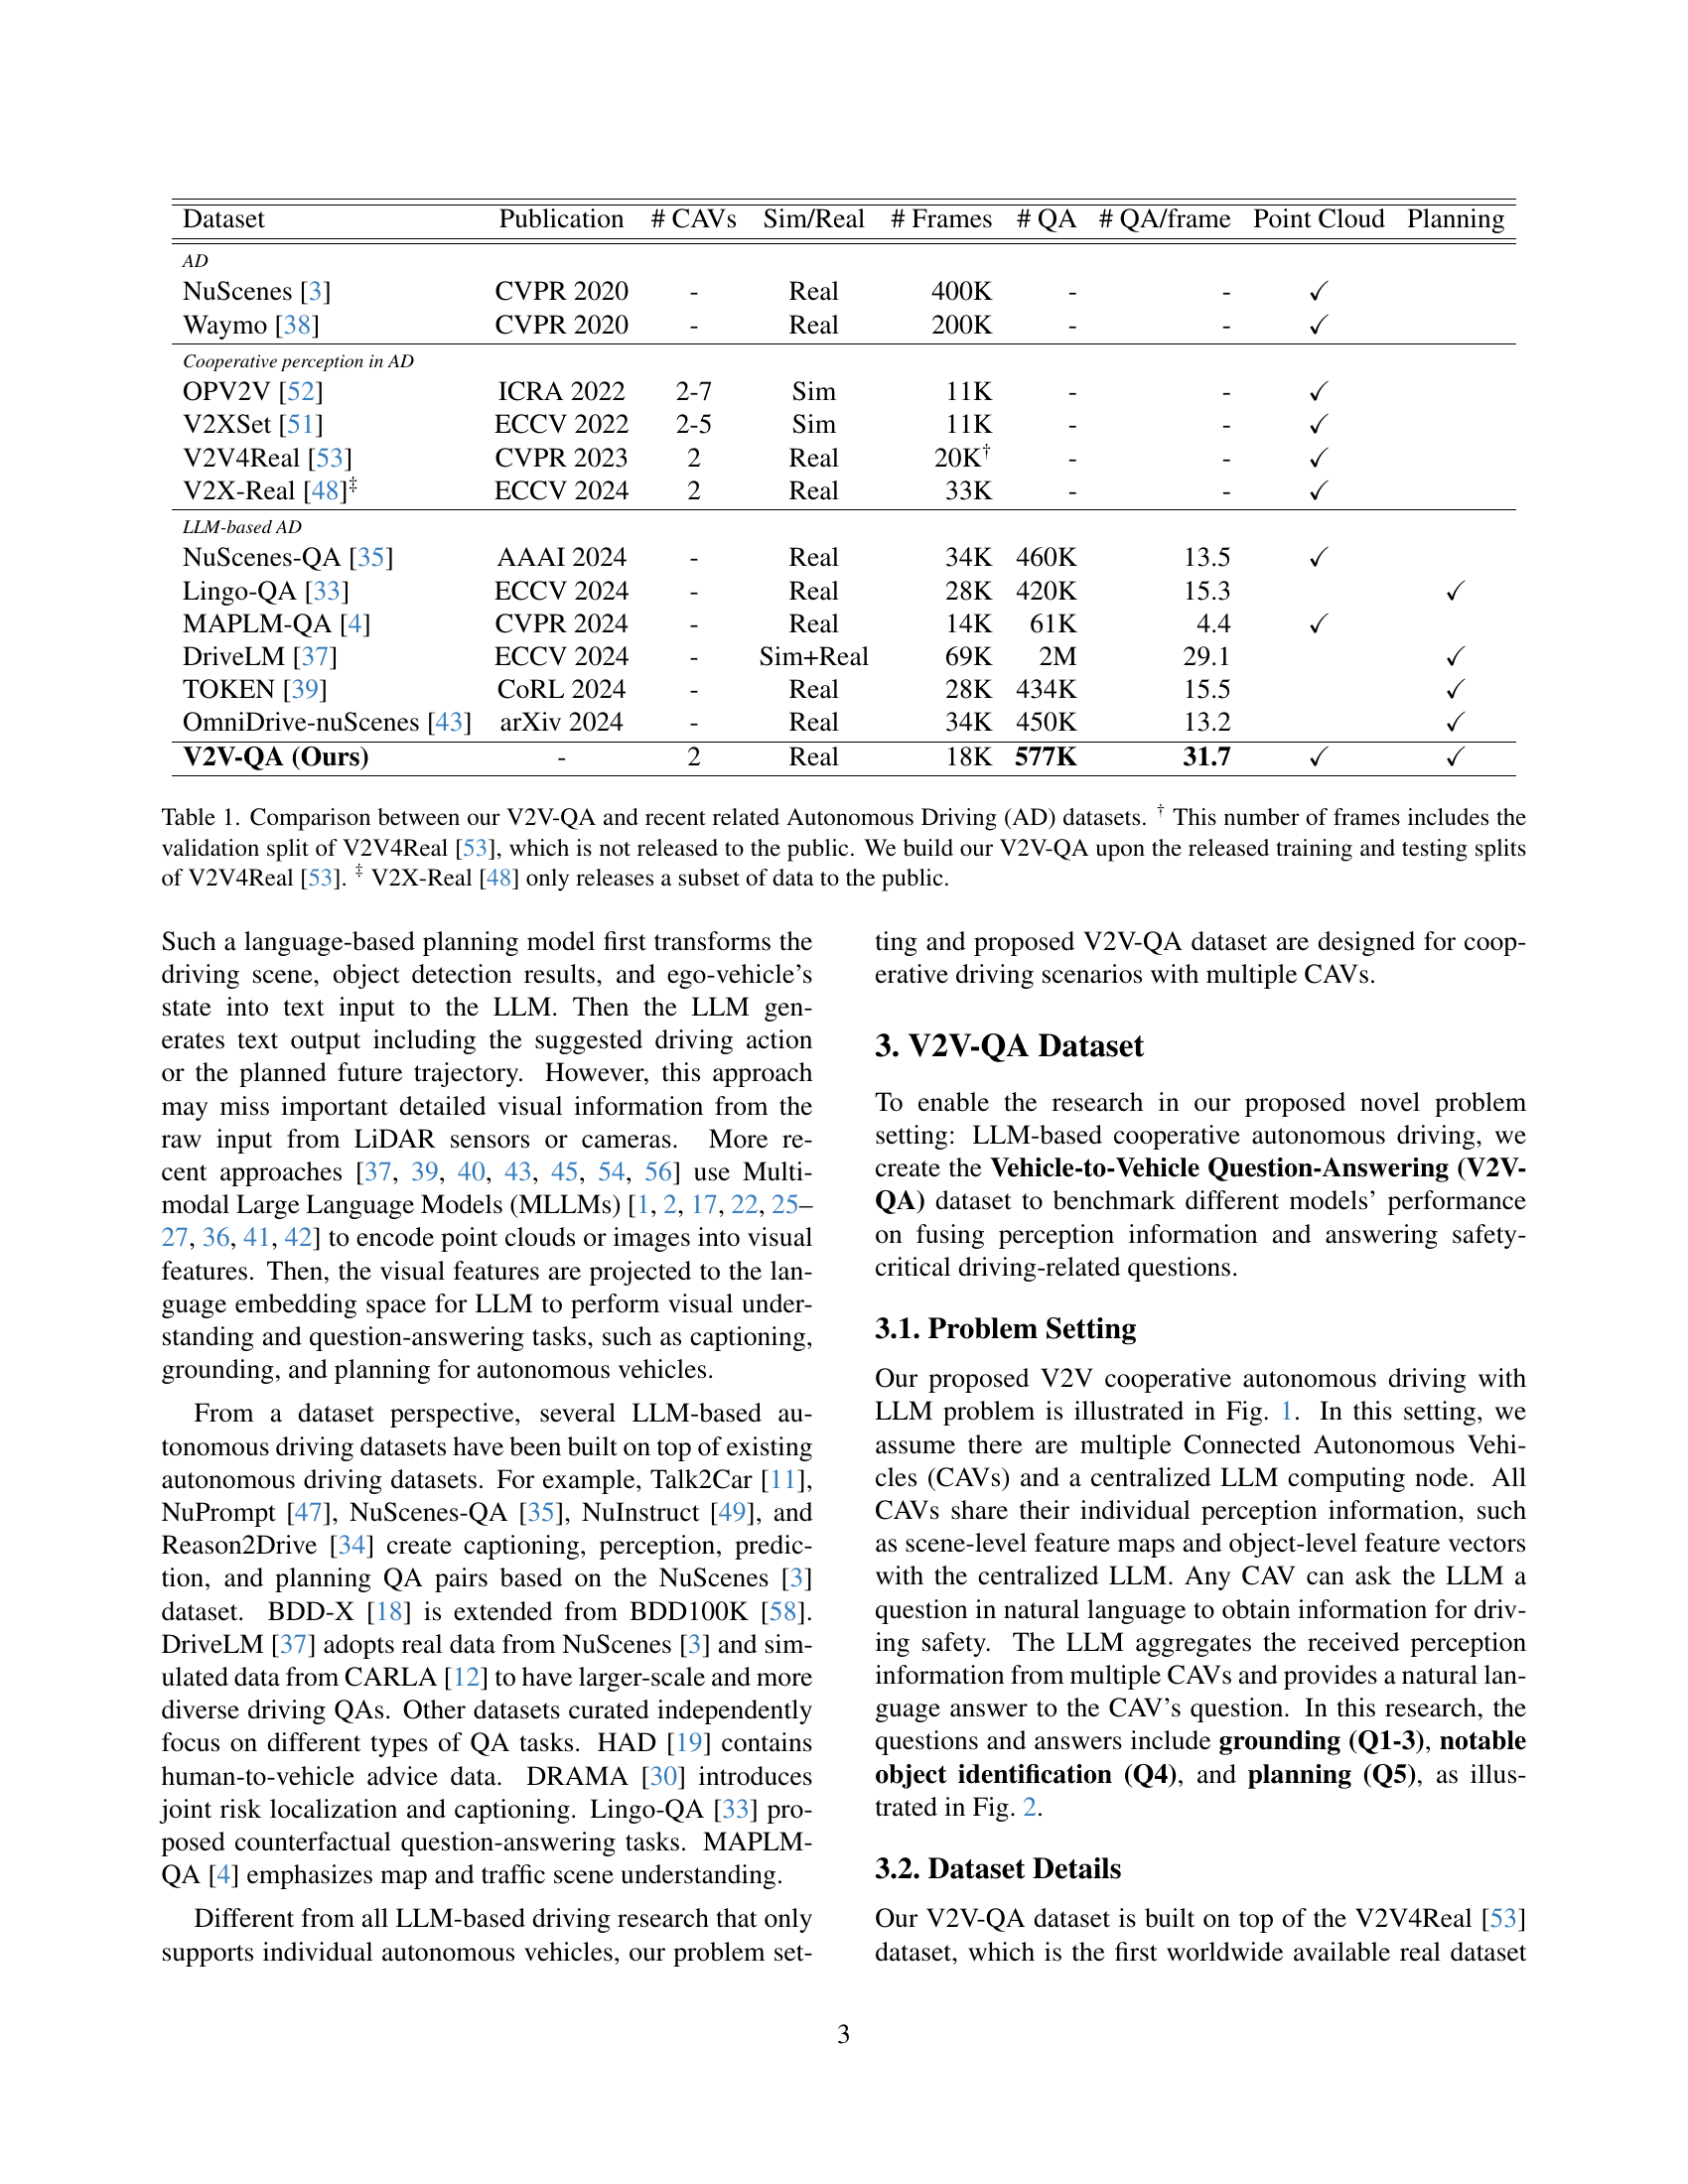
🔼 Table 1 compares the V2V-QA dataset with other relevant autonomous driving datasets. It details key characteristics including the number of autonomous vehicles involved in data collection (CAVs), whether the data is simulated or from real-world driving scenarios (Sim/Real), the total number of frames, the number of question-answer pairs, the number of questions per frame, whether point cloud data is included, and whether planning information is provided. Note that the frame count for V2V4Real includes the validation set which is not publicly available and that V2X-Real only made a subset of its data public.
read the caption
Table 1: Comparison between our V2V-QA and recent related Autonomous Driving (AD) datasets. † This number of frames includes the validation split of V2V4Real [53], which is not released to the public. We build our V2V-QA upon the released training and testing splits of V2V4Real [53]. ‡ V2X-Real [48] only releases a subset of data to the public.
In-depth insights#
V2V-LLM Overview#
A hypothetical ‘V2V-LLM Overview’ section would delve into the architecture and functionality of the Vehicle-to-Vehicle Large Language Model (V2V-LLM). It would likely begin by explaining how the system leverages multi-modal inputs, combining data from various sensors (LiDAR, cameras) of multiple autonomous vehicles (CAVs). The core of the overview would describe the LLM’s role in fusing this data, highlighting its ability to integrate diverse perception streams and answer driving-related questions. Key features, such as its capacity for grounding, object identification, and planning, would be elaborated upon, showcasing the system’s decision-making capabilities within a cooperative environment. Finally, a discussion of the advantages of V2V-LLM over traditional methods—like improved safety and reliability due to the fusion of multiple perspectives—would conclude this section. It would emphasize the novelty of using an LLM for cooperative driving and underscore the potential for increased safety and efficiency in autonomous vehicle systems.
Cooperative Perception#
Cooperative perception in autonomous driving leverages the combined sensor data from multiple vehicles to achieve a more robust and complete understanding of the environment than relying on individual vehicle sensors alone. This is particularly crucial in scenarios with sensor occlusion or malfunction, where individual vehicles may fail to detect important objects or events. Communication protocols are key to enabling cooperative perception, with vehicles sharing sensor data, typically using V2V (vehicle-to-vehicle) communication. Data fusion techniques then integrate this diverse information, addressing challenges like differing sensor modalities, varying data rates, and potential inconsistencies across sources. The resulting enhanced perception improves the accuracy and reliability of object detection, tracking, and scene understanding. This enhanced situational awareness directly benefits the downstream tasks of planning and decision-making, leading to safer and more efficient autonomous driving. Future research directions include exploring more efficient communication strategies, developing robust fusion algorithms adaptable to diverse data quality and types, and investigating the security and privacy implications of sharing data between autonomous vehicles.
V2V-QA Dataset#
The V2V-QA dataset represents a significant contribution to the field of cooperative autonomous driving. Its novelty lies in the integration of a large language model (LLM) within a cooperative perception framework, addressing a gap in existing datasets that primarily focus on perception tasks. By creating question-answer pairs around grounding, notable object identification, and planning scenarios, V2V-QA provides a comprehensive benchmark for evaluating LLM-based cooperative driving systems. The dataset’s utilization of real-world data from V2V4Real enhances its practical relevance and allows for more realistic testing. The diversity of question types is also crucial, as it compels models to demonstrate understanding of context, spatial reasoning, and predictive capabilities crucial for safe and robust autonomous systems. The careful design of V2V-QA thus makes it a powerful tool for advancing research in this rapidly evolving area.
LLM Fusion Method#
The concept of an “LLM Fusion Method” in the context of vehicle-to-vehicle (V2V) cooperative autonomous driving is a novel and powerful approach. It leverages the strengths of Large Language Models (LLMs) to integrate and reason over multi-modal data from multiple vehicles. Unlike traditional fusion techniques that primarily focus on low-level feature concatenation or aggregation, the LLM acts as a high-level reasoning engine. This allows the system to go beyond simple sensor fusion, incorporating contextual understanding, common-sense reasoning, and even uncertainty management into the decision-making process. The LLM’s ability to handle diverse data types (e.g., raw sensor readings, object detections, and even natural language descriptions) is crucial for robust and safe cooperative driving, particularly in scenarios with sensor occlusions or malfunctions. The key is the LLM’s capacity to learn complex relationships and patterns from vast amounts of training data, enabling it to synthesize information from various sources effectively. This approach potentially leads to improved safety and efficiency compared to methods relying solely on low-level data fusion strategies. However, challenges associated with LLM’s computational cost and explainability must be carefully addressed. Moreover, data requirements for effective training are significant, demanding substantial and diverse V2V datasets. Further research on efficient LLM architectures and training methods tailored for autonomous driving is essential for practical implementation.
Future Work#
Future research directions stemming from this V2V-LLM model could explore several promising avenues. Expanding the dataset to encompass more diverse driving scenarios and a wider range of cooperative driving tasks would significantly enhance the model’s robustness and generalizability. Incorporating HD map data into the model’s input could significantly improve the accuracy and safety of the generated trajectories, especially in complex intersections and challenging road conditions. Investigating alternative LLM architectures better suited for multi-modal fusion and real-time processing within the context of autonomous driving is also essential for optimizing performance. Finally, a detailed analysis of the model’s limitations and failure cases, as identified in the qualitative evaluation, should inform the development of strategies for error mitigation and enhanced safety protocols. The integration of explainable AI techniques could provide valuable insights into the model’s decision-making process, improving trust and facilitating broader adoption.
More visual insights#
More on figures

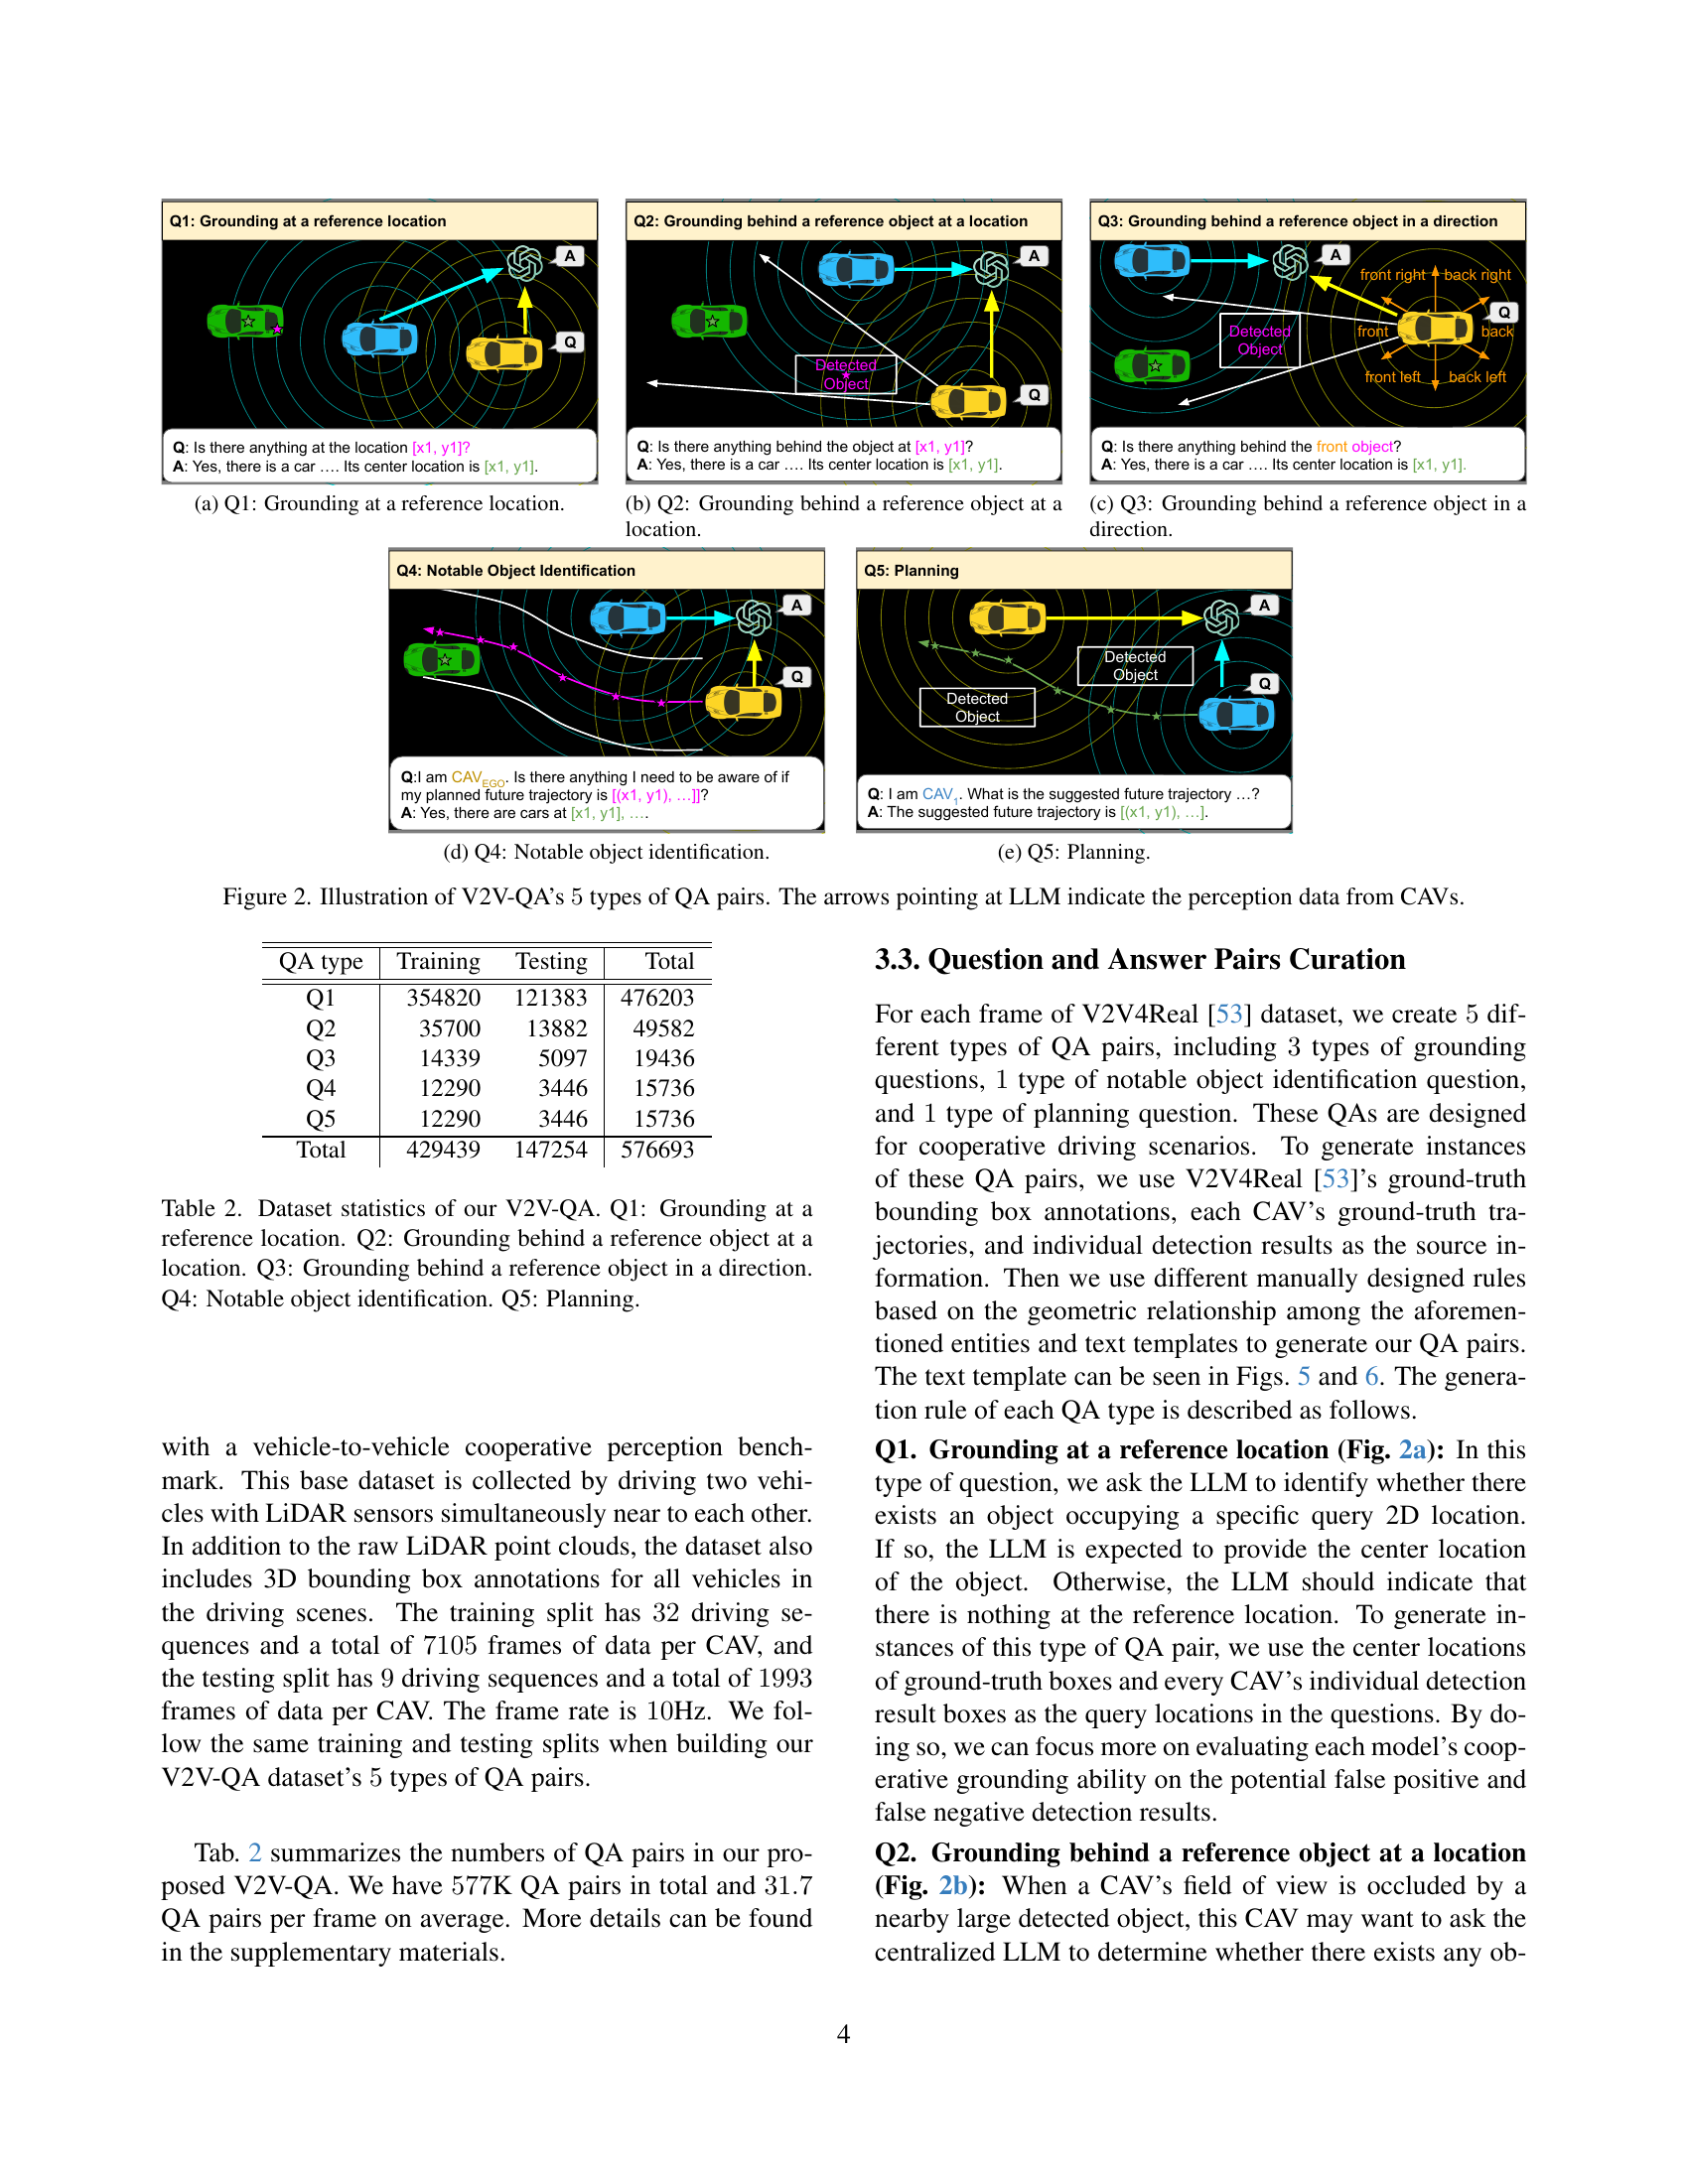
🔼 This figure shows an example of a question-answer pair in the V2V-QA dataset for the task of grounding at a reference location. The question asks if there is anything at a specific location (x1, y1). The answer confirms the presence of a car and provides its center location. This task assesses the model’s ability to identify objects at specified coordinates, which is crucial for safe and reliable autonomous driving.
read the caption
(a) Q1: Grounding at a reference location.

🔼 This figure demonstrates a question-answering pair related to grounding in a cooperative autonomous driving scenario. The question asks whether any objects are present behind a specific reference object located at a particular location. The image visually depicts the scene, highlighting the reference object and the objects located behind it. This illustrates how the system uses multi-modal input from multiple vehicles to answer complex queries involving spatial reasoning and object occlusion.
read the caption
(b) Q2: Grounding behind a reference object at a location.

🔼 This figure demonstrates a type of question-answer pair from the V2V-QA dataset. The question asks if there is anything behind a reference object in a specific direction. The figure shows a visual representation of the scene, including the reference object, a car behind it in the specified direction, and the predicted location based on the question. This illustrates the challenge of grounding questions in cooperative autonomous driving, where the visibility of objects for each vehicle might be limited, and relying on information from multiple vehicles is crucial.
read the caption
(c) Q3: Grounding behind a reference object in a direction.

🔼 This figure shows an example of the ‘Notable Object Identification’ question-answer pair in the V2V-QA dataset. The question asks whether there are any notable objects that the autonomous vehicle needs to be aware of near its planned trajectory. The answer from the LLM includes the location of nearby objects of interest, providing context to inform the vehicle’s planning system. This example demonstrates the use of multi-modal information from multiple connected autonomous vehicles (CAVs) to inform safe and efficient driving decisions.
read the caption
(d) Q4: Notable object identification.

🔼 This figure shows an example of a planning question-answer pair in the V2V-QA dataset. An autonomous vehicle (CAV) asks the central LLM: ‘I am CAV. What is the suggested future trajectory…?’. The LLM considers the fused perception information from multiple CAVs and generates an answer showing a suggested trajectory to avoid collisions.
read the caption
(e) Q5: Planning.

🔼 This figure illustrates the five question-answering (QA) pair types included in the V2V-QA dataset. These QAs are designed for cooperative driving scenarios. The five types are: (a) Grounding at a reference location: Asks whether an object exists at a specified location. (b) Grounding behind a reference object at a location: Asks whether an object is behind another object at a specific location. (c) Grounding behind a reference object in a direction: Asks whether an object exists in a specified direction behind a reference object. (d) Notable object identification: Asks to identify notable objects near planned future trajectories. (e) Planning: Asks for suggested future trajectories to avoid collisions. The arrows pointing toward the LLM in the diagram highlight that all connected autonomous vehicles (CAVs) share perception data with the LLM, enabling cooperative responses.
read the caption
Figure 2: Illustration of V2V-QA’s 5555 types of QA pairs. The arrows pointing at LLM indicate the perception data from CAVs.

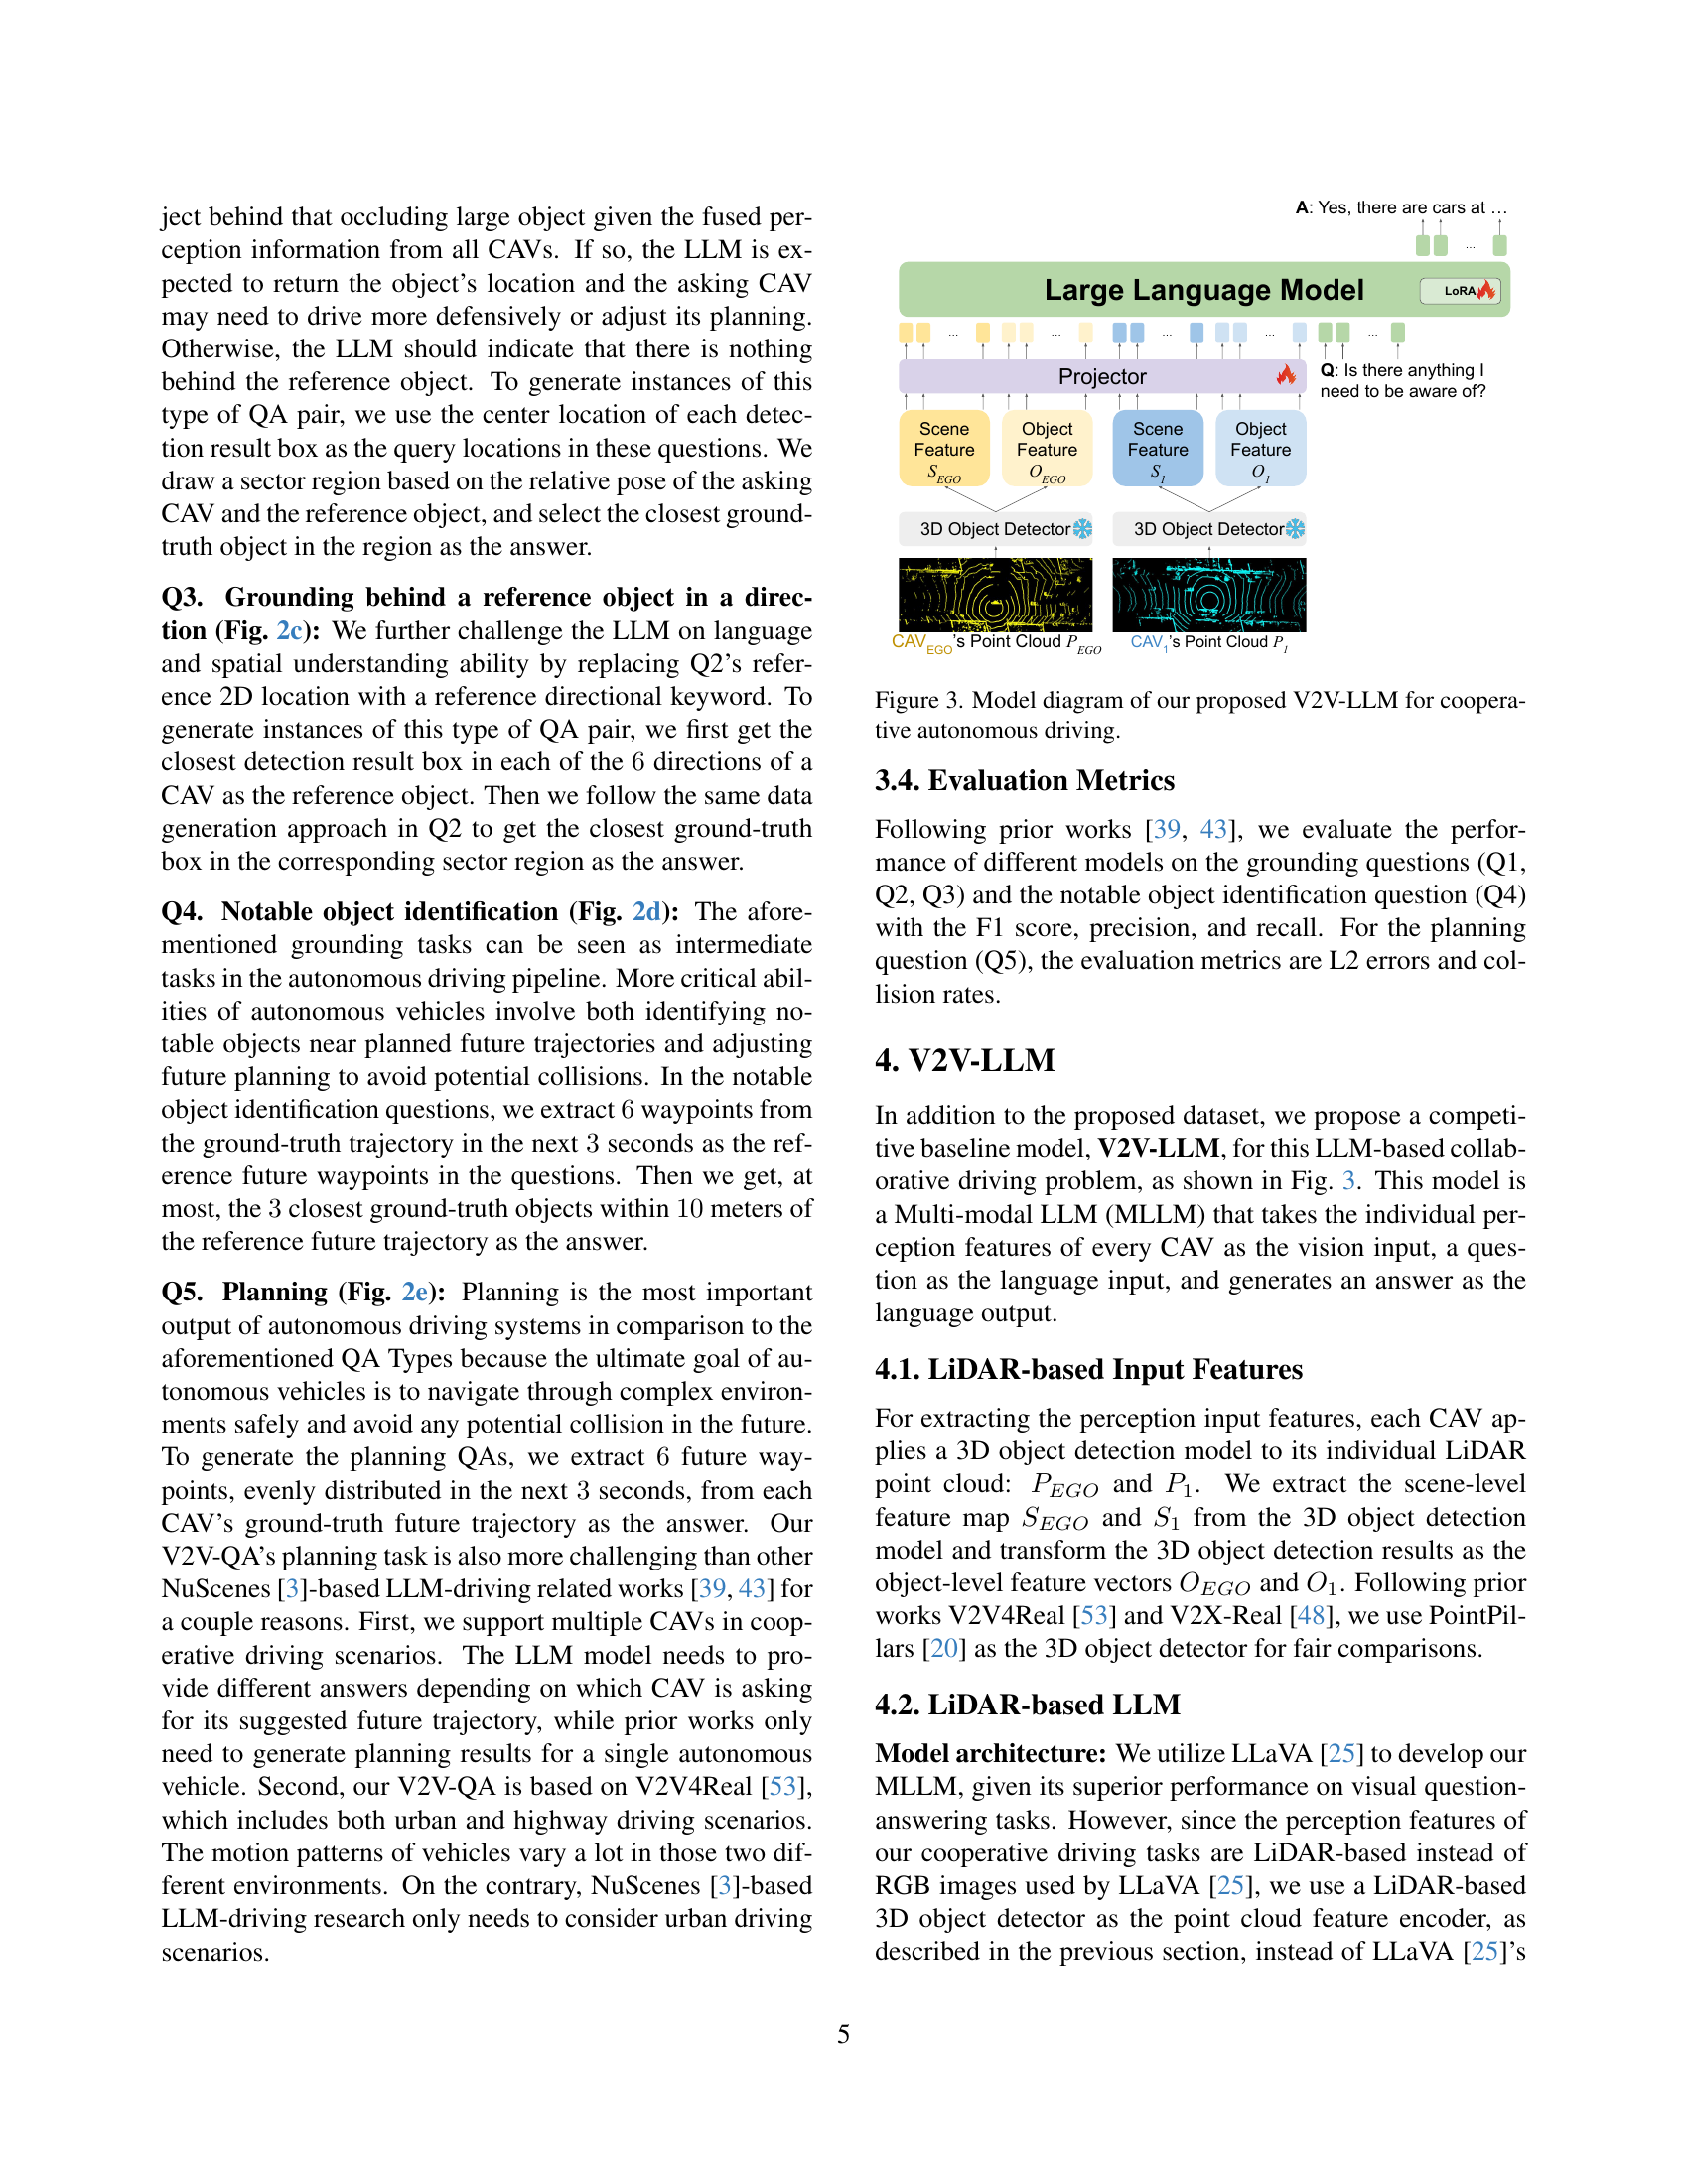
🔼 The figure illustrates the architecture of the Vehicle-to-Vehicle Large Language Model (V2V-LLM) for cooperative autonomous driving. It shows multiple connected autonomous vehicles (CAVs) each independently extracting scene-level feature maps and object-level feature vectors from their LiDAR point cloud data using a 3D object detector. This information is then sent to a central Large Language Model (LLM). The LLM fuses the perception data from all CAVs and answers driving-related questions (provided as language input) using a projector network to align the visual and language embeddings. The final output is a natural language answer.
read the caption
Figure 3: Model diagram of our proposed V2V-LLM for cooperative autonomous driving.

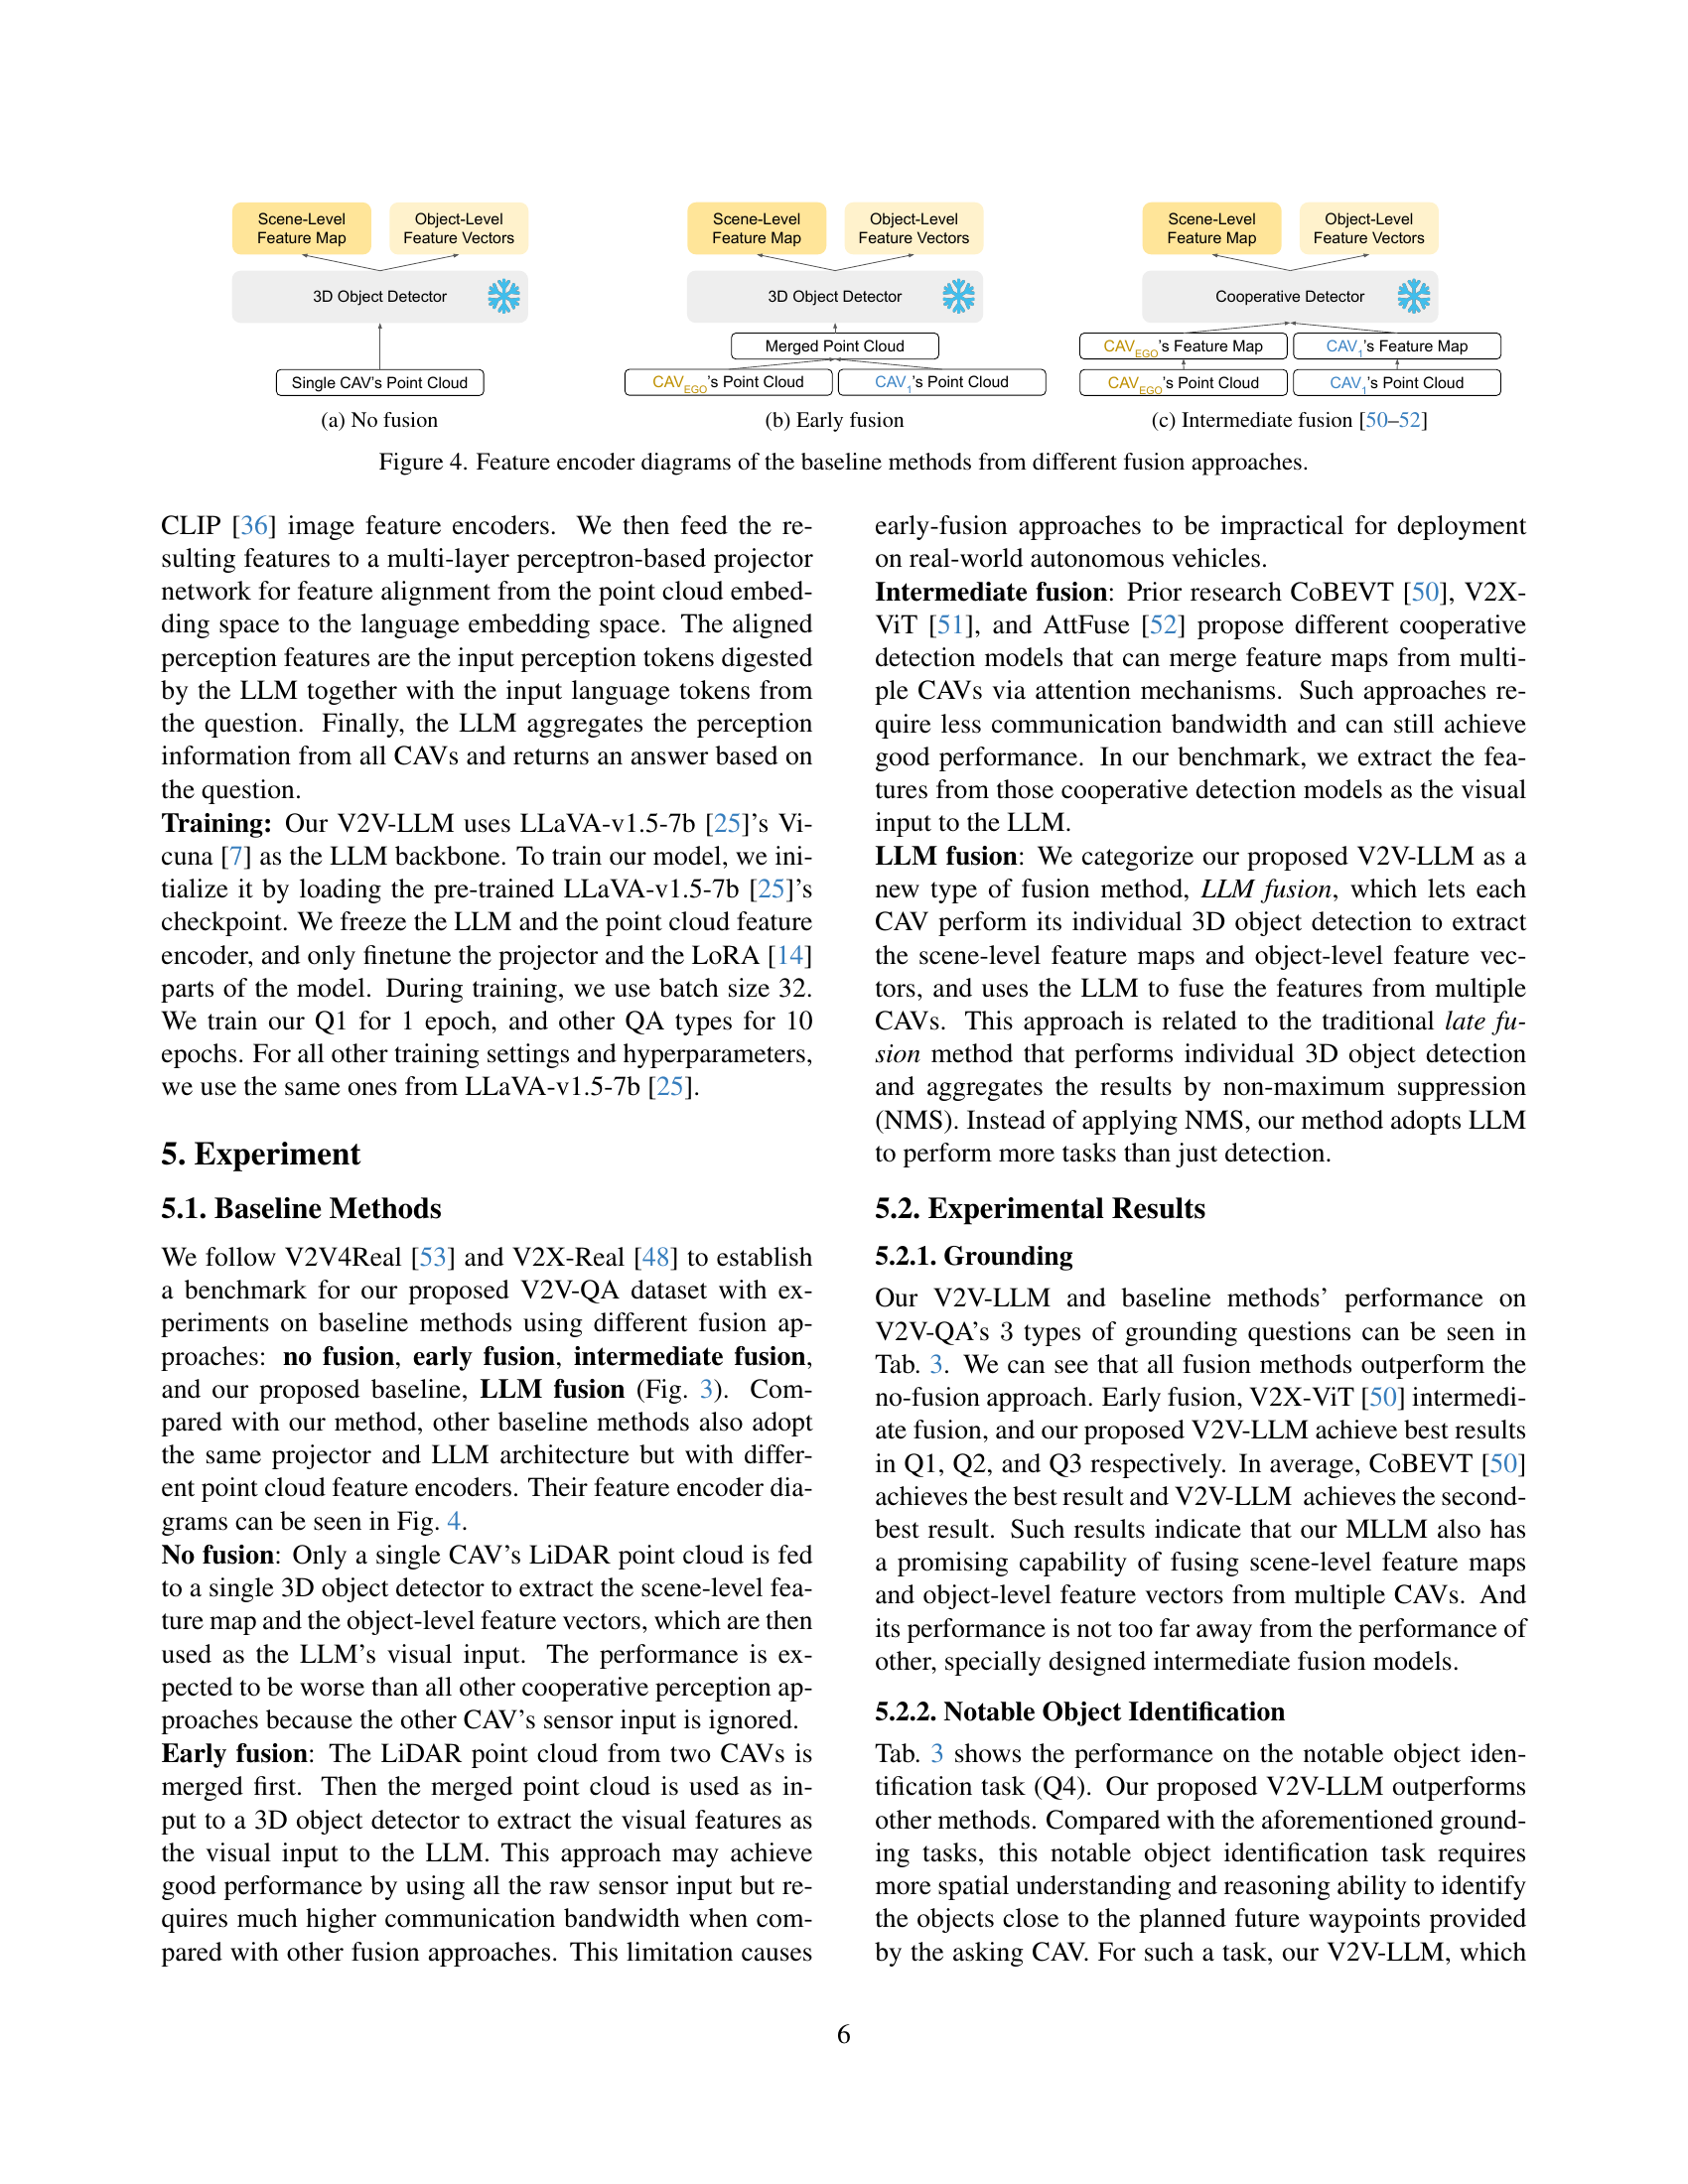
🔼 This figure shows the architecture of the baseline method with no fusion. In this approach, only a single CAV’s LiDAR point cloud is fed to a 3D object detector to extract scene-level feature maps and object-level feature vectors. These are then directly used as the input to the LLM. This method is expected to perform poorly compared to those using multi-CAV data because it ignores the sensor inputs from other CAVs.
read the caption
(a) No fusion

🔼 This figure shows the early fusion method used as a baseline in the paper. In early fusion, LiDAR point clouds from two CAVs (Connected Autonomous Vehicles) are merged before being processed by a 3D object detector. The resulting scene-level feature map and object-level feature vectors are then used as the visual input for the LLM (Large Language Model). This approach aims to leverage all sensor data but may be less efficient for large-scale deployments due to the high communication bandwidth required.
read the caption
(b) Early fusion

🔼 This figure shows the intermediate fusion approach used as a baseline method in the paper. It depicts how feature maps from multiple connected autonomous vehicles (CAVs) are merged. Unlike early fusion which merges raw LiDAR data from all CAVs before feature extraction, intermediate fusion first extracts scene-level feature maps and object-level feature vectors from each CAV individually. Then, these features are combined using techniques like attention mechanisms (as seen in works cited [50, 51, 52]) to produce a unified representation for the LLM. This approach offers a balance between the computational cost of early fusion and the potential loss of information inherent in no fusion.
read the caption
(c) Intermediate fusion [50, 51, 52]

🔼 This figure illustrates the different feature extraction methods used in the baseline models for cooperative autonomous driving. It compares three approaches: no fusion, early fusion, and intermediate fusion. The ’no fusion’ approach processes each vehicle’s LiDAR data independently, using a separate 3D object detector for each. The ’early fusion’ approach merges the LiDAR point clouds from all vehicles before processing them with a single 3D object detector. The ‘intermediate fusion’ approach uses a cooperative detector (like those explored in prior works) to process the data from each vehicle before passing features to the LLM. Each approach highlights a different way of combining data from multiple vehicles, demonstrating varying levels of computation and communication complexity.
read the caption
Figure 4: Feature encoder diagrams of the baseline methods from different fusion approaches.

🔼 This figure visualizes the performance of the V2V-LLM model on the grounding subtask of the V2V-QA dataset. Grounding involves identifying objects at specific locations. Each row represents a different sample from the testing set. Magenta circles indicate the location specified in the question (query location). Yellow crosses show the location predicted by the V2V-LLM model. Green circles indicate the ground truth location of the relevant object. The figure demonstrates the model’s ability to accurately locate objects based on textual queries, highlighting instances where predictions align well with ground truth, while showing potential limitations of the model where the prediction is less accurate.
read the caption
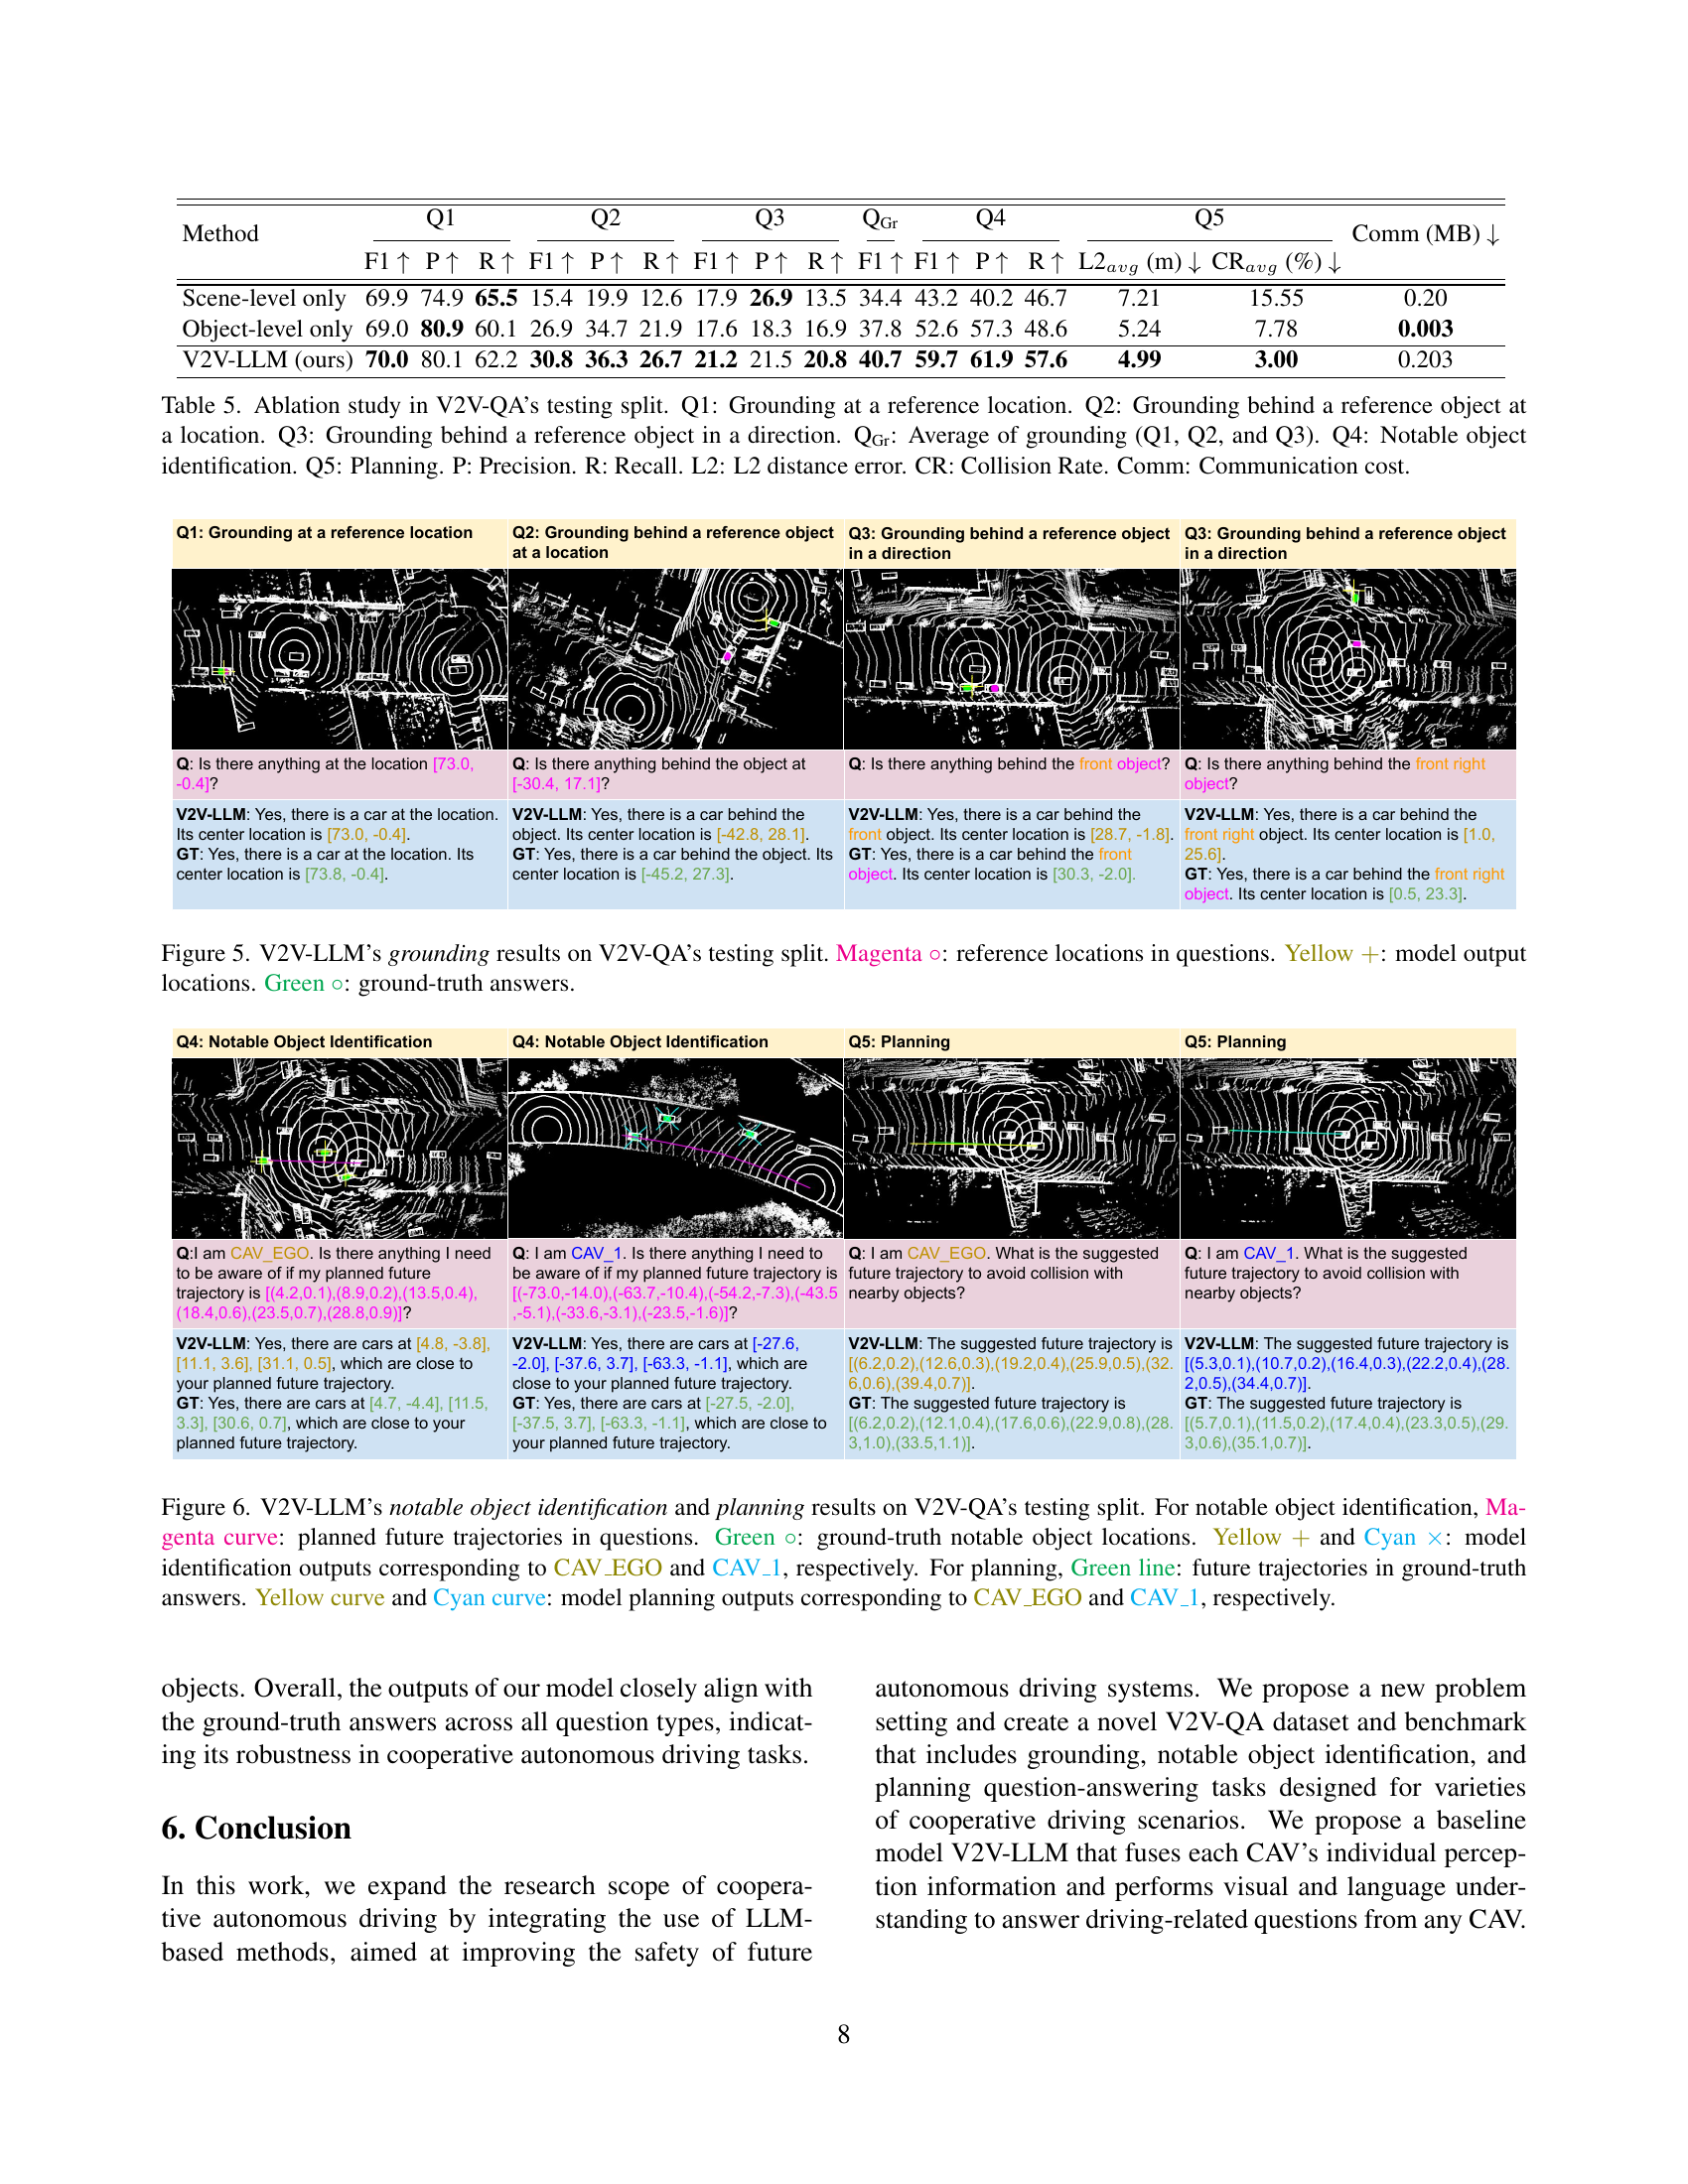
Figure 5: V2V-LLM’s grounding results on V2V-QA’s testing split. Magenta ∘\circ∘: reference locations in questions. Yellow +++: model output locations. Green ∘\circ∘: ground-truth answers.

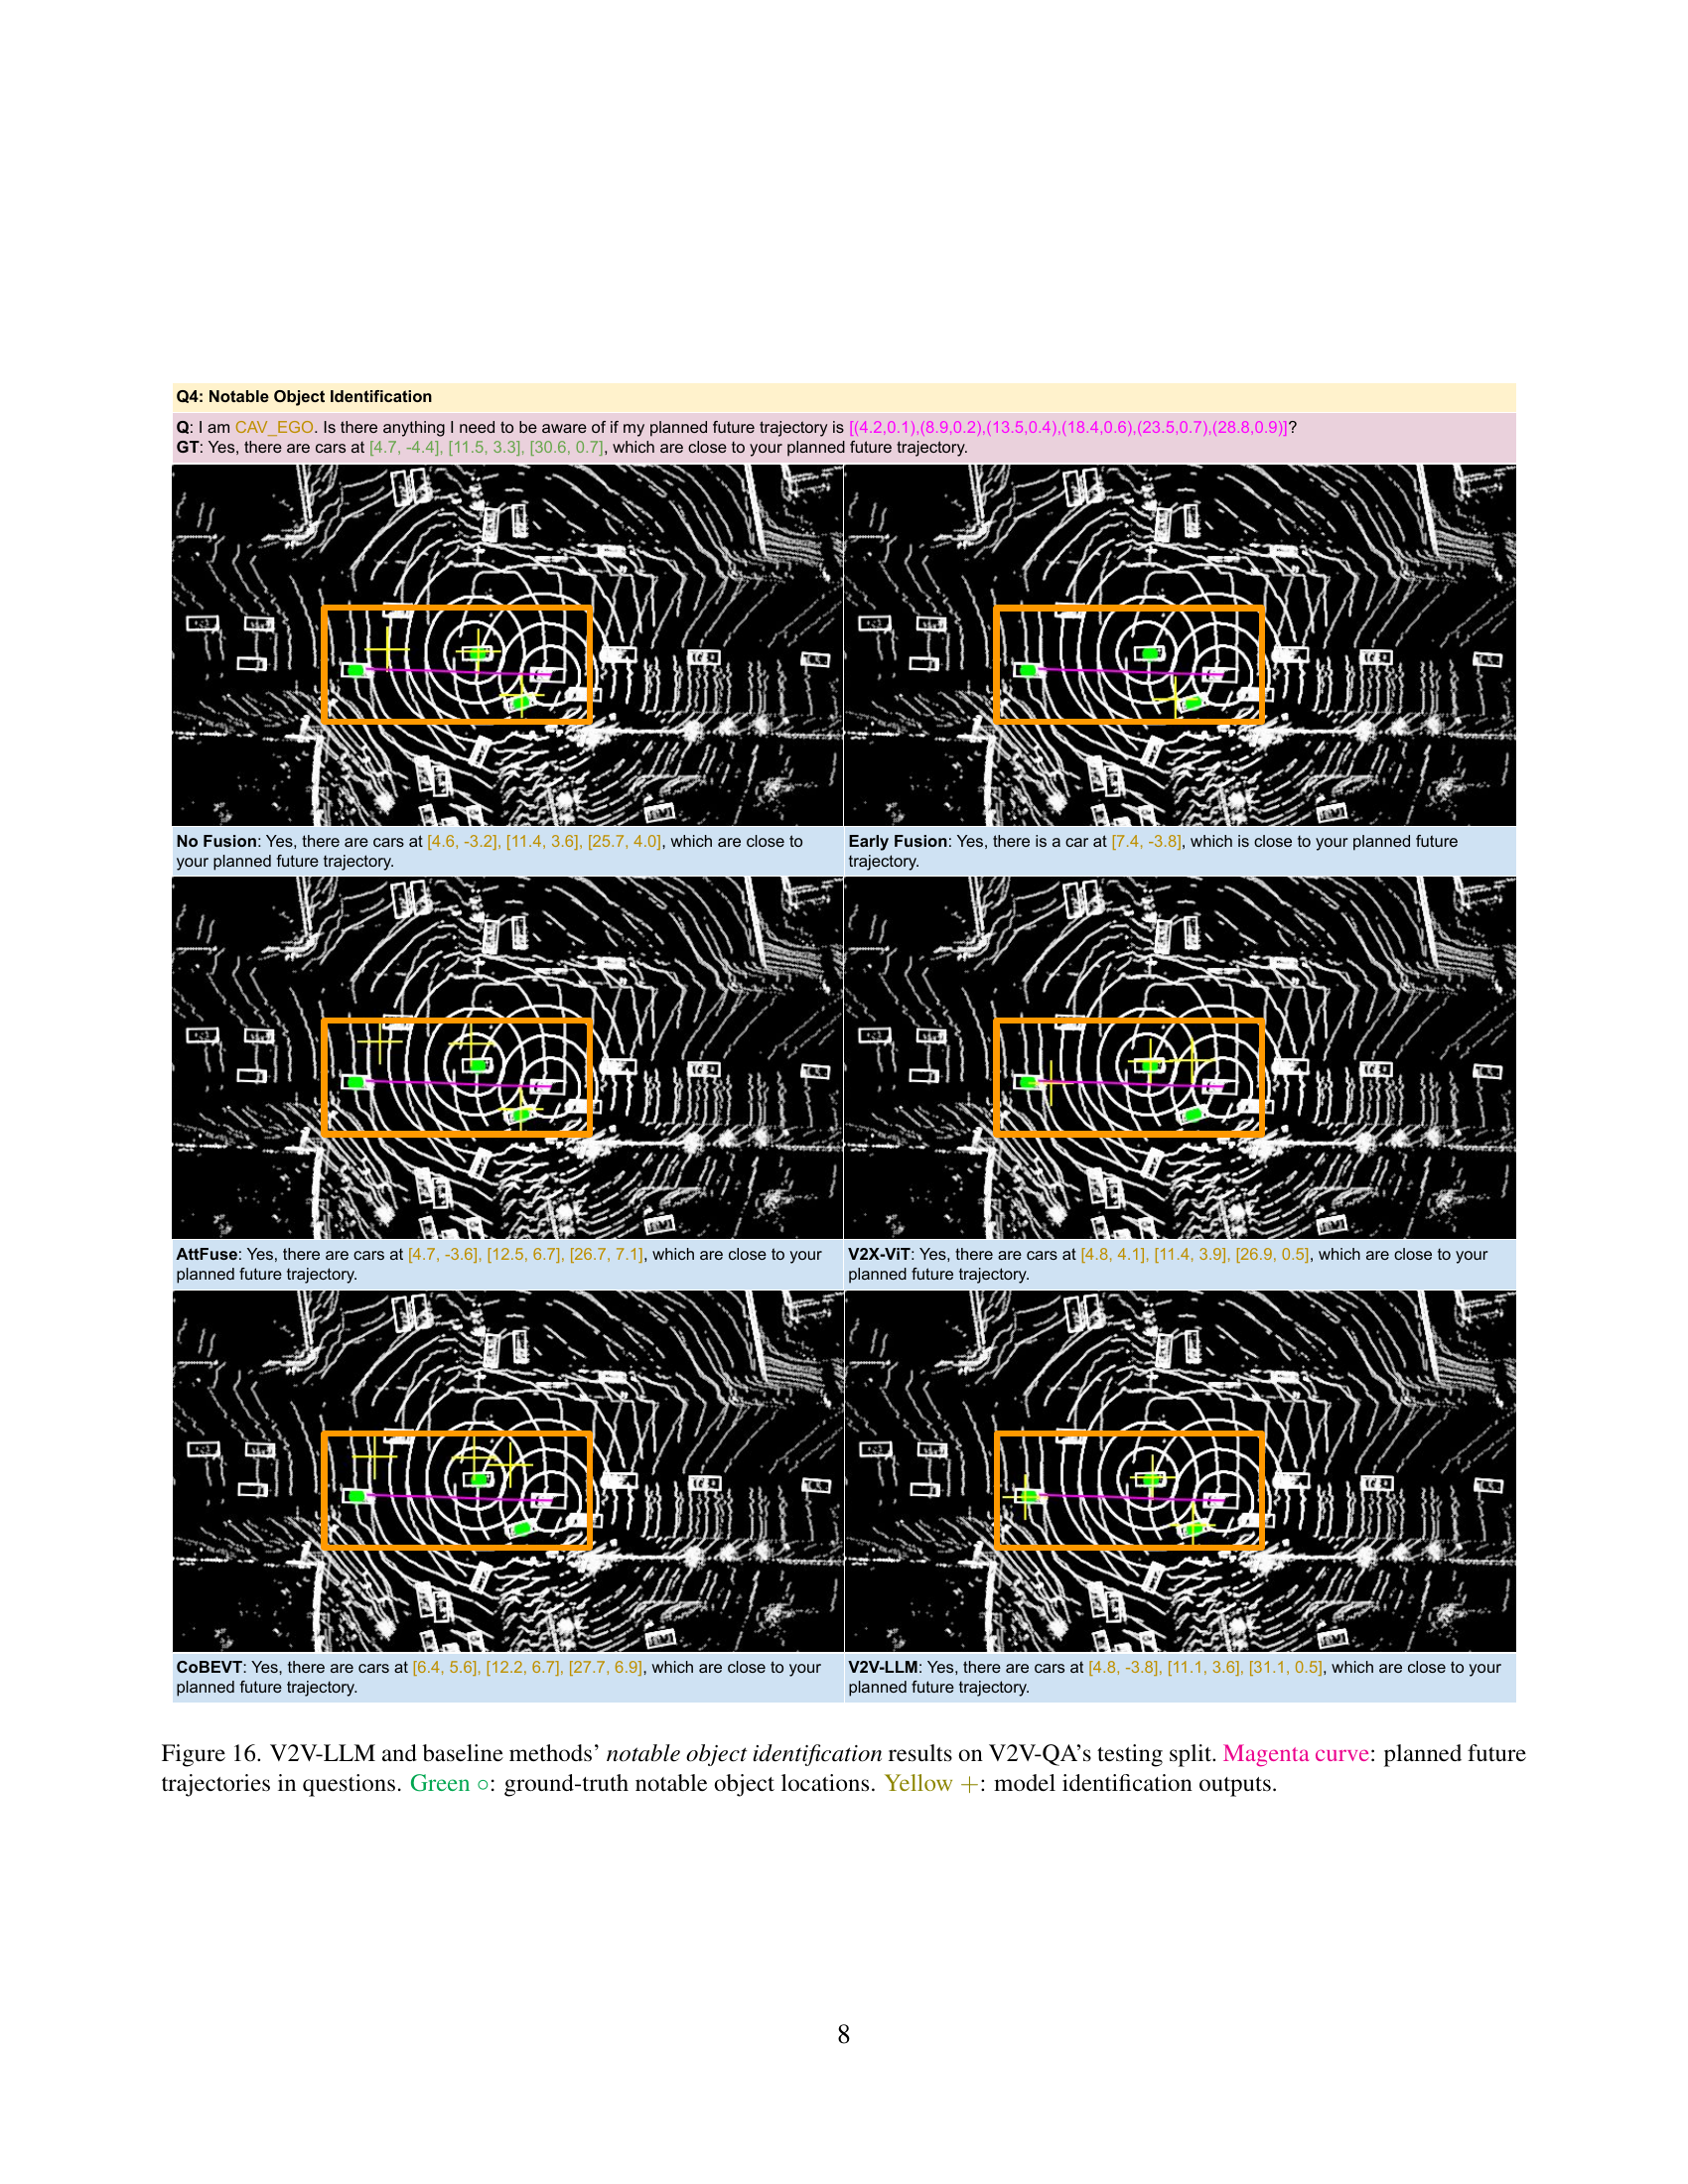
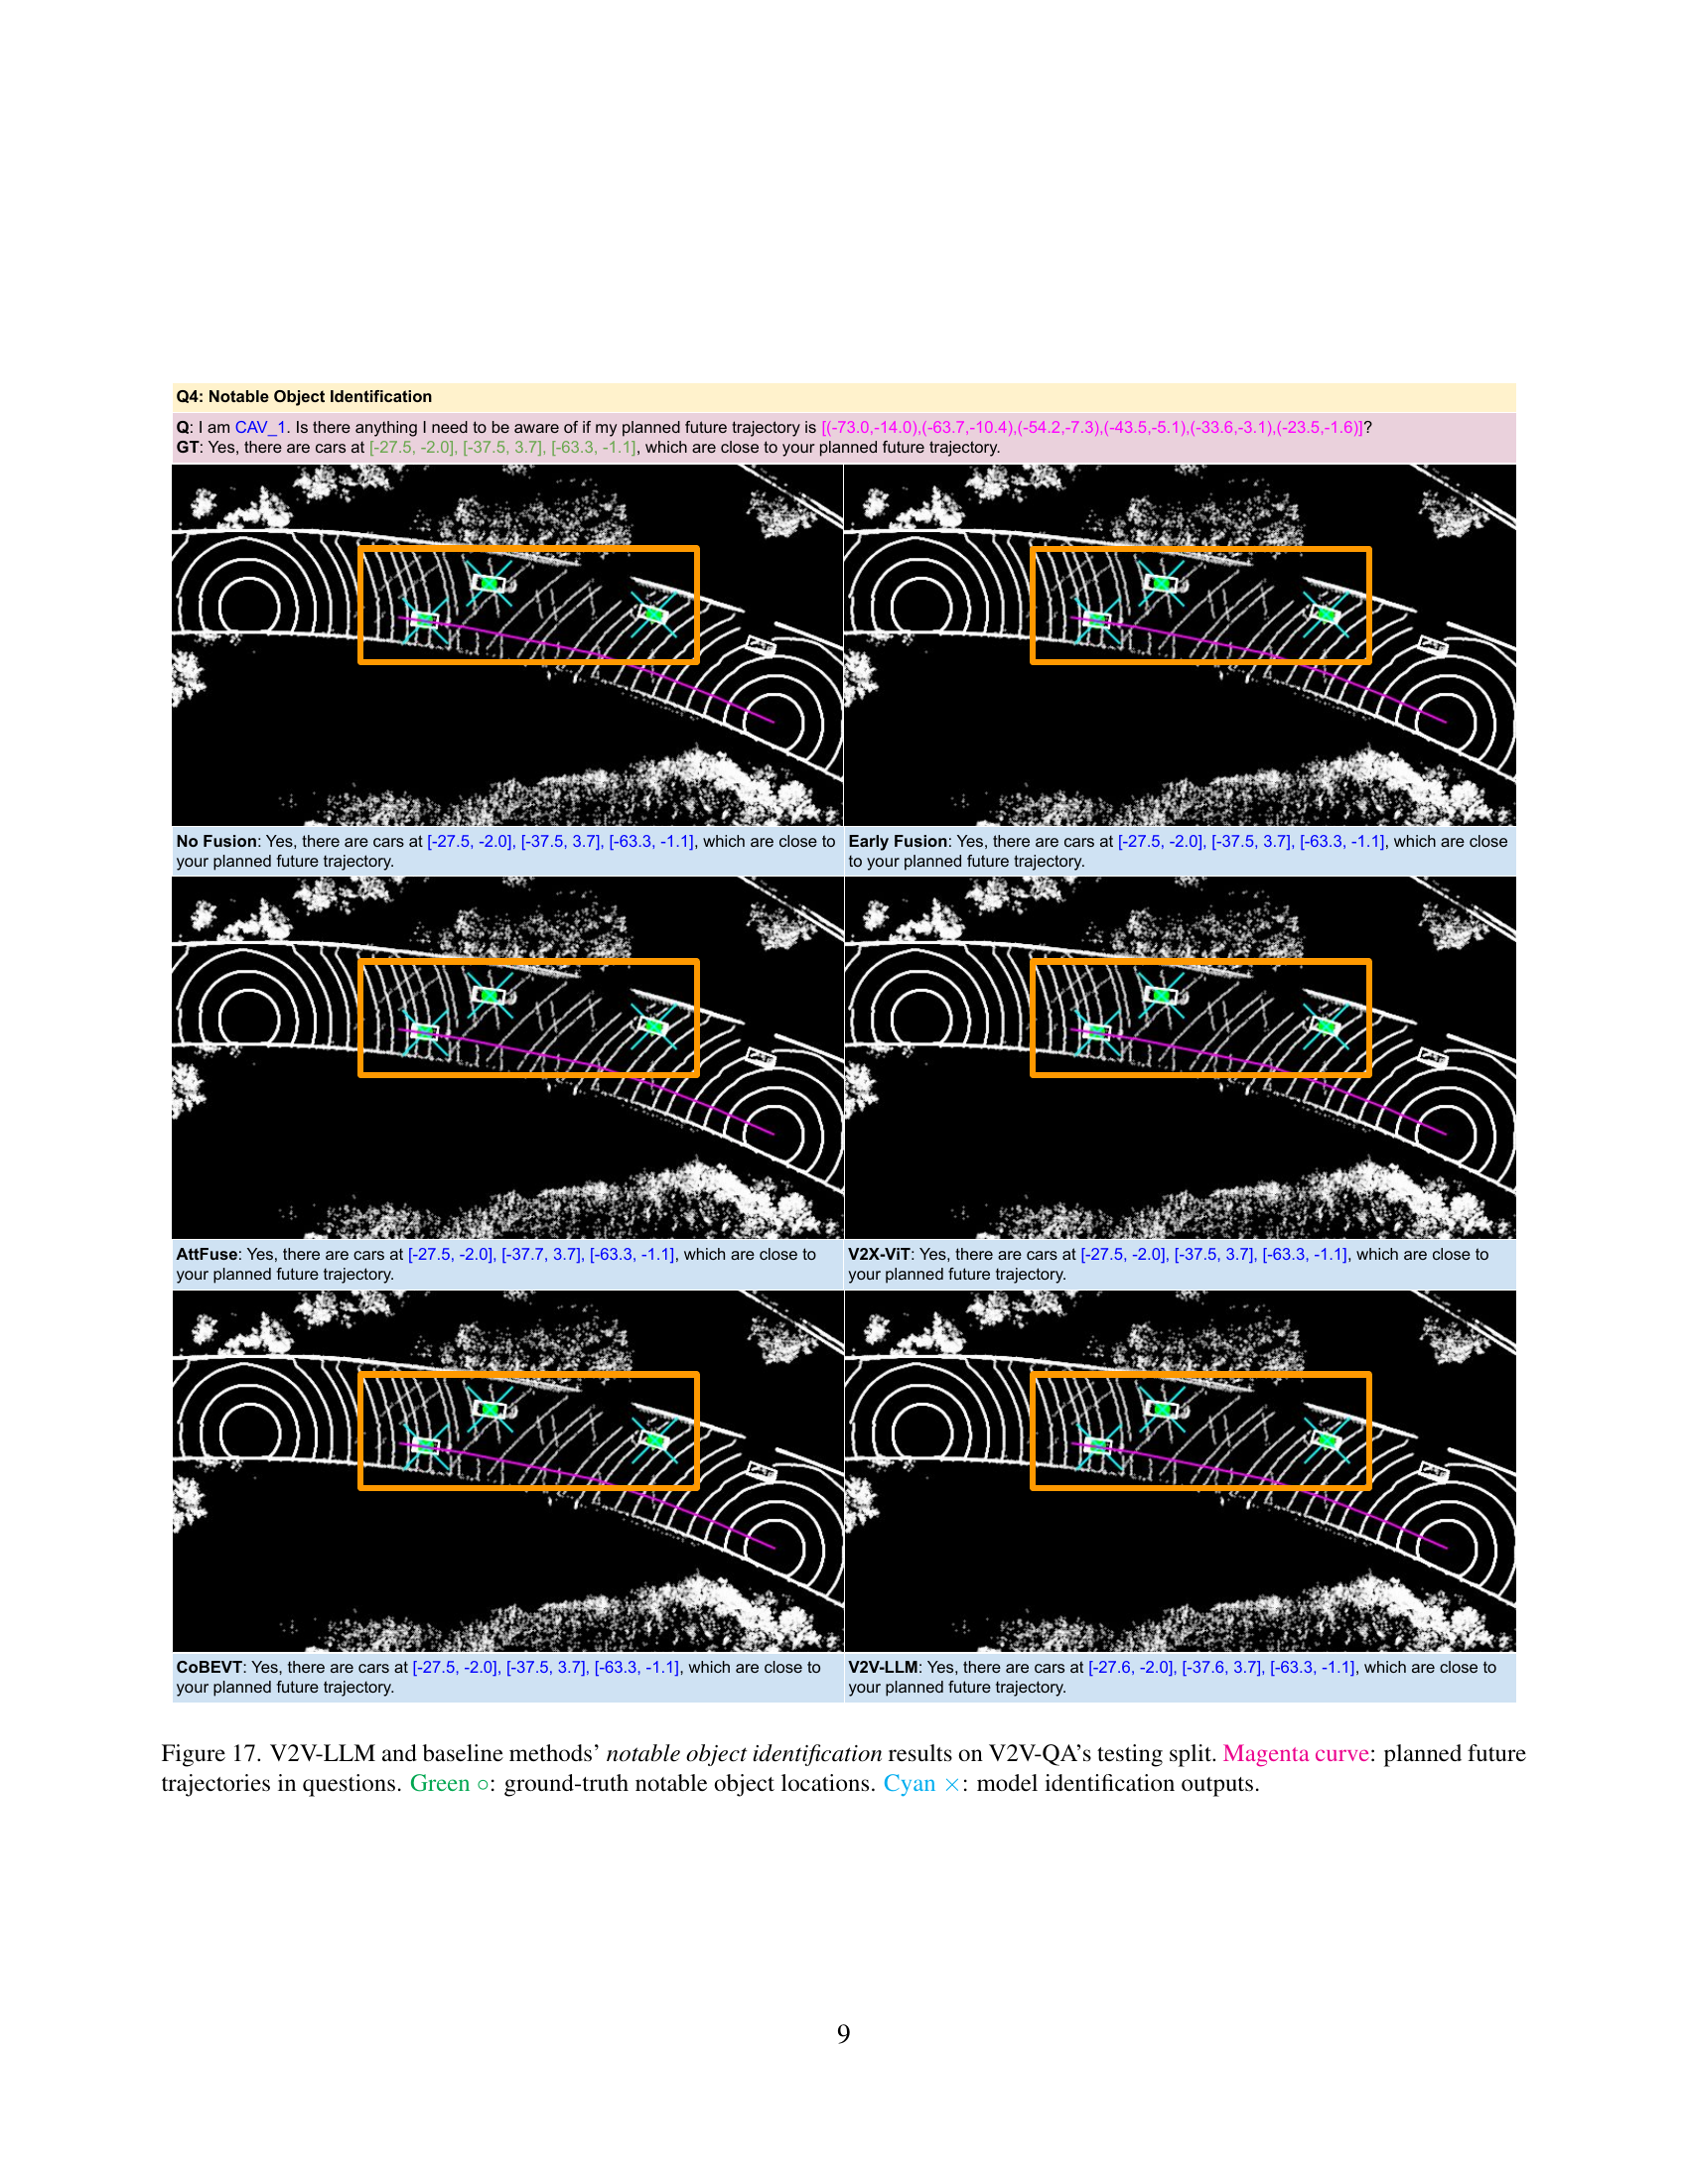
🔼 Figure 6 presents a qualitative analysis of the V2V-LLM model’s performance on notable object identification and trajectory planning tasks within the V2V-QA testing dataset. The top half illustrates the notable object identification results. Magenta curves represent the planned future trajectories from the questions. Green circles denote the ground truth locations of notable objects. Yellow and cyan markings indicate the identified objects by V2V-LLM, distinguishing between the ego vehicle (CAV_EGO) and another vehicle (CAV_1). The bottom half showcases planning results. Green lines depict ground truth future trajectories, while yellow and cyan curves show trajectories generated by V2V-LLM for CAV_EGO and CAV_1, respectively.
read the caption
Figure 6: V2V-LLM’s notable object identification and planning results on V2V-QA’s testing split. For notable object identification, Magenta curve: planned future trajectories in questions. Green ∘\circ∘: ground-truth notable object locations. Yellow +++ and Cyan ×\times×: model identification outputs corresponding to CAV_EGO and CAV_1, respectively. For planning, Green line: future trajectories in ground-truth answers. Yellow curve and Cyan curve: model planning outputs corresponding to CAV_EGO and CAV_1, respectively.

🔼 This figure shows the distribution of ground-truth answer locations relative to the CAV (Connected Autonomous Vehicle) in V2V-QA’s Q1, which is the grounding task at a reference location. The figure consists of four subplots: (a) shows the distribution of x-coordinates (meters), (b) shows the distribution of y-coordinates (meters), (c) shows the distribution of distances (meters) between the ground-truth answers and the CAV, and (d) shows the distribution of angles (degrees) between the ground-truth answers and the CAV. The x-axis represents the coordinates and the distance, while the y-axis represents the probability density. The plots illustrate the spatial distribution of objects relevant to the grounding questions within the context of the autonomous driving scenario.
read the caption
(a) x (meters)

🔼 This figure shows the distribution of ground-truth answer locations’ y-coordinate relative to the CAV in V2V-QA’s Q2, which is the question type of grounding behind a reference object at a location. The y-axis represents the probability density, and the x-axis represents the y-coordinate in meters. The distribution is shown in a histogram with different color representing different ranges of distances. The figure helps to understand the spatial distribution of the answers relative to the CAV for this specific question type.
read the caption
(b) y (meters)

🔼 This figure shows the distribution of ground-truth answer locations relative to the CAV in V2V-QA’s Q3: Grounding behind a reference object in a direction. The x-axis represents the x-coordinate in meters, where positive x is in the direction the CAV is facing, and the y-axis is the y-coordinate in meters, with positive y to the right of the CAV. The plot shows the probability density function of the distance (in meters) between the CAV’s location and the locations of answers. The distribution of the angle (in degrees) between the CAV’s front direction and the direction of answer locations is also displayed. The distributions are shown in the same order as in Fig. 8.
read the caption
(c) distance (meters)

🔼 This histogram shows the distribution of the angle (in degrees) of the ground truth answer locations relative to the CAV (Connected Autonomous Vehicle) in the V2V-QA (Vehicle-to-Vehicle Question Answering) dataset for question type Q3: Grounding behind a reference object in a direction. The angle is calculated based on the relative position of the answer location with respect to the reference object’s position from the perspective of the CAV.
read the caption
(d) angle (degrees)

🔼 This figure visualizes the distribution of ground truth answer locations relative to the autonomous vehicle (CAV) in the V2V-QA dataset’s Q1 task, which focuses on grounding at a reference location. The plots illustrate the distribution along the x-axis (front-facing direction of the CAV), the y-axis (right-facing direction of the CAV), the distance from the CAV, and the angle relative to the CAV. These distributions provide insights into the spatial characteristics of the ground truth answers within the dataset for this specific task, showing how they are distributed relative to the CAV’s perspective.
read the caption
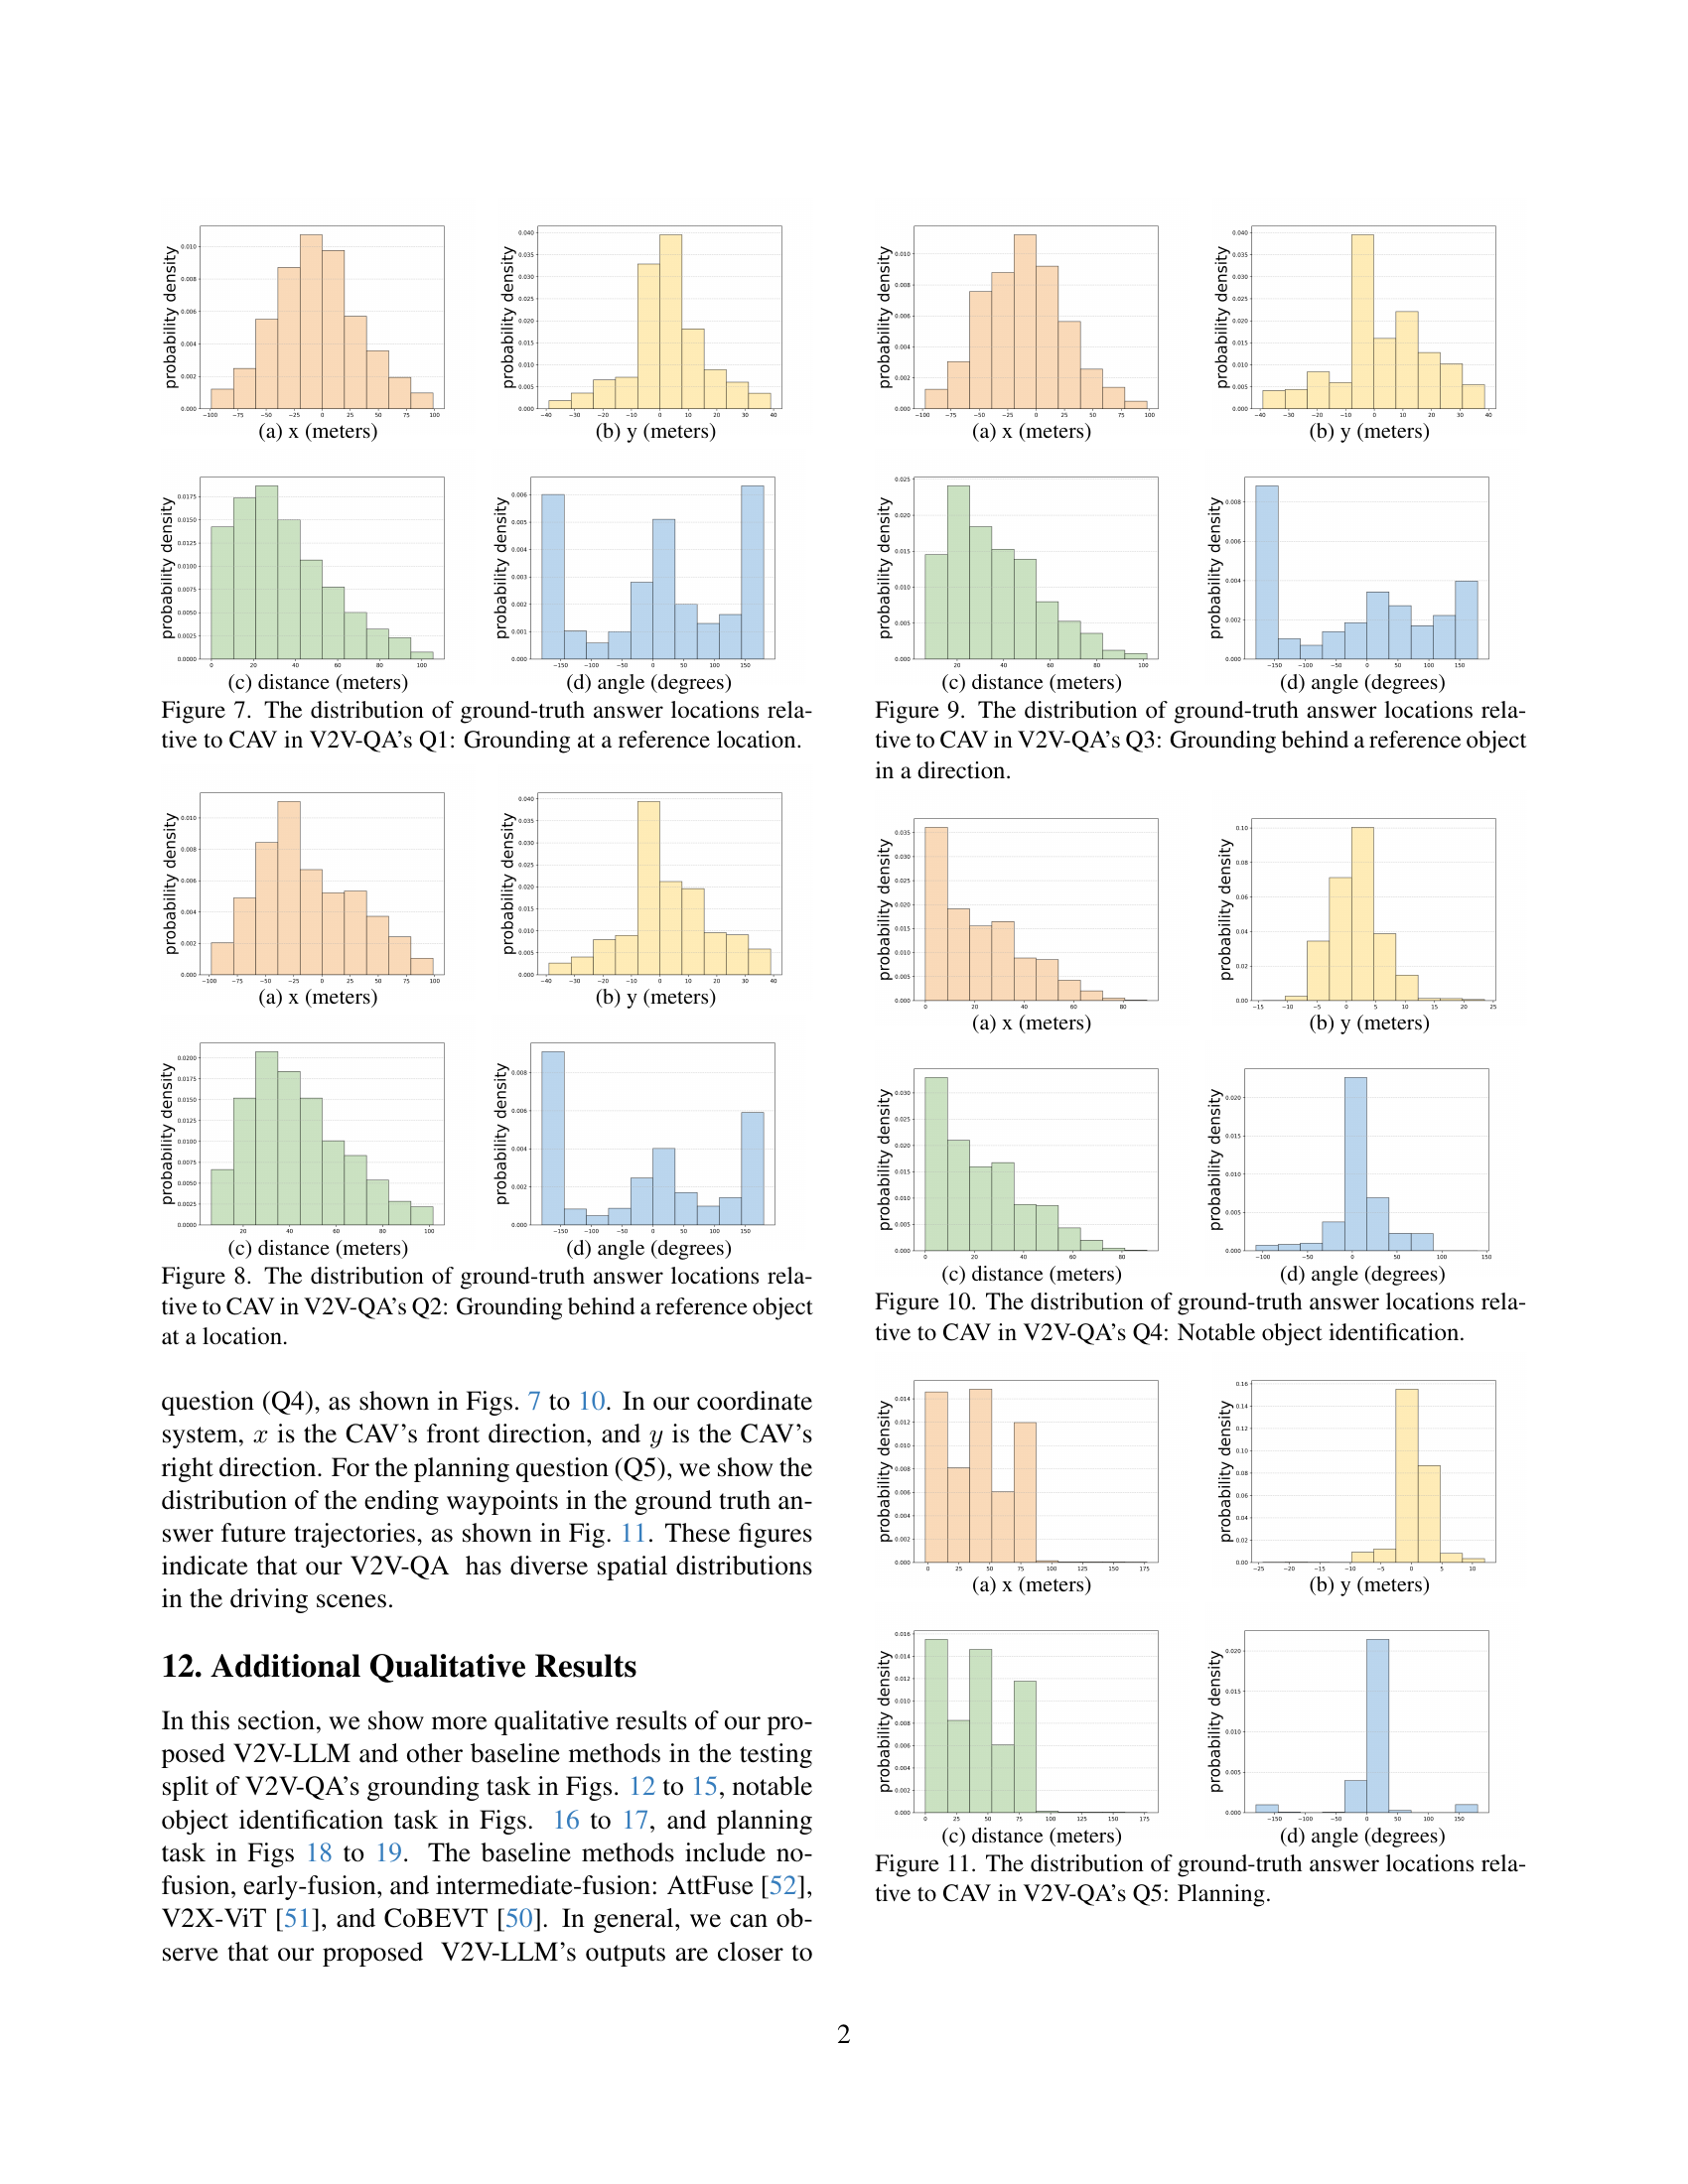
Figure 7: The distribution of ground-truth answer locations relative to CAV in V2V-QA’s Q1: Grounding at a reference location.

🔼 This figure shows the distribution of ground-truth answer locations relative to the CAV (Connected Autonomous Vehicle) in the V2V-QA dataset’s Q1 task (Grounding at a reference location). The x-axis represents the x-coordinate (meters) in the local coordinate system of the CAV, where x=0 is the CAV’s front direction. Similarly, the y-axis represents the y-coordinate (meters), where y=0 is the CAV’s right direction. The figure contains four subplots. (a) shows the distribution of x-coordinates, (b) shows the distribution of y-coordinates, (c) shows the distribution of distances (meters) between the CAV and the answer locations, and (d) shows the distribution of angles (degrees) of the answer locations relative to the CAV’s front direction. This visualization helps to understand the spatial characteristics of the question-answer pairs in this specific grounding task.
read the caption
(a) x (meters)

🔼 This figure shows the distribution of ground-truth answer locations’ y-coordinates relative to the CAV (Connected Autonomous Vehicle) in the V2V-QA dataset. The y-axis represents the probability density, and the x-axis shows the y-coordinate in meters. The figure helps illustrate the spatial distribution of the answers in the dataset, indicating the range and frequency of y-coordinates of the answers relative to the CAVs. This is crucial for understanding the data distribution and evaluating the performance of models on various spatial scenarios.
read the caption
(b) y (meters)

🔼 This figure shows the distribution of ground-truth answer locations relative to the CAV in V2V-QA’s Q3: Grounding behind a reference object in a direction. The x-axis represents the distance (in meters) between the CAV and the ground-truth answer location. The histogram visually represents the frequency or probability density of different distances observed in the dataset.
read the caption
(c) distance (meters)

🔼 This histogram shows the distribution of the angles of ground-truth answer locations relative to the CAV (Connected Autonomous Vehicle) in the V2V-QA (Vehicle-to-Vehicle Question Answering) dataset for question type Q3: Grounding behind a reference object in a direction. The angle is calculated as the direction of the ground truth answer location with respect to the CAV’s heading.
read the caption
(d) angle (degrees)

🔼 This figure shows the distribution of ground truth answer locations relative to the autonomous vehicle (CAV) in the V2V-QA dataset’s Q2 task, which is ‘Grounding behind a reference object at a location’. The distributions are visualized in four subplots showing the x-coordinate, y-coordinate, distance, and angle of the ground truth answer locations relative to the CAV. This provides insights into the spatial characteristics of the answers provided to this specific type of question within the dataset. The distributions help illustrate the range and frequency of various locations of objects behind reference objects, useful for understanding the complexity and variability of the cooperative perception task.
read the caption
Figure 8: The distribution of ground-truth answer locations relative to CAV in V2V-QA’s Q2: Grounding behind a reference object at a location.

🔼 This figure visualizes the distribution of ground-truth answer locations relative to the CAV (connected autonomous vehicle) in V2V-QA’s Q1 (Grounding at a reference location). The x-axis represents the x-coordinate (meters) and the y-axis represents the probability density. Subfigure (a) displays the distribution along the x-axis (front direction of the vehicle), (b) displays the distribution along the y-axis (right direction of the vehicle), (c) shows the distribution of distances (meters) between the ground truth locations and the CAV, and (d) presents the angular distribution (degrees) of the locations relative to the CAV. These distributions help characterize the spatial characteristics of the grounding task in the dataset.
read the caption
(a) x (meters)

🔼 This histogram shows the distribution of the y-coordinates of ground-truth answer locations relative to the CAV (Connected Autonomous Vehicle) in the V2V-QA dataset’s Q2 question type. The y-axis represents the probability density, and the x-axis represents the y-coordinate in meters. This visualization helps to understand the spatial distribution of objects relative to the CAV’s position when answering grounding questions about objects located behind a reference object at a specific location. The distribution is centered around 0, reflecting the fact that most answers are near the reference object but spread across various Y locations.
read the caption
(b) y (meters)

🔼 This figure shows the distribution of the distances between ground truth answer locations and the locations of the asking CAVs in the V2V-QA’s Q3 dataset. The x-axis represents the distance in meters, and the y-axis represents the probability density. The distribution is shown for different perspectives, including the x-coordinate, y-coordinate, distance, and angle. The x-coordinate and y-coordinate show the distribution along the x-axis and y-axis of the CAV’s local coordinate system. The distance shows the distribution of the distances between the ground truth answer locations and the asking CAVs. The angle shows the distribution of the angles between the ground truth answer locations and the asking CAVs. The figure helps to understand the spatial distribution of the objects relative to the asking CAVs.
read the caption
(c) distance (meters)

🔼 This histogram shows the distribution of the angle (in degrees) of ground-truth answer locations relative to the CAV (Connected Autonomous Vehicle) in the V2V-QA dataset’s Q4: Notable Object Identification task. The angle is measured as the direction from the CAV to the ground truth answer location.
read the caption
(d) angle (degrees)

🔼 This figure shows the distribution of ground truth answer locations relative to the ego vehicle (CAV) for question type Q3 of the V2V-QA dataset. Q3 questions are of the form: ‘Is there anything behind the [direction] object?’ The distributions are visualized for x and y coordinates (in meters), distance from the ego vehicle (in meters), and angle from the ego vehicle’s forward direction (in degrees). The distributions reveal the spatial spread of objects that satisfy Q3 queries in the dataset, which provides insight into the types of cooperative perception challenges addressed in the dataset and V2V-LLM model.
read the caption
Figure 9: The distribution of ground-truth answer locations relative to CAV in V2V-QA’s Q3: Grounding behind a reference object in a direction.

🔼 This figure shows the distribution of ground-truth answer locations relative to the CAV (connected autonomous vehicle) in V2V-QA’s Q1 (Grounding at a reference location). The figure is composed of four subplots: (a) shows the distribution of x-coordinates (in meters), (b) shows the distribution of y-coordinates (in meters), (c) shows the distribution of distances (in meters) between the CAV and the answer location, and (d) shows the distribution of angles (in degrees) between the CAV’s forward direction and the answer location. Each subplot provides a histogram illustrating the frequency distribution of the respective metric. This visualization helps to understand the spatial characteristics and distribution of the answer locations relative to the CAV.
read the caption
(a) x (meters)

🔼 This figure displays the distribution of ground-truth answer locations along the y-axis relative to the CAV (Connected Autonomous Vehicle) in the V2V-QA dataset. The y-axis represents the lateral direction, with positive values indicating locations to the right of the CAV and negative values indicating locations to the left. The distribution is shown in a histogram, providing insights into the spatial distribution of objects relevant to the grounding questions in the dataset.
read the caption
(b) y (meters)

🔼 This figure shows the distribution of the distance between the ground-truth answer locations and the asking CAV’s location for question type Q3 (Grounding behind a reference object in a direction) in the V2V-QA dataset. The x-axis represents the distance in meters, and the y-axis represents the probability density. The distribution is shown as a histogram.
read the caption
(c) distance (meters)

🔼 This histogram shows the distribution of the angles of ground-truth answer locations relative to the CAV’s coordinate system in the V2V-QA’s Q3 dataset. The angle is measured in degrees and represents the direction of the answer location with respect to the CAV’s forward direction. This visualization helps to understand the spatial distribution of answers relative to the CAV, providing insights into the dataset’s characteristics and the challenges involved in cooperative perception tasks.
read the caption
(d) angle (degrees)

🔼 This figure visualizes the distribution of ground truth answer locations relative to the ego vehicle (CAV) for question type Q4 in the V2V-QA dataset. Specifically, it shows how the x and y coordinates (relative to the CAV), the distance from the CAV, and the angle relative to the CAV are distributed for the ground truth answers of question type Q4. This provides insights into the spatial characteristics of the notable objects that the model is expected to identify and helps to understand the difficulty and distribution of the data for this question type.
read the caption
Figure 10: The distribution of ground-truth answer locations relative to CAV in V2V-QA’s Q4: Notable object identification.

🔼 This figure shows the distribution of ground-truth answer locations relative to the CAV (connected autonomous vehicle) in V2V-QA’s Q1 (Grounding at a reference location). The figure consists of four subplots: (a) shows the x-coordinate distribution in meters, (b) shows the y-coordinate distribution in meters, (c) shows the distance distribution in meters, and (d) shows the angle distribution in degrees. Each subplot provides a histogram visualizing the frequency of different values for the corresponding metric. This helps understand the spatial distribution of the objects referenced in the dataset’s grounding questions relative to the CAV’s perspective.
read the caption
(a) x (meters)

🔼 This figure shows the distribution of ground-truth answer locations relative to the CAV in V2V-QA’s Q2. The y-axis represents the probability density, and the x-axis shows the y-coordinate of the ground truth answer location in meters. The figure provides four subplots: (a) x-coordinate distribution, (b) y-coordinate distribution, (c) distance distribution from the CAV to the answer location, and (d) angle distribution of the answer location relative to the CAV’s heading. These distributions are important to understand the characteristics of the dataset and the difficulty of the grounding task, as they show how the relevant information is distributed in the dataset.
read the caption
(b) y (meters)

🔼 This figure shows the distribution of the ground-truth answer distances to the asking CAV in V2V-QA’s Q3. The distance is calculated from the location of the ground-truth answer to the location of the asking CAV. The distribution is shown as a histogram. The x-axis represents the distance in meters, and the y-axis represents the probability density.
read the caption
(c) distance (meters)

🔼 This histogram shows the distribution of the angle (in degrees) of ground-truth answer locations relative to the CAV (Connected Autonomous Vehicle) in the V2V-QA (Vehicle-to-Vehicle Question Answering) dataset. The angle is measured from the CAV’s forward direction, indicating the orientation of the objects being located relative to the vehicle’s heading. This distribution helps illustrate the range of object locations relative to the CAV that the models are tasked with identifying in the dataset and in the experiment.
read the caption
(d) angle (degrees)

🔼 This figure visualizes the distribution of ground truth answer locations relative to the ego vehicle (CAV) for the planning questions in the V2V-QA dataset. Specifically, it shows the distribution of the x-coordinate, y-coordinate, distance, and angle of the ending waypoints from the ground truth trajectories, providing insights into the spatial characteristics of the planning task within the dataset.
read the caption
Figure 11: The distribution of ground-truth answer locations relative to CAV in V2V-QA’s Q5: Planning.

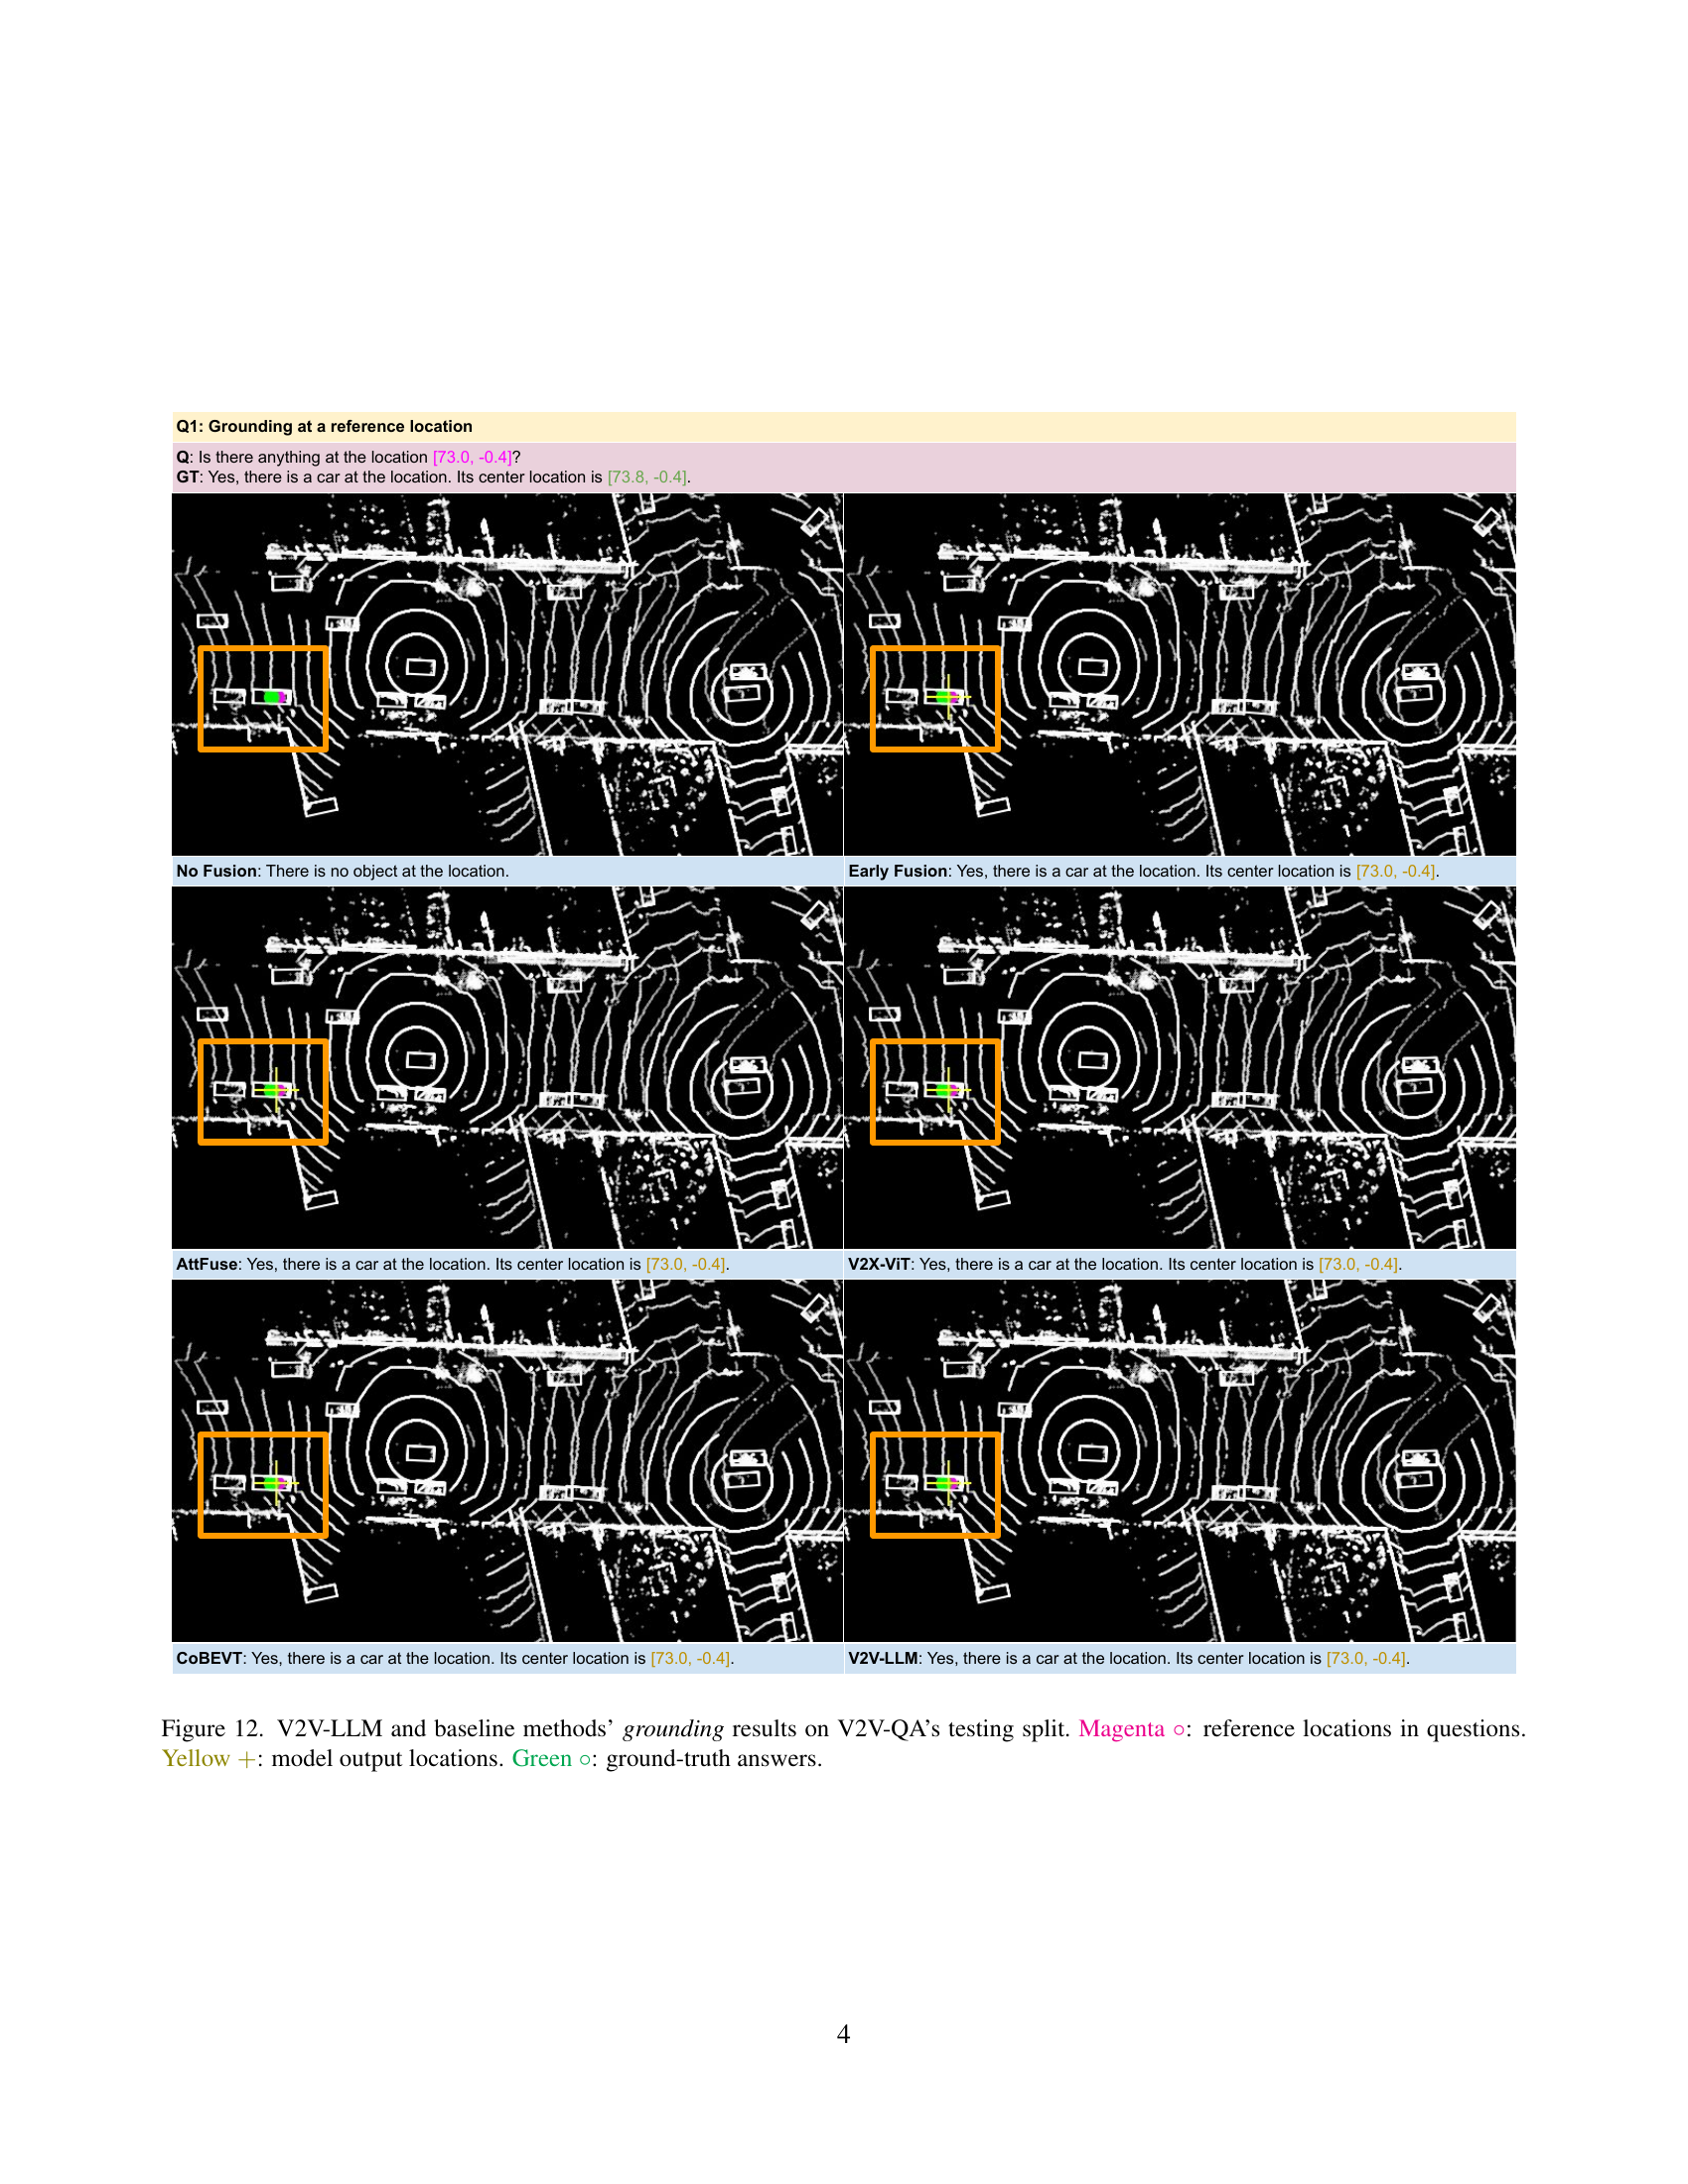
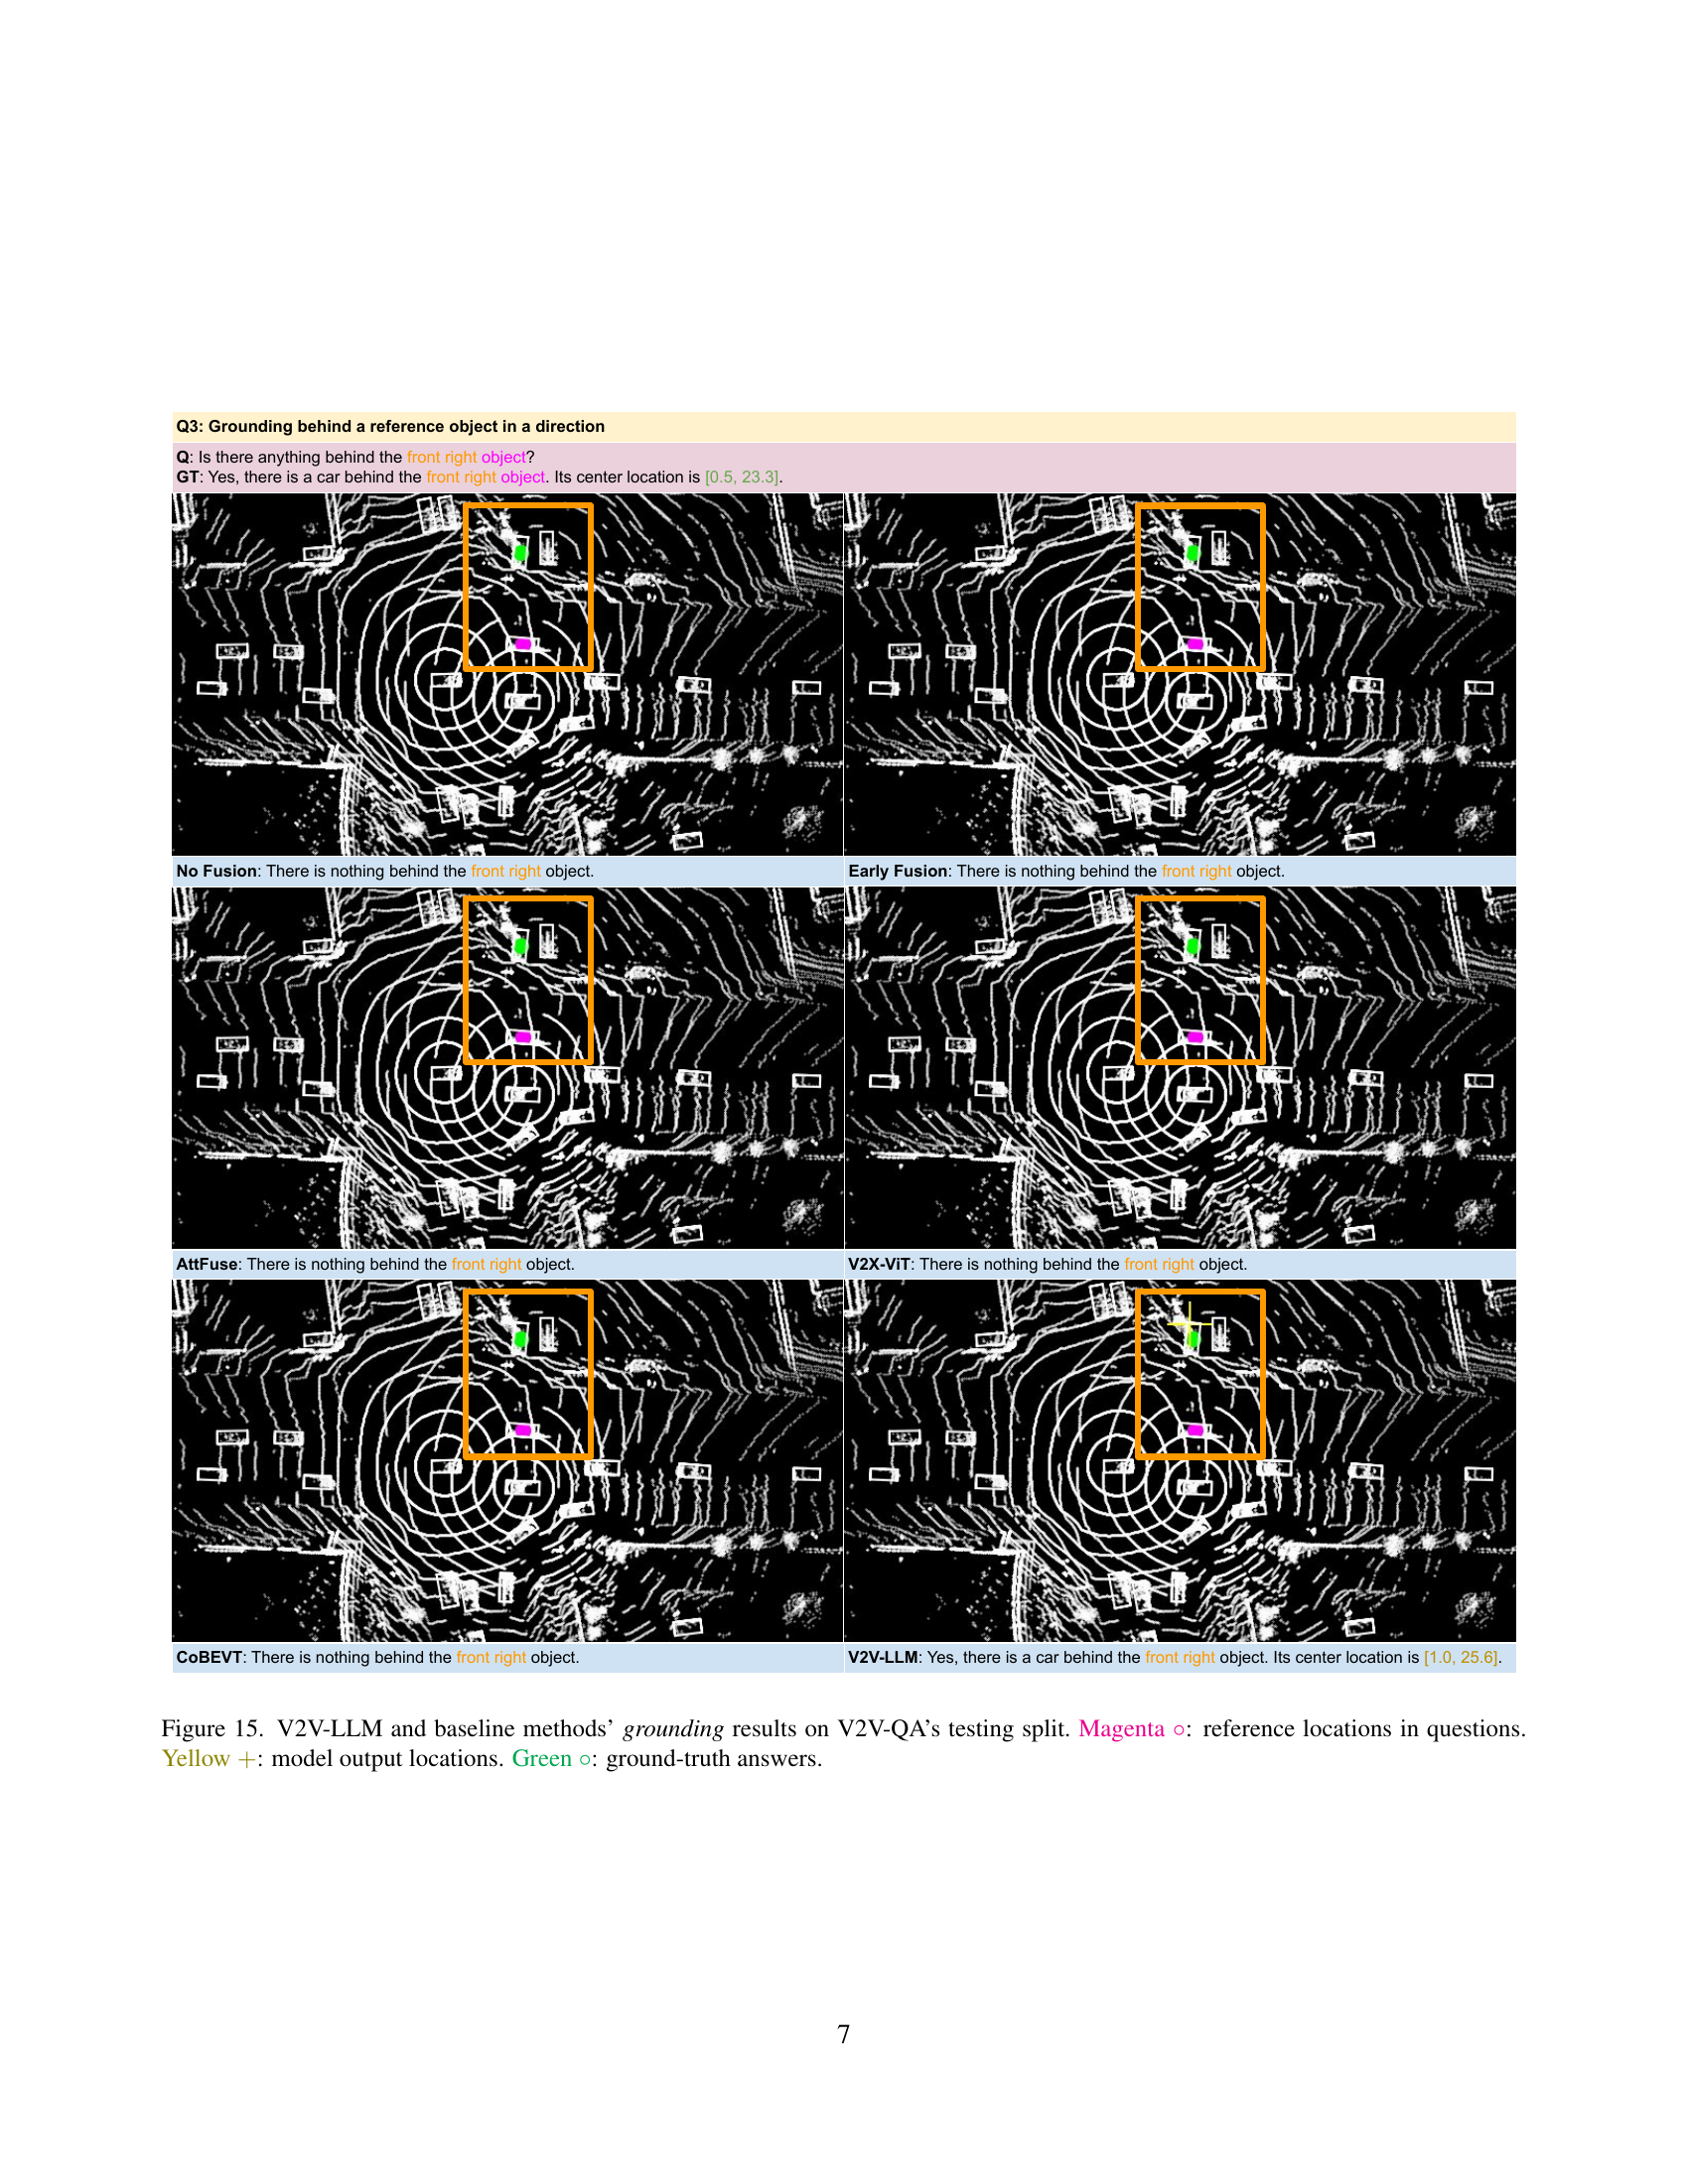
🔼 This figure compares the performance of V2V-LLM and several baseline methods (No Fusion, Early Fusion, AttFuse, V2X-VIT, COBEVT) on the grounding task of the V2V-QA dataset. The grounding task involves identifying objects at specific locations. Each row presents a different example. The image shows the point cloud data. Magenta circles indicate the reference location provided in the question. Yellow plus signs (+) show the location predicted by the model. Green circles show the ground truth location of the object.
read the caption
Figure 12: V2V-LLM and baseline methods’ grounding results on V2V-QA’s testing split. Magenta ∘\circ∘: reference locations in questions. Yellow +++: model output locations. Green ∘\circ∘: ground-truth answers.

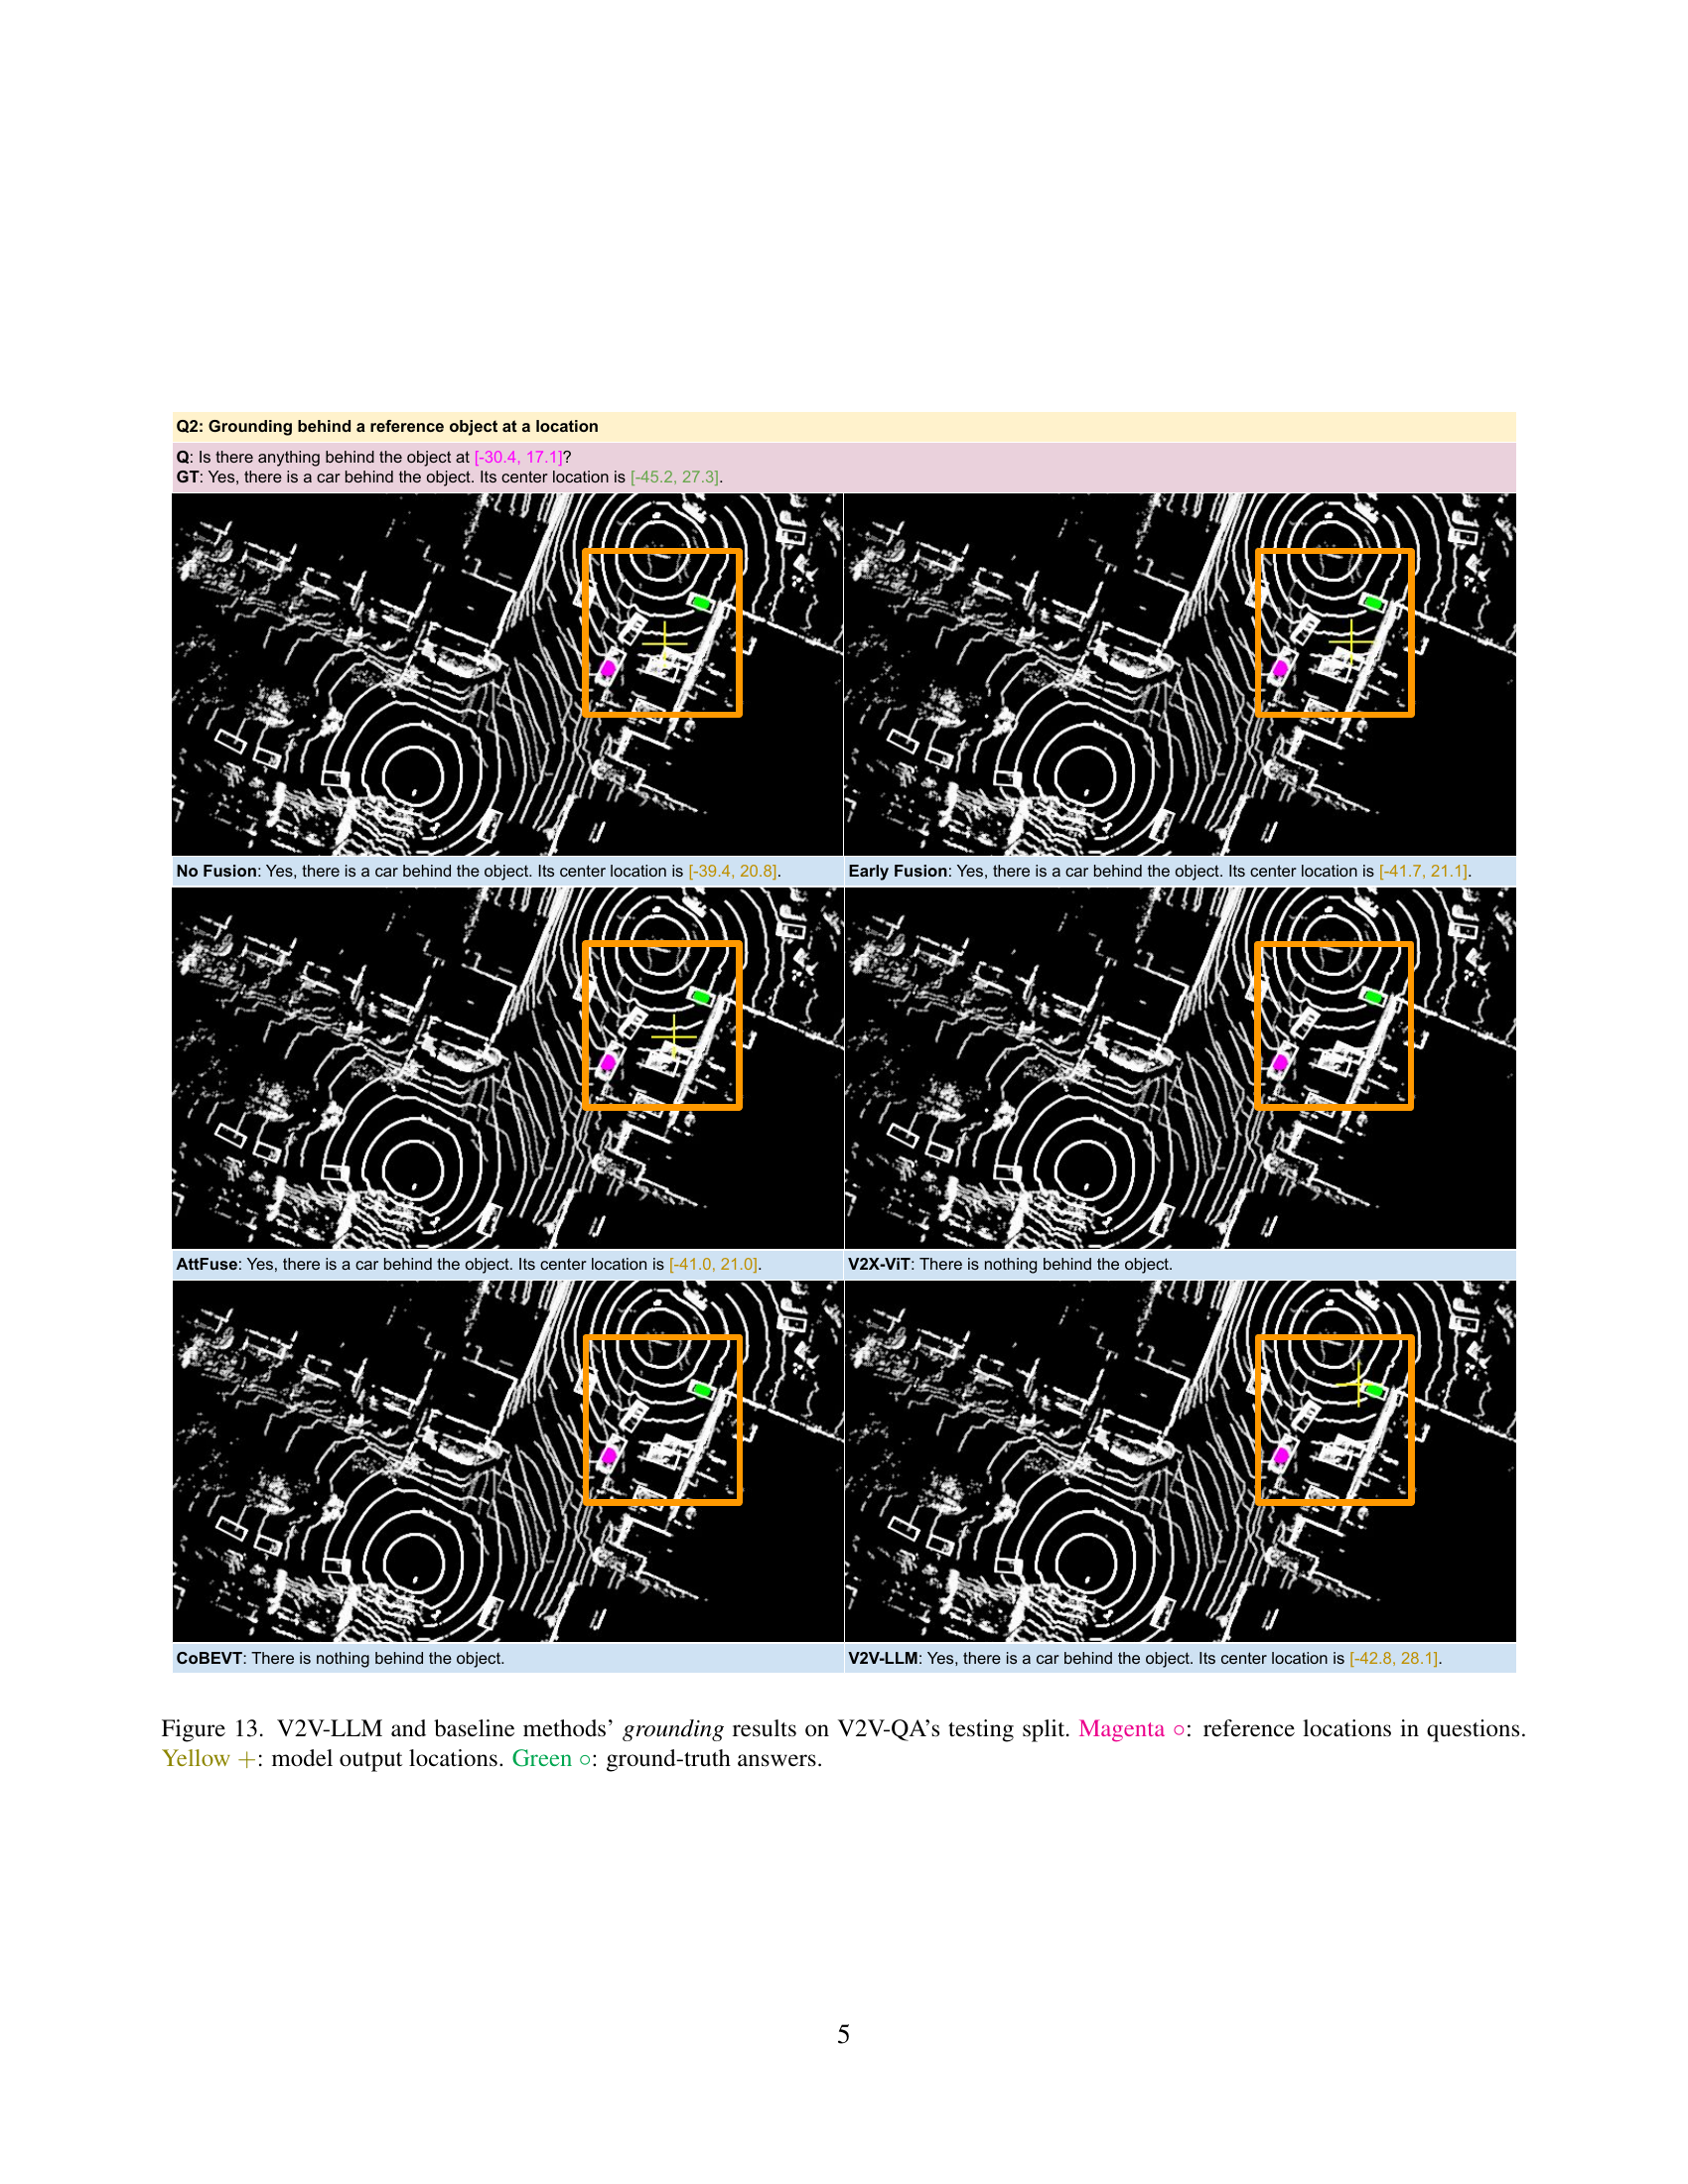
🔼 Figure 13 presents a comparison of grounding results between the proposed V2V-LLM model and several baseline methods. The task is to identify objects at specified locations within a driving scene, using data from the V2V-QA testing split. The figure visualizes the results by showing LiDAR point cloud data for a section of the driving scene and highlighting relevant objects. Magenta circles denote the reference locations specified in the questions. Yellow plus symbols represent the locations predicted by each method. Ground truth object locations are shown as green circles. This comparison allows for an evaluation of the accuracy and effectiveness of each method in cooperative grounding tasks. In particular, it can assess how well each approach fuses information from multiple vehicles to accurately and reliably identify objects in the driving scene.
read the caption
Figure 13: V2V-LLM and baseline methods’ grounding results on V2V-QA’s testing split. Magenta ∘\circ∘: reference locations in questions. Yellow +++: model output locations. Green ∘\circ∘: ground-truth answers.
More on tables
| QA type | Training | Testing | Total |
|---|---|---|---|
| Q1 | 354820 | 121383 | 476203 |
| Q2 | 35700 | 13882 | 49582 |
| Q3 | 14339 | 5097 | 19436 |
| Q4 | 12290 | 3446 | 15736 |
| Q5 | 12290 | 3446 | 15736 |
| Total | 429439 | 147254 | 576693 |
🔼 Table 2 presents a detailed breakdown of the V2V-QA dataset’s composition. It shows the number of question-answer pairs for each of the five question types. These types are categorized as: Q1 (Grounding at a reference location), Q2 (Grounding behind a reference object at a location), Q3 (Grounding behind a reference object in a direction), Q4 (Notable object identification), and Q5 (Planning). The table displays the quantity of training and testing data for each question type and the overall total, offering insights into the dataset’s size and balance across different tasks.
read the caption
Table 2: Dataset statistics of our V2V-QA. Q1: Grounding at a reference location. Q2: Grounding behind a reference object at a location. Q3: Grounding behind a reference object in a direction. Q4: Notable object identification. Q5: Planning.
| Method | Q1 | Q2 | Q3 | QGr | Q4 | Q5 | Comm(MB) | |||||||||
|---|---|---|---|---|---|---|---|---|---|---|---|---|---|---|---|---|
| F1 | P | R | F1 | P | R | F1 | P | R | F1 | F1 | P | R | L2avg (m) | CRavg (%) | ||
| No Fusion | 66.6 | 77.9 | 58.2 | 22.6 | 29.4 | 18.4 | 17.2 | 17.4 | 16.9 | 35.5 | 47.3 | 49.2 | 45.6 | 6.55 | 4.57 | 0 |
| Early Fusion | 73.5 | 82.2 | 66.5 | 23.3 | 29.1 | 19.5 | 20.8 | 22.7 | 19.3 | 39.2 | 53.9 | 55.4 | 52.6 | 6.20 | 3.55 | 0.96 |
| Intermediate Fusion | ||||||||||||||||
| AttFuse [52] | 70.7 | 79.6 | 63.6 | 26.4 | 31.6 | 22.7 | 18.4 | 19.6 | 17.4 | 38.5 | 56.9 | 57.2 | 56.6 | 6.83 | 4.12 | 0.20 |
| V2X-ViT [51] | 70.8 | 81.1 | 62.8 | 28.0 | 33.9 | 23.9 | 22.6 | 25.2 | 20.5 | 40.5 | 57.6 | 57.0 | 58.2 | 7.08 | 4.33 | 0.20 |
| CoBEVT [50] | 72.2 | 76.8 | 68.1 | 29.3 | 34.7 | 25.3 | 21.3 | 22.1 | 20.6 | 40.9 | 57.6 | 57.2 | 58.1 | 6.72 | 3.88 | 0.20 |
| LLM Fusion | ||||||||||||||||
| V2V-LLM (Ours) | 70.0 | 80.1 | 62.2 | 30.8 | 36.3 | 26.7 | 21.2 | 21.5 | 20.8 | 40.7 | 59.7 | 61.9 | 57.6 | 4.99 | 3.00 | 0.203 |
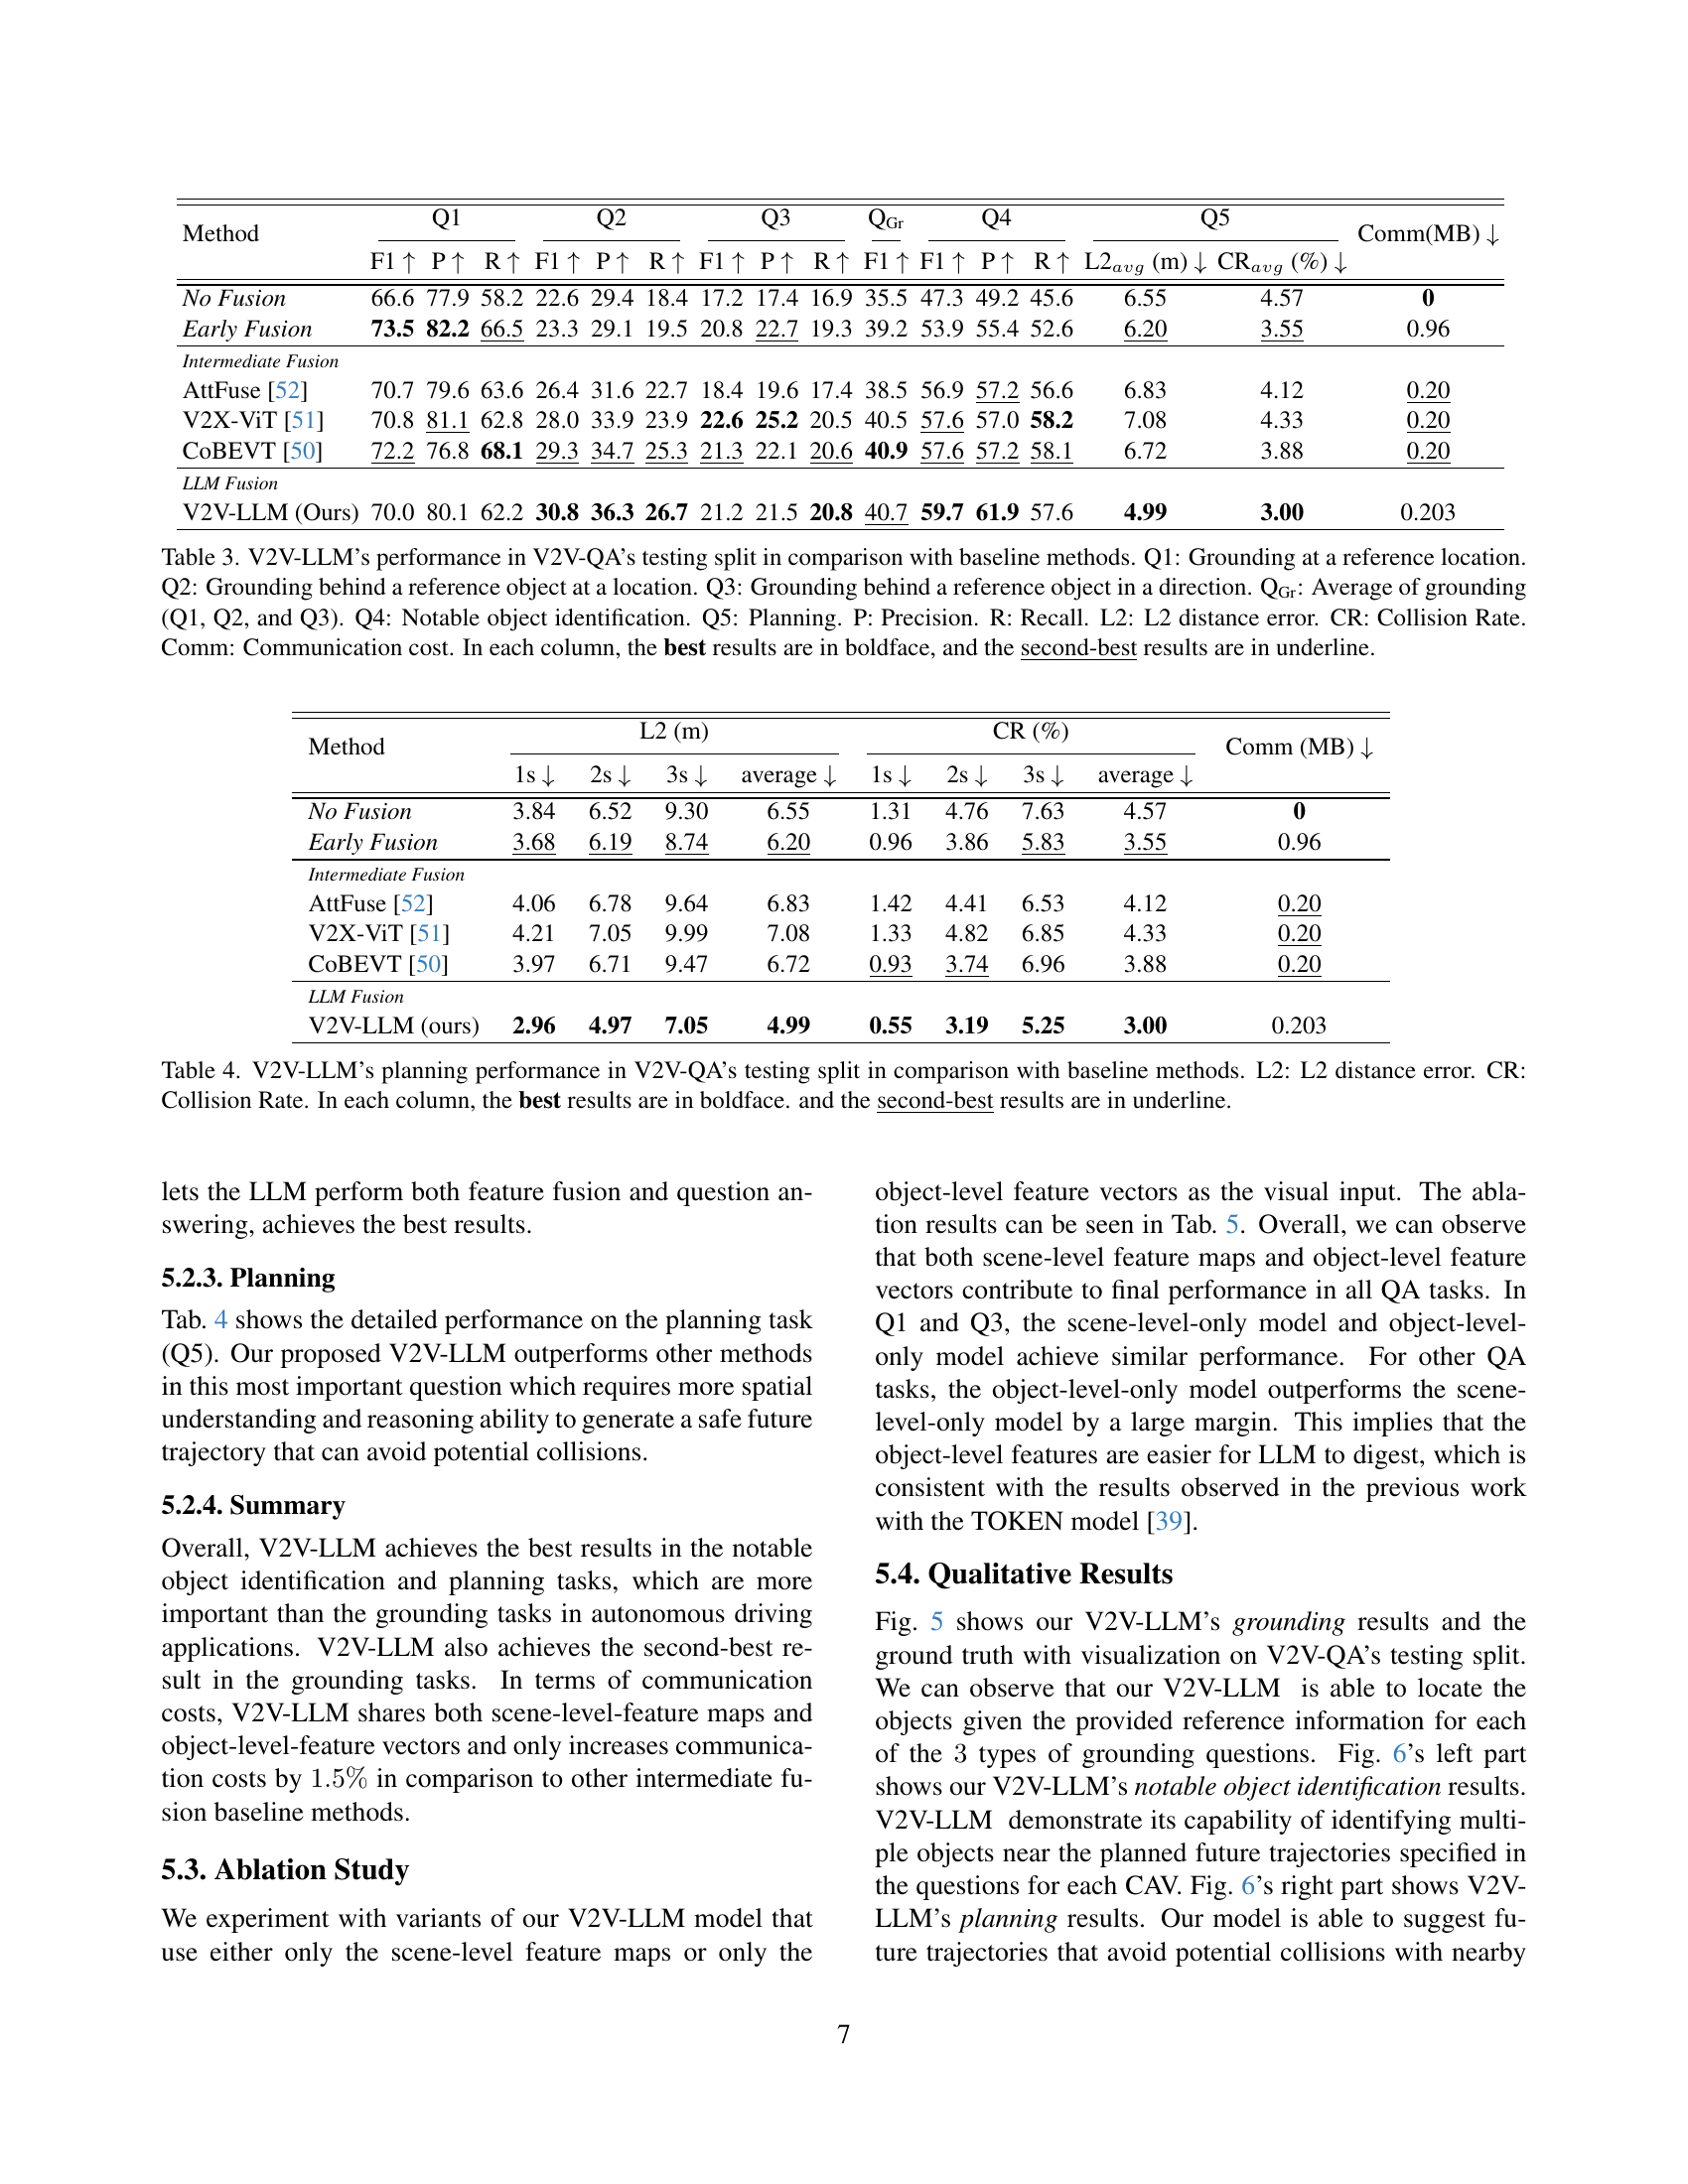
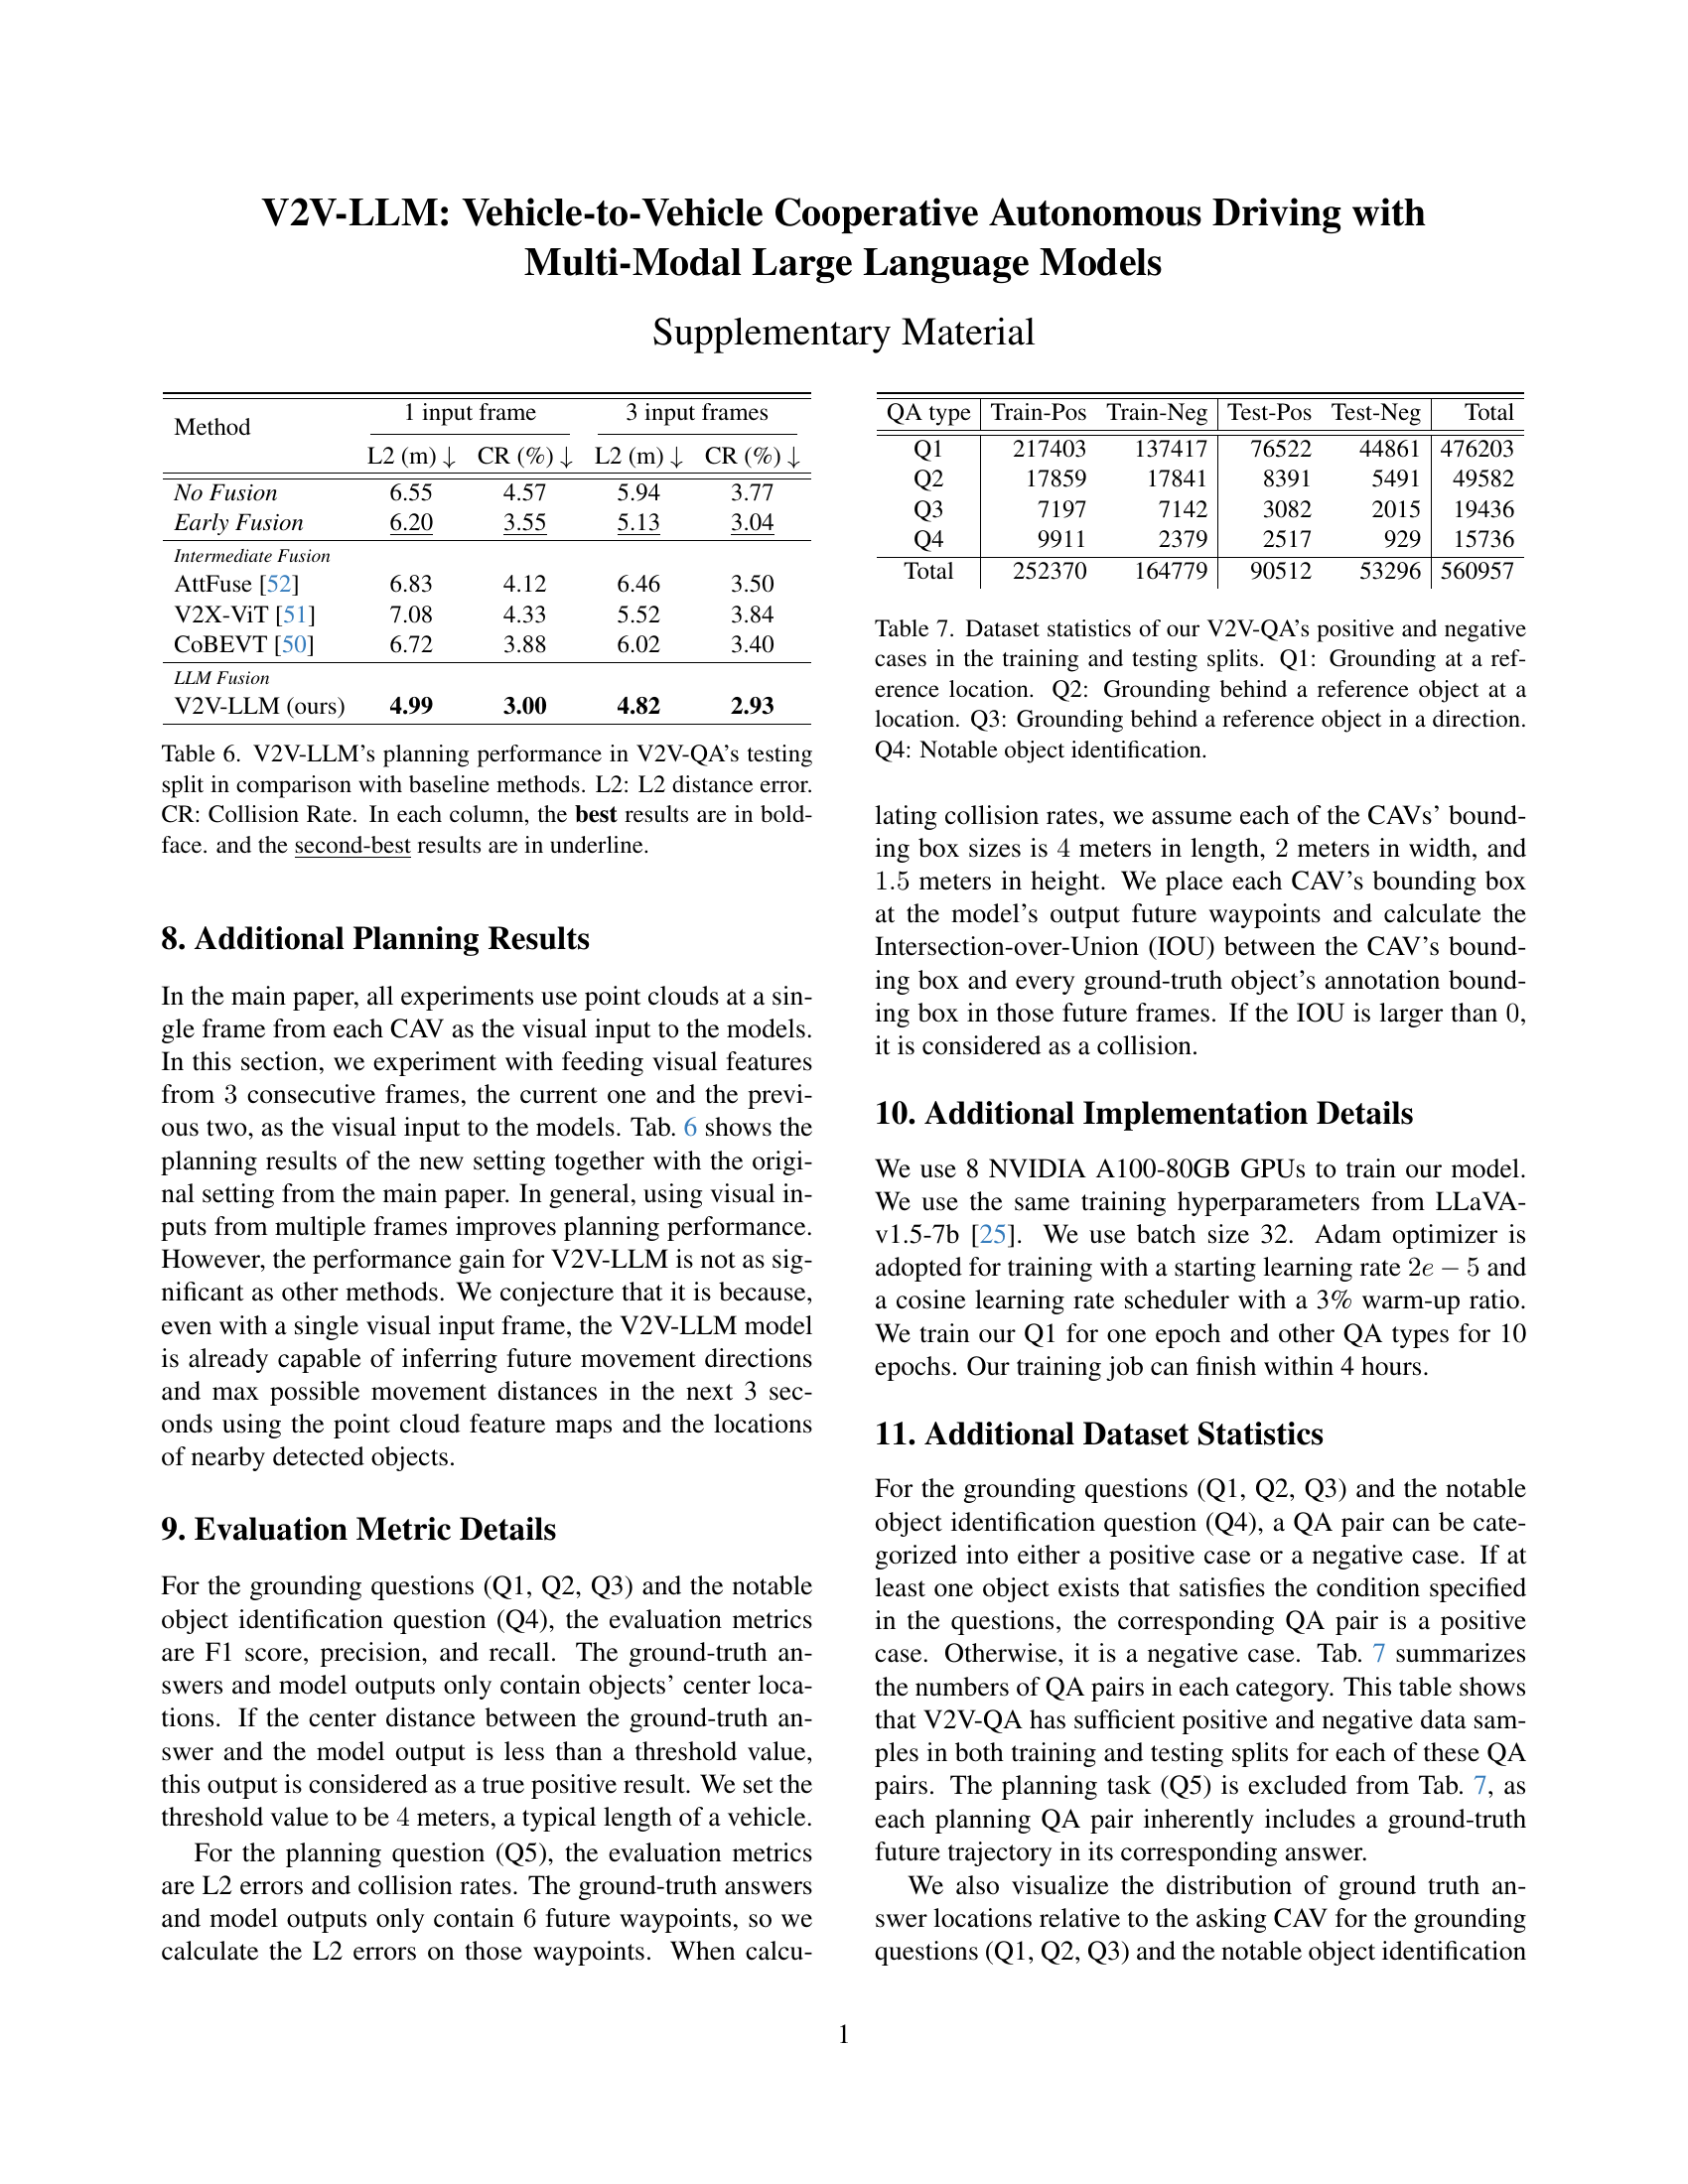
🔼 This table presents a comparison of the performance of various methods on the V2V-QA dataset. The methods include different fusion approaches: no fusion, early fusion, intermediate fusion, and the proposed V2V-LLM model. The table shows the performance metrics (F1 score, precision, recall, L2 distance error, and collision rate) for five different question types in the V2V-QA dataset: grounding at a reference location (Q1), grounding behind a reference object at a location (Q2), grounding behind a reference object in a direction (Q3), notable object identification (Q4), and planning (Q5). The average performance across the three grounding questions is also provided (QGr). The communication cost (Comm) for each method is also included. The best results for each metric are shown in bold, and the second-best results are underlined.
read the caption
Table 3: V2V-LLM’s performance in V2V-QA’s testing split in comparison with baseline methods. Q1: Grounding at a reference location. Q2: Grounding behind a reference object at a location. Q3: Grounding behind a reference object in a direction. QGr: Average of grounding (Q1, Q2, and Q3). Q4: Notable object identification. Q5: Planning. P: Precision. R: Recall. L2: L2 distance error. CR: Collision Rate. Comm: Communication cost. In each column, the best results are in boldface, and the second-best results are in underline.
| Method | L2 (m) | CR (%) | Comm (MB) | ||||||
|---|---|---|---|---|---|---|---|---|---|
| 1s | 2s | 3s | average | 1s | 2s | 3s | average | ||
| No Fusion | 3.84 | 6.52 | 9.30 | 6.55 | 1.31 | 4.76 | 7.63 | 4.57 | 0 |
| Early Fusion | 3.68 | 6.19 | 8.74 | 6.20 | 0.96 | 3.86 | 5.83 | 3.55 | 0.96 |
| Intermediate Fusion | |||||||||
| AttFuse [52] | 4.06 | 6.78 | 9.64 | 6.83 | 1.42 | 4.41 | 6.53 | 4.12 | 0.20 |
| V2X-ViT [51] | 4.21 | 7.05 | 9.99 | 7.08 | 1.33 | 4.82 | 6.85 | 4.33 | 0.20 |
| CoBEVT [50] | 3.97 | 6.71 | 9.47 | 6.72 | 0.93 | 3.74 | 6.96 | 3.88 | 0.20 |
| LLM Fusion | |||||||||
| V2V-LLM (ours) | 2.96 | 4.97 | 7.05 | 4.99 | 0.55 | 3.19 | 5.25 | 3.00 | 0.203 |
🔼 Table 4 presents a comparison of the planning performance of V2V-LLM against several baseline methods using the V2V-QA testing dataset. The evaluation metrics used are the average L2 distance error (in meters) between planned and actual trajectories, and the average collision rate (percentage of instances where collisions occur). For better readability, the best results for each metric are highlighted in bold, while the second-best results are underlined. This allows for a direct comparison of V2V-LLM’s planning capabilities against methods utilizing different fusion approaches (no fusion, early fusion, and intermediate fusion).
read the caption
Table 4: V2V-LLM’s planning performance in V2V-QA’s testing split in comparison with baseline methods. L2: L2 distance error. CR: Collision Rate. In each column, the best results are in boldface. and the second-best results are in underline.
| Method | Q1 | Q2 | Q3 | QGr | Q4 | Q5 | Comm (MB) | |||||||||
|---|---|---|---|---|---|---|---|---|---|---|---|---|---|---|---|---|
| F1 | P | R | F1 | P | R | F1 | P | R | F1 | F1 | P | R | L2avg (m) | CRavg (%) | ||
| Scene-level only | 69.9 | 74.9 | 65.5 | 15.4 | 19.9 | 12.6 | 17.9 | 26.9 | 13.5 | 34.4 | 43.2 | 40.2 | 46.7 | 7.21 | 15.55 | 0.20 |
| Object-level only | 69.0 | 80.9 | 60.1 | 26.9 | 34.7 | 21.9 | 17.6 | 18.3 | 16.9 | 37.8 | 52.6 | 57.3 | 48.6 | 5.24 | 7.78 | 0.003 |
| V2V-LLM (ours) | 70.0 | 80.1 | 62.2 | 30.8 | 36.3 | 26.7 | 21.2 | 21.5 | 20.8 | 40.7 | 59.7 | 61.9 | 57.6 | 4.99 | 3.00 | 0.203 |
🔼 This table presents the results of an ablation study conducted on the V2V-QA dataset’s testing split. The study evaluates the performance of the V2V-LLM model under various configurations. Specifically, it examines the impact of using only scene-level features or only object-level features, as opposed to using both, on the model’s ability to perform different tasks. These tasks include grounding (Q1-Q3, an average of these three is QGr), notable object identification (Q4), and planning (Q5). The evaluation metrics used are F1 score, precision (P), recall (R), L2 distance error (L2), collision rate (CR), and communication cost (Comm). The results provide insights into the relative contributions of scene and object features to the overall performance of the V2V-LLM model across different tasks.
read the caption
Table 5: Ablation study in V2V-QA’s testing split. Q1: Grounding at a reference location. Q2: Grounding behind a reference object at a location. Q3: Grounding behind a reference object in a direction. QGr: Average of grounding (Q1, Q2, and Q3). Q4: Notable object identification. Q5: Planning. P: Precision. R: Recall. L2: L2 distance error. CR: Collision Rate. Comm: Communication cost.
| Method | 1 input frame | 3 input frames | ||
|---|---|---|---|---|
| L2 (m) | CR (%) | L2 (m) | CR (%) | |
| No Fusion | 6.55 | 4.57 | 5.94 | 3.77 |
| Early Fusion | 6.20 | 3.55 | 5.13 | 3.04 |
| Intermediate Fusion | ||||
| AttFuse [52] | 6.83 | 4.12 | 6.46 | 3.50 |
| V2X-ViT [51] | 7.08 | 4.33 | 5.52 | 3.84 |
| CoBEVT [50] | 6.72 | 3.88 | 6.02 | 3.40 |
| LLM Fusion | ||||
| V2V-LLM (ours) | 4.99 | 3.00 | 4.82 | 2.93 |
🔼 Table 6 presents a comparison of the planning performance of the proposed V2V-LLM model against several baseline methods on the V2V-QA testing dataset. The performance is evaluated using two metrics: the average L2 distance error (L2) and the average collision rate (CR). Lower L2 error indicates better trajectory planning accuracy, and a lower collision rate signifies improved safety. The table highlights the best-performing model for each metric in boldface and the second-best performing model with an underline, indicating V2V-LLM’s relative strengths and weaknesses in this specific task.
read the caption
Table 6: V2V-LLM’s planning performance in V2V-QA’s testing split in comparison with baseline methods. L2: L2 distance error. CR: Collision Rate. In each column, the best results are in boldface. and the second-best results are in underline.
| QA type | Train-Pos | Train-Neg | Test-Pos | Test-Neg | Total |
|---|---|---|---|---|---|
| Q1 | 217403 | 137417 | 76522 | 44861 | 476203 |
| Q2 | 17859 | 17841 | 8391 | 5491 | 49582 |
| Q3 | 7197 | 7142 | 3082 | 2015 | 19436 |
| Q4 | 9911 | 2379 | 2517 | 929 | 15736 |
| Total | 252370 | 164779 | 90512 | 53296 | 560957 |
🔼 This table presents a breakdown of the V2V-QA dataset, categorized by question type and the positive/negative class of each data point. The dataset is used to evaluate models on cooperative autonomous driving tasks. It shows the number of positive (at least one object satisfies the question’s condition) and negative (no object satisfies the condition) examples in the training and testing sets for four question types: Q1 (Grounding at a reference location), Q2 (Grounding behind a reference object at a location), Q3 (Grounding behind a reference object in a direction), and Q4 (Notable object identification). This breakdown helps understand the class distribution within the dataset, informing the evaluation of model performance.
read the caption
Table 7: Dataset statistics of our V2V-QA’s positive and negative cases in the training and testing splits. Q1: Grounding at a reference location. Q2: Grounding behind a reference object at a location. Q3: Grounding behind a reference object in a direction. Q4: Notable object identification.
Full paper#