TL;DR#
Current text-to-video generation models struggle with complex actions, adherence to physical laws, and generating videos with multiple concepts. Diffusion-based models, while effective, lack explicit causal modeling. There is also a need for more efficient training and inference strategies.
This paper introduces Step-Video-T2V, a 30B parameter model addressing these challenges. It utilizes a deep compression VAE for efficient video representation, bilingual text encoders, and a DiT with 3D full attention for improved video generation. A novel Video-DPO approach enhances visual quality, and a new benchmark dataset, Step-Video-T2V-Eval, enables fair comparisons with other models. The model and dataset are open-sourced, advancing the field.
Key Takeaways#
Why does it matter?#
This paper is crucial for researchers in video generation and foundation models. It introduces Step-Video-T2V, a state-of-the-art model, and shares key insights and challenges in developing video foundation models. The open-sourcing of the model and benchmark dataset accelerates innovation and empowers creators, making it highly relevant to current research trends and opening avenues for future research.
Visual Insights#

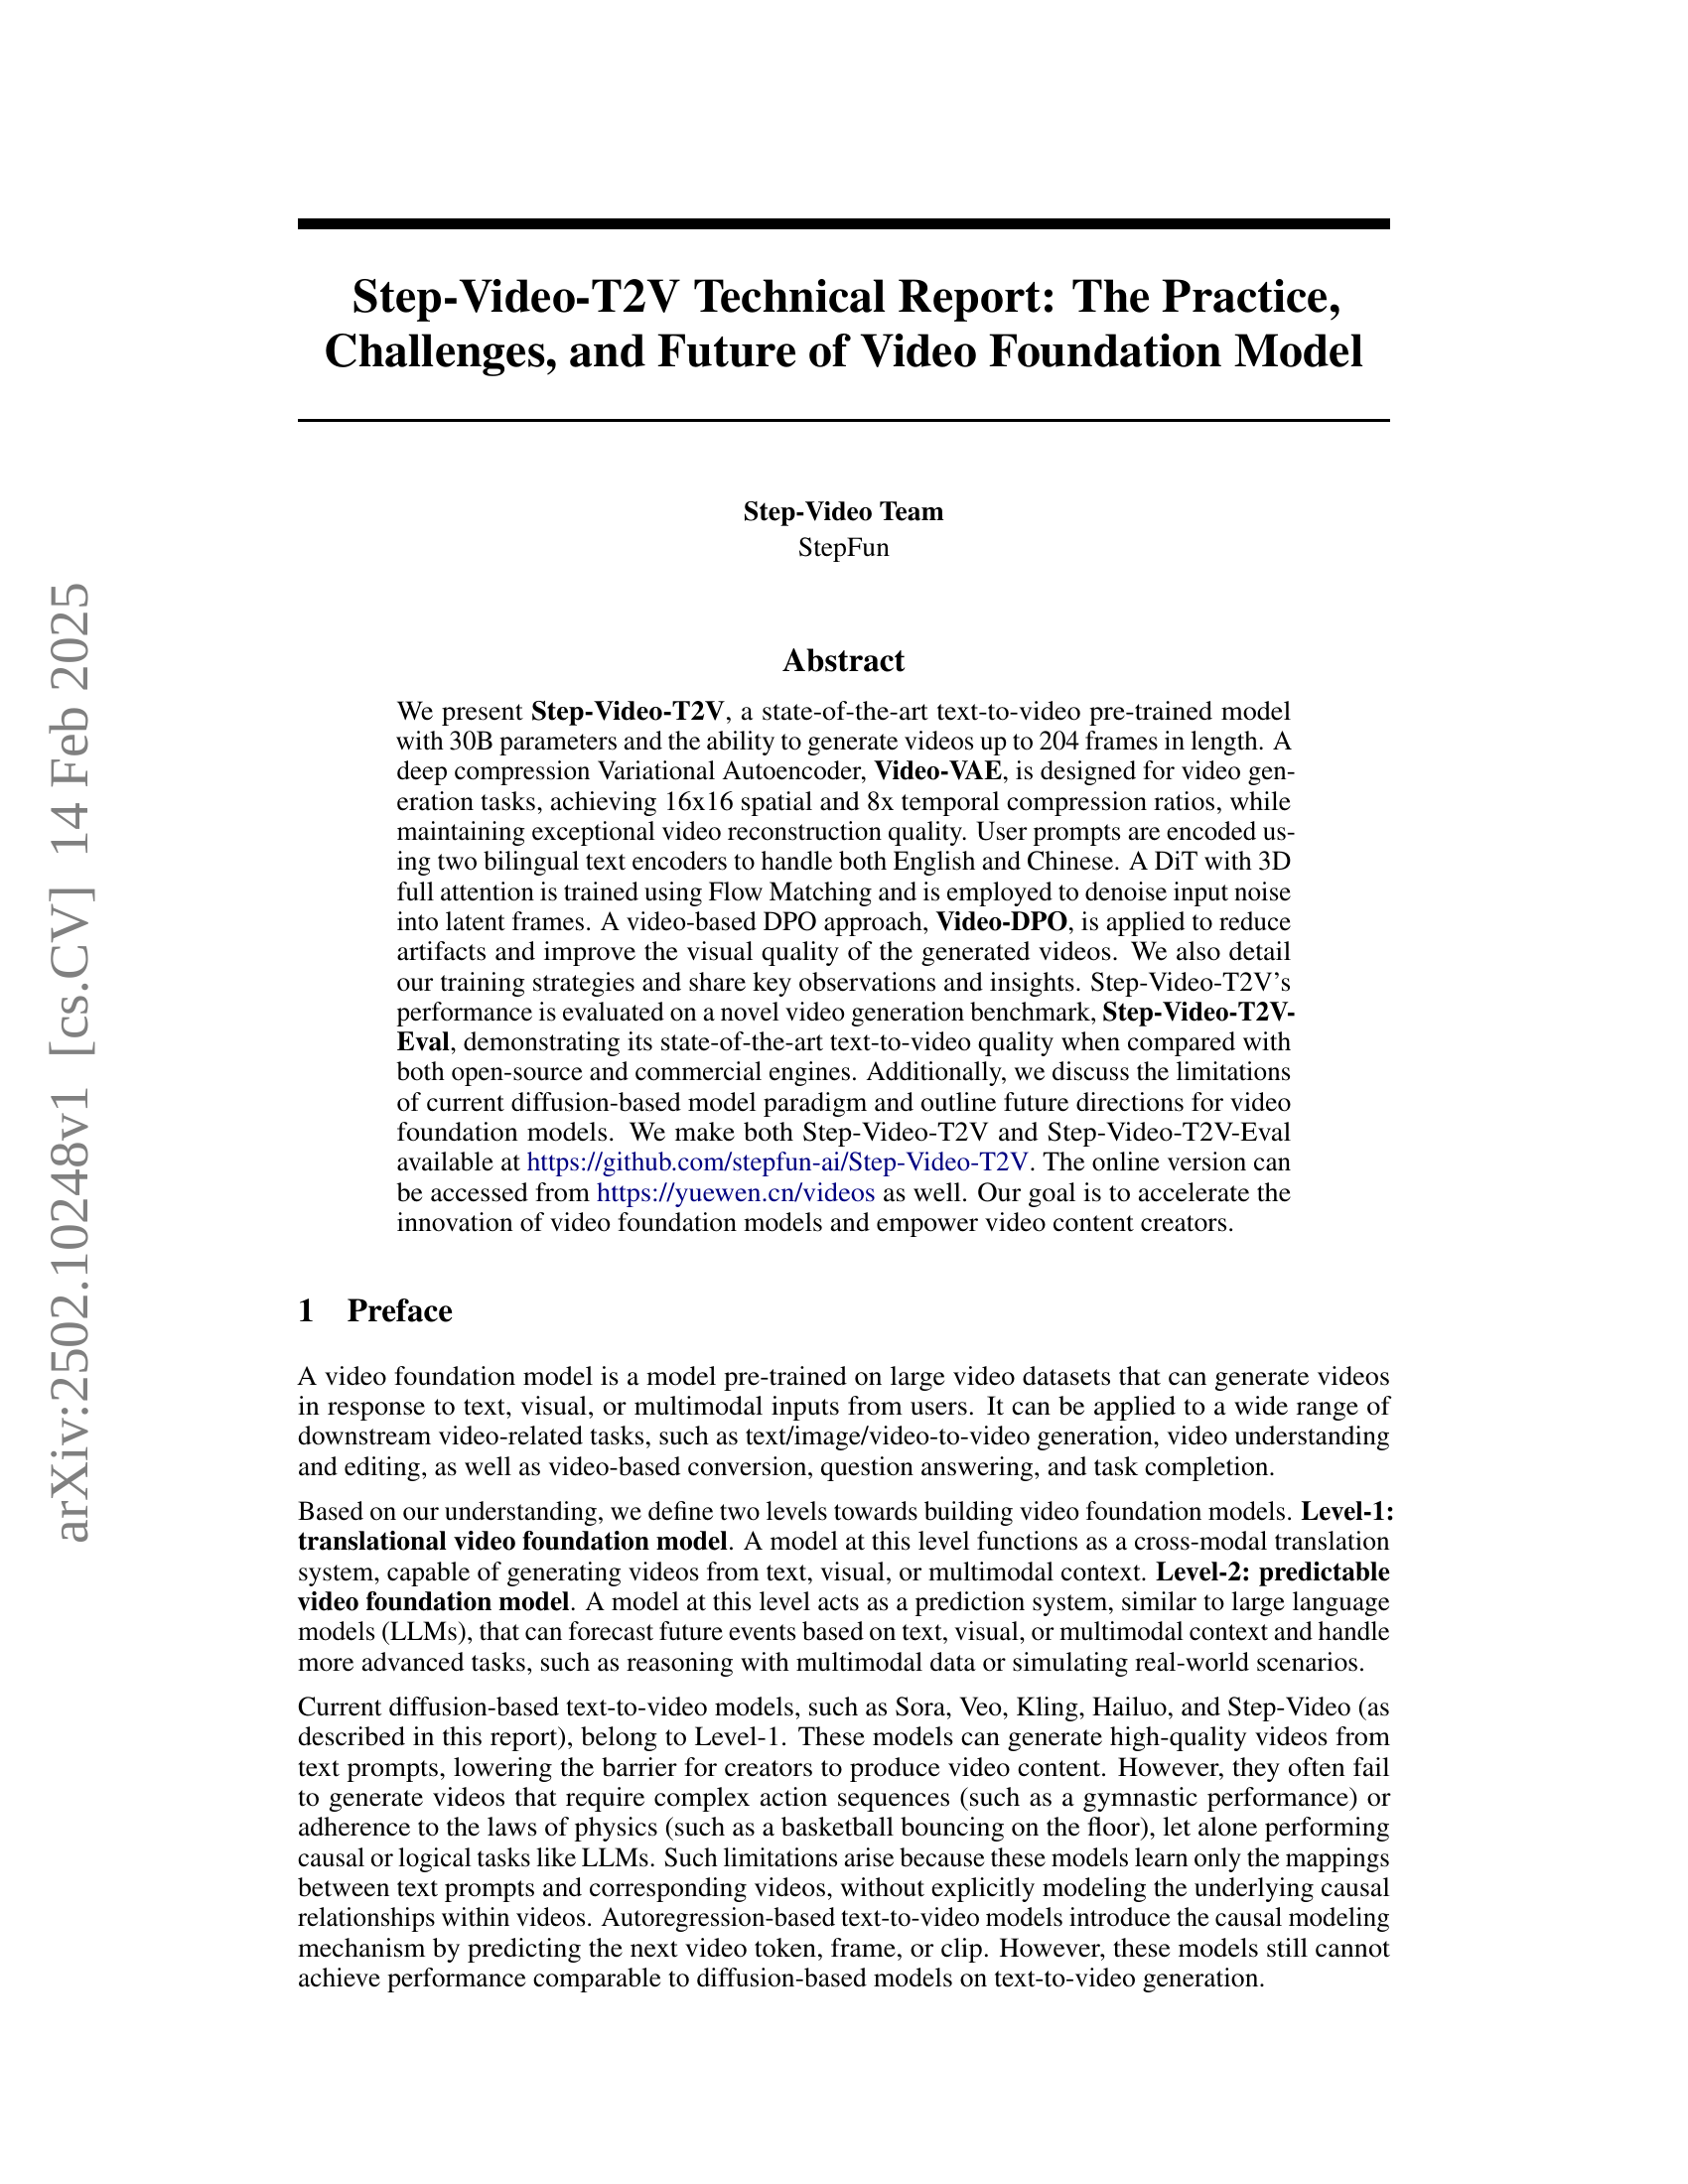
🔼 Step-Video-T2V’s architecture uses a high-compression Video-VAE to reduce computational costs while preserving video quality. This VAE achieves 16x16 spatial and 8x temporal compression. User prompts in English or Chinese are processed by two bilingual text encoders. A Diffusion Transformer (DiT) with 3D full attention, trained using Flow Matching, denoises the encoded prompts to generate latent video frames. Video-based Direct Preference Optimization (Video-DPO) refines the results, reducing artifacts and improving realism and smoothness.
read the caption
Figure 1: Architecture overview of Step-Video-T2V. Videos are represented by a high-compression Video-VAE, achieving 16x16 spatial and 8x temporal compression ratios. User prompts are encoded using two bilingual pre-trained text encoders to handle both English and Chinese. A DiT with 3D full attention is trained using Flow Matching and is employed to denoise input noise into latent frames, with text embeddings and timesteps serving as conditioning factors. To further enhance the visual quality of the generated videos, a video-based DPO approach is applied, which effectively reduces artifacts and ensures smoother, more realistic video outputs.
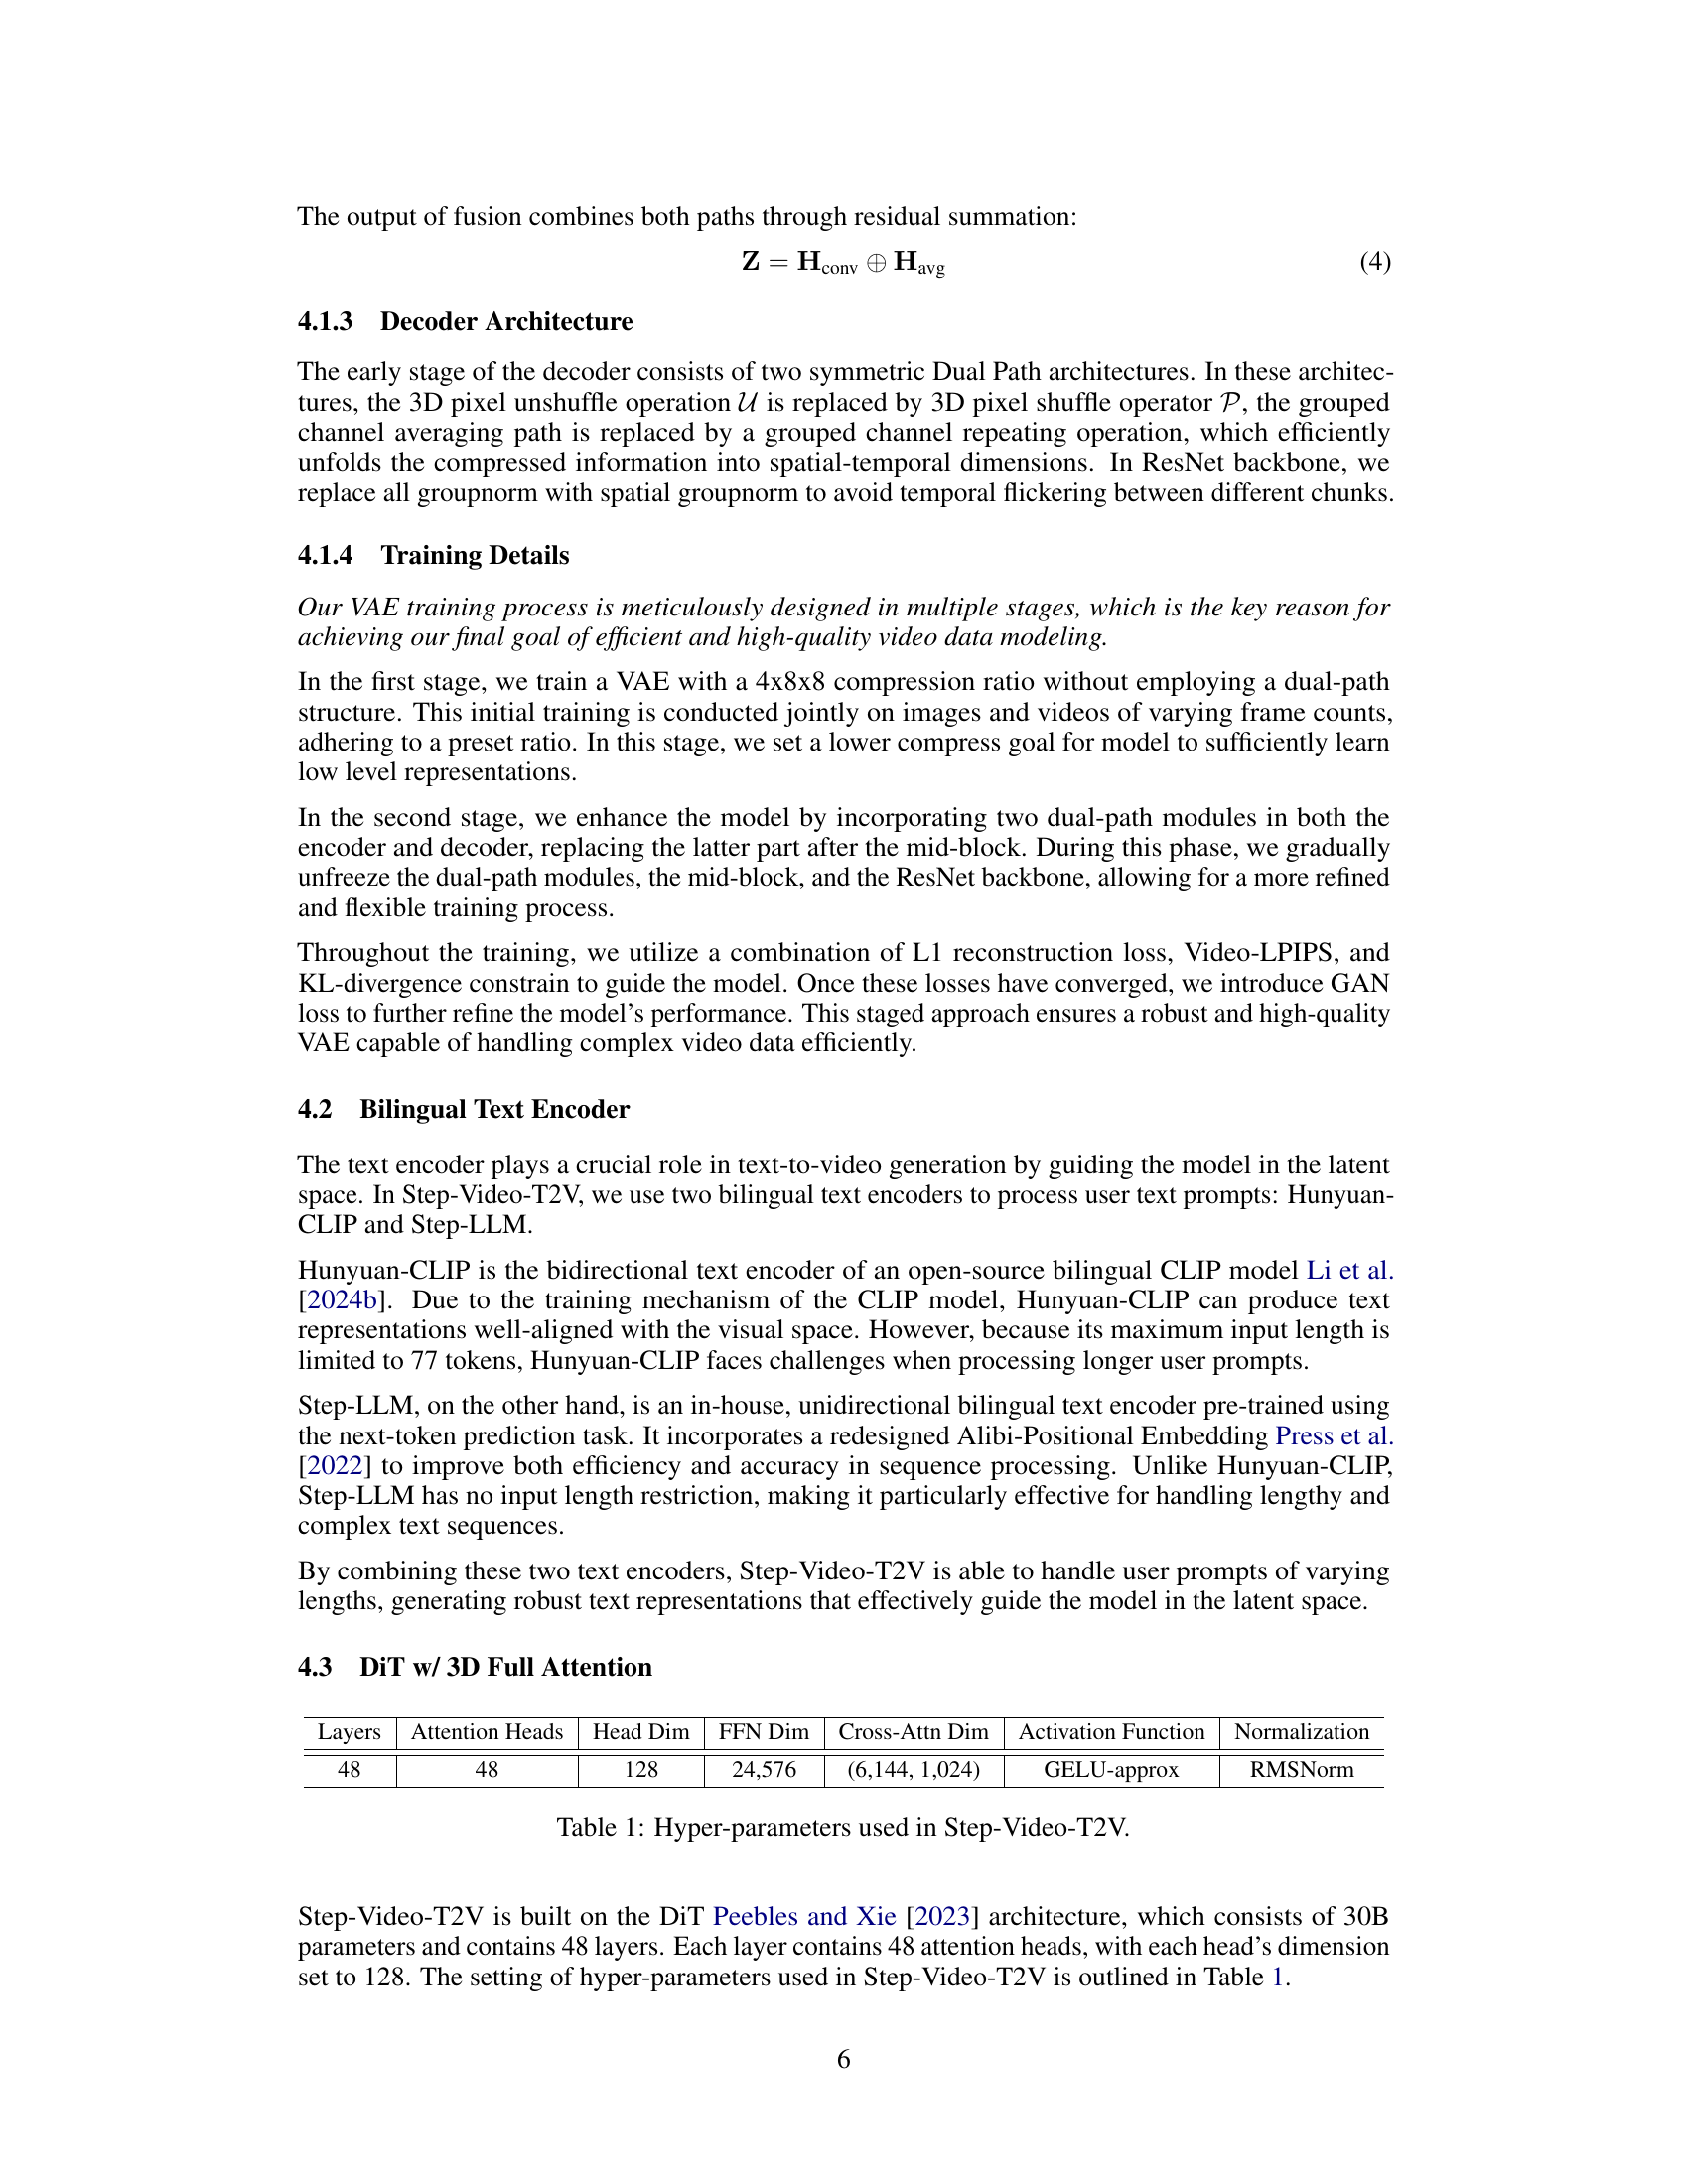
| Layers | Attention Heads | Head Dim | FFN Dim | Cross-Attn Dim | Activation Function | Normalization |
| 48 | 48 | 128 | 24,576 | (6,144, 1,024) | GELU-approx | RMSNorm |
🔼 This table details the hyperparameters used in the Step-Video-T2V model architecture. It specifies the number of layers, attention heads, dimensions of the hidden layers, feed-forward network (FFN), cross-attention, and the activation and normalization functions used within each layer.
read the caption
Table 1: Hyper-parameters used in Step-Video-T2V.
In-depth insights#
Video-T2V Practice#
The heading ‘Video-T2V Practice’ suggests a discussion on the practical implementation and application of a text-to-video model. A thoughtful analysis would delve into the model’s training process, highlighting the challenges in handling large-scale video datasets and the optimization techniques employed to mitigate computational costs. Crucially, it should examine the model’s performance on various benchmarks and its ability to generate high-quality, diverse videos, with an emphasis on assessing visual quality, motion smoothness, and adherence to user prompts. It’s important to also discuss limitations, such as the model’s capacity to handle complex action sequences or scenarios that require understanding physics, and the need for better methods to evaluate video quality, potentially going beyond simple metrics and incorporating human perception. Finally, a section on ‘practice’ should address real-world deployment and any considerations for optimizing its use in specific applications, potentially mentioning areas of successful implementation and ongoing research.
Compression VAE#
A compression Variational Autoencoder (VAE) is a crucial component for efficient video generation, particularly when dealing with high-resolution videos and long sequences. The core idea is to reduce the dimensionality of the video data while preserving essential information. This is achieved by encoding the video into a lower-dimensional latent space and then decoding it back. A well-designed compression VAE significantly reduces computational complexity, enabling training and inference of large-scale video models that would otherwise be infeasible. The compression ratios achieved are often expressed in terms of spatial and temporal reductions; higher ratios indicate greater compression but potentially more information loss. Therefore, a major challenge is to achieve high compression ratios while maintaining high reconstruction quality. This requires careful design of the encoder and decoder architectures and potentially the use of advanced techniques such as attention mechanisms or specialized convolutional layers. The effectiveness of a compression VAE is usually evaluated by quantitative metrics like PSNR, SSIM, and perceptual metrics like LPIPS or Fréchet Inception Distance (FID), all of which assess the similarity between the original video and the reconstructed one. The choice of architecture and optimization strategies is crucial in balancing compression and reconstruction quality, impacting both computational efficiency and the overall quality of generated videos. A good compression VAE is a critical enabler for efficient and high-quality video generation, forming a foundation for more advanced models.
DPO for Video#
Direct Preference Optimization (DPO) presents a compelling approach for enhancing video generation models by incorporating human feedback. Instead of relying solely on automated metrics, DPO leverages human preferences to guide the model’s learning process. This allows for a more nuanced and accurate refinement of generated video quality. The process typically involves generating multiple videos for the same prompt and having human annotators rate their preference. This feedback is then used to adjust the model’s parameters to favor the generation of preferred videos. A key advantage of DPO is its relatively simple implementation, making it a more accessible method compared to other reinforcement learning techniques. However, challenges remain in efficiently collecting and utilizing human feedback, particularly for high-resolution or long-duration videos. The scalability of DPO for large-scale video datasets also needs to be carefully considered. Further research is needed to refine DPO methods, perhaps exploring ways to reduce human annotation requirements, or incorporating more sophisticated reward models to learn effectively from limited feedback. Ultimately, DPO techniques hold significant promise for improving the overall quality and user satisfaction of video generation models.
Future Directions#
Future research directions in video foundation models should prioritize several key areas. Improving the understanding of causal relationships within videos is crucial, moving beyond simple mappings between text and video to models that explicitly represent temporal dependencies and physical laws. This will likely involve exploring autoregressive models or hybrid approaches combining autoregressive and diffusion methods. Addressing the limitations of current diffusion-based models such as difficulty with complex action sequences or adherence to physics is another critical direction. Developing more effective methods for incorporating human feedback is vital, ideally reducing reliance on time-consuming and expensive manual annotation. Reinforcement learning methods offer a promising avenue here. Finally, efficient training and inference strategies are essential, considering the massive computational resources required for these models, focusing on innovative compression techniques and optimized architectures. Advancements in these areas will be instrumental in developing truly versatile and powerful video foundation models capable of handling a wide range of complex tasks.
Model Limitations#
This research paper does not include a section explicitly titled ‘Model Limitations’. However, based on the content of the provided text, several limitations of the Step-Video-T2V model can be inferred. The model’s performance is heavily reliant on high-quality training data. Generating high-quality videos requires substantial resources and specialized expertise for data curation and labeling. The model exhibits difficulties generating videos requiring complex action sequences or adherence to the laws of physics, a limitation inherent to current diffusion-based models. Further, the model’s handling of multiple concepts within a single video remains imperfect, sometimes leading to incomplete or inaccurate results. Finally, current implementations show constraints in handling longer duration videos and generating high-resolution outputs. Addressing these limitations would require improvements in data curation, the model architecture, and potentially novel training strategies. Future work could focus on incorporating more complex causal models into the architecture, utilizing improved data representation techniques, or exploring different training paradigms to enhance performance in specific aspects such as action generation and physical plausibility. These improvements will be crucial in developing a truly comprehensive and versatile video foundation model.
More visual insights#
More on figures

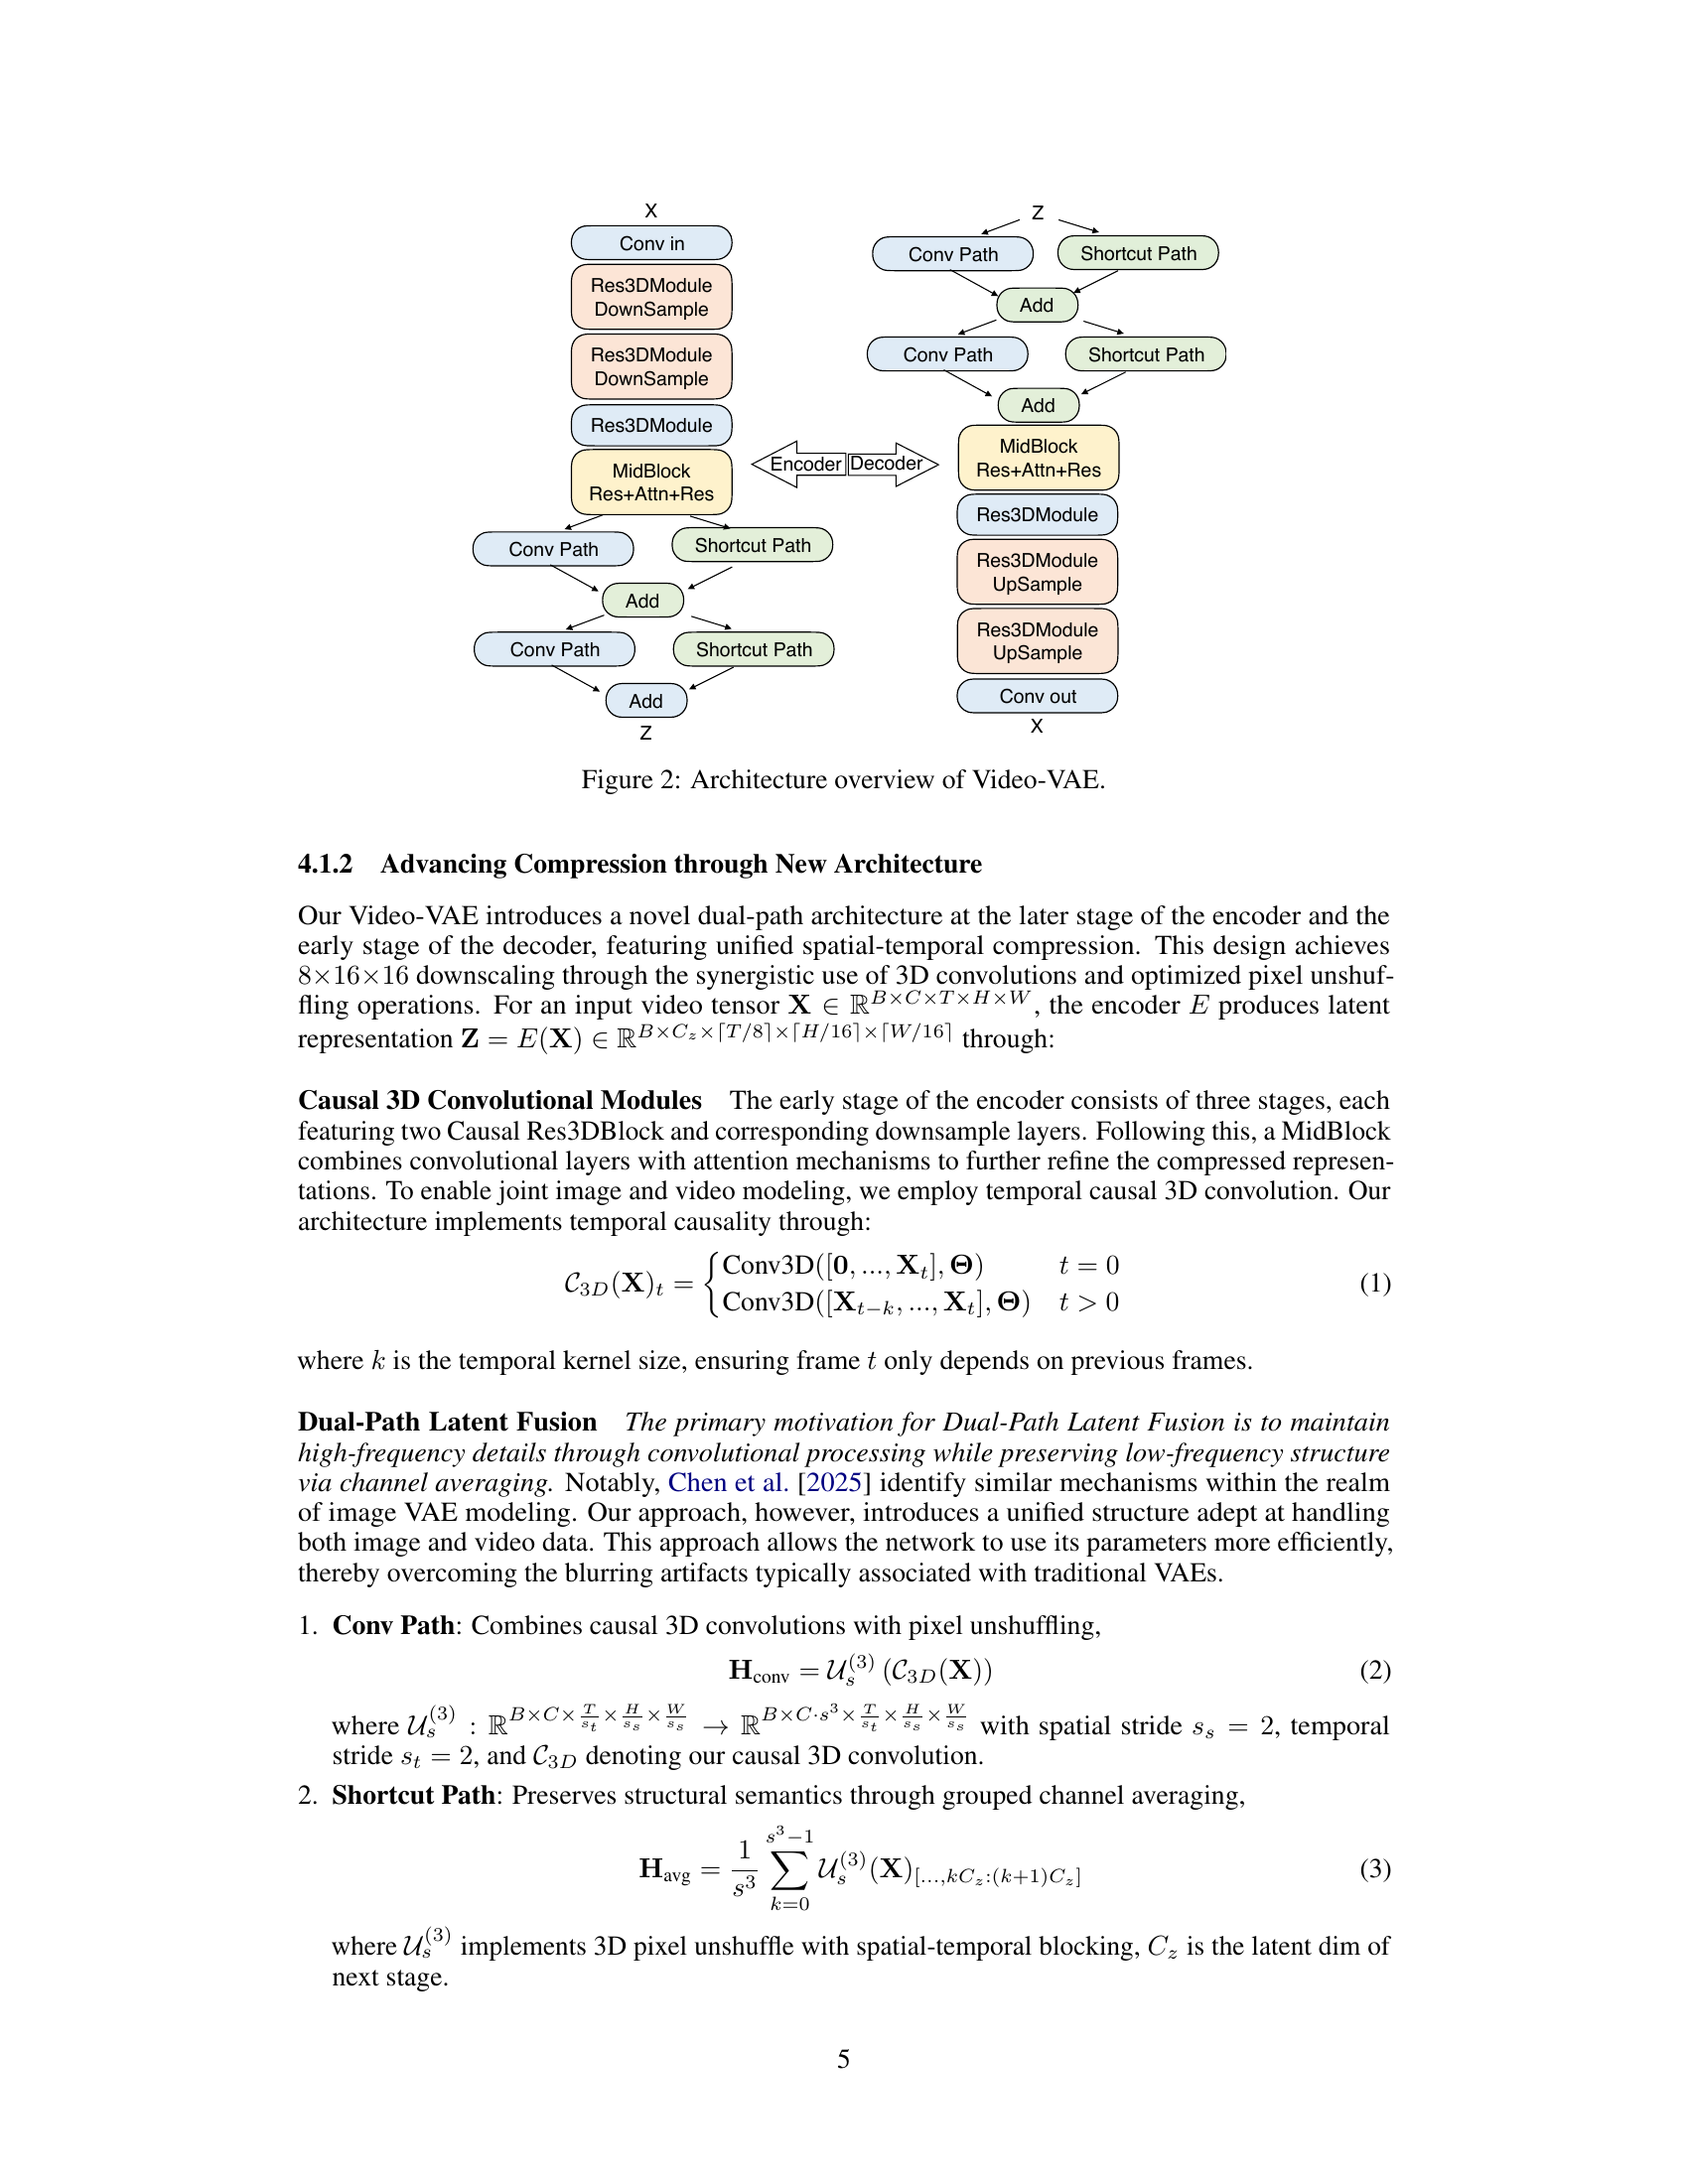
🔼 This figure provides a detailed illustration of the Video-VAE architecture, a crucial component of the Step-Video-T2V model. It showcases the encoder and decoder pathways, highlighting the dual-path architecture employed for efficient compression and reconstruction of video data. Specific components such as convolutional modules, Res3DModules, and downsampling/upsampling operations are clearly depicted, allowing for a comprehensive understanding of the Video-VAE’s mechanisms for compressing videos into latent space representations and reconstructing them back into their original format.
read the caption
Figure 2: Architecture overview of Video-VAE.

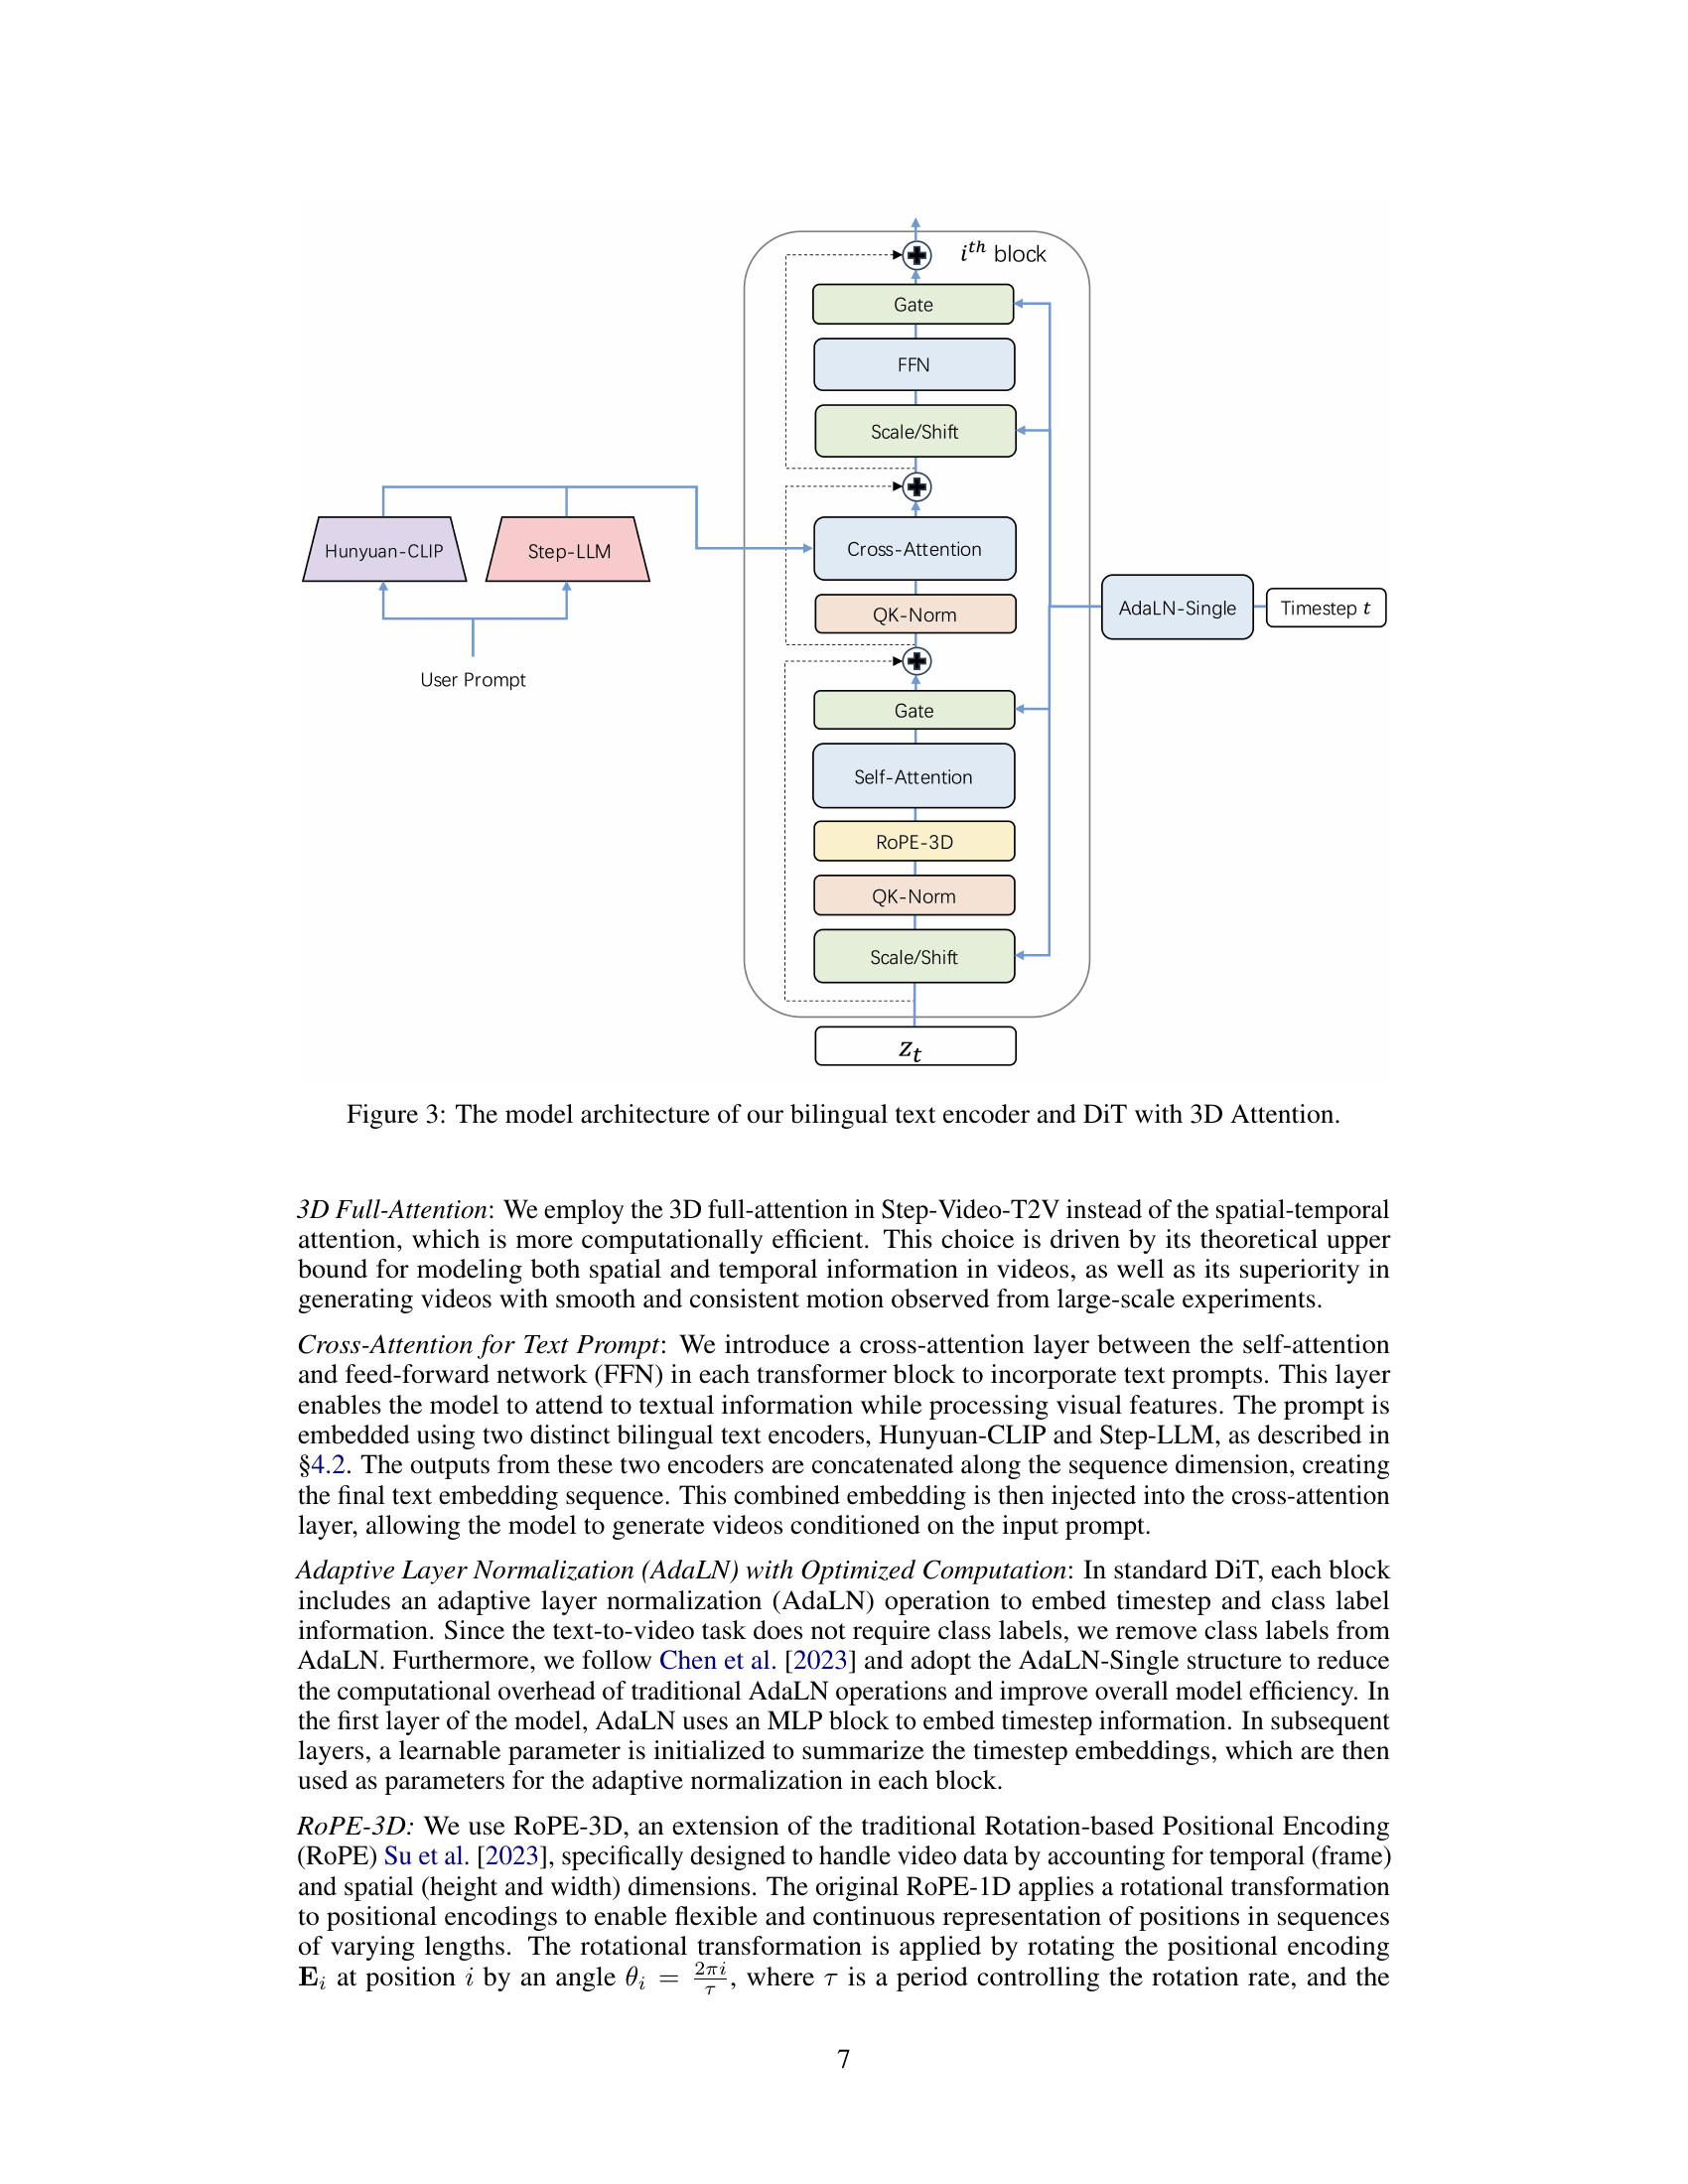
🔼 This figure details the architecture of the Step-Video-T2V model’s text encoder and the Diffusion Transformer (DiT) with 3D attention. The text encoder is bilingual, processing both English and Chinese prompts using Hunyuan-CLIP and Step-LLM. The DiT incorporates a cross-attention layer to integrate text embeddings with visual features, utilizes 3D full attention for efficient spatial and temporal modeling, and employs adaptive layer normalization (AdaLN) with optimized computation and ROPE-3D positional encoding.
read the caption
Figure 3: The model architecture of our bilingual text encoder and DiT with 3D Attention.

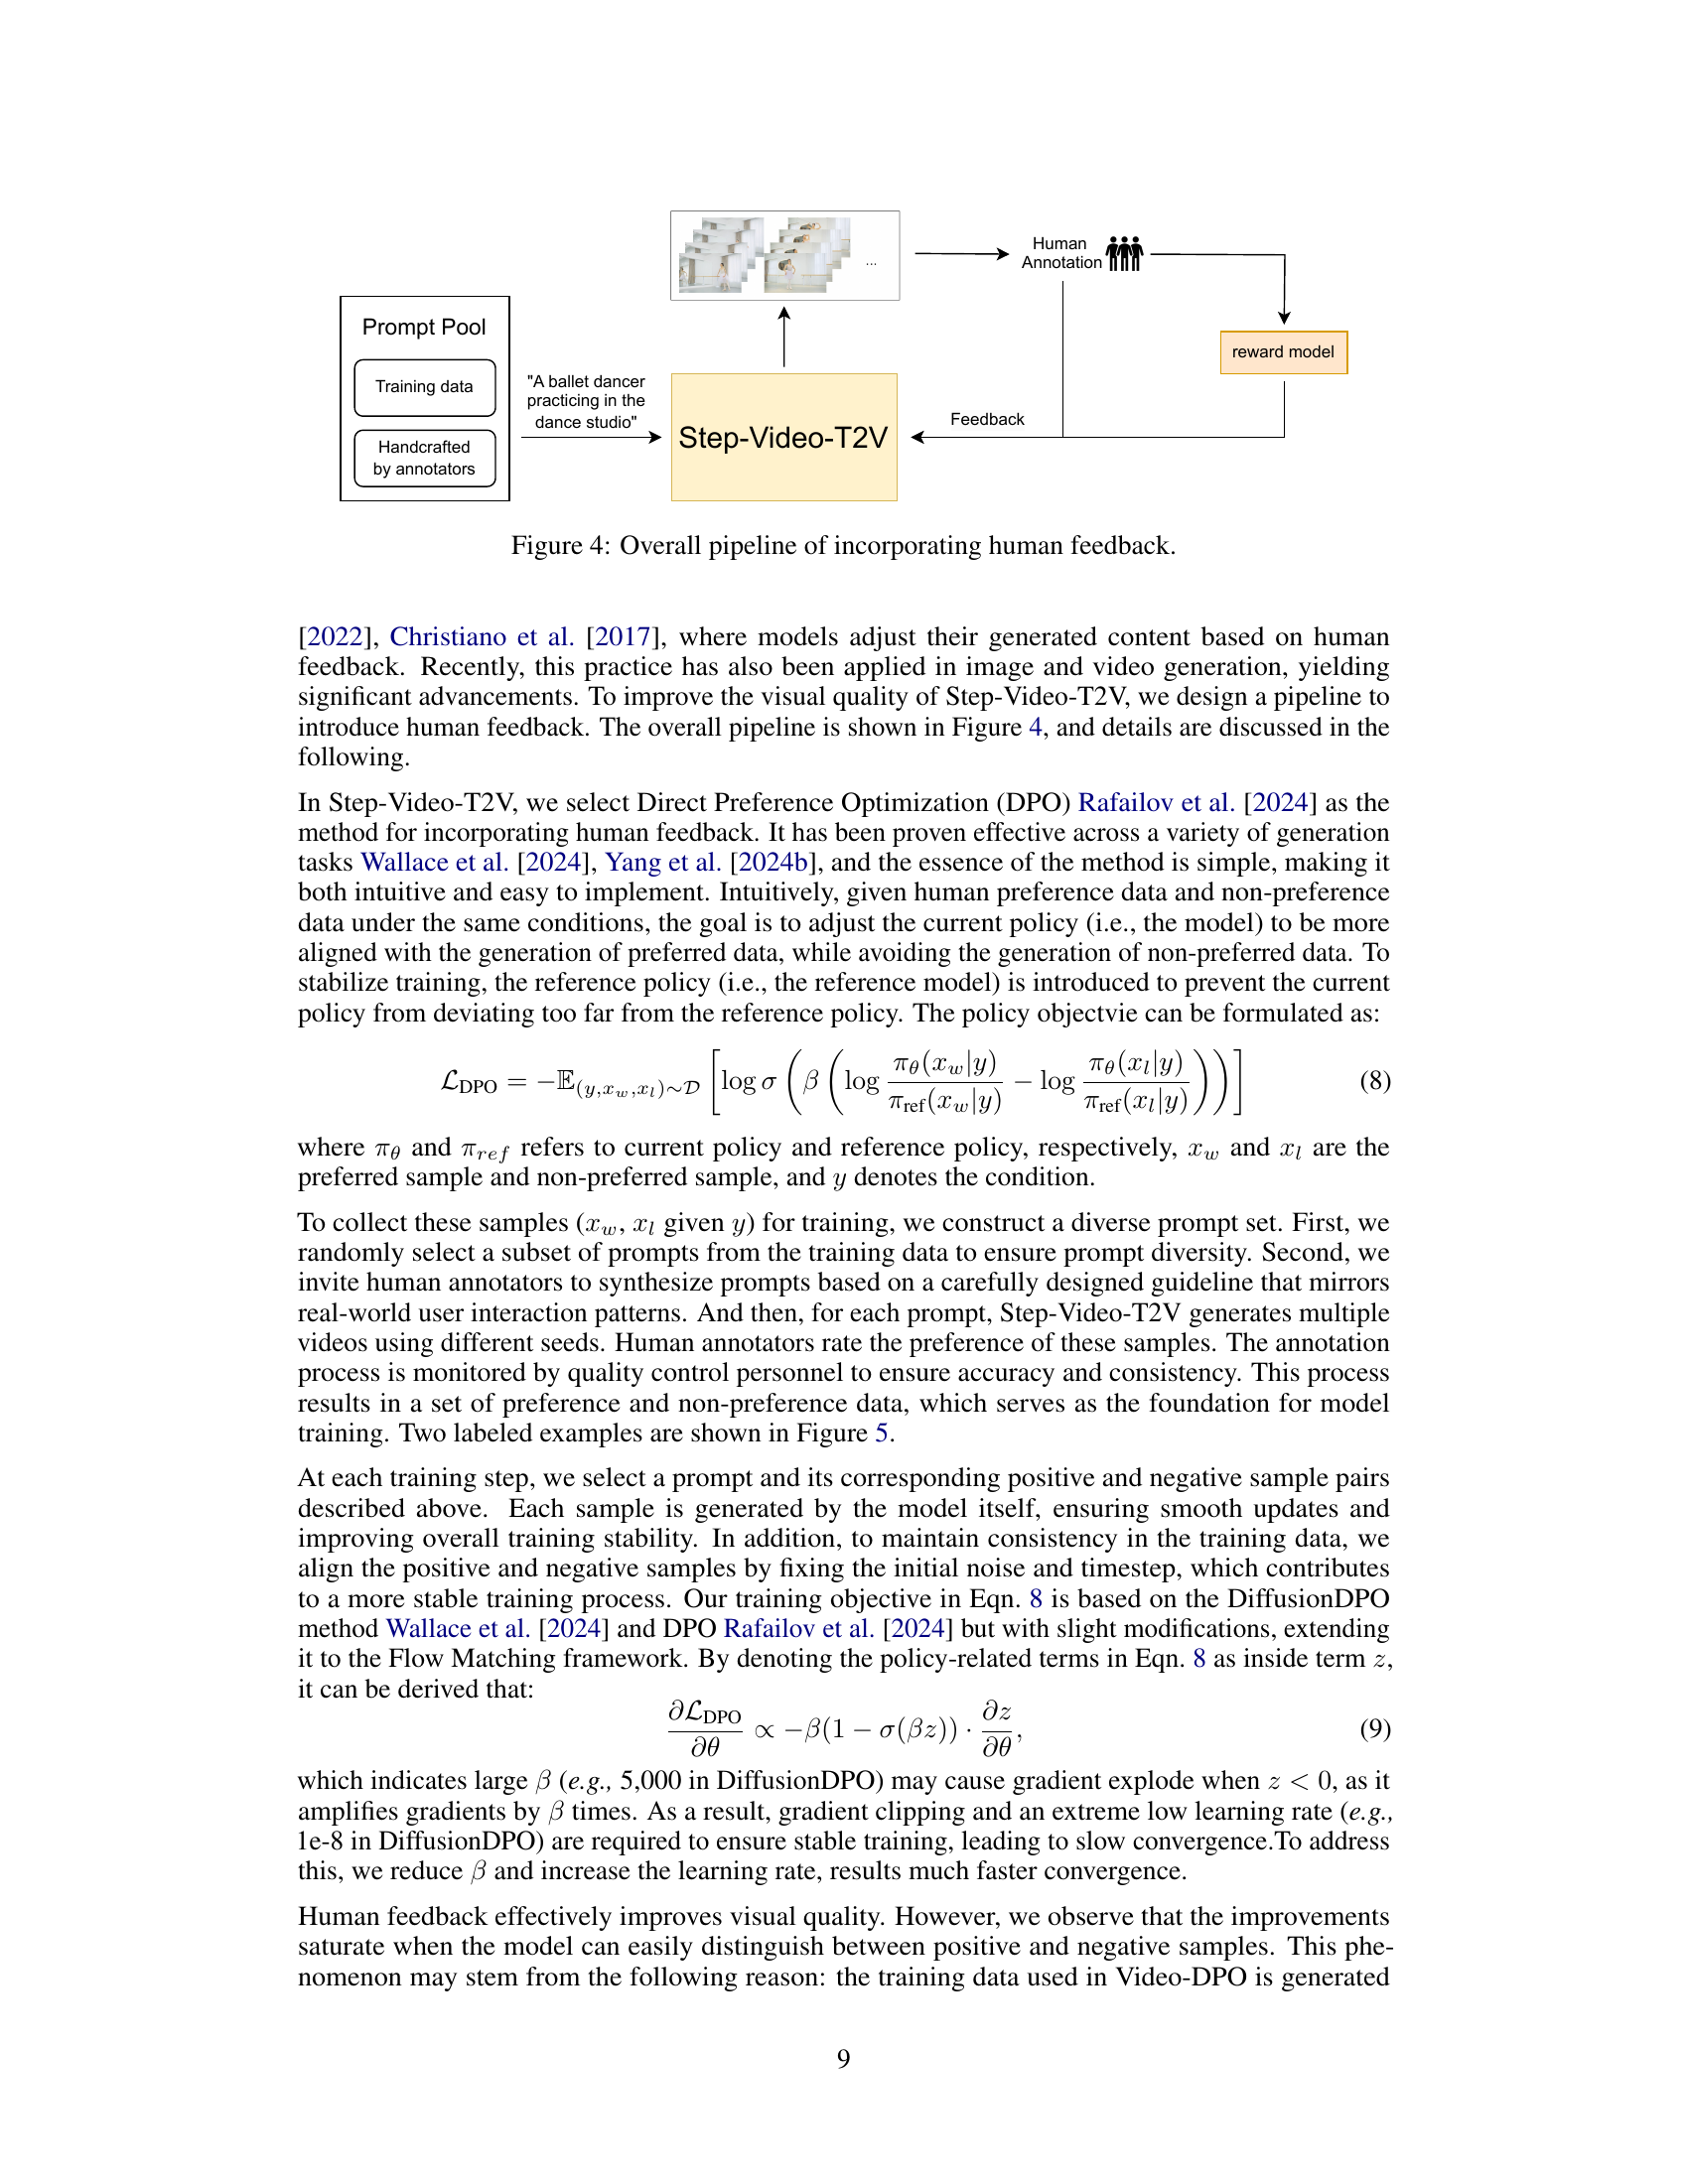
🔼 This figure illustrates the process of integrating human feedback into the Step-Video-T2V model to improve the visual quality of generated videos. It shows the pipeline, beginning with a pool of prompts that are used to generate videos. These videos are then rated by human annotators using a reward model, providing feedback on which videos are preferred and which are not. This feedback is then used to fine-tune the Step-Video-T2V model, resulting in higher quality video outputs. The reward model is trained using labeled data consisting of both positive and negative example videos for various prompts. The final output is a refined Step-Video-T2V model that generates improved videos based on human preferences.
read the caption
Figure 4: Overall pipeline of incorporating human feedback.

🔼 This figure shows two examples of video generation results from the Step-Video-T2V model using the same prompt: ‘A ballet dancer practicing in the dance studio’. Image (a) represents a non-preferred generation, highlighting common issues like artifacts or inconsistencies in the dancer’s movements and pose. Image (b) shows a preferred generation, demonstrating improved realism, fluidity of motion, and overall visual quality.
read the caption
Figure 5: We generate different samples with same prompt ('A ballet dancer practicing in the dance studio' in this case), and annotate these samples as non-preferred (a) or preferred (b).

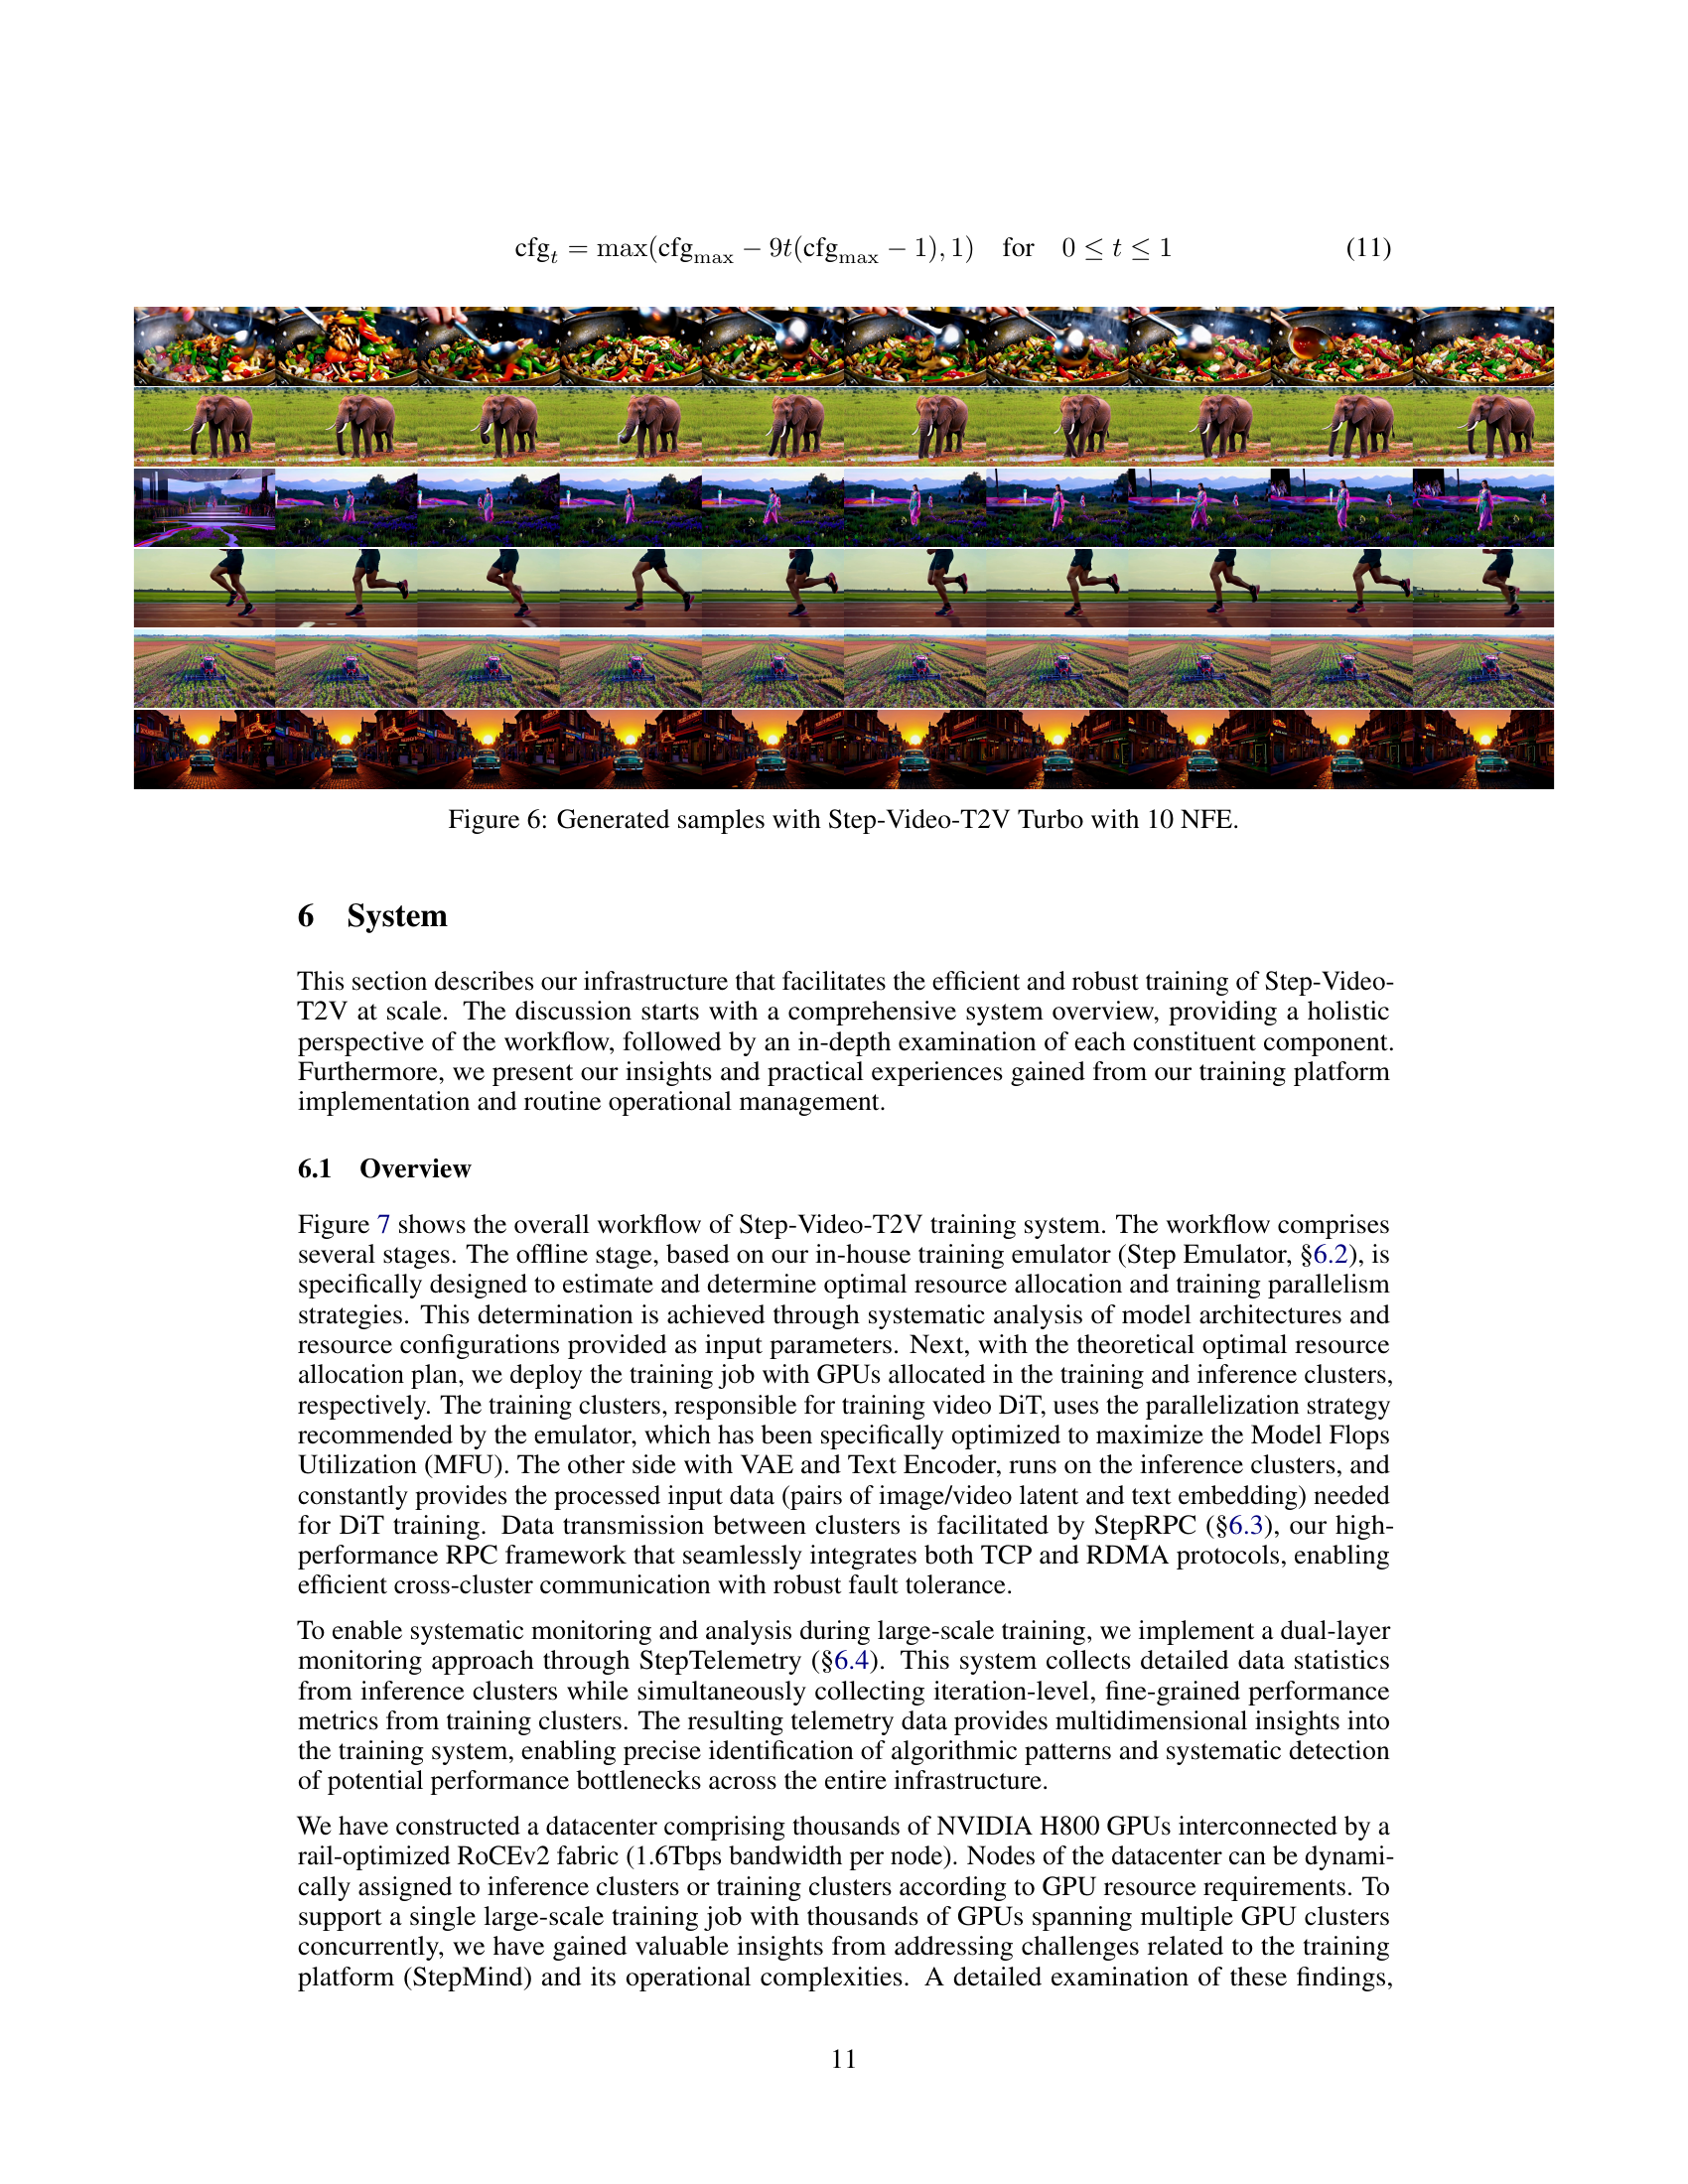
🔼 This figure showcases sample video frames generated using the Step-Video-T2V Turbo model. The key point highlighted is that these high-quality videos were generated with only 10 noise-to-image diffusion steps (NFE). This demonstrates the effectiveness of the model’s distillation process for improving computational efficiency during inference while maintaining visual quality.
read the caption
Figure 6: Generated samples with Step-Video-T2V Turbo with 10 NFE.

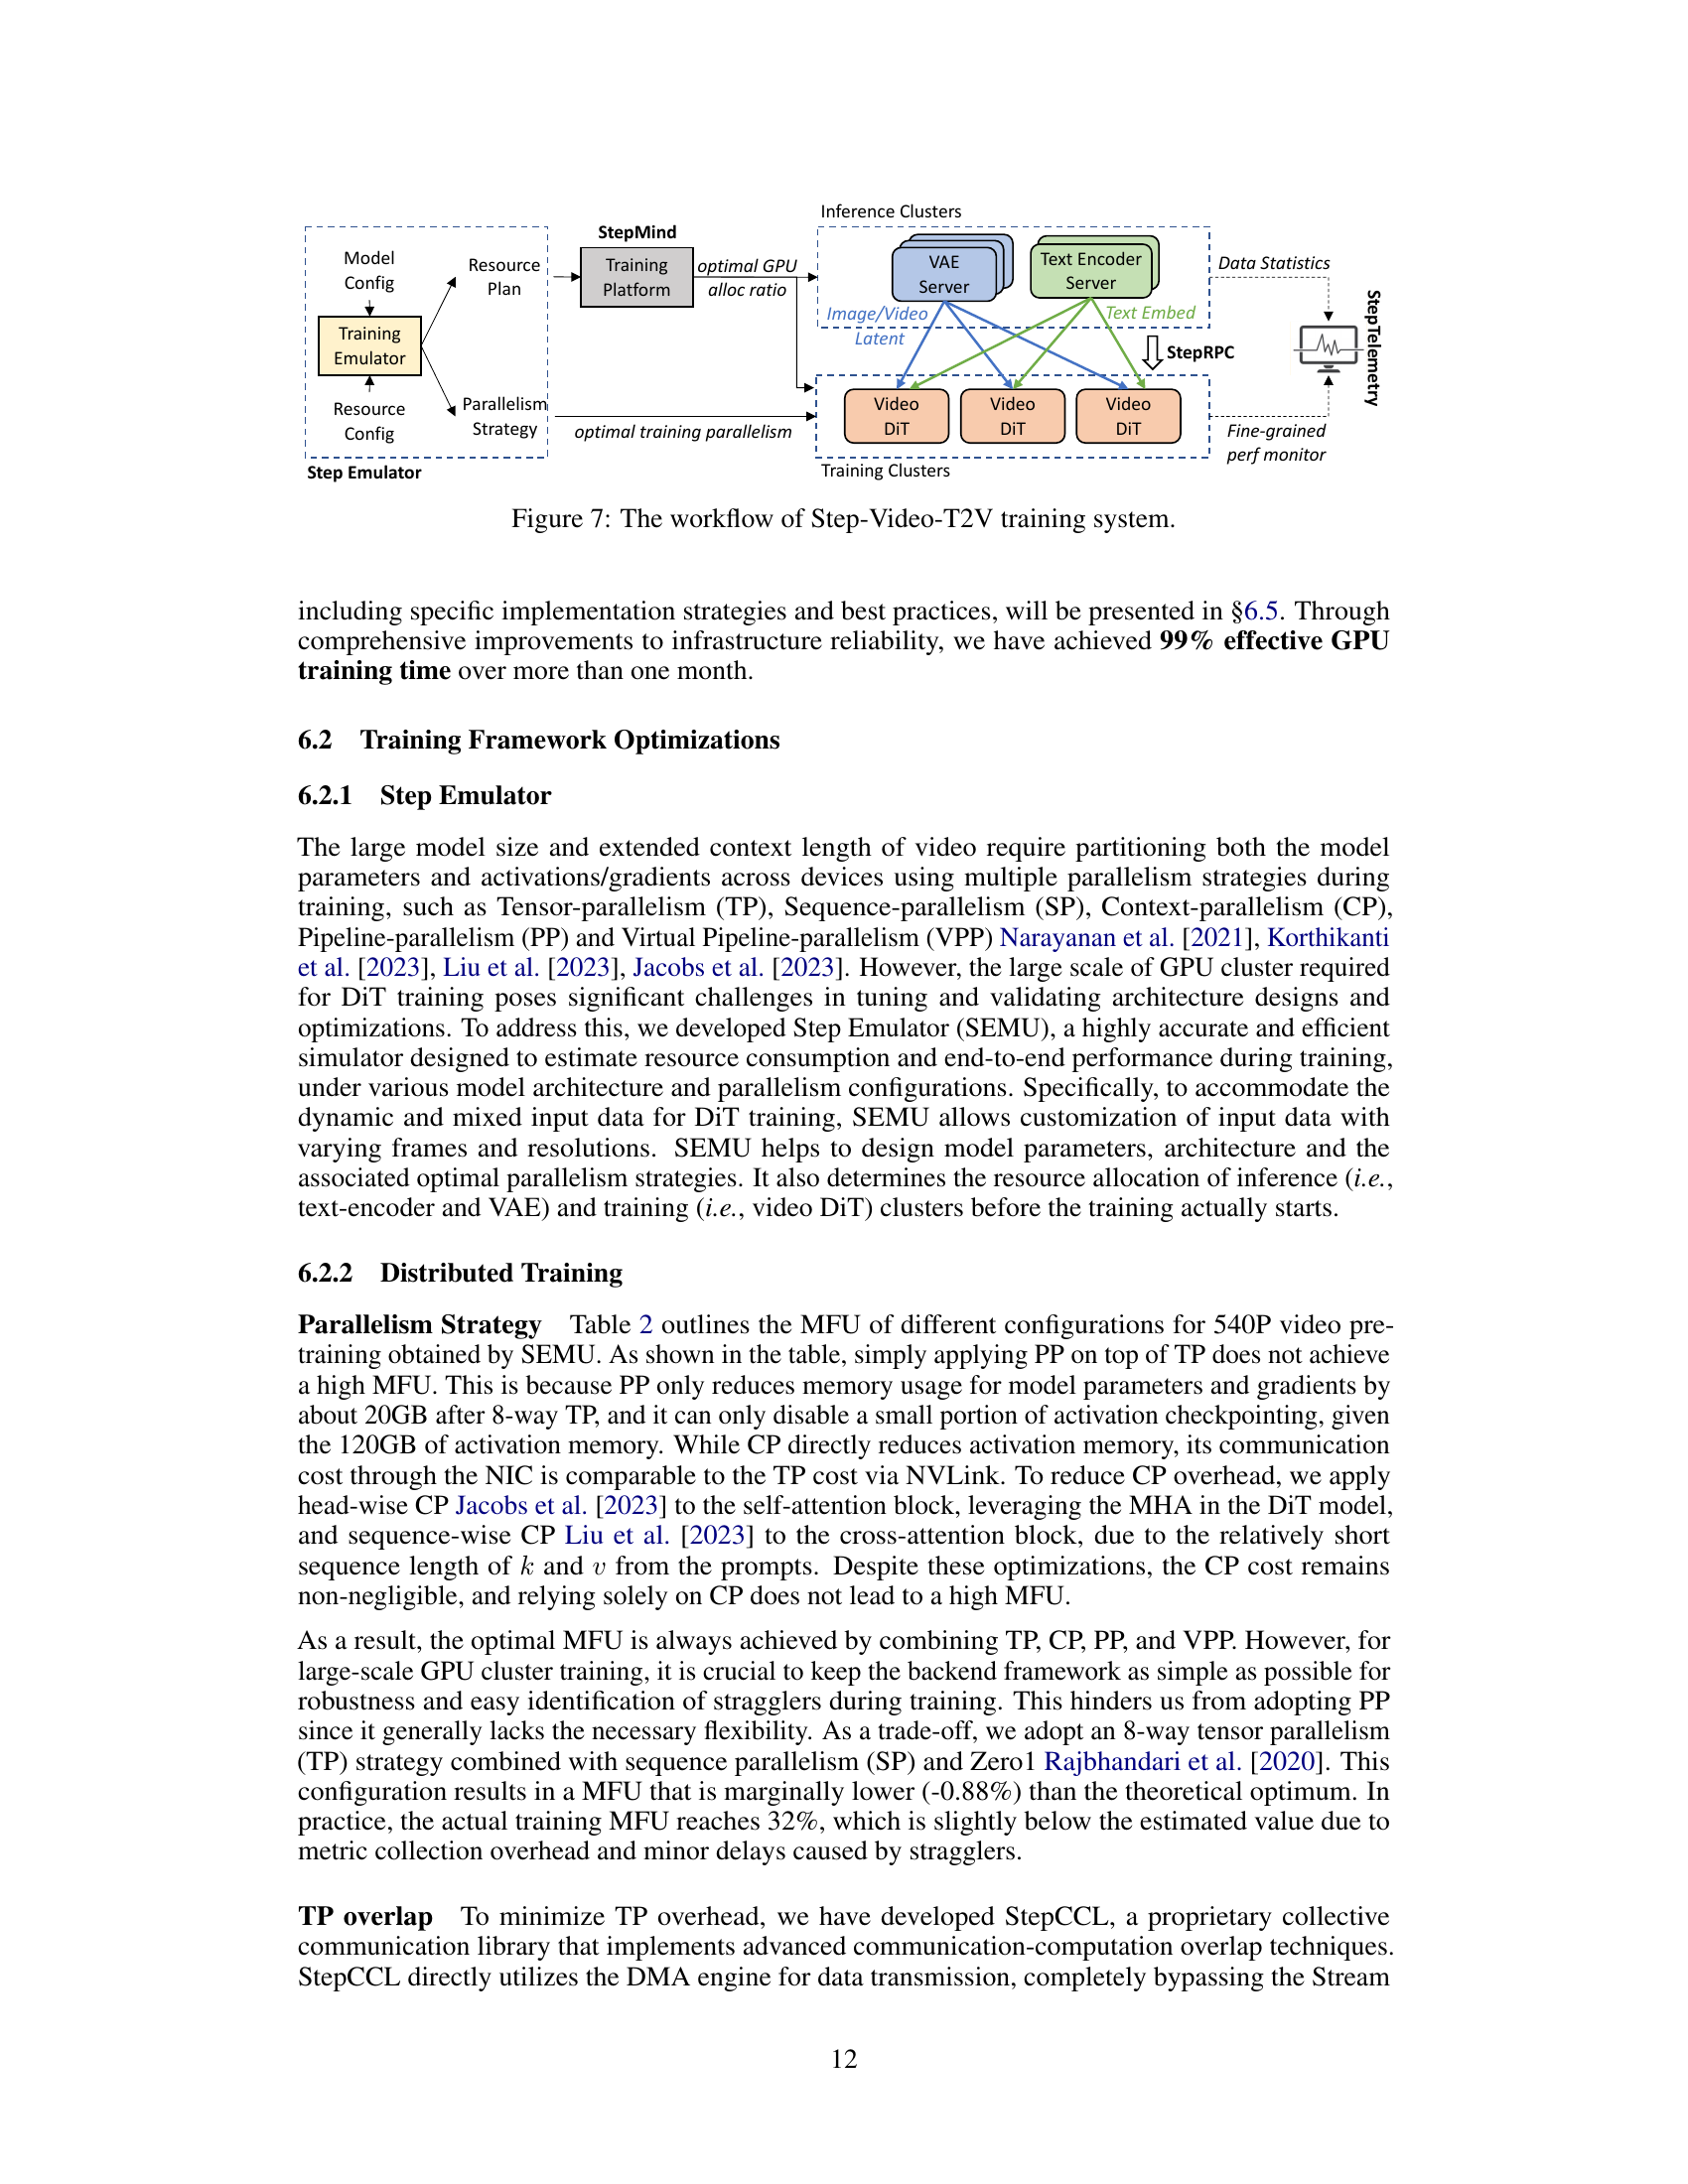
🔼 This figure illustrates the Step-Video-T2V training system’s workflow, which involves offline and online stages. The offline stage uses a training emulator to determine the optimal resource allocation and training parallelism strategy. This plan is then used in the online stage where the training job is deployed across two clusters: training clusters (for the video DiT) and inference clusters (for VAE and Text Encoder). StepRPC, a high-performance RPC framework, ensures efficient communication between these clusters. StepTelemetry provides multi-dimensional system monitoring and analysis capabilities, which are crucial for identifying potential bottlenecks and failures. The workflow is designed to improve training efficiency and robustness.
read the caption
Figure 7: The workflow of Step-Video-T2V training system.

🔼 This figure illustrates the Step-Video-T2V system’s hybrid approach to load balancing during training. The system addresses computational imbalances caused by training on videos and images with varying resolutions. A two-stage process is used: 1) Coarse-grained balancing: Batch sizes are adjusted for different resolutions to achieve rough FLOP (floating point operations) parity across batches. 2) Fine-grained balancing: Image padding is dynamically added to batches to compensate for any residual FLOP differences, ensuring optimal GPU utilization.
read the caption
Figure 8: Load balancing with hybrid granularity.

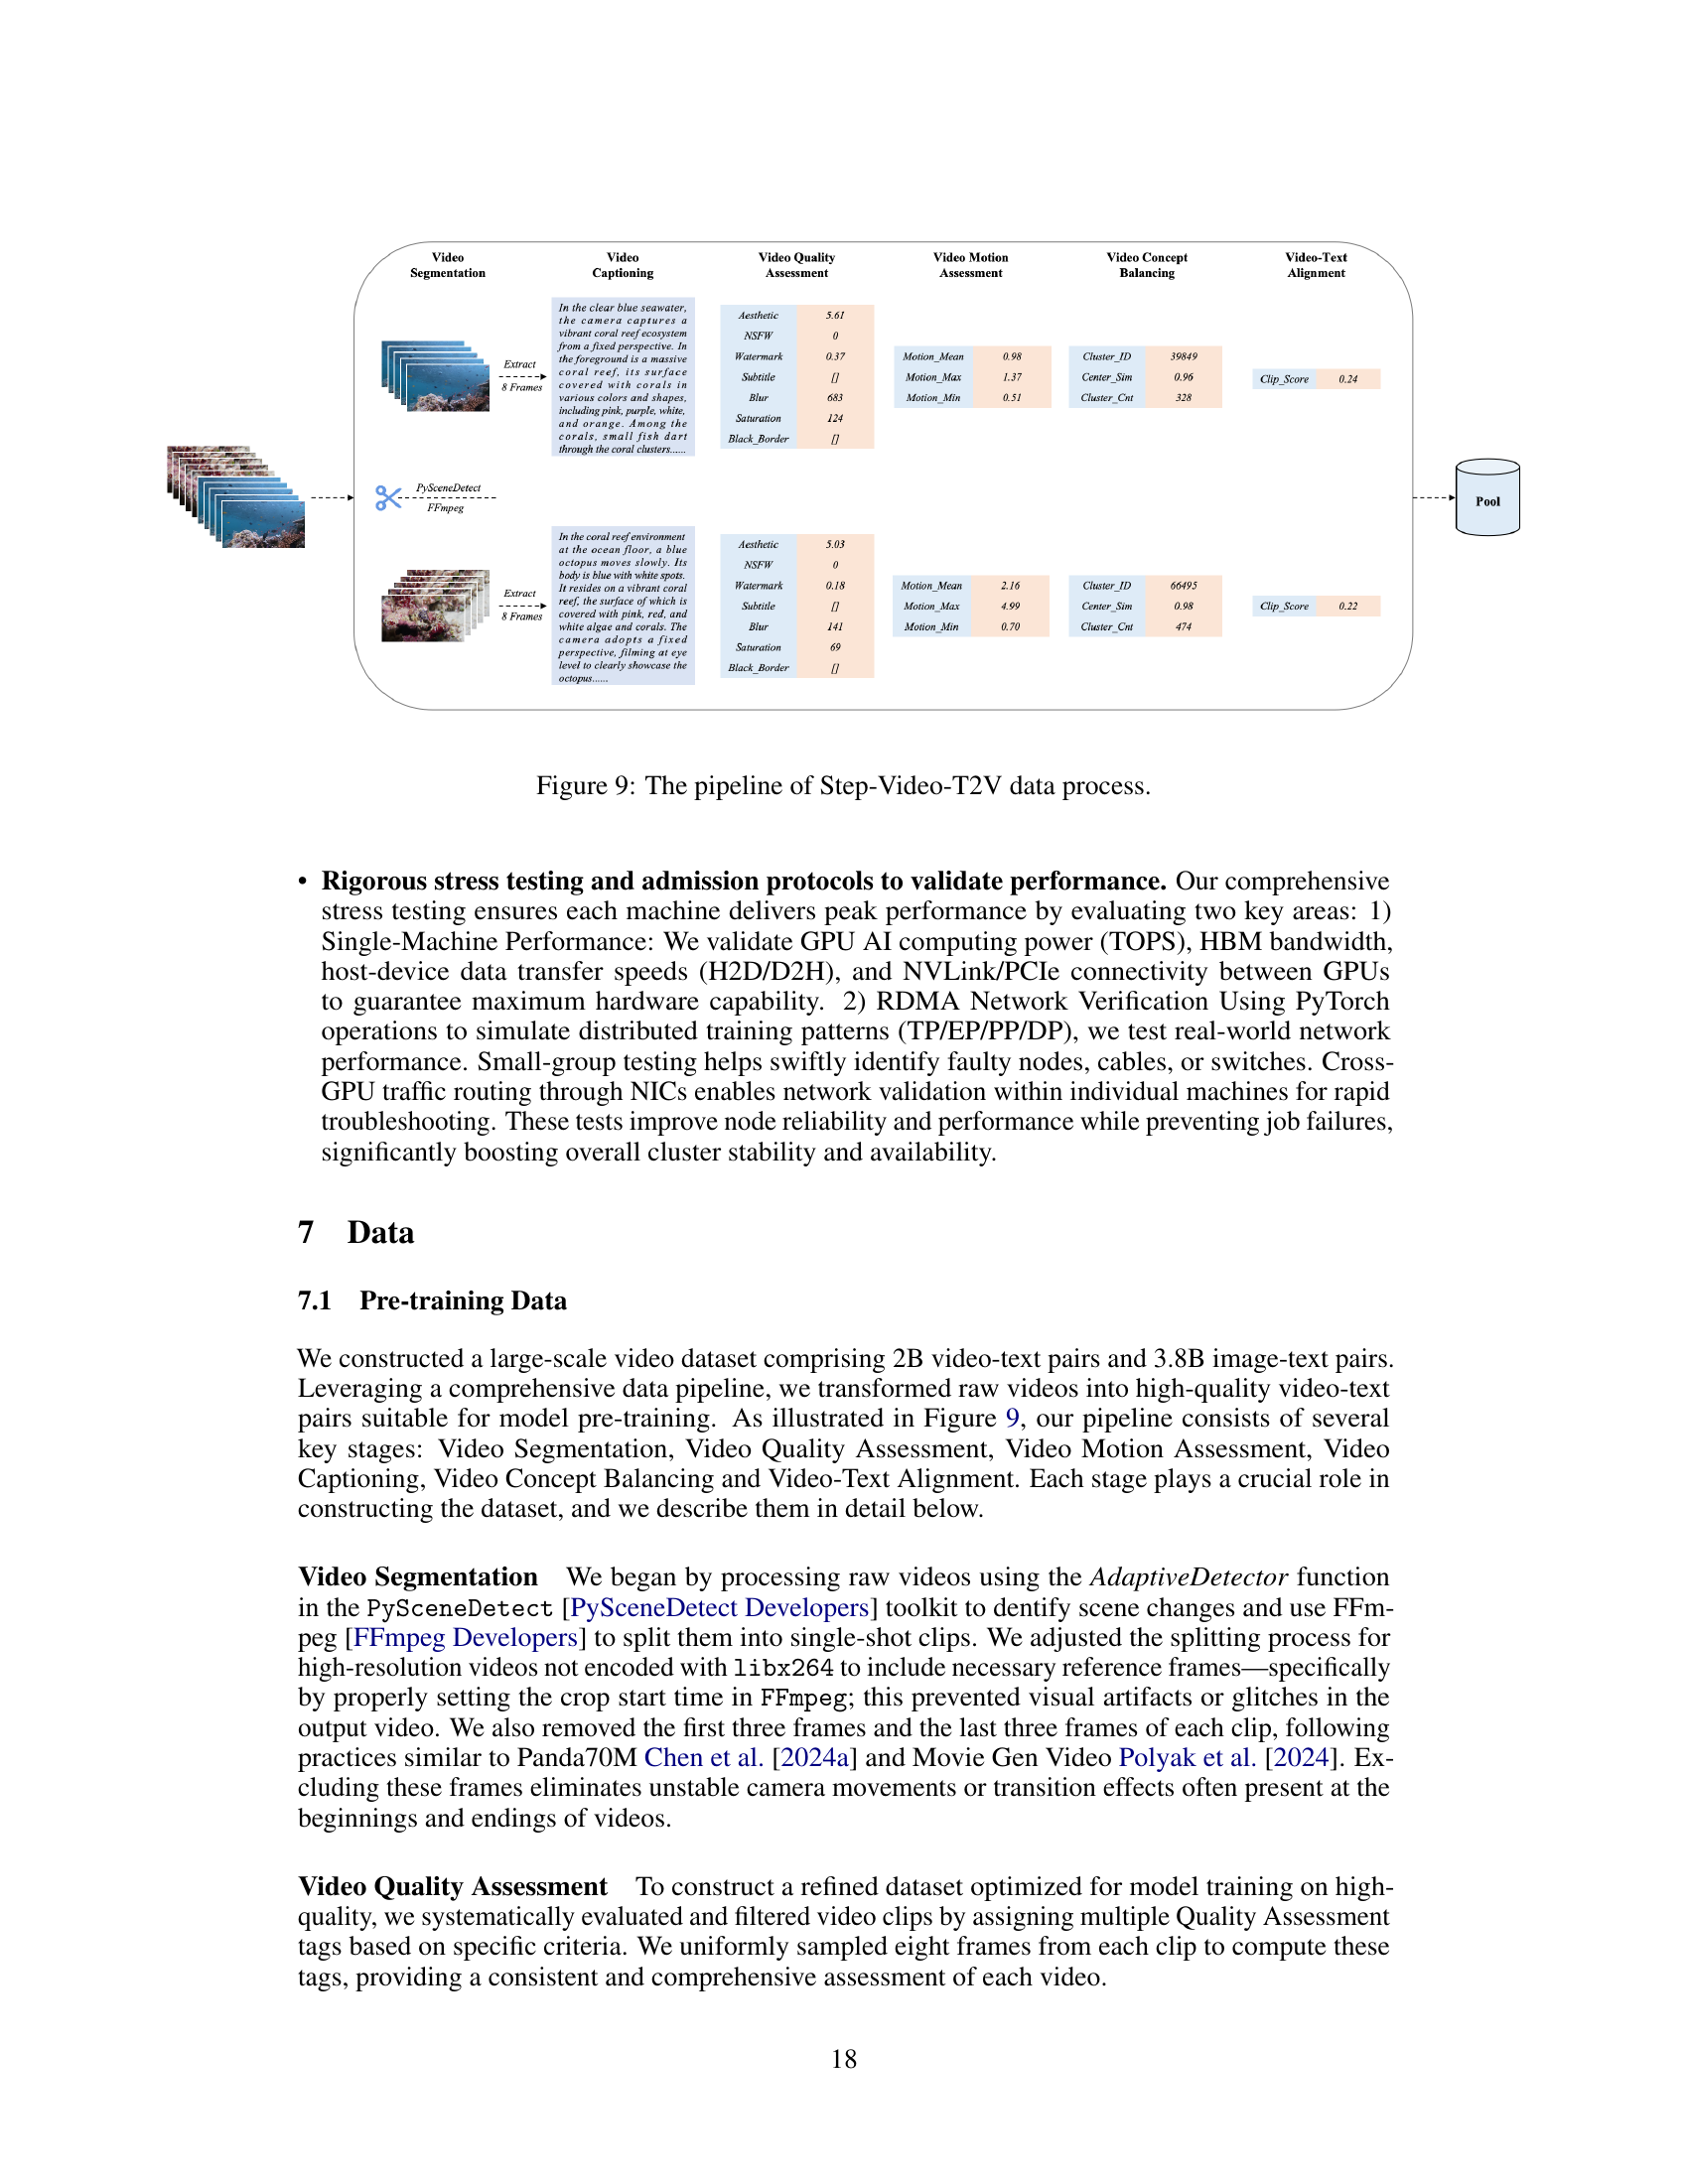
🔼 This figure details the comprehensive data processing pipeline used to prepare the Step-Video-T2V dataset. The pipeline consists of several crucial stages: First, raw video data is segmented into individual clips using scene detection and video splitting techniques. Then, the quality of each clip is assessed using a series of metrics, including aesthetic score, NSFW detection, watermark detection, saturation, blur, black borders, and motion analysis. Video content is further analyzed for the presence of subtitles, and video-text alignment is checked using CLIP similarity scores. Finally, video clips are organized into clusters based on concepts and filtered to ensure data quality and balance. This rigorous procedure ensures a high-quality dataset for training Step-Video-T2V.
read the caption
Figure 9: The pipeline of Step-Video-T2V data process.

🔼 The figure shows the training loss curves for different stages of the Step-Video-T2V model training process. Each curve represents a specific stage and uses a different dataset (denoted as si). The x-axis shows the number of training iterations, while the y-axis represents the training loss. The plot helps visualize how the model’s performance improves across various stages and datasets, indicating the effectiveness of the training strategy.
read the caption
Figure 10: Training curve of different training stages, where sisubscript𝑠𝑖s_{i}italic_s start_POSTSUBSCRIPT italic_i end_POSTSUBSCRIPT denotes the ithsuperscript𝑖𝑡ℎi^{th}italic_i start_POSTSUPERSCRIPT italic_t italic_h end_POSTSUPERSCRIPT dataset used in the corresponding stage.

🔼 This figure illustrates the multi-stage data filtering process employed for both the pre-training and post-training phases of the Step-Video-T2V model. Each stage uses various filters to remove low-quality or unsuitable data. Filters include evaluating aesthetic appeal, blurriness, motion quality, saturation, the presence of watermarks and subtitles, video resolution, and ensuring a balance of concepts. The final post-training dataset is also refined via manual review. The diagram visually demonstrates how the dataset size decreases at each filtering stage, highlighting the impact of each filter on data quality.
read the caption
Figure 11: Hierarchical data filtering for pre-training and post-training.

🔼 The figure displays four frames from a video generated by the Step-Video-T2V model. The video depicts a Chinese girl in a traditional outfit, smiling confidently. She holds a sign reading ‘we will open source.’ The background is an ancient, elegant setting, enhancing the scene’s overall realistic style and coherence with the prompt. The image showcases the model’s ability to generate videos with clear visuals, detailed elements, and accurate text rendering.
read the caption
Figure 12: Four frames sampled from the video generated based on the prompt 'In the video, a Chinese girl is dressed in an exquisite traditional outfit, smiling with a confident and graceful expression. She holds a piece of paper with the words 'we will open source' clearly written on it. The background features an ancient and elegant setting, complementing the girl’s demeanor. The entire scene is clear and has a realistic style.'.
More on tables
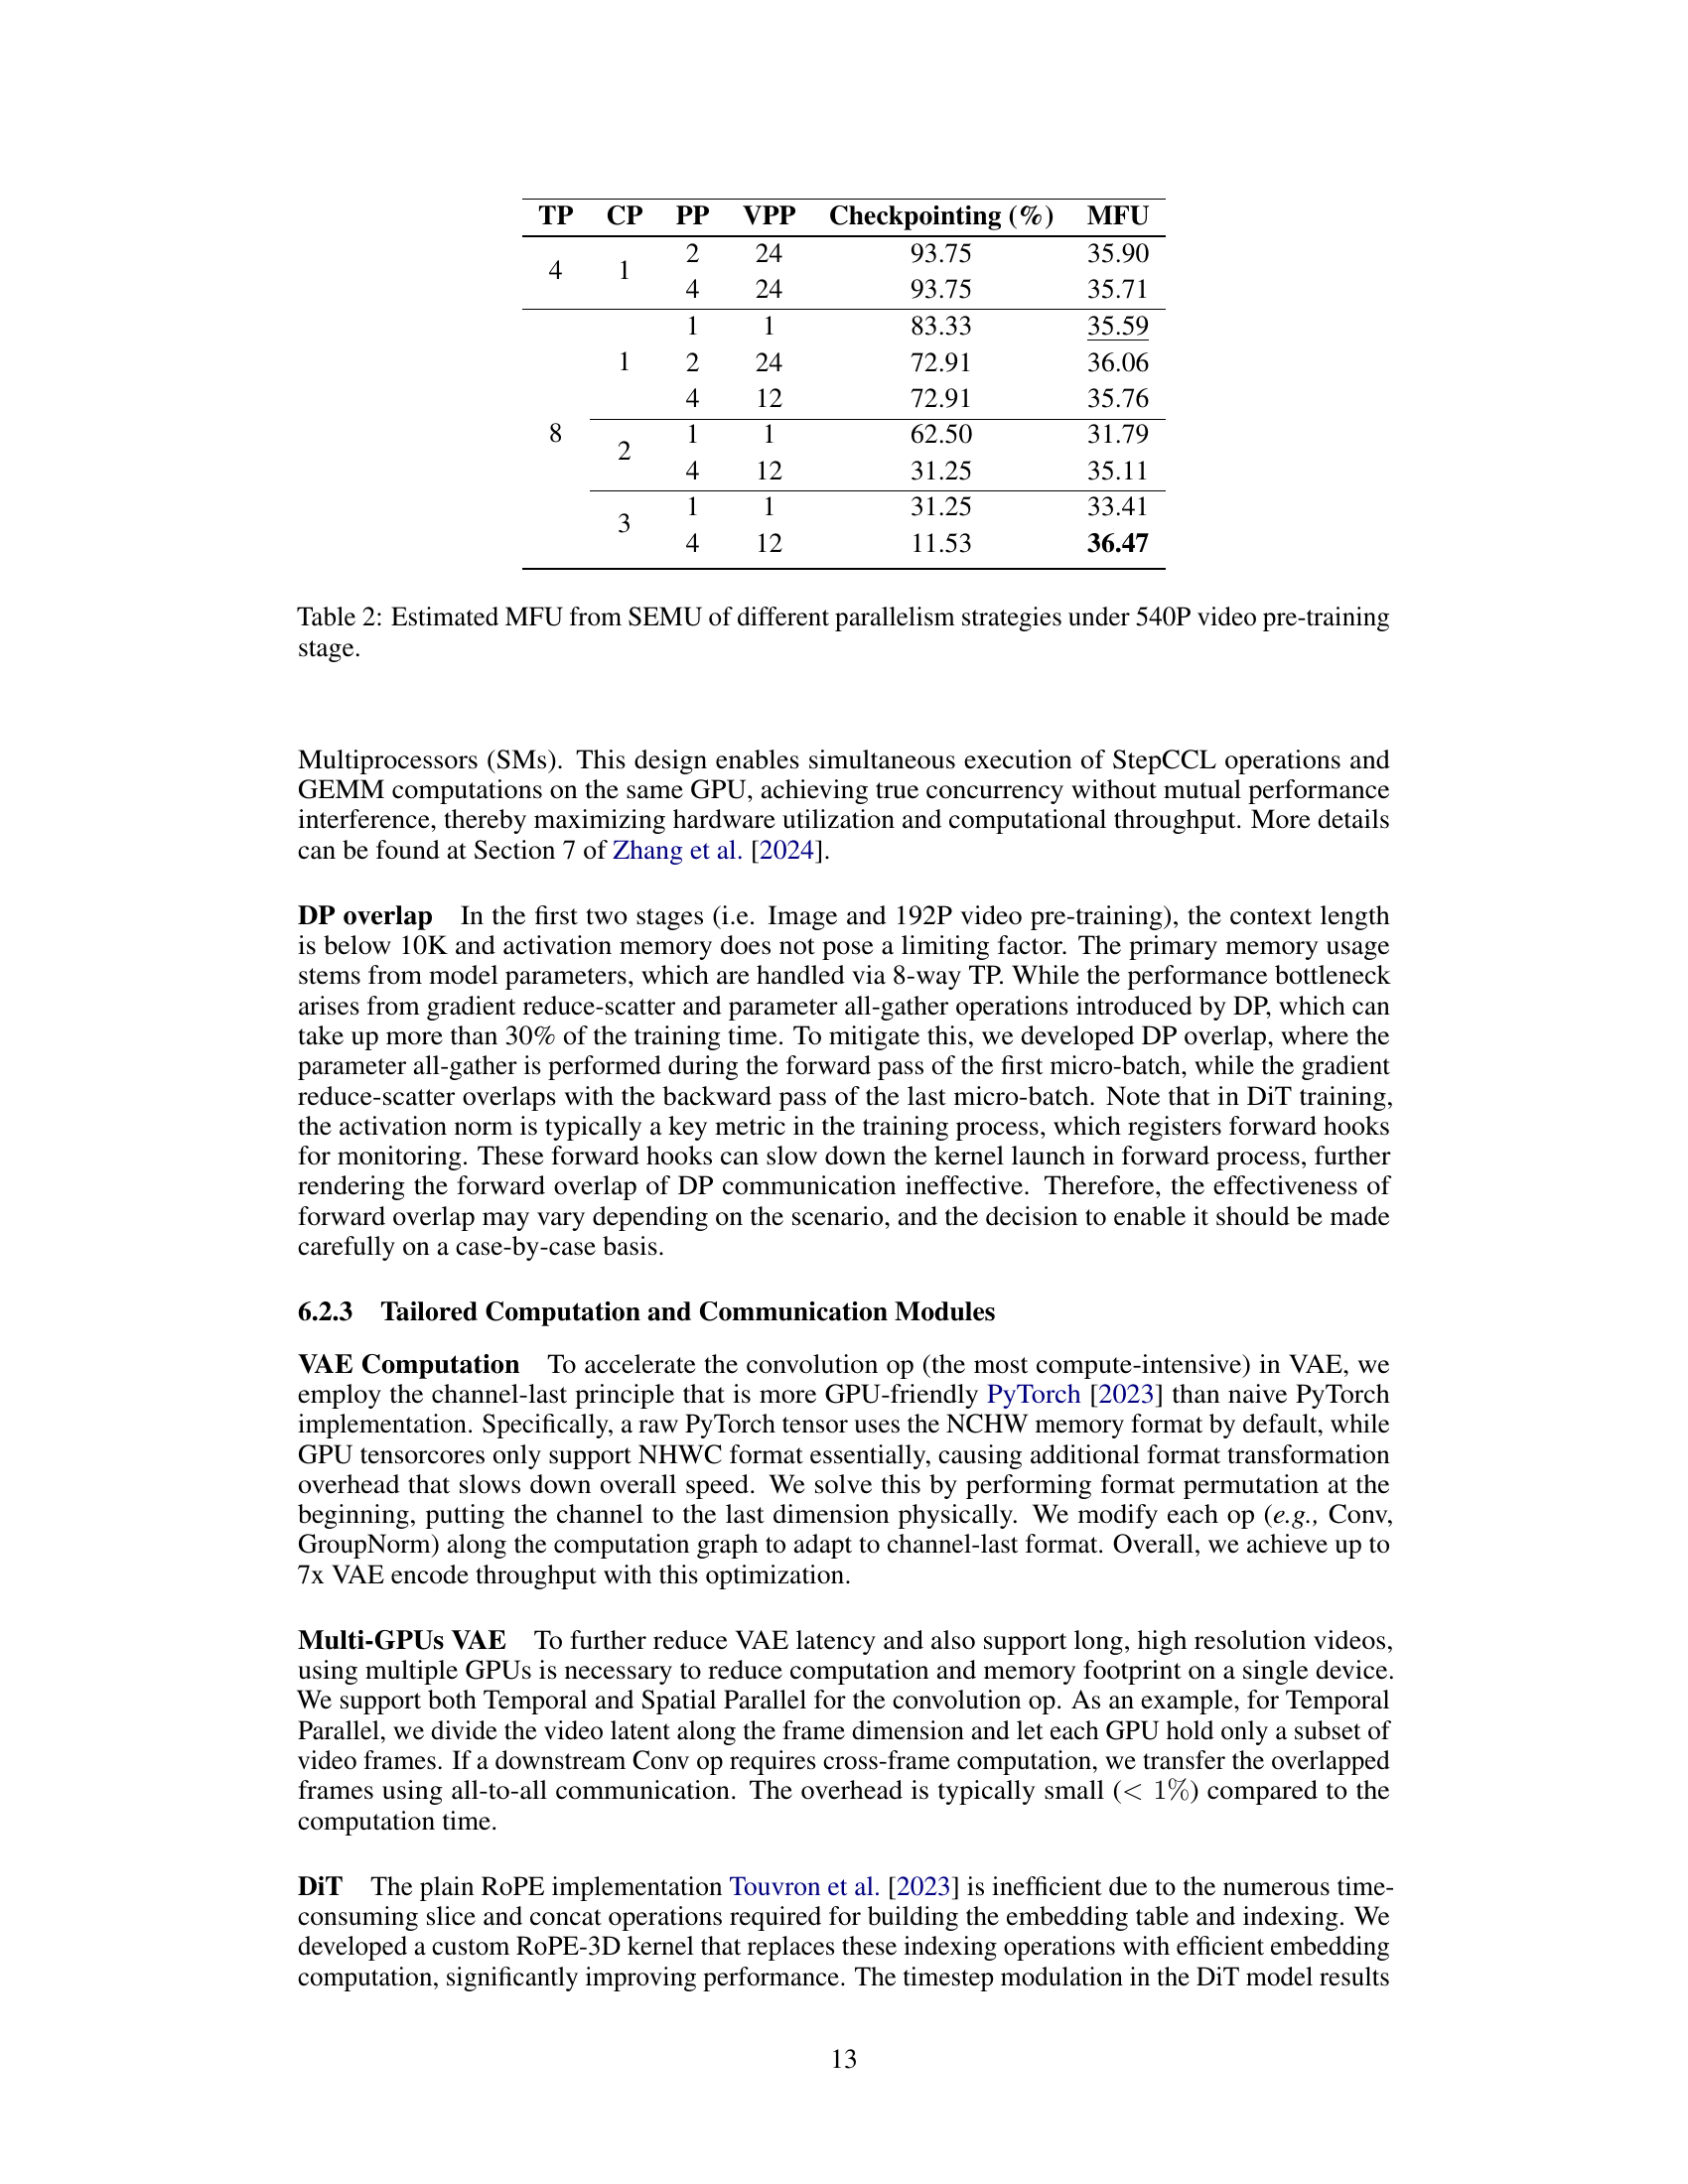
| TP | CP | PP | VPP | Checkpointing (%) | MFU |
| 4 | 1 | 2 | 24 | 93.75 | 35.90 |
| 4 | 24 | 93.75 | 35.71 | ||
| 8 | 1 | 1 | 1 | 83.33 | 35.59 |
| 2 | 24 | 72.91 | 36.06 | ||
| 4 | 12 | 72.91 | 35.76 | ||
| 2 | 1 | 1 | 62.50 | 31.79 | |
| 4 | 12 | 31.25 | 35.11 | ||
| 3 | 1 | 1 | 31.25 | 33.41 | |
| 4 | 12 | 11.53 | 36.47 |
🔼 This table presents the results of simulations performed using the Step Emulator (SEMU) to estimate the model FLOPS utilization (MFU) under various parallel training strategies. The simulations were conducted for the 540P video pre-training stage. The table shows the MFU achieved with different combinations of tensor parallelism (TP), context parallelism (CP), pipeline parallelism (PP), virtual pipeline parallelism (VPP), and checkpointing. It helps in identifying the optimal combination for maximum training efficiency.
read the caption
Table 2: Estimated MFU from SEMU of different parallelism strategies under 540P video pre-training stage.
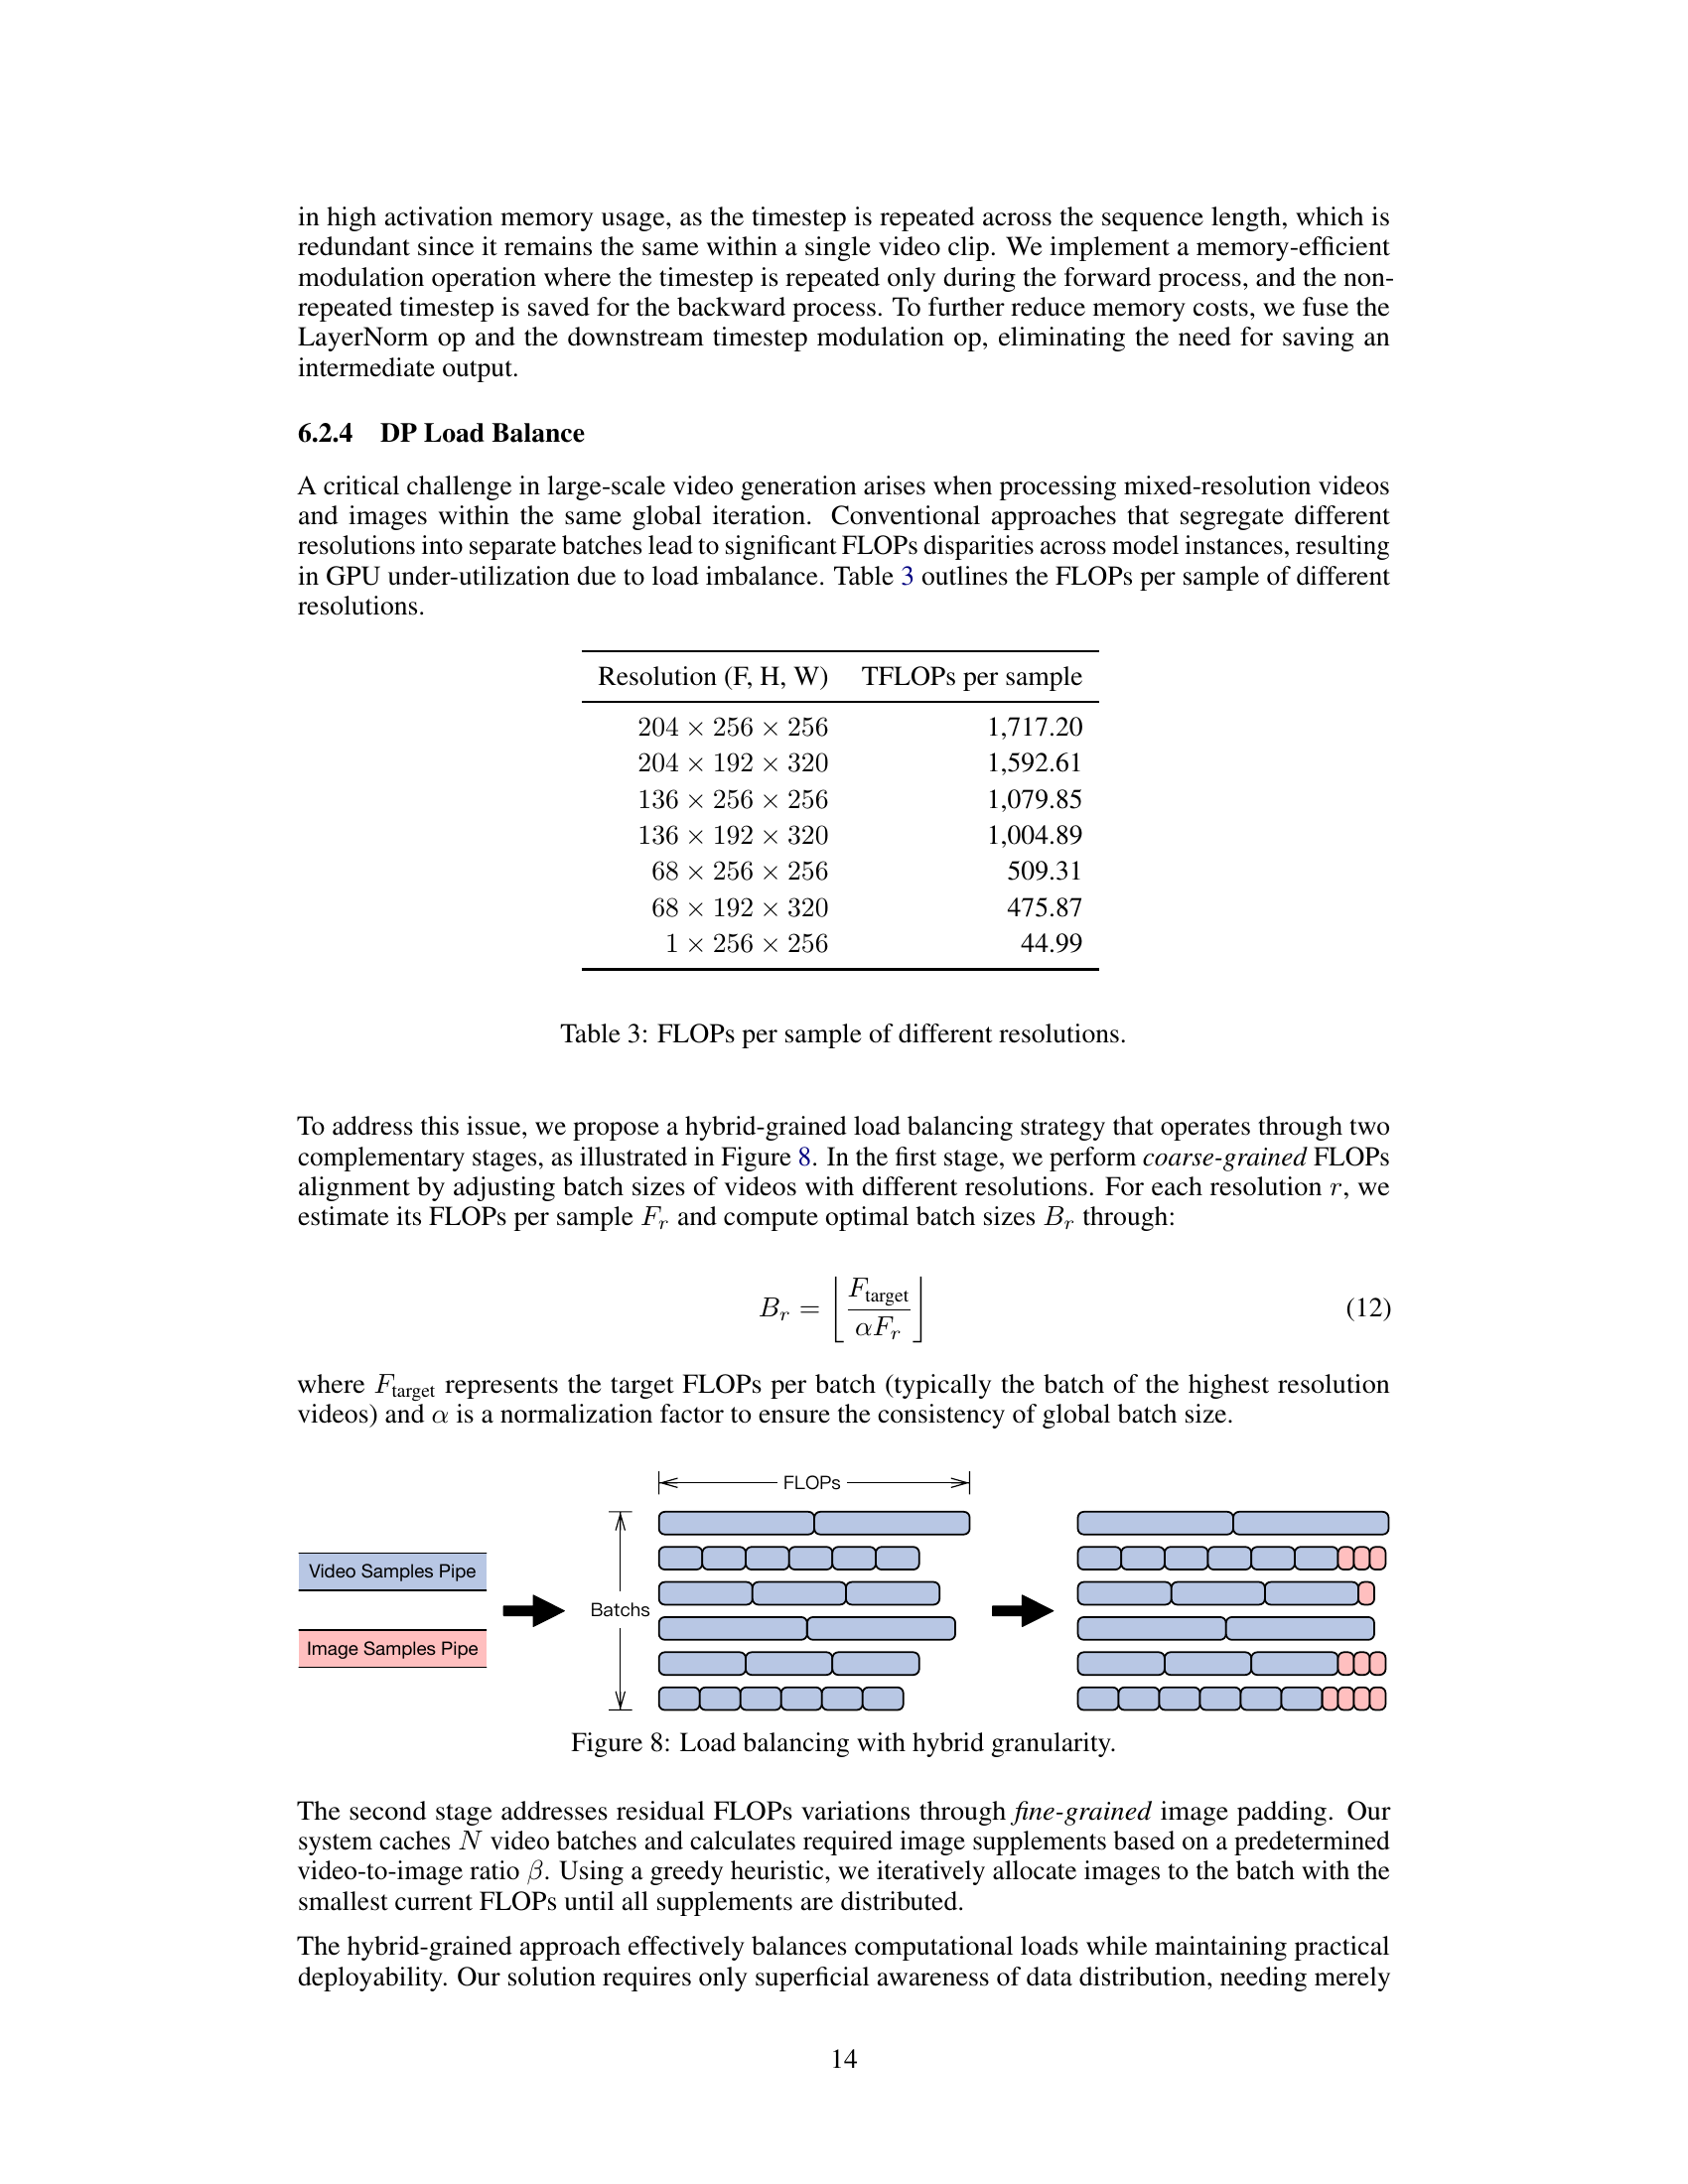
| Resolution (F, H, W) | TFLOPs per sample |
| 1,717.20 | |
| 1,592.61 | |
| 1,079.85 | |
| 1,004.89 | |
| 509.31 | |
| 475.87 | |
| 44.99 |
🔼 This table presents the computational cost, measured in FLOPs (floating-point operations), for processing video samples of different resolutions. The resolution is given as a tuple (frames, height, width). The table is useful for understanding the computational burden associated with different video resolutions when training or generating videos with the Step-Video-T2V model, and highlights the need for efficient processing techniques to handle high-resolution video data.
read the caption
Table 3: FLOPs per sample of different resolutions.
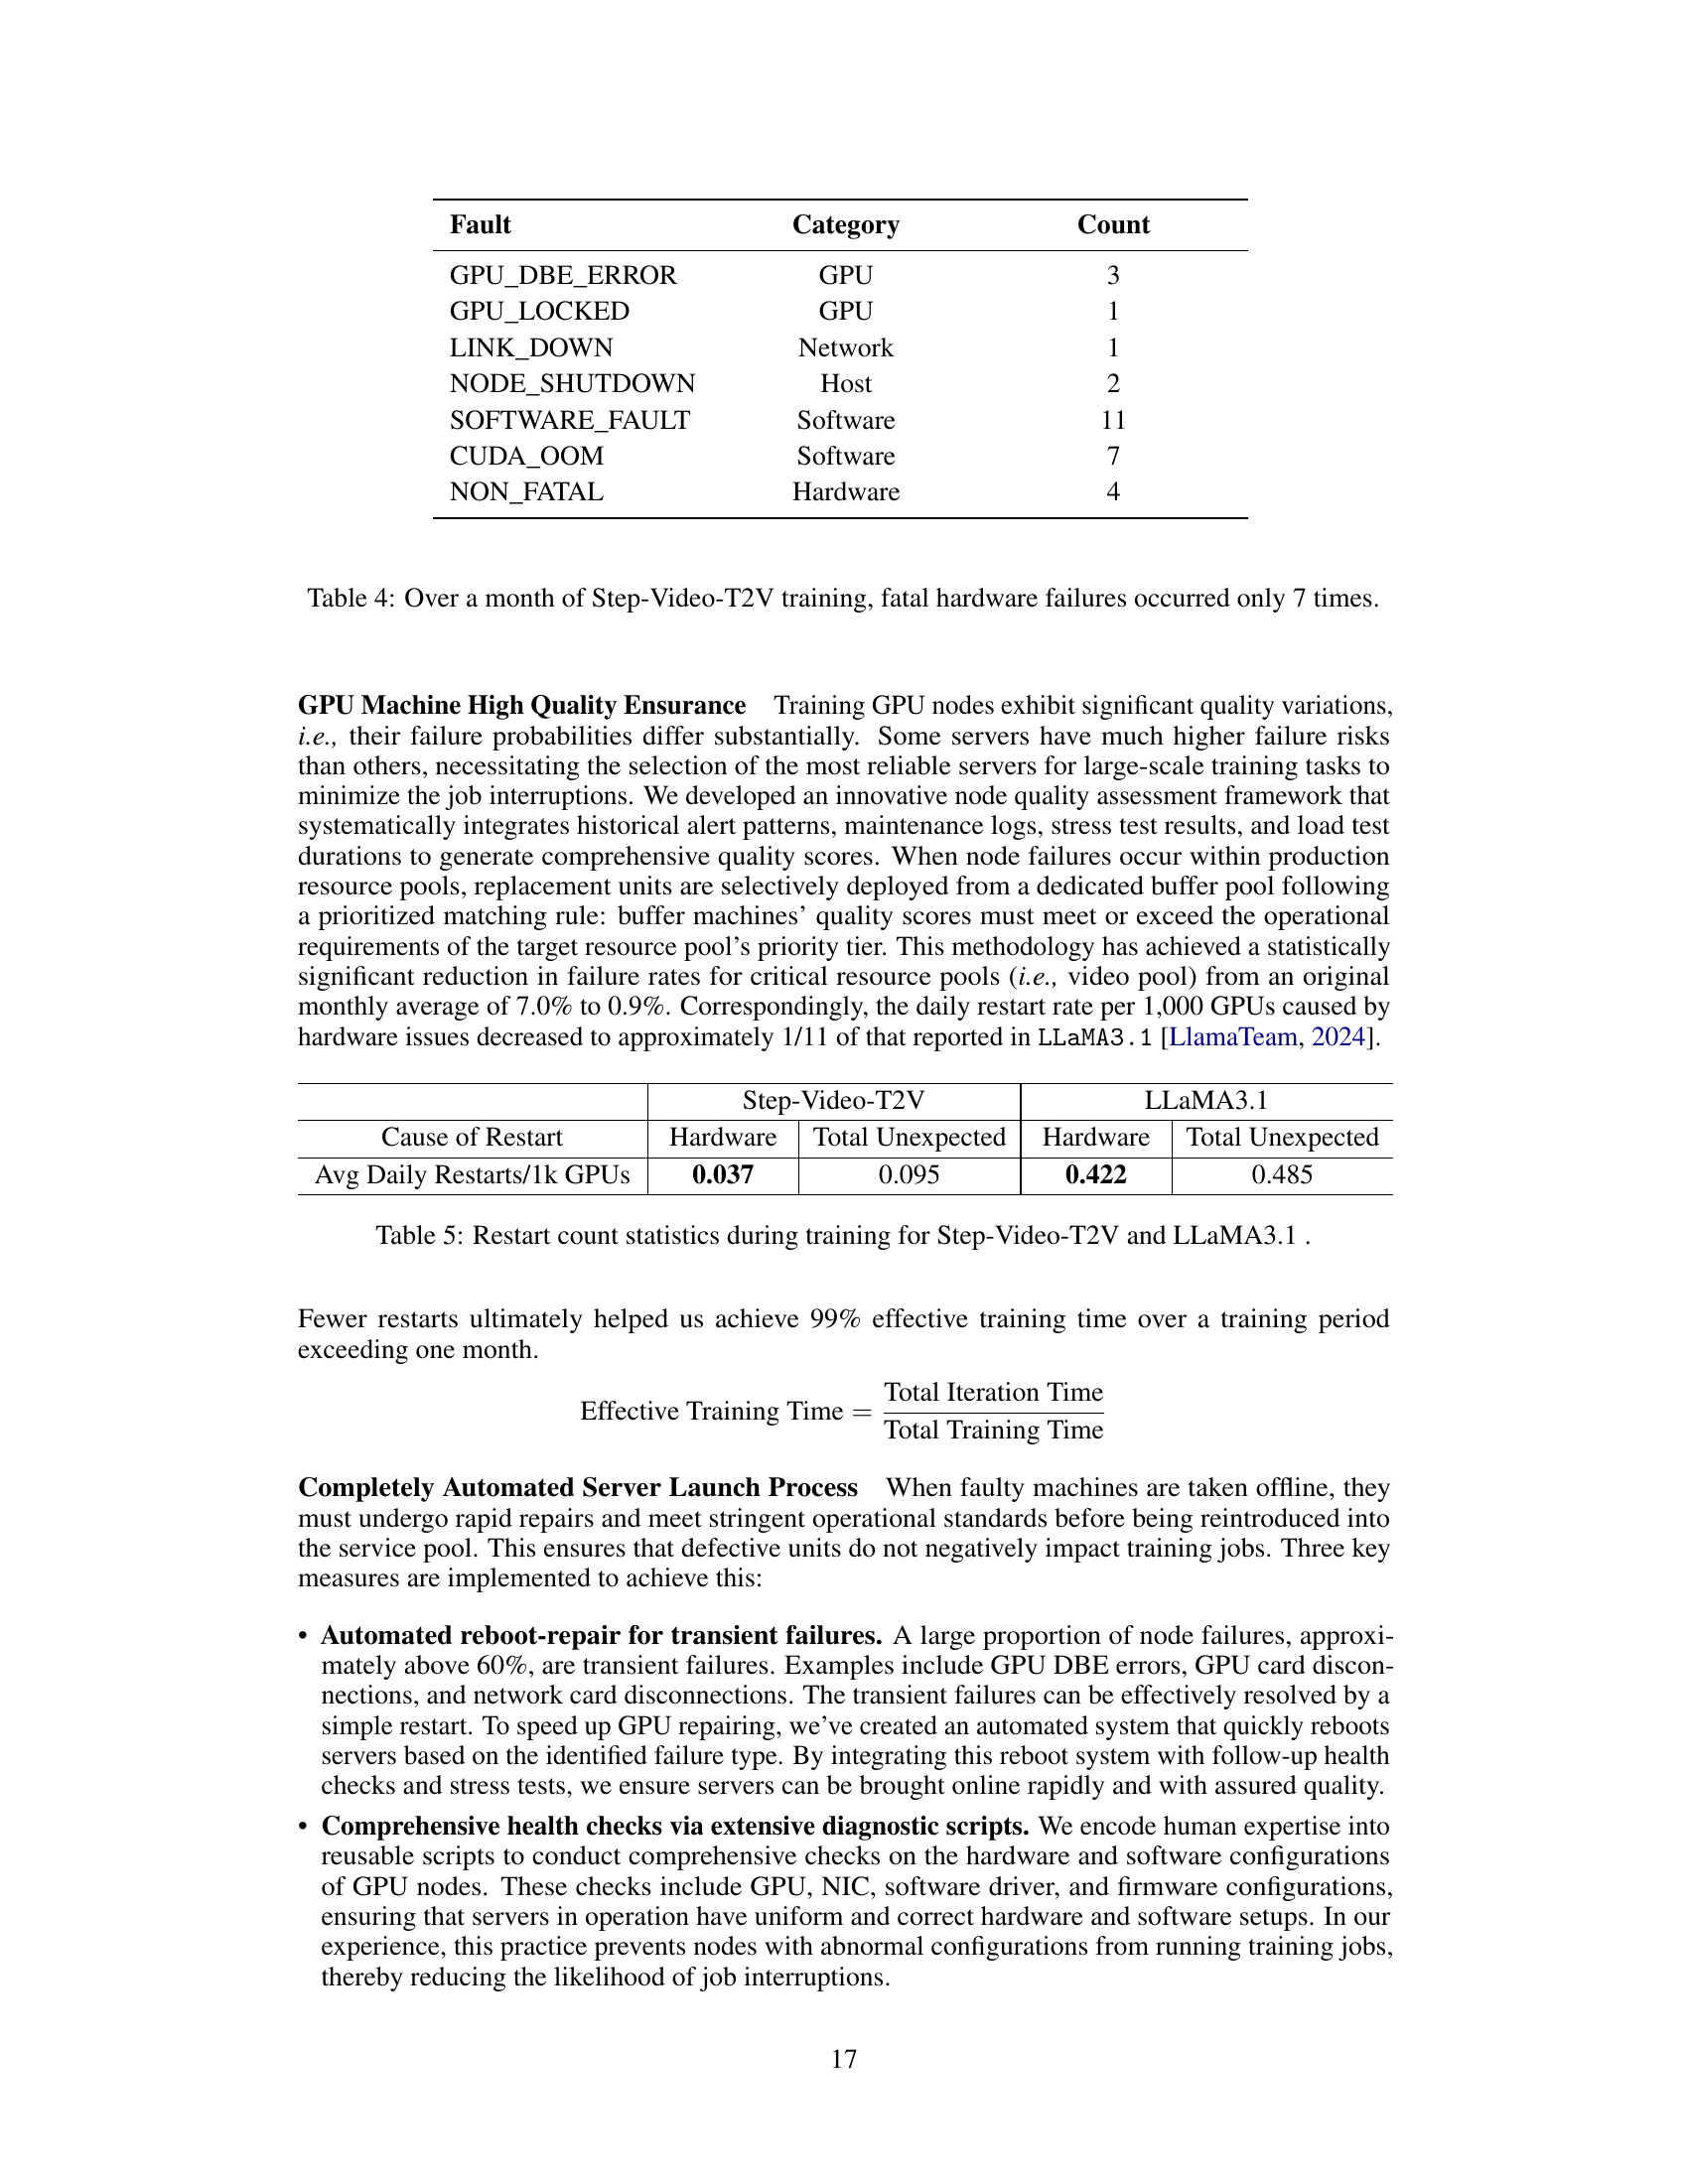
| Fault | Category | Count |
| GPU_DBE_ERROR | GPU | 3 |
| GPU_LOCKED | GPU | 1 |
| LINK_DOWN | Network | 1 |
| NODE_SHUTDOWN | Host | 2 |
| SOFTWARE_FAULT | Software | 11 |
| CUDA_OOM | Software | 7 |
| NON_FATAL | Hardware | 4 |
🔼 This table summarizes the types and frequency of hardware failures that occurred during a month-long Step-Video-T2V training run. It highlights the low number of fatal failures, emphasizing the system’s reliability and resilience. The categories of failures include GPU-related issues, network problems, and host or software malfunctions. The count for each failure type is presented, showing a relatively low overall number of incidents.
read the caption
Table 4: Over a month of Step-Video-T2V training, fatal hardware failures occurred only 7 times.
| Step-Video-T2V | LLaMA3.1 | |||
| Cause of Restart | Hardware | Total Unexpected | Hardware | Total Unexpected |
| Avg Daily Restarts/1k GPUs | 0.037 | 0.095 | 0.422 | 0.485 |
🔼 This table compares the restart count statistics between Step-Video-T2V and LLaMA3.1 during their respective training periods. It shows the average daily number of restarts per 1,000 GPUs due to hardware issues and the overall percentage of effective training time achieved. This data highlights the improved system stability and reliability of Step-Video-T2V’s training infrastructure compared to LLaMA3.1.
read the caption
Table 5: Restart count statistics during training for Step-Video-T2V and LLaMA3.1 .
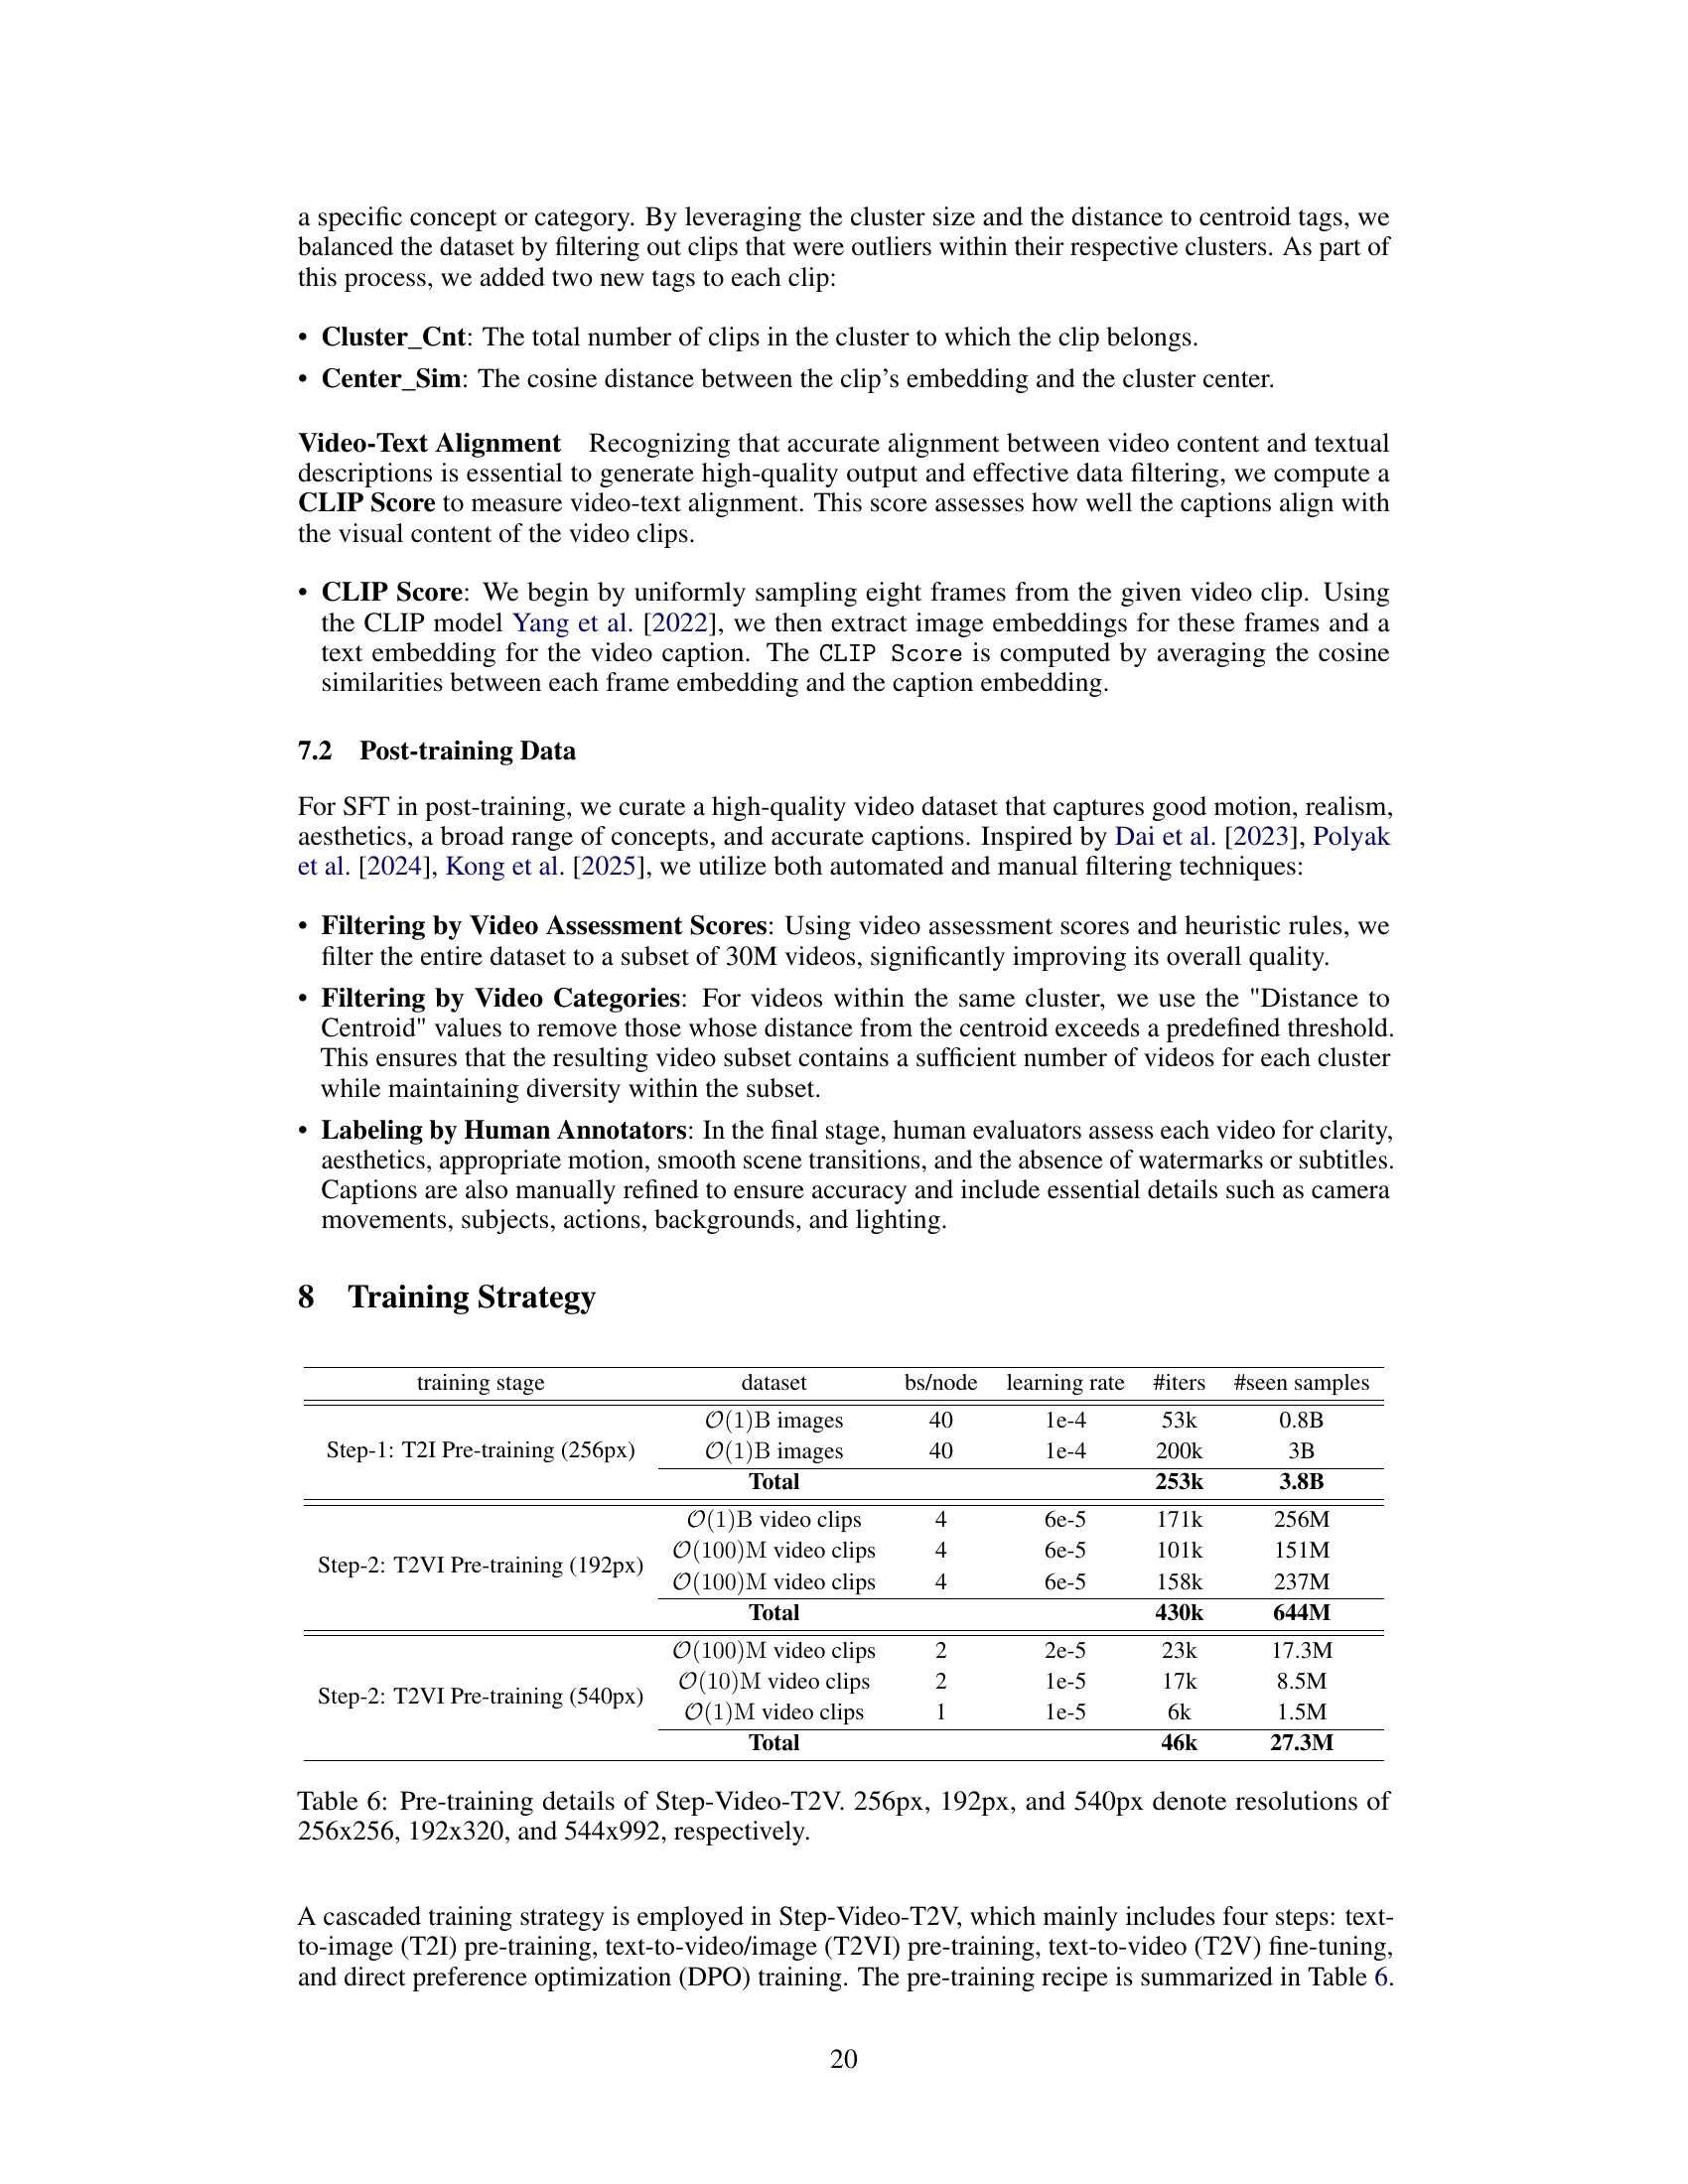
| training stage | dataset | bs/node | learning rate | #iters | #seen samples |
| Step-1: T2I Pre-training (256px) | images | 40 | 1e-4 | 53k | 0.8B |
| images | 40 | 1e-4 | 200k | 3B | |
| Total | 253k | 3.8B | |||
| Step-2: T2VI Pre-training (192px) | video clips | 4 | 6e-5 | 171k | 256M |
| video clips | 4 | 6e-5 | 101k | 151M | |
| video clips | 4 | 6e-5 | 158k | 237M | |
| Total | 430k | 644M | |||
| Step-2: T2VI Pre-training (540px) | video clips | 2 | 2e-5 | 23k | 17.3M |
| video clips | 2 | 1e-5 | 17k | 8.5M | |
| video clips | 1 | 1e-5 | 6k | 1.5M | |
| Total | 46k | 27.3M |
🔼 This table details the hyperparameters and training data used in the three pre-training stages of the Step-Video-T2V model. It shows the resolution of the images and videos used, the batch size per node, the learning rate, the number of iterations, and the total number of samples seen during each stage. The three stages are: Text-to-Image (T2I) pre-training at 256x256 resolution, Text-to-Video/Image (T2VI) pre-training at 192x320 and 544x992 resolutions, and another T2VI pre-training at 540p (544x992).
read the caption
Table 6: Pre-training details of Step-Video-T2V. 256px, 192px, and 540px denote resolutions of 256x256, 192x320, and 544x992, respectively.
| Step-Video-T2V vs. HunyuanVideo (Win-Tie-Loss) | Annotator-1 | Annotator-2 | Annotator-3 |
| Overall | 59-22-47 | 46-47-35 | 54-41-33 |
| Sports | 6-3-3 | 5-5-2 | 6-6-0 |
| Food | 5-2-4 | 5-4-2 | 3-7-1 |
| Scenery | 5-3-4 | 2-9-1 | 7-1-4 |
| Animals | 6-0-6 | 3-6-3 | 2-7-3 |
| Festivals | 4-4-3 | 5-2-4 | 4-5-2 |
| Combined Concepts | 5-2-5 | 6-3-3 | 8-1-3 |
| Surreal | 4-2-5 | 5-2-4 | 6-2-3 |
| People | 6-2-4 | 3-4-5 | 5-2-5 |
| 3D Animation | 7-1-4 | 4-5-3 | 6-3-3 |
| Cinematography | 5-1-5 | 2-5-4 | 1-4-6 |
| Style | 6-2-4 | 6-2-4 | 6-3-3 |
🔼 This table presents a comparison of the performance of Step-Video-T2V against HunyuanVideo using Metric-1. Metric-1 involves human annotators comparing video pairs generated by each model for the same prompt, labeling each pair as a win for Step-Video-T2V, a tie, or a loss. The table shows the win-tie-loss counts for each model across different video categories from the Step-Video-T2V-Eval benchmark.
read the caption
Table 7: Comparison with HunyuanVideo using Metric-1.
| Step-Video-T2V vs. HunyuanVideo | Instruction Following | Motion Smoothness | Physical Plausibility | Aesthetic Appeal |
| Overall | 1,273-1,221 | 1,407-1,327 | 1,417-1,238 | 1,312-1,238 |
| Sports | 130-111 | 120-104 | 113-99 | 110-98 |
| Food | 85-92 | 110-97 | 107-93 | 111-90 |
| Scenery | 130-129 | 139-126 | 134-120 | 125-122 |
| Animals | 104-106 | 123-114 | 110-107 | 99-108 |
| Festivals | 102-91 | 110-102 | 97-90 | 103-94 |
| Combined Concepts | 132-115 | 139-136 | 139-135 | 118-115 |
| Surreal | 99-101 | 138-139 | 135-134 | 125-126 |
| People | 115-117 | 129-129 | 148-150 | 115-112 |
| 3D Animation | 113-109 | 137-133 | 149-146 | 139-135 |
| Cinematography | 121-117 | 121-122 | 132-133 | 116-115 |
| Style | 142-133 | 141-125 | 153-134 | 151-123 |
🔼 This table presents a comparison of Step-Video-T2V and HunyuanVideo using Metric 2. Metric 2 involves human evaluation across four dimensions: Instruction Following, Motion Smoothness, Physical Plausibility, and Aesthetic Appeal. Three annotators evaluated each video generated by both models for each prompt in the Step-Video-T2V-Eval benchmark. For each category within the benchmark, the table shows the aggregated scores from all annotators across all prompts for each dimension, providing a detailed comparison of model performance across multiple aspects of video generation quality.
read the caption
Table 8: Comparison with HunyuanVideo using Metric-2. We invited three human annotators to evaluate each video. For each category and evaluation dimension, we aggregated the scores given by all annotators across all prompts within the category for that dimension.
| Step-Video-T2V vs. T2VTopA (Win-Tie-Loss) | Annotator-1 | Annotator-2 | Annotator-3 |
| Overall | 44-13-69 | 41-13-72 | 46-25-55 |
| Sports | 6-2-4 | 7-0-5 | 7-3-2 |
| Food | 5-2-4 | 6-1-4 | 4-2-5 |
| Scenery | 1-0-10 | 4-0-7 | 1-2-8 |
| Animals | 1-3-8 | 1-3-8 | 3-1-8 |
| Festivals | 6-2-3 | 7-2-2 | 5-3-3 |
| Combined Concepts | 2-0-10 | 1-3-8 | 8-0-4 |
| Surreal | 4-1-6 | 3-2-6 | 4-2-5 |
| People | 2-1-8 | 2-1-8 | 6-1-4 |
| 3D Animation | 6-0-6 | 3-0-9 | 5-3-4 |
| Cinematography | 5-1-5 | 4-1-6 | 1-3-7 |
| Style | 6-1-5 | 3-0-9 | 2-5-5 |
🔼 This table presents a comparison of Step-Video-T2V against the commercial text-to-video generation engine T2VTopA using Metric 1. Metric 1 involves human evaluation where annotators compare video pairs generated by each model for the same prompt and determine which model produced better quality, resulting in a Win, Tie, or Loss for each comparison. The table shows the Win/Tie/Loss counts across multiple annotators for each of the 11 categories used in the Step-Video-T2V-Eval benchmark, as well as an overall comparison. Two prompts were excluded from the analysis because T2VTopA failed to generate videos for them.
read the caption
Table 9: Comparison with T2VTopA using Metric-1. A total of 126 prompts were evaluated, rather than 128, as T2VTopA rejected 2 prompts.
| Step-Video-T2V vs. T2VTopB (Win-Tie-Loss) | Annotator-1 | Annotator-2 | Annotator-3 |
| Overall | 36-35-51 | 67-10-45 | 55-22-45 |
| Sports | 8-2-2 | 10-1-1 | 8-2-2 |
| Food | 3-4-3 | 7-1-2 | 7-2-1 |
| Scenery | 2-6-4 | 5-2-5 | 5-4-3 |
| Animals | 5-1-5 | 3-1-7 | 2-2-7 |
| Festivals | 6-1-4 | 6-0-5 | 2-4-5 |
| Combined Concepts | 1-4-7 | 6-1-5 | 4-2-6 |
| Surreal | 2-0-6 | 3-0-5 | 2-1-5 |
| People | 1-3-7 | 4-1-6 | 3-1-7 |
| 3D Animation | 5-3-4 | 11-0-1 | 11-0-1 |
| Cinematography | 3-3-5 | 4-2-5 | 3-1-7 |
| Style | 0-8-4 | 8-1-3 | 8-3-1 |
🔼 This table presents a comparison of Step-Video-T2V’s performance against T2VTopB, using Metric-1 which involves human evaluation. Three annotators independently compared video outputs from both models for 122 prompts (6 prompts were excluded because T2VTopB failed to generate results for them). The results indicate, for each prompt, whether Step-Video-T2V performed better (Win), worse (Loss), or similarly (Tie) to T2VTopB. The overall results are summarized, along with a breakdown for each of the eleven categories evaluated.
read the caption
Table 10: Comparison with T2VTopB using Metric-1. A total of 122 prompts were evaluated, rather than 128, as T2VTopB rejected 6 prompts.
| Model | Instruction Following | Motion Smoothness | Physical Plausibility | Aesthetic Appeal | |
| Annotator-1 | Step-Video-T2V | 204 | 210 | 203 | 187 |
| T2VTopA | 211 | 200 | 198 | 196 | |
| T2VTopB | 185 | 184 | 178 | 175 | |
| Annotator-2 | Step-Video-T2V | 211 | 243 | 256 | 217 |
| T2VTopA | 241 | 243 | 242 | 228 | |
| T2VTopB | 234 | 236 | 229 | 204 | |
| Annotator-3 | Step-Video-T2V | 170 | 197 | 172 | 178 |
| T2VTopA | 177 | 177 | 153 | 171 | |
| T2VTopB | 164 | 163 | 139 | 148 | |
| Annotator-4 | Step-Video-T2V | 199 | 232 | 230 | 225 |
| T2VTopA | 217 | 221 | 201 | 199 | |
| T2VTopB | 194 | 219 | 194 | 194 | |
| Annotator-5 | Step-Video-T2V | 218 | 225 | 213 | 211 |
| T2VTopA | 221 | 220 | 213 | 212 | |
| T2VTopB | 209 | 217 | 202 | 196 | |
| Annotator-6 | Step-Video-T2V | 187 | 213 | 251 | 211 |
| T2VTopA | 193 | 201 | 259 | 197 | |
| T2VTopB | 201 | 224 | 271 | 227 |
🔼 This table presents a comparison of Step-Video-T2V against two leading commercial text-to-video models in China (T2VTopA and T2VTopB) using Metric 2. Metric 2 assesses video quality across four dimensions: Instruction Following, Motion Smoothness, Physical Plausibility, and Aesthetic Appeal. Six human annotators evaluated each video, assigning a score (1-5) for each dimension. The table shows the aggregated average scores for each model across all prompts (excluding prompts rejected by any model). This provides a quantitative comparison of the models’ performance on various qualitative aspects of video generation.
read the caption
Table 11: Comparison with T2VTopA and T2VTopB using Metric-2. We invited six human annotators to evaluate each video. For each evaluation dimension, we aggregated the scores given by each annotator across all prompts for that dimension. Prompts that were rejected by any model were excluded from the analysis for all models.
| Category | Step-Video-T2V vs. Movie Gen Video (Win-Tie-Loss) | Step-Video-T2V vs. HunyuanVideo (Win-Tie-Loss) | # of Prompts |
| Overall | 485-315-489 | 615-313-361 | 1,289 |
| human | 123-58-160 | 181-64-96 | 341 |
| physics | 61-54-64 | 87-47-45 | 179 |
| unusual activity & subject | 110-74-108 | 136-75-81 | 292 |
| animal | 39-37-42 | 47-30-41 | 118 |
| scene | 84-53-63 | 91-58-51 | 200 |
| sequential motion | 9-2-2 | 6-2-5 | 13 |
| camera motion | 59-37-50 | 67-37-42 | 146 |
🔼 Table 12 presents a comparison of the performance of Step-Video-T2V against MovieGen Video and HunyuanVideo, using the MovieGen Video benchmark dataset. The benchmark contains 1003 prompts, but the total number of evaluations is 1289 because some prompts encompass multiple categories. Six human annotators assessed the video generations, providing judgments on several aspects of video quality. The results show wins, ties, and losses for each model across various categories of prompts (Overall, Human, Physics, Unusual Activity & Subject, Animal, Scene, Sequential Motion, and Camera Motion).
read the caption
Table 12: Comparison of Movie Gen Video and HunyuanVideo using the Movie Gen Video Bench. The total number of evaluations (1,289) is greater than 1,003 due to some prompts having multiple category tags. This evaluation involved six human annotators.
| Model | Downsample Factor | SSIM | PSNR | rFVD |
| OpenSora-1.2 (Zheng et al. (2024)) | 4 × 8 × 8 | 0.9126 | 31.41 | 20.42 |
| CogvideoX-1.5 (Yang et al. (2024a)) | 4 × 8 × 8 | 0.9373 | 38.10 | 16.33 |
| HunyuanVideo (Kong et al. (2025)) | 4 × 8 × 8 | 0.9710 | 39.56 | 4.17 |
| Cosmos-VAE (Nvidia (2025)) | 4 × 8 × 8 | 0.9315 | 37.66 | 9.10 |
| Cosmos-VAE (Nvidia (2025)) | 8 × 16 × 16 | 0.8862 | 34.82 | 40.33 |
| Video-VAE (Ours) | 8 × 16 × 16 | 0.9776 | 39.37 | 3.61 |
🔼 This table compares the video reconstruction quality of the proposed Video-VAE model with several existing open-source models using three metrics: SSIM (Structural Similarity Index), PSNR (Peak Signal-to-Noise Ratio), and rFVD (reduced Fréchet Video Distance). The comparison uses 1000 test videos, and the results demonstrate the ability of Video-VAE to achieve state-of-the-art reconstruction quality even with a significantly higher compression ratio compared to other methods.
read the caption
Table 13: Comparison of reconstruction metrics.
Full paper#