TL;DR#
Atomic property prediction heavily relies on large datasets and extensive computational resources for effective model pretraining. However, this approach is not only expensive but also inefficient, as it does not guarantee performance improvements. Current research lacks methods to strategically select the most relevant data for pretraining and efficient training methodologies, resulting in significant resource waste. This research seeks to improve this situation by investigating a more efficient strategy for pretraining.
The paper introduces a new method that employs a novel metric (CSI) inspired by computer vision’s FID to quantify the alignment between pretraining and downstream datasets. By using this metric, researchers can select smaller, focused datasets for pretraining that are highly relevant to their task. This approach drastically reduces computational costs, achieving results comparable to or surpassing large-scale pretraining. The research demonstrates that in pretraining for atomic property prediction, carefully selected high-quality datasets outperform larger, less relevant ones. The proposed CSI metric offers a practical tool to assist researchers in efficiently choosing their training data. This method is efficient and allows for achieving good predictive accuracy, thus saving resources and time.
Key Takeaways#
Why does it matter?#
This paper is crucial because it challenges the prevailing assumption that larger datasets automatically lead to better results in atomic property prediction. It introduces a novel approach that prioritizes data quality over quantity, offering a more efficient and cost-effective alternative for researchers. The findings highlight new avenues for investigation focusing on data selection strategies and the development of more efficient computational methods, directly addressing current resource constraints in this research area. The proposed Chemical Similarity Index provides researchers with a practical tool for optimizing their pretraining datasets.
Visual Insights#

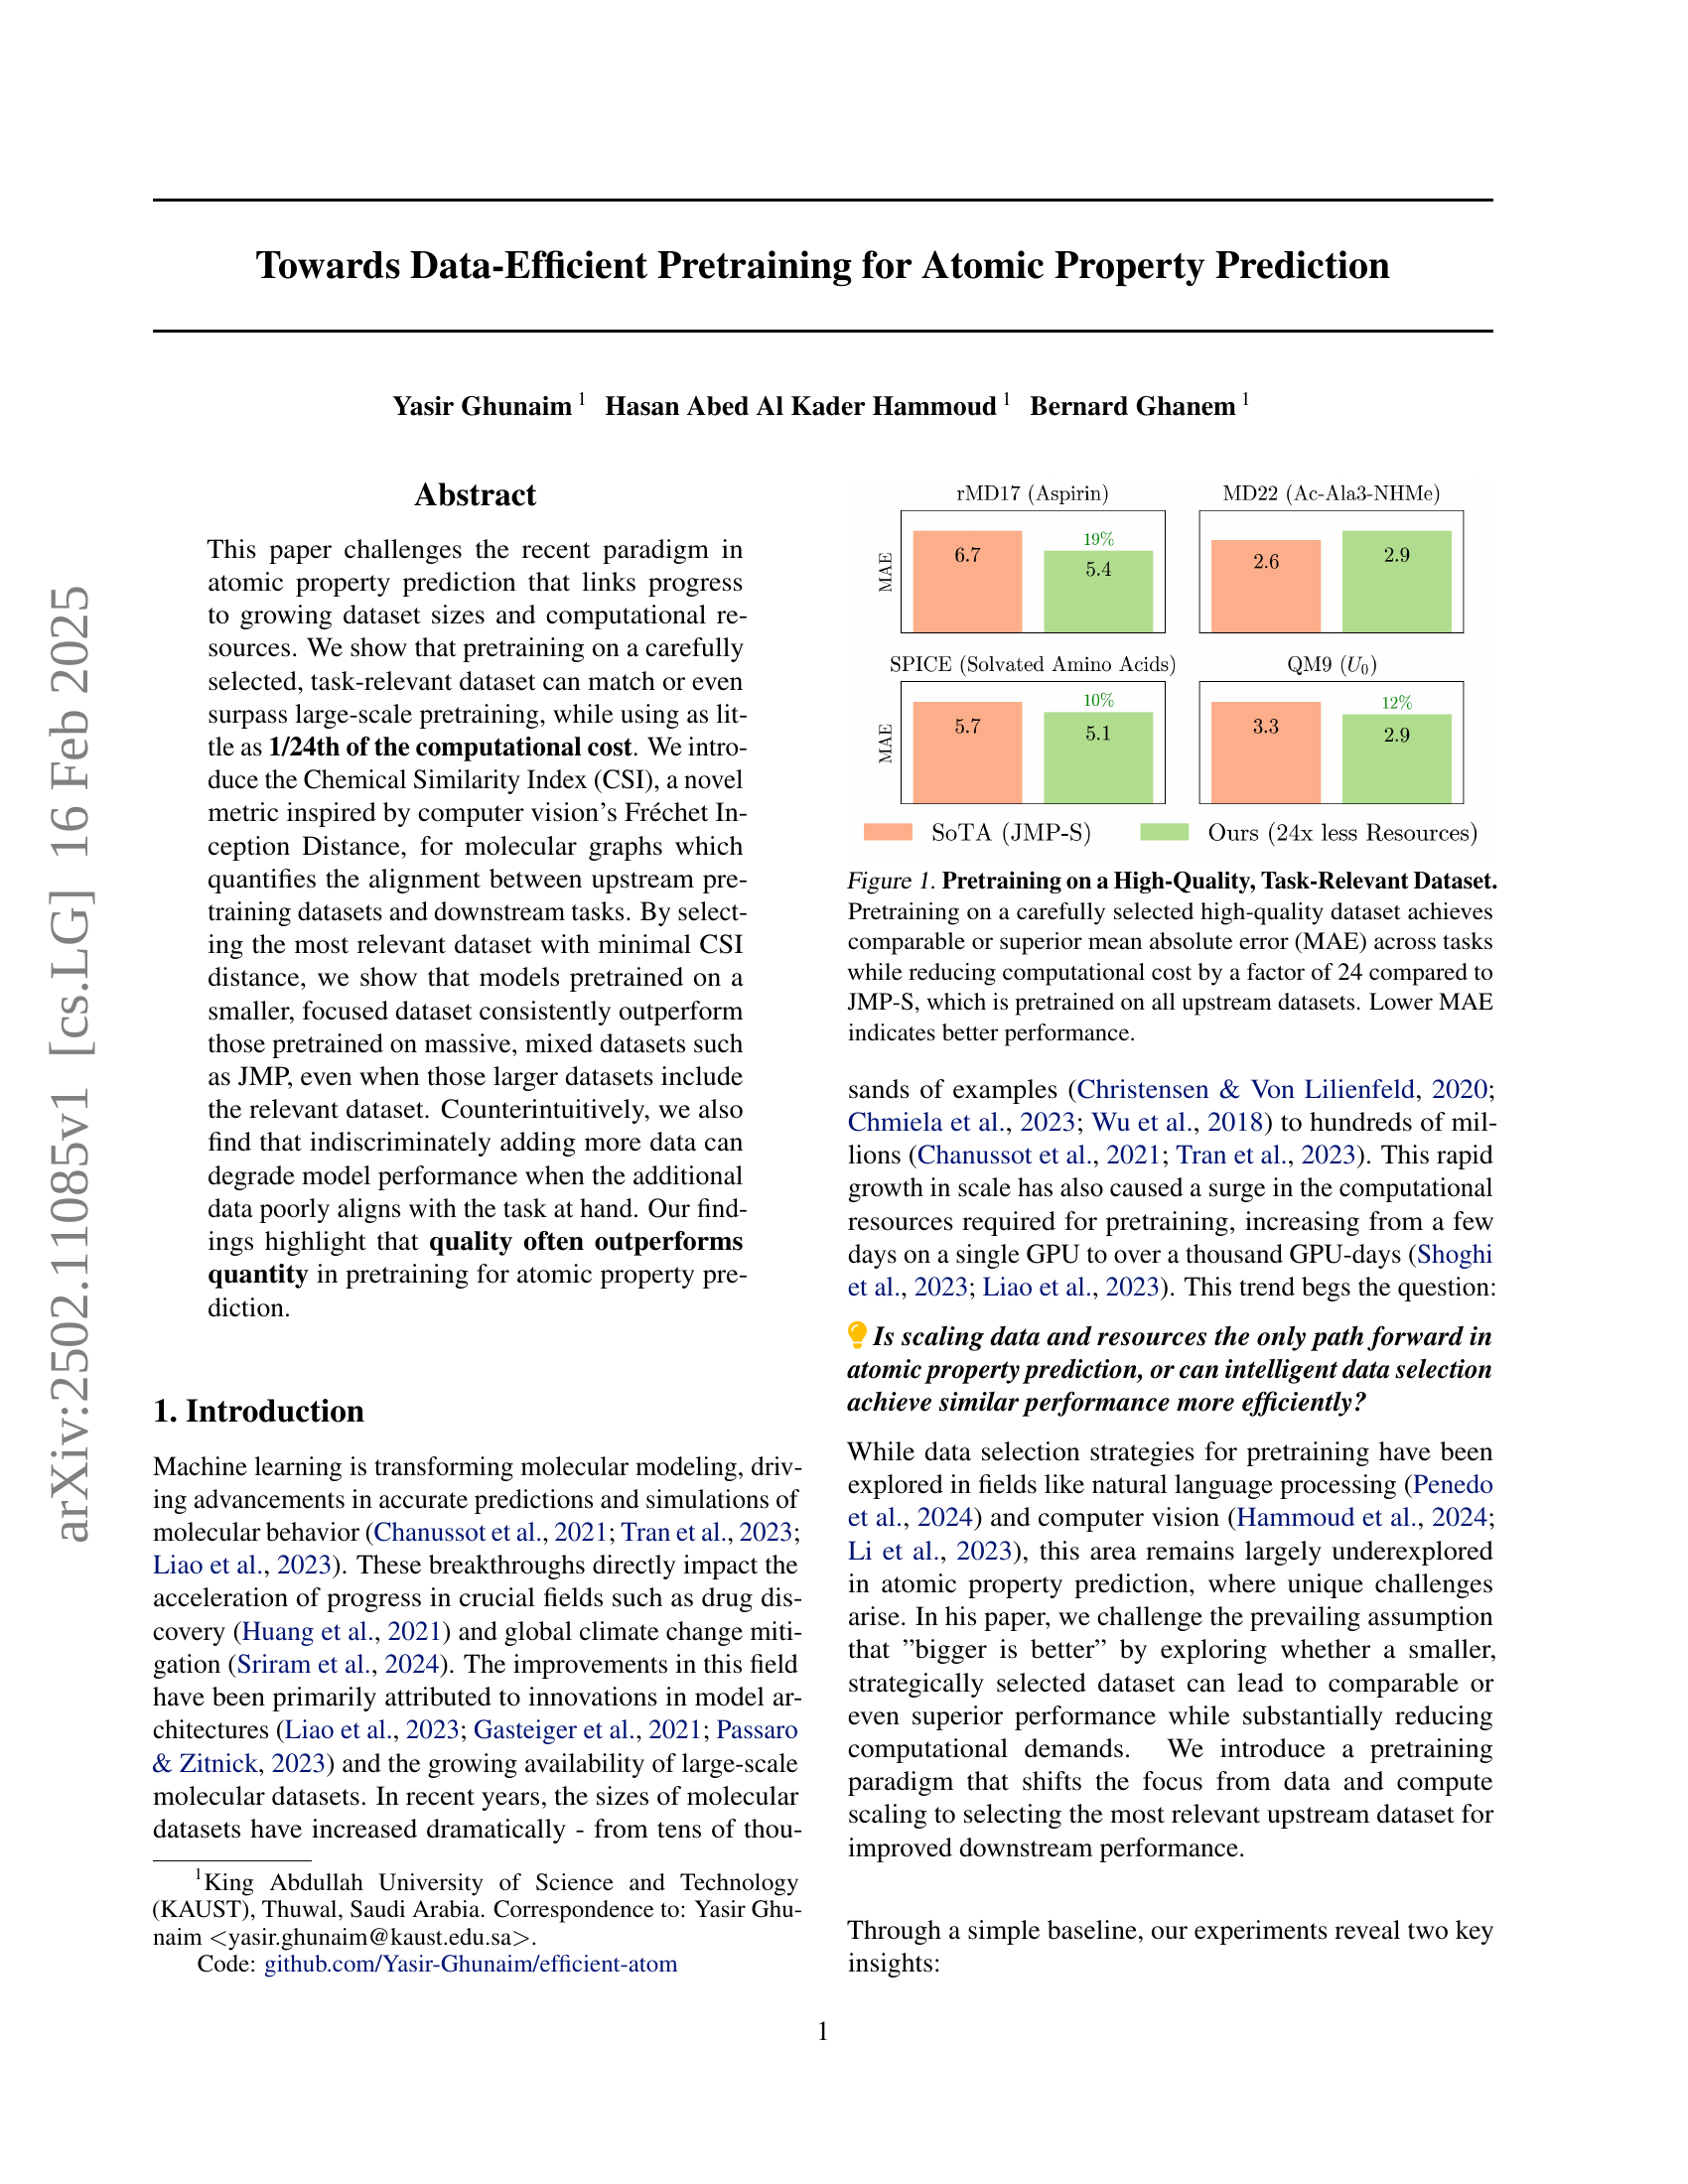
🔼 This figure demonstrates the effectiveness of using a high-quality, task-relevant dataset for pretraining in atomic property prediction. By carefully selecting a smaller, relevant dataset, the model achieves comparable or even better performance (measured by Mean Absolute Error, MAE) compared to a model (JMP-S) pretrained on a significantly larger, more diverse dataset that includes the smaller dataset. Importantly, this improvement comes with a 24-fold reduction in computational cost. Lower MAE values indicate better predictive accuracy.
read the caption
Figure 1: Pretraining on a High-Quality, Task-Relevant Dataset. Pretraining on a carefully selected high-quality dataset achieves comparable or superior mean absolute error (MAE) across tasks while reducing computational cost by a factor of 24 compared to JMP-S, which is pretrained on all upstream datasets. Lower MAE indicates better performance.
| Upstream Data | Backbone | rMD17 | MD22 | SPICE | QM9 | |
|---|---|---|---|---|---|---|
| (meV/Å) | (meV/Å) | (meV/Å) | (meV) | |||
| Mixed (Temp) | JMP-L (GemNet-OC-L) | 5.1 | 1.92 | 4.75 | 2.9 | |
| JMP-S (GemNet-OC-S) | 6.7 | 2.64 | 5.71 | 3.3 | ||
| JMP-S*(GemNet-OC-S) | 6.8 | 3.21 | 5.60 | 3.4 | ||
| ANI-1x | GemNet-OC-S | 5.4 | 2.90 | 5.13 | 2.9 | |
| Transition-1x | 10.1 | 3.73 | 7.55 | 3.2 | ||
| OC20 | 14.6 | 4.53 | 8.74 | 4.8 | ||
| OC22 | 16.0 | 5.20 | 10.73 | 5.7 | ||
| Mixed (Balanced) | GemNet-OC-S | 9.4 | 3.62 | 7.02 | 3.2 | |
| Mixed (Temp) | 11.0 | 4.03 | 7.98 | 3.6 |
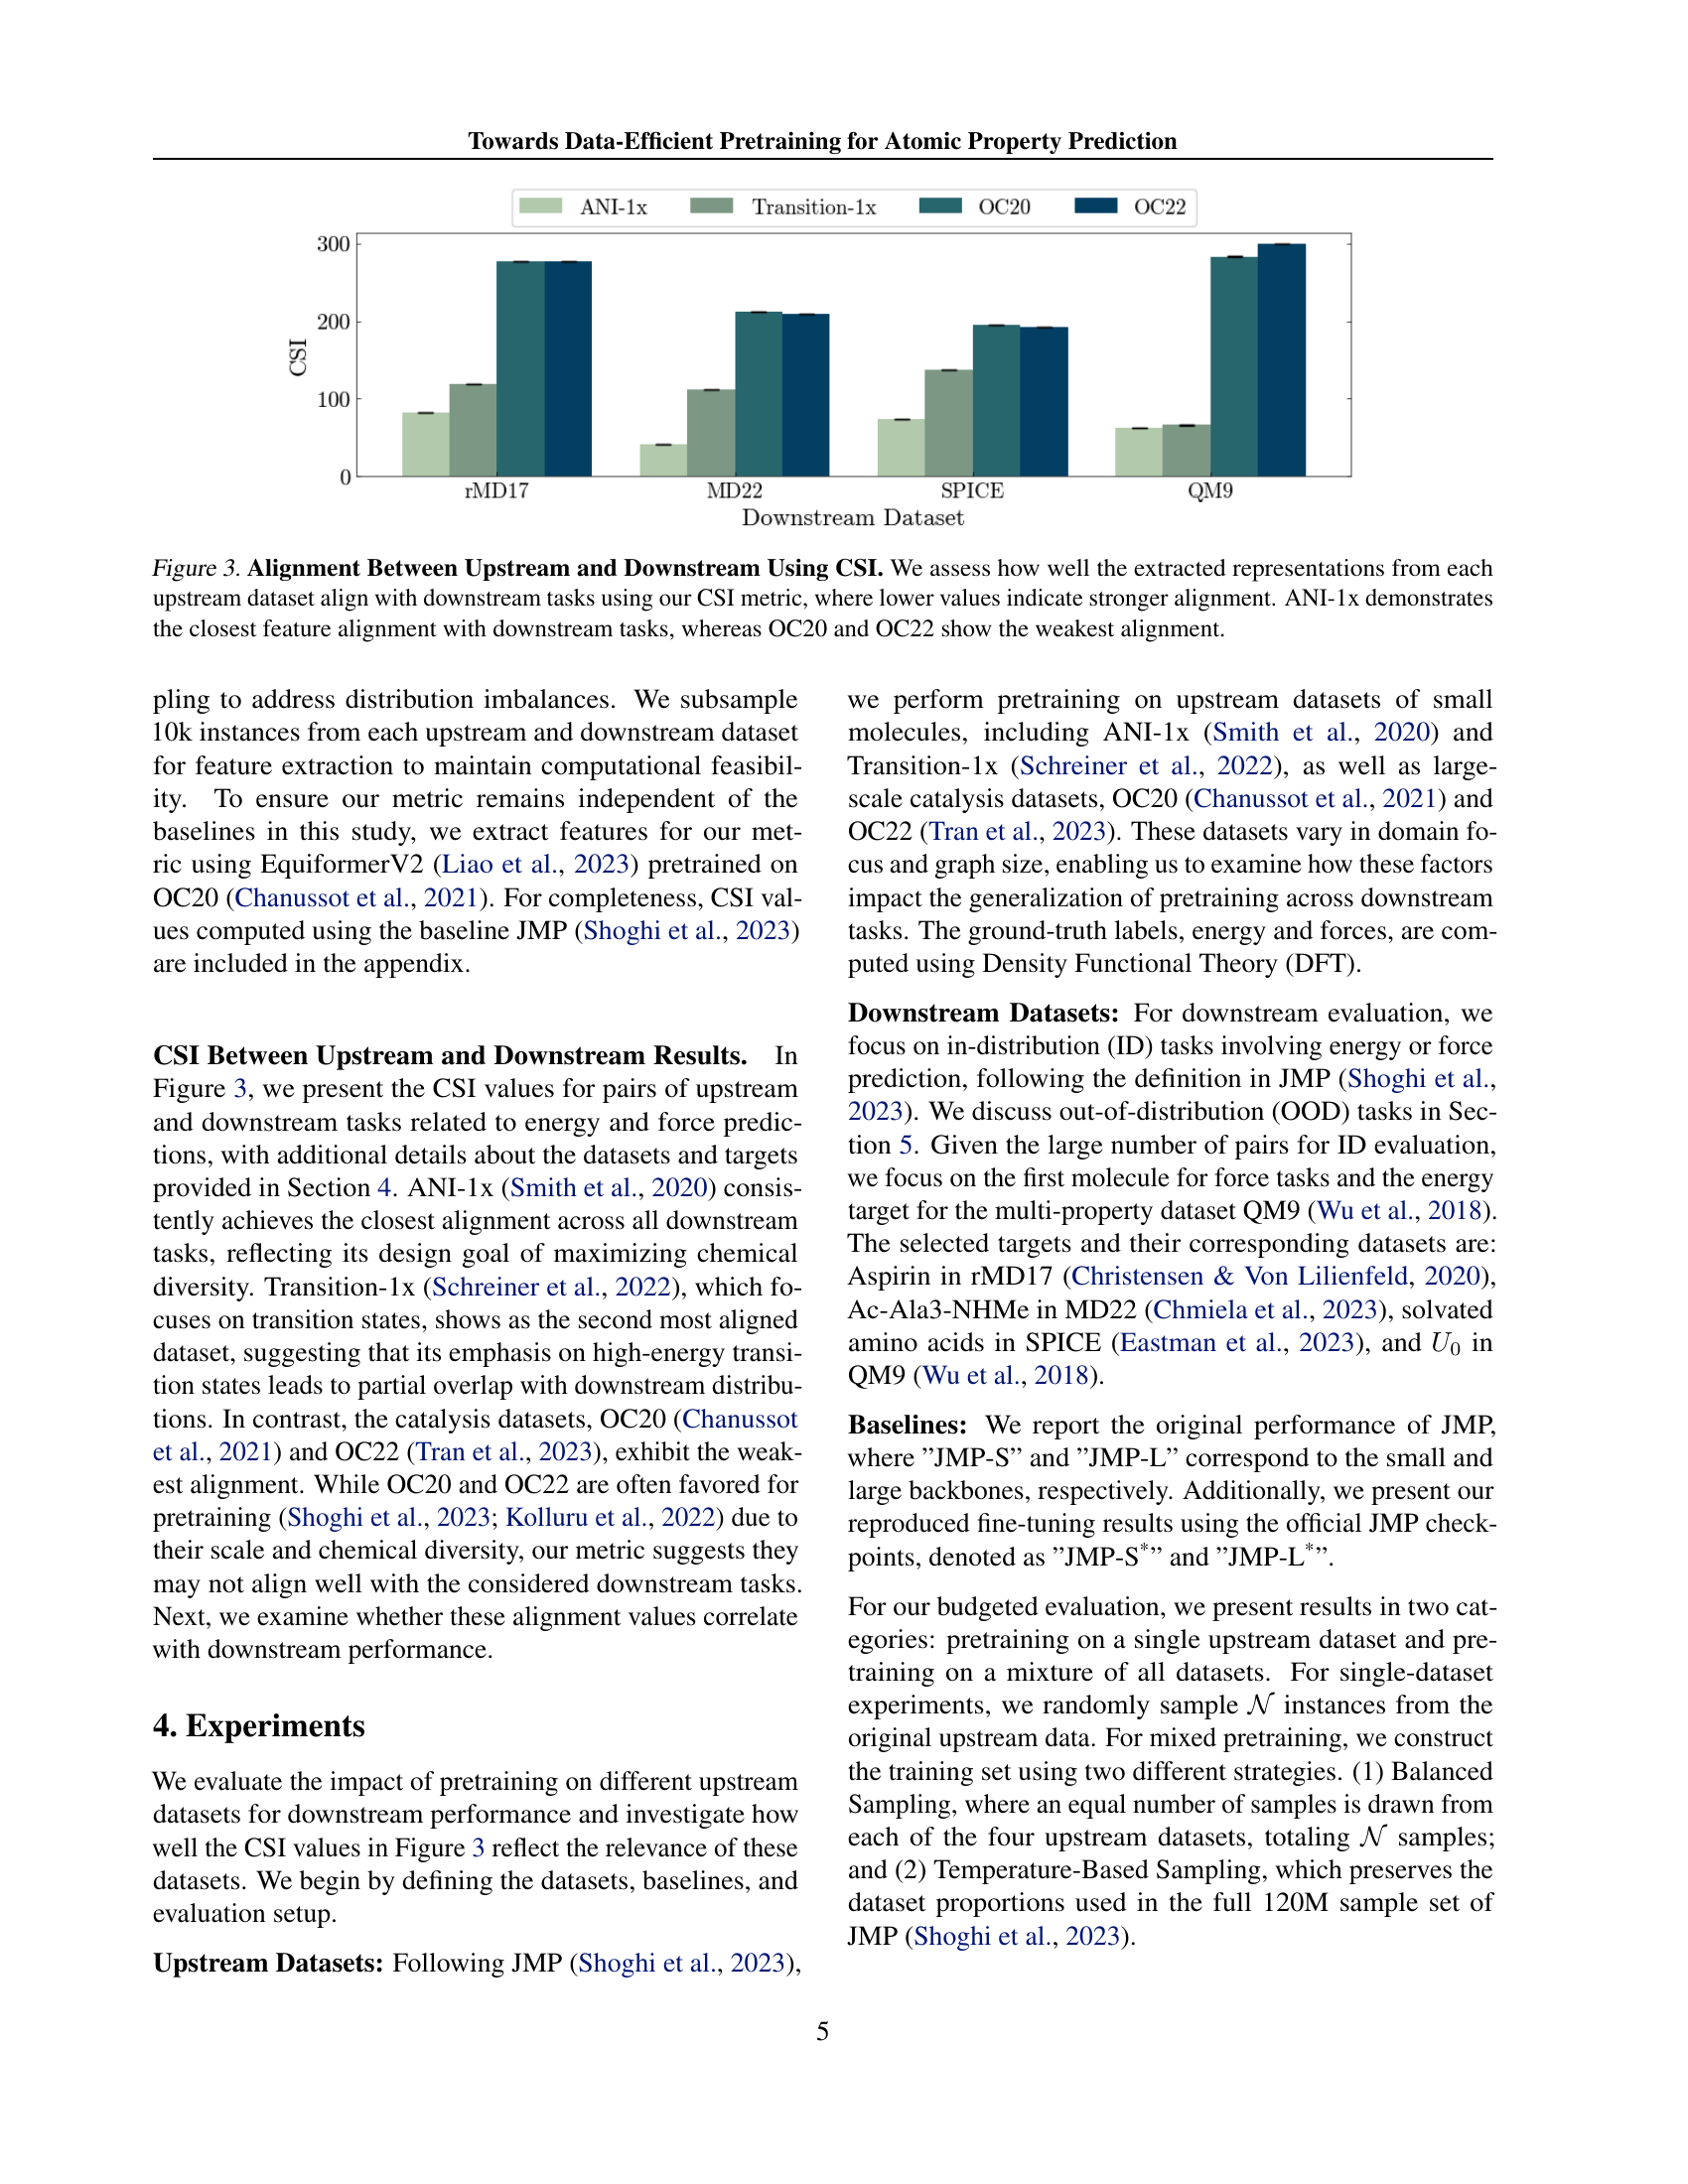
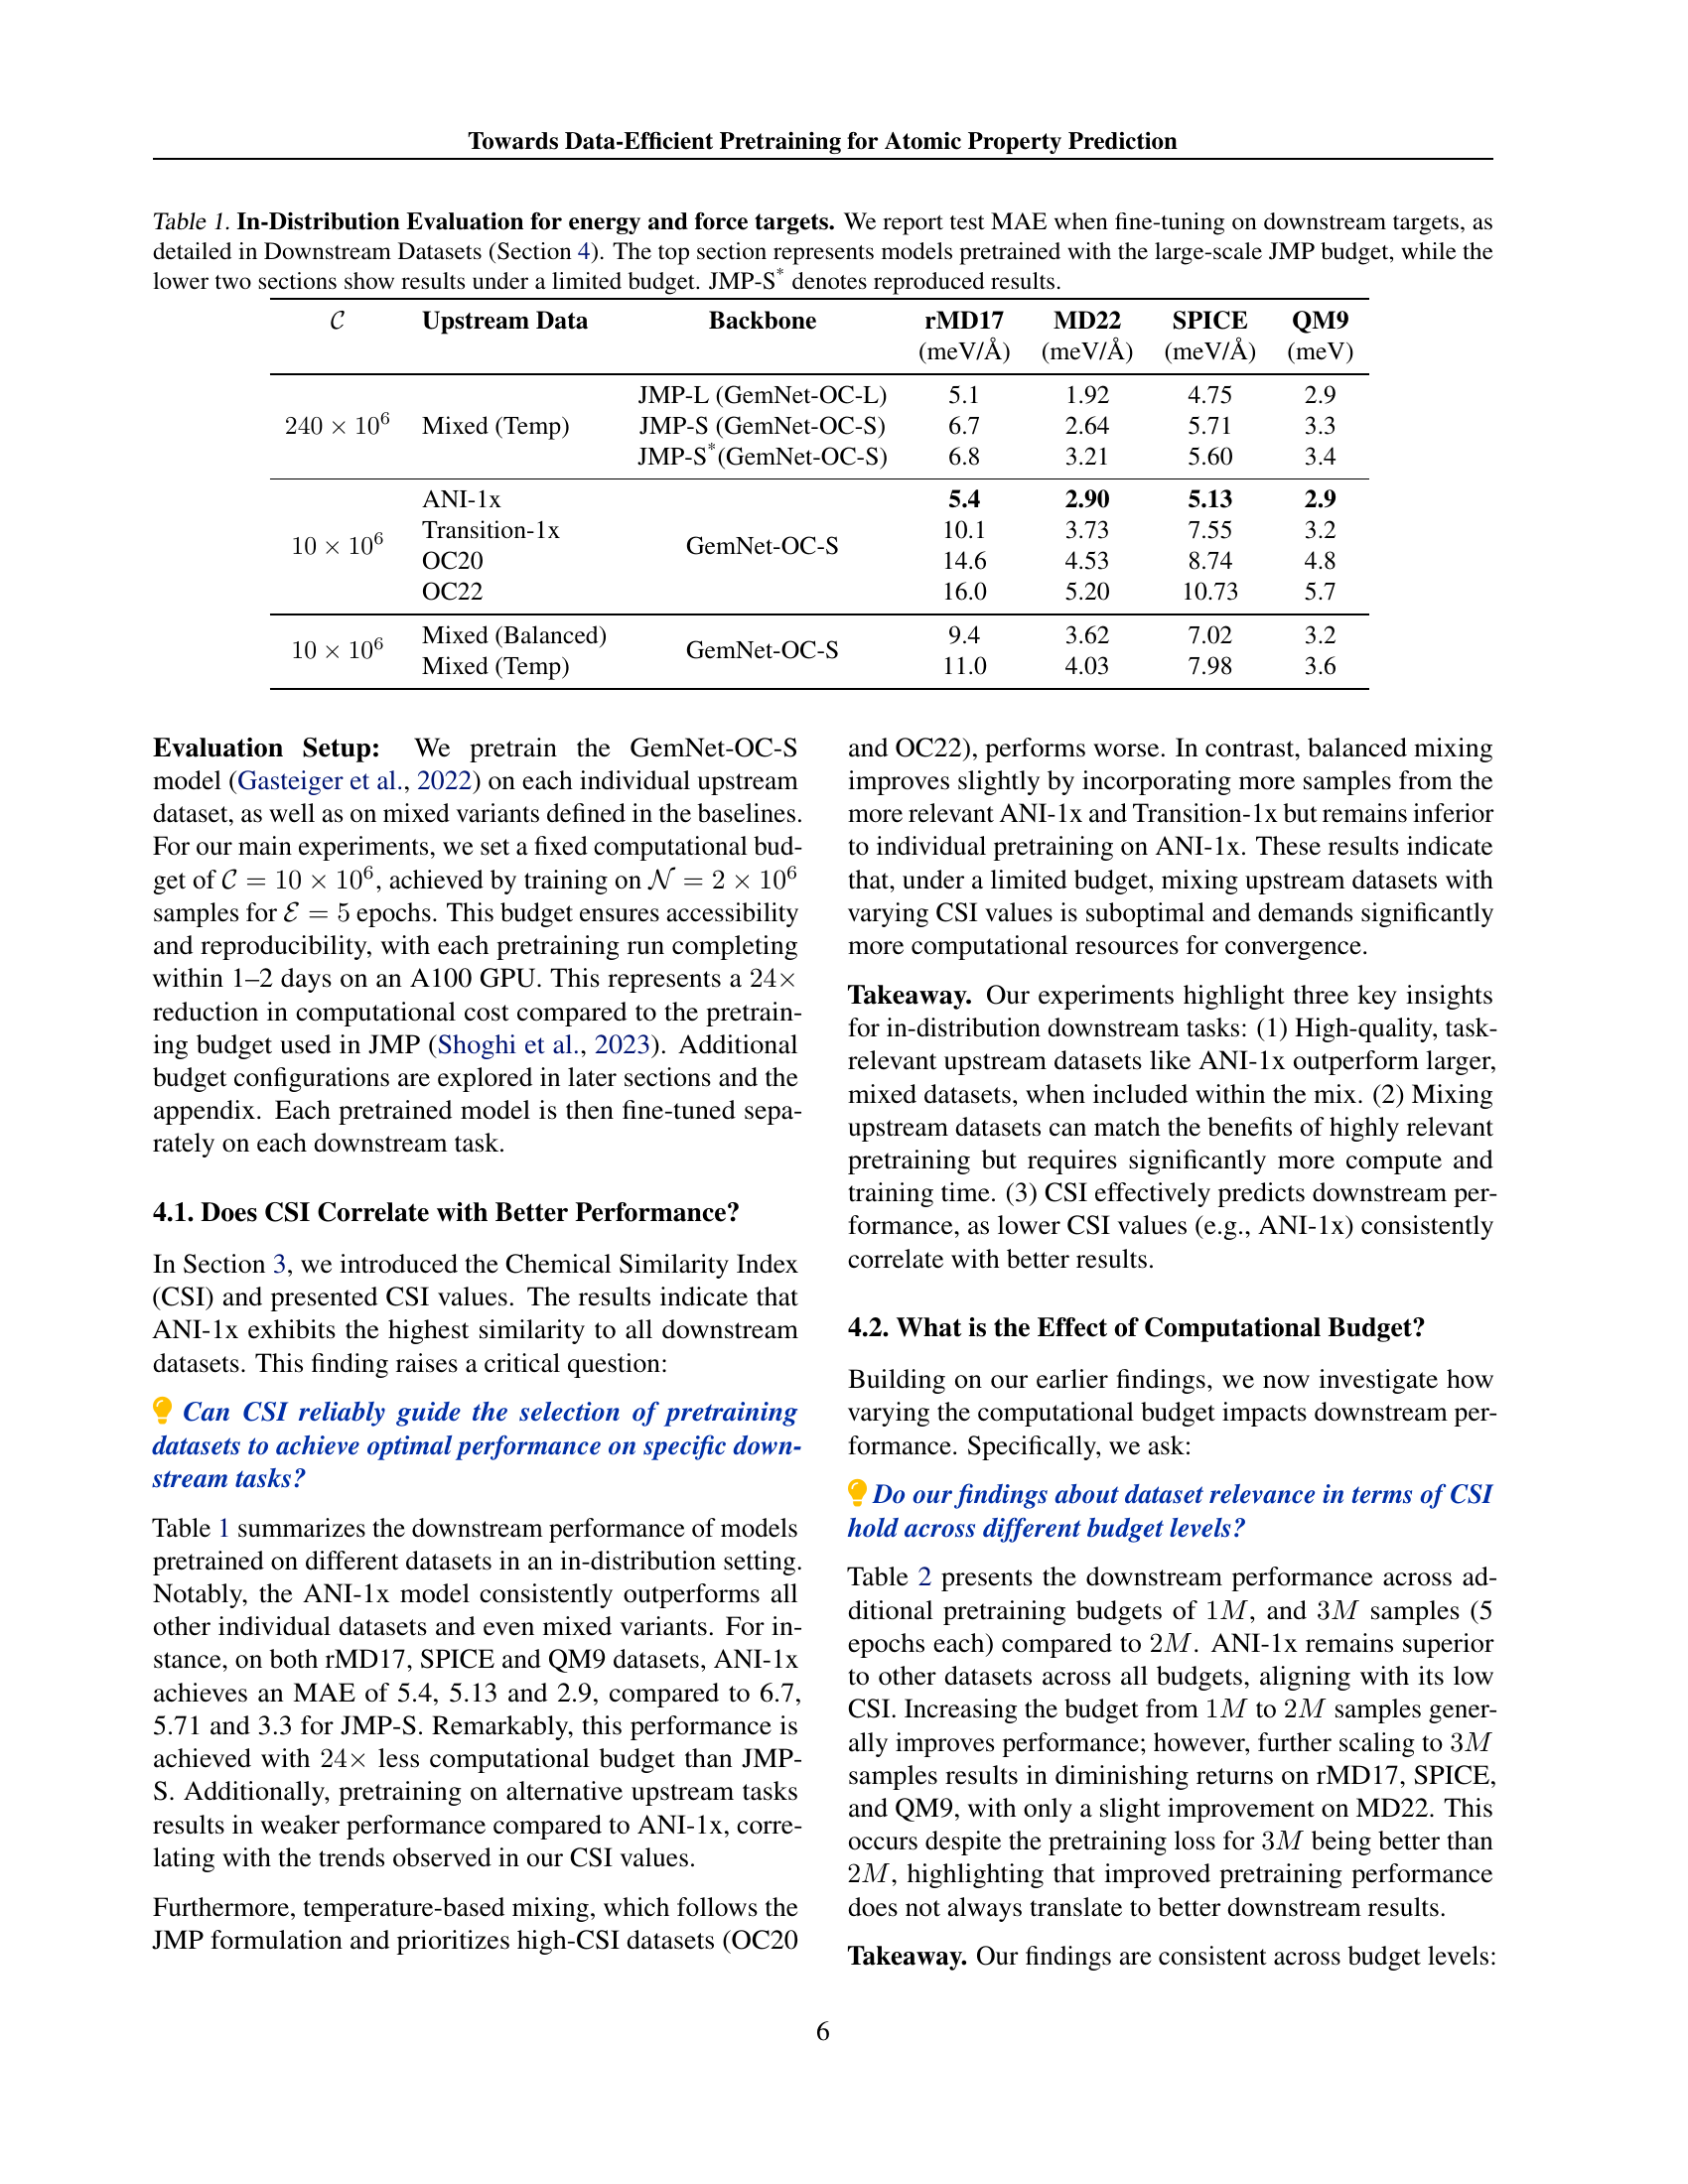
🔼 This table presents the Mean Absolute Error (MAE) results for energy and force prediction tasks on various downstream datasets. The models were fine-tuned after pretraining on different upstream datasets. The top section shows results for models pretrained using the large computational budget of the JMP method (Shoghi et al., 2023). The bottom two sections display results obtained under more limited computational budgets (10 million and 240 million samples), demonstrating the impact of reduced resources on performance. The JMP-S* row indicates reproduced results for the JMP-S model, serving as a comparison baseline.
read the caption
Table 1: In-Distribution Evaluation for energy and force targets. We report test MAE when fine-tuning on downstream targets, as detailed in Downstream Datasets (Section 4). The top section represents models pretrained with the large-scale JMP budget, while the lower two sections show results under a limited budget. JMP-S* denotes reproduced results.
In-depth insights#
Data-Efficient Pretraining#
The concept of ‘Data-Efficient Pretraining’ in the context of atomic property prediction is a significant contribution because it challenges the prevailing paradigm that larger datasets automatically lead to better performance. The research highlights the crucial role of data relevance, arguing that carefully selecting a smaller, task-relevant dataset for pretraining can significantly outperform using massive, diverse datasets. This approach not only achieves comparable or even superior results but drastically reduces the computational cost, potentially by orders of magnitude. The Chemical Similarity Index (CSI), a novel metric inspired by FID, is introduced to quantify the alignment between upstream pretraining data and downstream tasks. CSI serves as a valuable tool for guiding data selection, facilitating the identification of highly relevant datasets and thus, contributing towards more efficient and cost-effective model development in this computationally intensive field. The findings strongly suggest that a focus on data quality, as measured by CSI, is often superior to simply increasing data quantity in atomic property prediction pretraining.
CSI Metric#
The paper introduces a novel metric, the Chemical Similarity Index (CSI), inspired by the Fréchet Inception Distance (FID) from computer vision. CSI’s core function is to quantify the alignment between upstream pretraining datasets and downstream tasks in atomic property prediction. This is crucial because it allows researchers to select the most relevant pretraining dataset for a given downstream task, thus maximizing efficiency and often improving performance. Unlike simply increasing dataset size, CSI guides a data-driven, task-specific approach. The CSI metric’s effectiveness is demonstrated empirically, showing a strong correlation between low CSI values (indicating high similarity) and improved downstream performance. This suggests that carefully selecting a high-quality, task-relevant pretraining dataset is often more beneficial than using larger, less relevant datasets. The paper also explores different design considerations for CSI, including feature type, aggregation strategies, and sampling techniques in handling long-tail distributions which are common in molecular datasets. The careful consideration of these aspects underscores the CSI’s robustness and adaptability for the unique challenges posed by the molecular domain. Overall, the CSI metric represents a valuable tool for efficient pretraining in atomic property prediction.
Budget Impact#
A significant portion of the research focuses on computational efficiency, especially concerning the trade-offs between dataset size and training epochs under a fixed computational budget. The authors introduce a novel metric, the Chemical Similarity Index (CSI), to guide dataset selection, prioritizing quality over quantity. Their experiments demonstrate that smaller, carefully chosen datasets, guided by CSI, can match or surpass the performance of models trained on much larger datasets. This is particularly impactful as it drastically reduces computational cost, potentially making advanced molecular modeling accessible to researchers with fewer resources. The analysis of budget impact shows that indiscriminately increasing dataset size does not always translate to improved performance; in fact, adding less-relevant data can be detrimental. Optimal performance often hinges on the right balance between dataset quality and computational budget, highlighting the importance of intelligent data selection and efficient training strategies.
OOD Generalization#
The concept of out-of-distribution (OOD) generalization in the context of atomic property prediction is crucial. The study’s findings suggest that while the Chemical Similarity Index (CSI) effectively predicts performance on in-distribution (ID) tasks, its accuracy on OOD tasks is less consistent. The success of pretraining on a specific dataset heavily depends on the similarity between the training dataset and the downstream task. This highlights a critical limitation: a highly effective model trained on a certain type of molecules might perform poorly on dissimilar molecules. Therefore, developing methods to effectively measure and improve the generalization capabilities of models across diverse molecular datasets and properties is necessary. This would entail the development of more robust metrics that can capture subtle differences in molecular structure and properties, and new techniques to improve the model’s ability to adapt to unseen data. Further research should focus on more robust feature extraction and representation methods, and the creation of broader, more representative pretraining datasets. Investigating alternative pretraining strategies, such as multi-task or transfer learning approaches, is also critical for improving OOD generalization. This is essential to enhance the reliability and applicability of machine learning methods in the real-world applications of material science and drug discovery.
Future Directions#
Future research could explore expanding the Chemical Similarity Index (CSI) to encompass more diverse molecular representations and properties, potentially improving its predictive power for out-of-distribution tasks. Investigating alternative data selection strategies, beyond CSI-guided selection, could reveal further efficiencies in pretraining. The impact of different model architectures on the effectiveness of data-efficient pretraining warrants further study. Exploring the potential of dataset distillation techniques to create compact, representative subsets from large datasets could drastically reduce computational costs. Finally, a more in-depth analysis of the interplay between dataset size, training epochs, and model complexity under various computational budgets is crucial for establishing optimal training parameters and further enhancing the efficiency of pretraining methods for atomic property prediction.
More visual insights#
More on figures

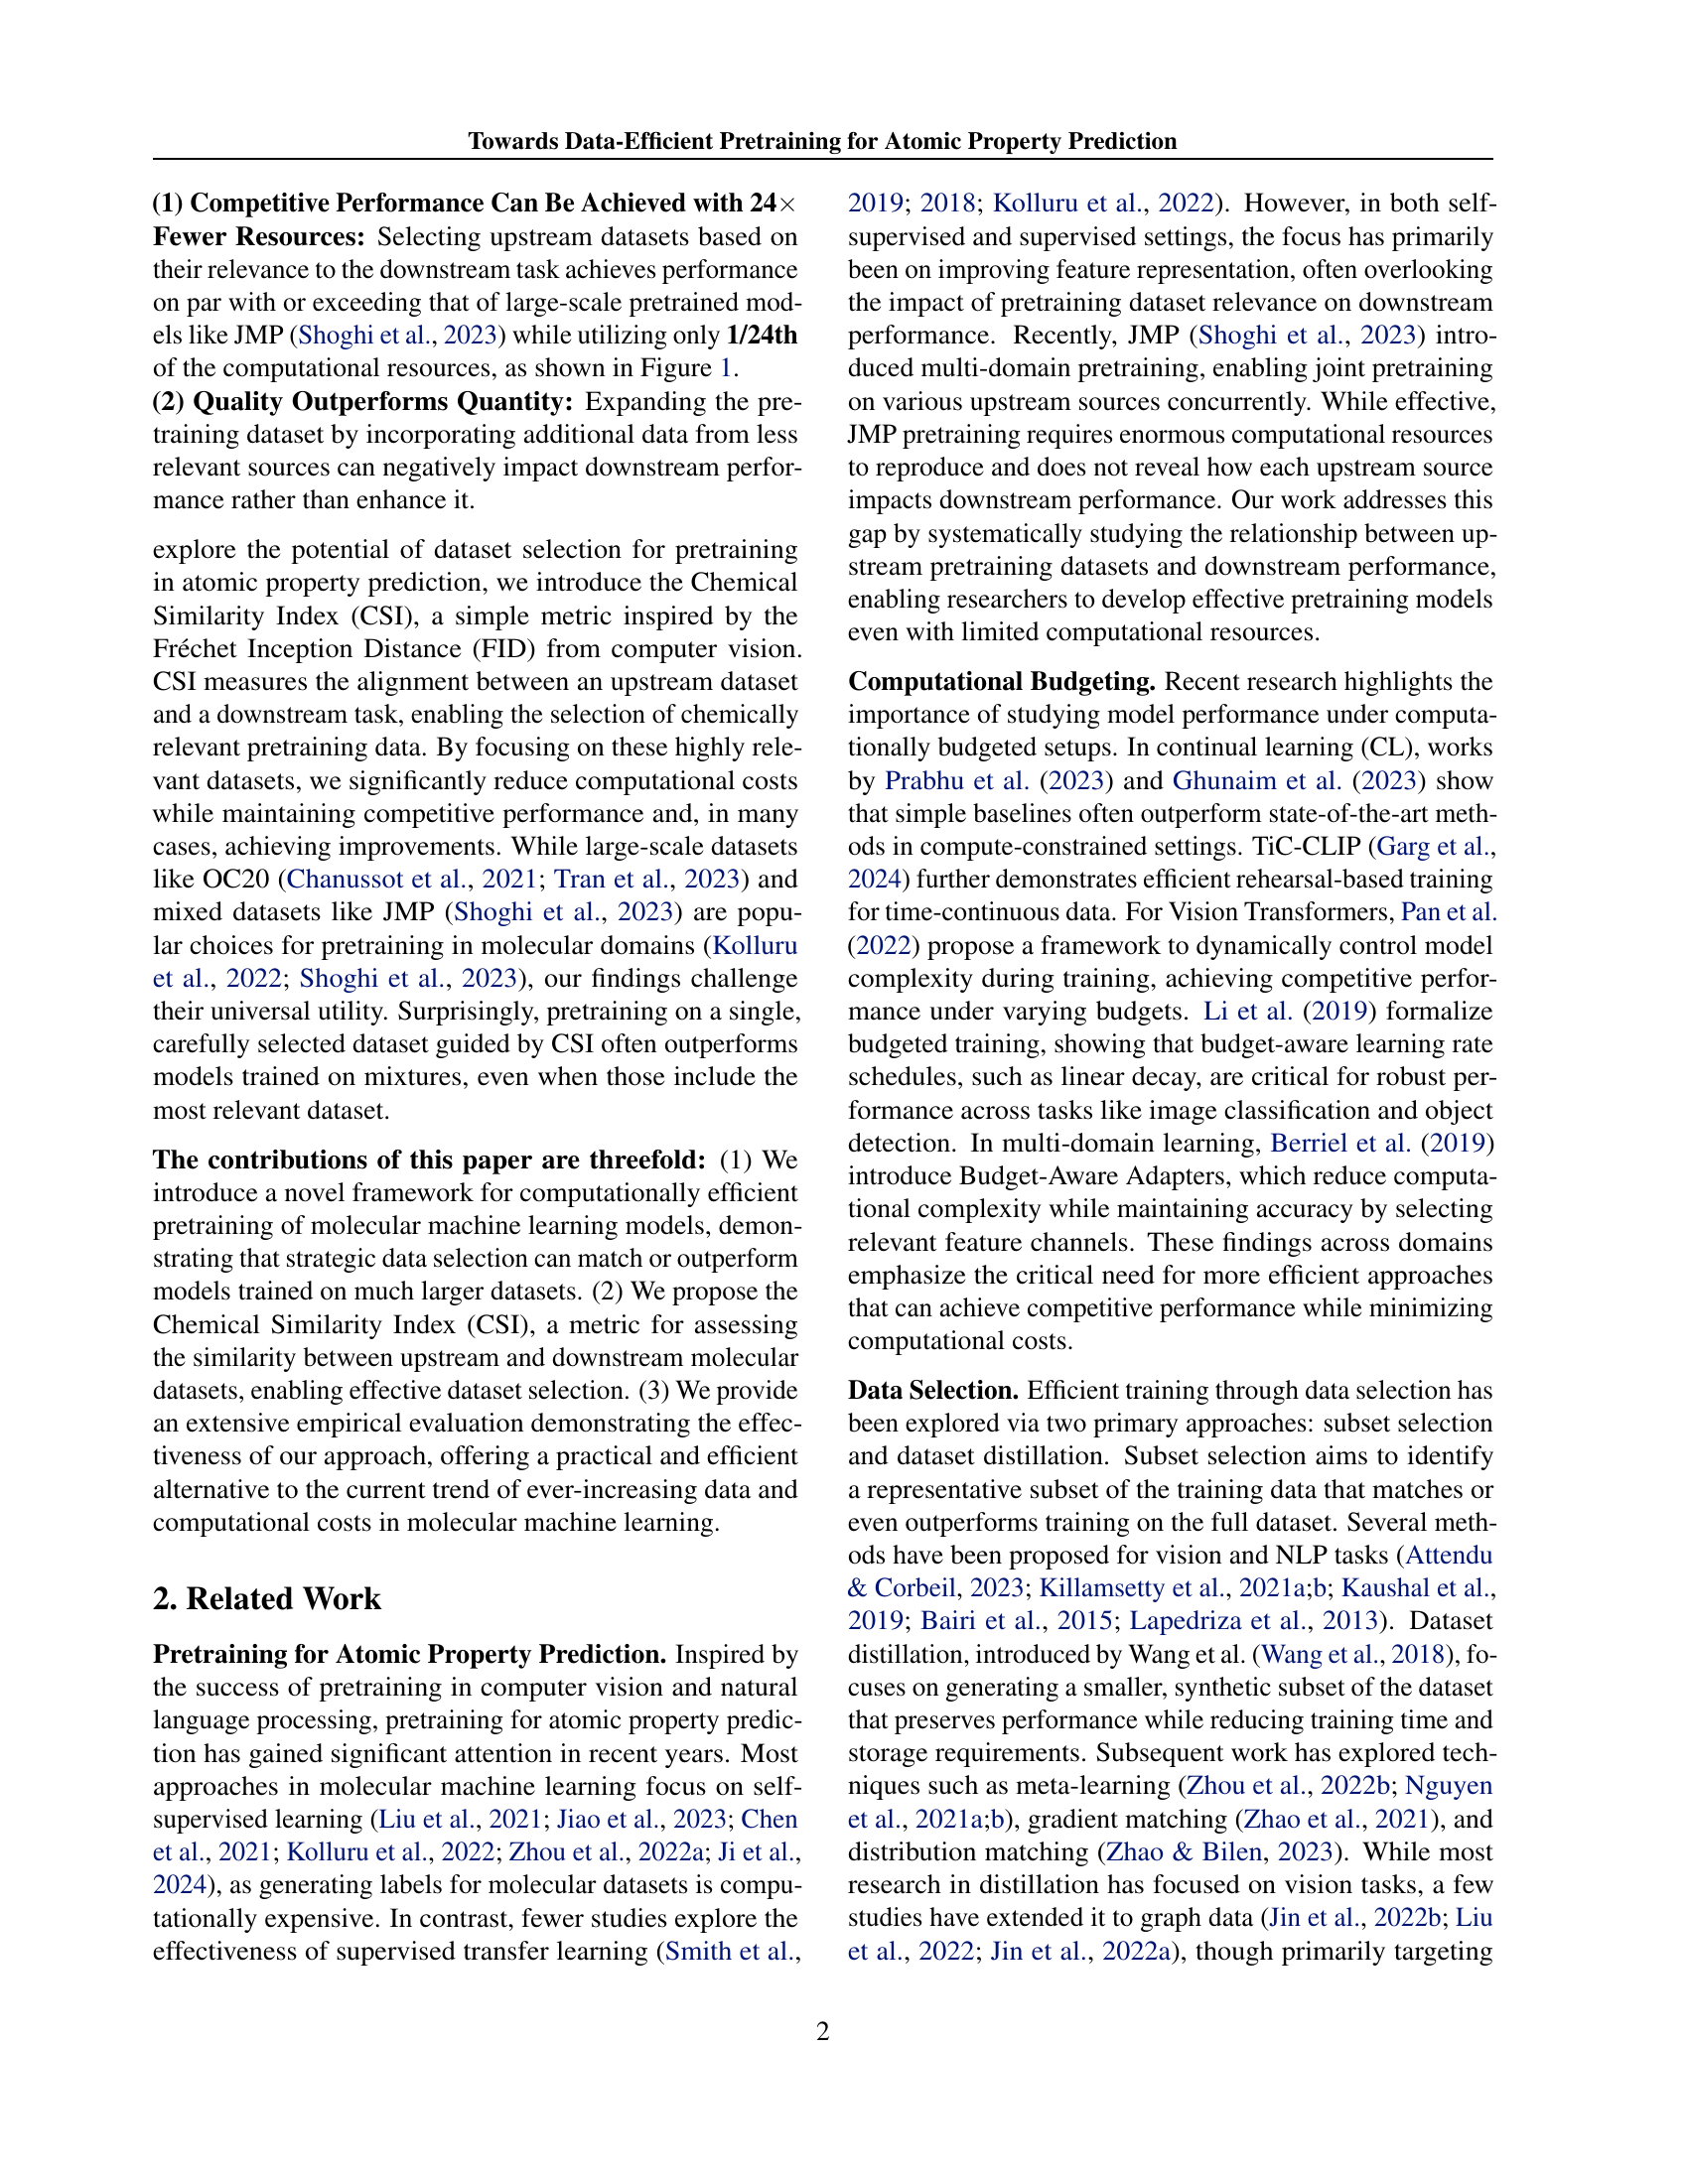
🔼 This figure illustrates the pipeline for pretraining and finetuning a model for atomic property prediction. It highlights a two-stage process. First, a dataset selection stage uses a distance metric (δ) to choose the most relevant upstream dataset (from a set of candidate datasets D(1), D(2),…D(K)) for pretraining, based on its similarity to the downstream task dataset (Dd). Second, a limited budget pretraining stage is employed, where a subset of N samples are randomly selected from the chosen upstream dataset and trained for E epochs, resulting in a computational budget of C = E * N. The pretrained backbone (θ(1)b) from this process is then fine-tuned using the downstream dataset to get the final model parameters (θd).
read the caption
Figure 2: Pipeline Overview. Our paradigm for pretraining and finetuning consists of two new components: (1) Dataset Selection Stage, where a distance metric δ𝛿\deltaitalic_δ is employed to identify the dataset that is most similar to our downstream task dataset 𝒟dsubscript𝒟𝑑\mathcal{D}_{d}caligraphic_D start_POSTSUBSCRIPT italic_d end_POSTSUBSCRIPT, in this case 𝒟u(1)superscriptsubscript𝒟𝑢1\mathcal{D}_{u}^{(1)}caligraphic_D start_POSTSUBSCRIPT italic_u end_POSTSUBSCRIPT start_POSTSUPERSCRIPT ( 1 ) end_POSTSUPERSCRIPT. This selected dataset is then used for pretraining the model. (2) Limited Budget Pretraining, where we impose a training budget by subsampling 𝒩𝒩\mathcal{N}caligraphic_N random samples from 𝒟u(1)superscriptsubscript𝒟𝑢1\mathcal{D}_{u}^{(1)}caligraphic_D start_POSTSUBSCRIPT italic_u end_POSTSUBSCRIPT start_POSTSUPERSCRIPT ( 1 ) end_POSTSUPERSCRIPT and training the model for ℰℰ\mathcal{E}caligraphic_E epochs. This results in a computational budget of 𝒞=ℰ×𝒩𝒞ℰ𝒩\mathcal{C}=\mathcal{E}\times\mathcal{N}caligraphic_C = caligraphic_E × caligraphic_N. The pretrained backbone θb(1)∗superscriptsubscript𝜃𝑏1\theta_{b}^{(1)*}italic_θ start_POSTSUBSCRIPT italic_b end_POSTSUBSCRIPT start_POSTSUPERSCRIPT ( 1 ) ∗ end_POSTSUPERSCRIPT is subsequently finetuned on the downstream task dataset 𝒟dsubscript𝒟𝑑\mathcal{D}_{d}caligraphic_D start_POSTSUBSCRIPT italic_d end_POSTSUBSCRIPT to obtain the final model parameters θd∗superscriptsubscript𝜃𝑑\theta_{d}^{*}italic_θ start_POSTSUBSCRIPT italic_d end_POSTSUBSCRIPT start_POSTSUPERSCRIPT ∗ end_POSTSUPERSCRIPT.

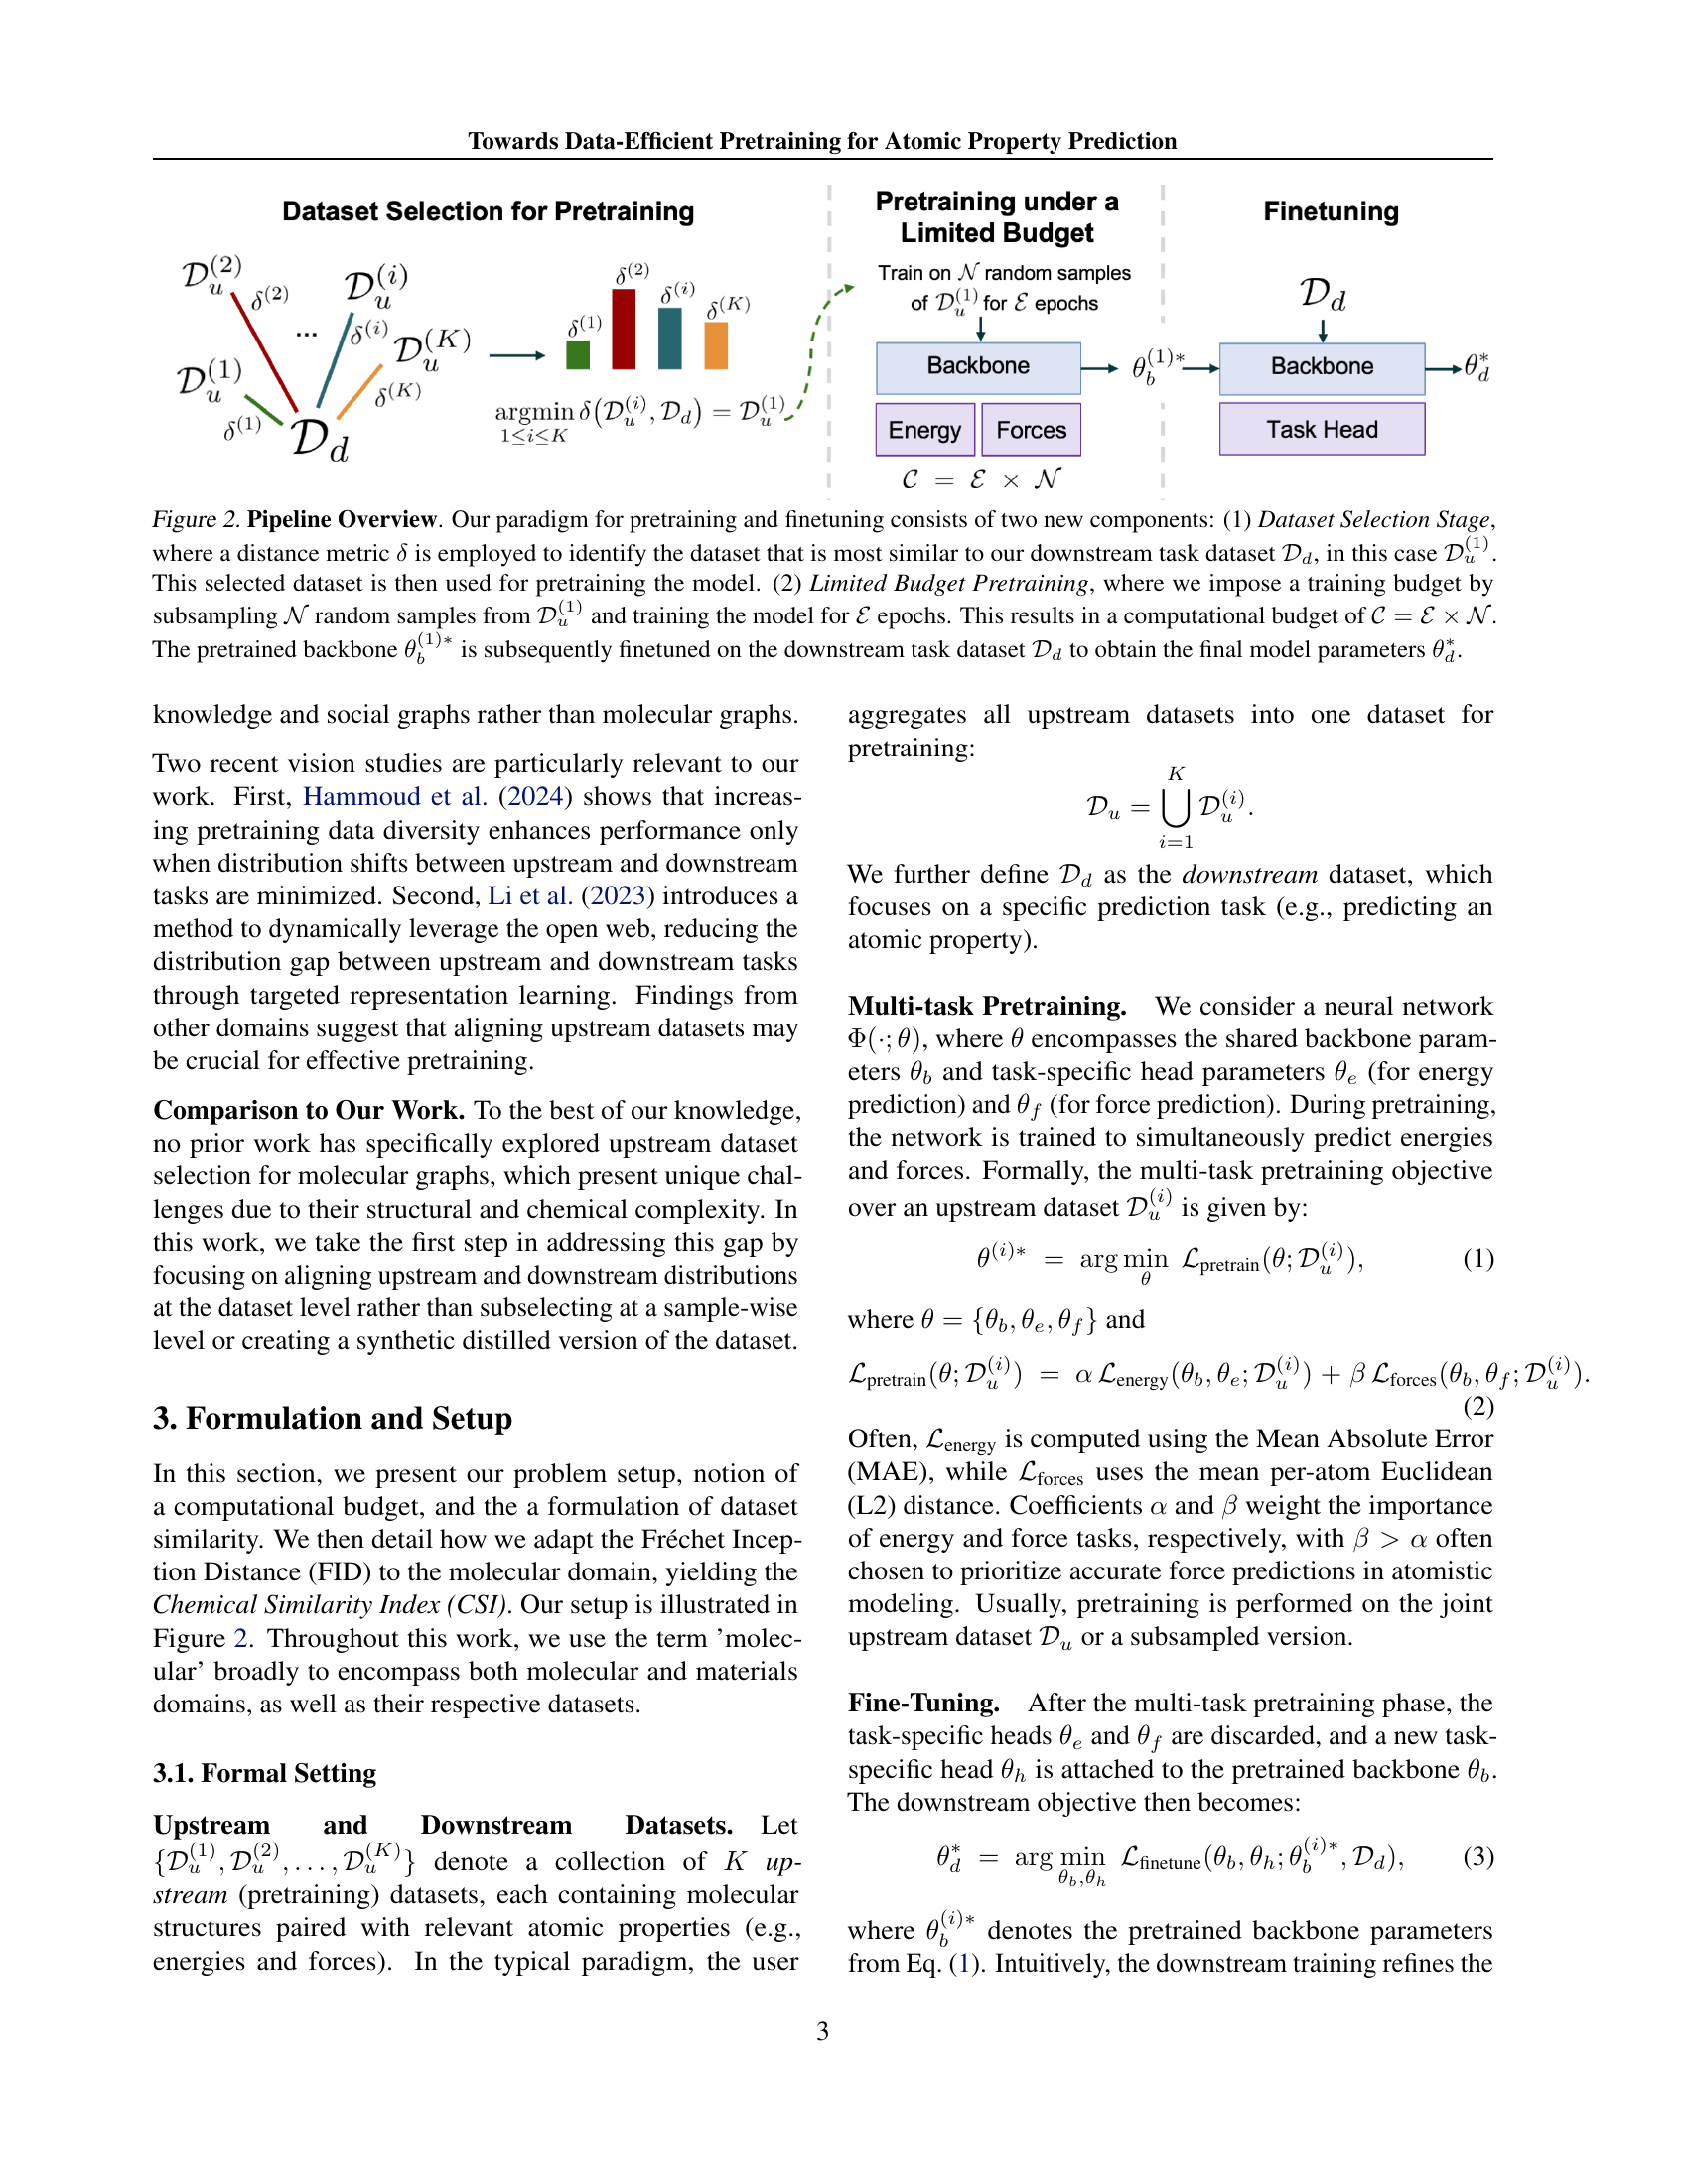
🔼 This figure displays the Chemical Similarity Index (CSI) values, which measure the alignment between different upstream datasets and various downstream tasks. Lower CSI values represent stronger alignment. The results show that ANI-1x exhibits the strongest alignment with all downstream tasks, indicating its high relevance for pretraining. Conversely, OC20 and OC22 demonstrate the weakest alignment, suggesting that they might be less suitable for these specific downstream tasks. This highlights the importance of selecting task-relevant upstream datasets for effective pretraining.
read the caption
Figure 3: Alignment Between Upstream and Downstream Using CSI. We assess how well the extracted representations from each upstream dataset align with downstream tasks using our CSI metric, where lower values indicate stronger alignment. ANI-1x demonstrates the closest feature alignment with downstream tasks, whereas OC20 and OC22 show the weakest alignment.
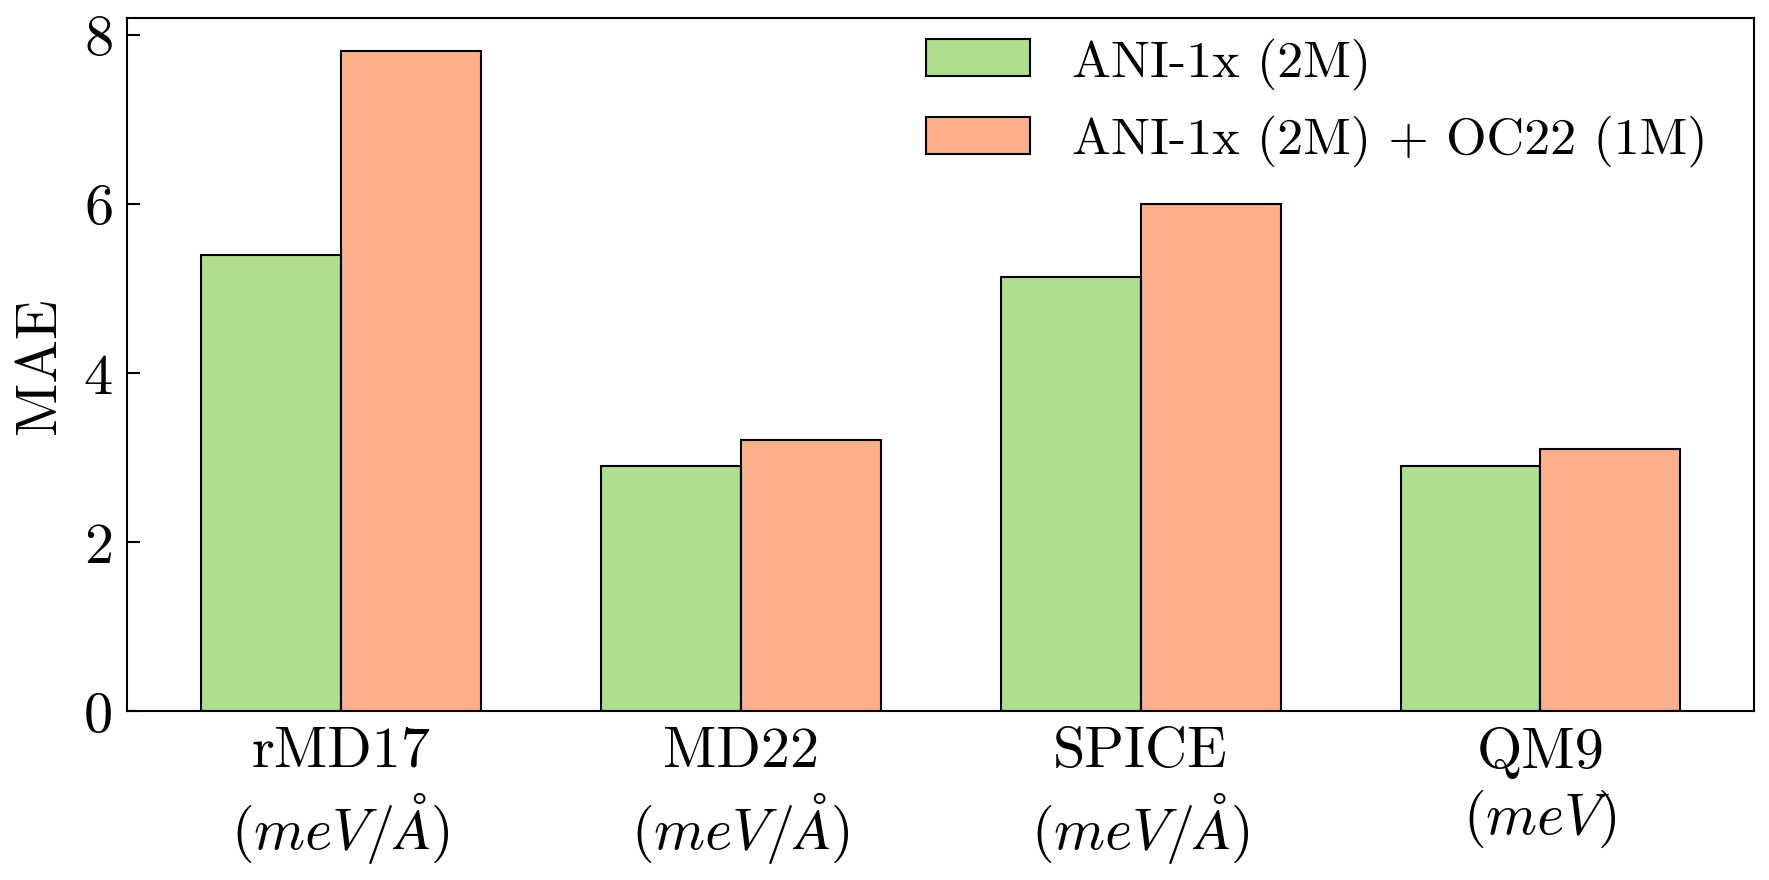
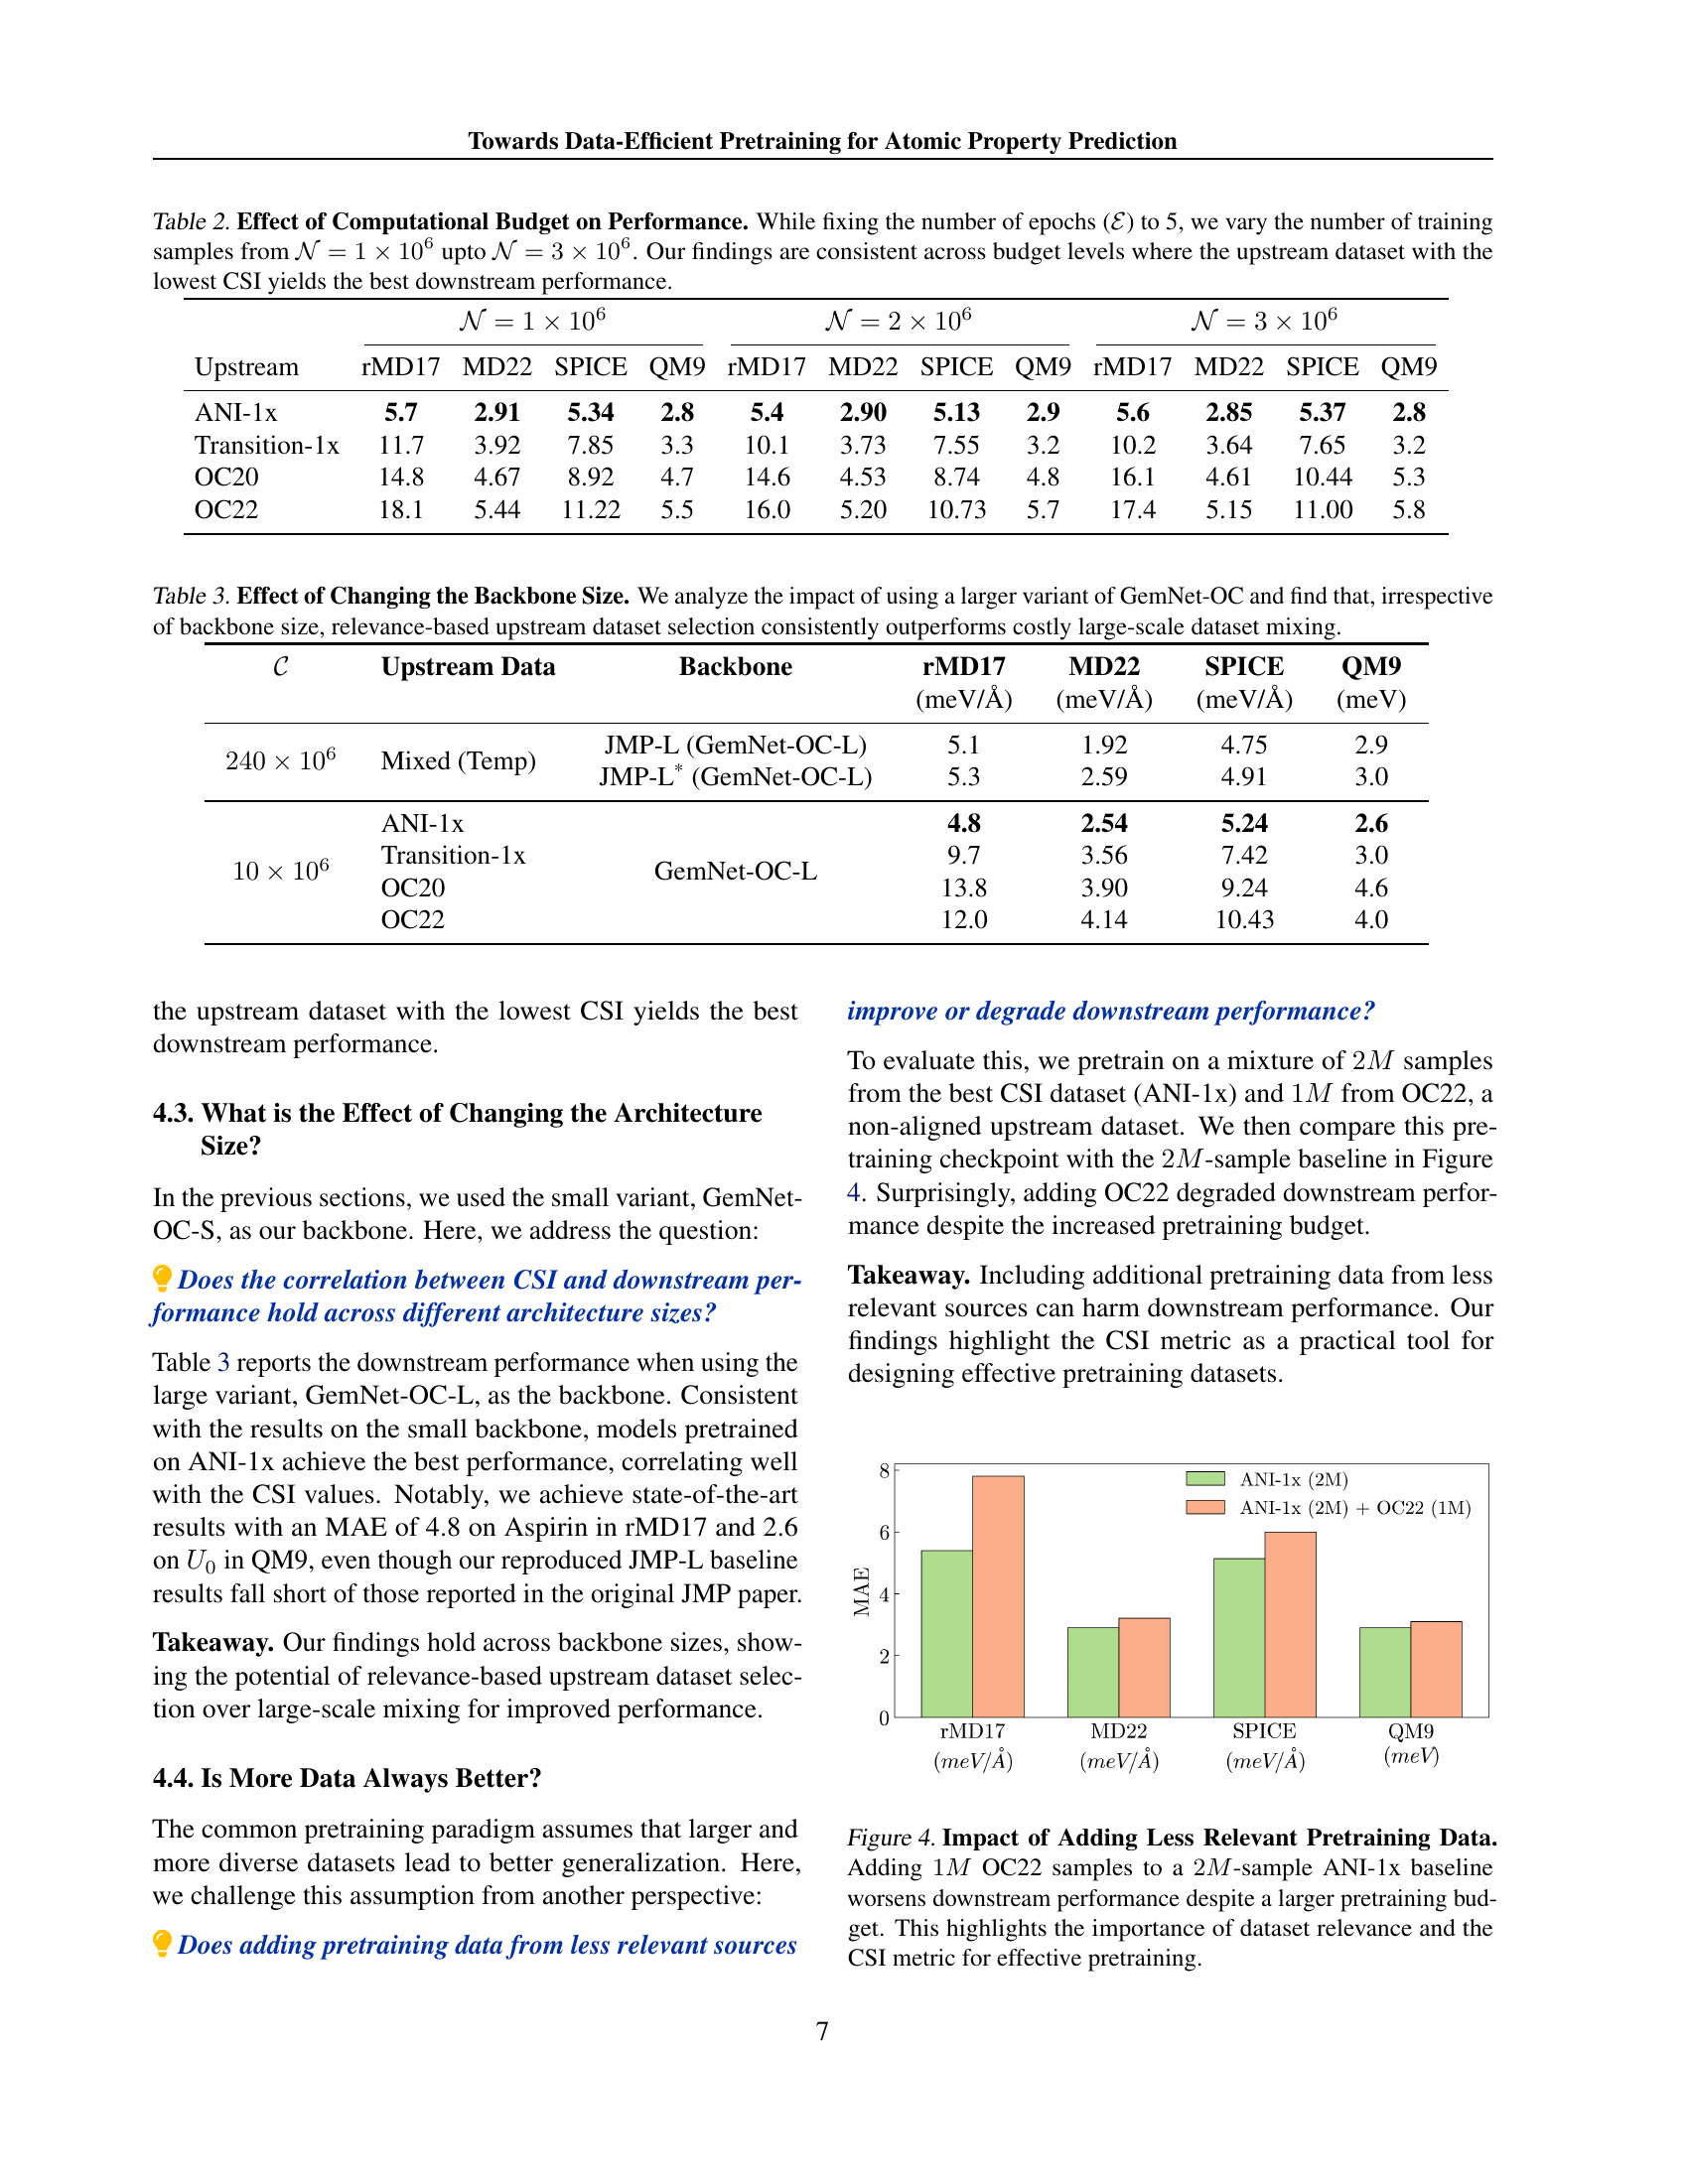
🔼 This figure demonstrates the effect of adding less relevant pretraining data to a model already pretrained on a relevant dataset. Specifically, it shows the downstream performance of a model pretrained on 2 million samples from the ANI-1x dataset (a high-quality dataset highly relevant to the downstream tasks), and then further pretrained with an additional 1 million samples from the OC22 dataset (a less relevant dataset). Despite the increase in the total amount of training data (a larger pretraining budget), the inclusion of the OC22 data negatively impacts the model’s performance on downstream tasks. This result underlines the importance of selecting relevant pretraining data and highlights the Chemical Similarity Index (CSI) as a valuable metric for evaluating data relevance and guiding effective pretraining.
read the caption
Figure 4: Impact of Adding Less Relevant Pretraining Data. Adding 1M1𝑀1M1 italic_M OC22 samples to a 2M2𝑀2M2 italic_M-sample ANI-1x baseline worsens downstream performance despite a larger pretraining budget. This highlights the importance of dataset relevance and the CSI metric for effective pretraining.

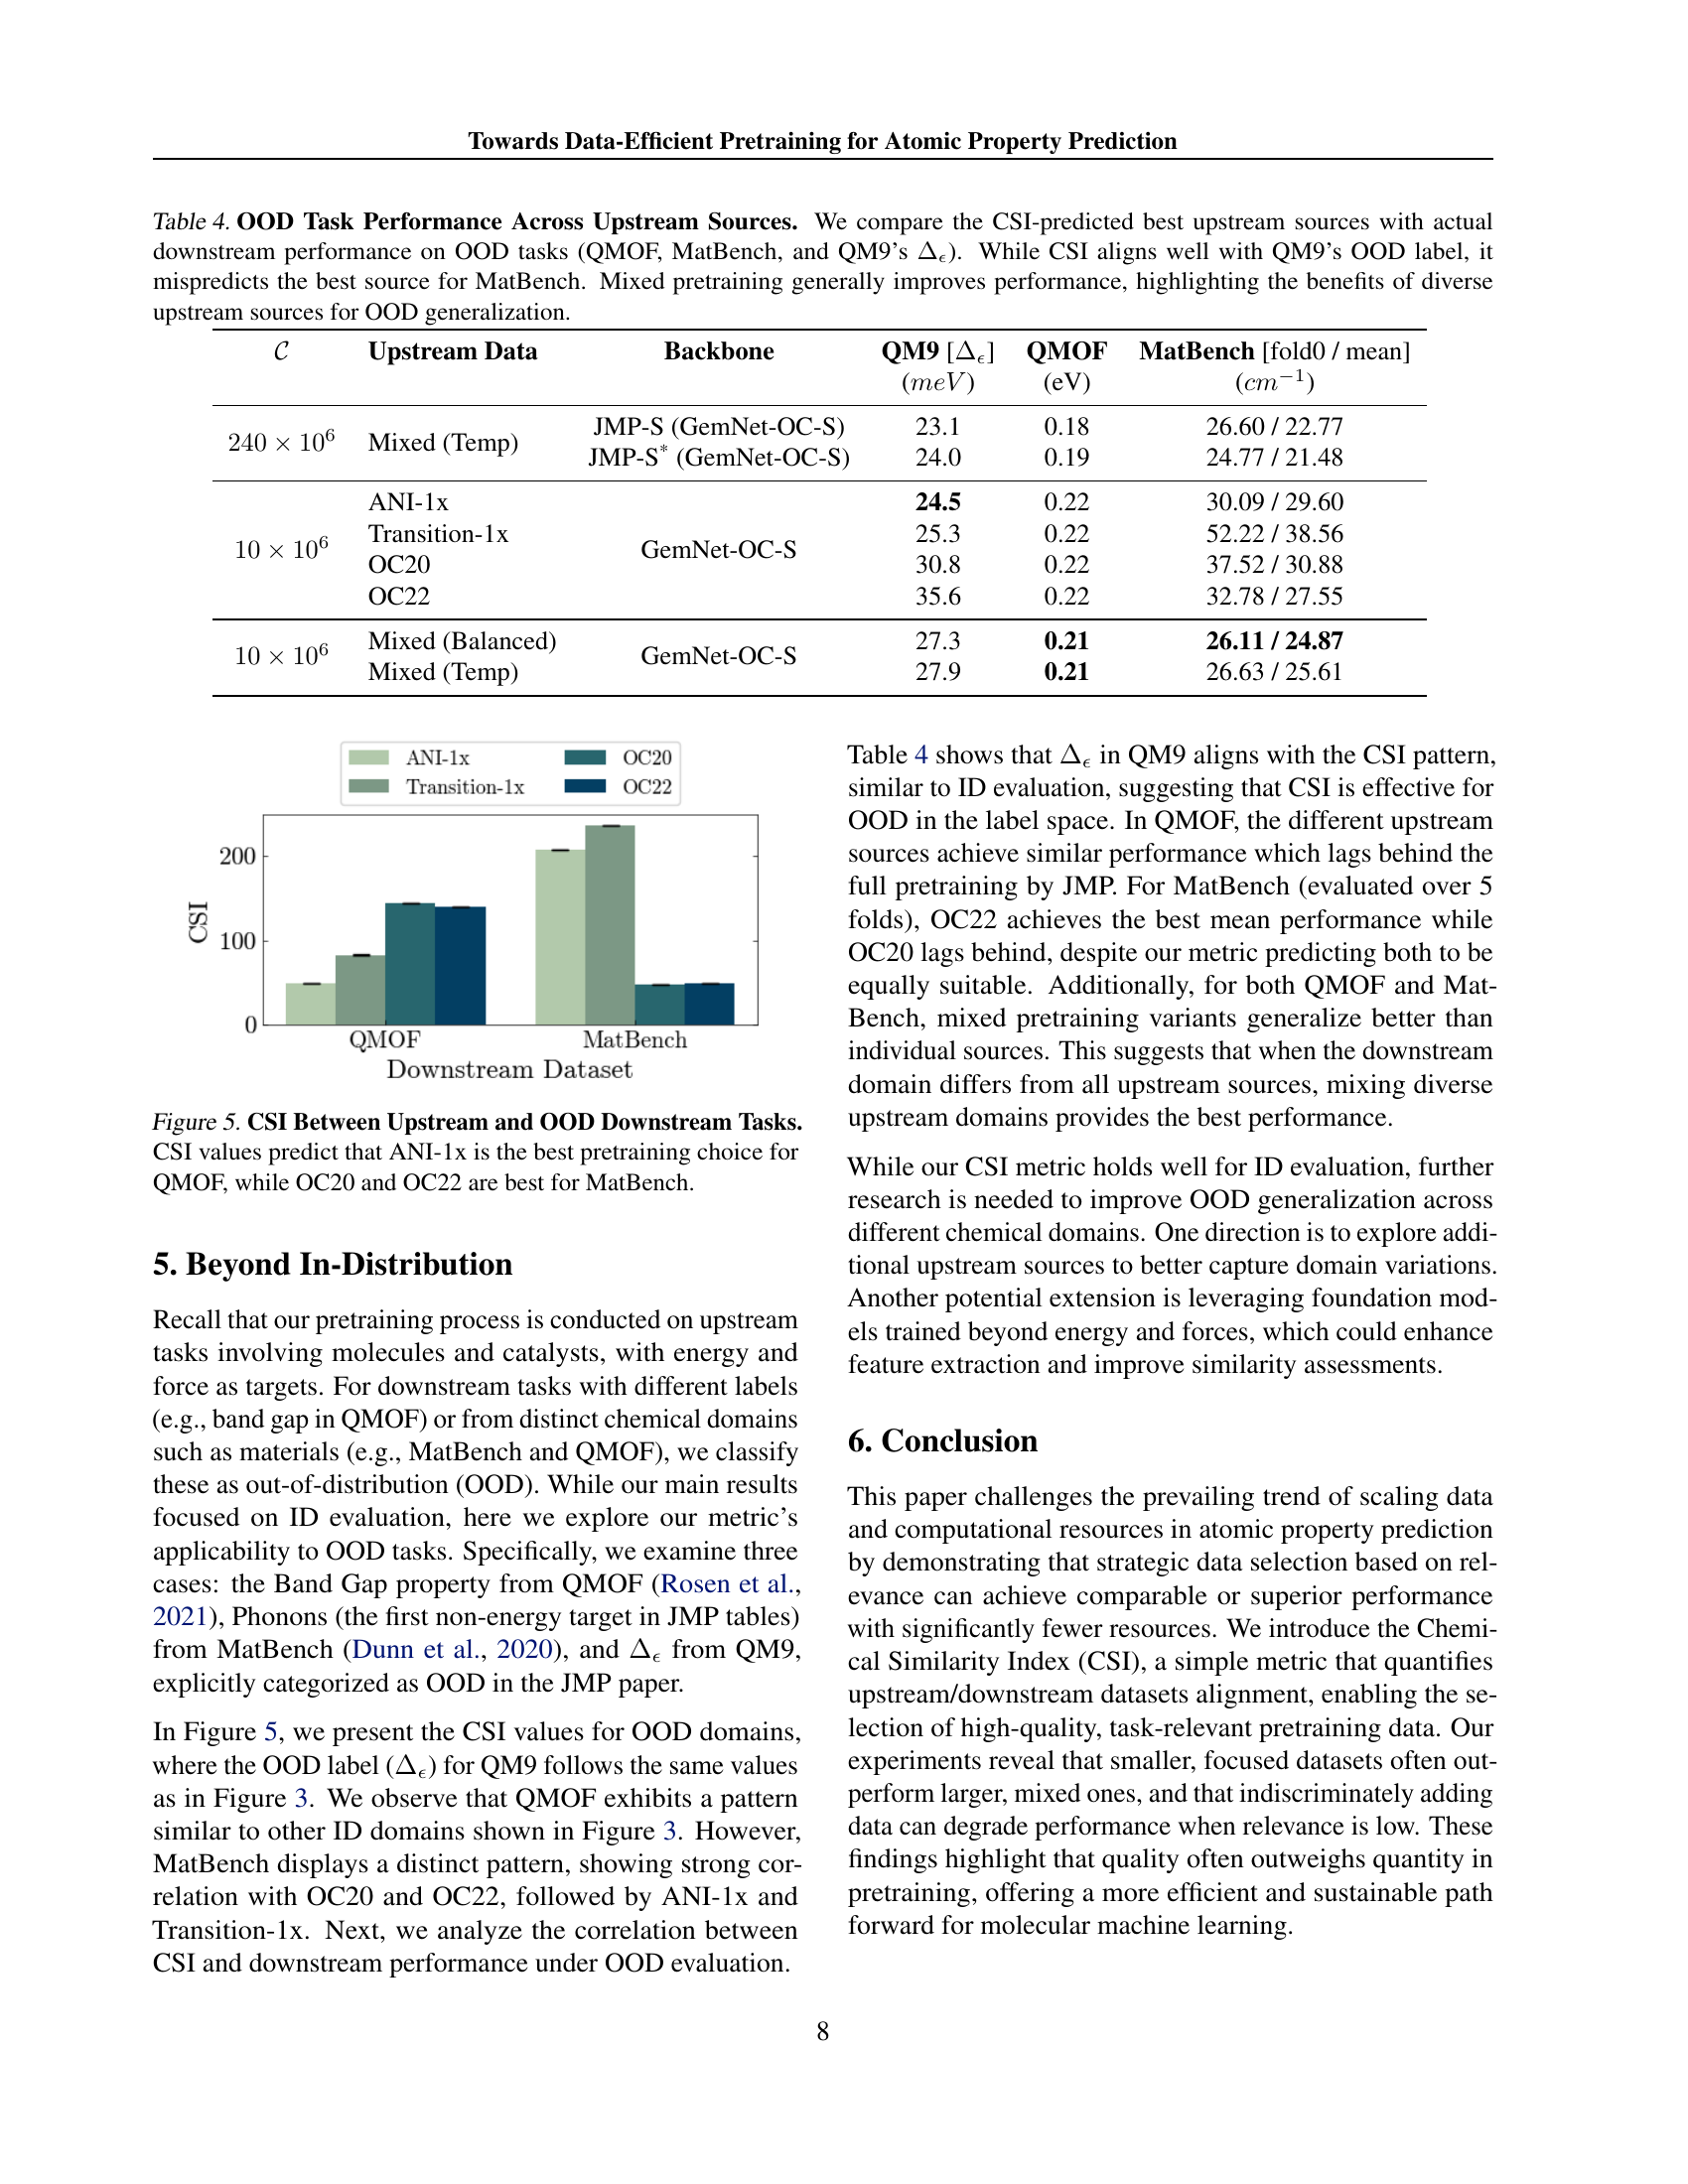
🔼 Figure 5 illustrates the Chemical Similarity Index (CSI) values for various upstream datasets in relation to out-of-distribution (OOD) downstream tasks: QMOF and MatBench. CSI, a metric assessing dataset relevance, indicates the predicted best upstream dataset for each OOD task. For the QMOF task, the CSI suggests ANI-1x as the most suitable pretraining dataset. However, for the MatBench task, the CSI suggests that OC20 and OC22 are more appropriate choices. This visualization highlights the ability of CSI to predict the best-performing upstream dataset for various downstream tasks, even those outside the initial training distribution.
read the caption
Figure 5: CSI Between Upstream and OOD Downstream Tasks. CSI values predict that ANI-1x is the best pretraining choice for QMOF, while OC20 and OC22 are best for MatBench.

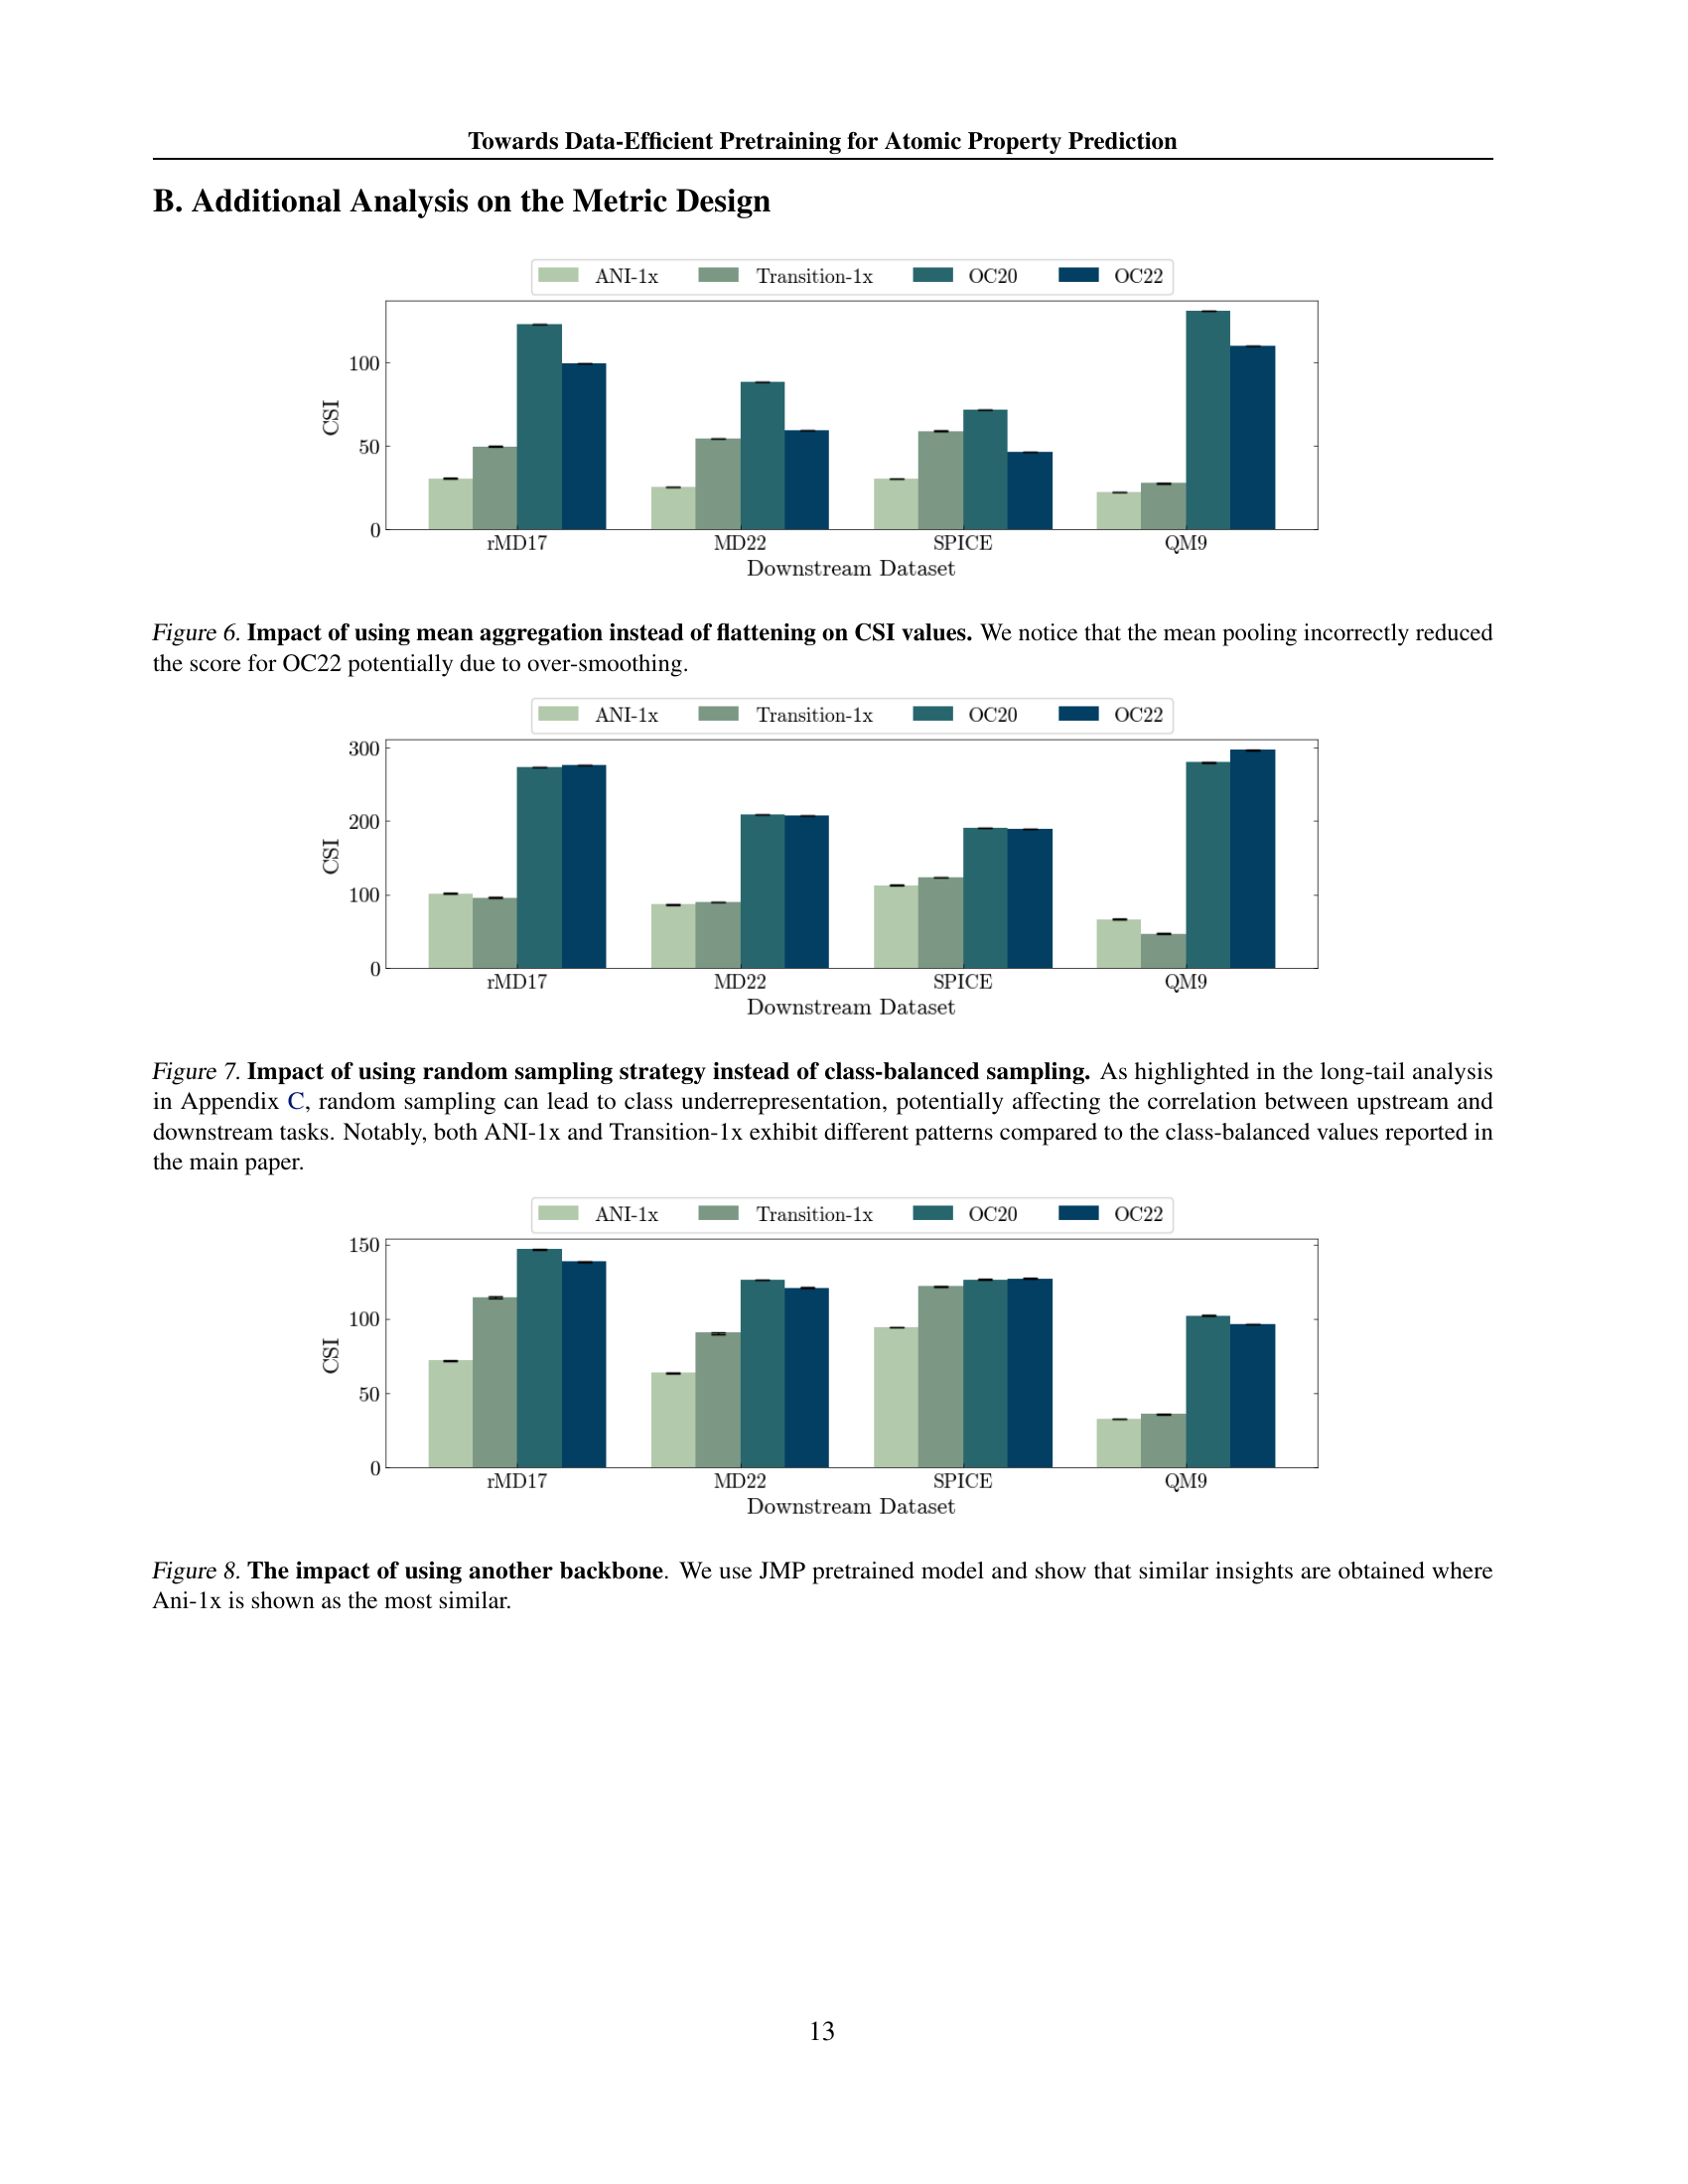
🔼 This figure compares the results of using two different aggregation methods for calculating the Chemical Similarity Index (CSI): flattening and mean pooling. The CSI is a metric used to measure the similarity between upstream (pretraining) and downstream (target task) datasets. The results show that using mean pooling to aggregate node features before computing the CSI leads to a lower score for the OC22 dataset than when using flattening. This suggests that the mean pooling method may be over-smoothing the features in OC22, which reduces its apparent similarity to the downstream datasets. This is an important finding because it highlights the potential impact of the feature aggregation method on the overall CSI results. This implies the need for careful consideration when choosing feature aggregation methods for the computation of CSI.
read the caption
Figure 6: Impact of using mean aggregation instead of flattening on CSI values. We notice that the mean pooling incorrectly reduced the score for OC22 potentially due to over-smoothing.

🔼 This figure compares the results of using two different sampling methods: random sampling and class-balanced sampling, to create subsets of upstream datasets for the CSI calculation. It shows that random sampling, due to its non-uniform nature, can create subsets with significant class imbalances. This imbalance impacts the subsequent CSI scores, which measure dataset similarity. The figure highlights how the CSI values obtained using random sampling differ significantly from those obtained using class-balanced sampling, particularly for ANI-1x and Transition-1x. The class-balanced sampling, employed in the main study, is shown to produce more robust and reliable CSI scores.
read the caption
Figure 7: Impact of using random sampling strategy instead of class-balanced sampling. As highlighted in the long-tail analysis in Appendix C, random sampling can lead to class underrepresentation, potentially affecting the correlation between upstream and downstream tasks. Notably, both ANI-1x and Transition-1x exhibit different patterns compared to the class-balanced values reported in the main paper.

🔼 This figure explores the robustness of the Chemical Similarity Index (CSI) metric by using a different backbone model (the JMP pretrained model) for calculating CSI values. The results are compared against the CSI values obtained using the original backbone in the paper. The comparison shows that using a different backbone model still yields similar insights, demonstrating the consistency and reliability of CSI in identifying the most relevant upstream datasets for pretraining, where ANI-1x consistently demonstrates the highest similarity across different downstream tasks.
read the caption
Figure 8: The impact of using another backbone. We use JMP pretrained model and show that similar insights are obtained where Ani-1x is shown as the most similar.

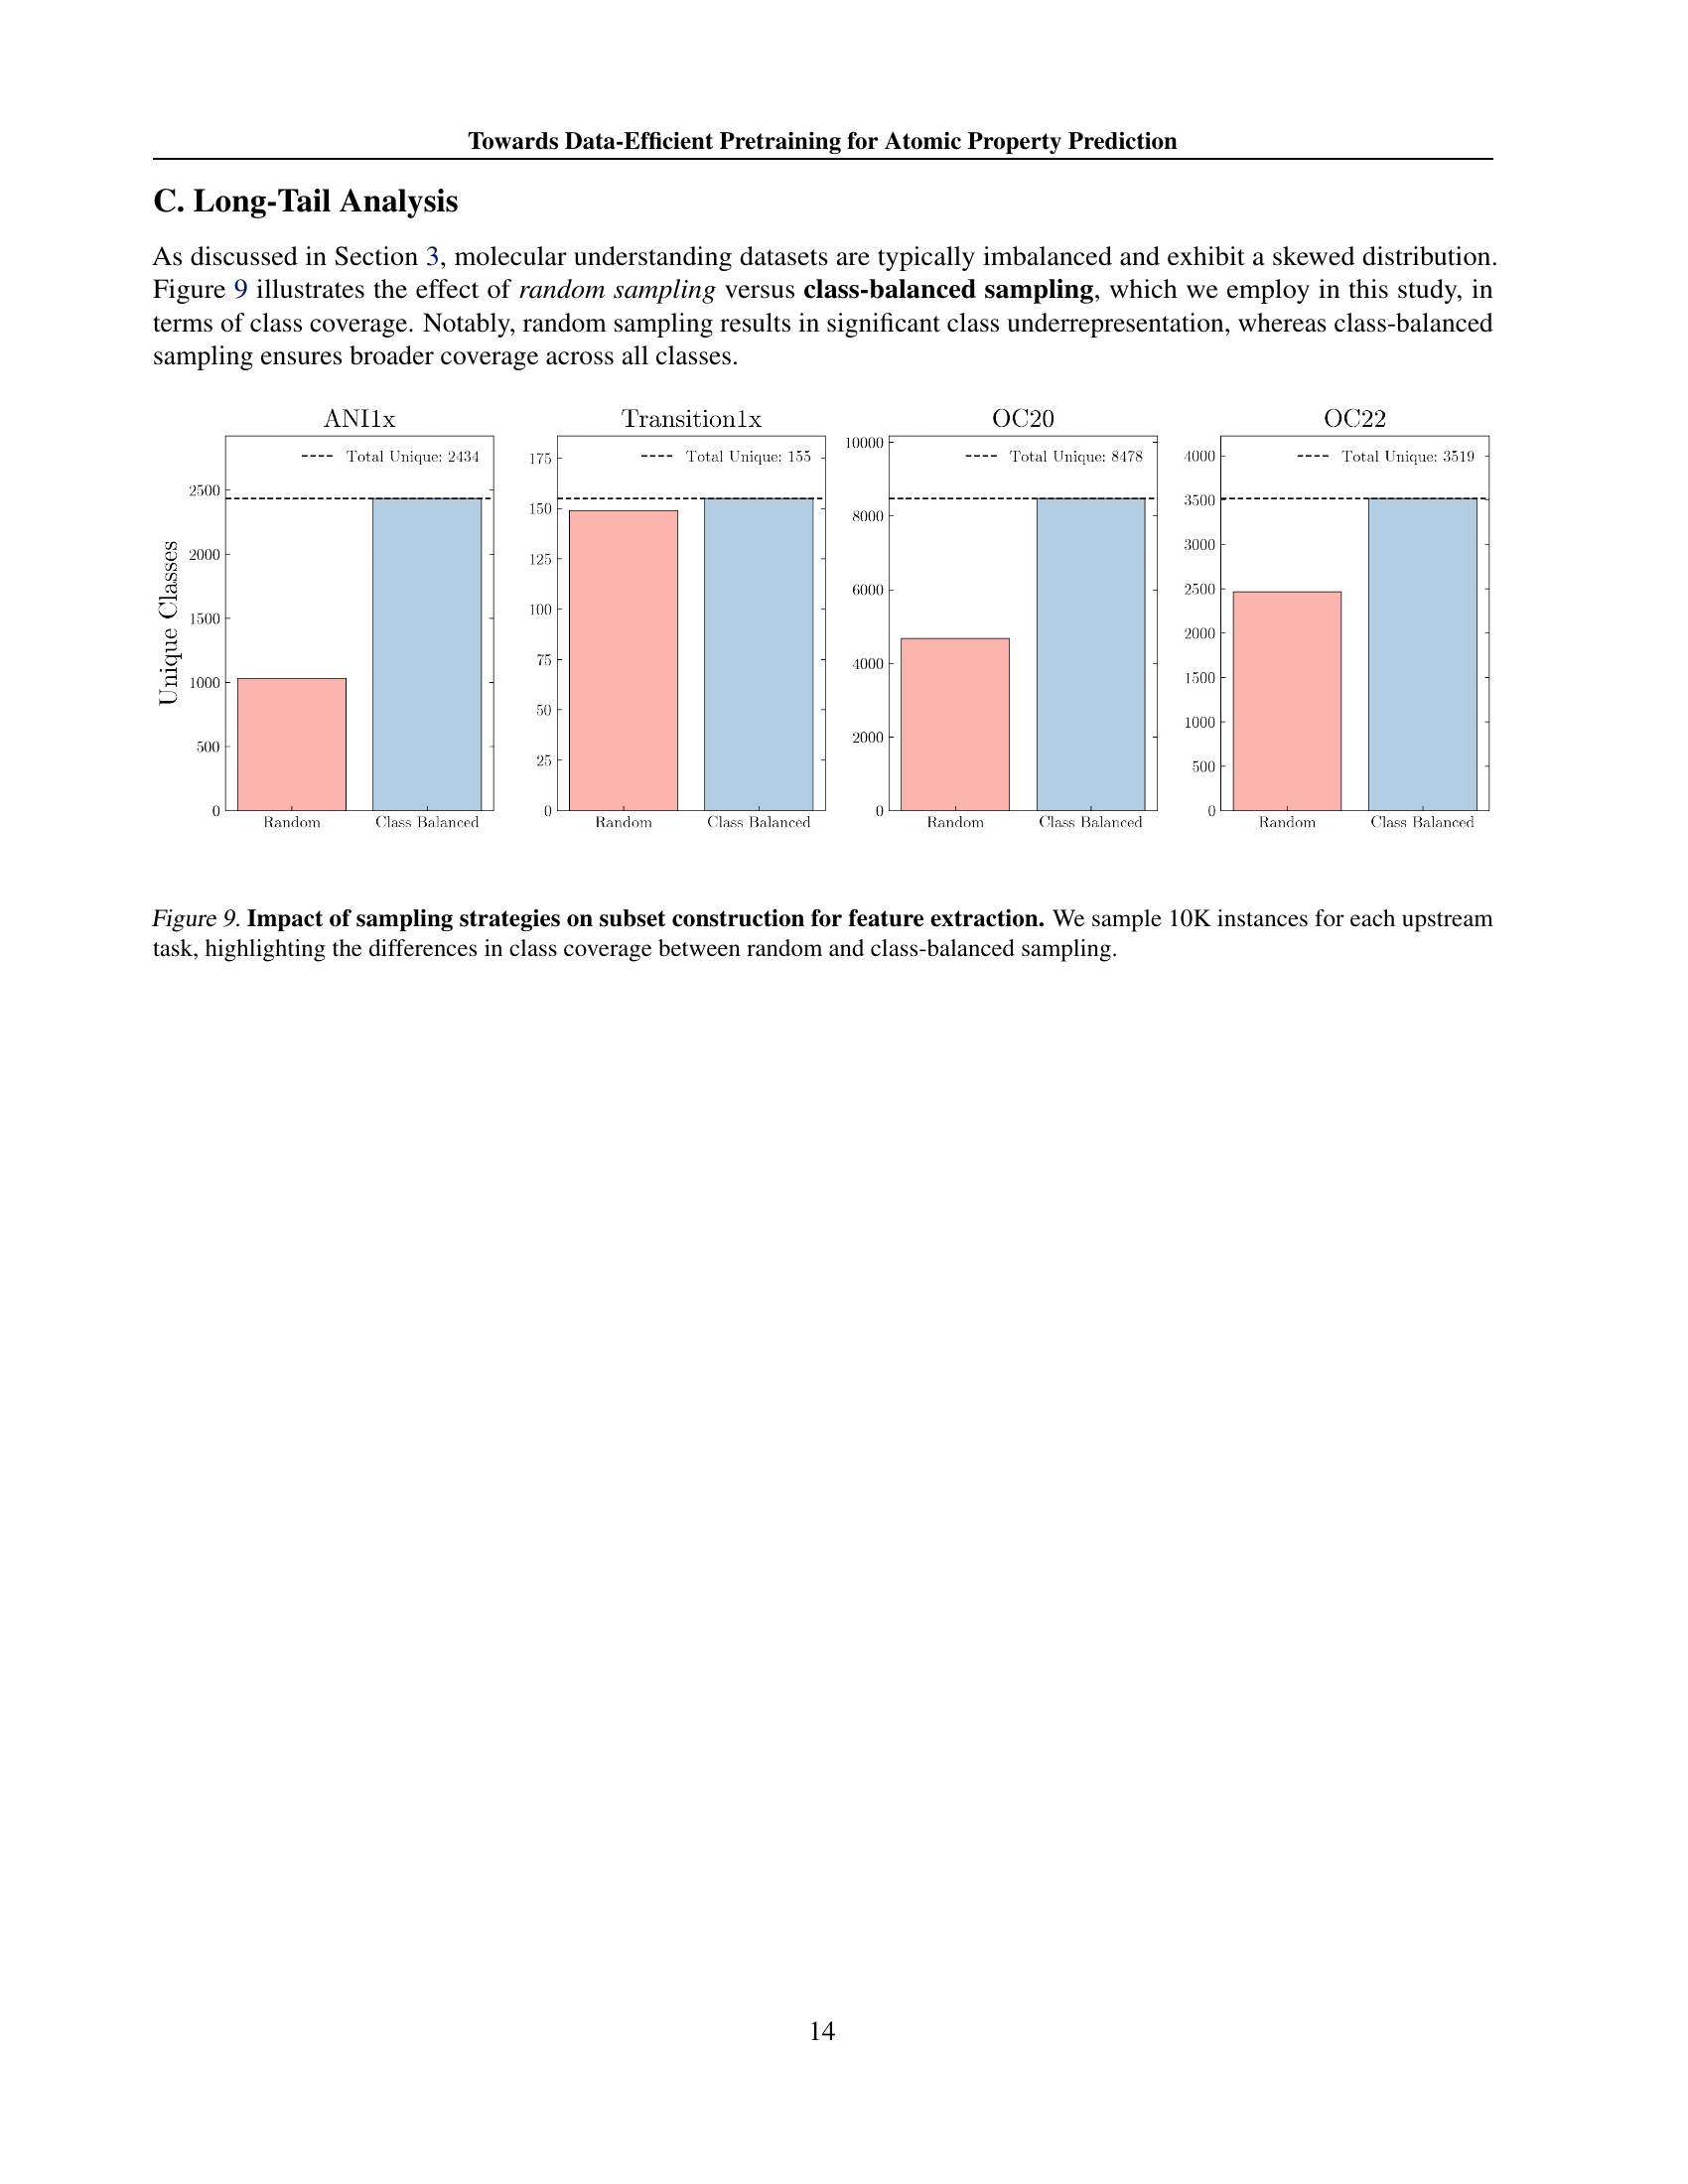
🔼 This figure compares two sampling methods for selecting subsets of upstream datasets used in pretraining: random sampling and class-balanced sampling. Both methods aim to select 10,000 instances from each upstream dataset (ANI-1x, Transition-1x, OC20, OC22). The bar charts show the distribution of the number of unique molecular structures (classes) represented in the selected subset for each dataset and sampling method. Class-balanced sampling aims for more even coverage across all classes, whereas random sampling may over-represent common structures and under-represent rare ones. This is important because class imbalance can affect the performance of machine learning models.
read the caption
Figure 9: Impact of sampling strategies on subset construction for feature extraction. We sample 10K instances for each upstream task, highlighting the differences in class coverage between random and class-balanced sampling.
More on tables
| Upstream | rMD17 | MD22 | SPICE | QM9 | rMD17 | MD22 | SPICE | QM9 | rMD17 | MD22 | SPICE | QM9 |
|---|---|---|---|---|---|---|---|---|---|---|---|---|
| ANI-1x | 5.7 | 2.91 | 5.34 | 2.8 | 5.4 | 2.90 | 5.13 | 2.9 | 5.6 | 2.85 | 5.37 | 2.8 |
| Transition-1x | 11.7 | 3.92 | 7.85 | 3.3 | 10.1 | 3.73 | 7.55 | 3.2 | 10.2 | 3.64 | 7.65 | 3.2 |
| OC20 | 14.8 | 4.67 | 8.92 | 4.7 | 14.6 | 4.53 | 8.74 | 4.8 | 16.1 | 4.61 | 10.44 | 5.3 |
| OC22 | 18.1 | 5.44 | 11.22 | 5.5 | 16.0 | 5.20 | 10.73 | 5.7 | 17.4 | 5.15 | 11.00 | 5.8 |
🔼 This table presents the results of an experiment designed to assess how different computational budgets affect the performance of models pretrained on various upstream datasets. The experiment keeps the number of training epochs constant at 5 but varies the number of training samples across three different budget levels: 1 million, 2 million, and 3 million samples. The table shows the mean absolute error (MAE) achieved on four downstream tasks (rMD17, MD22, SPICE, and QM9) for models pretrained on four different upstream datasets (ANI-1x, Transition-1x, OC20, and OC22). The key finding is that the upstream dataset with the lowest Chemical Similarity Index (CSI) consistently yields the best downstream performance, regardless of the computational budget.
read the caption
Table 2: Effect of Computational Budget on Performance. While fixing the number of epochs (ℰℰ\mathcal{E}caligraphic_E) to 5, we vary the number of training samples from 𝒩=1×10⁶𝒩1superscript106\mathcal{N}=1\times 10^{6}caligraphic_N = 1 × 10 start_POSTSUPERSCRIPT 6 end_POSTSUPERSCRIPT upto 𝒩=3×10⁶𝒩3superscript106\mathcal{N}=3\times 10^{6}caligraphic_N = 3 × 10 start_POSTSUPERSCRIPT 6 end_POSTSUPERSCRIPT. Our findings are consistent across budget levels where the upstream dataset with the lowest CSI yields the best downstream performance.
| Upstream Data | Backbone | rMD17 | MD22 | SPICE | QM9 | |
|---|---|---|---|---|---|---|
| (meV/Å) | (meV/Å) | (meV/Å) | (meV) | |||
| Mixed (Temp) | JMP-L (GemNet-OC-L) | 5.1 | 1.92 | 4.75 | 2.9 | |
| JMP-L* (GemNet-OC-L) | 5.3 | 2.59 | 4.91 | 3.0 | ||
| ANI-1x | GemNet-OC-L | 4.8 | 2.54 | 5.24 | 2.6 | |
| Transition-1x | 9.7 | 3.56 | 7.42 | 3.0 | ||
| OC20 | 13.8 | 3.90 | 9.24 | 4.6 | ||
| OC22 | 12.0 | 4.14 | 10.43 | 4.0 |
🔼 This table investigates the effect of using different backbone sizes (GemNet-OC-S and GemNet-OC-L) on the performance of models pretrained with various upstream datasets. It compares the performance of models pretrained on a single, relevant upstream dataset (selected based on its relevance to the downstream task) versus models pretrained on a mixture of large-scale datasets. The results demonstrate that choosing the relevant upstream dataset consistently yields superior performance, regardless of the backbone size, highlighting the importance of data quality over quantity in pretraining.
read the caption
Table 3: Effect of Changing the Backbone Size. We analyze the impact of using a larger variant of GemNet-OC and find that, irrespective of backbone size, relevance-based upstream dataset selection consistently outperforms costly large-scale dataset mixing.
| Upstream Data | Backbone | QM9 [] | QMOF | MatBench [fold0 / mean] | |
|---|---|---|---|---|---|
| () | (eV) | () | |||
| Mixed (Temp) | JMP-S (GemNet-OC-S) | 23.1 | 0.18 | 26.60 / 22.77 | |
| JMP-S* (GemNet-OC-S) | 24.0 | 0.19 | 24.77 / 21.48 | ||
| ANI-1x | GemNet-OC-S | 24.5 | 0.22 | 30.09 / 29.60 | |
| Transition-1x | 25.3 | 0.22 | 52.22 / 38.56 | ||
| OC20 | 30.8 | 0.22 | 37.52 / 30.88 | ||
| OC22 | 35.6 | 0.22 | 32.78 / 27.55 | ||
| Mixed (Balanced) | GemNet-OC-S | 27.3 | 0.21 | 26.11 / 24.87 | |
| Mixed (Temp) | 27.9 | 0.21 | 26.63 / 25.61 |
🔼 Table 4 presents out-of-distribution (OOD) performance results for various upstream datasets. The CSI metric was used to predict the best upstream dataset for each OOD downstream task (QMOF, MatBench, and a specific OOD subset of QM9). The results show that the CSI prediction aligns well with the best-performing upstream source for the QM9 OOD task, but it fails to accurately predict the optimal source for MatBench. Furthermore, the table demonstrates that using a mixed set of upstream datasets for pretraining generally improves performance on the OOD tasks compared to using a single upstream dataset, highlighting the value of data diversity for robust generalization to unseen data.
read the caption
Table 4: OOD Task Performance Across Upstream Sources. We compare the CSI-predicted best upstream sources with actual downstream performance on OOD tasks (QMOF, MatBench, and QM9’s ΔϵsubscriptΔitalic-ϵ\Delta_{\epsilon}roman_Δ start_POSTSUBSCRIPT italic_ϵ end_POSTSUBSCRIPT). While CSI aligns well with QM9’s OOD label, it mispredicts the best source for MatBench. Mixed pretraining generally improves performance, highlighting the benefits of diverse upstream sources for OOD generalization.
| Upstream Data | Backbone | rMD17 | MD22 | SPICE | QM9 | |||
|---|---|---|---|---|---|---|---|---|
| (meV/Å) | (meV/Å) | (meV/Å) | (meV) | |||||
| ANI-1x | GemNet-OC-S | 5.4 | 2.90 | 5.13 | 2.9 | |||
| Transition-1x | 10.1 | 3.73 | 7.55 | 3.2 | ||||
| OC20 | 14.6 | 4.53 | 8.74 | 4.8 | ||||
| OC22 | 16.0 | 5.20 | 10.73 | 5.7 | ||||
| ANI1x | GemNet-OC-S | 5.4 | 2.88 | 5.04 | 2.9 | |||
| Transition1x | 10.6 | 3.79 | 7.50 | 3.1 | ||||
| OC20 | 14.8 | 4.67 | 10.16 | 4.9 | ||||
| OC22 | 17.3 | 5.24 | 11.06 | 5.4 |
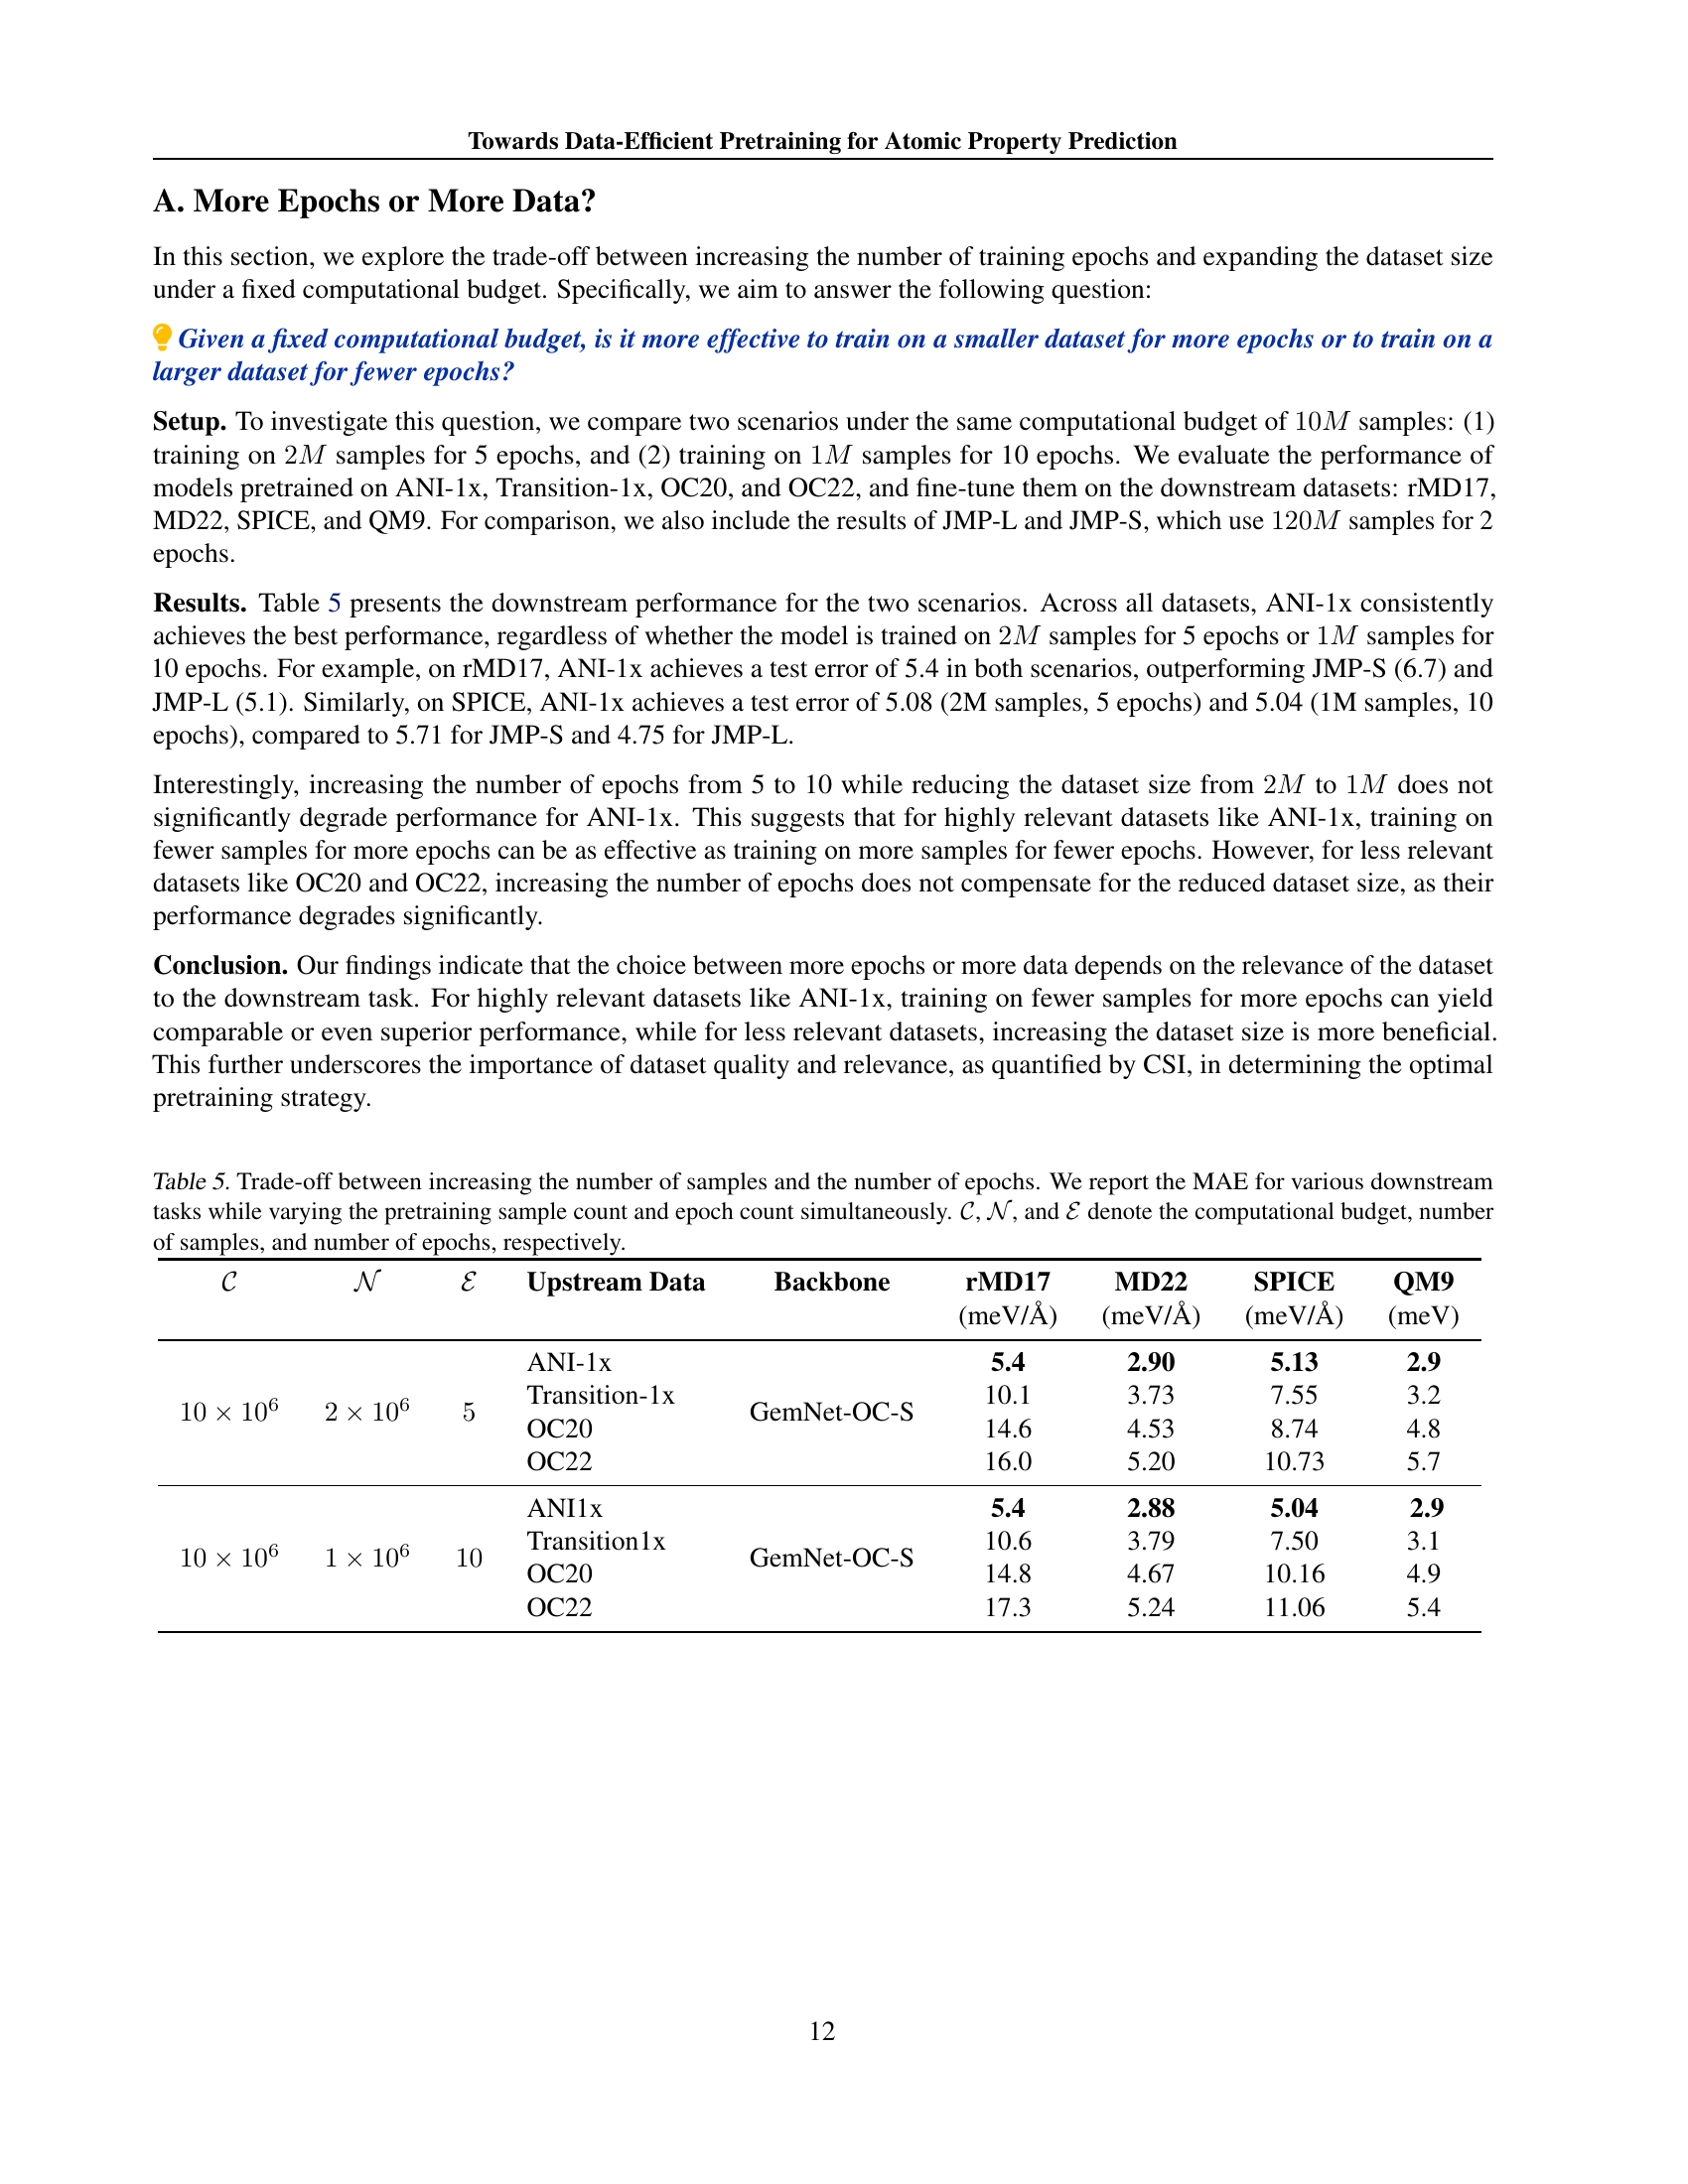
🔼 This table investigates the impact of varying the number of training samples and epochs while maintaining a constant computational budget. It explores whether it’s more effective to train on a smaller dataset for more epochs or a larger dataset for fewer epochs. The results are presented in terms of Mean Absolute Error (MAE) for various downstream tasks, providing insights into the optimal trade-off between data size and training duration for different pretraining datasets.
read the caption
Table 5: Trade-off between increasing the number of samples and the number of epochs. We report the MAE for various downstream tasks while varying the pretraining sample count and epoch count simultaneously. 𝒞𝒞\mathcal{C}caligraphic_C, 𝒩𝒩\mathcal{N}caligraphic_N, and ℰℰ\mathcal{E}caligraphic_E denote the computational budget, number of samples, and number of epochs, respectively.
Full paper#