TL;DR#
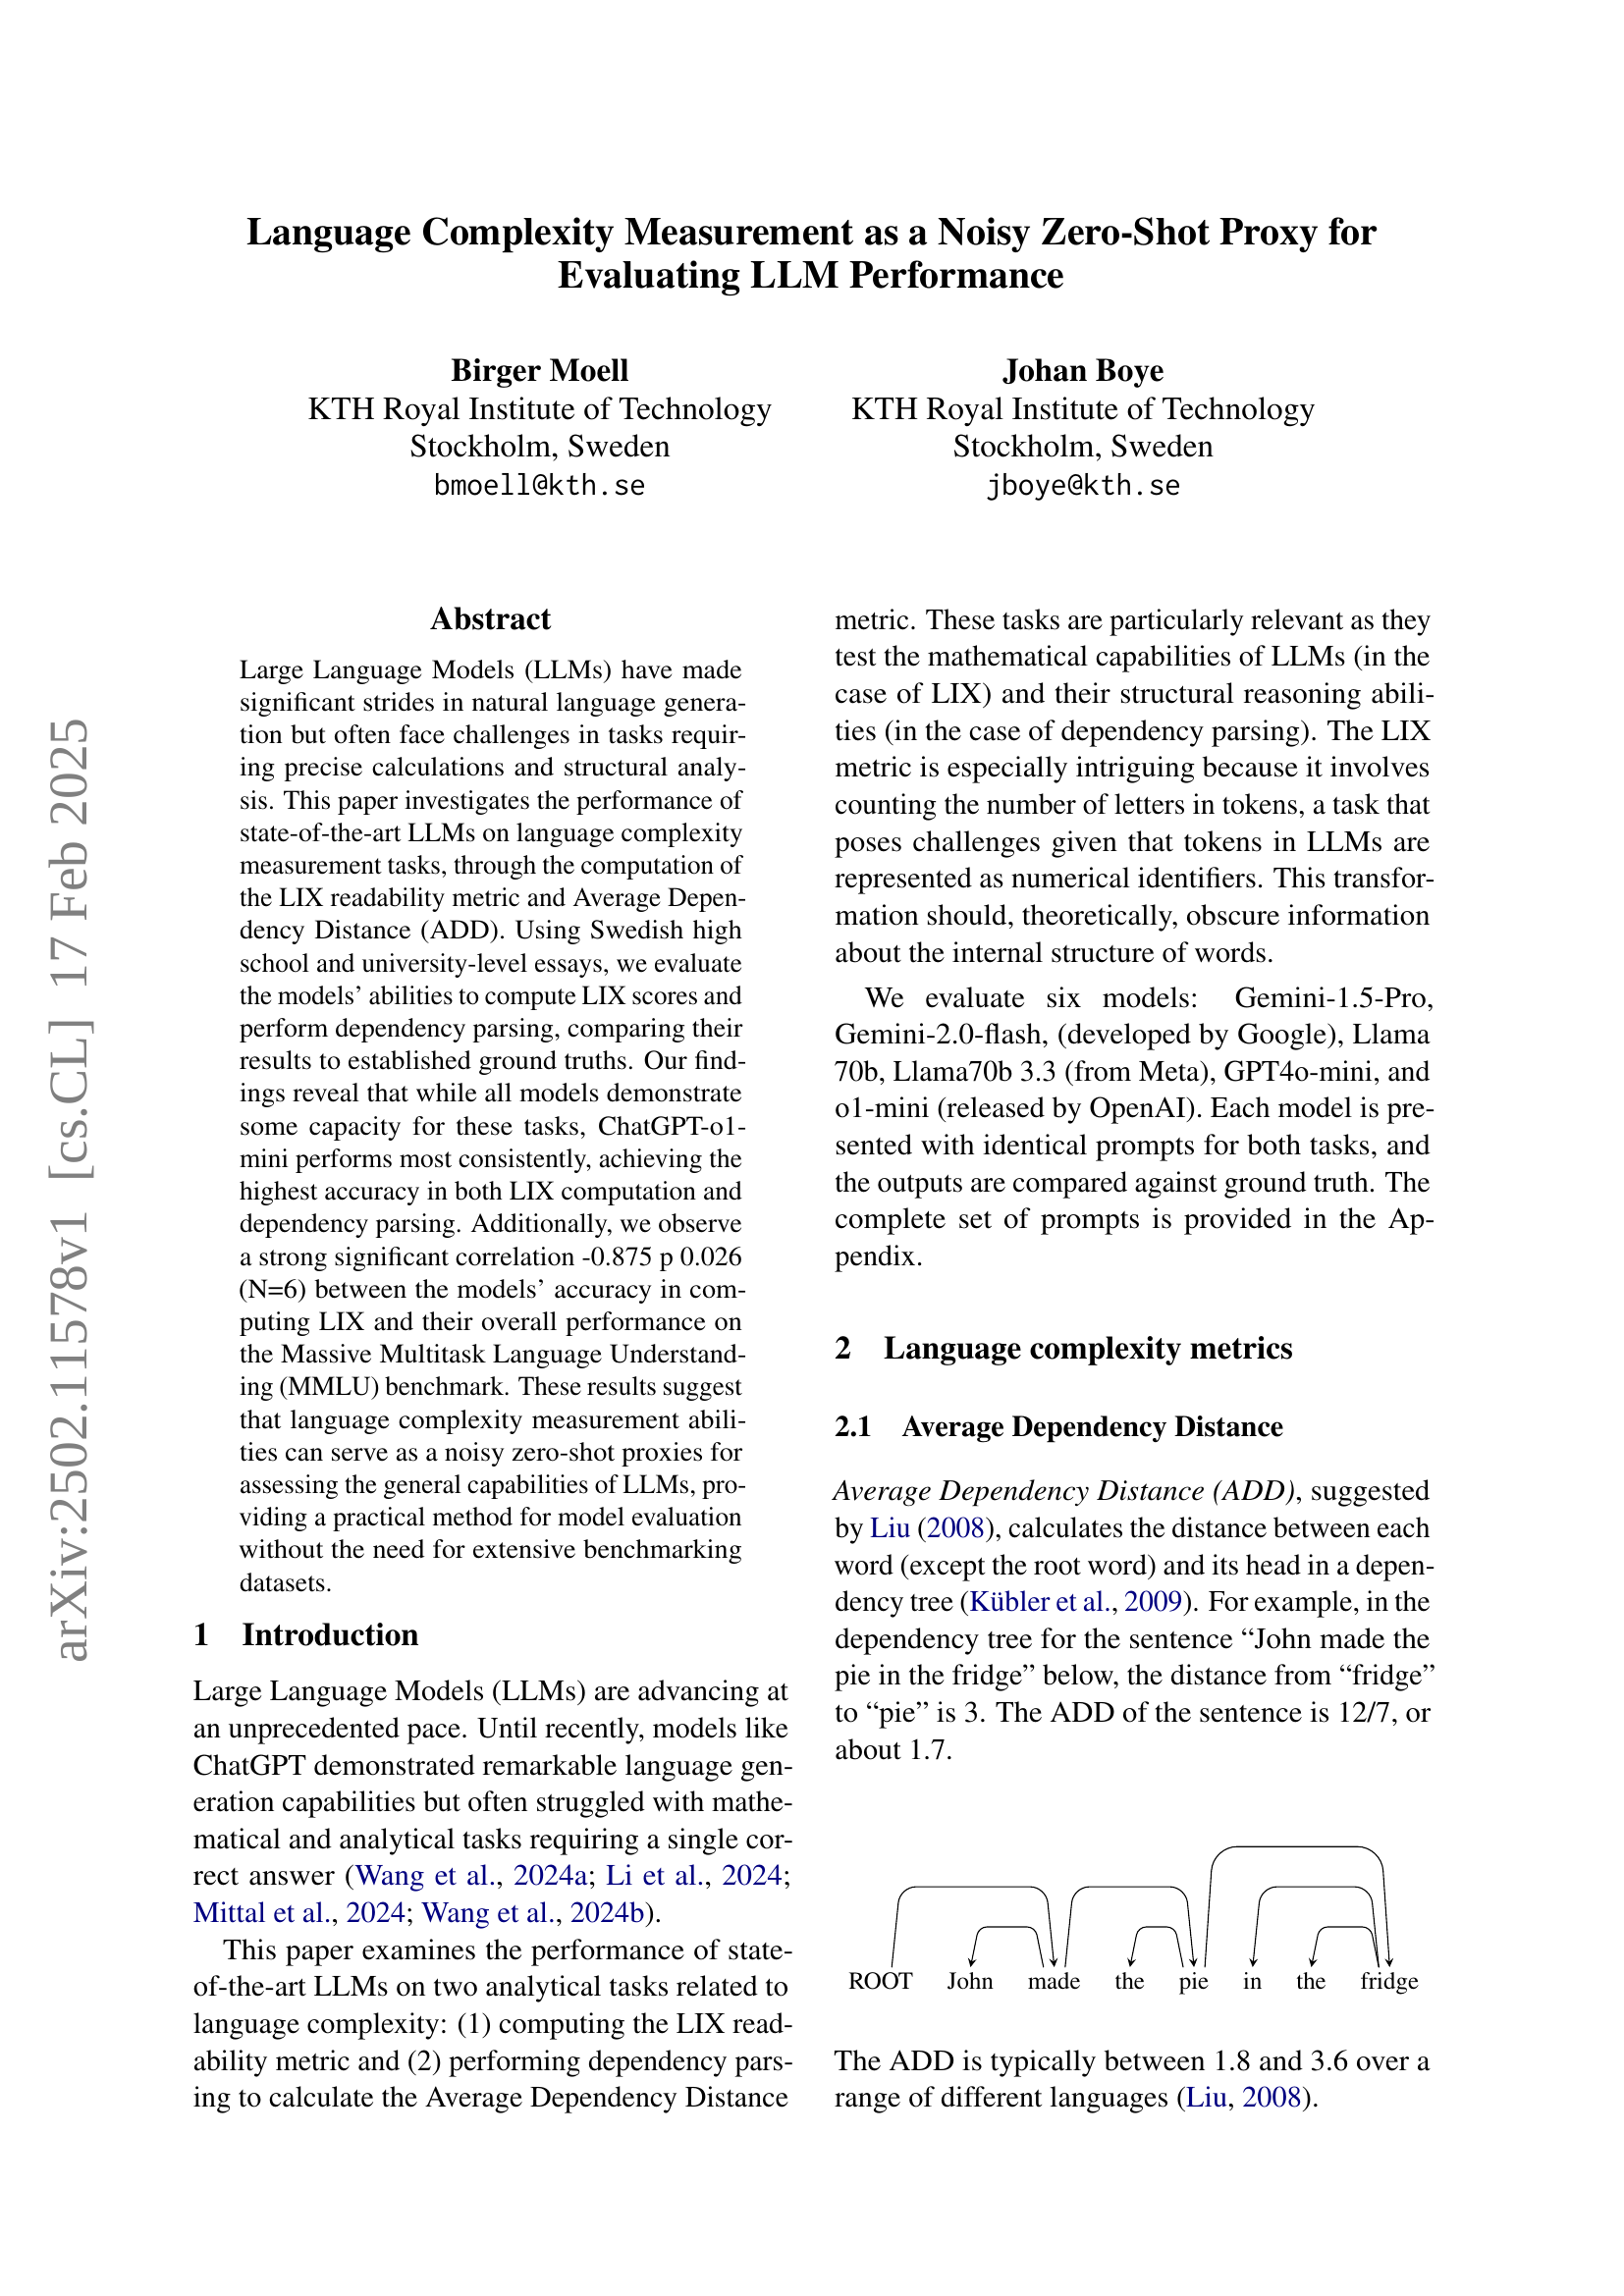
Large Language Models (LLMs) are rapidly advancing, but their capabilities in mathematical and analytical tasks remain a challenge. This paper explores LLMs’ performance in language complexity measurement, specifically using the LIX readability metric and Average Dependency Distance (ADD). It evaluates six state-of-the-art LLMs on these tasks using Swedish essays, comparing their results to ground truths.
The study reveals that while all LLMs demonstrate some capacity for these tasks, ChatGPT-01-mini performs most consistently, achieving the highest accuracy. Importantly, a significant negative correlation is found between models’ accuracy in computing LIX and their overall performance on the Massive Multitask Language Understanding (MMLU) benchmark. This suggests that language complexity measurement abilities can serve as noisy zero-shot proxies for assessing the general capabilities of LLMs, offering a more efficient model evaluation method.
Key Takeaways#
Why does it matter?#
This paper is important as it proposes a novel zero-shot proxy for evaluating LLMs using language complexity metrics. This method is cost-effective and avoids the need for extensive benchmark datasets, offering a practical approach for researchers and developers. Its findings also shed light on the relationship between language complexity and overall LLM capabilities, paving the way for future research on more efficient and effective LLM evaluation methods. The study also highlights the limitations of LLMs in mathematical and analytical tasks, demonstrating the need for further advancements in these areas.
Visual Insights#
| Model | MMLU | LIX Error |
|---|---|---|
| Gemini-1.5-pro | 85.9 | 19.72 |
| Gemini-2.0-flash | 87.0 | 10.42 |
| llama-70b | 86.0 | 20.9 |
| llama-70b 3.3 | 86.0 | 18.64 |
| GPT-4o-mini | 88.7 | 9.2 |
| o1-mini | 90.8 | 7.4 |
🔼 This table presents the Massive Multitask Language Understanding (MMLU) benchmark scores and the corresponding LIX error values for six different large language models (LLMs). The MMLU score reflects each model’s overall performance across various tasks, while the LIX error represents the deviation between the model’s calculated LIX readability score and the ground truth LIX score for a set of Swedish texts. This comparison allows for an analysis of the relationship between a model’s general performance (MMLU) and its ability to accurately assess text readability (LIX).
read the caption
Table 1: MMLU and LIX error for various models
In-depth insights#
LLM Complexity Proxy#
The concept of an “LLM Complexity Proxy” proposes using readily measurable aspects of LLM performance as indicators of their overall capabilities. The core idea is to avoid extensive, resource-intensive benchmark testing by identifying simpler, correlated tasks. This approach is particularly valuable for evaluating analytical abilities often lacking in LLMs. For instance, measuring an LLM’s accuracy in calculating readability metrics (like LIX) or performing dependency parsing to compute Average Dependency Distance (ADD) could act as effective proxies. A strong correlation between performance on these simpler tasks and established general-purpose benchmarks (like MMLU) would validate the proxy’s effectiveness. However, it’s crucial to acknowledge potential limitations. The proxy might be noisy, meaning that the correlation isn’t perfect. Furthermore, the choice of proxy tasks is critical; they must be relevant and representative of the broader capabilities being assessed, otherwise, the prediction will lack validity. The inherent complexities of LLMs, such as variations in tokenization and model architectures, require careful consideration when interpreting results. Future research should focus on refining and validating these proxies, potentially creating a tiered system where proxies assess different aspects of LLM capabilities. This proxy methodology offers a potential pathway toward efficient and practical LLM evaluation.
Swedish LLM Test#
A hypothetical “Swedish LLM Test” would involve evaluating the performance of large language models (LLMs) on tasks specifically designed using Swedish language data. This would go beyond simply translating English prompts and evaluating the output in English. Key aspects would include using Swedish text corpora for training and evaluation, assessing the models’ understanding of Swedish grammar and semantics, including subtleties like word order and complex sentence structures. The test could involve tasks such as text summarization, question answering, machine translation (to and from Swedish), and sentiment analysis, all performed on uniquely Swedish datasets. Crucially, it needs to address the issue of resource availability, as sufficient high-quality Swedish datasets might be comparatively limited, necessitating careful dataset curation and potentially the development of new evaluation metrics tailored to the nuances of the Swedish language. A successful Swedish LLM Test would provide valuable insights into the capabilities of LLMs in handling morphologically rich and relatively low-resource languages, informing the development of more robust and adaptable multilingual models.
MMLU Correlation#
The analysis of the correlation between Massive Multitask Language Understanding (MMLU) scores and language complexity metrics reveals a strong negative correlation, suggesting that LLMs with higher MMLU scores demonstrate better accuracy in computing language complexity metrics such as LIX. This indicates that an LLM’s proficiency in complex analytical tasks is linked to its ability to correctly process linguistic structures and compute readability metrics. The negative correlation implies that as a model’s overall performance (as measured by MMLU) increases, its errors in language complexity calculations decrease. This is a valuable insight because it suggests that language complexity assessment can serve as a noisy but efficient zero-shot proxy for evaluating broader LLM capabilities, thereby reducing the need for extensive, resource-intensive benchmarking datasets. The statistical significance of this correlation supports the validity of using LIX computation accuracy as a helpful indicator of an LLM’s overall proficiency.
Dependency Parsing#
The research paper section on “Dependency Parsing” likely delves into how well large language models (LLMs) can analyze sentence structure by identifying the relationships between words. This is a crucial aspect of natural language understanding, and the authors likely used metrics like the Unlabeled Attachment Score (UAS) to quantitatively assess the models’ performance in this task. A higher UAS score would indicate greater accuracy in correctly identifying the dependencies between words within a sentence’s dependency tree. The evaluation likely involved comparing the LLMs’ dependency parses to a gold standard, such as human-annotated trees. The analysis may further explore which types of dependencies are more challenging for LLMs to accurately parse. For instance, the performance differences between parsing simple subject-verb-object relationships versus more complex structures with multiple clauses are important. Ultimately, this section would provide evidence about the strength and limitations of LLMs in handling the complexities of syntactic structures, a key component of natural language understanding tasks.
Future of LLMs#
The future of LLMs is brimming with potential, yet fraught with challenges. Improved reasoning and problem-solving capabilities are crucial; current LLMs often struggle with tasks requiring mathematical precision or complex logical inference. Enhanced explainability and transparency are also vital, enabling better understanding of model decisions and fostering trust. Addressing biases and ethical concerns is paramount, requiring careful data curation and model training techniques to mitigate harmful outputs. More efficient and resource-friendly models will be essential for widespread accessibility and deployment. Finally, interoperability and standardization will facilitate seamless collaboration and integration of LLMs into diverse applications and workflows. The future hinges on achieving a sophisticated balance between advancing performance and mitigating potential risks.
More visual insights#
More on tables
| Model | ADD diff 1 | ADD diff 2 |
|---|---|---|
| Gemini-1.5-pro | 1.02 | 3.54 |
| Gemini-2.0-flash | 0.66 | 0.41 |
| llama-70b | 0.88 | 0.64 |
| GPT-4o-mini | 0.97 | 1.38 |
| o1-mini | 0.64 | 0.12 |
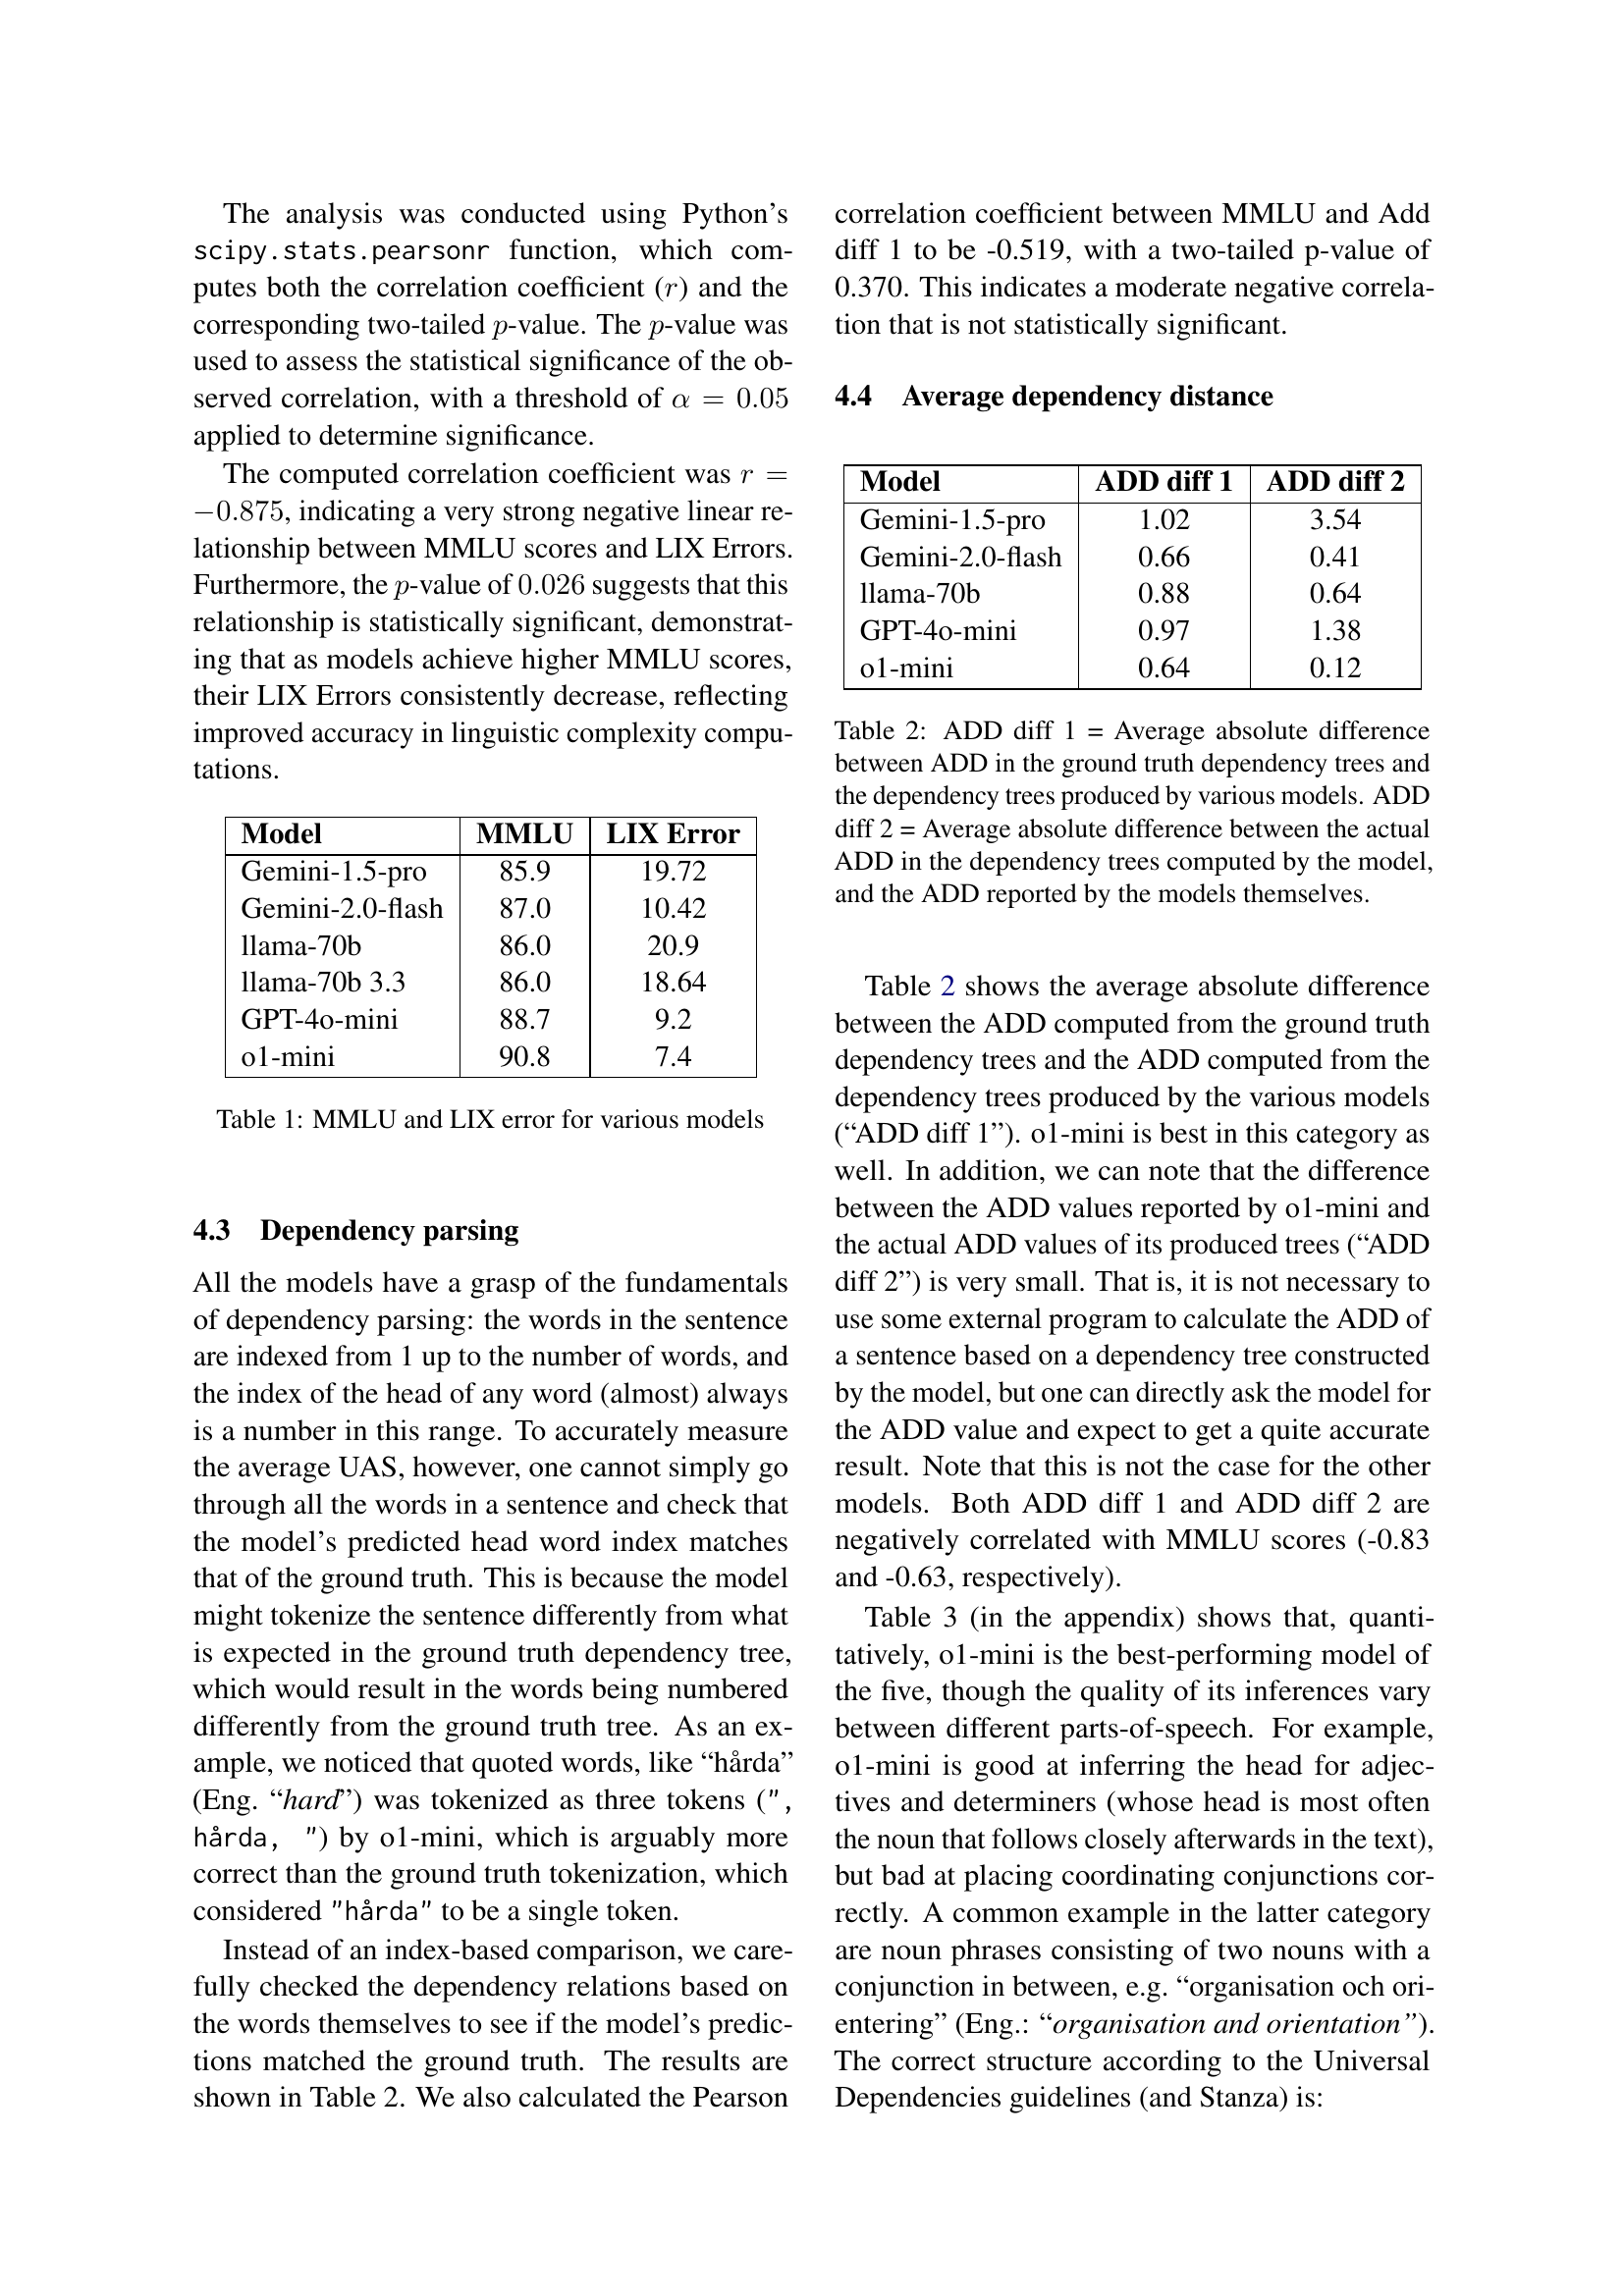
🔼 This table presents a comparison of the Average Dependency Distance (ADD) computed in two different ways: first, by comparing the model’s produced dependency trees against ground truth, and second, by comparing the ADD values reported by the models themselves against the actual ADD values calculated from their produced dependency trees. ADD diff 1 shows the average absolute difference between the ADD calculated from ground truth dependency trees and the model’s dependency trees. ADD diff 2 displays the average absolute difference between the model-reported ADD and the actual ADD obtained from the model’s dependency trees.
read the caption
Table 2: ADD diff 1 = Average absolute difference between ADD in the ground truth dependency trees and the dependency trees produced by various models. ADD diff 2 = Average absolute difference between the actual ADD in the dependency trees computed by the model, and the ADD reported by the models themselves.
| Label / Model | Gemini-pro | Gemini-2.0-flash | llama-70b | GPT-4o-mini | o1-mini |
|---|---|---|---|---|---|
| ADJ | 0.49 | 0.57 | 0.56 | 0.59 | 0.71 |
| ADP | 0.23 | 0.10 | 0.28 | 0.22 | 0.13 |
| ADV | 0.43 | 0.56 | 0.47 | 0.47 | 0.62 |
| AUX | 0.21 | 0.23 | 0.23 | 0.16 | 0.32 |
| CCONJ | 0.18 | 0.16 | 0.23 | 0.18 | 0.08 |
| DET | 0.38 | 0.62 | 0.46 | 0.47 | 0.76 |
| NOUN | 0.31 | 0.30 | 0.34 | 0.31 | 0.37 |
| NUM | 0.27 | 0.35 | 0.28 | 0.35 | 0.45 |
| PART | 0.33 | 0.42 | 0.40 | 0.26 | 0.49 |
| PRON | 0.30 | 0.32 | 0.39 | 0.33 | 0.46 |
| PROPN | 0.29 | 0.19 | 0.27 | 0.28 | 0.30 |
| PUNCT | 0.04 | 0.28 | 0.16 | 0.19 | 0.49 |
| SCONJ | 0.10 | 0.33 | 0.19 | 0.07 | 0.18 |
| VERB | 0.16 | 0.28 | 0.22 | 0.19 | 0.26 |
| Micro-average (UAS) | 0.28 | 0.32 | 0.33 | 0.30 | 0.38 |
| Macro-average (UAS) | 0.27 | 0.34 | 0.32 | 0.29 | 0.40 |
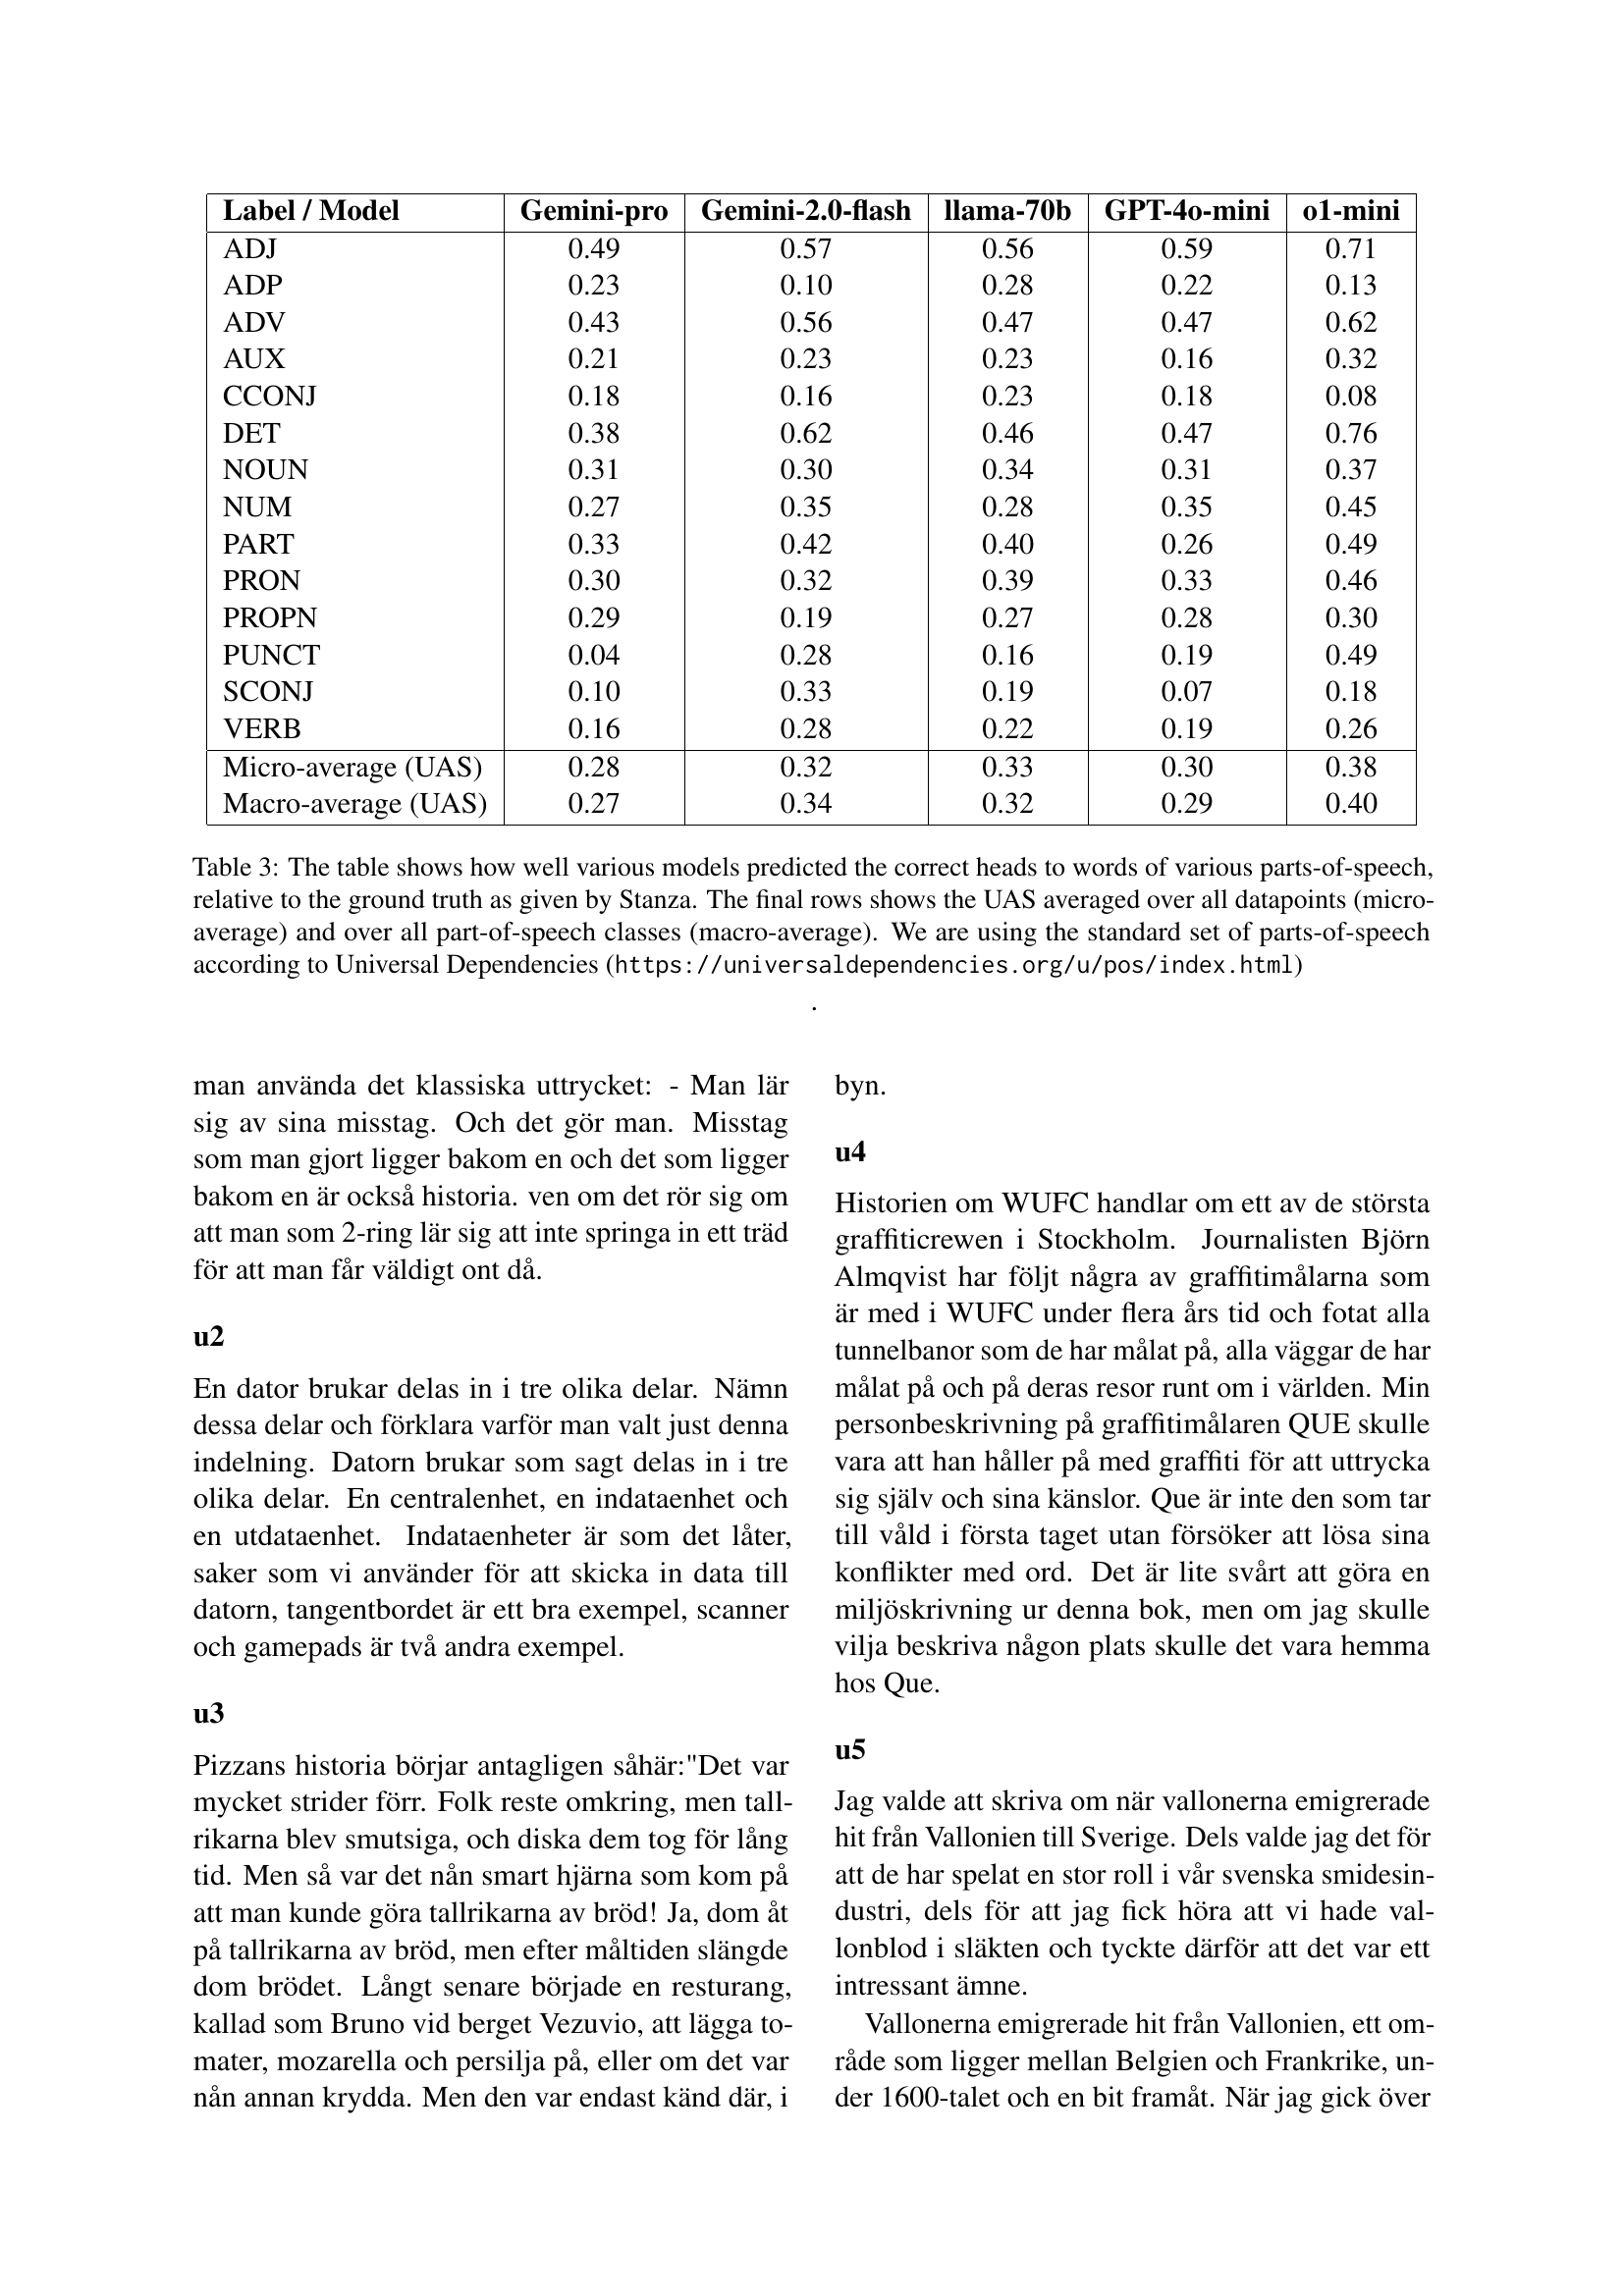
🔼 This table presents the performance of different Large Language Models (LLMs) in dependency parsing. It shows the Unlabeled Attachment Score (UAS) for each model across various parts-of-speech (POS) tags. The UAS measures the accuracy of the model’s prediction of the correct head for each word in a sentence. A higher UAS indicates better performance. The table also provides micro-averaged and macro-averaged UAS scores, which represent the average UAS across all data points and all POS tags, respectively.
read the caption
Table 3: The table shows how well various models predicted the correct heads to words of various parts-of-speech, relative to the ground truth as given by Stanza. The final rows shows the UAS averaged over all datapoints (micro-average) and over all part-of-speech classes (macro-average). We are using the standard set of parts-of-speech according to Universal Dependencies (https://universaldependencies.org/u/pos/index.html)
Full paper#