TL;DR#
Current AI struggles with common-sense reasoning about physical interactions. Existing models either rely on hand-crafted rules (structured models) or struggle with generalization from pixel-level data (pixel-based models). Both approaches have limitations: structured models lack flexibility, while pixel-based models lack generalizability. This paper introduces V-JEPA, a novel video prediction model trained using a self-supervised learning approach on natural videos.
V-JEPA learns to predict masked regions of videos within a learned representation space. By evaluating the model’s ‘surprise’ at unexpected events, the researchers show that V-JEPA demonstrably understands several intuitive physics principles. This significantly outperforms other state-of-the-art models, suggesting self-supervised learning in abstract representation spaces is key to developing intuitive physics understanding in AI. This challenges assumptions about the need for innate knowledge in humans and presents a new paradigm for building AI with robust common-sense reasoning.
Key Takeaways#
Why does it matter?#
This paper is important because it challenges the long-held belief that innate knowledge is necessary for understanding intuitive physics. It demonstrates that self-supervised learning on natural videos, using a novel approach, can enable AI models to develop this understanding, opening new avenues for AI development and cognitive science research. The findings suggest that general-purpose learning mechanisms are sufficient to acquire such knowledge, prompting further research into the nature of intuitive physics and its implications for both AI and human cognition.
Visual Insights#

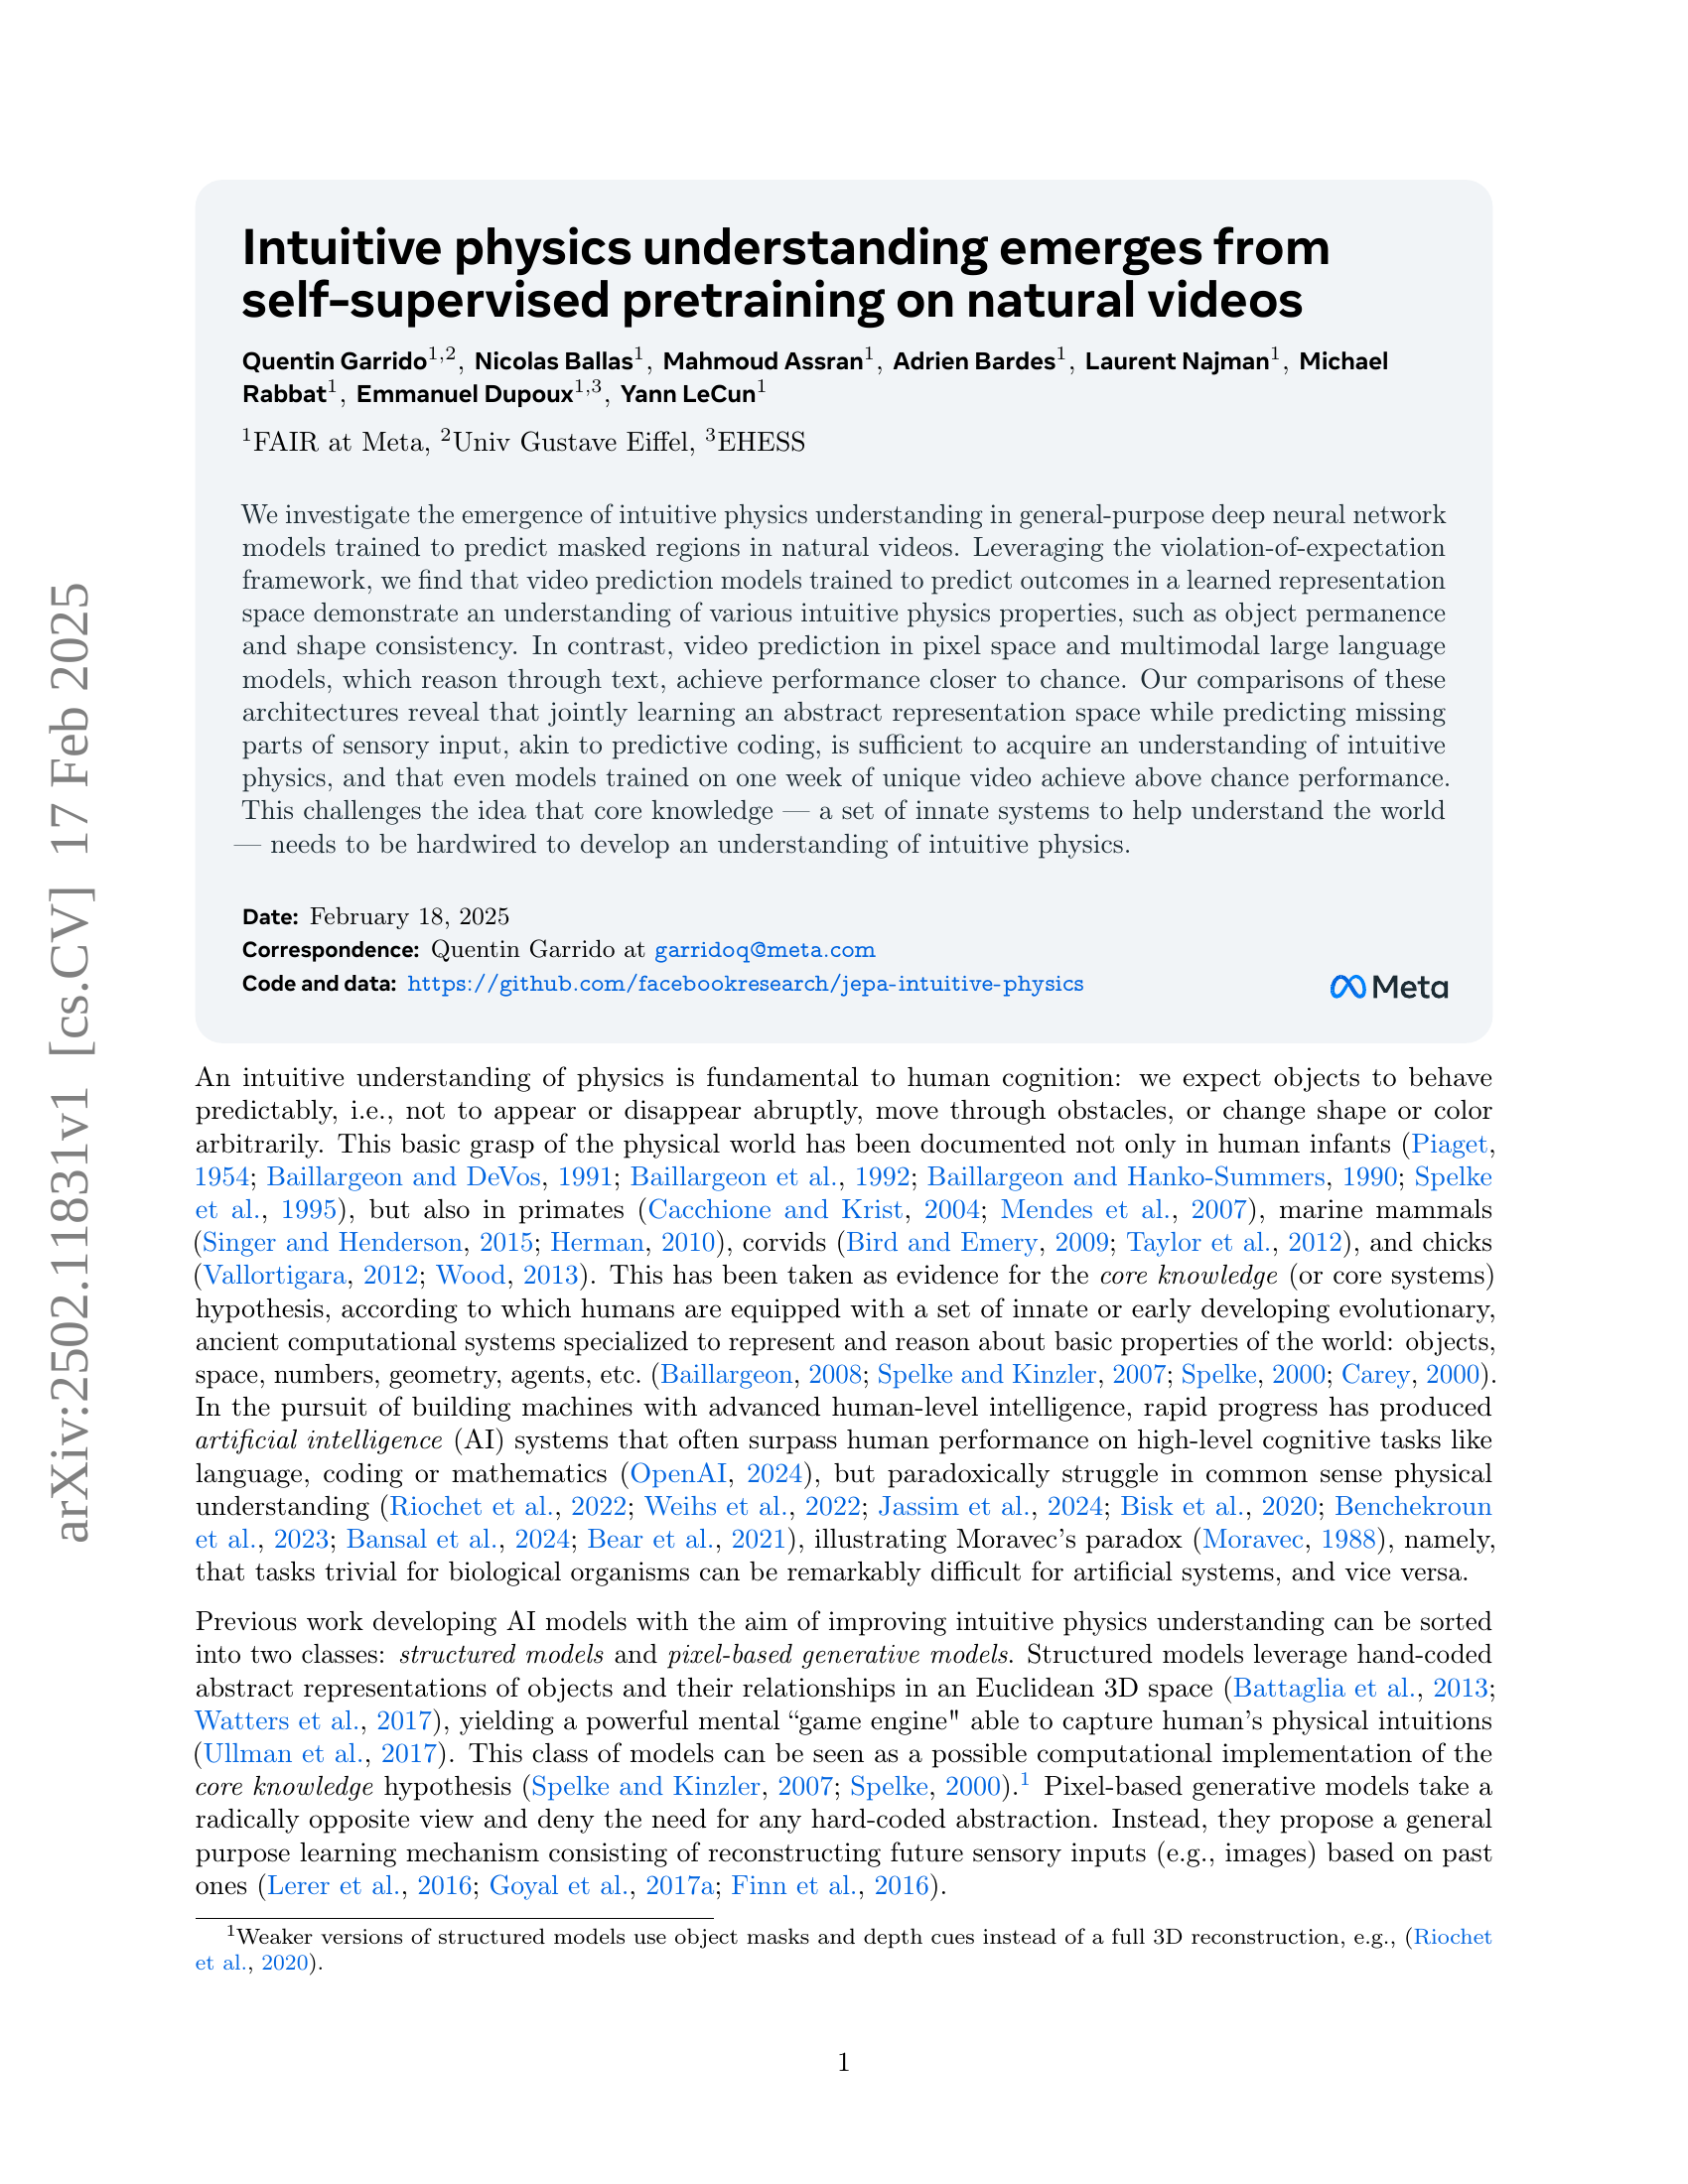
🔼 Figure 1 demonstrates that V-JEPA, a video prediction model operating in a learned representation space, develops an understanding of intuitive physics. Panel A compares V-JEPA’s performance on three intuitive physics datasets (IntPhys, GRASP, InfLevel) to other video models using a Violation of Expectation paradigm. V-JEPA shows significantly higher surprise responses to physically implausible videos than other models, including those trained on text or pixel-based prediction. Untrained V-JEPA models show performance close to chance. Panel B illustrates the V-JEPA training process: it learns to predict the representation of a complete video given a corrupted version, thus learning a meaningful representation space. Panel C explains how the surprise metric is calculated from trained V-JEPA: future frame representations are predicted based on past frames and compared to actual representations to quantify surprise, allowing for the detection of physical violations.
read the caption
Figure 1: Video prediction in representation space (V-JEPA) achieves an understanding of intuitive physics. (A) Video models are evaluated on three intuitive physics datasets using the Violation of Expectation paradigm (IntPhys, GRASP, and InfLevel). V-JEPA is significantly more ‘surprised’ by implausible videos. Random initializations of V-JEPA (untrained networks) show near-chance performance, and state-of-the-art video models based on text or pixel prediction are much closer to chance. Confidence intervals at 95% are obtained via bootstrapping, except for untrained networks (n=20𝑛20n=20italic_n = 20) which use a normal distribution assumption. (B) V-JEPA is trained to ’inpaint’ natural videos in a learned representation space. Starting from a video and a corrupted version, representations are first extracted. The goal is then to predict the representation of the original video from the representation of the corrupted ones. (C) From a trained V-JEPA, we compute a surprise metric by predicting representations of N future frames based on M past ones and comparing the predictions to the representations of observed events. The surprise metric is then used to decide which of the two videos contains a physical violation.
| Hyper-parameter | ViT-B/16 | ViT-L/16 | ViT-H/16 |
|---|---|---|---|
| positional embeddings | |||
| Type | RoPE | RoPE | RoPE |
| theta | 10000 | 10000 | 10000 |
| data | |||
| resolution | 224 | 224 | 224 |
| num_frames | 16 | 16 | 16 |
| framerate | 5.33 fps | 5.33 fps | 5.33 fps |
| horizontal_flip | true | true | true |
| random_resize_scale | (0.3, 1.0) | (0.3, 1.0) | (0.3, 1.0) |
| random_resize_aspect_ratio | (0.75, 1.35) | (0.75, 1.35) | (0.75, 1.35) |
| masking | |||
| block_aspect_ratio | (0.75, 1.5) | (0.75, 1.5) | (0.75,1.5) |
| shortrange_mask_num_blocks | 8 | 8 | 8 |
| shortrange_mask_spatial_scale | 0.15 | 0.15 | 0.15 |
| longrange_mask_num_blocks | 2 | 2 | 2 |
| longrange_mask_spatial_scale | 0.7 | 0.7 | 0.7 |
| optimization | |||
| optimizer | AdamW | AdamW | AdamW |
| batch_size | 3072 | 3072 | 3072 |
| total_number_of_iterations | 90000 | 90000 | 90000 |
| scheduler | Linear + Cosine | Linear + Cosine | Linear + Cosine |
| warmup_iterations | 12000 | 12000 | 12000 |
| learning_rate | 6.25 | 6.25 | 6.25 |
| start_lr | 2 | 2 | 2 |
| final_lr | 1 | 1 | 1 |
| start_momentum | 0.998 | 0.998 | 0.998 |
| final_momentum | 1.0 | 1.0 | 1.0 |
| start_weight_decay | 0.04 | 0.04 | 0.04 |
| final_weight_decay | 0.4 | 0.4 | 0.4 |
| scheduler_scale_factor | 1.25 | 1.25 | 1.25 |
| architecture | |||
| patch_size | 16 | 16 | 16 |
| tubelet_size | 2 | 2 | 2 |
| pred_depth | 12 | 12 | 12 |
| pred_embed_dim | 384 | 384 | 384 |
| hardware | |||
| dtype | bfloat16 | bfloat16 | bfloat16 |
| accelerator | A100 80G | A100 80G | A100 80G |
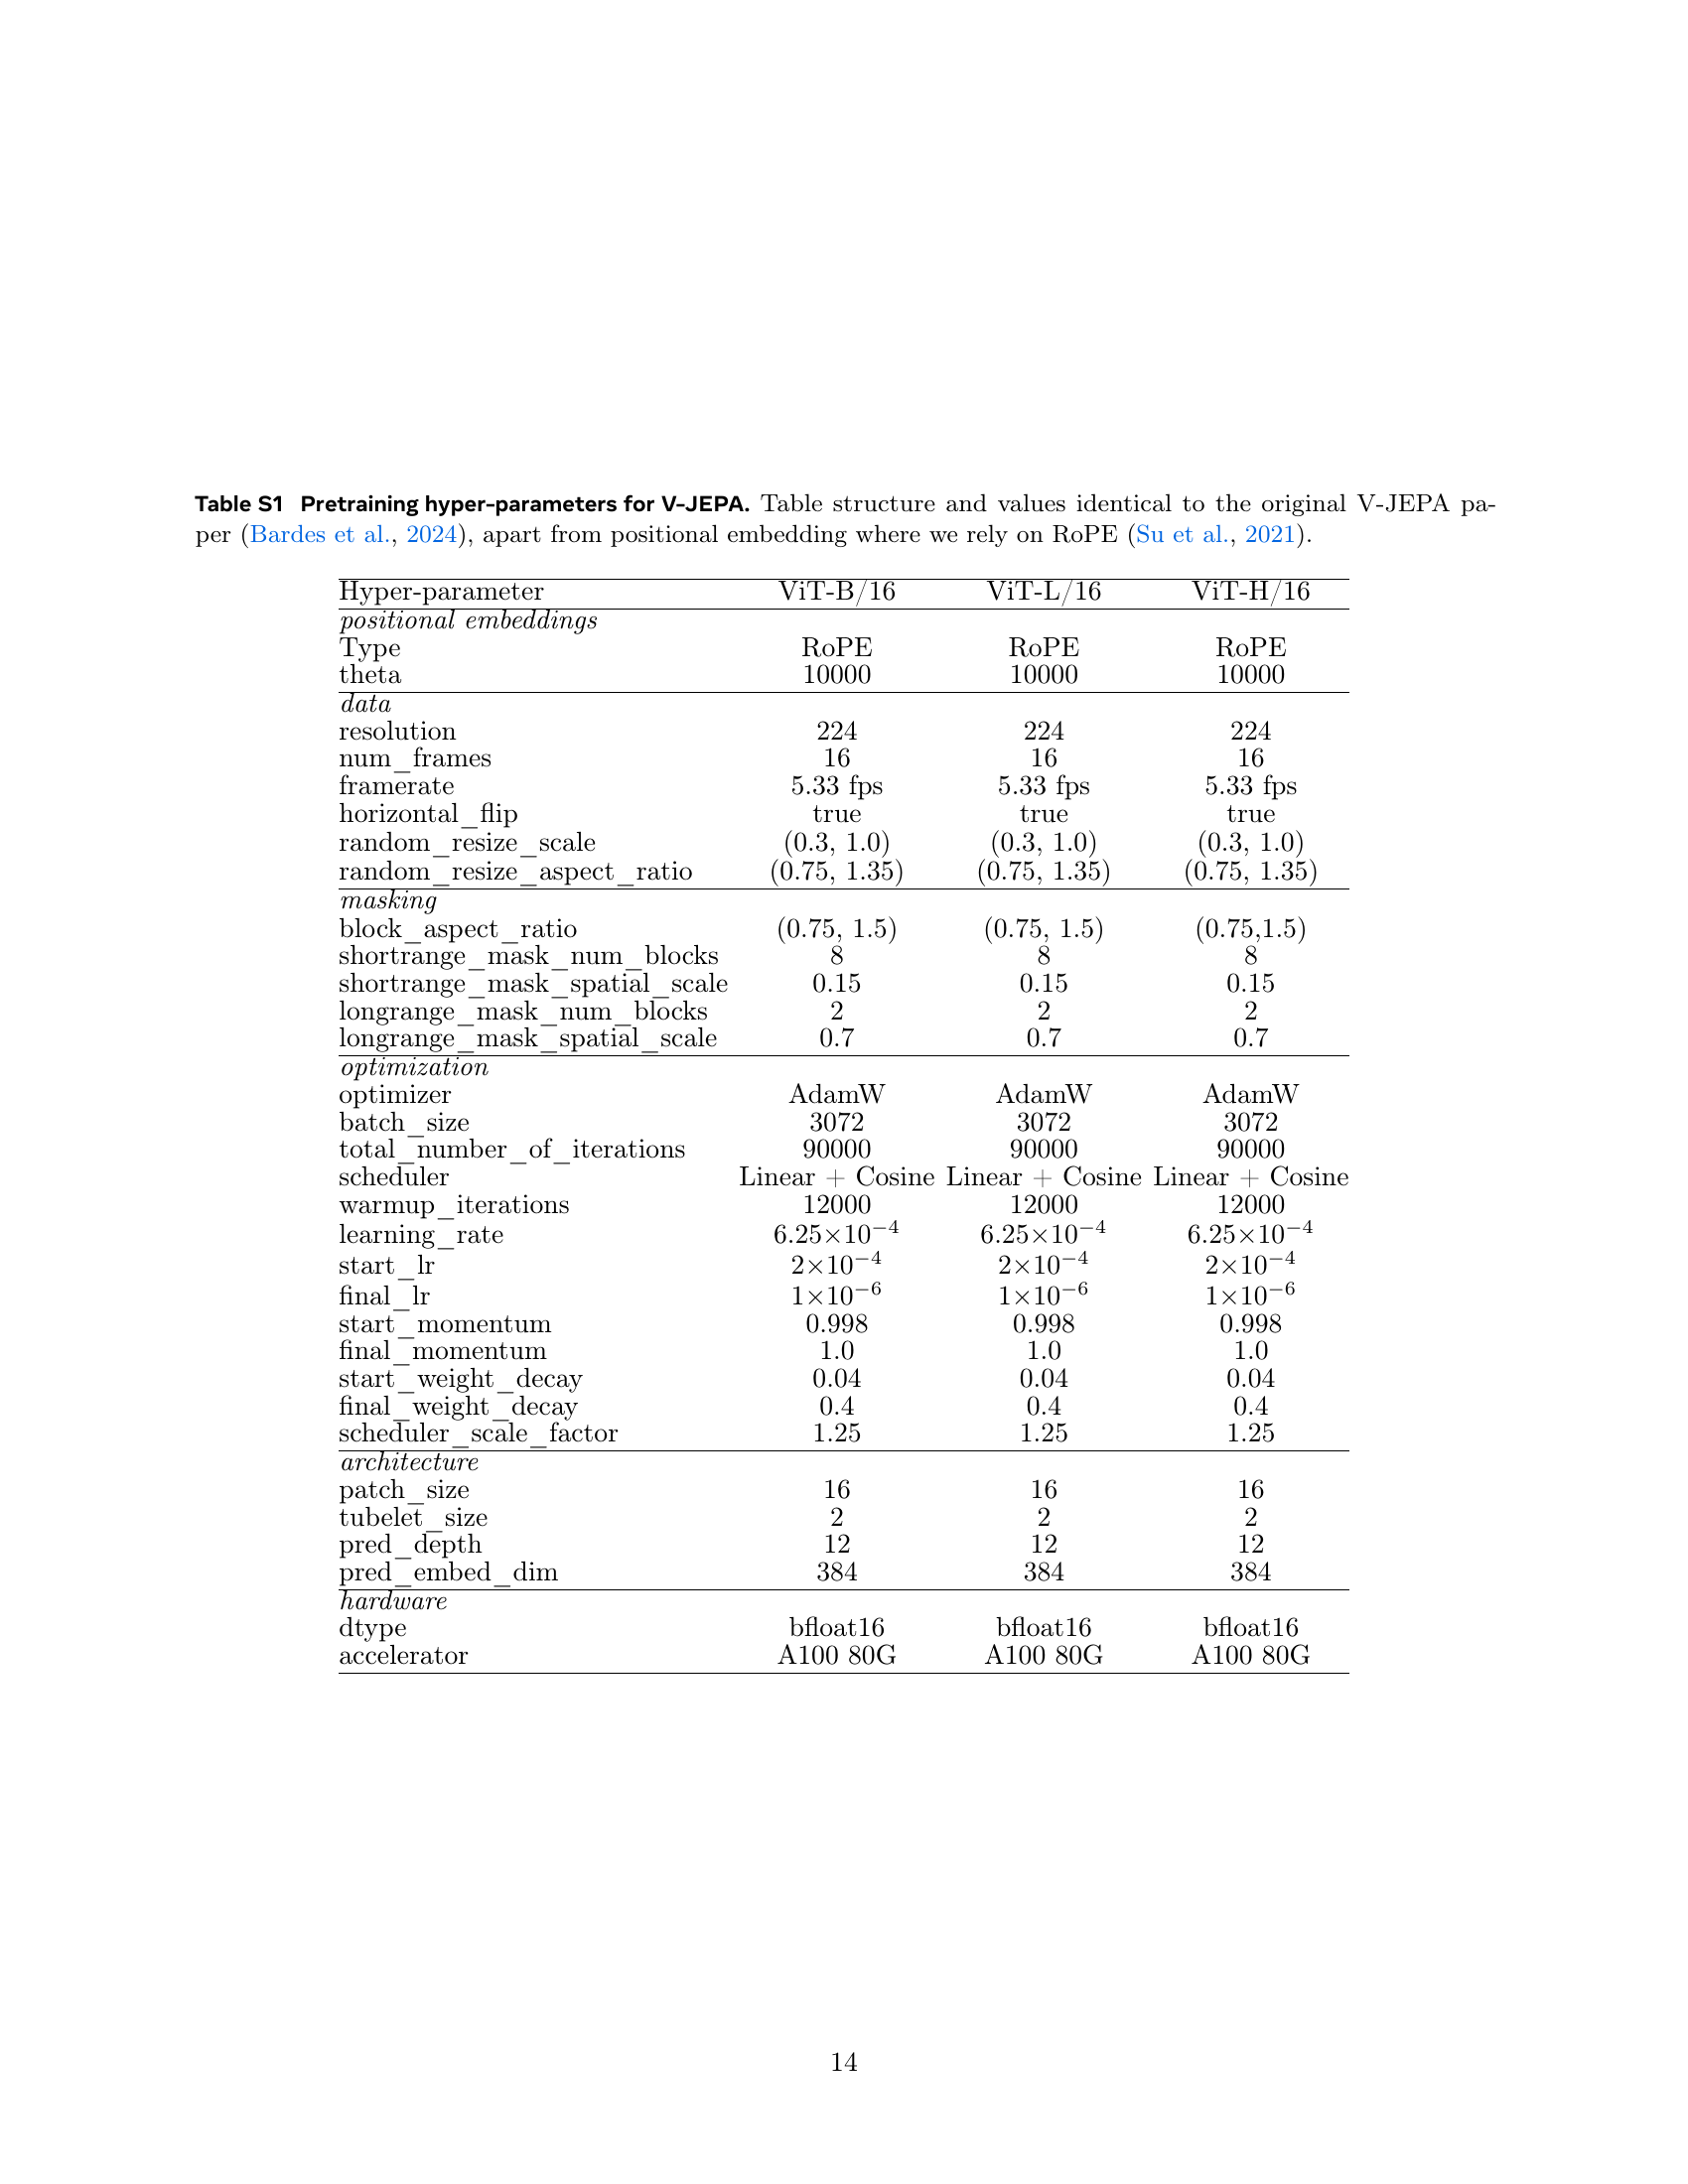
🔼 Table S1 presents the hyperparameters used for pre-training the V-JEPA model. The values are consistent with the original V-JEPA paper by Bardes et al. (2024), with the exception of the positional embedding method, which utilizes Rotary Position Embedding (RoPE) as described in Su et al. (2021). The table details various settings, including model architecture (Vision Transformer variations), training data parameters (resolution, frame rate, data augmentation), optimizer settings (AdamW parameters), and training schedule details (learning rate, weight decay, etc.). This table is crucial for reproducibility and understanding the experimental setup of the V-JEPA model.
read the caption
Table S1: Pretraining hyper-parameters for V-JEPA. Table structure and values identical to the original V-JEPA paper (Bardes et al., 2024), apart from positional embedding where we rely on RoPE (Su et al., 2021).
In-depth insights#
Intuitive Physics AI#
The concept of “Intuitive Physics AI” explores how artificial intelligence can be developed to understand and reason about the physical world in a manner similar to humans. This involves moving beyond simple physics engines and delving into the realm of common-sense reasoning, predictive modeling, and understanding of causality. A key aspect is the ability of AI systems to generalize from limited data and to handle uncertainty and unexpected events. This field is challenging because intuitive physics knowledge is often implicit and tacit rather than explicitly formulated. Success would have profound implications, enabling robots to safely navigate complex environments, AI systems to interpret visual scenes with greater depth, and the creation of more robust and adaptable AI agents overall. Key challenges involve developing AI models that can learn from diverse and messy real-world data, effectively handle uncertainty and noise, and generalize to novel situations. The core knowledge hypothesis, suggesting humans possess innate physical knowledge, raises questions of how such capabilities can emerge in AI systems, with self-supervised learning and predictive coding frameworks offering promising directions.
V-JEPA Architecture#
The core of the research revolves around V-JEPA (Video Joint Embedding Predictive Architecture), a novel approach to achieve intuitive physics understanding in AI models. V-JEPA cleverly leverages self-supervised learning by training on natural videos to predict masked regions. This method differs significantly from prior works that relied on hand-crafted features or structured models. Instead, V-JEPA learns an abstract representation space, enabling it to capture the underlying dynamics of the physical world without explicitly encoding rules. The model’s ability to predict masked portions of videos demonstrates an understanding of object permanence and shape consistency, exceeding the capabilities of other methods operating in pixel space or relying on textual reasoning. The success of V-JEPA challenges the notion that innate, hardwired knowledge is crucial for understanding intuitive physics, suggesting that self-supervised learning from raw sensory input can suffice.
Violation of Expectation#
The Violation of Expectation paradigm, rooted in developmental psychology, is a cornerstone of the research. It leverages the innate human tendency to react with surprise to physically impossible events. By presenting models with pairs of videos – one depicting a plausible scenario, the other a violation – researchers assess the model’s understanding based on its ‘surprise’ response (e.g., longer gaze time, prediction error). This method cleverly bypasses the need for explicit training on physics concepts, instead relying on the model’s internal representation of the world to reveal its grasp of intuitive physics. Higher surprise responses to impossible scenarios indicate a better understanding. The strength of this approach lies in its simplicity and elegance; it provides a natural, intuitive way to measure intuitive physics understanding without the complexity of explicit physics-based training. This methodology directly addresses the core question of whether an understanding of physics is hardwired or learned. The results demonstrate that models trained to predict masked regions in video do, in fact, demonstrate an understanding using this paradigm, suggesting a strong argument for the learned component of intuitive physics.
Ablation Study#
An ablation study systematically removes components of a model to understand their individual contributions. In the context of the research paper, this would involve selectively disabling or removing parts of the V-JEPA architecture (e.g., the encoder, predictor, specific layers) or altering aspects of the training procedure (e.g., the type of masking used during pre-training). By observing how performance changes on intuitive physics tasks after these alterations, the researchers can pinpoint what features are essential for the model’s understanding. This process helps determine the importance of each component (e.g., the learned representation space, the prediction task) and reveals how model architecture affects its capacity for intuitive physics understanding. The insights gained from such an ablation study provide crucial evidence supporting or refuting the core hypotheses about how intuitive physics understanding emerges in the model. The results would likely show a clear drop in performance if essential components were removed, suggesting their critical role in learning the target capabilities.
Future Work#
Future research directions stemming from this work on intuitive physics in AI models could explore several promising avenues. Scaling up the model size and training data further is crucial to ascertain whether the observed understanding generalizes to more complex scenarios and longer temporal dependencies. Investigating the influence of different video sources, especially those mimicking the visual input of infants, could provide further insights into the development of intuitive physics. A deeper exploration of the architecture’s limitations is also warranted. The model’s struggles with certain intuitive physics concepts, such as collisions, suggests a need for improvements in representing object interactions. This could involve incorporating more sophisticated methods for modeling object dynamics or exploring alternative architectural designs like hierarchical models. Finally, investigating the integration of agency and interaction within the model could significantly enhance its understanding. Allowing the model to interact with the simulated environment rather than simply observing it might unlock a more comprehensive grasp of physical principles. This could lead to more robust and generalized intuitive physics capabilities in AI systems.
More visual insights#
More on figures

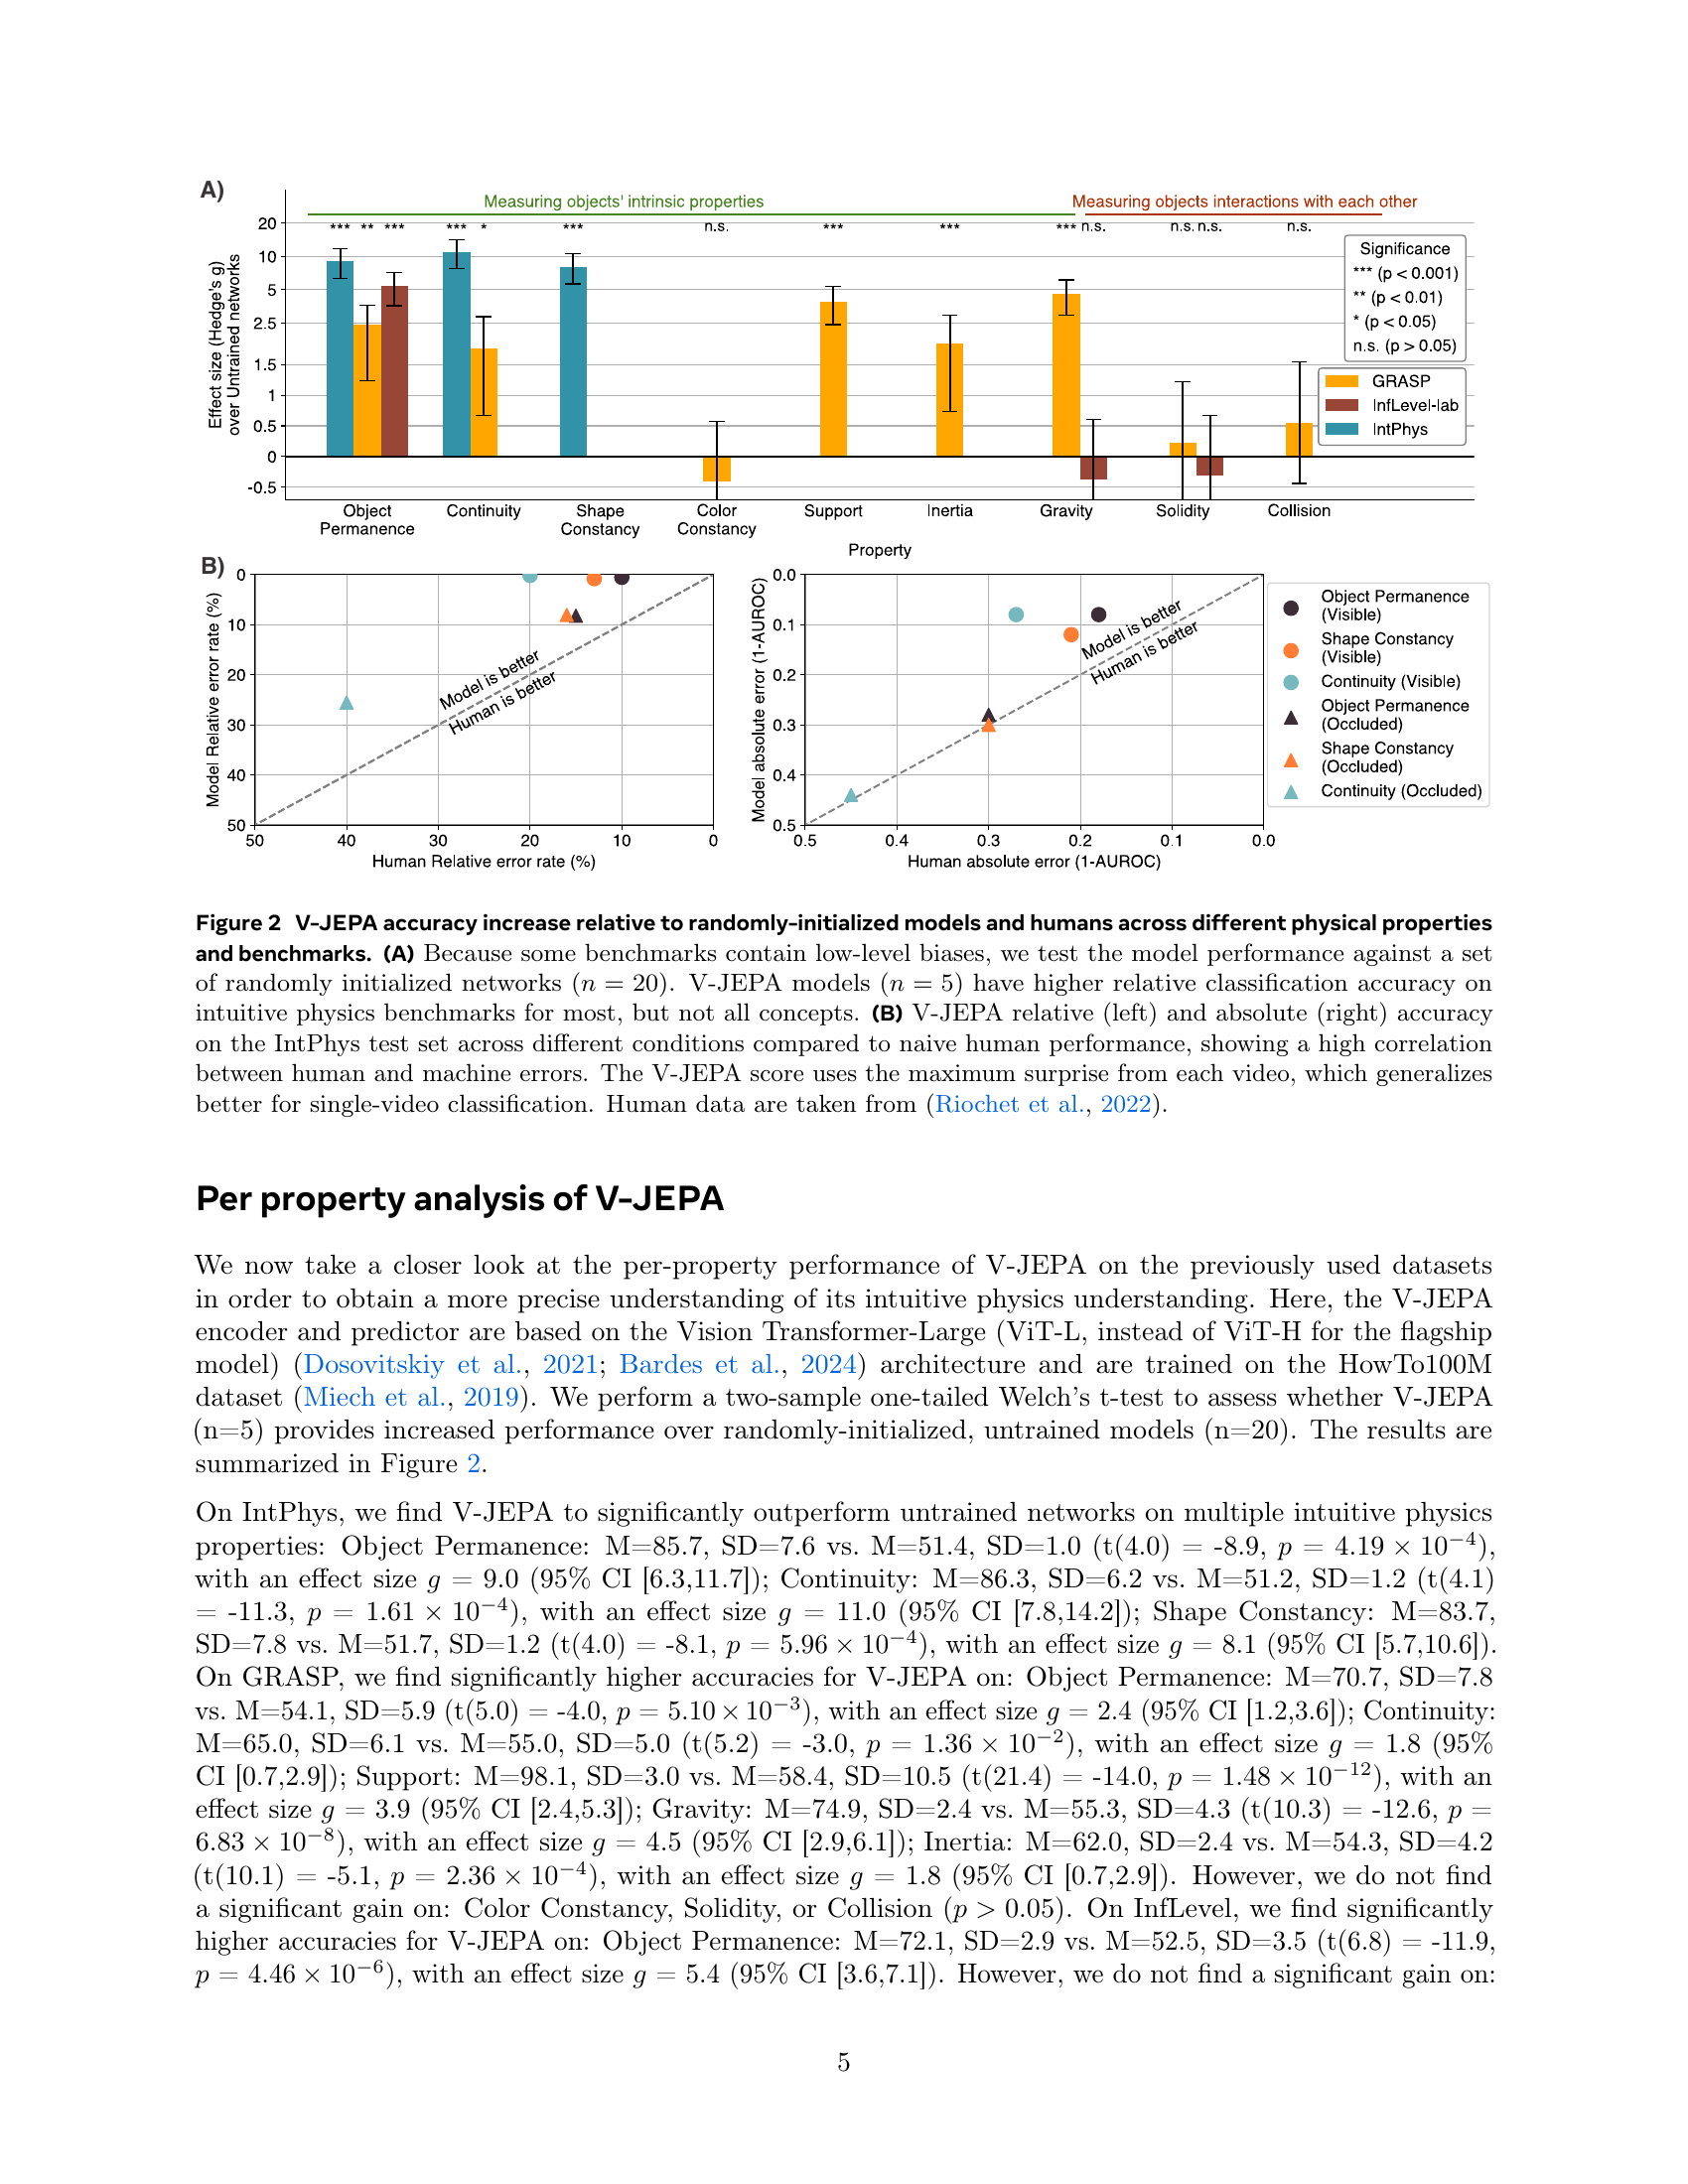
🔼 Figure 2 presents a comparative analysis of V-JEPA’s performance against randomly initialized models and human participants in recognizing intuitive physics properties. Panel (A) shows V-JEPA’s relative classification accuracy across three intuitive physics datasets (IntPhys, GRASP, and InfLevel-lab), comparing it against a control group of randomly initialized networks and highlighting V-JEPA’s superior performance for various physical properties. Panel (B) focuses on the IntPhys dataset, directly comparing V-JEPA’s performance to human participants across various conditions using both relative and absolute accuracy metrics. This panel emphasizes the correlation between human and machine errors and underscores that the maximum surprise value from each video provides a better generalization for single-video classification, based on data from Riochet et al. (2022).
read the caption
Figure 2: V-JEPA accuracy increase relative to randomly-initialized models and humans across different physical properties and benchmarks. (A) Because some benchmarks contain low-level biases, we test the model performance against a set of randomly initialized networks (n=20𝑛20n=20italic_n = 20). V-JEPA models (n=5𝑛5n=5italic_n = 5) have higher relative classification accuracy on intuitive physics benchmarks for most, but not all concepts. (B) V-JEPA relative (left) and absolute (right) accuracy on the IntPhys test set across different conditions compared to naive human performance, showing a high correlation between human and machine errors. The V-JEPA score uses the maximum surprise from each video, which generalizes better for single-video classification. Human data are taken from (Riochet et al., 2022).

🔼 Figure 3 analyzes the impact of various factors on V-JEPA’s performance in understanding intuitive physics, as measured by IntPhys scores. Panel (A) demonstrates that V-JEPA, pretrained on VideoMix2M (VM2M), consistently displays an understanding of intuitive physics regardless of the masking strategy used during training. Panel (B) compares the performance of models trained on three different datasets (K710, HowTo100M, and a combination), revealing that HowTo100M yields superior results. Interestingly, even a subset of the HowTo100M dataset (128 hours) produces above-chance performance, highlighting the model’s robustness and the dataset’s quality. Finally, panel (C) shows that while larger encoder models generally improve accuracy, even the smallest model (115 million parameters) trained on HowTo100M maintains significant performance. Overall, this figure highlights the robustness and key elements contributing to V-JEPA’s success in learning intuitive physics.
read the caption
Figure 3: Influence of type of mask, type and amount of training data, and model size on V-JEPA IntPhys scores. (A) When pretrained on VM2M, V-JEPA exhibits an understanding of intuitive physics with every masking strategy. (B) Of the three training datasets, two give high accuracies when trained separately (K710 and Howto100M). High scores are found with only 1289 hours of Howto100M (the largest dataset), and even 128h gives better than chance performance. (C) While larger encoders improve performance, we find that the performance remains non-trivial across sizes when pretraining on HowTo100M. Confidence intervals obtained via bootstrapping.

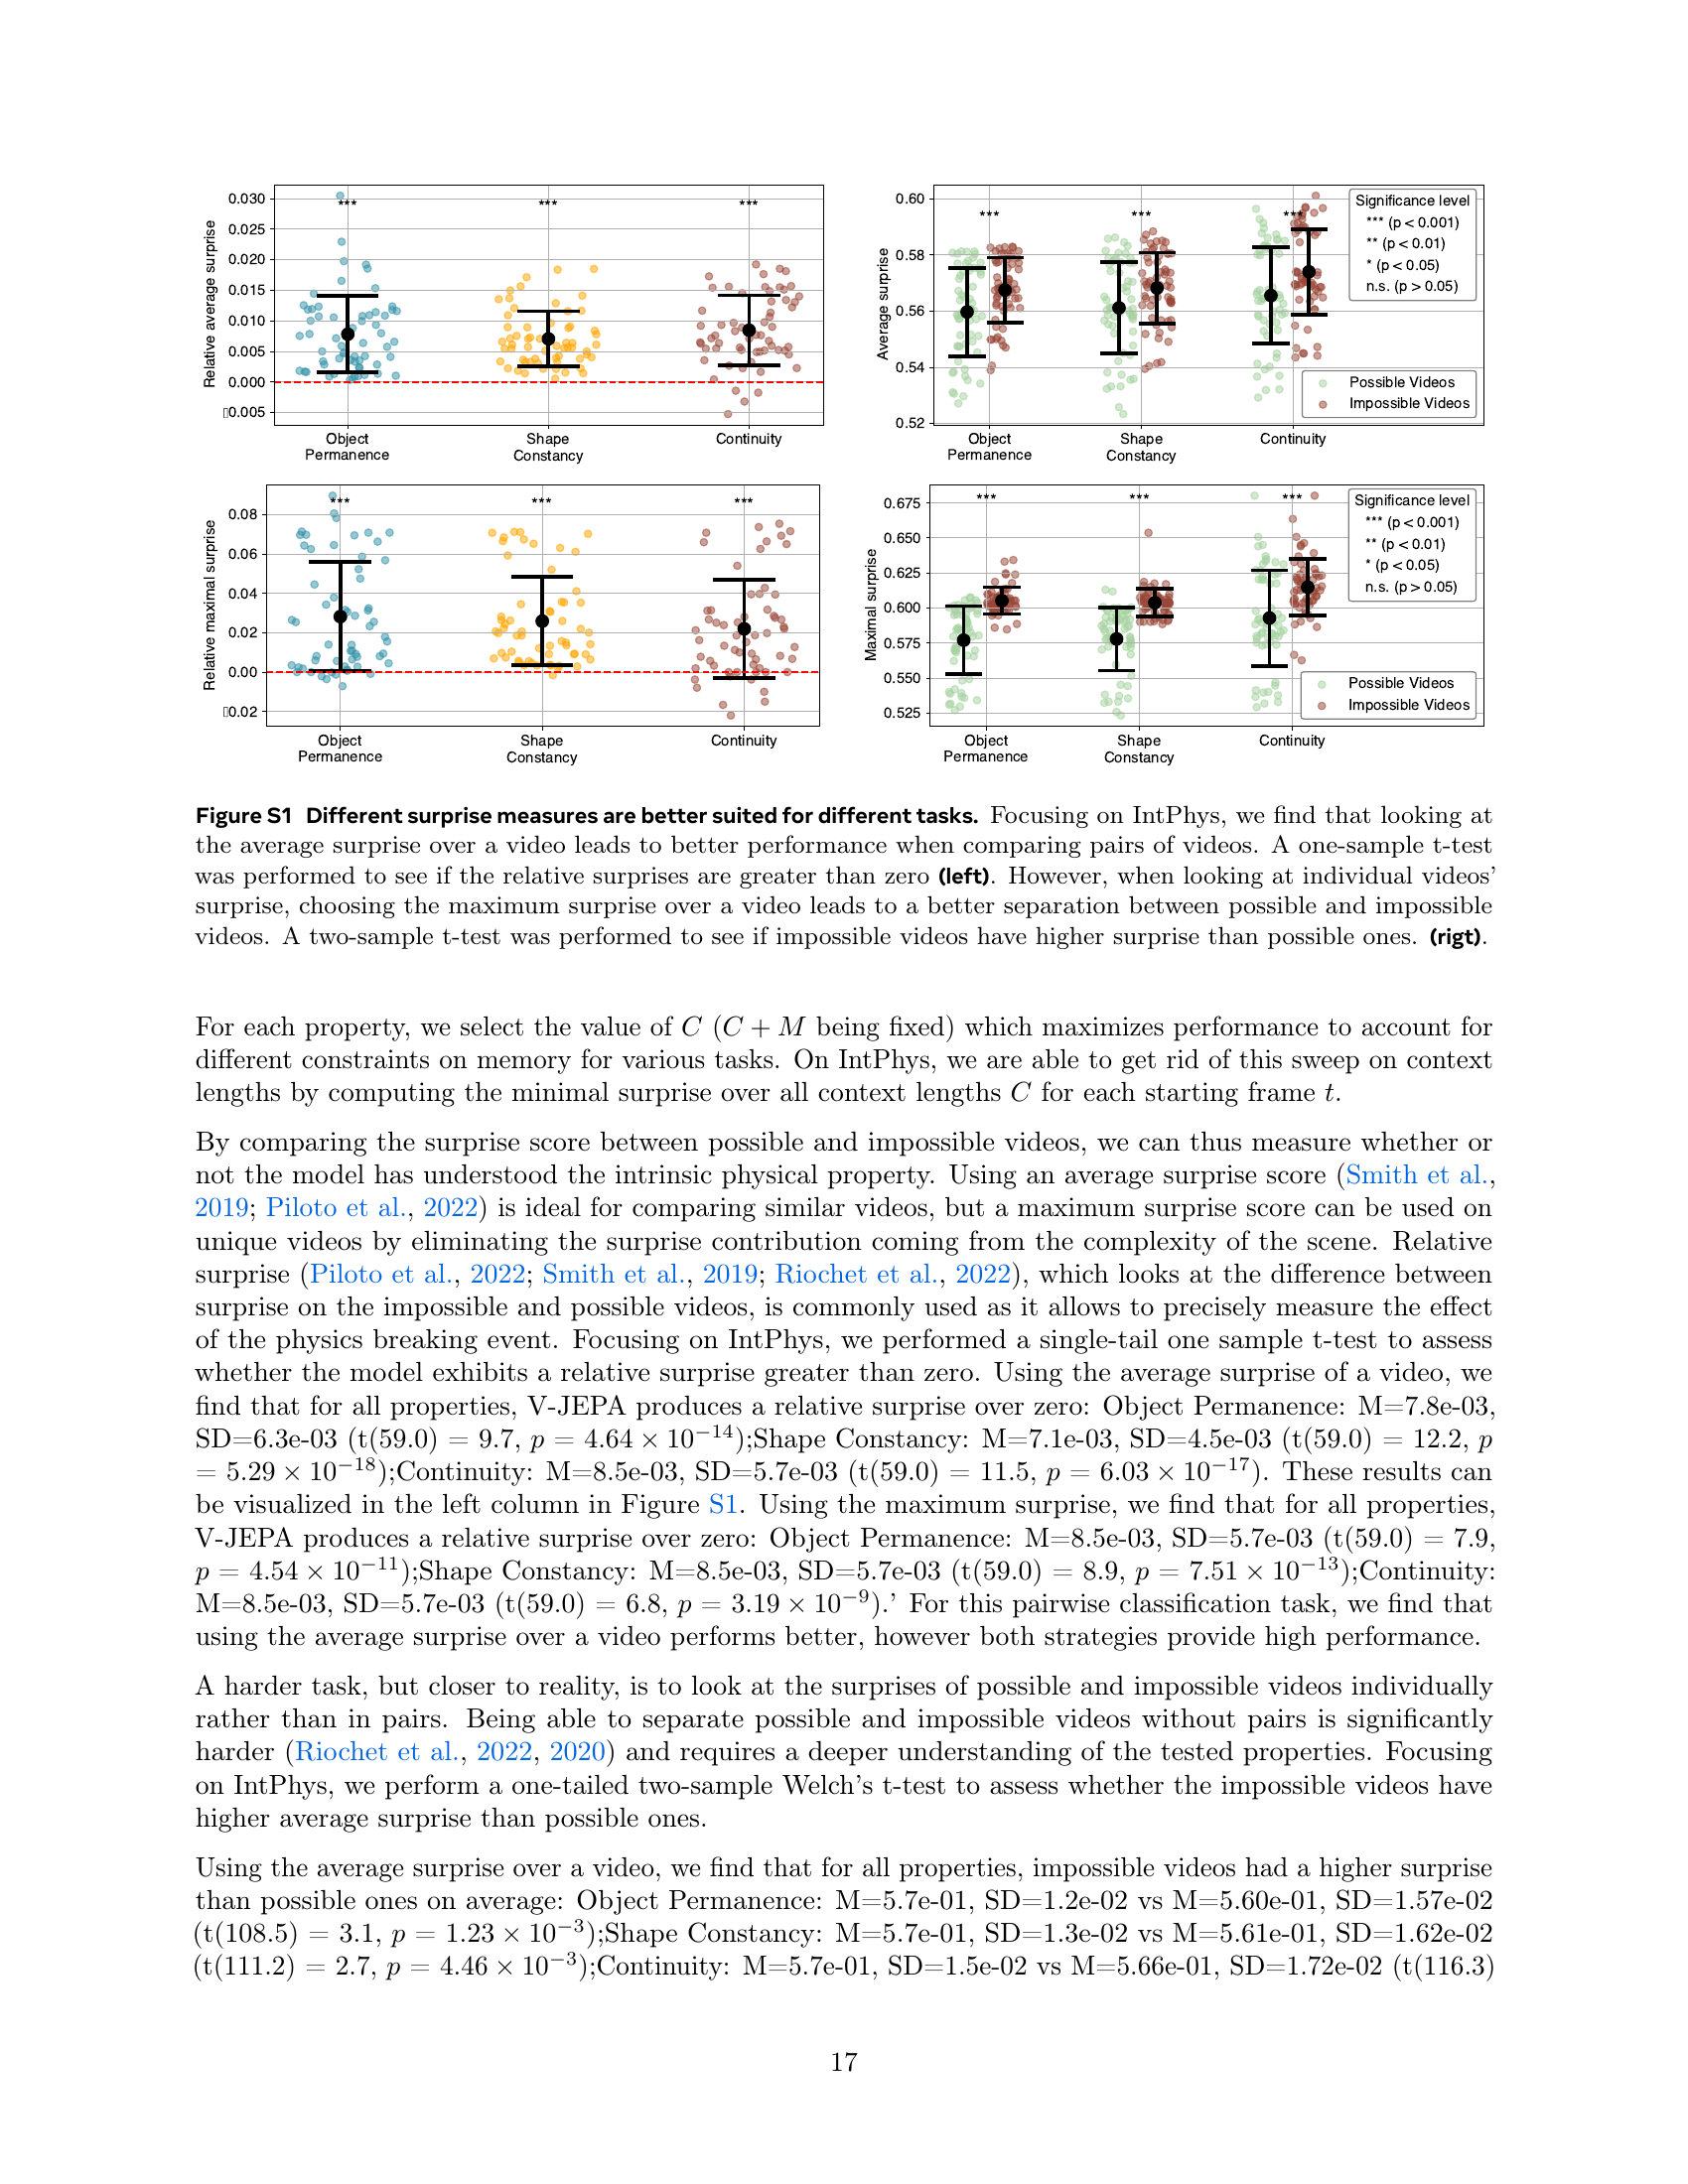
🔼 Figure S1 explores the effectiveness of different methods for measuring surprise in videos, specifically focusing on the IntPhys dataset. The left panel shows that when comparing pairs of videos (one physically possible, one impossible), using the average surprise across the entire video yields better performance for distinguishing between them. This is statistically confirmed using a one-sample t-test showing a relative surprise significantly greater than zero. The right panel examines individual videos. Here, using the maximum surprise within each video leads to a better separation between possible and impossible scenarios, statistically validated using a two-sample t-test showing that impossible videos have significantly higher maximum surprise than possible videos. The figure highlights that the optimal surprise metric depends on the specific task (pairwise comparison vs. individual video classification).
read the caption
Figure S1: Different surprise measures are better suited for different tasks. Focusing on IntPhys, we find that looking at the average surprise over a video leads to better performance when comparing pairs of videos. A one-sample t-test was performed to see if the relative surprises are greater than zero (left). However, when looking at individual videos’ surprise, choosing the maximum surprise over a video leads to a better separation between possible and impossible videos. A two-sample t-test was performed to see if impossible videos have higher surprise than possible ones. (rigt).

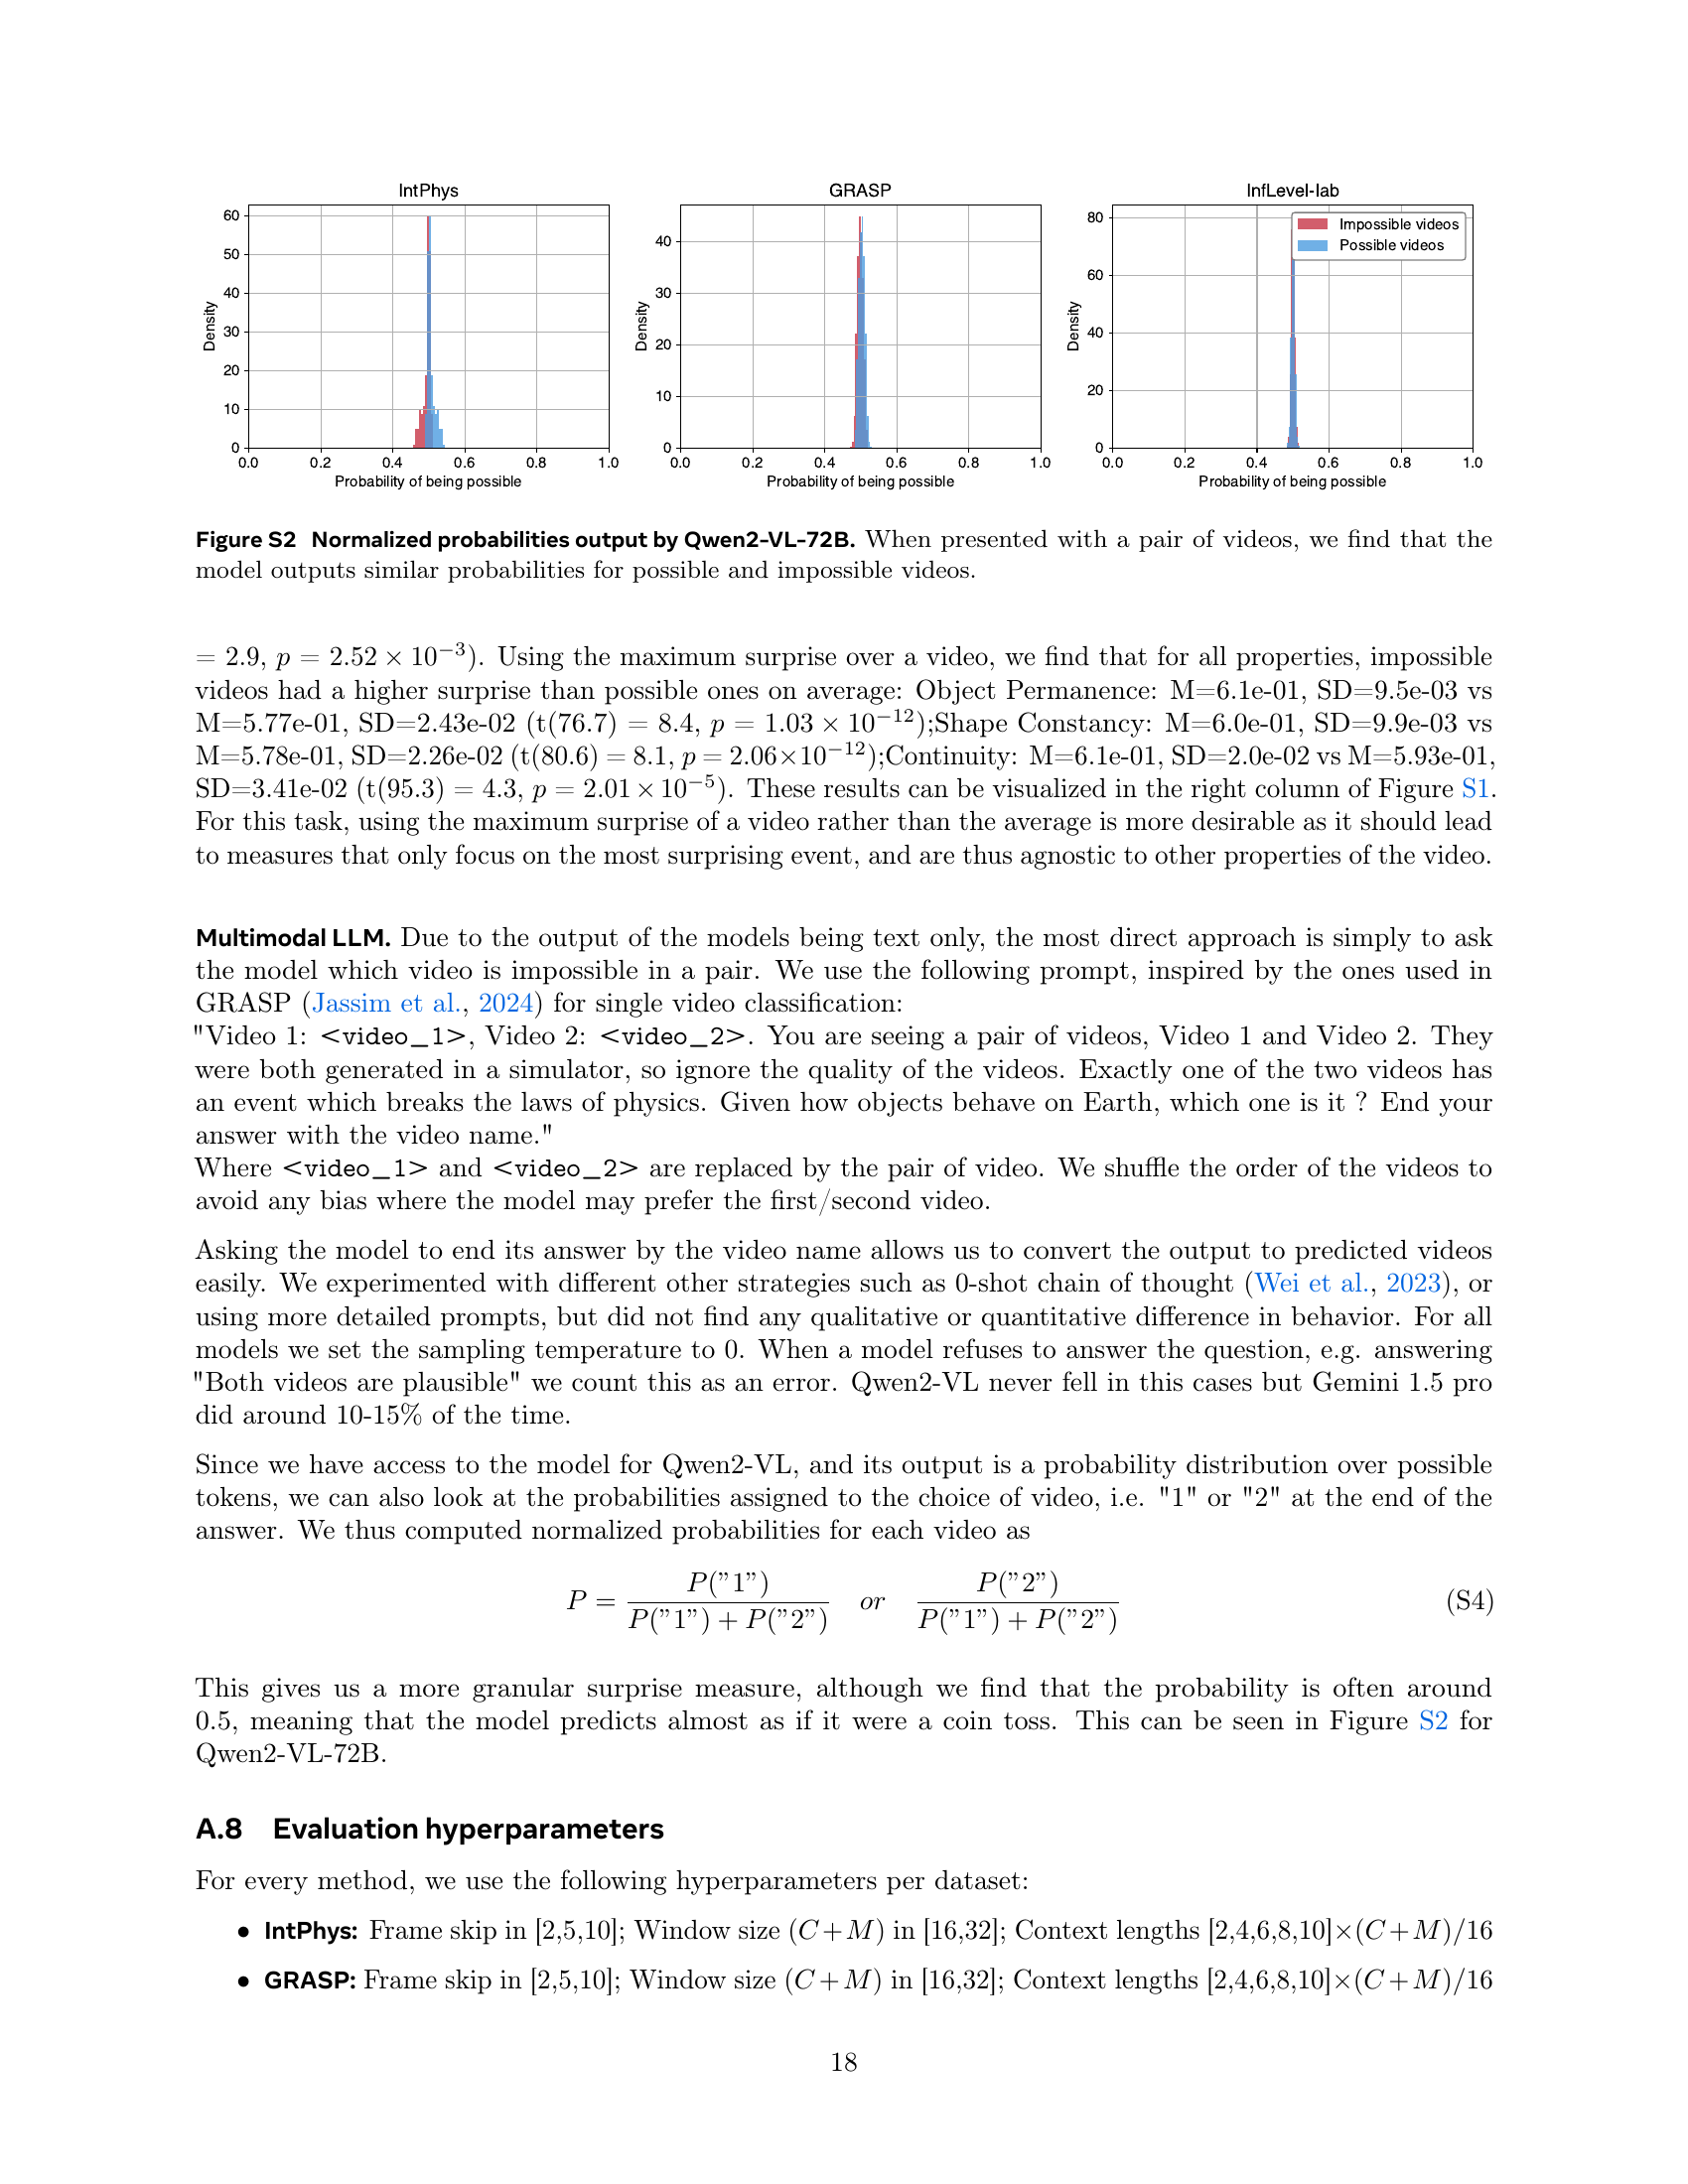
🔼 This figure displays the normalized probability distributions generated by the Qwen2-VL-72B model when presented with pairs of videos, one depicting a physically possible scenario and the other a physically impossible one. The distributions are shown separately for the IntPhys, GRASP, and InfLevel-lab datasets. The x-axis represents the probability of the model classifying a video as ‘possible’, ranging from 0 to 1. The y-axis represents the probability density. The key observation is that the model assigns almost identical probabilities to both possible and impossible videos across all three datasets. This indicates that the model does not reliably distinguish between physically plausible and implausible events, suggesting a lack of robust intuitive physics understanding.
read the caption
Figure S2: Normalized probabilities output by Qwen2-VL-72B. When presented with a pair of videos, we find that the model outputs similar probabilities for possible and impossible videos.

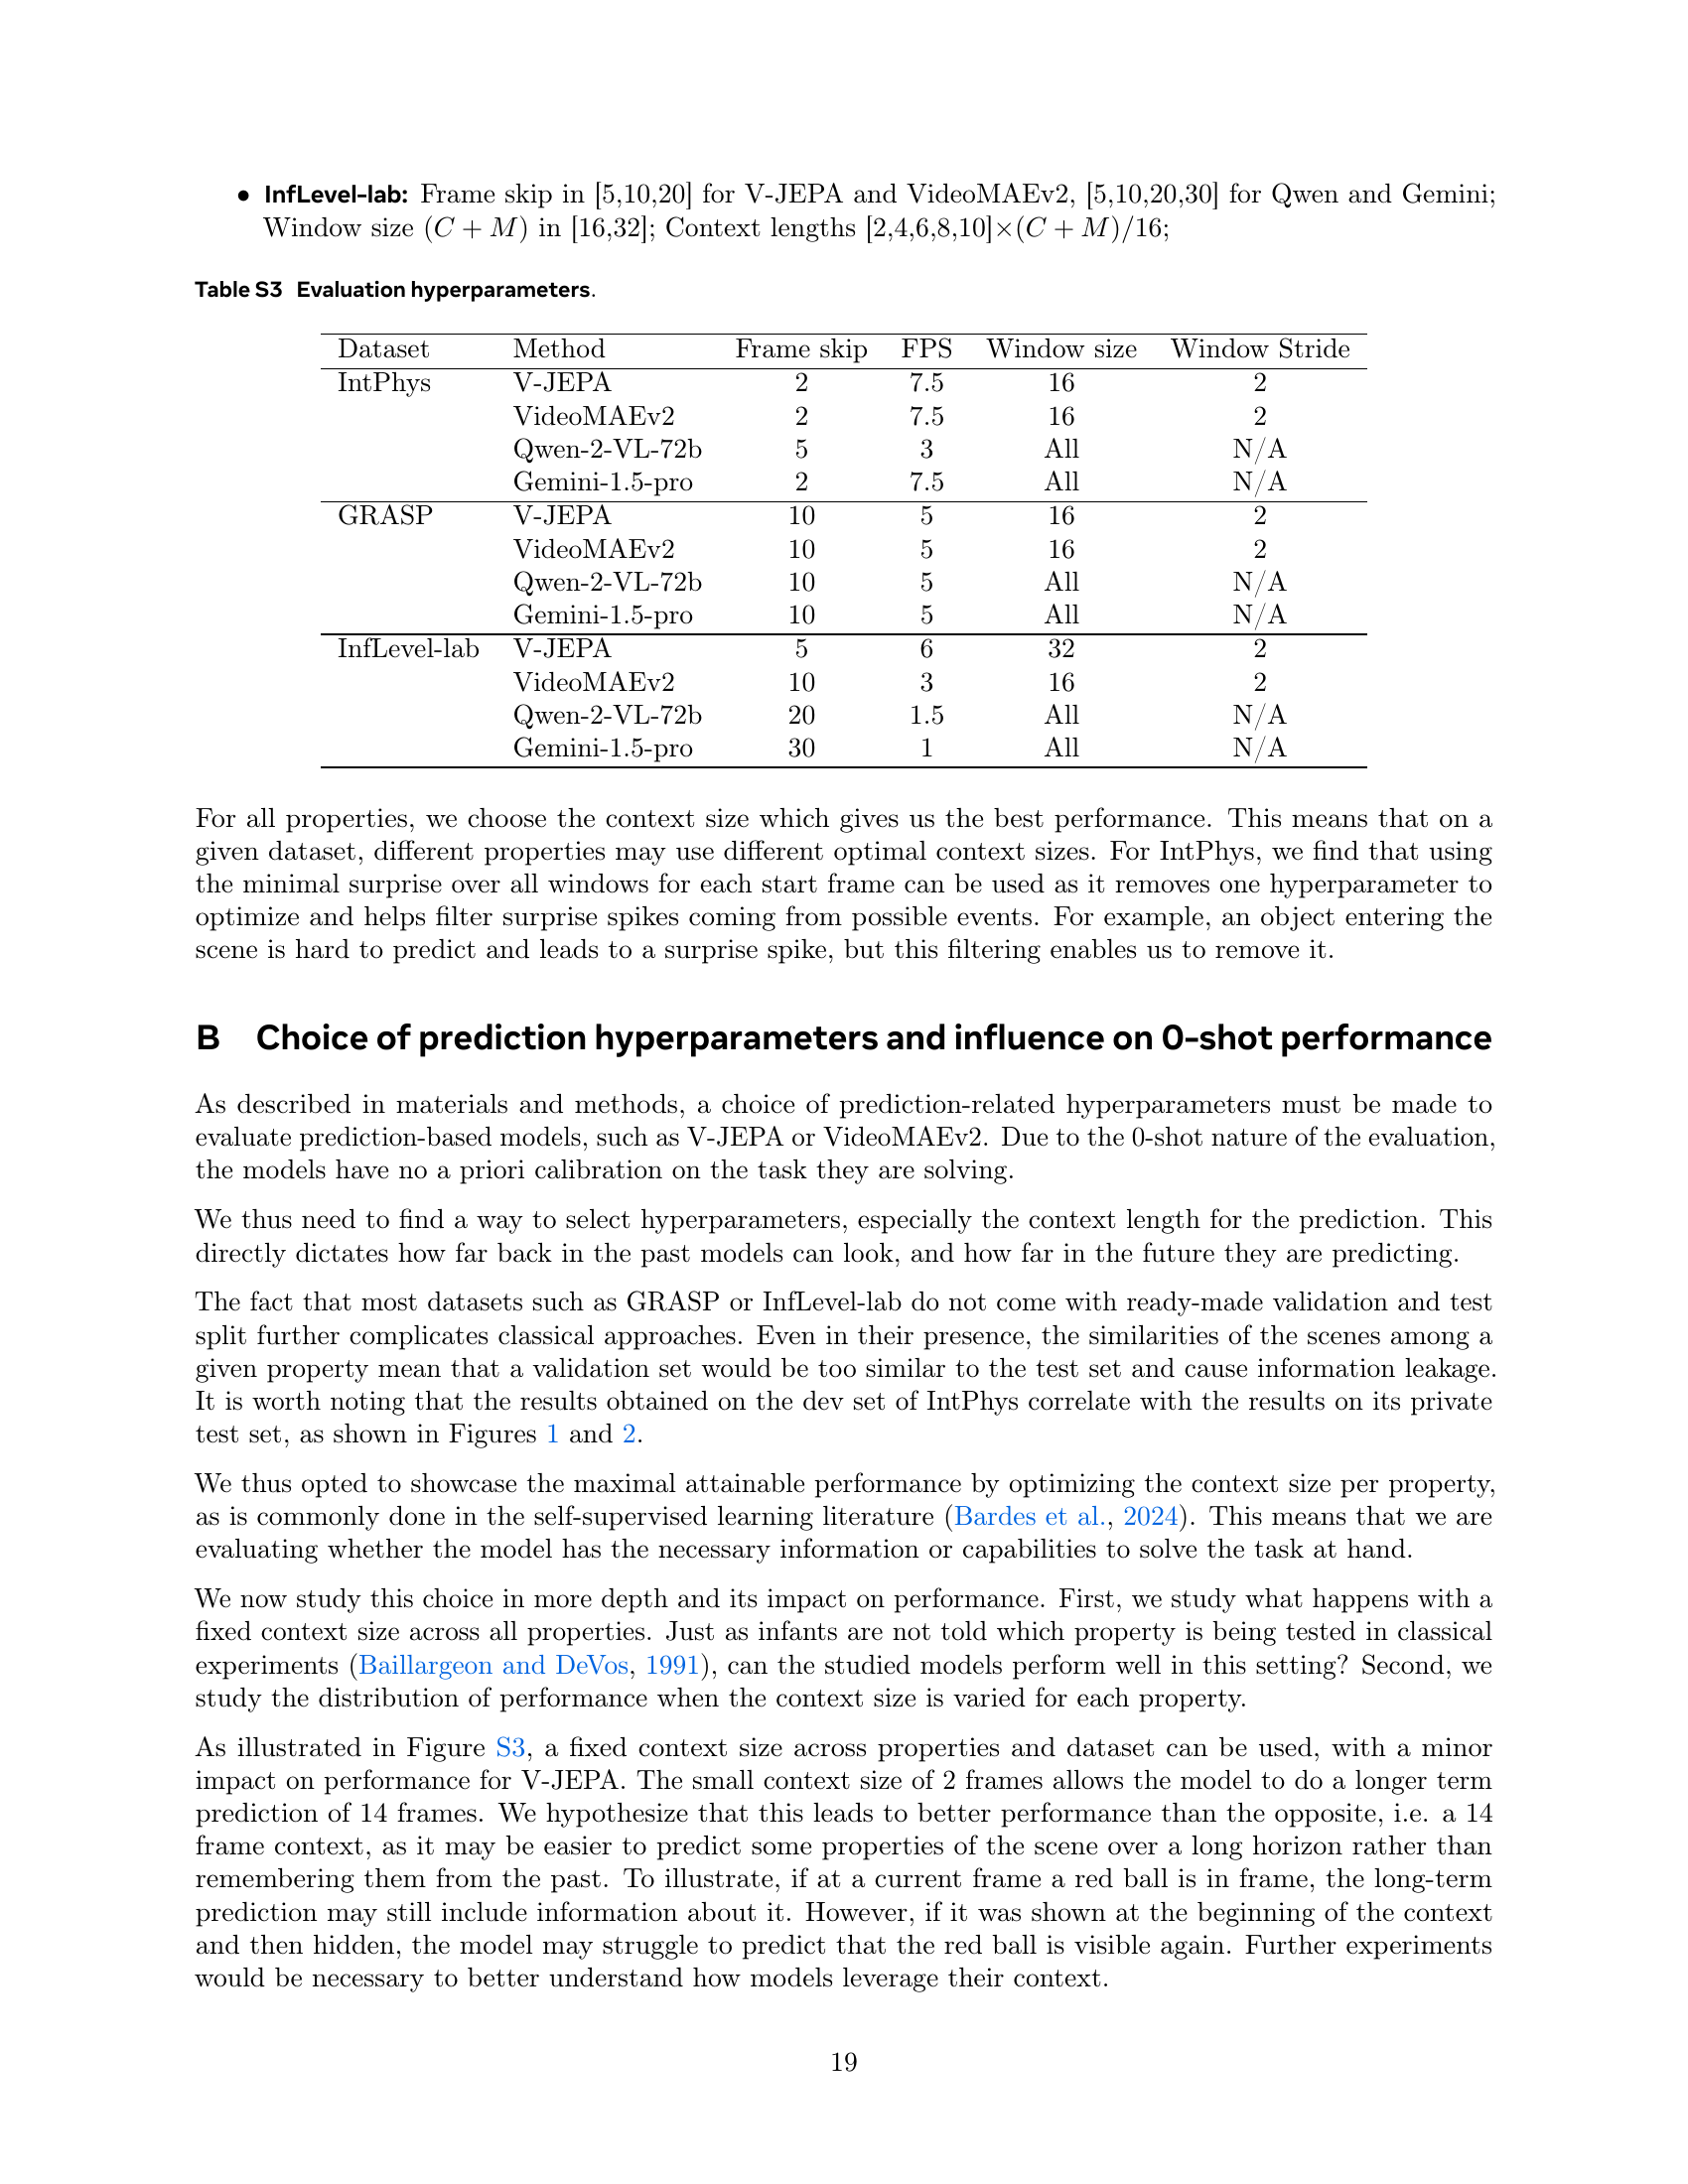
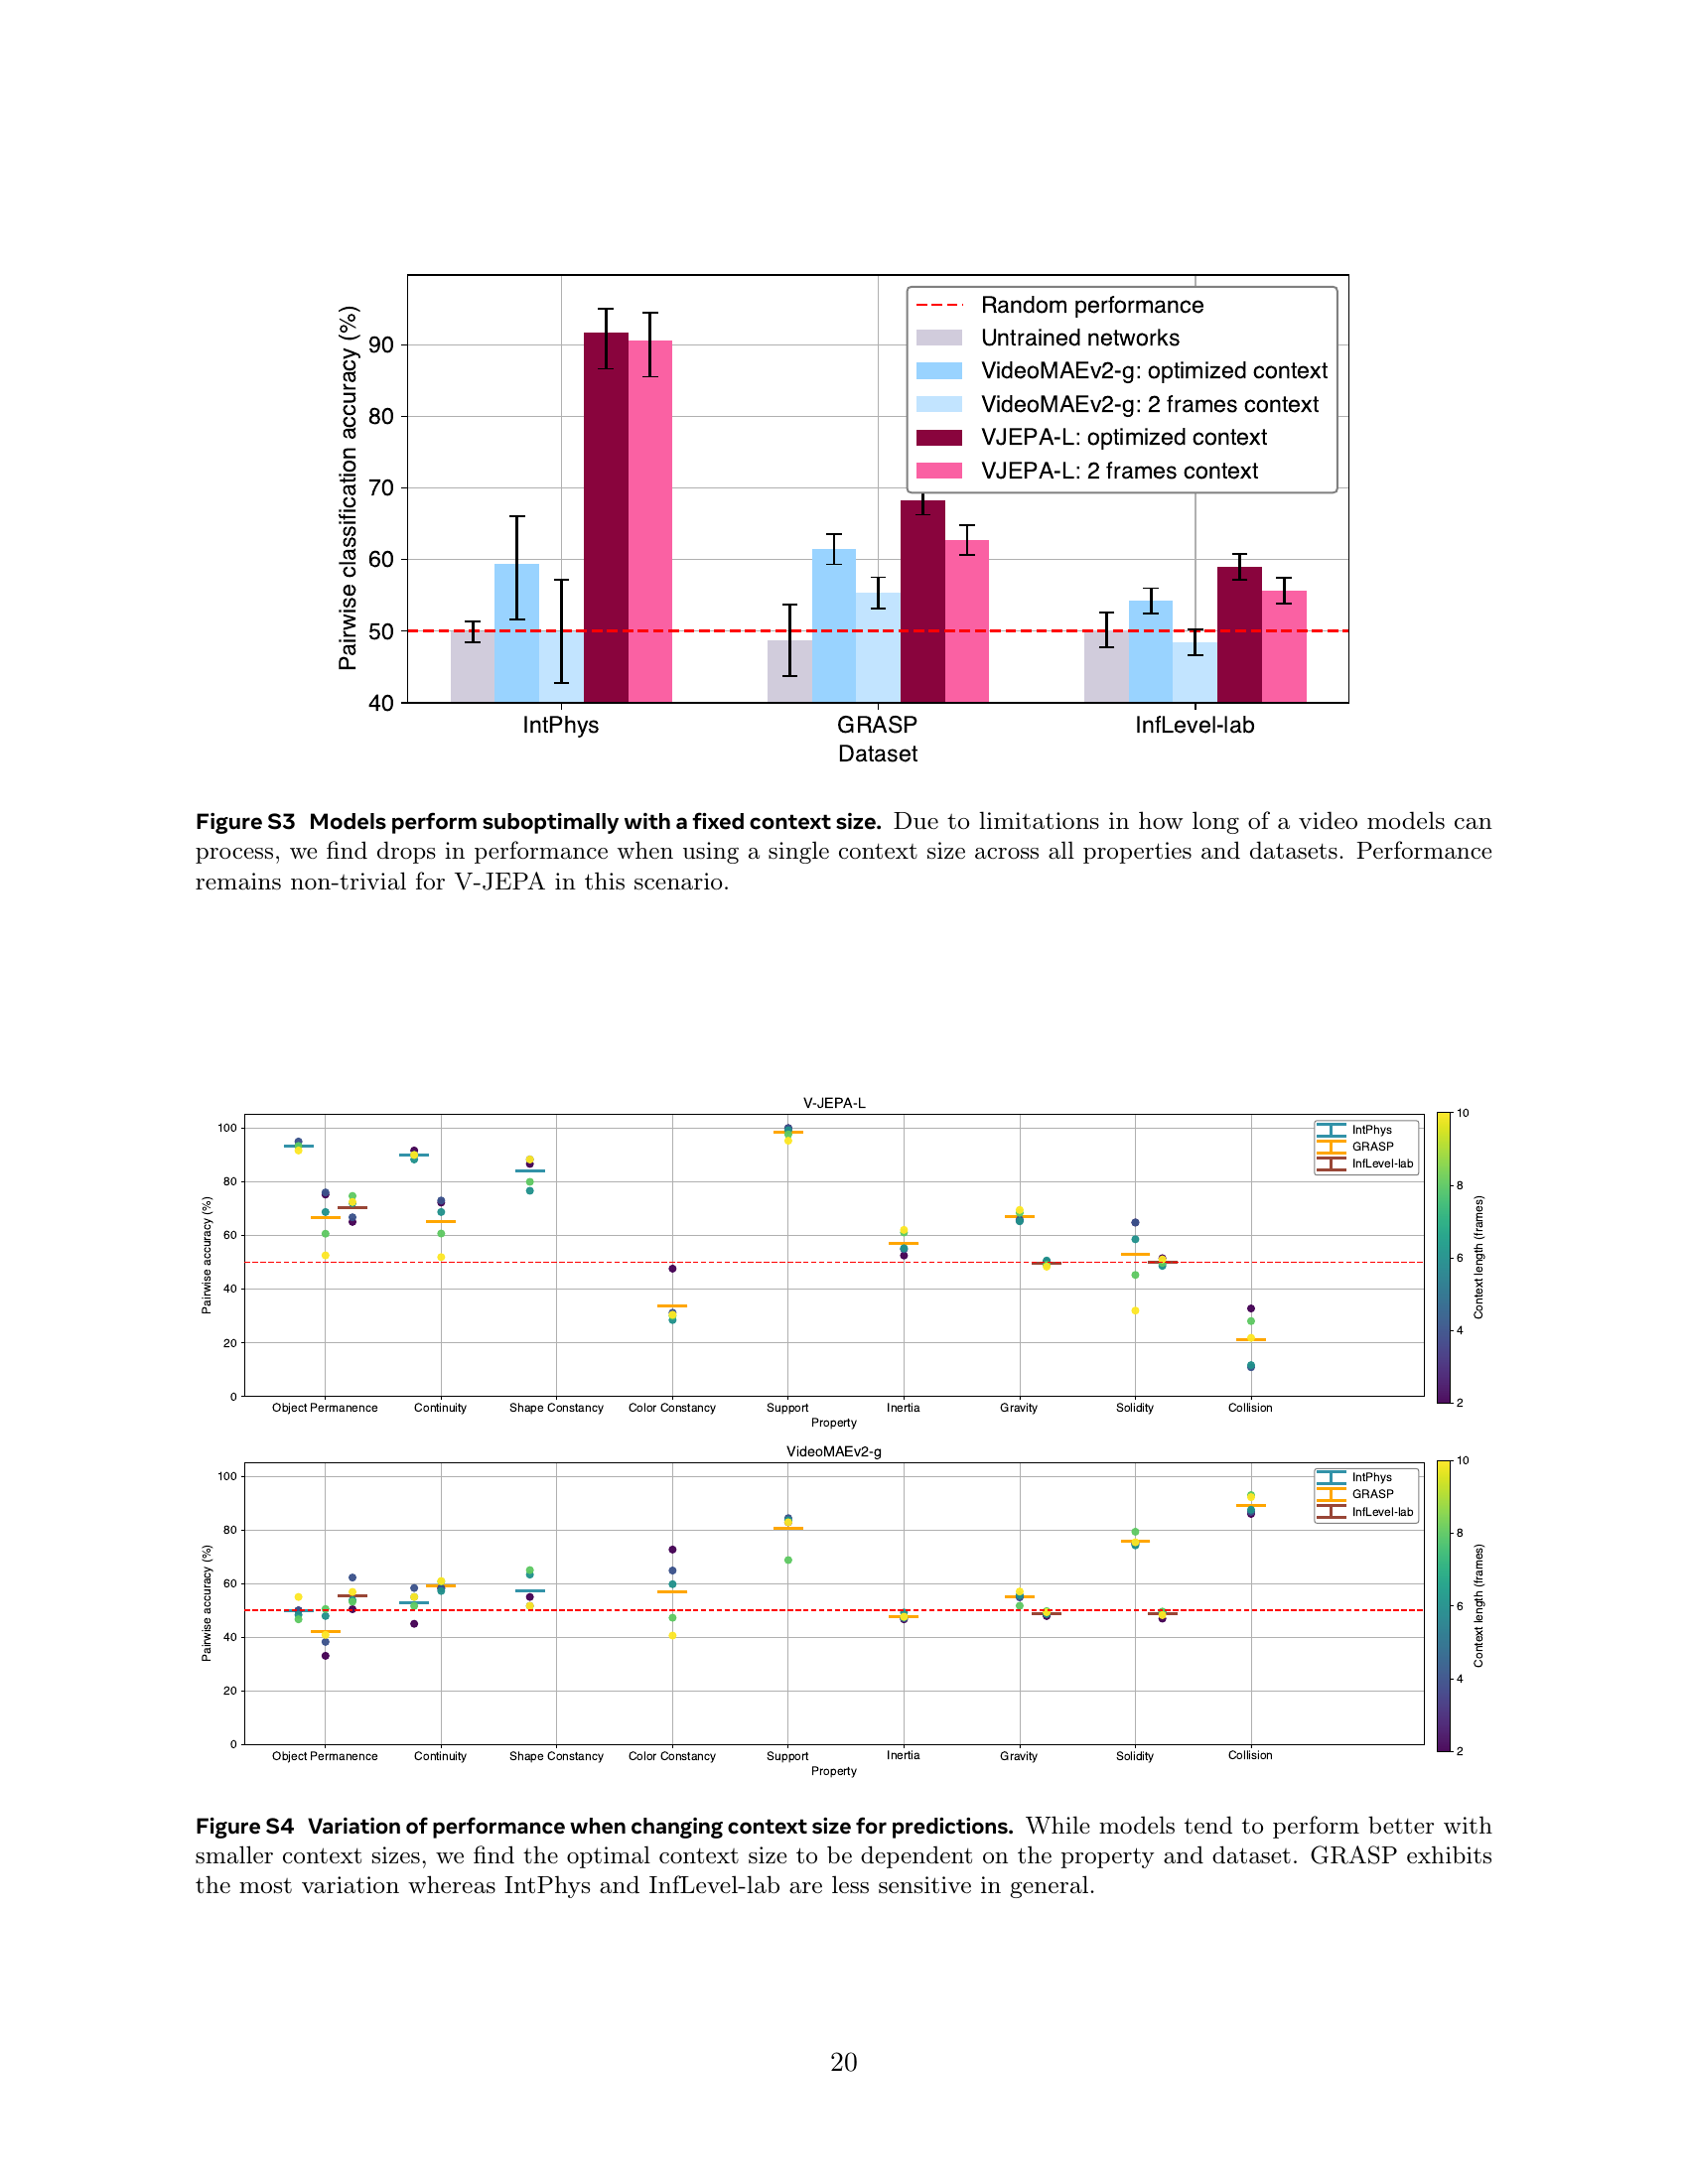
🔼 This figure investigates the effect of using a fixed context size (the number of preceding frames used for prediction) across different intuitive physics properties and datasets. The results show that using a single context size for all tasks leads to suboptimal performance for most models. This is attributed to limitations in the processing capabilities of the models, particularly when dealing with longer videos. Interestingly, V-JEPA shows more robust performance even under this constraint, demonstrating its ability to learn intuitive physics with limited contextual information.
read the caption
Figure S3: Models perform suboptimally with a fixed context size. Due to limitations in how long of a video models can process, we find drops in performance when using a single context size across all properties and datasets. Performance remains non-trivial for V-JEPA in this scenario.

🔼 Figure S4 analyzes the impact of context window size (the number of preceding frames used for prediction) on the accuracy of intuitive physics understanding across three benchmark datasets: IntPhys, GRASP, and InfLevel-lab. The results reveal that while smaller context windows generally lead to better performance, the optimal context size isn’t universal. It varies depending on both the specific intuitive physics property being evaluated (e.g., object permanence, continuity) and the dataset used. Notably, the GRASP dataset exhibits a greater sensitivity to context size changes compared to the IntPhys and InfLevel-lab datasets, indicating its more nuanced nature.
read the caption
Figure S4: Variation of performance when changing context size for predictions. While models tend to perform better with smaller context sizes, we find the optimal context size to be dependent on the property and dataset. GRASP exhibits the most variation whereas IntPhys and InfLevel-lab are less sensitive in general.

🔼 This figure explores how the diversity of training data impacts V-JEPA’s performance on the IntPhys benchmark. Two experiments are conducted: one where the number of videos in the HowTo100M dataset is reduced (left panel), and another where the number of frames per video is reduced, keeping the total number of videos constant (right panel). The left panel shows that reducing video diversity still allows V-JEPA to achieve good performance with only 128 hours of unique video data. The right panel reveals that reducing motion diversity has a stronger negative effect on performance, although the model still shows good results with only 2% of the original frames (equivalent to 2579 hours of video data). This suggests that while both scene and motion diversity are beneficial to model performance, scene diversity is more crucial for achieving a decent level of intuitive physics understanding.
read the caption
Figure S5: Influence of motion and scene diversity. By pretraining V-JEPA-L on subsets of HowTo100M, we investigate how the diversity in motion and scenes affects performance on IntPhys.(left) By subsampling videos, we reduce the diversity in scenes, where we find that the model can still reach good performance with 128h of unique videos. (right) By subsampling frames in videos, we reduce the diversity of motions in each scene. Here we find lower performance than when subsampling videos, but the model still achieves good performance with 2% of the frames (2579h).

🔼 Figure S6 presents a comparison of model performance on the InfLevel-lab dataset before and after modifying the dataset to remove the need for contextual information. The original InfLevel-lab dataset tests the understanding of gravity and solidity, requiring the model to remember properties of objects shown in a prior video segment before evaluating the main part of the experiment. By removing this initial segment and relabeling the videos to reflect the implied properties of the objects, the task becomes simpler. The figure shows that both V-JEPA and VideoMAE models exhibit significantly improved performance on this modified version of the dataset. However, the authors note that this simplification alters the inherent difficulty of distinguishing between ‘possible’ and ‘impossible’ scenarios.
read the caption
Figure S6: Relabeling InfLevel to remove contextualization events. Gravity and solidity both require to remember the properties about the containers shown in a video before the actual experiment. By relabeling the videos such that the prefix video is not necessary, we find a significant increase in performance for both V-JEPA and VideoMAE. However, this relabeling breaks the assumption that the possible and impossible videos have the same difficulty.

🔼 Figure S7 presents a comprehensive analysis of V-JEPA-L’s performance across various intuitive physics properties. It visually compares V-JEPA-L’s performance against that of untrained neural networks. The figure shows V-JEPA-L achieves higher accuracy on most properties tested. Each data point in the figure represents the average performance across five separate model runs (seeds), indicated by black dots, highlighting the model’s consistency.
read the caption
Figure S7: Complete results for V-JEPA-L. The models (n=5𝑛5n=5italic_n = 5) achieve accuracies higher than untrained networks on most properties. Black dots represent the performance of 5 seeds.
🔼 Figure S8 presents a comprehensive analysis of V-JEPA-H’s performance across various intuitive physics properties, comparing it against the performance of 20 untrained networks. The figure visually displays the pairwise classification accuracy achieved by V-JEPA-H for each property, along with confidence intervals derived through bootstrapping. This detailed comparison allows for a thorough assessment of V-JEPA-H’s ability to learn and generalize intuitive physics understanding, highlighting its strengths and potential limitations across different aspects of physical reasoning.
read the caption
Figure S8: Complete results for V-JEPA-H. The model achieves accuracies higher than untrained networks on most properties. Gray dots represent the performance of the 20 untrained networks. Confidence intervals obtained via bootstrapping.

🔼 Figure S9 presents a comprehensive performance analysis of the VideoMAE v2 model across multiple intuitive physics properties. It compares the model’s accuracy to that of untrained networks (serving as a baseline) using the pairwise classification task. The figure visualizes the accuracy for each property (e.g., object permanence, continuity, shape constancy, etc.) across three datasets (IntPhys, GRASP, InfLevel-lab). Error bars represent confidence intervals calculated through bootstrapping. A key observation is that VideoMAE v2 generally performs at or slightly above the level of untrained networks, except for the properties of solidity and collision, where its performance is closer to chance level. The gray dots in the chart specifically indicate the performance of the untrained networks.
read the caption
Figure S9: Complete results for VideoMAEv2. The model achieves performance on par or slightly higher than untrained networks across properties, apart from solidity and collision. Gray dots represent the performance of the 20 untrained networks. Confidence intervals obtained via bootstrapping.
More on tables
| Dataset | Realistic | Diverse scenes | Size | Number of Properties |
|---|---|---|---|---|
| IntPhys | No | Yes | 360 | 3 |
| GRASP | No | No | 4000 | 10 |
| InfLevel-lab | Yes | No | 4000 | 3 |
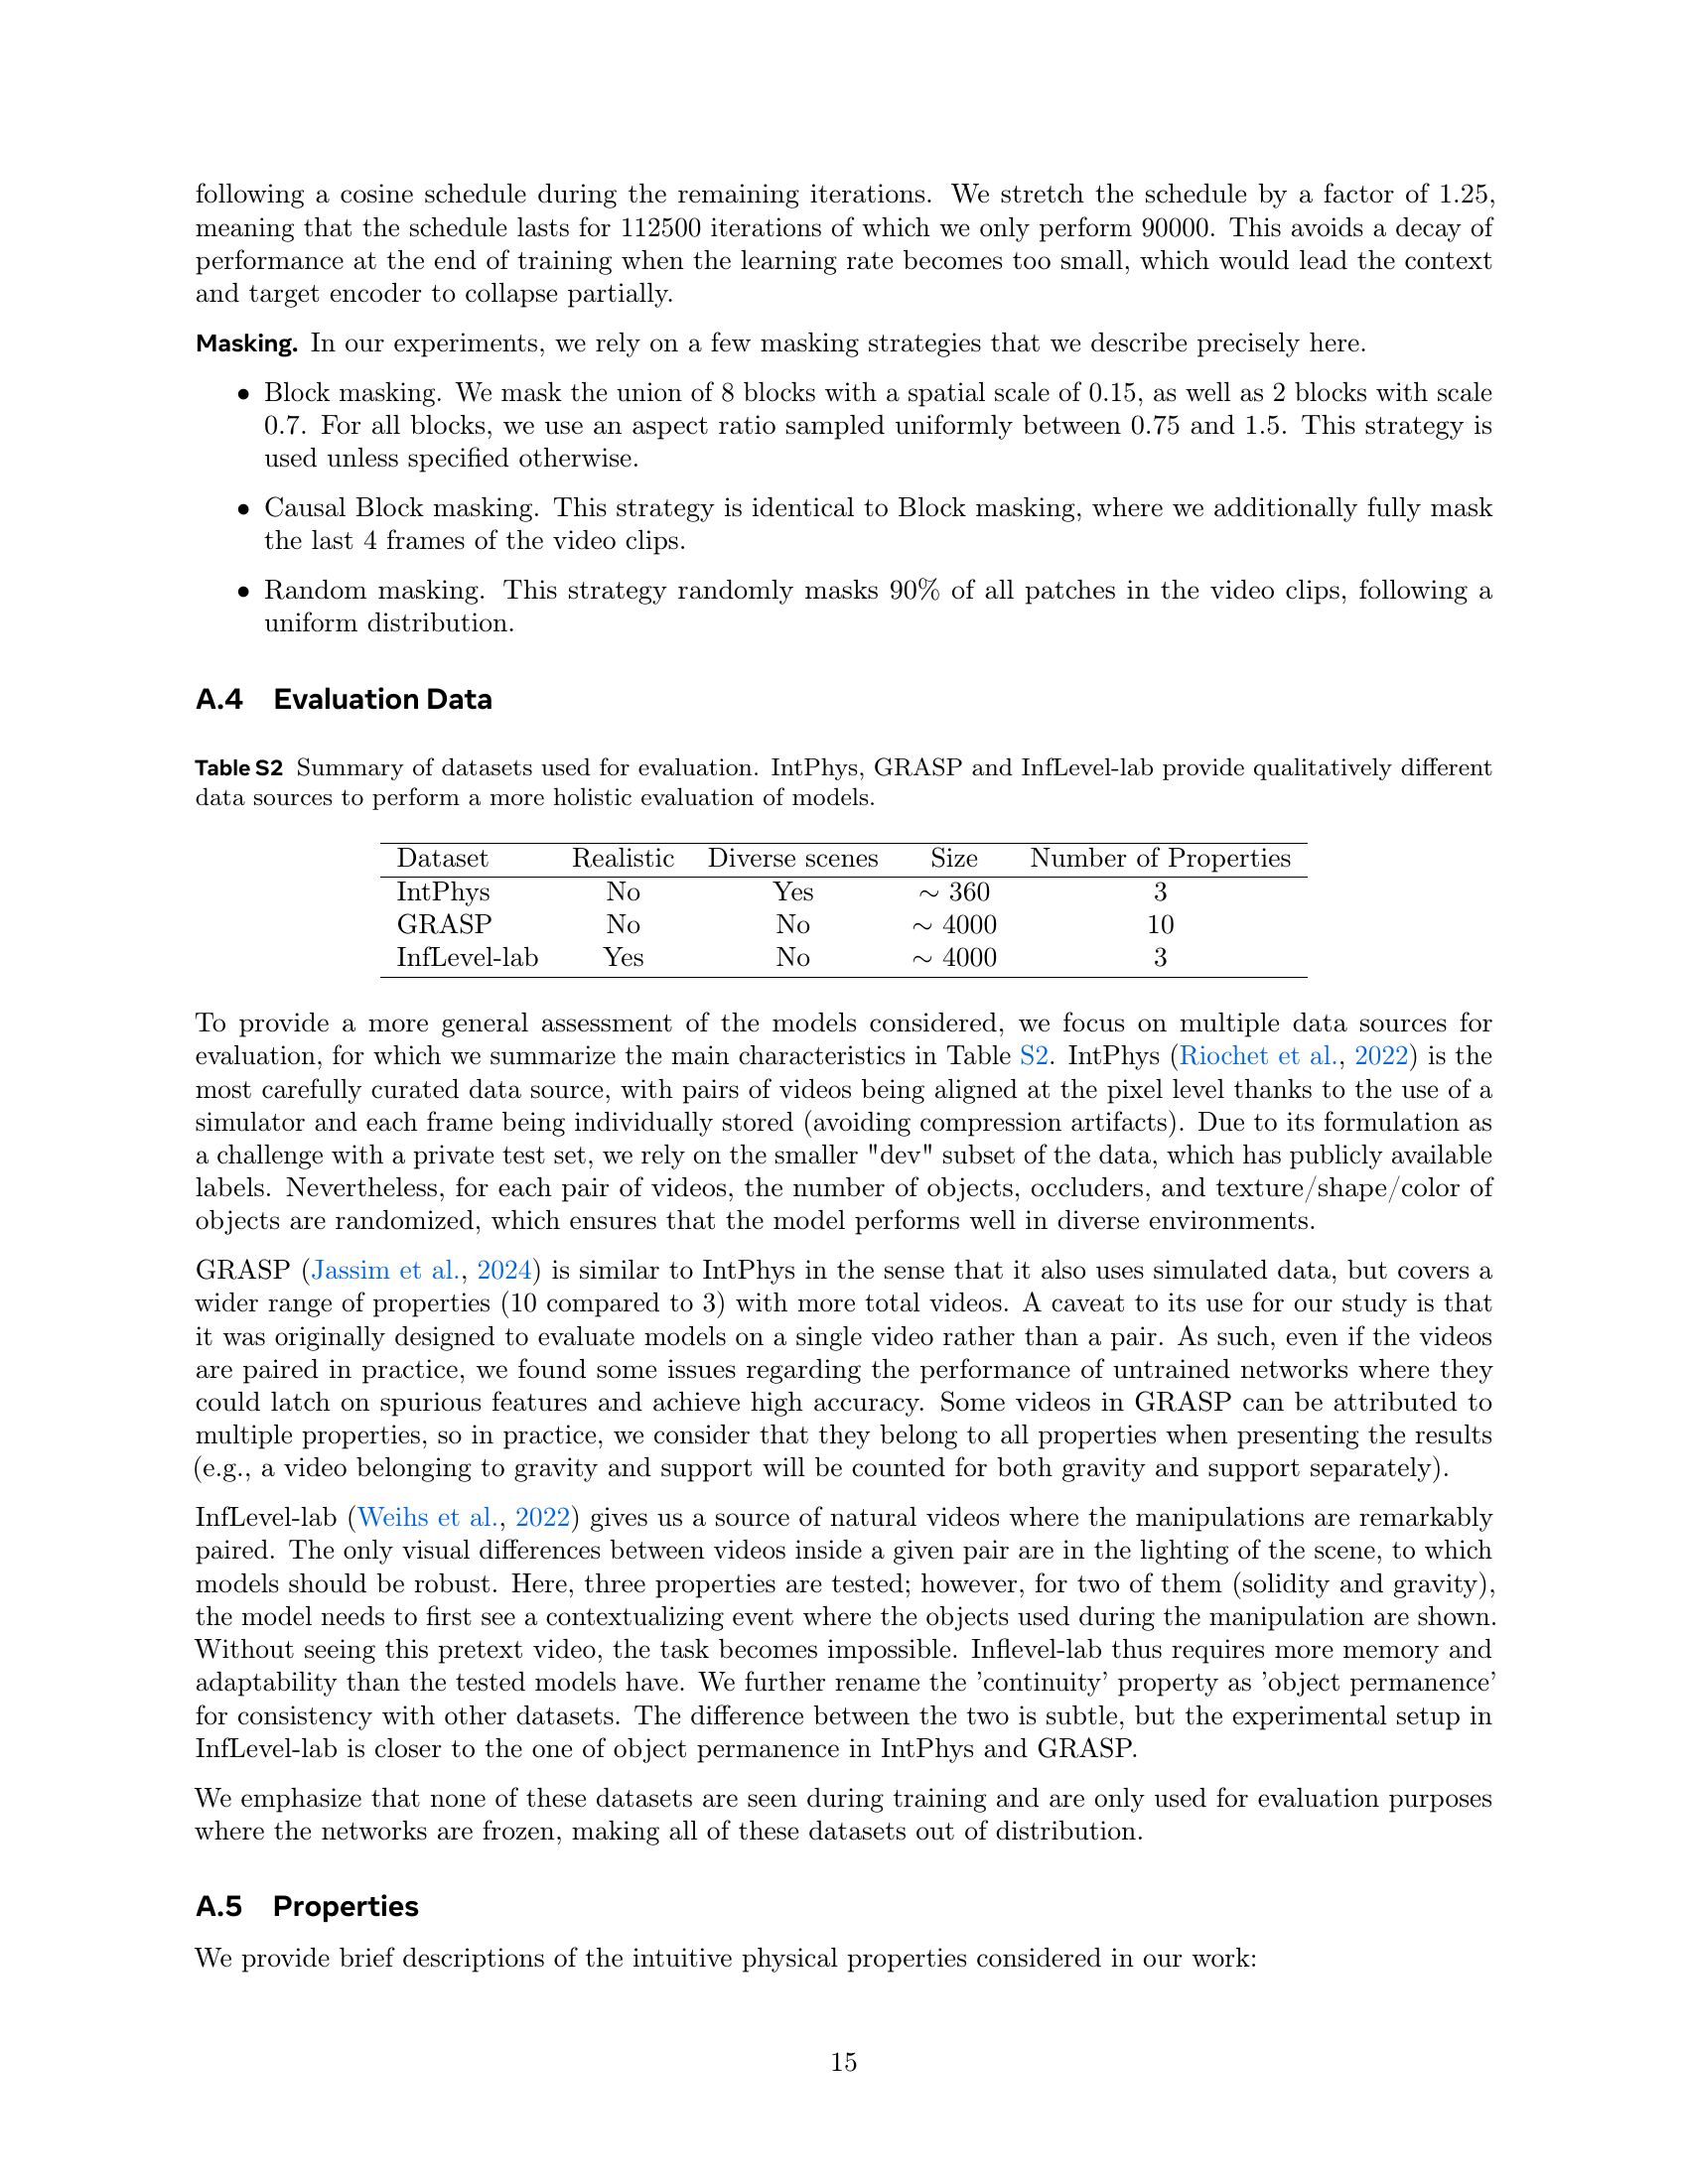
🔼 Table S2 provides a comparison of three datasets used to evaluate intuitive physics understanding in AI models: IntPhys, GRASP, and InfLevel-lab. Each dataset is characterized by its level of realism (synthetic or photorealistic), the diversity of scenes it includes, and the specific intuitive physics properties it tests. This table highlights the diversity of the evaluation by showing that different datasets assess varied aspects of physical intuition, thereby allowing for a comprehensive assessment of AI model capabilities.
read the caption
Table S2: Summary of datasets used for evaluation. IntPhys, GRASP and InfLevel-lab provide qualitatively different data sources to perform a more holistic evaluation of models.
| Dataset | Method | Frame skip | FPS | Window size | Window Stride |
|---|---|---|---|---|---|
| IntPhys | V-JEPA | 2 | 7.5 | 16 | 2 |
| VideoMAEv2 | 2 | 7.5 | 16 | 2 | |
| Qwen-2-VL-72b | 5 | 3 | All | N/A | |
| Gemini-1.5-pro | 2 | 7.5 | All | N/A | |
| GRASP | V-JEPA | 10 | 5 | 16 | 2 |
| VideoMAEv2 | 10 | 5 | 16 | 2 | |
| Qwen-2-VL-72b | 10 | 5 | All | N/A | |
| Gemini-1.5-pro | 10 | 5 | All | N/A | |
| InfLevel-lab | V-JEPA | 5 | 6 | 32 | 2 |
| VideoMAEv2 | 10 | 3 | 16 | 2 | |
| Qwen-2-VL-72b | 20 | 1.5 | All | N/A | |
| Gemini-1.5-pro | 30 | 1 | All | N/A |
🔼 This table details the specific hyperparameters used for each model (V-JEPA, VideoMAE, Qwen-2-VL-72B, and Gemini 1.5 pro) across three different datasets (IntPhys, GRASP, and InfLevel-lab). The hyperparameters listed include the frame skip rate, frames per second (FPS), window size (C+M), and window stride. These settings were chosen to optimize performance for each model and dataset in a zero-shot evaluation setting. Note that ‘All’ indicates no specific values were used for the window size and stride parameters for those models.
read the caption
Table S3: Evaluation hyperparameters.
| Method | Surprise | Object permanence | Shape constancy | Continuity | ||||||
|---|---|---|---|---|---|---|---|---|---|---|
| Visible | Occluded | All | Visible | Occluded | All | Visible | Occluded | All | ||
| V-JEPA-H | Max | 0.6% | 8.2% | 4.4% | 0.8% | 8.1% | 4.4% | 0.19% | 25.6% | 12.87% |
| V-JEPA-H | Avg | 0.0% | 0.56% | 0.28% | 0.0% | 0.0% | 0.0% | 0.0% | 0.19% | 0.09% |
| V-JEPA-L | Max | 5.2% | 35.4% | 0.20% | 8.8% | 35.0% | 21.9% | 5.9% | 41.5% | 23.8% |
| V-JEPA-L | Avg | 0.9% | 1.8% | 1.4% | 2.5% | 3.5% | 3.1% | 0.7% | 3.3% | 2.0% |
| Riochet et al. (2020) | 5.0% | 19.0% | 12.0% | 11.0% | 31.0% | 21.0% | 26.0% | 47.0% | 41.0% | |
| Human | 10.0% | 15.0% | 12.5% | 13.0% | 16.0% | 14.5% | 20.0% | 40.0% | 30.0% | |
🔼 Table S4 presents a comparison of pairwise error rates on the IntPhys test set, which evaluates intuitive physics understanding. The table contrasts the performance of several models (V-JEPA-H, V-JEPA-L, and a human baseline from Riochet et al., 2022) in classifying pairs of videos as either physically plausible or implausible. Two different methods for calculating surprise (maximum and average) are used for each model. The results demonstrate that both maximum and average surprise metrics yield high performance for V-JEPA models, surpassing human performance.
read the caption
Table S4: Pairwise error rates on IntPhys’ test set. For pairs of videos, taking either the maximum or average surprise from a video leads to high performance, surpassing the human results reported in (Riochet et al., 2022).
| Method | Surprise | Object permanence | Shape constancy | Continuity | ||||||
|---|---|---|---|---|---|---|---|---|---|---|
| Visible | Occluded | All | Visible | Occluded | All | Visible | Occluded | All | ||
| V-JEPA-H | Max | 8.0% | 28.1% | 19.2% | 11.9% | 29.7% | 21.9% | 7.8% | 43.9% | 29.67% |
| V-JEPA-H | Avg | 27.8% | 38.9% | 38.3% | 31.2% | 39.3% | 39.2% | 28.4% | 31.3% | 37.05% |
| V-JEPA-L | Max | 25.5% | 47.8% | 40.0% | 29.9% | 47.8% | 41.8% | 26.0% | 49.0% | 41.6% |
| V-JEPA-L | Avg | 33.4% | 41.7% | 41.5% | 37.0% | 42.5% | 42.7% | 34.4% | 38.8% | 41.5% |
| Human | 18.0% | 30.0% | 24.0% | 22.0% | 30.0% | 26.0% | 28.0% | 47.0% | 38.0% | |
🔼 Table S5 presents single-video classification error rates (1-AUROC) on the IntPhys test set, comparing the performance of different models based on both maximum and average surprise metrics. The results show that using the maximum surprise value yields the highest accuracy, surpassing human baseline performance reported in Riochet et al. (2022). Importantly, the table highlights that the average surprise metric is less effective, likely because its value is highly dependent on specific experimental factors, making it less reliable for evaluating model performance across different conditions. The error rates are presented as percentages for clarity.
read the caption
Table S5: Single video classification error rates (1-AUROC) on IntPhys’ test set. For single videos, we see that the maximum surprise of video leads to the highest performance, surpassing the human baselines reported in (Riochet et al., 2022). Here, the average surprise of a video is not a good metric, possibly due to values being too dependent on the experimental setup. We report the metric as percentages for legibility.
Full paper#