TL;DR#
Current vision-language models struggle to leverage the wealth of information available in unpaired multimodal data, especially interleaved image-text documents. These documents present a challenge because images and text aren’t explicitly linked. This limits the effectiveness of existing training methods.
The researchers tackle this problem by creating RealSyn, a new dataset. They developed methods to effectively link images and texts within these complex documents and even generate synthetic text to enhance the data. Their experiments show that models trained on RealSyn achieve excellent performance on various tasks and scale efficiently. This highlights RealSyn’s potential as a valuable resource for advancing research in vision-language representation learning.
Key Takeaways#
Why does it matter?#
This paper is crucial for researchers in computer vision and natural language processing due to its introduction of RealSyn, a novel large-scale multimodal dataset. RealSyn addresses the underutilization of unpaired, interleaved image-text documents, a significant limitation in current vision-language representation learning. The dataset’s innovative construction methods, combining realistic and synthetic data, open exciting avenues for future work, particularly in improving scalability and handling long-tail concepts. The readily available dataset and pre-trained model weights significantly boost the accessibility and reproducibility of future research.
Visual Insights#
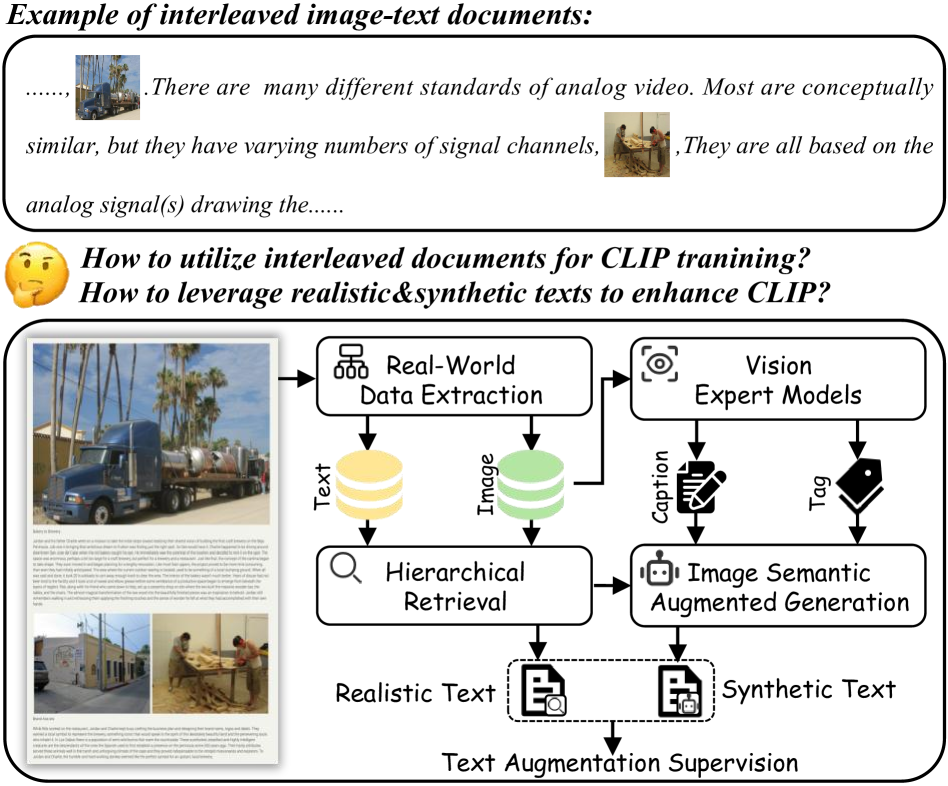
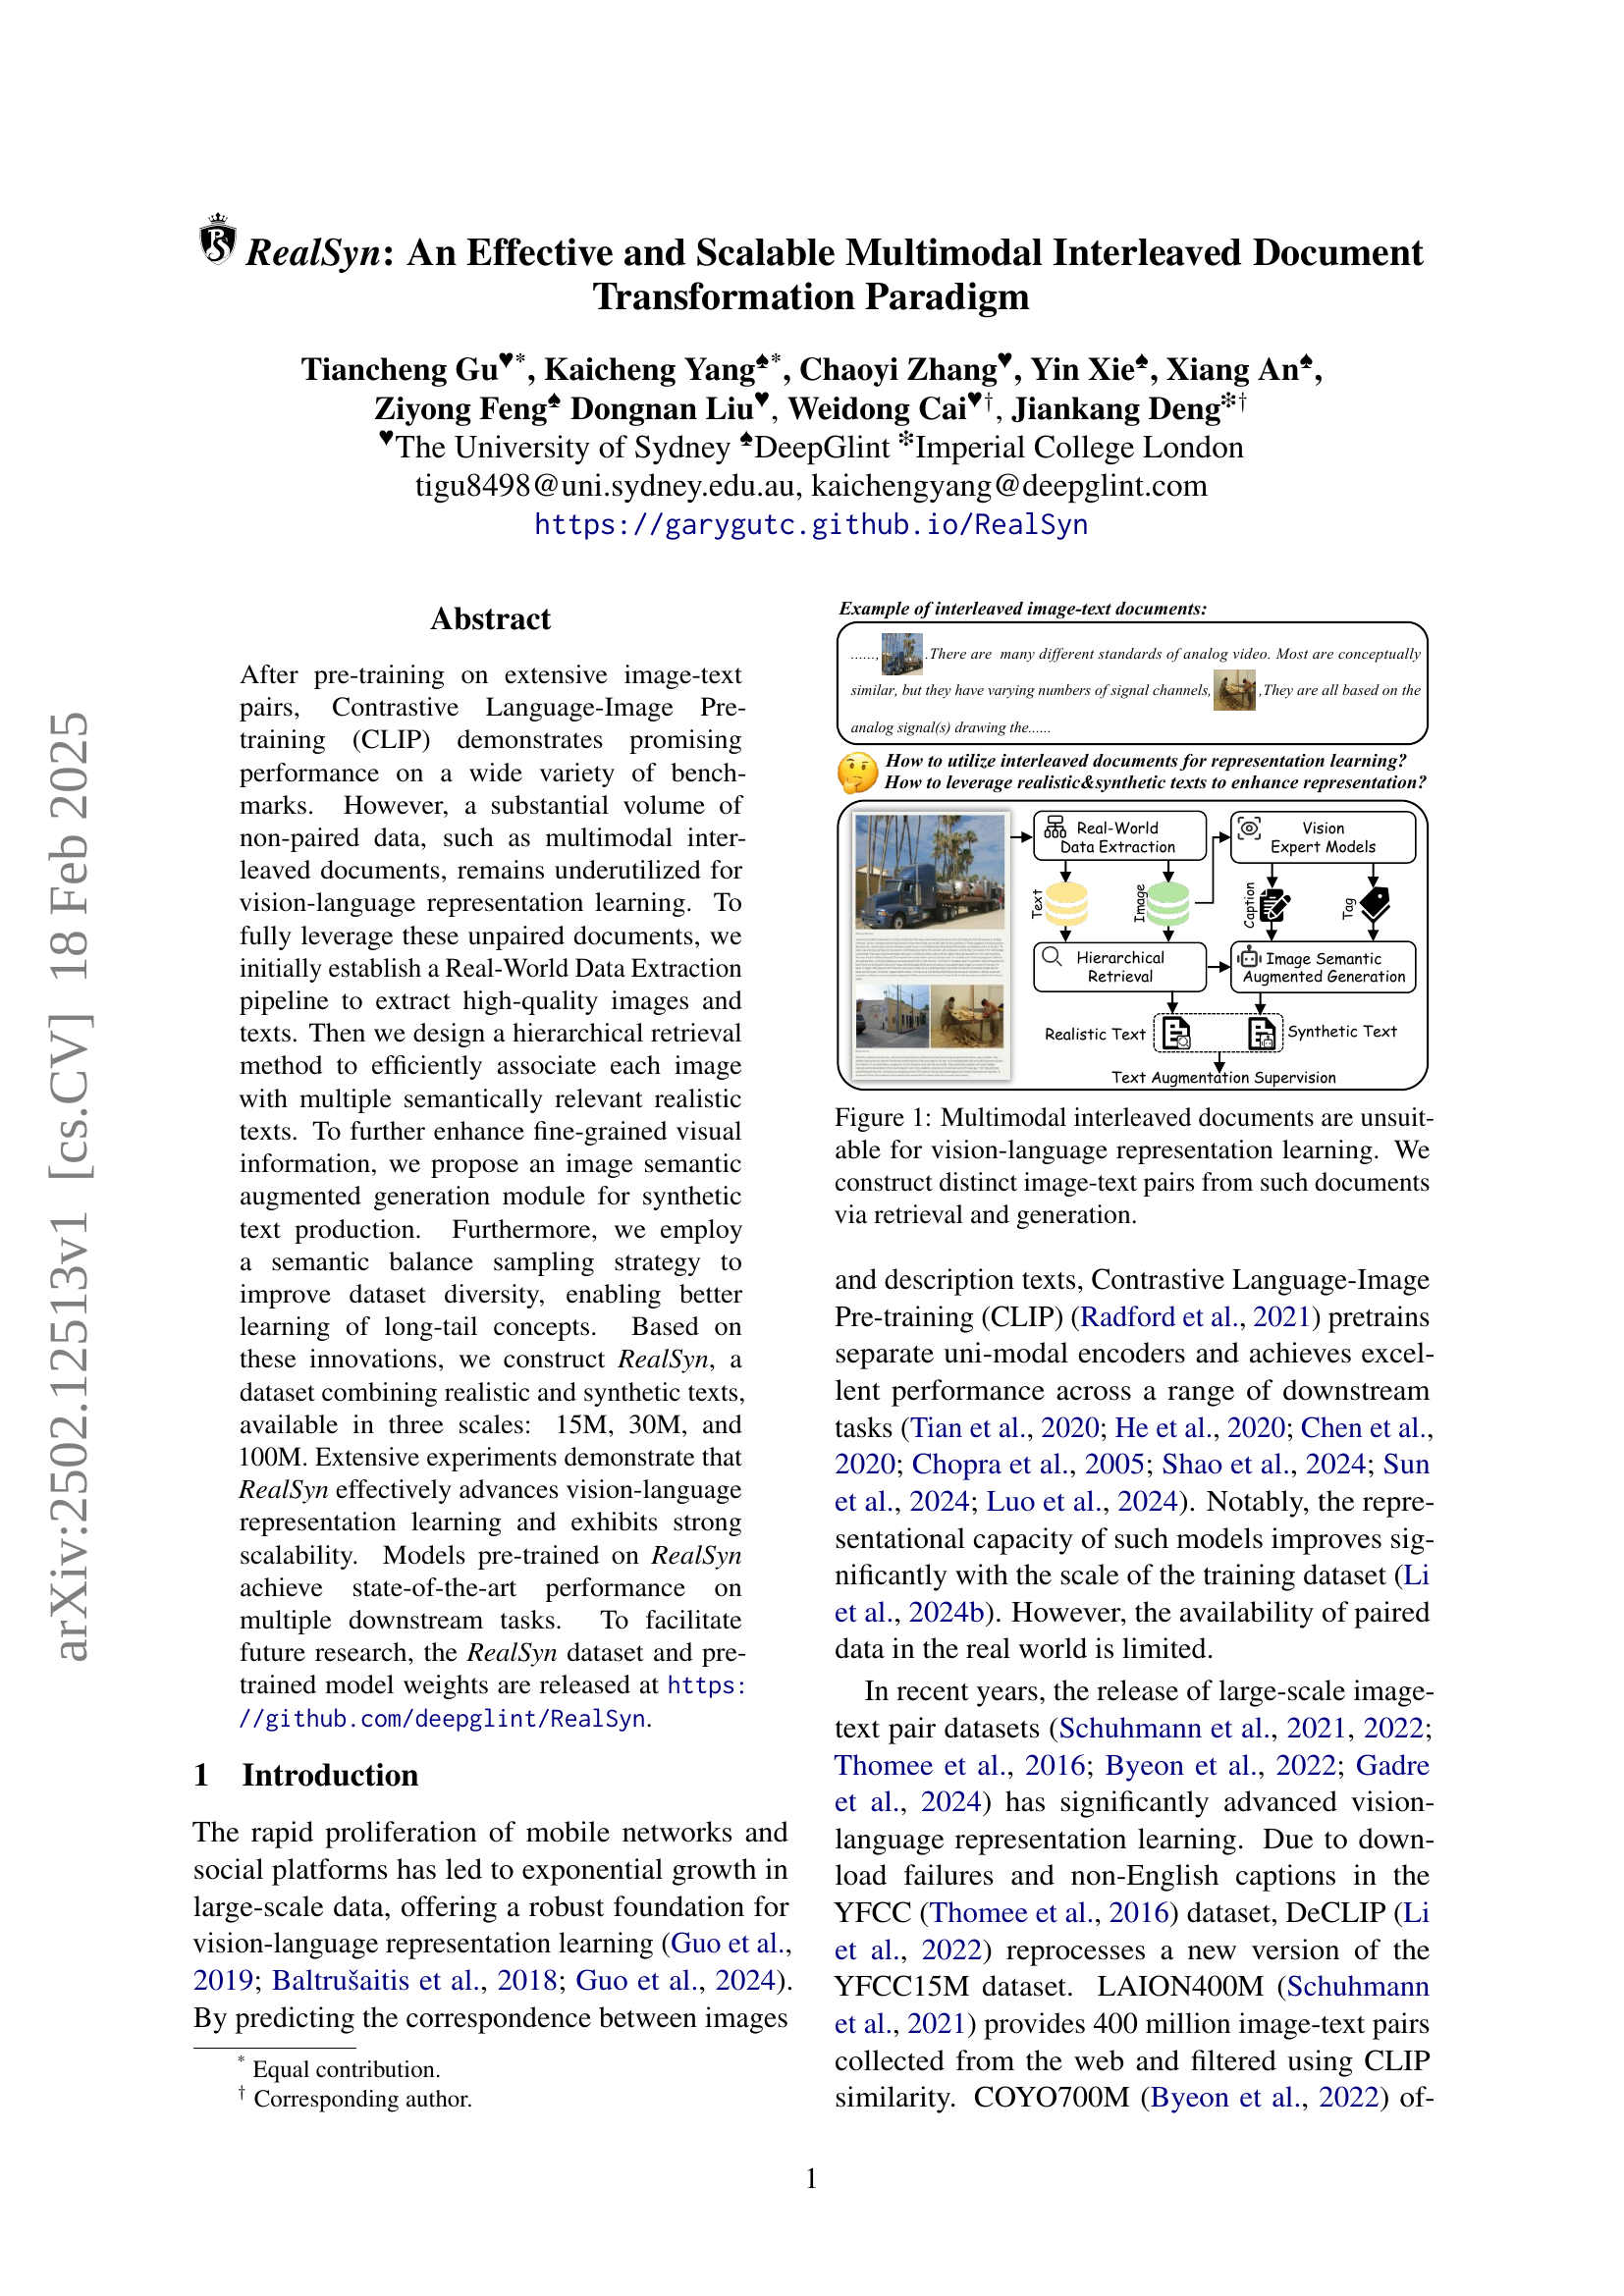
🔼 This figure illustrates the challenge of using multimodal interleaved documents for vision-language representation learning. These documents contain images and text intermixed without explicit pairings, making it difficult to directly use them for training models that learn relationships between images and text. The figure shows a proposed solution involving a pipeline. First, a data extraction step is performed to isolate image and text content. A hierarchical retrieval method then links each image with semantically relevant text segments. Finally, to improve the quality and amount of training data, an image semantic augmented generation module produces synthetic texts, ensuring that each image has multiple associated texts. This process generates distinct image-text pairs suitable for training vision-language models.
read the caption
Figure 1: Multimodal interleaved documents are unsuitable for vision-language representation learning. We construct distinct image-text pairs from such documents via retrieval and generation.
| Data Scale | Dataset | Food101 | CIFAR10 | CIFAR100 | Birdsnap | SUN397 | Cars | Aircraft | DTD | Pets | Caltech | Flowers | STL10 | EuroSAT | RESISC45 | KITTI | Country | UCF101 | Memes | SST2 | ImageNet | Average |
| 15M | YFCC | 67.2 | 90.4 | 70.8 | 47.7 | 66.7 | 23.8 | 29.7 | 62.4 | 65.7 | 80.1 | 90.0 | 94.7 | 94.9 | 79.4 | 75.4 | 18.4 | 70.8 | 48.6 | 56.2 | 56.7 | 64.5 |
| LAION | 71.0 | 93.3 | 78.1 | 41.0 | 66.3 | 76.9 | 43.0 | 71.2 | 74.5 | 87.6 | 88.2 | 93.6 | 95.3 | 82.9 | 72.2 | 13.5 | 75.4 | 55.7 | 57.3 | 59.3 | 69.8 | |
| RealSyn | 77.1 | 94.5 | 78.7 | 43.4 | 71.4 | 64.7 | 42.7 | 71.3 | 79.9 | 90.0 | 88.2 | 96.4 | 96.2 | 87.2 | 72.4 | 16.7 | 79.9 | 55.7 | 57.7 | 64.0 | 71.4 | |
| 30M | LAION | 76.1 | 94.5 | 80.0 | 47.4 | 70.3 | 82.3 | 45.9 | 74.7 | 80.3 | 89.8 | 89.5 | 95.6 | 95.5 | 84.5 | 72.6 | 15.2 | 76.6 | 56.2 | 60.0 | 64.3 | 72.6 |
| RealSyn | 81.2 | 95.4 | 81.8 | 48.4 | 74.5 | 73.4 | 45.2 | 74.2 | 84.1 | 91.3 | 90.6 | 97.2 | 96.5 | 89.2 | 74.5 | 19.0 | 82.6 | 55.0 | 56.2 | 68.5 | 73.9 | |
| 100M | LAION | 80.2 | 95.7 | 82.5 | 51.3 | 73.4 | 85.3 | 46.1 | 75.6 | 83.2 | 91.1 | 92.0 | 96.9 | 95.2 | 85.9 | 68.4 | 17.4 | 80.0 | 57.3 | 61.4 | 68.3 | 74.4 |
| RealSyn | 84.2 | 96.3 | 83.5 | 54.0 | 76.2 | 77.4 | 47.6 | 75.6 | 86.3 | 92.1 | 91.7 | 97.7 | 96.8 | 90.6 | 73.1 | 21.1 | 83.7 | 57.3 | 58.9 | 71.6 | 75.8 | |
🔼 This table presents the results of a linear probe evaluation on 20 downstream datasets. The experiment involved pre-training a Vision Transformer (ViT-B/32) model on the RealSyn dataset and then evaluating its performance on these diverse benchmark datasets. The performance is measured in terms of accuracy. The table shows that pre-training on RealSyn leads to an average improvement in performance, ranging from 1.3% to 6.9%, demonstrating the effectiveness of RealSyn for vision-language representation learning.
read the caption
Table 1: Linear probe on 20 downstream datasets. Pre-training ViT-B/32 on RealSyn achieves 1.3%-6.9% average performance improvement.
In-depth insights#
Multimodal Doc Use#
Utilizing multimodal documents presents a unique challenge and opportunity in vision-language research. The inherent interleaving of images and text necessitates innovative approaches beyond simple paired data strategies. A key consideration is the development of robust methods for associating images with relevant textual segments, perhaps employing hierarchical retrieval techniques that account for semantic context within the documents. Furthermore, addressing noisy or incomplete data is crucial, as real-world documents often contain inconsistencies. This might involve data cleaning, filtering, or advanced techniques like semantic filtering to ensure high-quality image-text pairings for pre-training. The potential reward, however, is significant: leveraging this rich, often underutilized resource could unlock substantial improvements in vision-language model performance, particularly for tasks involving complex, real-world scenarios. The successful utilization of multimodal documents will depend greatly on overcoming these technical hurdles and effectively harnessing the diverse information inherent in these rich data sources.
Hierarchical Retrieval#
Hierarchical retrieval, in the context of multimodal document processing, is a crucial technique for efficiently associating images with relevant text from a massive corpus. The core idea is to avoid the computationally expensive task of comparing each image to every text in a large dataset. Instead, a hierarchical structure is introduced, likely involving clustering of the text data based on semantic similarity. This allows for a two-stage retrieval process. First, the system identifies the most relevant cluster of texts based on image features. Then, a finer search is performed within that selected cluster, considerably reducing the search space and improving efficiency. This approach is especially important when dealing with large-scale datasets like the RealSyn dataset which contains a massive number of interleaved image-text documents. The hierarchical method allows for significant computational savings which makes the entire system scalable and makes it feasible to work with datasets of this size. The specific implementation details, such as the clustering algorithm and similarity metric used, would determine the effectiveness of this retrieval strategy. The success depends critically on the quality of the initial clustering to ensure that semantically relevant texts are grouped together efficiently.
Synthetic Text Gen#
The concept of ‘Synthetic Text Gen’ within a multimodal learning research paper is crucial for augmenting datasets. Generating synthetic text offers a way to address the scarcity of real-world paired image-text data, especially for niche or rare concepts. By creating artificial text descriptions for existing images, researchers can significantly expand the scale and diversity of their training data. This is particularly important for vision-language models, which often benefit from massive amounts of data to perform well. However, care must be taken to ensure that the generated synthetic text is high-quality and semantically consistent with the corresponding image. Poorly generated text can lead to inaccurate model learning and hinder downstream performance. Therefore, strategies like fine-tuning large language models (LLMs) or using advanced generative models are often employed to enhance realism and semantic accuracy. The methods used for synthetic text generation are critical to the overall success of the research, as poorly generated text can negatively impact model accuracy. Careful evaluation of the synthetic data, possibly including human evaluation, is essential to determine its quality and usefulness before incorporating it into the training pipeline.
RealSyn Dataset#
The RealSyn dataset represents a significant advancement in multimodal learning by addressing the limitations of existing vision-language datasets. Its novelty lies in its methodology for leveraging unpaired, interleaved image-text documents, a previously underutilized resource. The creation of RealSyn involved a multi-step process including real-world data extraction, hierarchical retrieval to match images with relevant texts, and image semantic augmented generation to produce synthetic texts that balance the dataset. The dataset’s hierarchical retrieval method addresses the computational challenge of associating images with texts from large corpora, thus enhancing its scalability. The inclusion of both realistic and synthetic texts makes RealSyn a robust and versatile resource, particularly well-suited for pre-training vision-language models. The availability of RealSyn in three scales (15M, 30M, and 100M) further underscores its practical value for research, promising improved downstream task performance and facilitating future advancements in multimodal understanding.
Future Work#
Future research directions stemming from this work could explore several promising avenues. Extending RealSyn to encompass a broader range of document types and languages is crucial for enhanced generalizability. Investigating more sophisticated methods for synthetic data generation, potentially incorporating generative models conditioned on both image and text features, could improve the quality and diversity of the training data. A deeper dive into optimal sampling strategies beyond semantic balance sampling is warranted, aiming for more efficient and effective data utilization. Finally, a thorough investigation into the impact of different model architectures and pre-training strategies on RealSyn would reveal further valuable insights into vision-language representation learning and the strengths and limitations of this novel dataset.
More visual insights#
More on figures

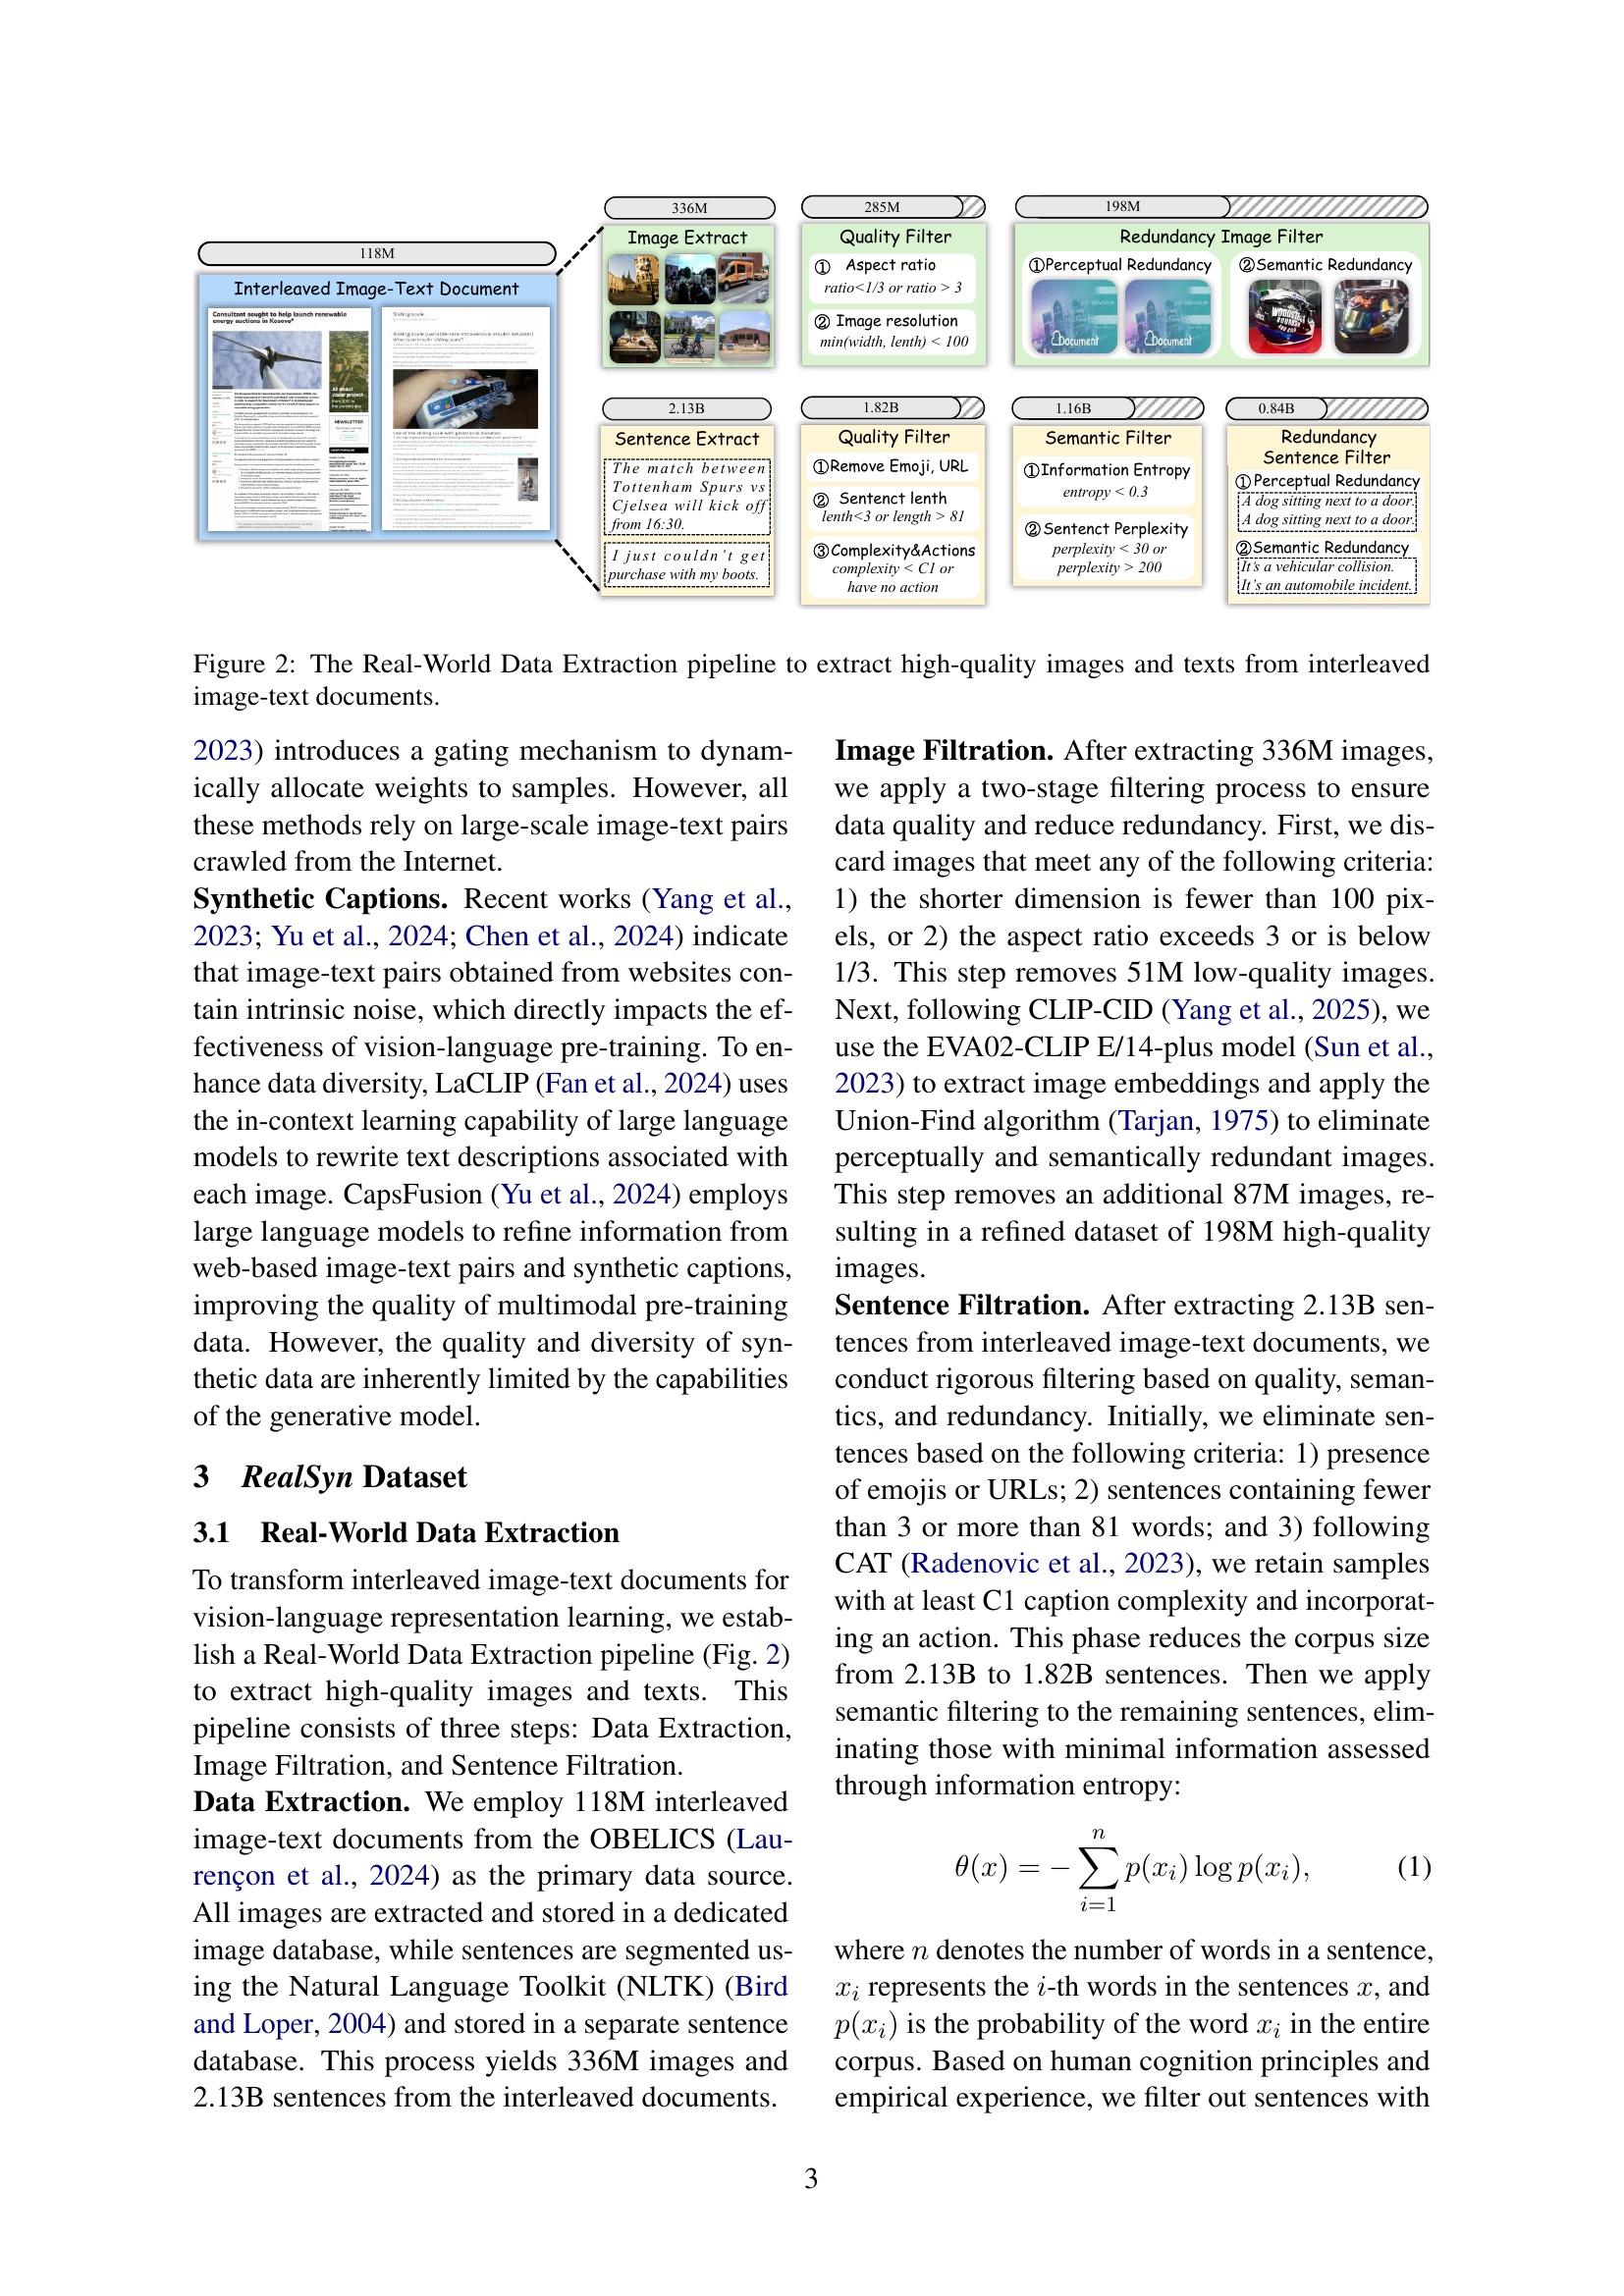
🔼 This figure illustrates the Real-World Data Extraction pipeline, a multi-stage process designed to extract high-quality images and text from a large corpus of interleaved image-text documents. The pipeline begins with the extraction of images and text segments from the original documents. Then, it proceeds through several filtering steps to remove low-quality, redundant, and semantically irrelevant data. Image filtering includes steps based on aspect ratio, resolution, and perceptual/semantic redundancy. Sentence filtering similarly includes criteria related to length, complexity, the presence of URLs or emojis, and information entropy to ensure high-quality, meaningful text. The result of this pipeline is a refined dataset comprising high-quality images and text ready for further use in training vision-language models.
read the caption
Figure 2: The Real-World Data Extraction pipeline to extract high-quality images and texts from interleaved image-text documents.

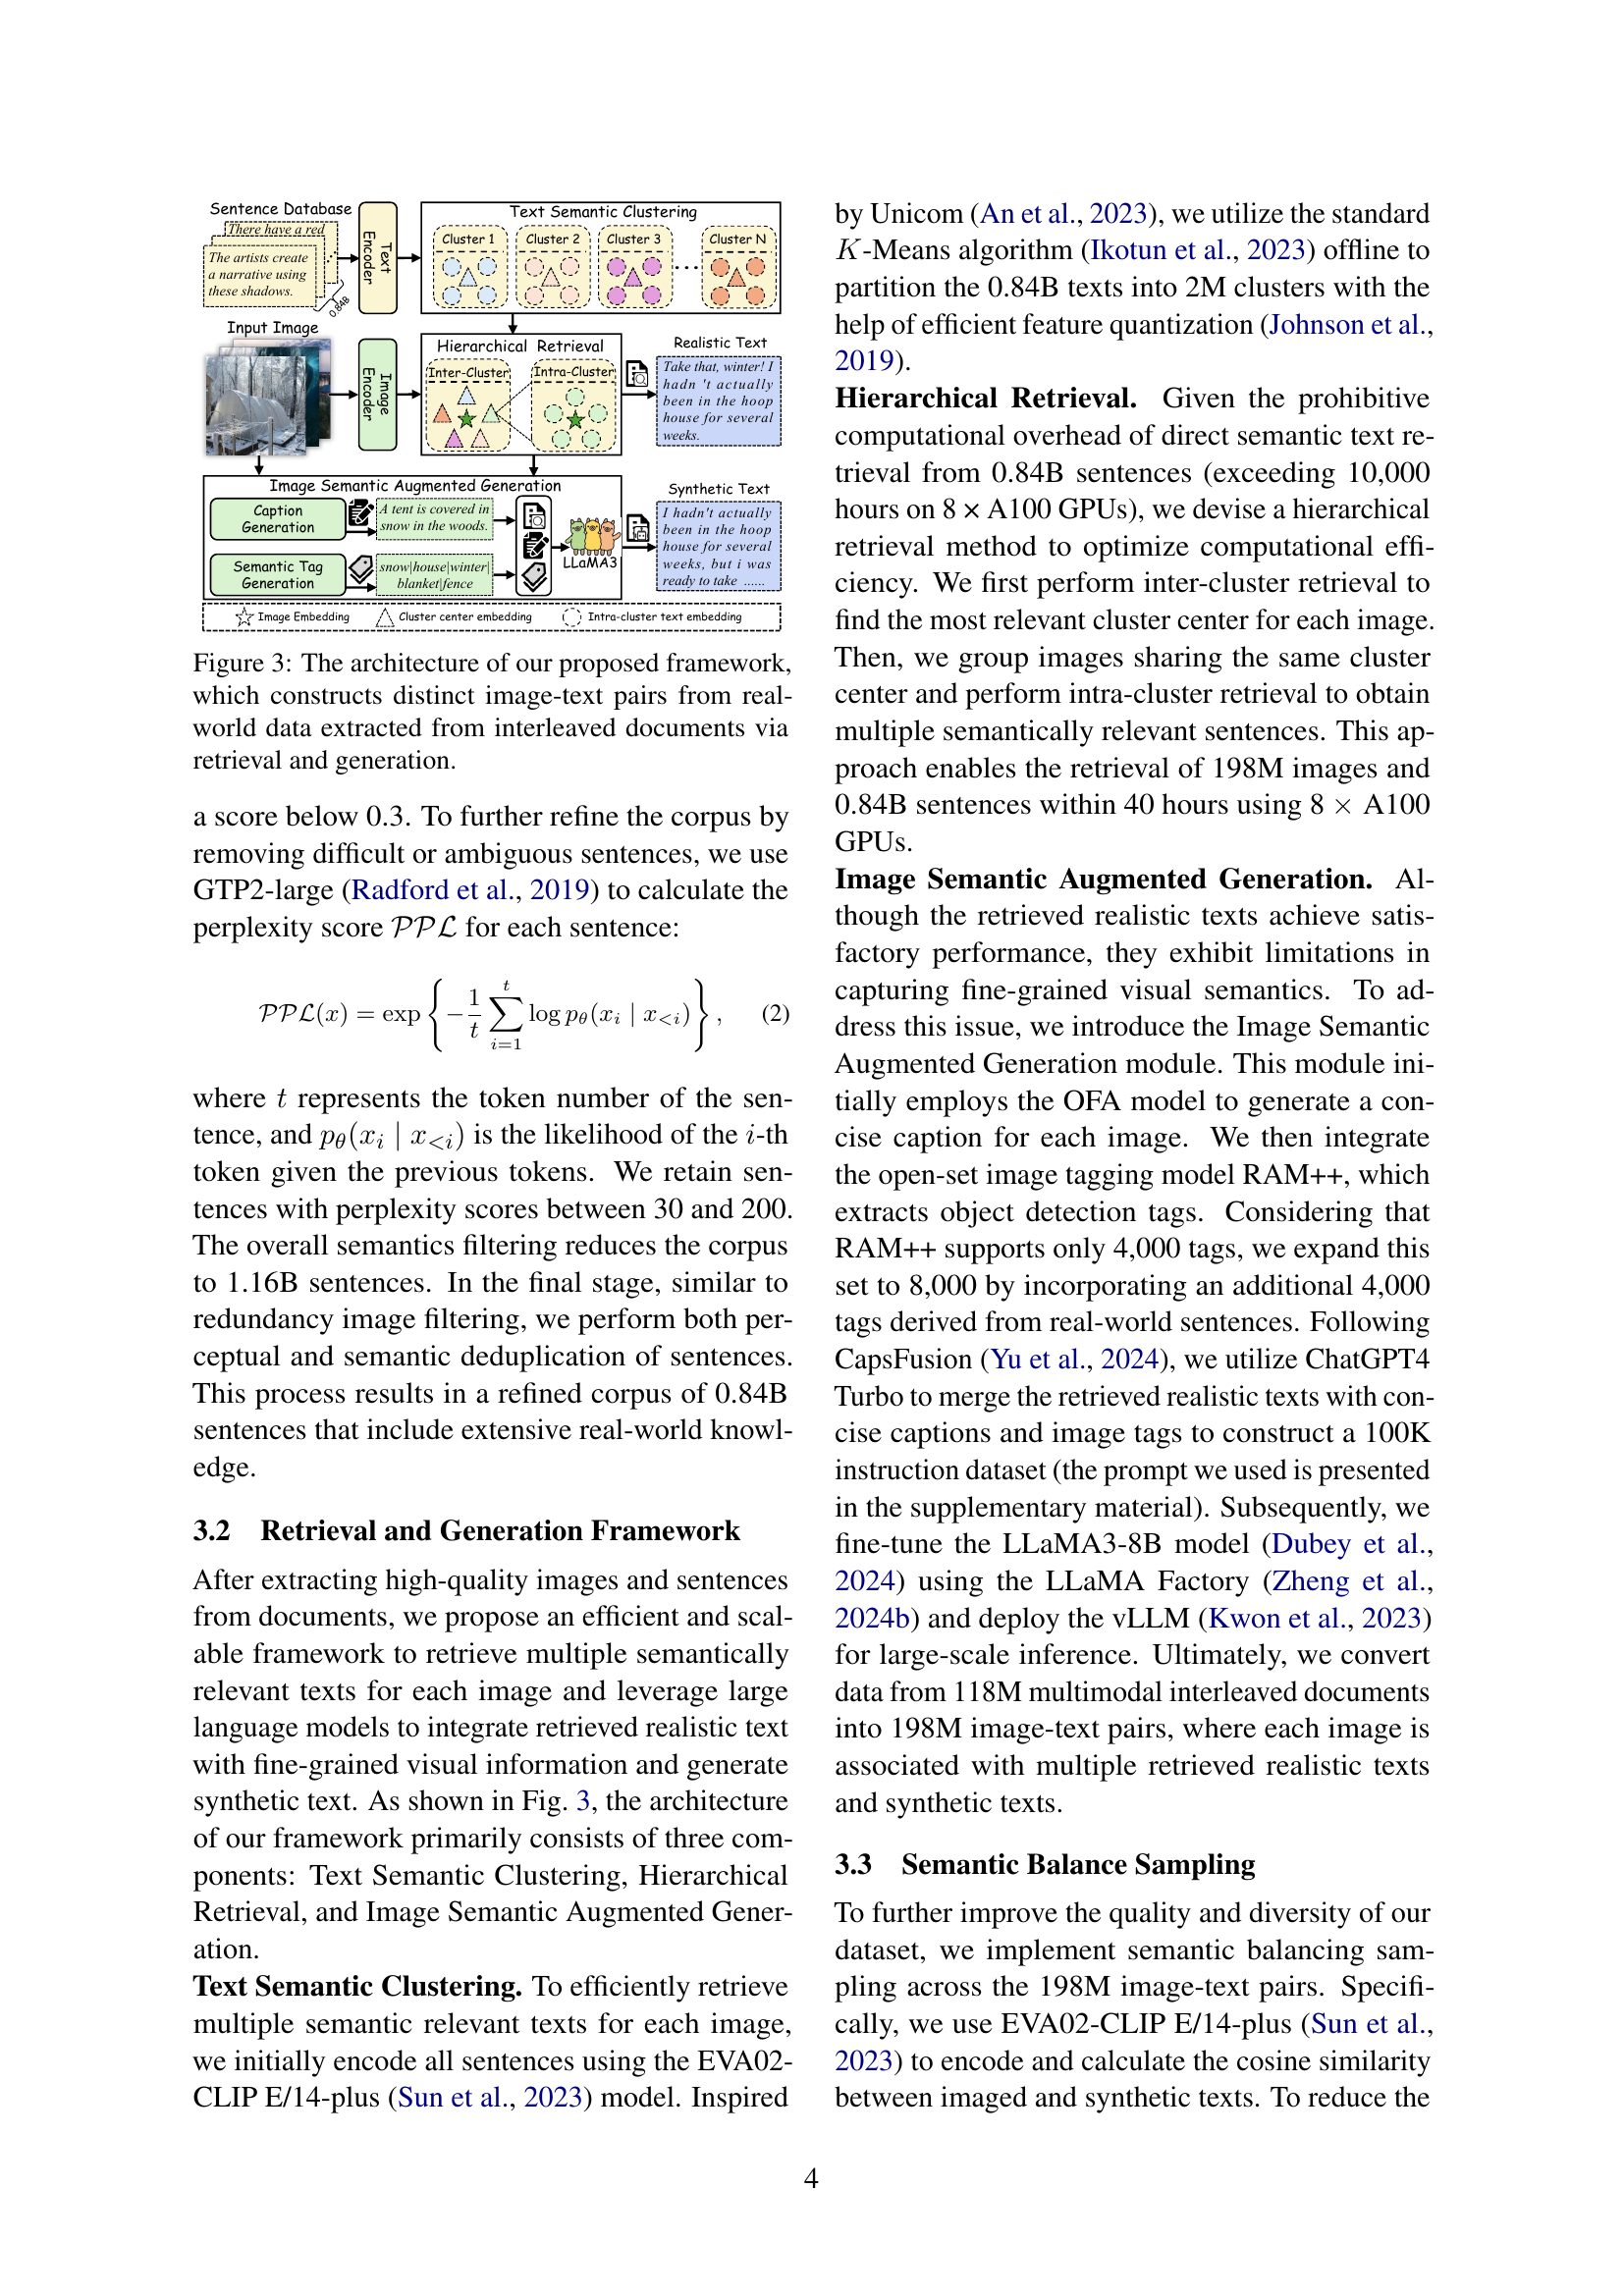
🔼 This figure illustrates the framework used to generate image-text pairs from real-world, interleaved documents. The process begins with extracting images and texts from the documents, followed by text semantic clustering to group similar texts. A hierarchical retrieval method then efficiently associates images with semantically relevant texts from various clusters. Finally, an image semantic augmented generation module produces synthetic text captions, enhancing image understanding. This entire framework produces high-quality image-text pairs suitable for vision-language model training.
read the caption
Figure 3: The architecture of our proposed framework, which constructs distinct image-text pairs from real-world data extracted from interleaved documents via retrieval and generation.

🔼 This figure visualizes the distribution of topics within the RealSyn dataset using t-SNE dimensionality reduction on LDA topic modeling results. A random subset of 1 million samples from the RealSyn dataset was used for this analysis. The visualization helps understand the diversity of topics covered in the dataset. Each point represents a sample, and the clusters show groupings of semantically similar samples.
read the caption
Figure 4: A T-SNE Van der Maaten and Hinton (2008) projection of LDA Blei et al. (2003) topic cluster from a randomly selected 1M samples from RealSyn.

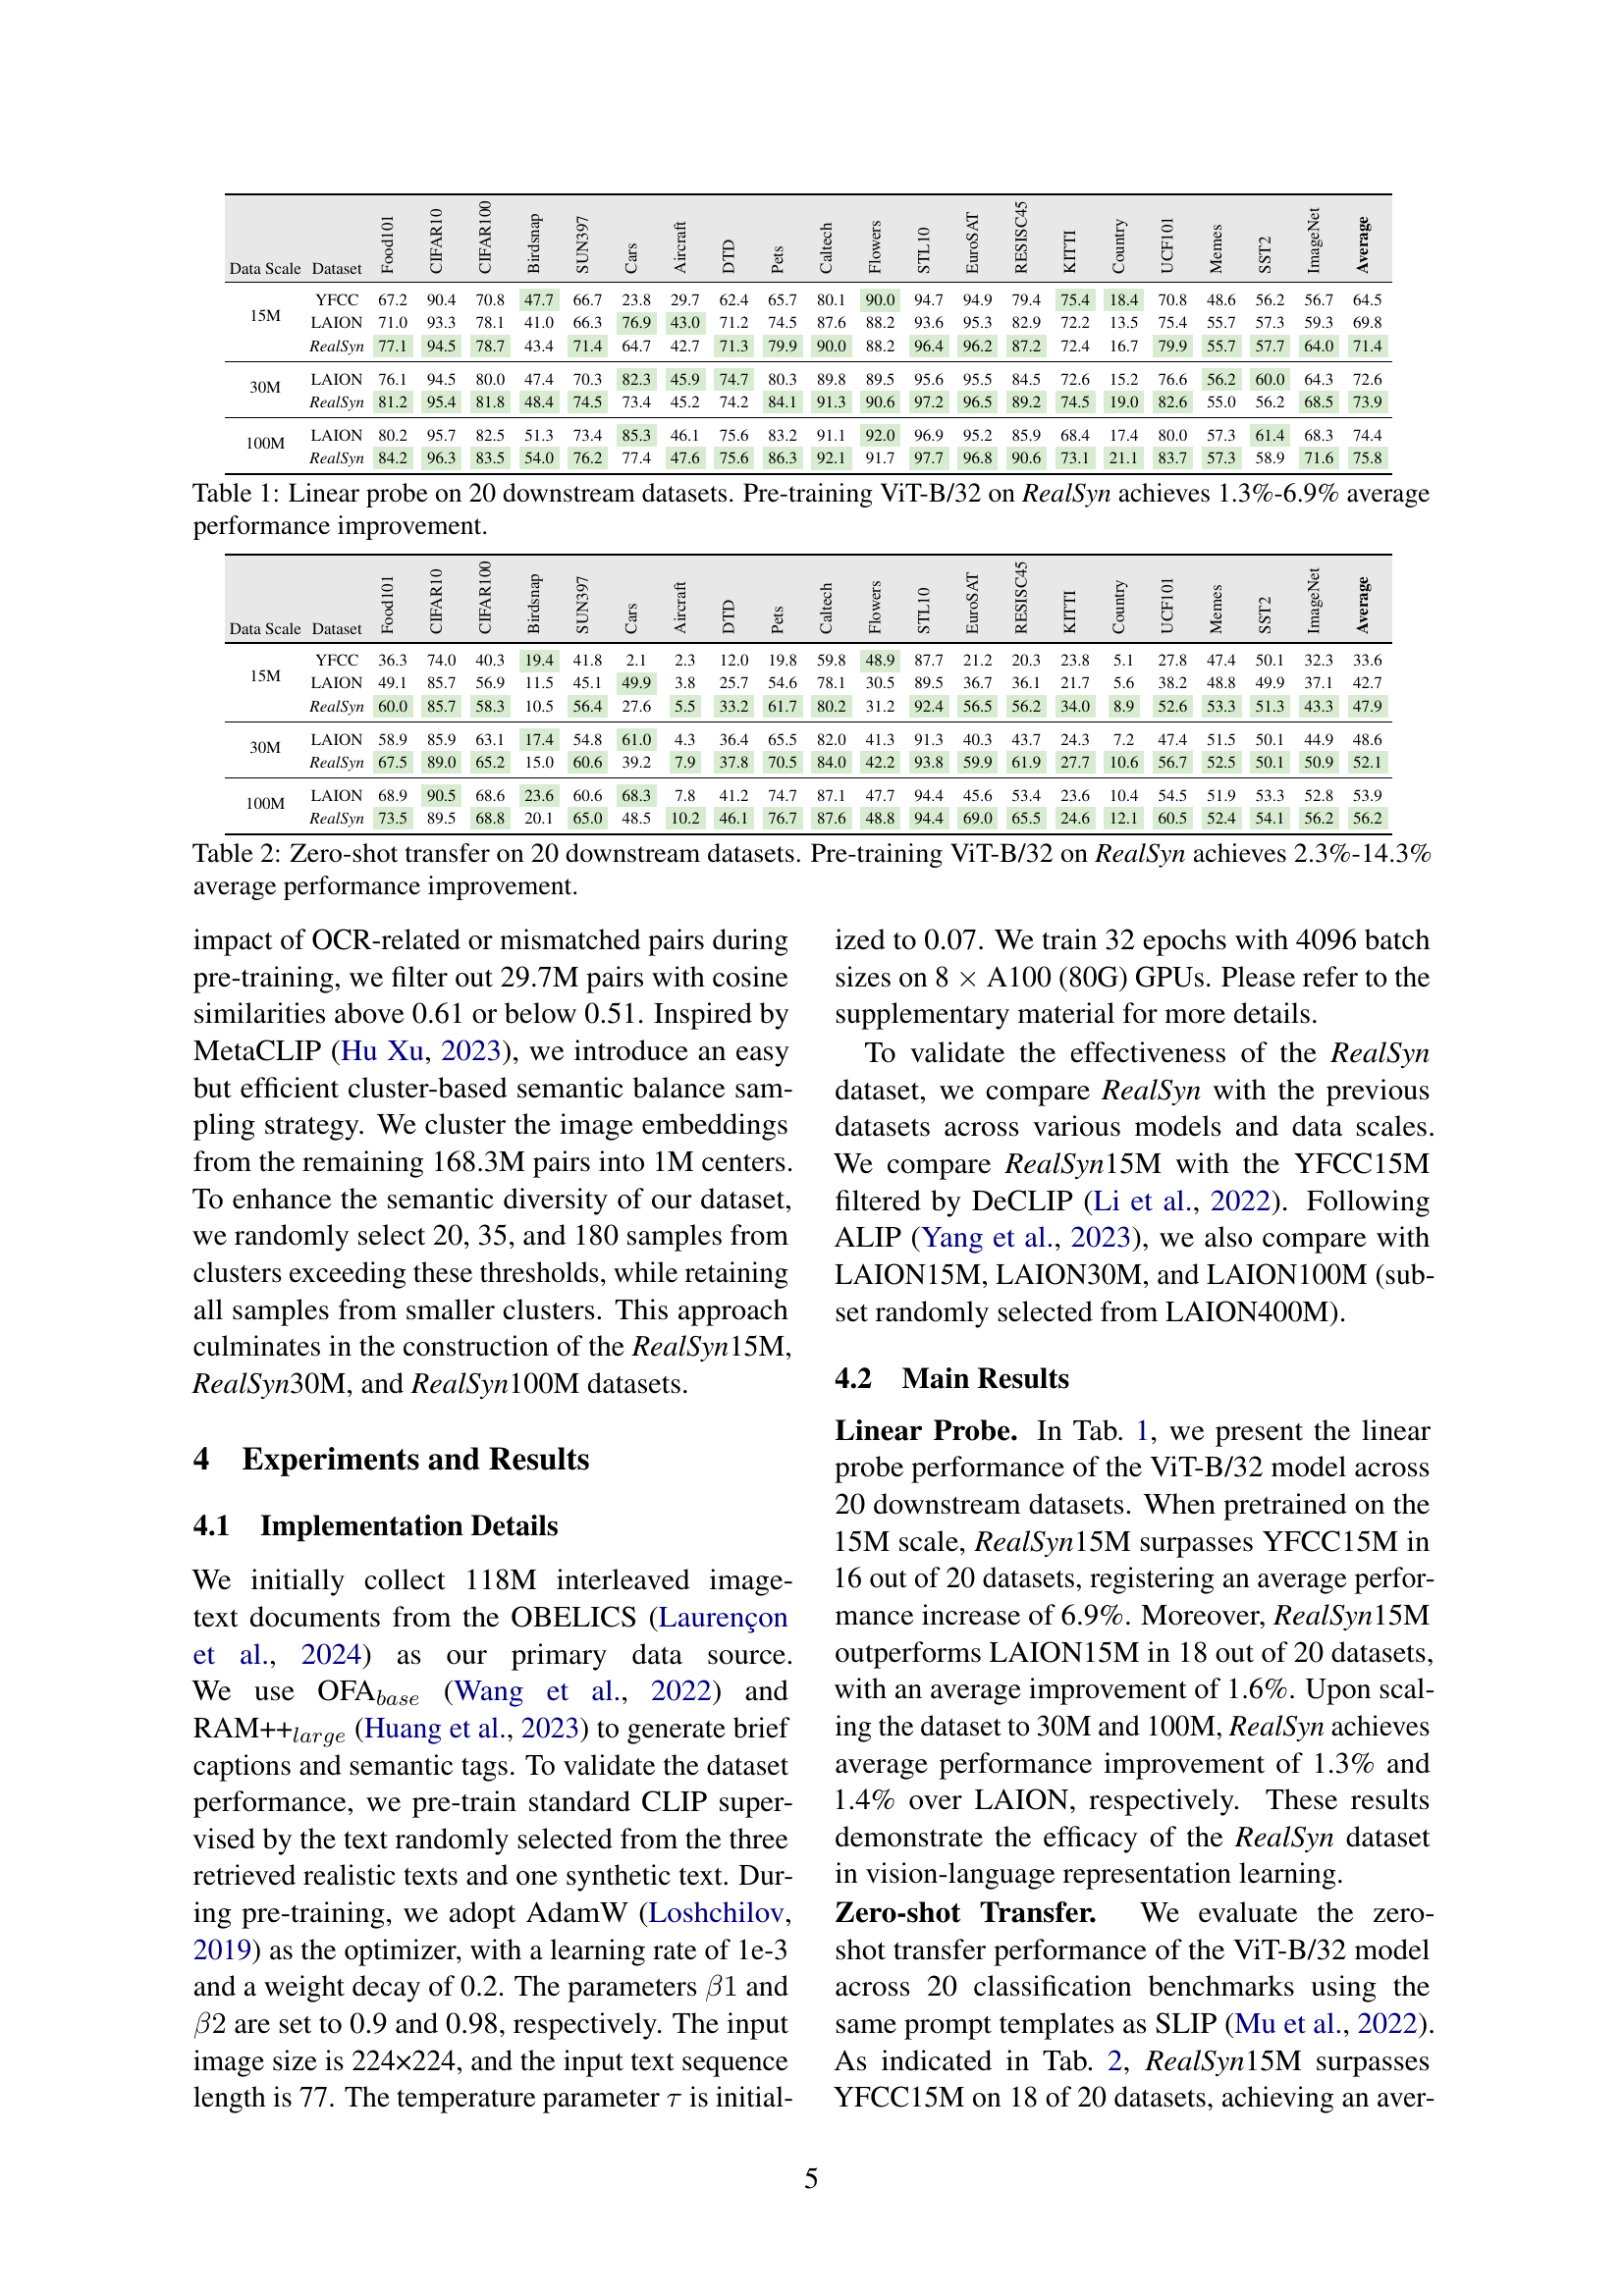
🔼 This figure compares the richness of various datasets in terms of image-text similarity and token distribution. It shows that the RealSyn dataset, especially when including both realistic and synthetic texts, has a richer textual context and more diverse vocabulary than datasets solely based on realistic web data, thereby enriching its potential for vision-language representation learning.
read the caption
(a) Richness assessment comparison

🔼 This figure compares the diversity of different datasets by showing the number of unique entities present in their captions. A higher number of unique entities indicates greater diversity in the data. The figure visually demonstrates that the RealSyn dataset has substantially more diverse captions compared to the LAION and YFCC datasets, as represented by the significantly higher count of unique tokens present in its captions. This diversity is beneficial for training robust and generalizable vision-language models.
read the caption
(b) Diversity assessment comparison

🔼 Figure 5 presents a comparison of the richness and diversity of four datasets: YFCC15M, LAION, RealSyn-R1 (using only the most relevant realistic text retrieved for each image), and RealSyn-S1 (incorporating both the most relevant realistic text and its semantically augmented synthetic counterpart). The richness is assessed by calculating the cosine similarity between image and text embeddings, and the distribution of token counts in the text captions. The diversity is analyzed using the number of unique entities mentioned in the captions. The figure shows that RealSyn, especially when using both realistic and synthetic texts, exhibits higher richness and diversity compared to the other datasets.
read the caption
Figure 5: The richness assessment and diversity assessment on different datasets. RealSyn-R1: the most relevant retrieved realistic text. RealSyn-S1: the semantic augmented synthetic text based on RealSyn-R1.

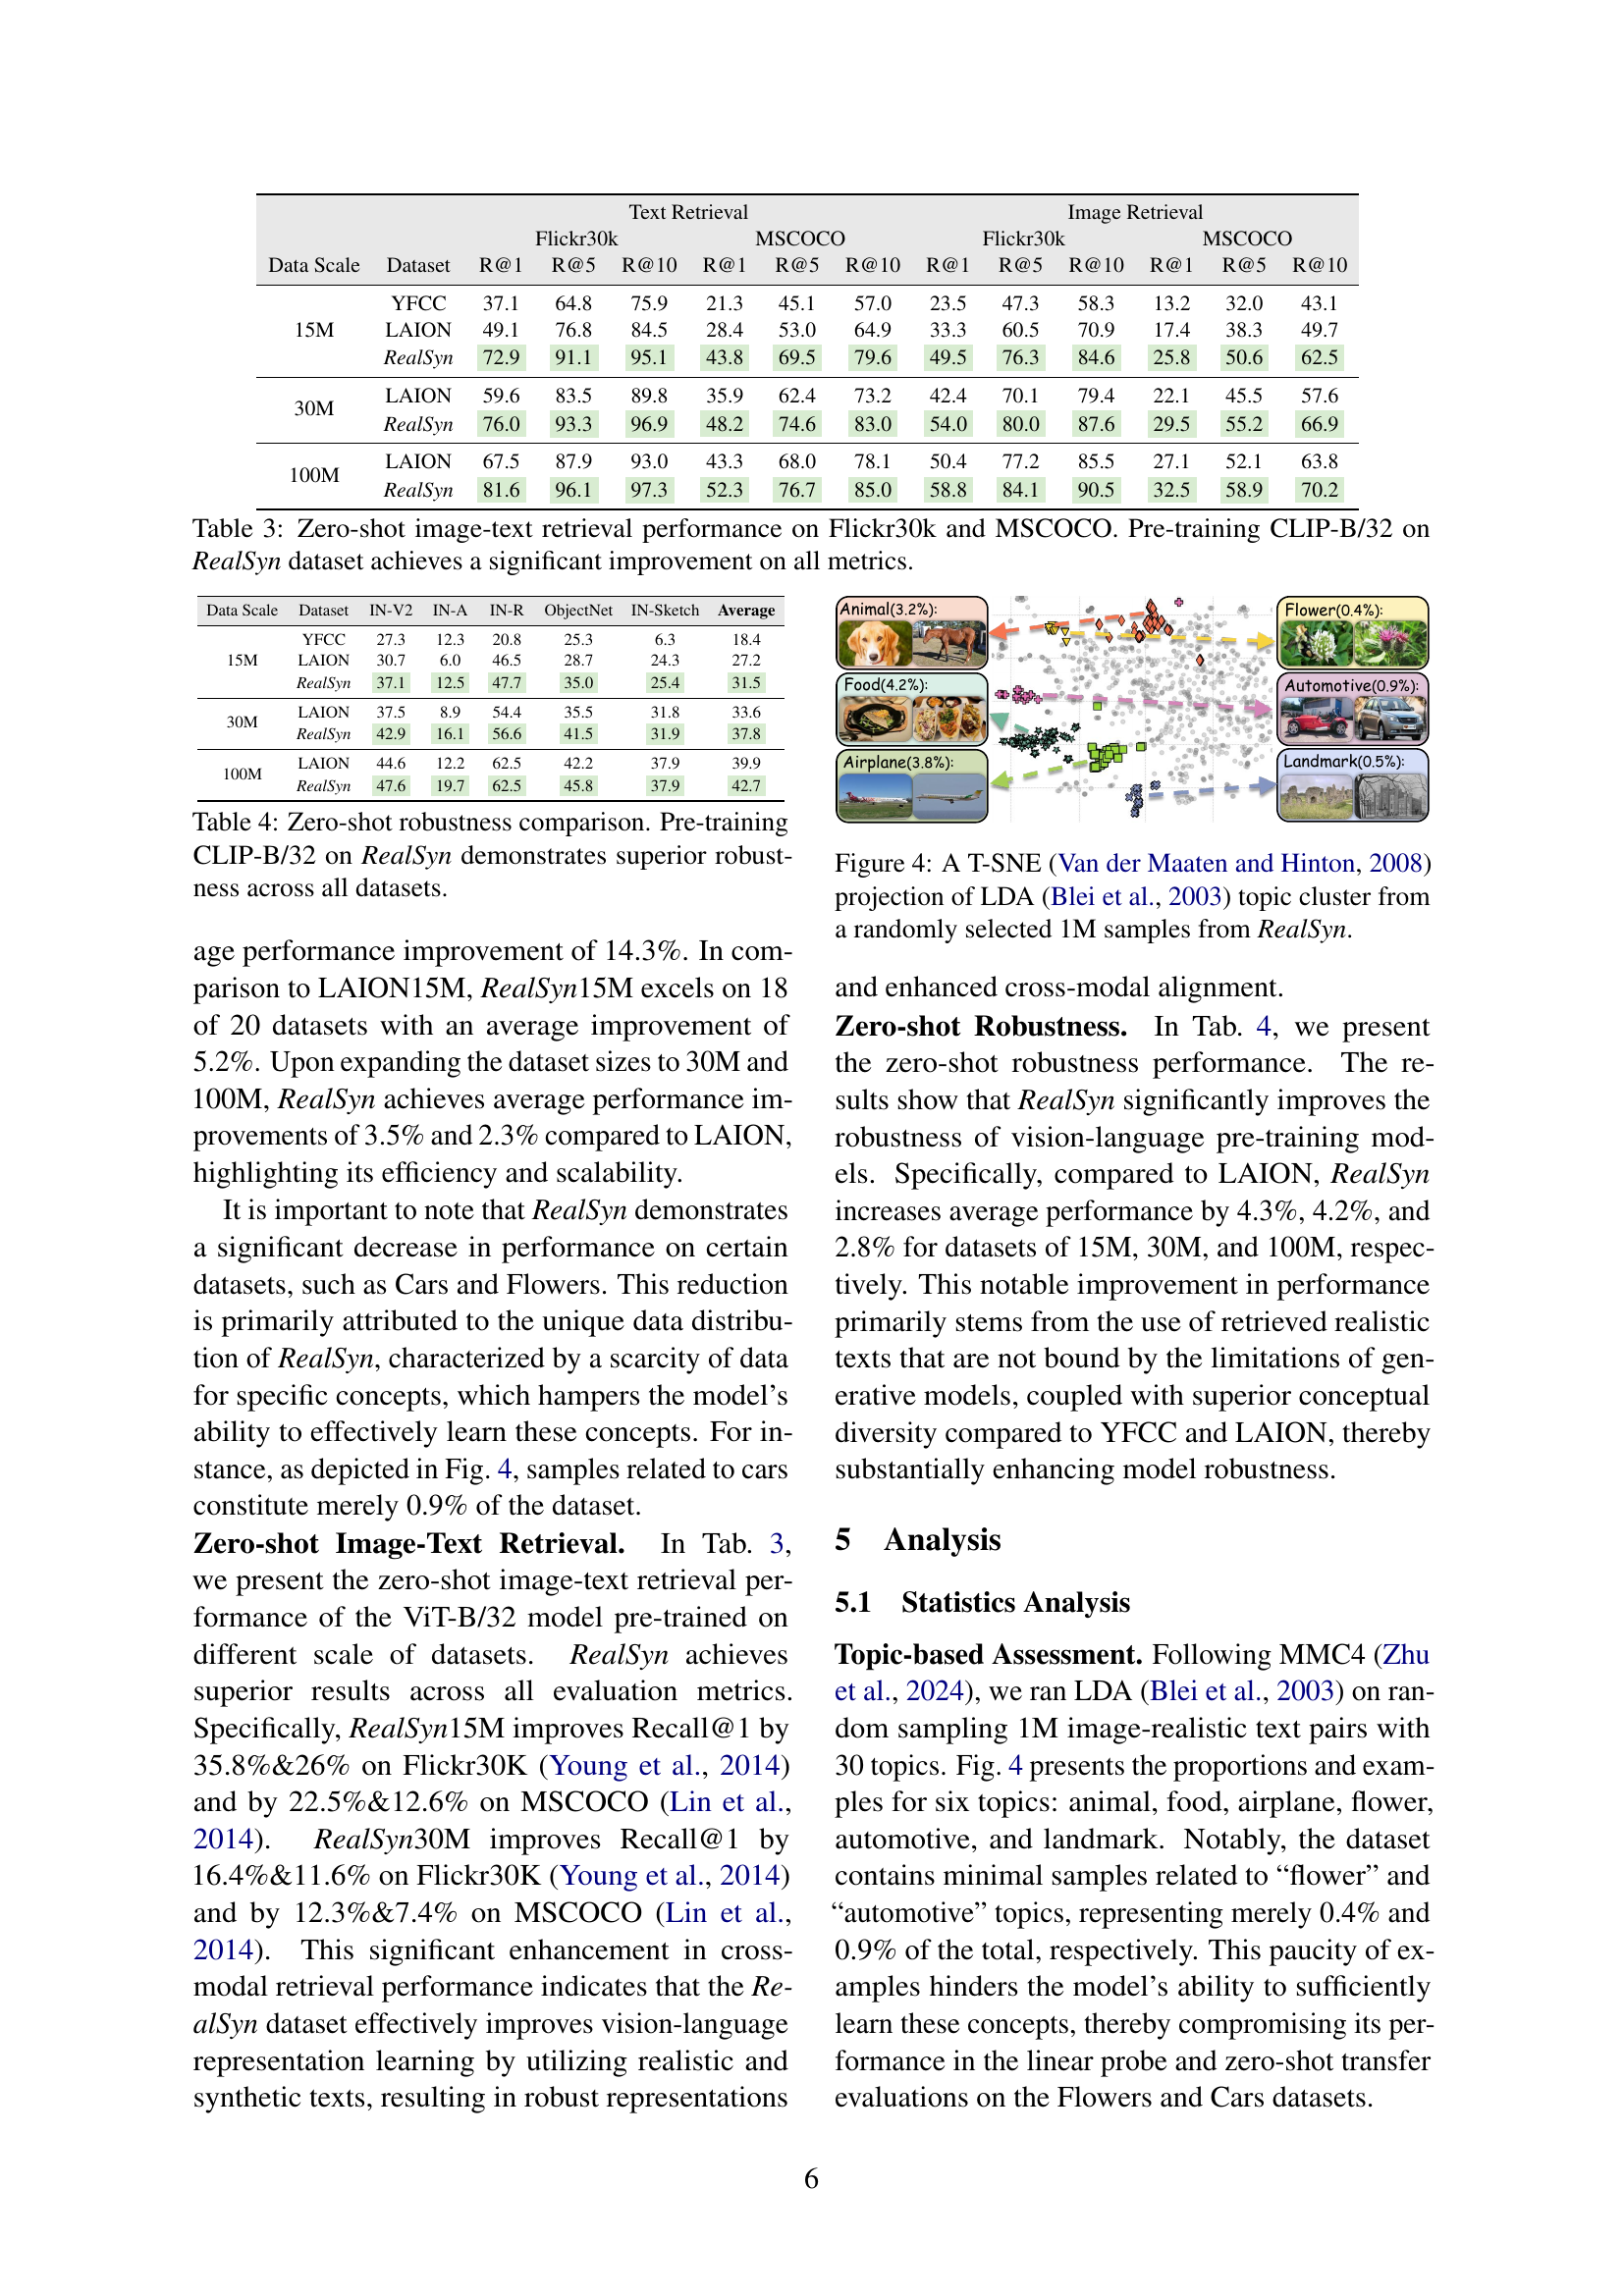
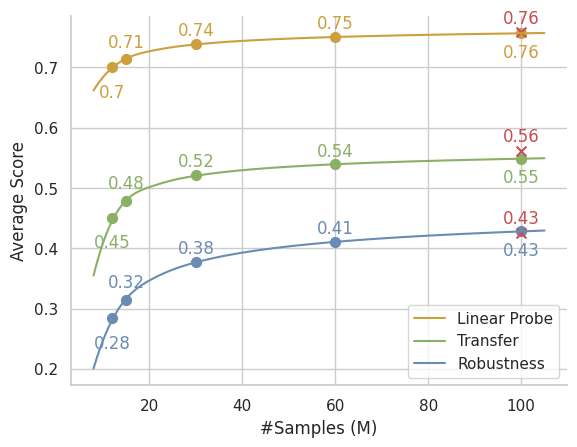
🔼 Figure 6 presents a comparison of model scaling capabilities between two large-scale image-text datasets: LAION30M and RealSyn30M. It demonstrates how performance varies across different model sizes (ViT-B/32, ViT-B/16, ViT-L/14) when pre-trained on each dataset. The results are shown across three key metrics: linear probe performance on downstream tasks, zero-shot transfer learning performance, and robustness. This visualization allows assessing which dataset is more effective at improving model scaling and performance on downstream tasks.
read the caption
Figure 6: Model scaling capability. We compare the models pre-trained on LAION30M and RealSyn30M.

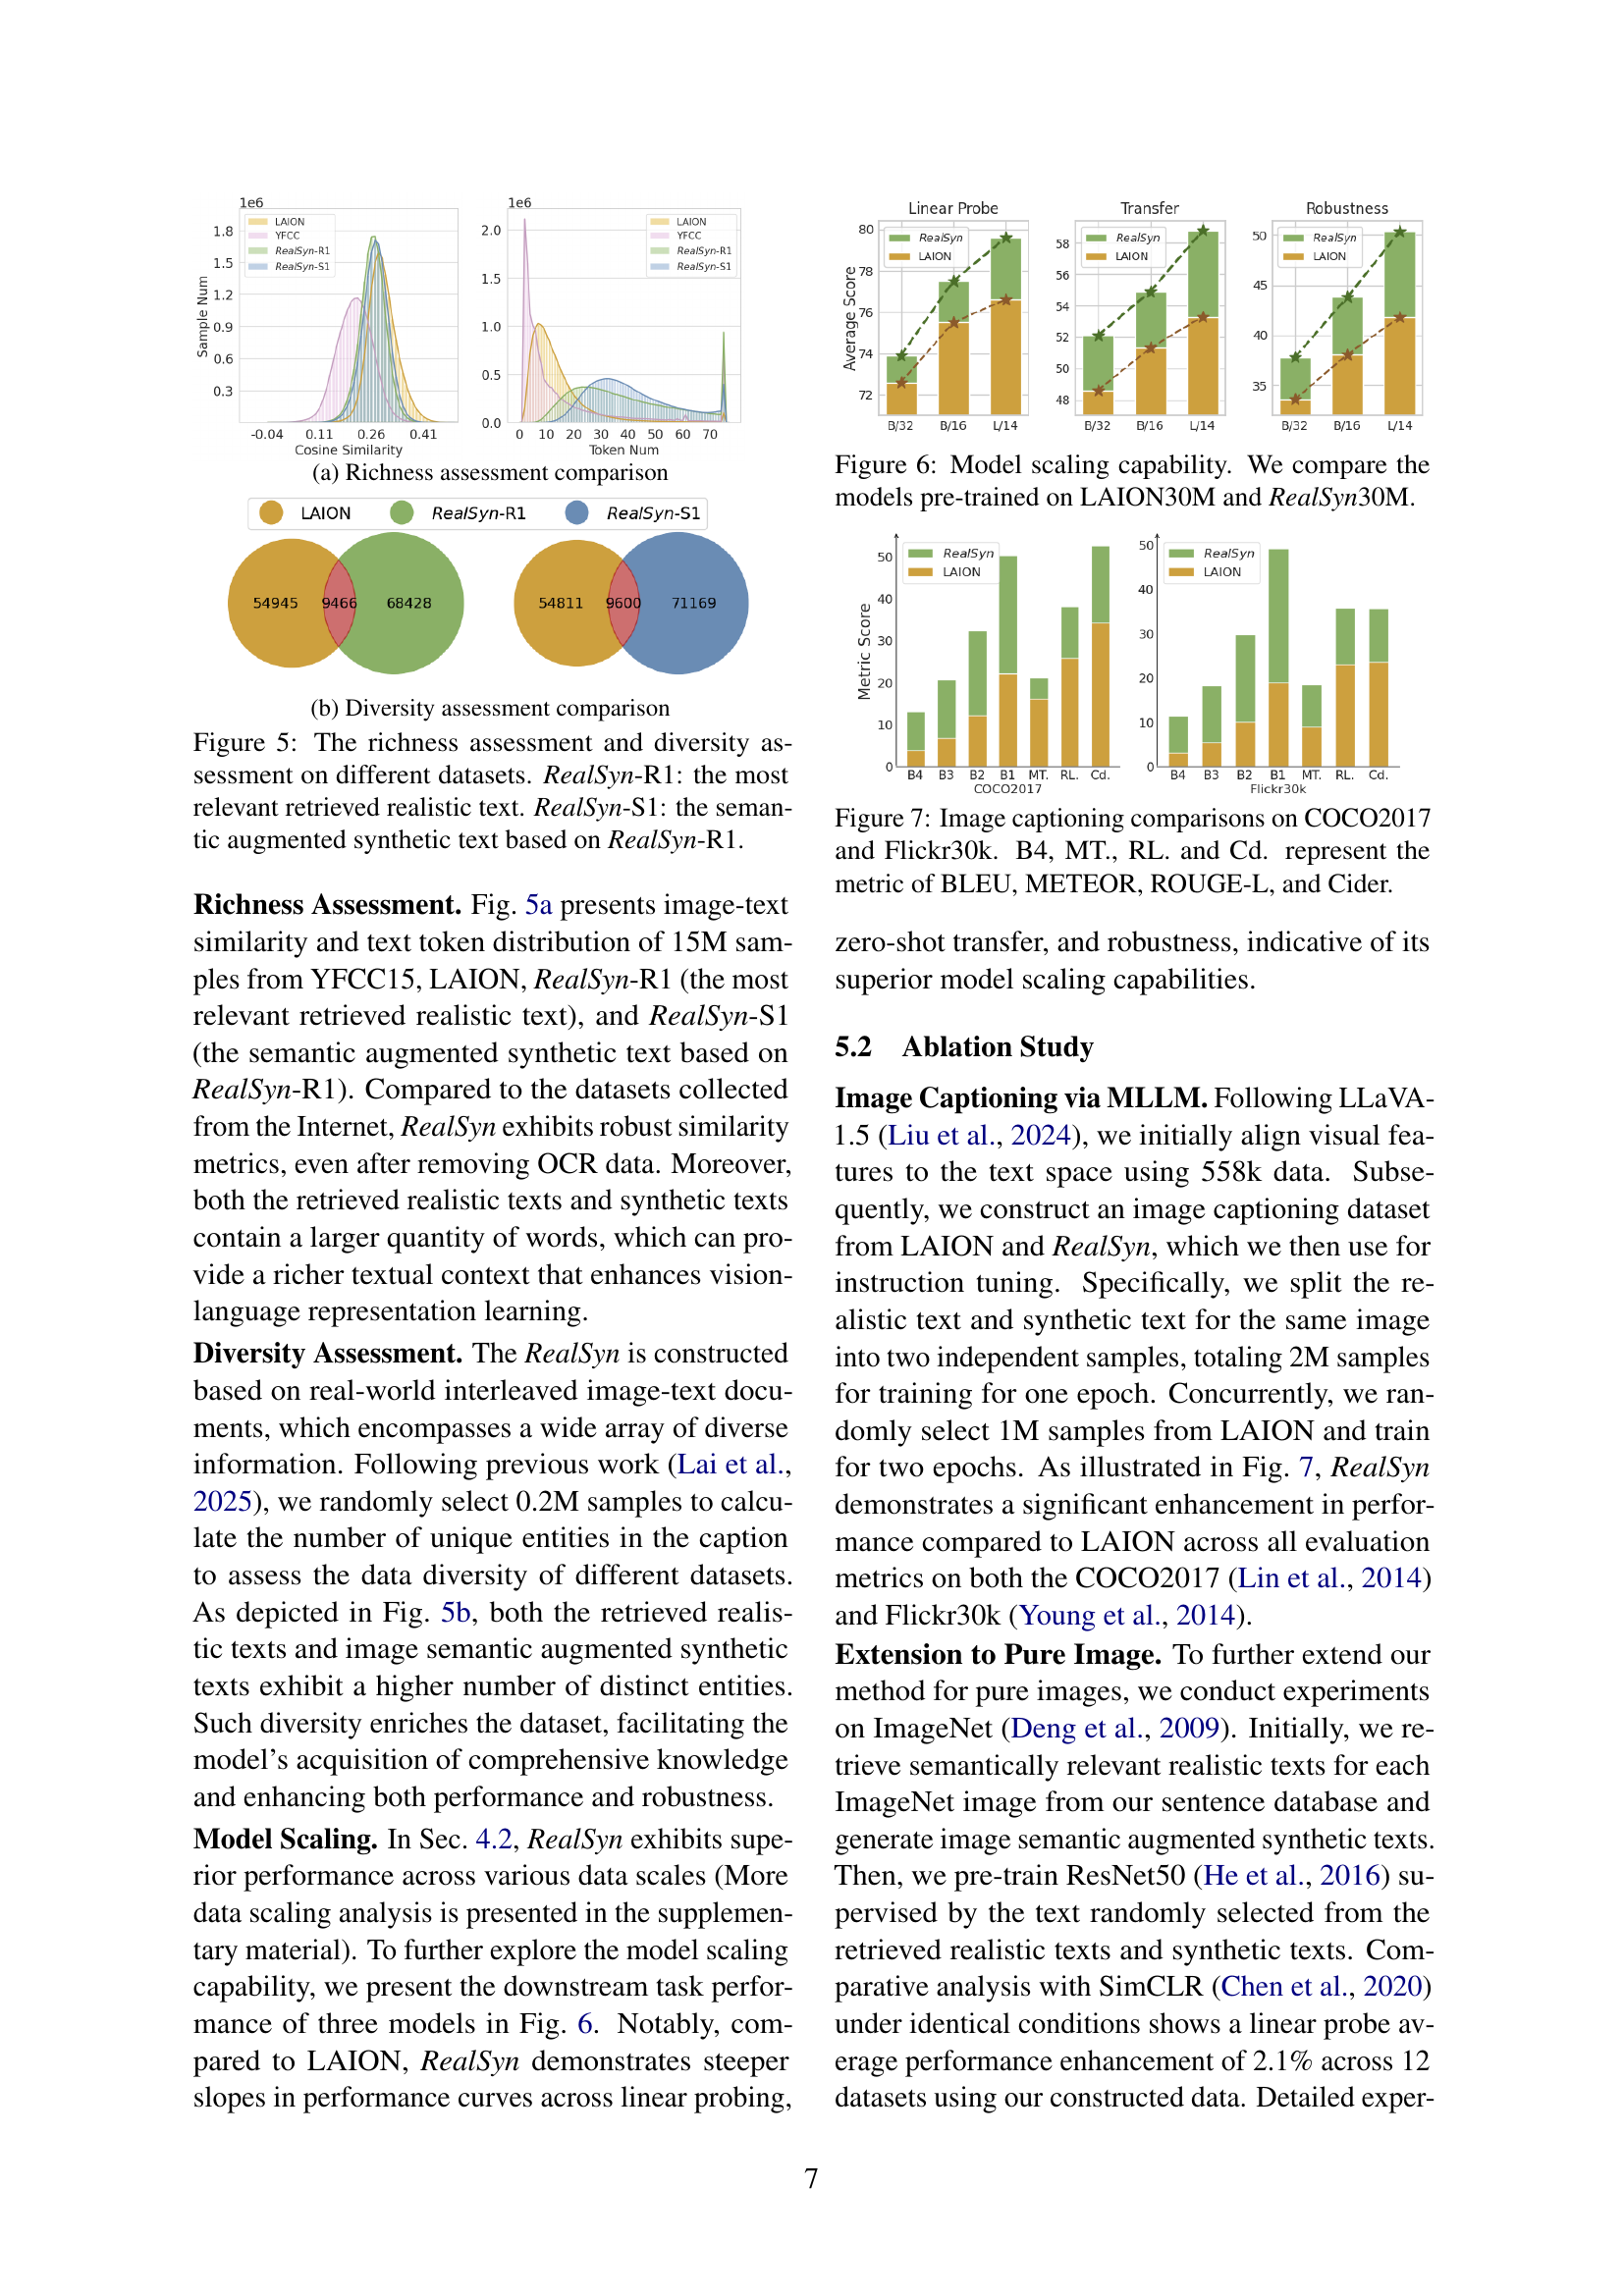
🔼 Figure 7 presents a comparison of image captioning performance on the COCO2017 and Flickr30k datasets. The results are shown for different models, with performance evaluated using four metrics: BLEU (B4), METEOR (MT.), ROUGE-L (RL.), and CIDEr (Cd.). This allows for a comprehensive assessment of caption quality across various models and datasets.
read the caption
Figure 7: Image captioning comparisons on COCO2017 and Flickr30k. B4, MT., RL. and Cd. represent the metric of BLEU, METEOR, ROUGE-L, and Cider.

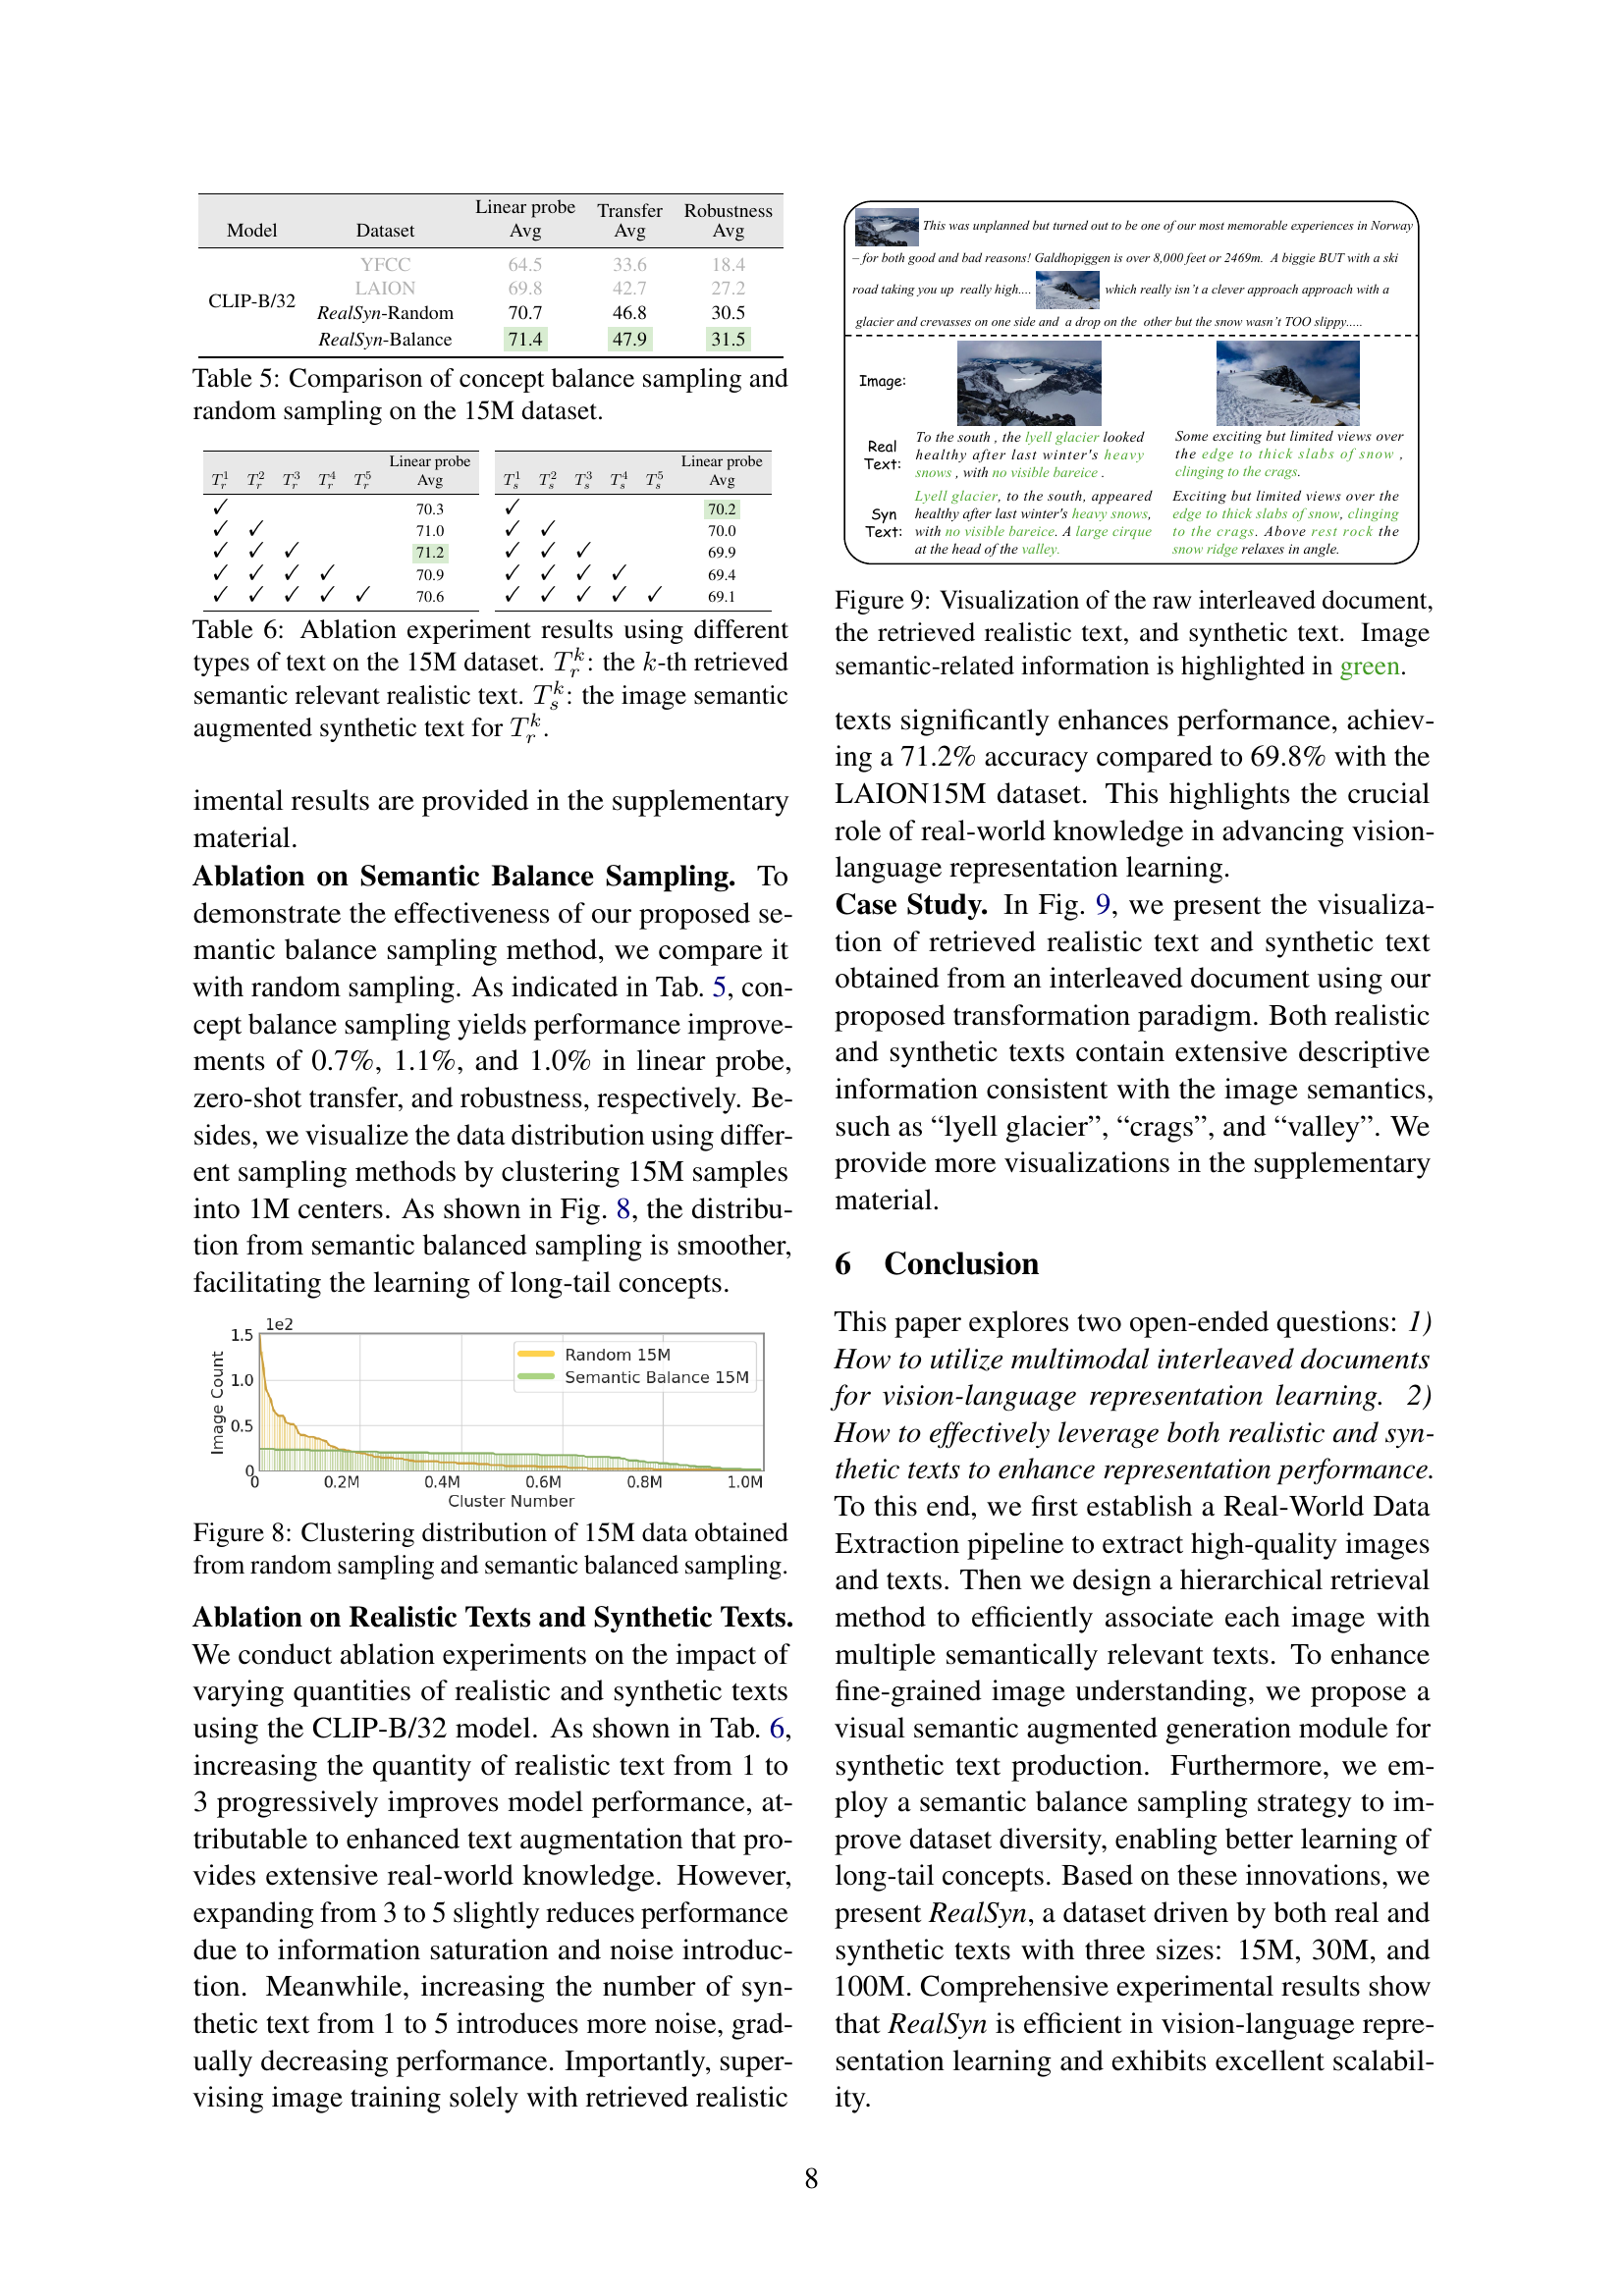
🔼 Figure 8 presents a comparative analysis of data distribution obtained from two sampling methods: random sampling and semantic balanced sampling. The x-axis represents the cluster number, and the y-axis denotes the count of samples within each cluster. Two distinct curves illustrate the distribution of 15 million data points from each sampling technique. The plot visually demonstrates how semantic balanced sampling, in contrast to random sampling, leads to a more uniform and balanced distribution of data across clusters, mitigating potential biases towards certain clusters and improving the model’s ability to learn from diverse data.
read the caption
Figure 8: Clustering distribution of 15M data obtained from random sampling and semantic balanced sampling.
🔼 Figure 9 visualizes the transformation of an interleaved document into image-text pairs. It shows the original, unstructured document alongside extracted high-quality images. The figure then highlights how a hierarchical retrieval system identifies multiple semantically relevant realistic texts associated with each image. Finally, it displays synthetic texts generated to augment the image’s semantic information. These synthetic texts are created using a large language model and aim to provide fine-grained details that may be missing from the original text. The image semantic-related information in both the realistic and synthetic texts is highlighted in green, demonstrating how this information is preserved and enriched throughout the process.
read the caption
Figure 9: Visualization of the raw interleaved document, the retrieved realistic text, and synthetic text. Image semantic-related information is highlighted in green.

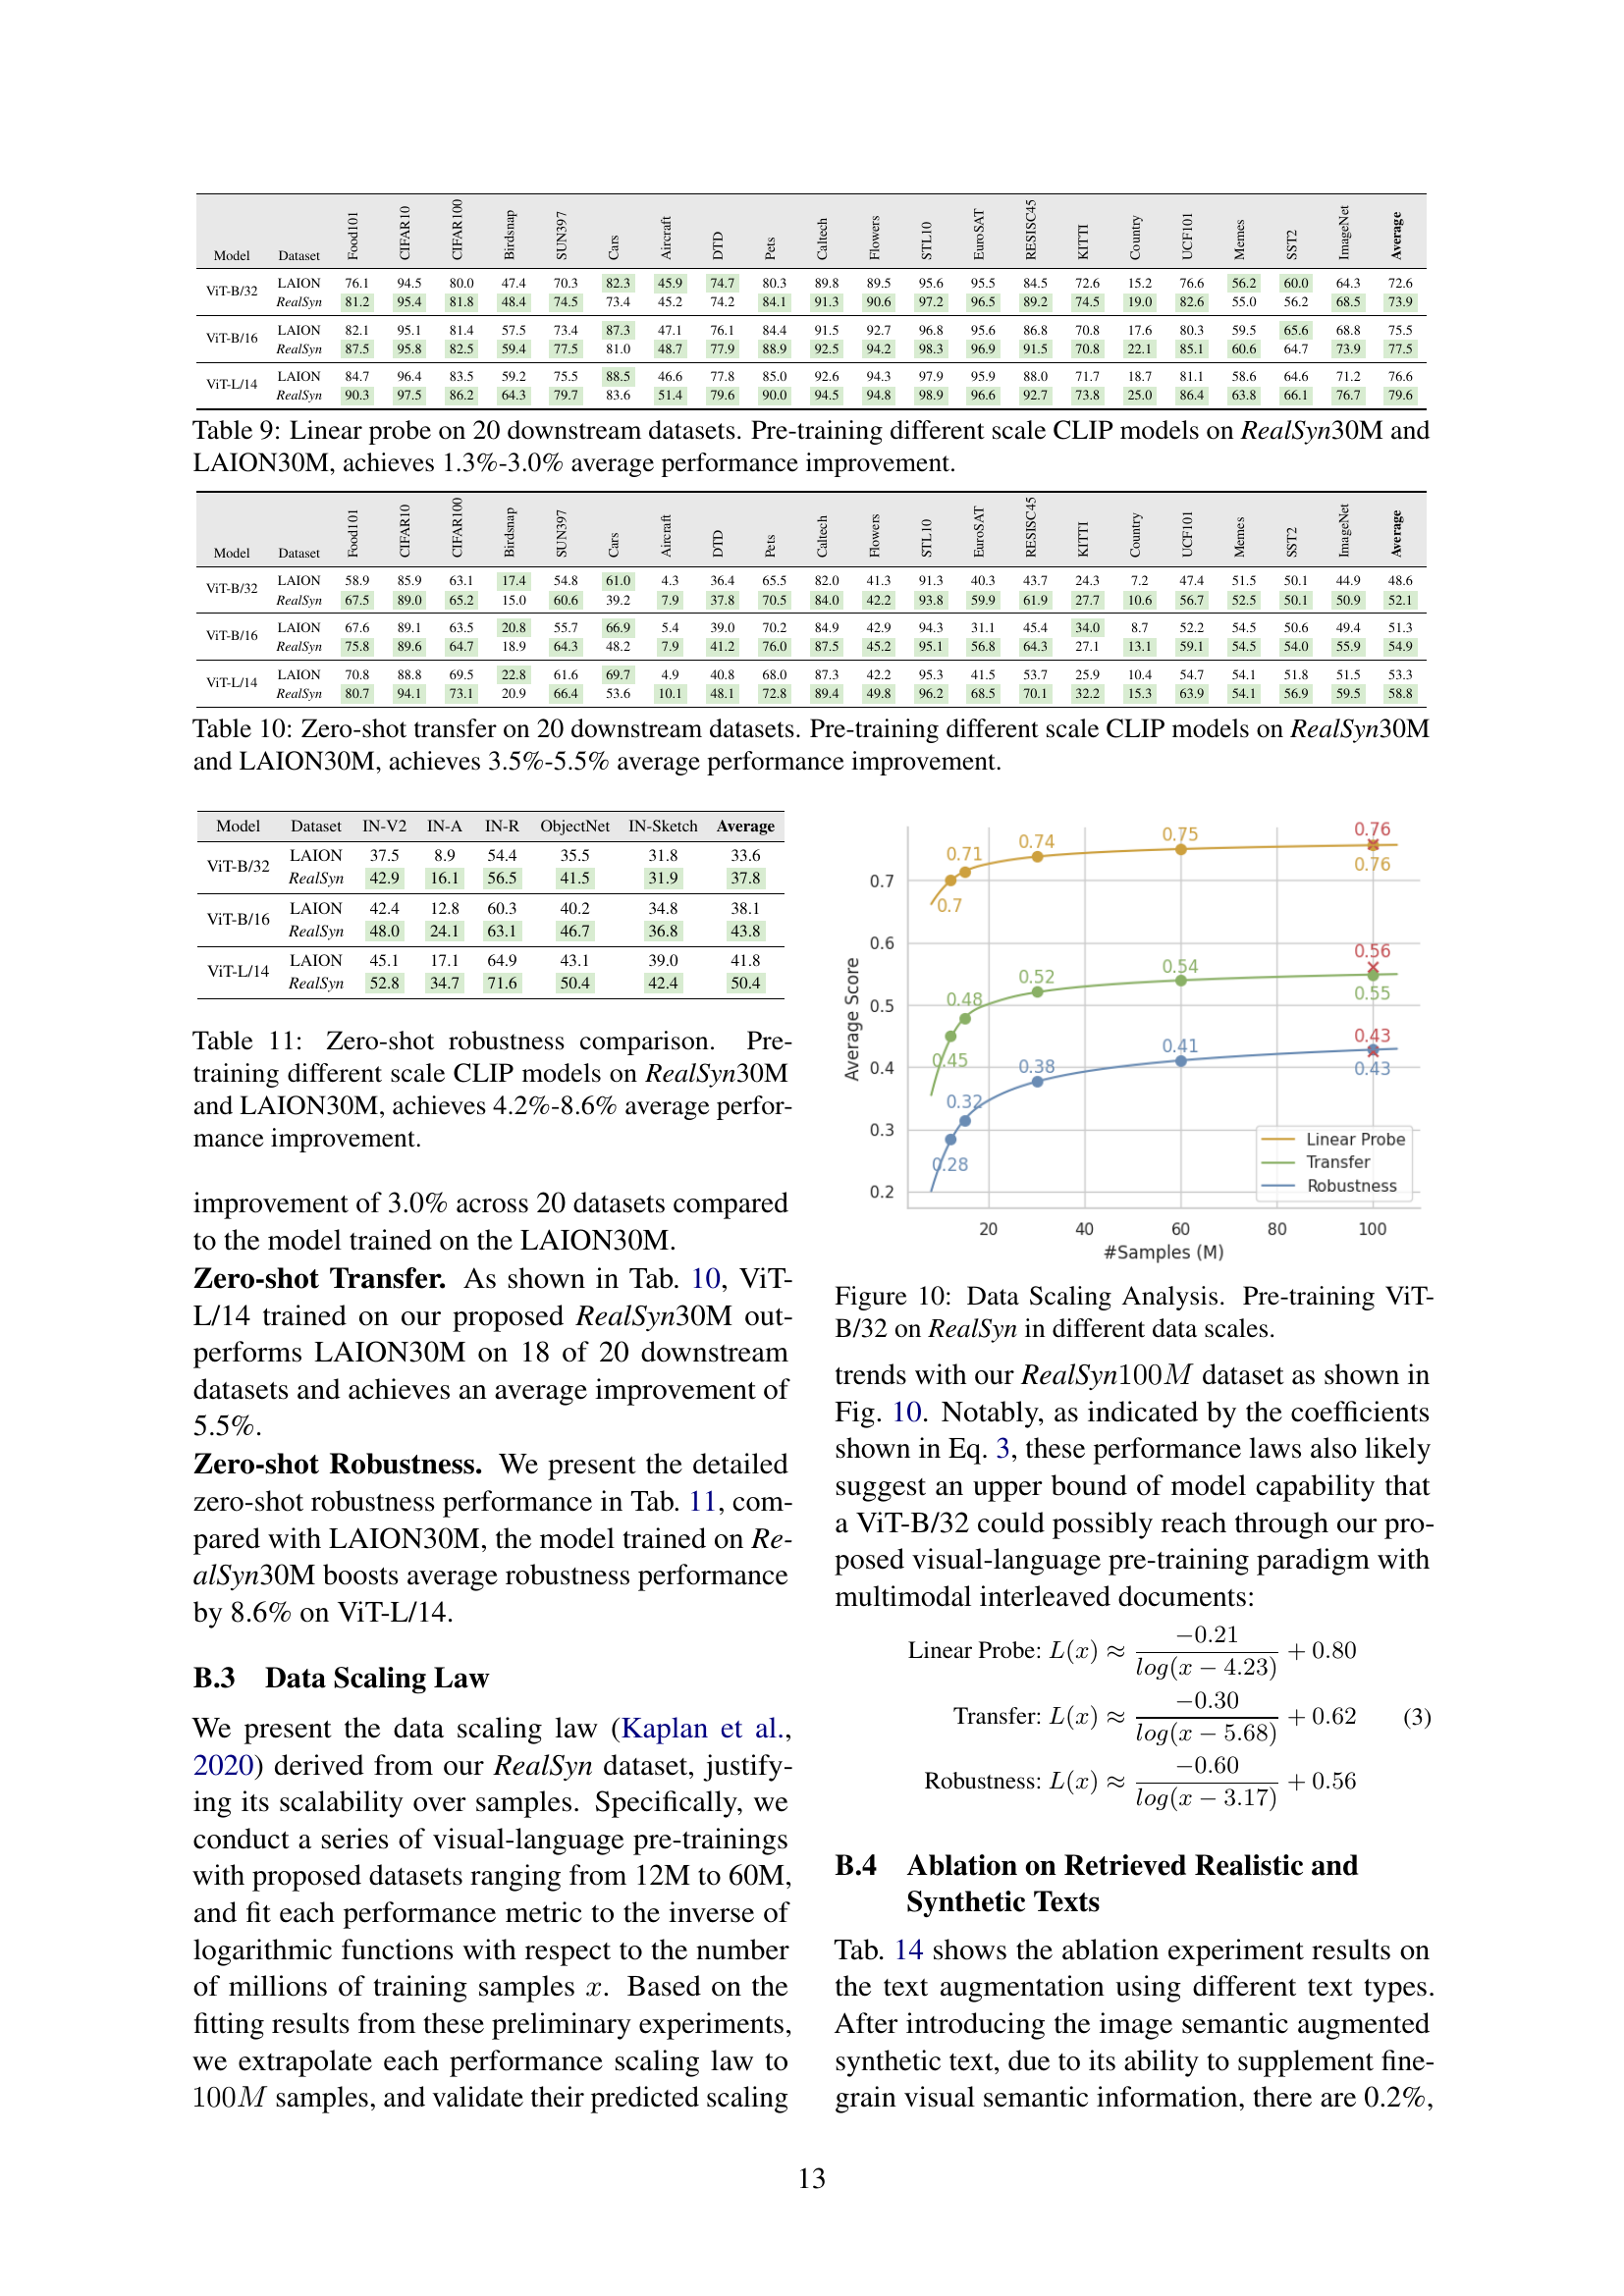
🔼 This figure illustrates the performance scaling of the Vision Transformer (ViT-B/32) model when pre-trained on the RealSyn dataset at various scales. It visually represents how the model’s performance changes as the amount of training data increases. This allows for an evaluation of the dataset’s scalability and efficiency, showing whether performance gains plateau or continue to improve with larger datasets.
read the caption
Figure 10: Data Scaling Analysis. Pre-training ViT-B/32 on RealSyn in different data scales.
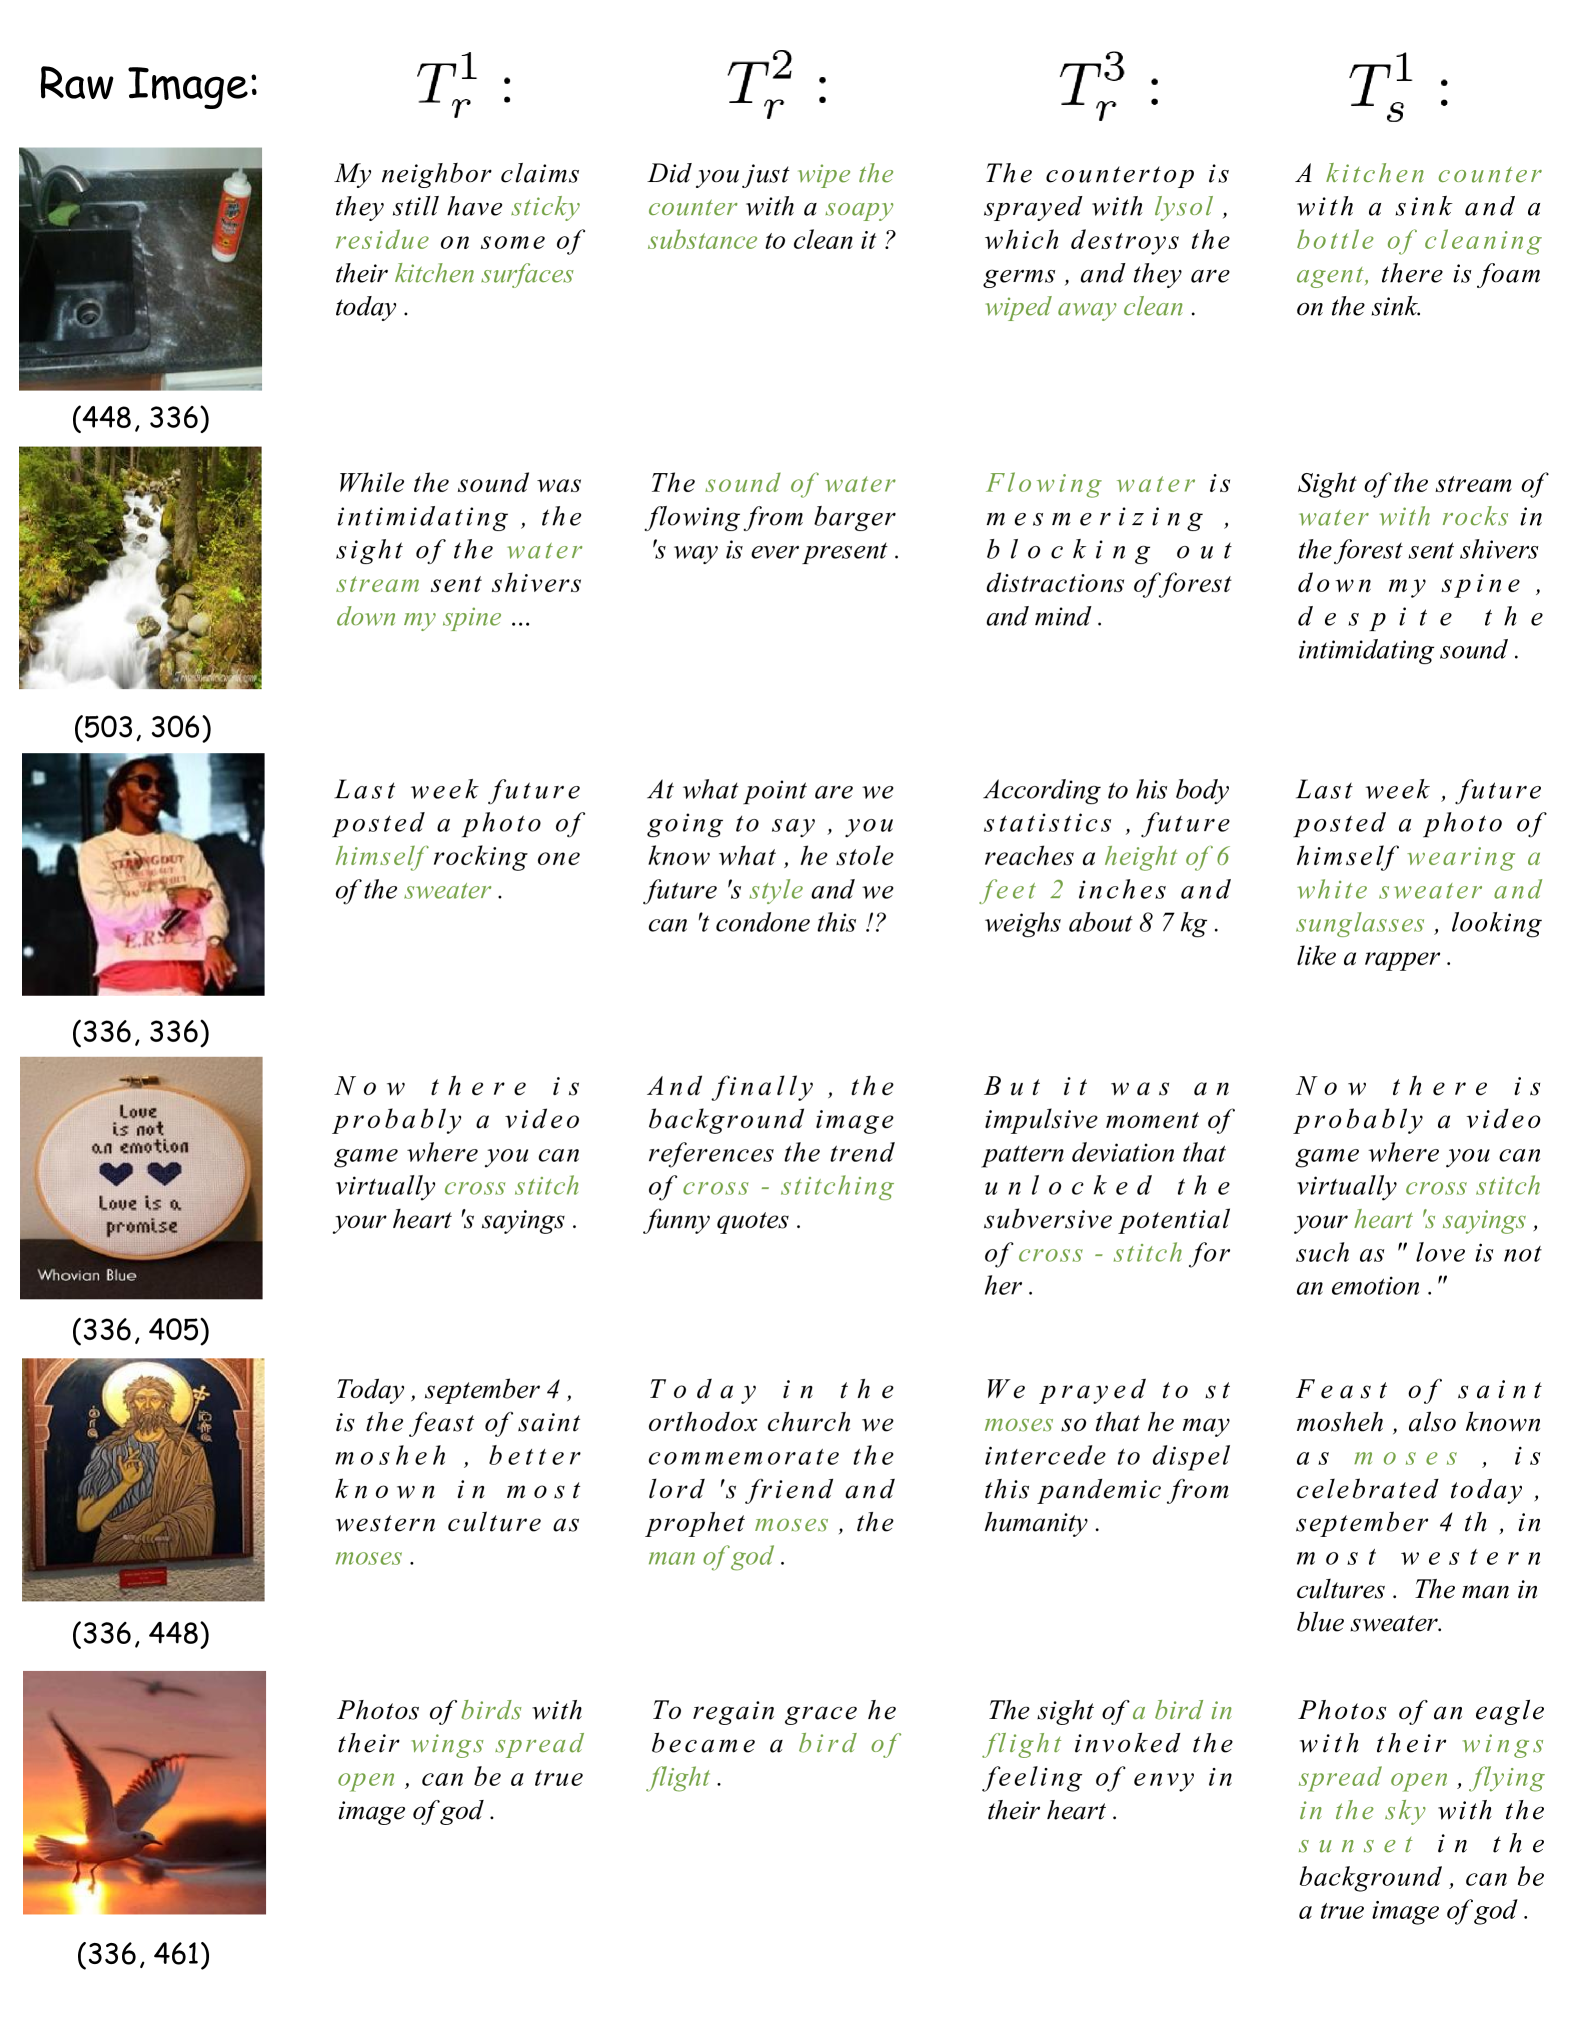
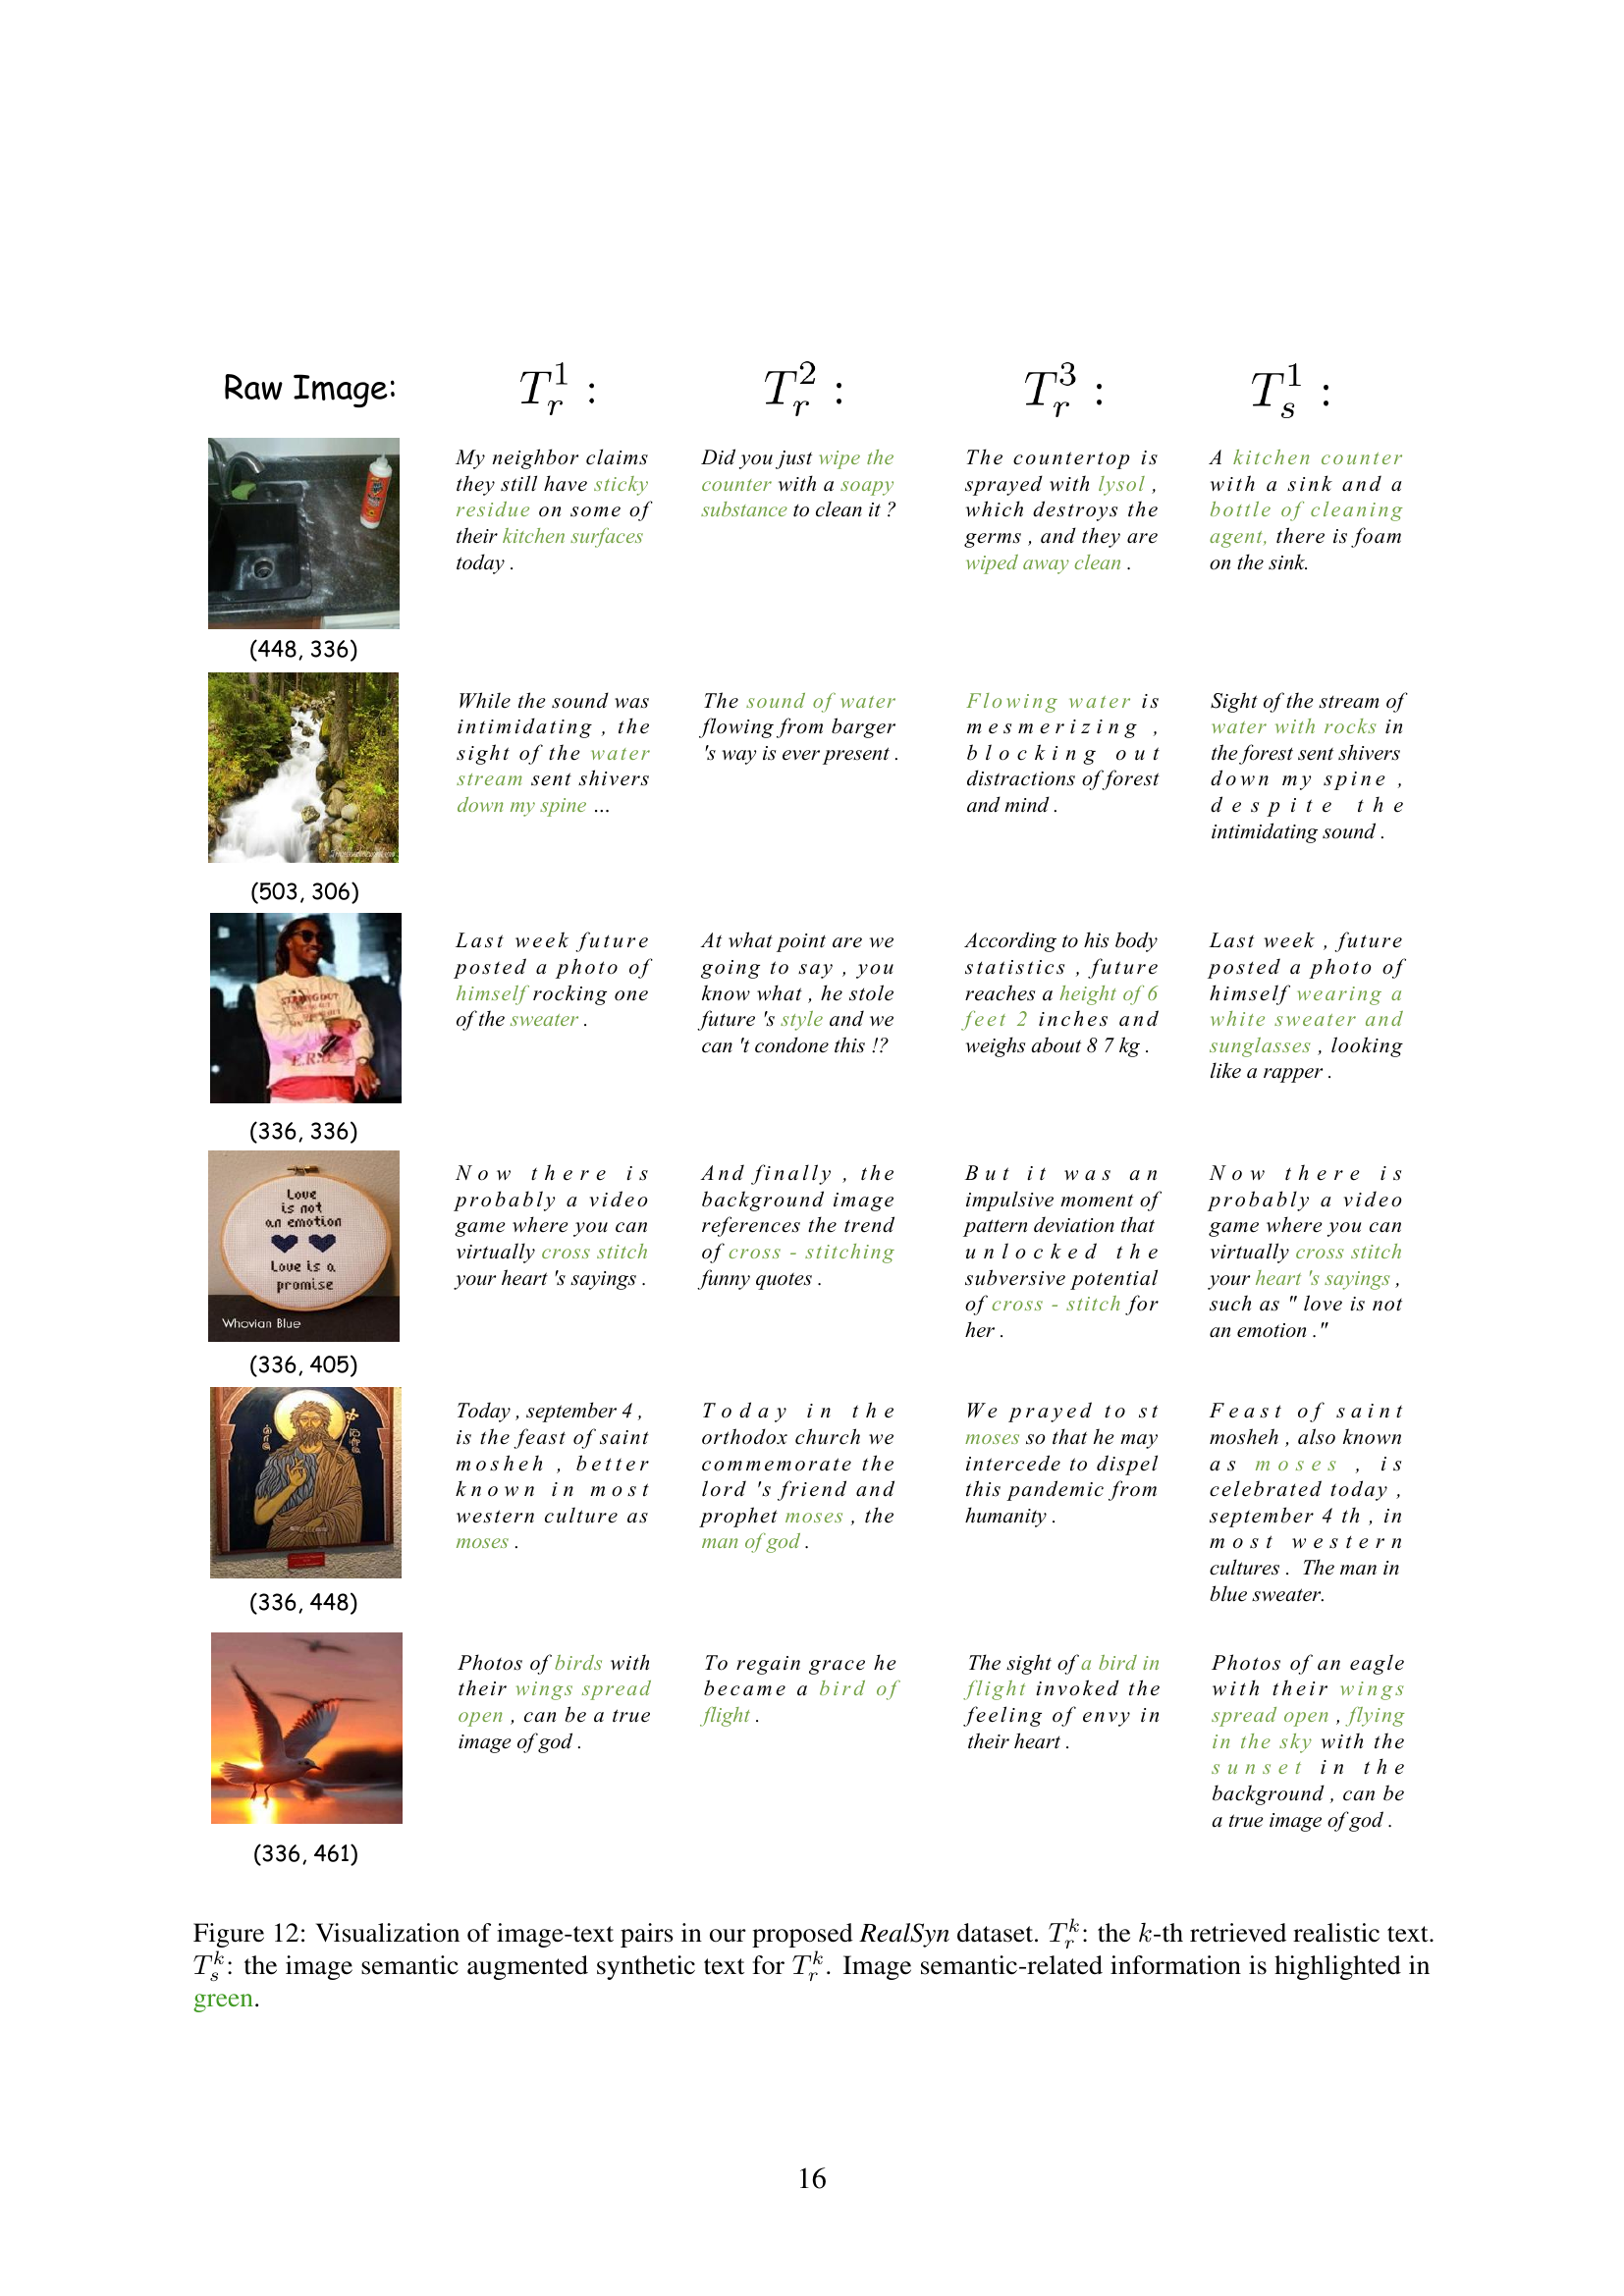
🔼 This figure visualizes examples from the RealSyn dataset, showcasing the integration of realistic and synthetic image-text pairs. Each row displays a raw image, followed by multiple realistic text descriptions (Tkr) retrieved from the original interleaved documents. These are then complemented by corresponding synthetic texts (Tks) generated to enhance fine-grained semantic details using the model and the original realistic texts. The generated synthetic texts aim to improve the representation learning by adding semantic richness and diversity. Green highlights indicate portions of the synthetic text directly related to image semantics.
read the caption
Figure 11: Visualization of image-text pairs in our proposed RealSyn dataset. Trksubscriptsuperscript𝑇𝑘𝑟T^{k}_{r}italic_T start_POSTSUPERSCRIPT italic_k end_POSTSUPERSCRIPT start_POSTSUBSCRIPT italic_r end_POSTSUBSCRIPT: the k𝑘kitalic_k-th retrieved realistic text. Tsksubscriptsuperscript𝑇𝑘𝑠T^{k}_{s}italic_T start_POSTSUPERSCRIPT italic_k end_POSTSUPERSCRIPT start_POSTSUBSCRIPT italic_s end_POSTSUBSCRIPT: the image semantic augmented synthetic text for Trksubscriptsuperscript𝑇𝑘𝑟T^{k}_{r}italic_T start_POSTSUPERSCRIPT italic_k end_POSTSUPERSCRIPT start_POSTSUBSCRIPT italic_r end_POSTSUBSCRIPT. Image semantic-related information is highlighted in green.
More on tables
| Data Scale | Dataset | Food101 | CIFAR10 | CIFAR100 | Birdsnap | SUN397 | Cars | Aircraft | DTD | Pets | Caltech | Flowers | STL10 | EuroSAT | RESISC45 | KITTI | Country | UCF101 | Memes | SST2 | ImageNet | Average |
| 15M | YFCC | 36.3 | 74.0 | 40.3 | 19.4 | 41.8 | 2.1 | 2.3 | 12.0 | 19.8 | 59.8 | 48.9 | 87.7 | 21.2 | 20.3 | 23.8 | 5.1 | 27.8 | 47.4 | 50.1 | 32.3 | 33.6 |
| LAION | 49.1 | 85.7 | 56.9 | 11.5 | 45.1 | 49.9 | 3.8 | 25.7 | 54.6 | 78.1 | 30.5 | 89.5 | 36.7 | 36.1 | 21.7 | 5.6 | 38.2 | 48.8 | 49.9 | 37.1 | 42.7 | |
| RealSyn | 60.0 | 85.7 | 58.3 | 10.5 | 56.4 | 27.6 | 5.5 | 33.2 | 61.7 | 80.2 | 31.2 | 92.4 | 56.5 | 56.2 | 34.0 | 8.9 | 52.6 | 53.3 | 51.3 | 43.3 | 47.9 | |
| 30M | LAION | 58.9 | 85.9 | 63.1 | 17.4 | 54.8 | 61.0 | 4.3 | 36.4 | 65.5 | 82.0 | 41.3 | 91.3 | 40.3 | 43.7 | 24.3 | 7.2 | 47.4 | 51.5 | 50.1 | 44.9 | 48.6 |
| RealSyn | 67.5 | 89.0 | 65.2 | 15.0 | 60.6 | 39.2 | 7.9 | 37.8 | 70.5 | 84.0 | 42.2 | 93.8 | 59.9 | 61.9 | 27.7 | 10.6 | 56.7 | 52.5 | 50.1 | 50.9 | 52.1 | |
| 100M | LAION | 68.9 | 90.5 | 68.6 | 23.6 | 60.6 | 68.3 | 7.8 | 41.2 | 74.7 | 87.1 | 47.7 | 94.4 | 45.6 | 53.4 | 23.6 | 10.4 | 54.5 | 51.9 | 53.3 | 52.8 | 53.9 |
| RealSyn | 73.5 | 89.5 | 68.8 | 20.1 | 65.0 | 48.5 | 10.2 | 46.1 | 76.7 | 87.6 | 48.8 | 94.4 | 69.0 | 65.5 | 24.6 | 12.1 | 60.5 | 52.4 | 54.1 | 56.2 | 56.2 | |
🔼 This table presents the results of a zero-shot transfer experiment conducted on 20 different downstream datasets. The experiment evaluated the performance of a Vision Transformer (ViT-B/32) model pre-trained on the RealSyn dataset. The table shows the performance (likely accuracy or other relevant metrics) achieved on each downstream dataset, comparing the results obtained with the RealSyn pre-trained model against results using models pre-trained on other datasets (likely YFCC15M and LAION). The table highlights that pre-training with RealSyn leads to significant performance improvements, ranging from 2.3% to 14.3% on average, demonstrating the effectiveness of the RealSyn dataset in improving the generalizability of vision-language models.
read the caption
Table 2: Zero-shot transfer on 20 downstream datasets. Pre-training ViT-B/32 on RealSyn achieves 2.3%-14.3% average performance improvement.
| Text Retrieval | Image Retrieval | ||||||||||||
| Flickr30k | MSCOCO | Flickr30k | MSCOCO | ||||||||||
| Data Scale | Dataset | R@1 | R@5 | R@10 | R@1 | R@5 | R@10 | R@1 | R@5 | R@10 | R@1 | R@5 | R@10 |
| 15M | YFCC | 37.1 | 64.8 | 75.9 | 21.3 | 45.1 | 57.0 | 23.5 | 47.3 | 58.3 | 13.2 | 32.0 | 43.1 |
| LAION | 49.1 | 76.8 | 84.5 | 28.4 | 53.0 | 64.9 | 33.3 | 60.5 | 70.9 | 17.4 | 38.3 | 49.7 | |
| RealSyn | 72.9 | 91.1 | 95.1 | 43.8 | 69.5 | 79.6 | 49.5 | 76.3 | 84.6 | 25.8 | 50.6 | 62.5 | |
| 30M | LAION | 59.6 | 83.5 | 89.8 | 35.9 | 62.4 | 73.2 | 42.4 | 70.1 | 79.4 | 22.1 | 45.5 | 57.6 |
| RealSyn | 76.0 | 93.3 | 96.9 | 48.2 | 74.6 | 83.0 | 54.0 | 80.0 | 87.6 | 29.5 | 55.2 | 66.9 | |
| 100M | LAION | 67.5 | 87.9 | 93.0 | 43.3 | 68.0 | 78.1 | 50.4 | 77.2 | 85.5 | 27.1 | 52.1 | 63.8 |
| RealSyn | 81.6 | 96.1 | 97.3 | 52.3 | 76.7 | 85.0 | 58.8 | 84.1 | 90.5 | 32.5 | 58.9 | 70.2 | |
🔼 This table presents the results of zero-shot image-text retrieval experiments conducted on two benchmark datasets: Flickr30k and MSCOCO. The experiments evaluated the performance of the CLIP-B/32 model pre-trained on the RealSyn dataset. The table shows Recall@1, Recall@5, and Recall@10 metrics for both image retrieval and text retrieval tasks across three different scales of the RealSyn dataset (15M, 30M, and 100M). The results demonstrate the significant improvement in zero-shot image-text retrieval performance achieved by pre-training on the RealSyn dataset compared to results from other large-scale pre-training datasets such as LAION and YFCC.
read the caption
Table 3: Zero-shot image-text retrieval performance on Flickr30k and MSCOCO. Pre-training CLIP-B/32 on RealSyn dataset achieves a significant improvement on all metrics.
| Data Scale | Dataset | IN-V2 | IN-A | IN-R | ObjectNet | IN-Sketch | Average |
| 15M | YFCC | 27.3 | 12.3 | 20.8 | 25.3 | 6.3 | 18.4 |
| LAION | 30.7 | 6.0 | 46.5 | 28.7 | 24.3 | 27.2 | |
| RealSyn | 37.1 | 12.5 | 47.7 | 35.0 | 25.4 | 31.5 | |
| 30M | LAION | 37.5 | 8.9 | 54.4 | 35.5 | 31.8 | 33.6 |
| RealSyn | 42.9 | 16.1 | 56.6 | 41.5 | 31.9 | 37.8 | |
| 100M | LAION | 44.6 | 12.2 | 62.5 | 42.2 | 37.9 | 39.9 |
| RealSyn | 47.6 | 19.7 | 62.5 | 45.8 | 37.9 | 42.7 | |
🔼 Table 4 presents a zero-shot robustness comparison across various datasets, showcasing the performance of the CLIP-B/32 model pre-trained on the RealSyn dataset. It compares the model’s performance on datasets representing various levels of visual complexity and noise, such as images with fine-grained details (ImageNet), images with more visual noise and ambiguity (ObjectNet), and sketch-style images (IN-Sketch). Superior performance on all these diverse datasets indicates the increased robustness of the RealSyn-pretrained model against variations in visual input quality and style.
read the caption
Table 4: Zero-shot robustness comparison. Pre-training CLIP-B/32 on RealSyn demonstrates superior robustness across all datasets.
| Model | Dataset | Linear probe Avg | Transfer Avg | Robustness Avg |
| CLIP-B/32 | YFCC | 64.5 | 33.6 | 18.4 |
| LAION | 69.8 | 42.7 | 27.2 | |
| RealSyn-Random | 70.7 | 46.8 | 30.5 | |
| RealSyn-Balance | 71.4 | 47.9 | 31.5 | |
🔼 This table presents a comparison of two sampling methods, concept balance sampling and random sampling, used in creating the 15M subset of the RealSyn dataset. It shows the average performance of each sampling method on three downstream tasks (linear probe, zero-shot transfer, and zero-shot robustness) to demonstrate the effectiveness of concept balance sampling in improving model performance. The results illustrate the impact of the sampling technique on the dataset’s ability to generalize across different tasks.
read the caption
Table 5: Comparison of concept balance sampling and random sampling on the 15M dataset.
| Linear probe Avg | |||||
| ✓ | 70.3 | ||||
| ✓ | ✓ | 71.0 | |||
| ✓ | ✓ | ✓ | 71.2 | ||
| ✓ | ✓ | ✓ | ✓ | 70.9 | |
| ✓ | ✓ | ✓ | ✓ | ✓ | 70.6 |
🔼 This table presents the results of an ablation study investigating the impact of different text types on the performance of a vision-language model trained on the 15M subset of the RealSyn dataset. Specifically, it examines the effect of using varying numbers of retrieved realistic texts (denoted as Tkr, where k represents the k-th retrieved text) and their corresponding image-semantic augmented synthetic texts (denoted as Tks) on the model’s performance. The results help determine the optimal combination of realistic and synthetic texts for achieving the best performance.
read the caption
Table 6: Ablation experiment results using different types of text on the 15M dataset. Trksubscriptsuperscript𝑇𝑘𝑟T^{k}_{r}italic_T start_POSTSUPERSCRIPT italic_k end_POSTSUPERSCRIPT start_POSTSUBSCRIPT italic_r end_POSTSUBSCRIPT: the k𝑘kitalic_k-th retrieved semantic relevant realistic text. Tsksubscriptsuperscript𝑇𝑘𝑠T^{k}_{s}italic_T start_POSTSUPERSCRIPT italic_k end_POSTSUPERSCRIPT start_POSTSUBSCRIPT italic_s end_POSTSUBSCRIPT: the image semantic augmented synthetic text for Trksubscriptsuperscript𝑇𝑘𝑟T^{k}_{r}italic_T start_POSTSUPERSCRIPT italic_k end_POSTSUPERSCRIPT start_POSTSUBSCRIPT italic_r end_POSTSUBSCRIPT.
| Linear probe Avg | |||||
| ✓ | 70.2 | ||||
| ✓ | ✓ | 70.0 | |||
| ✓ | ✓ | ✓ | 69.9 | ||
| ✓ | ✓ | ✓ | ✓ | 69.4 | |
| ✓ | ✓ | ✓ | ✓ | ✓ | 69.1 |
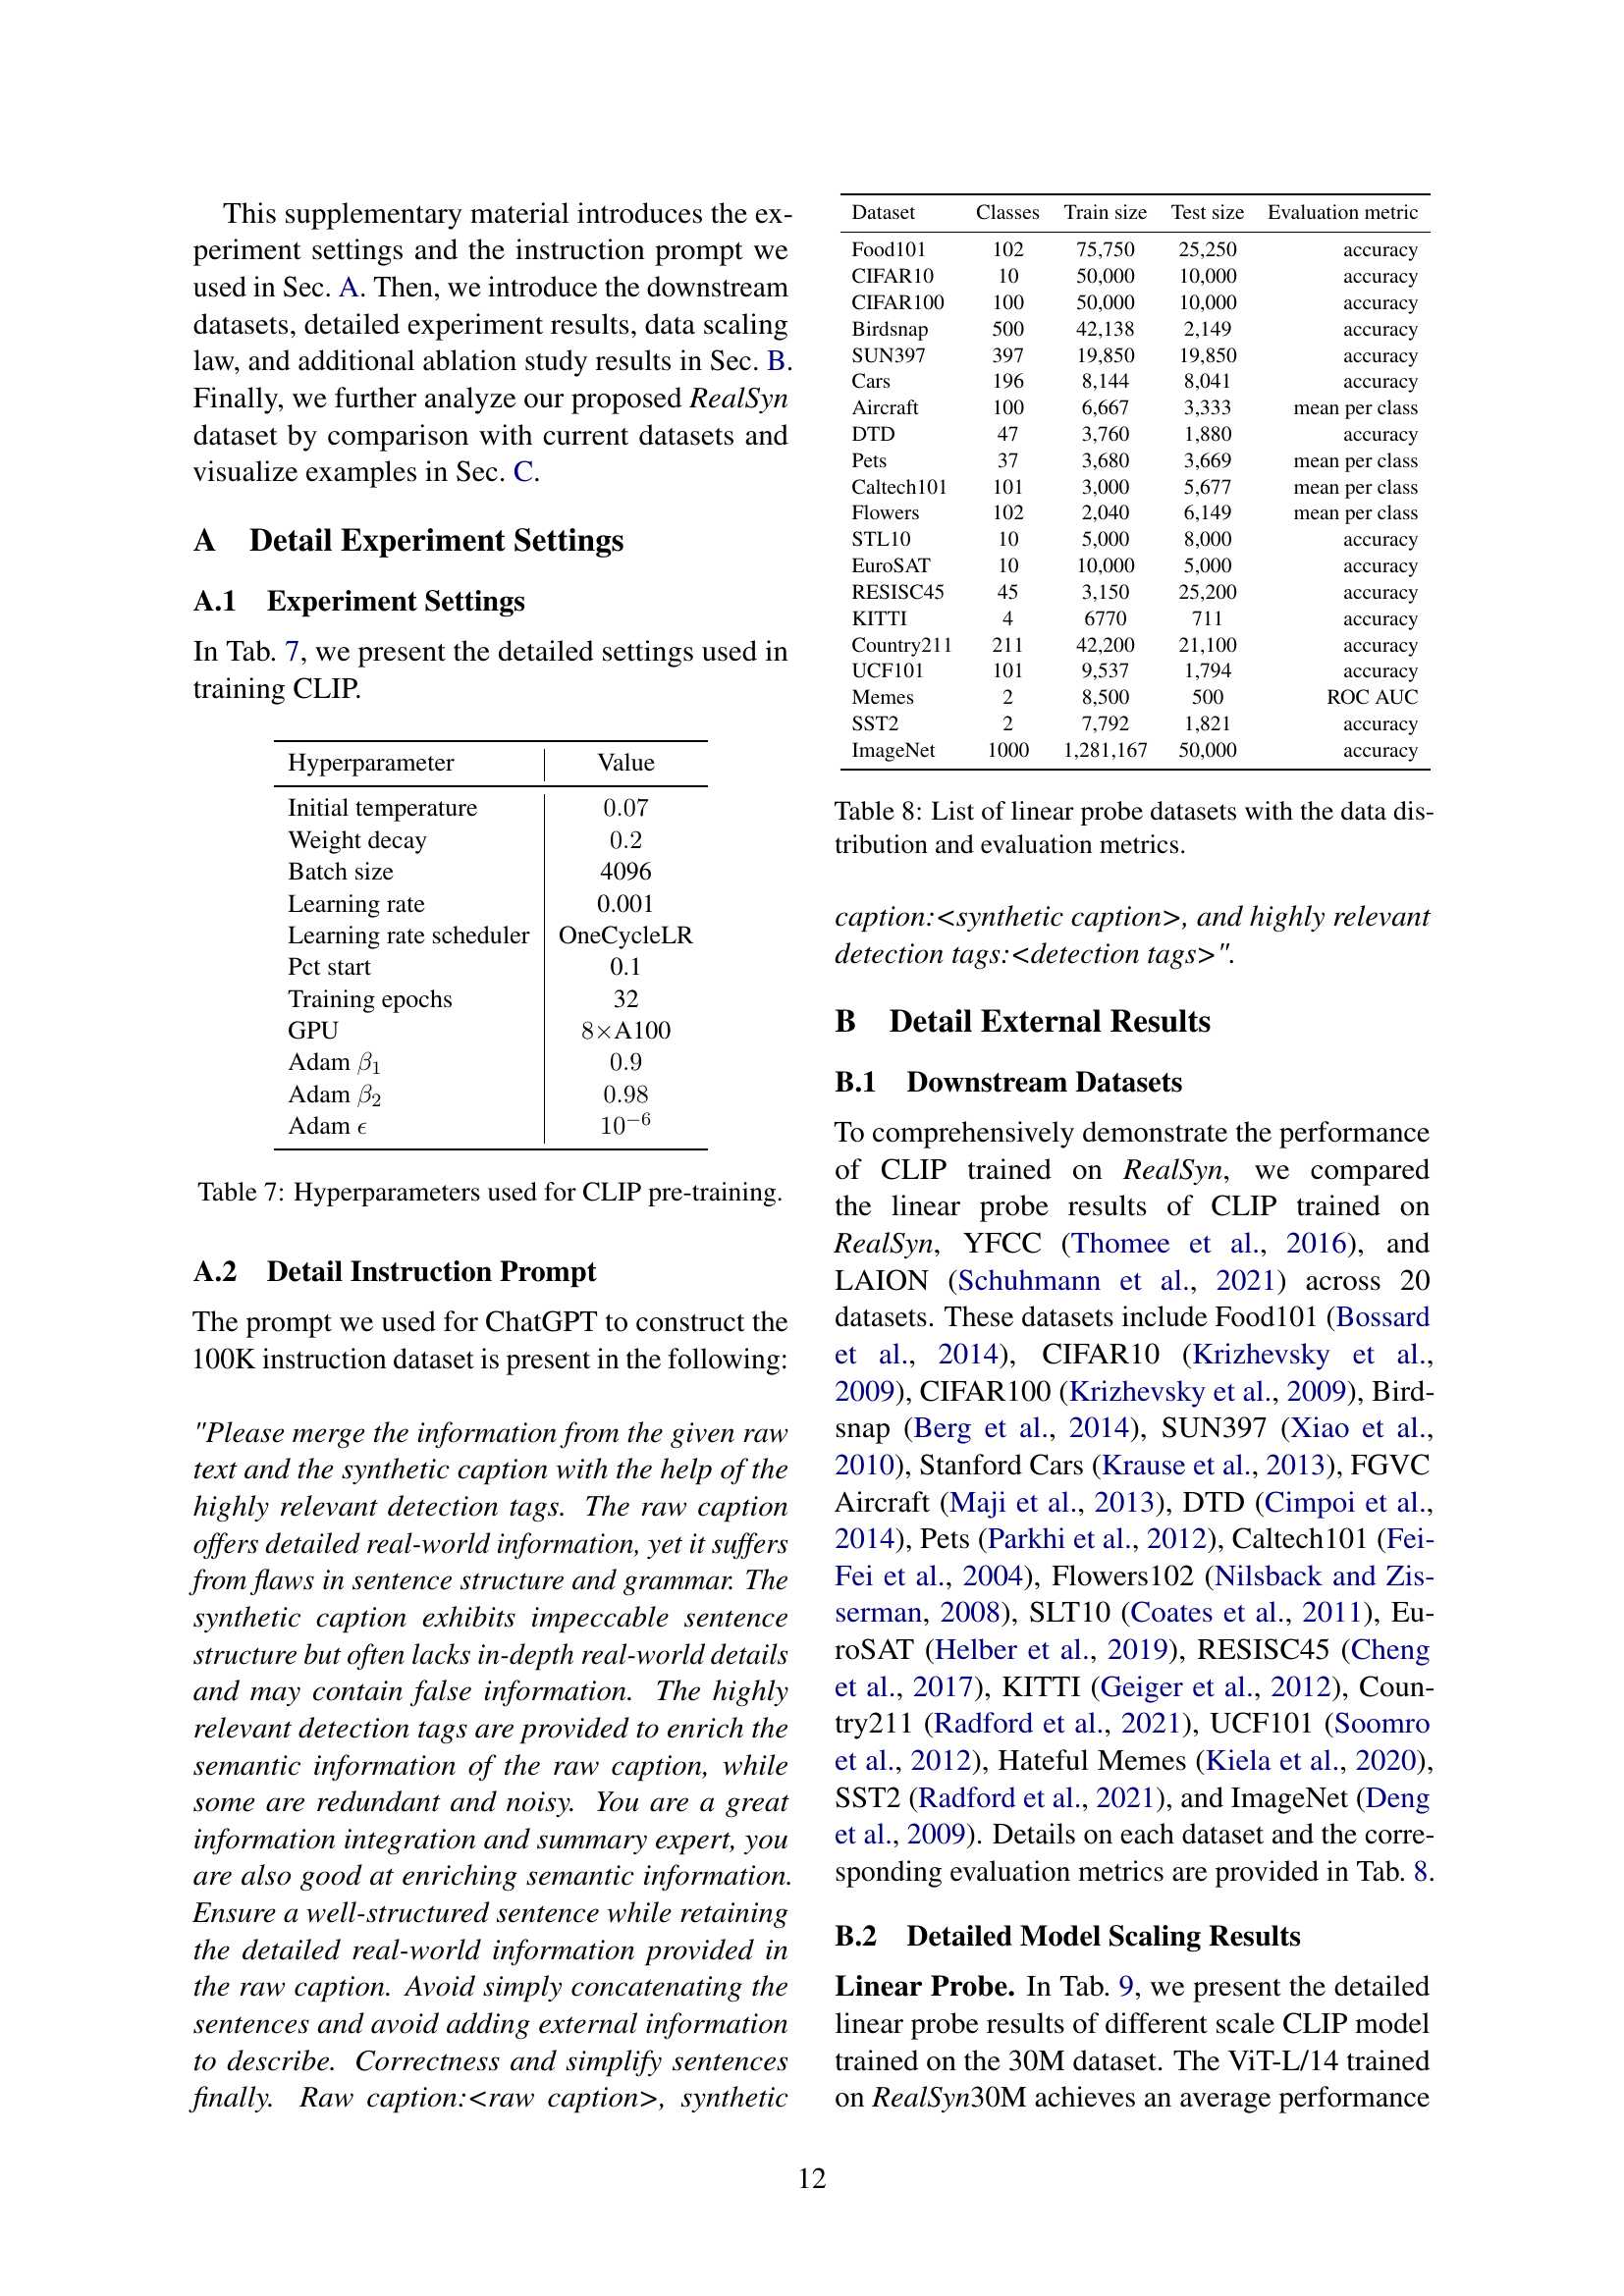
🔼 This table details the hyperparameters used during the pre-training phase of the CLIP model. It lists each hyperparameter (e.g., initial temperature, weight decay, batch size, learning rate, learning rate scheduler, and Adam optimizer settings), along with its corresponding value. These settings are crucial for reproducing the experimental results presented in the paper and understanding the model’s training process. The table provides a concise overview of the model’s training configuration.
read the caption
Table 7: Hyperparameters used for CLIP pre-training.
| Hyperparameter | Value |
| Initial temperature | |
| Weight decay | |
| Batch size | 4096 |
| Learning rate | 0.001 |
| Learning rate scheduler | OneCycleLR |
| Pct start | 0.1 |
| Training epochs | 32 |
| GPU | A100 |
| Adam | |
| Adam | |
| Adam |
🔼 This table lists the 20 downstream datasets used for the linear probe evaluation. For each dataset, it shows the number of classes, training set size, test set size, and the evaluation metric used (accuracy or mean per-class accuracy). The datasets encompass diverse visual domains, including food, objects, scenes, and more, enabling a comprehensive evaluation of model performance.
read the caption
Table 8: List of linear probe datasets with the data distribution and evaluation metrics.
| Dataset | Classes | Train size | Test size | Evaluation metric |
| Food101 | 102 | 75,750 | 25,250 | accuracy |
| CIFAR10 | 10 | 50,000 | 10,000 | accuracy |
| CIFAR100 | 100 | 50,000 | 10,000 | accuracy |
| Birdsnap | 500 | 42,138 | 2,149 | accuracy |
| SUN397 | 397 | 19,850 | 19,850 | accuracy |
| Cars | 196 | 8,144 | 8,041 | accuracy |
| Aircraft | 100 | 6,667 | 3,333 | mean per class |
| DTD | 47 | 3,760 | 1,880 | accuracy |
| Pets | 37 | 3,680 | 3,669 | mean per class |
| Caltech101 | 101 | 3,000 | 5,677 | mean per class |
| Flowers | 102 | 2,040 | 6,149 | mean per class |
| STL10 | 10 | 5,000 | 8,000 | accuracy |
| EuroSAT | 10 | 10,000 | 5,000 | accuracy |
| RESISC45 | 45 | 3,150 | 25,200 | accuracy |
| KITTI | 4 | 6770 | 711 | accuracy |
| Country211 | 211 | 42,200 | 21,100 | accuracy |
| UCF101 | 101 | 9,537 | 1,794 | accuracy |
| Memes | 2 | 8,500 | 500 | ROC AUC |
| SST2 | 2 | 7,792 | 1,821 | accuracy |
| ImageNet | 1000 | 1,281,167 | 50,000 | accuracy |
🔼 This table presents the results of a linear probe evaluation on 20 downstream datasets. The evaluation compares the performance of CLIP models pre-trained on RealSyn30M and LAION30M. The table shows the performance (likely accuracy or another relevant metric) for each dataset and model, allowing for a comparison of the effectiveness of the two datasets in pre-training CLIP models at different scales (ViT-B/32, ViT-B/16, ViT-L/14). The caption highlights that RealSyn30M consistently shows improvement over LAION30M, ranging from 1.3% to 3.0% on average.
read the caption
Table 9: Linear probe on 20 downstream datasets. Pre-training different scale CLIP models on RealSyn30M and LAION30M, achieves 1.3%-3.0% average performance improvement.
| Model | Dataset | Food101 | CIFAR10 | CIFAR100 | Birdsnap | SUN397 | Cars | Aircraft | DTD | Pets | Caltech | Flowers | STL10 | EuroSAT | RESISC45 | KITTI | Country | UCF101 | Memes | SST2 | ImageNet | Average |
| ViT-B/32 | LAION | 76.1 | 94.5 | 80.0 | 47.4 | 70.3 | 82.3 | 45.9 | 74.7 | 80.3 | 89.8 | 89.5 | 95.6 | 95.5 | 84.5 | 72.6 | 15.2 | 76.6 | 56.2 | 60.0 | 64.3 | 72.6 |
| RealSyn | 81.2 | 95.4 | 81.8 | 48.4 | 74.5 | 73.4 | 45.2 | 74.2 | 84.1 | 91.3 | 90.6 | 97.2 | 96.5 | 89.2 | 74.5 | 19.0 | 82.6 | 55.0 | 56.2 | 68.5 | 73.9 | |
| ViT-B/16 | LAION | 82.1 | 95.1 | 81.4 | 57.5 | 73.4 | 87.3 | 47.1 | 76.1 | 84.4 | 91.5 | 92.7 | 96.8 | 95.6 | 86.8 | 70.8 | 17.6 | 80.3 | 59.5 | 65.6 | 68.8 | 75.5 |
| RealSyn | 87.5 | 95.8 | 82.5 | 59.4 | 77.5 | 81.0 | 48.7 | 77.9 | 88.9 | 92.5 | 94.2 | 98.3 | 96.9 | 91.5 | 70.8 | 22.1 | 85.1 | 60.6 | 64.7 | 73.9 | 77.5 | |
| ViT-L/14 | LAION | 84.7 | 96.4 | 83.5 | 59.2 | 75.5 | 88.5 | 46.6 | 77.8 | 85.0 | 92.6 | 94.3 | 97.9 | 95.9 | 88.0 | 71.7 | 18.7 | 81.1 | 58.6 | 64.6 | 71.2 | 76.6 |
| RealSyn | 90.3 | 97.5 | 86.2 | 64.3 | 79.7 | 83.6 | 51.4 | 79.6 | 90.0 | 94.5 | 94.8 | 98.9 | 96.6 | 92.7 | 73.8 | 25.0 | 86.4 | 63.8 | 66.1 | 76.7 | 79.6 | |
🔼 This table presents the results of zero-shot transfer learning experiments across 20 diverse downstream datasets. Two different large-scale pre-trained CLIP models (ViT-B/32 and ViT-L/14) were evaluated after being pre-trained on either the RealSyn30M or LAION30M datasets. The results showcase the performance improvements achieved by using the RealSyn30M dataset for pre-training compared to using the LAION30M dataset. The improvements range from 3.5% to 5.5% on average across the various downstream tasks, highlighting the effectiveness of RealSyn30M in improving transfer learning capabilities across a wide spectrum of visual recognition tasks.
read the caption
Table 10: Zero-shot transfer on 20 downstream datasets. Pre-training different scale CLIP models on RealSyn30M and LAION30M, achieves 3.5%-5.5% average performance improvement.
| Model | Dataset | Food101 | CIFAR10 | CIFAR100 | Birdsnap | SUN397 | Cars | Aircraft | DTD | Pets | Caltech | Flowers | STL10 | EuroSAT | RESISC45 | KITTI | Country | UCF101 | Memes | SST2 | ImageNet | Average |
| ViT-B/32 | LAION | 58.9 | 85.9 | 63.1 | 17.4 | 54.8 | 61.0 | 4.3 | 36.4 | 65.5 | 82.0 | 41.3 | 91.3 | 40.3 | 43.7 | 24.3 | 7.2 | 47.4 | 51.5 | 50.1 | 44.9 | 48.6 |
| RealSyn | 67.5 | 89.0 | 65.2 | 15.0 | 60.6 | 39.2 | 7.9 | 37.8 | 70.5 | 84.0 | 42.2 | 93.8 | 59.9 | 61.9 | 27.7 | 10.6 | 56.7 | 52.5 | 50.1 | 50.9 | 52.1 | |
| ViT-B/16 | LAION | 67.6 | 89.1 | 63.5 | 20.8 | 55.7 | 66.9 | 5.4 | 39.0 | 70.2 | 84.9 | 42.9 | 94.3 | 31.1 | 45.4 | 34.0 | 8.7 | 52.2 | 54.5 | 50.6 | 49.4 | 51.3 |
| RealSyn | 75.8 | 89.6 | 64.7 | 18.9 | 64.3 | 48.2 | 7.9 | 41.2 | 76.0 | 87.5 | 45.2 | 95.1 | 56.8 | 64.3 | 27.1 | 13.1 | 59.1 | 54.5 | 54.0 | 55.9 | 54.9 | |
| ViT-L/14 | LAION | 70.8 | 88.8 | 69.5 | 22.8 | 61.6 | 69.7 | 4.9 | 40.8 | 68.0 | 87.3 | 42.2 | 95.3 | 41.5 | 53.7 | 25.9 | 10.4 | 54.7 | 54.1 | 51.8 | 51.5 | 53.3 |
| RealSyn | 80.7 | 94.1 | 73.1 | 20.9 | 66.4 | 53.6 | 10.1 | 48.1 | 72.8 | 89.4 | 49.8 | 96.2 | 68.5 | 70.1 | 32.2 | 15.3 | 63.9 | 54.1 | 56.9 | 59.5 | 58.8 | |
🔼 This table presents a comparison of zero-shot robustness across different CLIP models (ViT-B/32, ViT-B/16, ViT-L/14) trained on RealSyn30M and LAION30M datasets. The zero-shot robustness is evaluated on various image datasets (IN-V2, IN-A, IN-R, ObjectNet, IN-Sketch). The results show that models pre-trained on RealSyn30M consistently outperform those trained on LAION30M, demonstrating a significant improvement in robustness. The average performance improvement ranges from 4.2% to 8.6%, highlighting the effectiveness of the RealSyn dataset in enhancing model robustness.
read the caption
Table 11: Zero-shot robustness comparison. Pre-training different scale CLIP models on RealSyn30M and LAION30M, achieves 4.2%-8.6% average performance improvement.
| Model | Dataset | IN-V2 | IN-A | IN-R | ObjectNet | IN-Sketch | Average |
| ViT-B/32 | LAION | 37.5 | 8.9 | 54.4 | 35.5 | 31.8 | 33.6 |
| RealSyn | 42.9 | 16.1 | 56.5 | 41.5 | 31.9 | 37.8 | |
| ViT-B/16 | LAION | 42.4 | 12.8 | 60.3 | 40.2 | 34.8 | 38.1 |
| RealSyn | 48.0 | 24.1 | 63.1 | 46.7 | 36.8 | 43.8 | |
| ViT-L/14 | LAION | 45.1 | 17.1 | 64.9 | 43.1 | 39.0 | 41.8 |
| RealSyn | 52.8 | 34.7 | 71.6 | 50.4 | 42.4 | 50.4 | |
🔼 This table presents the results of a linear probe evaluation on 12 downstream datasets. The experiment involved pre-training a CLIP model using ResNet50 as the image encoder. The model was trained on image-text pairs, and the table shows the performance (likely accuracy) achieved on each of the 12 different tasks after this pre-training. A 2.1% average performance improvement is reported compared to some baseline.
read the caption
Table 12: Linear probe on 12 downstream datasets. Pre-training CLIP (ResNet50) on image-text pairs achieves 2.1% performance improvement.
| Model | Method | Food101 | CIFAR10 | CIFAR100 | Birdsnap | SUN397 | Cars | Aircraft | VOC2007 | DTD | Pets | Caltech101 | Flowers | Average |
| ResNet50 | SimCLR | 68.4 | 90.6 | 71.6 | 37.4 | 58.8 | 50.3 | 50.3 | 80.5 | 74.5 | 83.6 | 90.3 | 91.2 | 70.6 |
| Real&Syn Texts | 72.5 | 89.1 | 69.0 | 57.1 | 63.6 | 51.4 | 48.1 | 85.5 | 69.7 | 90.5 | 88.1 | 88.8 | 72.7 | |
🔼 This table compares RealSyn with other large-scale image-text datasets used for pre-training vision-language models. It shows the number of images, average number of tokens per image, average number of texts per image, the type of text (realistic or synthetic), and the source of the data for each dataset. The datasets compared are CC12M, YFCC15M, CapsFusion, LAION400M, and three variations of RealSyn (15M, 30M, and 100M). This allows for a direct comparison of dataset characteristics and helps to understand the relative size and composition of RealSyn in the context of existing datasets.
read the caption
Table 13: Current Dataset Comparison. Comparison with large-scale image-text pre-training datasets.
| Dataset | #Images | #Avg Tokens Image | #Avg Texts Image | Text Type | Source Type |
| CC12M | 1 | Realistic | Website | ||
| YFCC15M | 16 | 1 | Realistic | Website | |
| CapsFusion | 1 | Synthetic | Image-Text Pair | ||
| LAION400M | 27 | 1 | Realistic | Website | |
| RealSyn15M | 40 | 4 | Realistic & Synthetic | Interleaved Image-Text | |
| RealSyn30M | 38 | 4 | Realistic & Synthetic | Interleaved Image-Text | |
| RealSyn100M | 36 | 4 | Realistic & Synthetic | Interleaved Image-Text |
🔼 Table 14 presents ablation study results focusing on the impact of different text types within the RealSyn15M dataset. It compares the performance of models trained using varying combinations of realistic texts (retrieved from the dataset) and synthetic texts (generated by the model, augmented with image semantics). This allows researchers to isolate the contributions of each text type to model performance. The results show the effects of using different numbers of realistic and synthetic texts in the training process.
read the caption
Table 14: Ablation experiment results using different types of text on RealSyn15M. Trksubscriptsuperscript𝑇𝑘𝑟T^{k}_{r}italic_T start_POSTSUPERSCRIPT italic_k end_POSTSUPERSCRIPT start_POSTSUBSCRIPT italic_r end_POSTSUBSCRIPT: the k𝑘kitalic_k-th retrieved semantic relevant realistic text. Tsksubscriptsuperscript𝑇𝑘𝑠T^{k}_{s}italic_T start_POSTSUPERSCRIPT italic_k end_POSTSUPERSCRIPT start_POSTSUBSCRIPT italic_s end_POSTSUBSCRIPT: the image semantic augmented synthetic text for Trksubscriptsuperscript𝑇𝑘𝑟T^{k}_{r}italic_T start_POSTSUPERSCRIPT italic_k end_POSTSUPERSCRIPT start_POSTSUBSCRIPT italic_r end_POSTSUBSCRIPT.
Full paper#