TL;DR#
Deep learning in remote sensing image change detection (CD) faces challenges such as limited open-source datasets and inconsistent detection results across varying change areas. Existing algorithms struggle with highly dynamic change areas, as they rely on single-phase training approaches which degrade when addressing scenarios with wide variations in change areas, ranging from no change to complete change.
This paper introduces the JL1-CD dataset, which contains 5,000 pairs of high-resolution images with diverse change scenarios. To improve performance in the diverse dataset, the paper presents a multi-teacher knowledge distillation (MTKD) framework with the O-P strategy, where models trained on partitions are served as teachers. The student model achieves superior detection accuracy under the supervision of multiple teachers, establishing new state-of-the-art (SOTA) results.
Key Takeaways#
Why does it matter?#
This research introduces the JL1-CD dataset, offering high-resolution, diverse change scenarios for remote sensing. The MTKD framework enhances CD model performance without increasing computational cost, setting a new baseline and inspiring further exploration of knowledge distillation techniques.
Visual Insights#

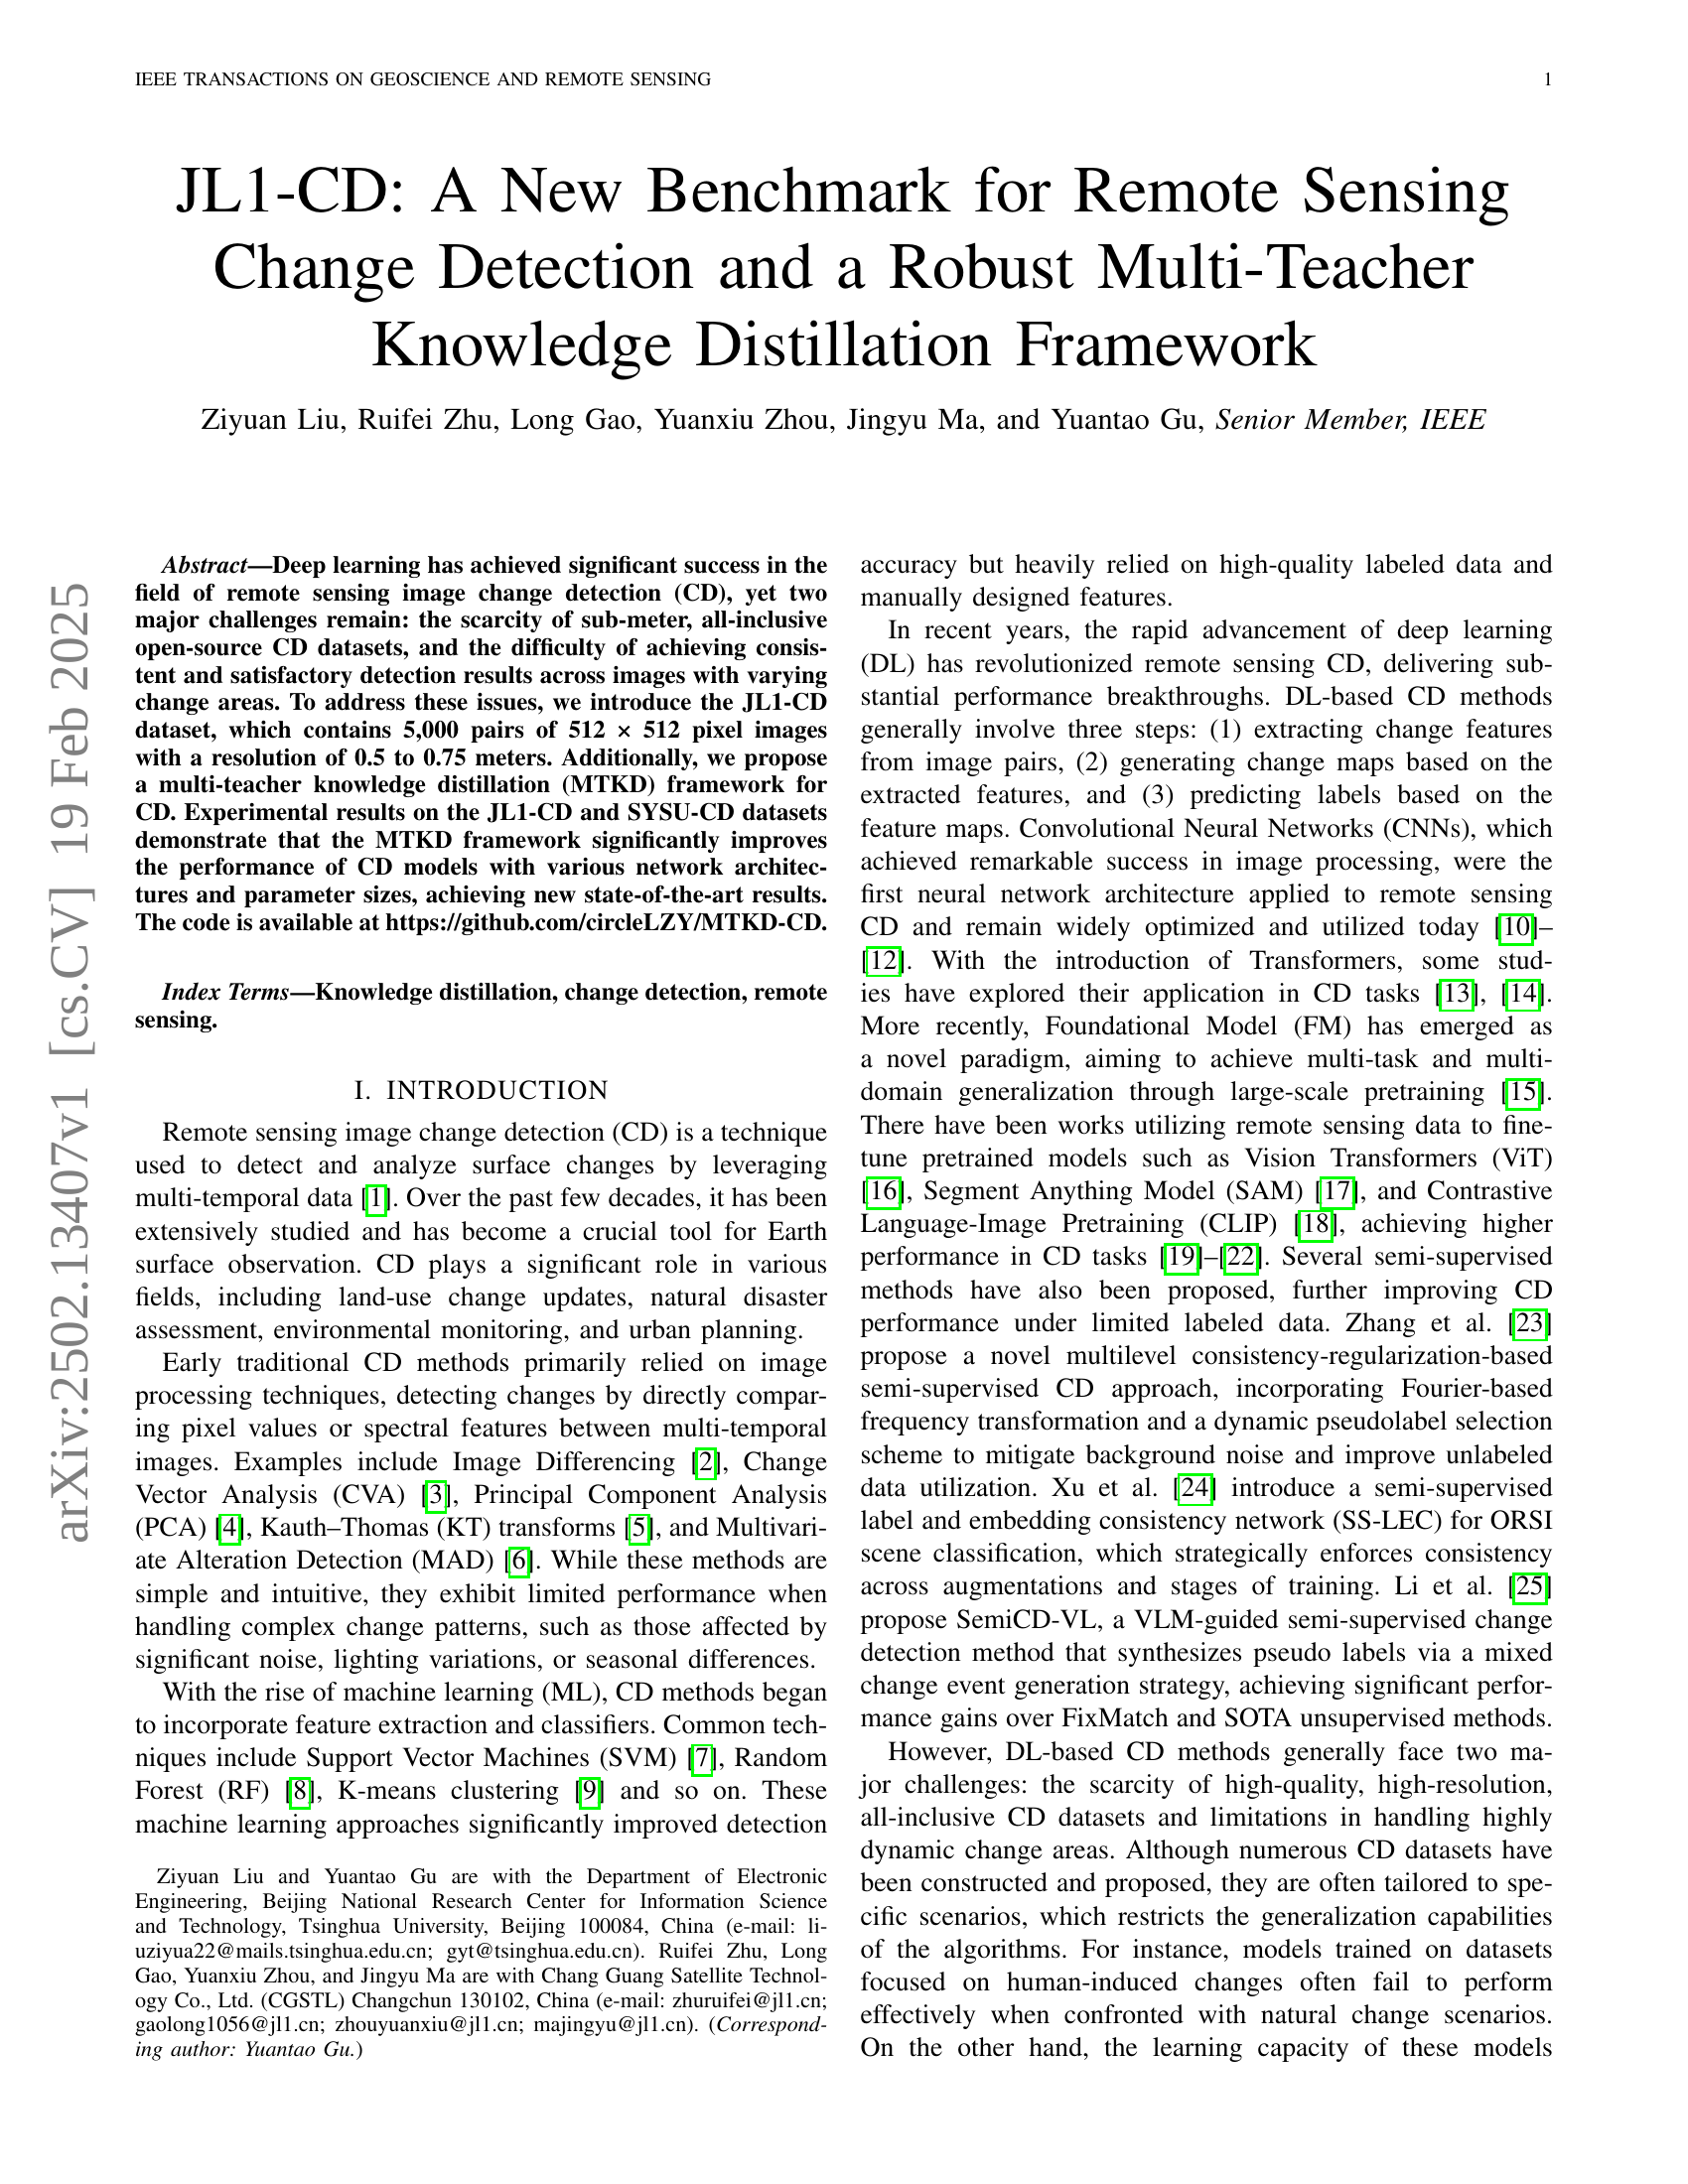
🔼 This figure shows a timeline summarizing the evolution of deep learning-based change detection (CD) methods in remote sensing. It highlights key methods and the year they were introduced, illustrating the rapid advancements in the field over time. The timeline visually represents the progression of algorithms, from early convolutional neural network (CNN)-based approaches to more recent transformer-based and foundational model (FM)-based techniques.
read the caption
Figure 1: Timeline of the development of mainstream DL-based CD methods.
| Dataset | Class | Image Pairs | Image Size | Resolution | ||
|---|---|---|---|---|---|---|
| SZTAKI[46] | 1 | 13 | 1.5 | |||
| DSIFN[31] | 1 | 394 | 512 × 512 | 2 | ||
| SECOND[39] | 6 | 4,662 | 512 × 512 | 0.5-3 | ||
| WHU-CD[47] | 1 | 1 | 32,20 × 15,354 | 0.2 | ||
| LEVIR-CD[32] | 1 | 637 | 1,024 × 1,024 | 0.3 | ||
| S2Looking[48] | 1 | 5,000 | 1,024 × 1,024 | 0.5-0.8 | ||
| CDD[49] | 1 | 16,000 | 256 × 256 | 0.03-1 | ||
| SYSU-CD[50] | 1 | 20,000 | 256 × 256 | 0.5 | ||
| JL1-CD | 1 | 5,000 | 512 × 512 | 0.5-0.75 |
🔼 This table presents a comparison of several open-source change detection (CD) datasets, highlighting key characteristics such as the number of classes, image pairs, image size, and resolution. It also introduces the JL1-CD dataset, a new dataset proposed in this paper, and compares its features to the existing ones. This allows readers to understand the context and relative size/quality of the JL1-CD dataset compared to other publicly available datasets.
read the caption
TABLE I: Information of Open-Source CD Datasets and the Proposed JL1-CD Dataset
In-depth insights#
New JL1-CD Dataset#
The authors introduce the JL1-CD dataset to address limitations in existing remote sensing change detection datasets. JL1-CD aims to offer high-resolution, all-inclusive data for improved DL algorithm development. The dataset comprises 5,000 pairs of 512x512 images with 0.5-0.75 meter resolution, captured in China. Unlike many datasets focused on human-induced changes, JL1-CD encompasses diverse natural changes (forests, water). Data split of 4,000 training and 1,000 testing pairs ensures enough data for training. Availability of the JL1-CD dataset aims to foster progress in CD research, addressing current dataset shortcomings.
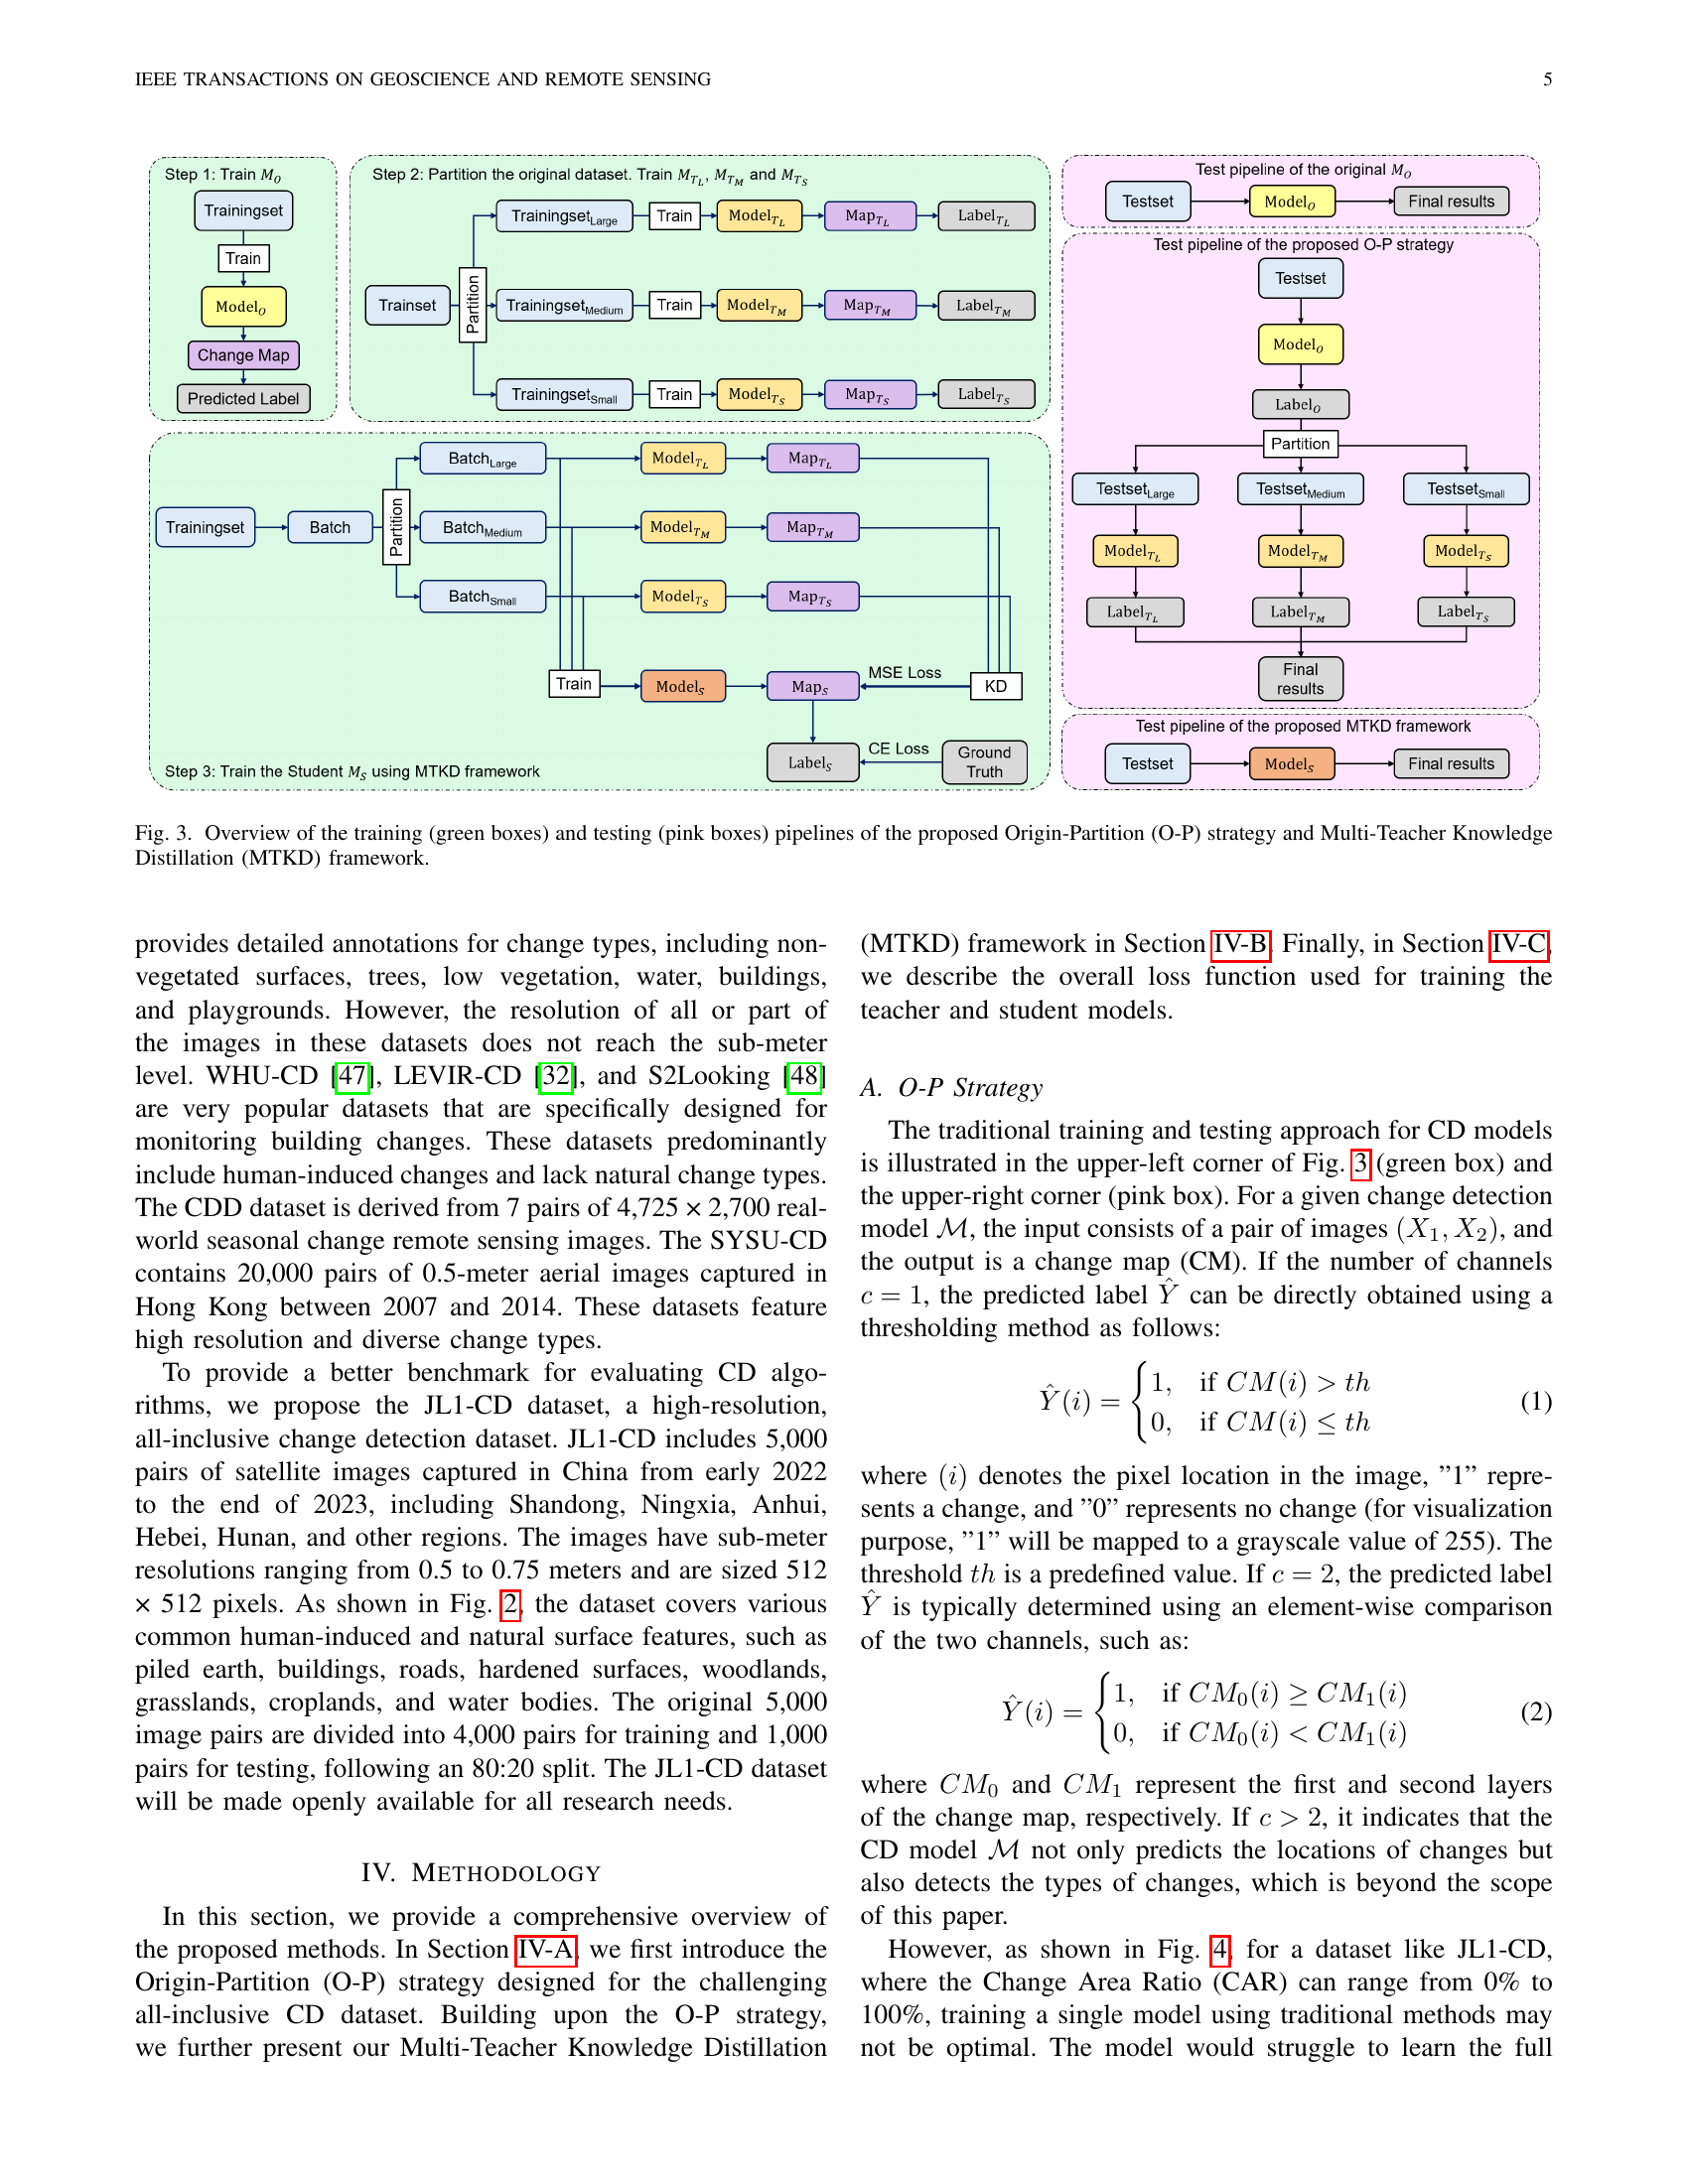
O-P Train Strategy#
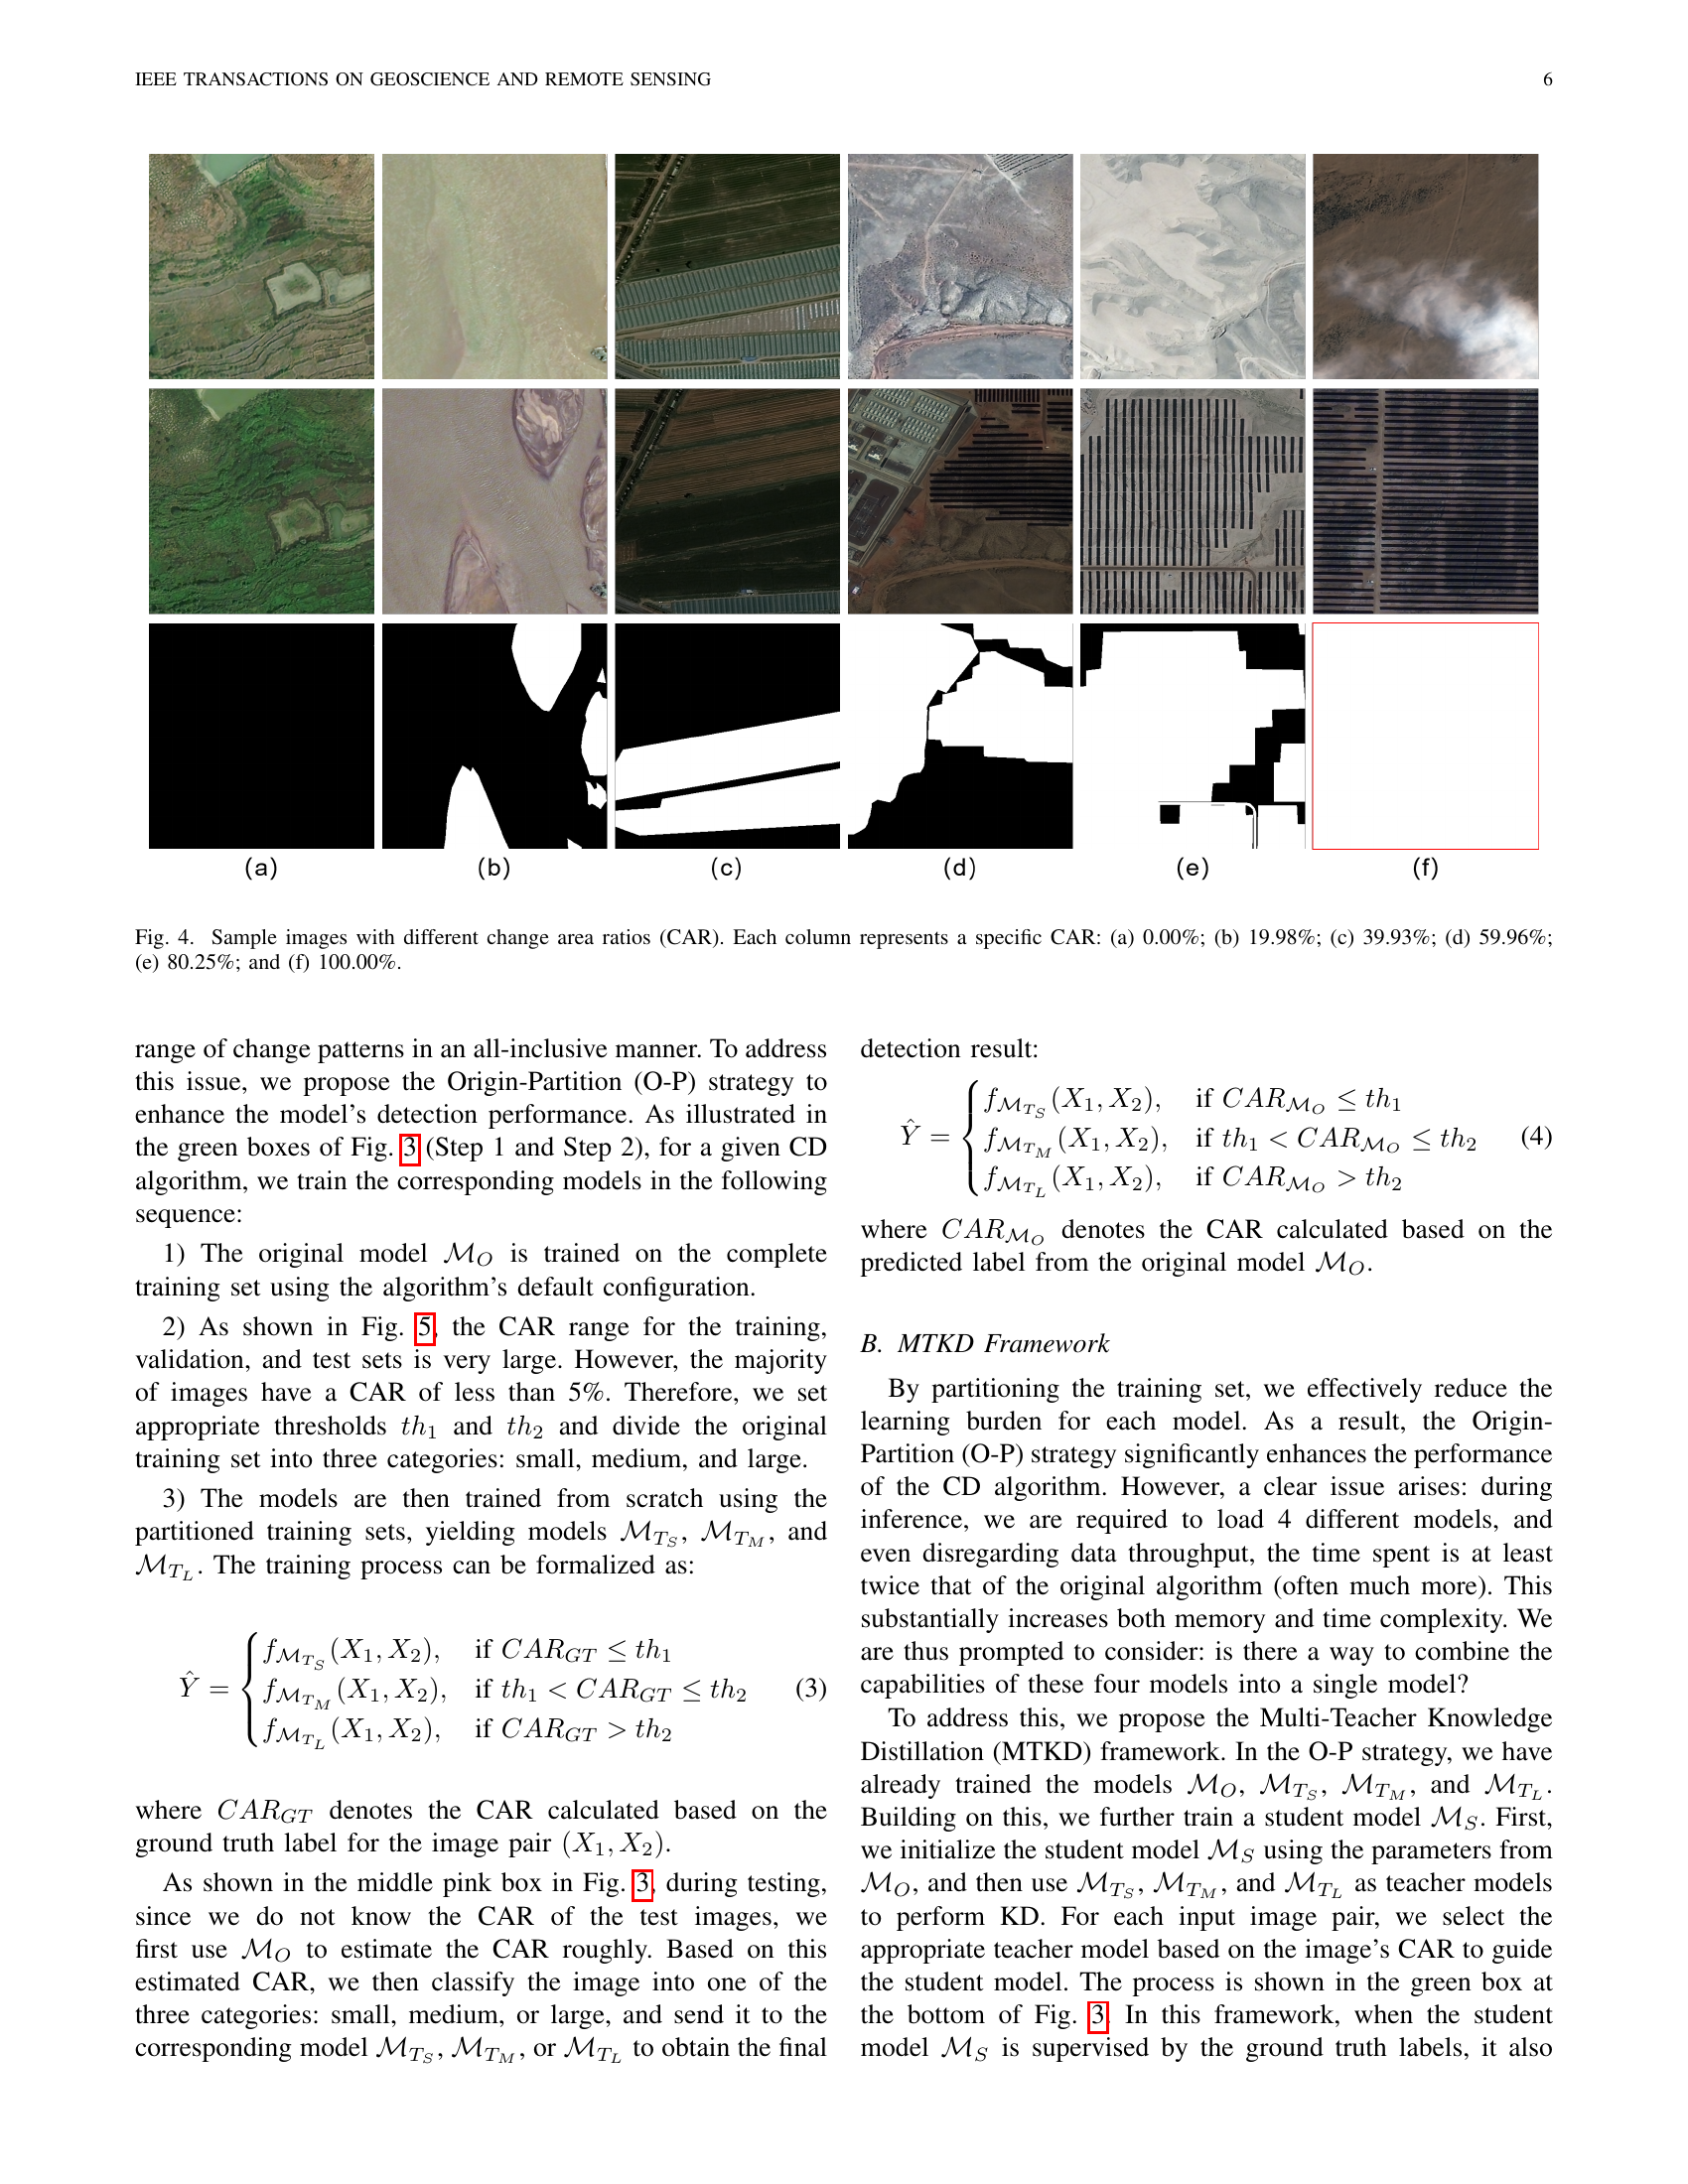
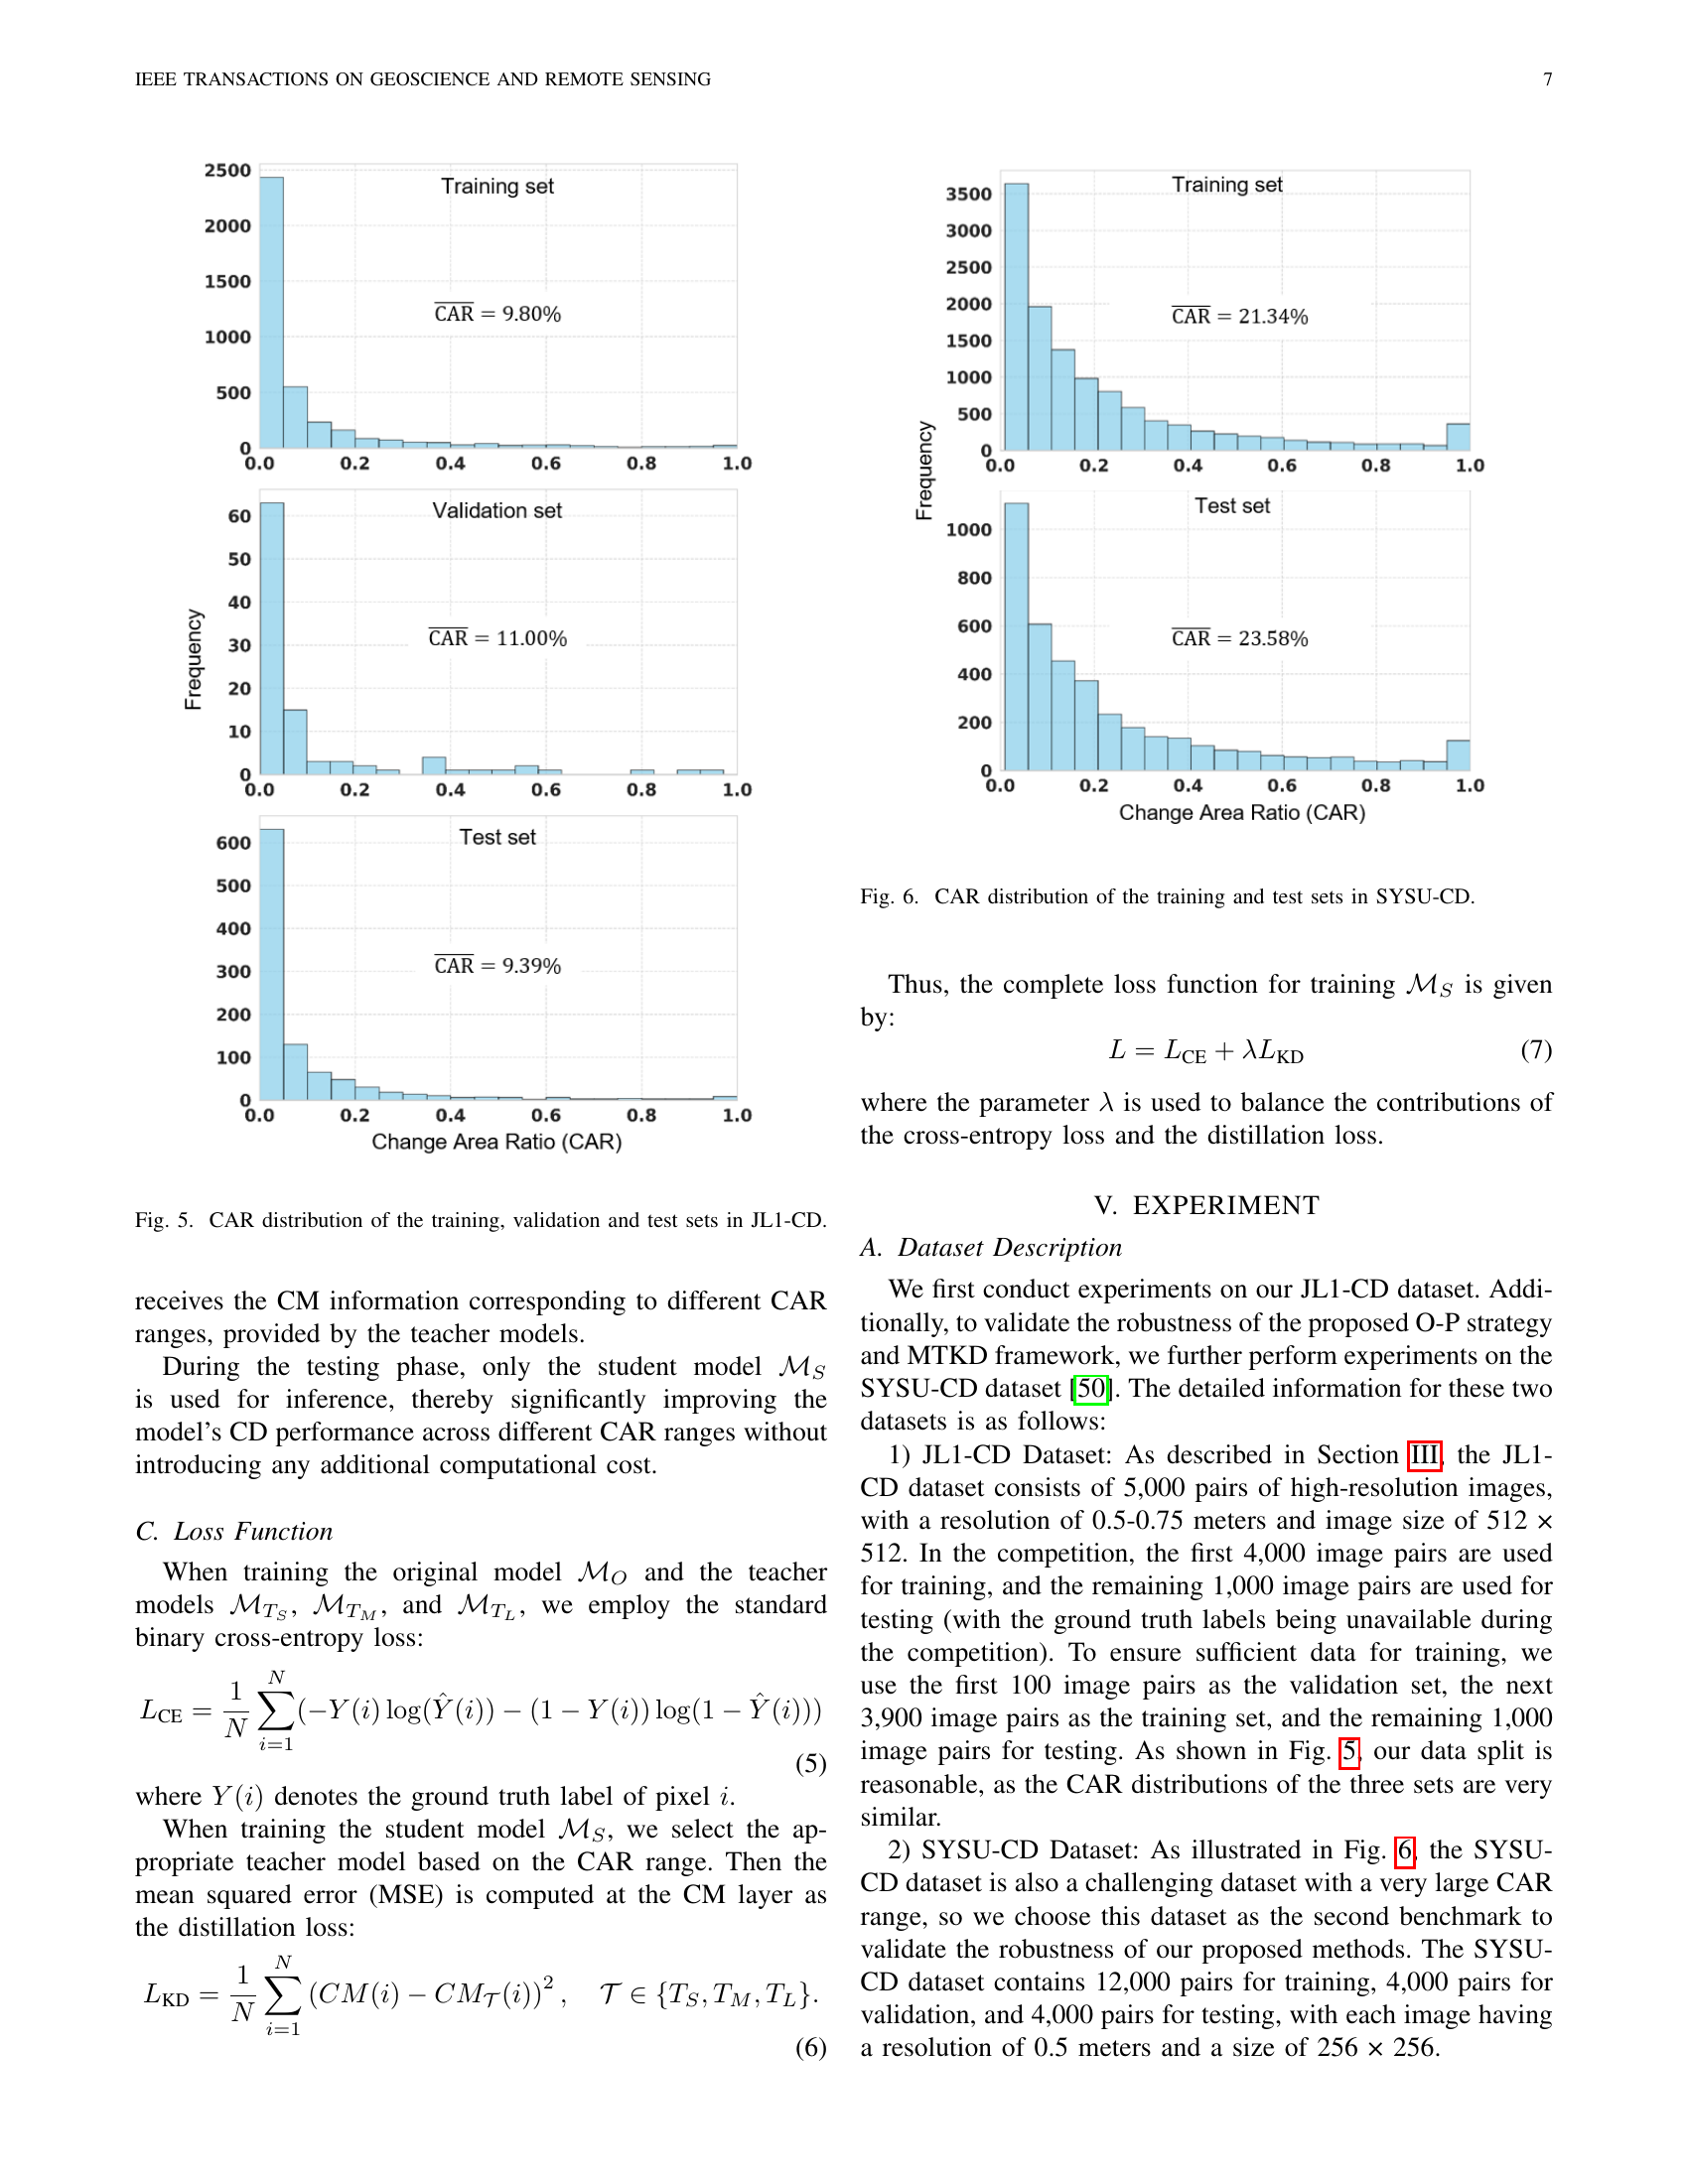
The Origin-Partition (O-P) training strategy addresses challenges in change detection datasets with wide-ranging Change Area Ratios (CAR). Traditional methods struggle with such diversity, so O-P divides the training data based on CAR levels (small, medium, large) to train specialized models. This approach reduces the learning burden on individual models, enhancing detection accuracy across diverse change scenarios. During inference, a coarse CAR estimation determines which specialized model is used, optimizing detection. The O-P strategy is particularly effective for datasets like JL1-CD, where CAR varies significantly, improving overall performance.
Multi-Teacher MTKD#
The Multi-Teacher Knowledge Distillation (MTKD) framework is a promising approach for enhancing change detection (CD) model performance, particularly in scenarios with diverse change patterns. MTKD leverages the collective knowledge of multiple “teacher” models, each trained on different subsets of the data or with different configurations, to guide the training of a single “student” model. This allows the student model to learn from a more comprehensive and robust representation of the data, leading to improved generalization and accuracy. The key idea is that each teacher model captures different aspects of the underlying data distribution, and by combining their knowledge, the student model can achieve superior performance compared to models trained in isolation. A crucial aspect of MTKD is the selection of appropriate teacher models and the design of an effective distillation strategy. The teachers should be diverse enough to provide complementary information but also sufficiently accurate to avoid transferring noise or biases to the student. The distillation process itself can involve various techniques, such as minimizing the distance between the teacher and student model outputs or feature representations. The MTKD framework is an effective approach to improve the performance of CD models by leveraging the strengths of multiple teachers, leading to improved generalization and accuracy. This approach also has the potential to be extended to other remote sensing tasks and other knowledge distillation frameworks.
CAR Perf. Analysis#
Analyzing change detection models across varying Change Area Ratios (CAR) unveils nuanced performance behaviors. Models optimized for general datasets often struggle with images exhibiting extreme CAR values (either very low or very high). The O-P strategy aims to mitigate this by partitioning training data based on CAR, fostering specialized models. MTKD further refines this by distilling knowledge from these specialized ’teacher’ models into a single ‘student’ model, potentially boosting detection accuracy, particularly for subtle changes. Observed performance trends suggest that O-P and MTKD can significantly enhance detection accuracy for images with low CARs, indicating improved sensitivity to minor changes. However, performance may decrease for images with very high CARs, necessitating further investigation into how these strategies handle complete change scenarios. Overall, understanding CAR-specific performance is crucial for deploying change detection models effectively, and adaptive training strategies like O-P and MTKD offer promising avenues for improvement. The graphs presented provide valuable visualization for analyzing CAR performance in change detection models.
Robustness Tests#
The ‘Robustness Tests’ section typically aims to validate the reliability and consistency of a proposed method across varying conditions or settings. It often involves evaluating performance with different datasets, parameter settings, or noise levels to assess the method’s generalization ability. Furthermore, it may test the sensitivity of key parameters or analyze performance under extreme or atypical scenarios. By demonstrating consistent and acceptable results under diverse conditions, robustness tests bolster confidence in the method’s real-world applicability and highlight its limitations. The aim is to provide a comprehensive understanding of the method’s strengths and weaknesses beyond the specific experimental setup, offering insights into its practical utility.
More visual insights#
More on figures

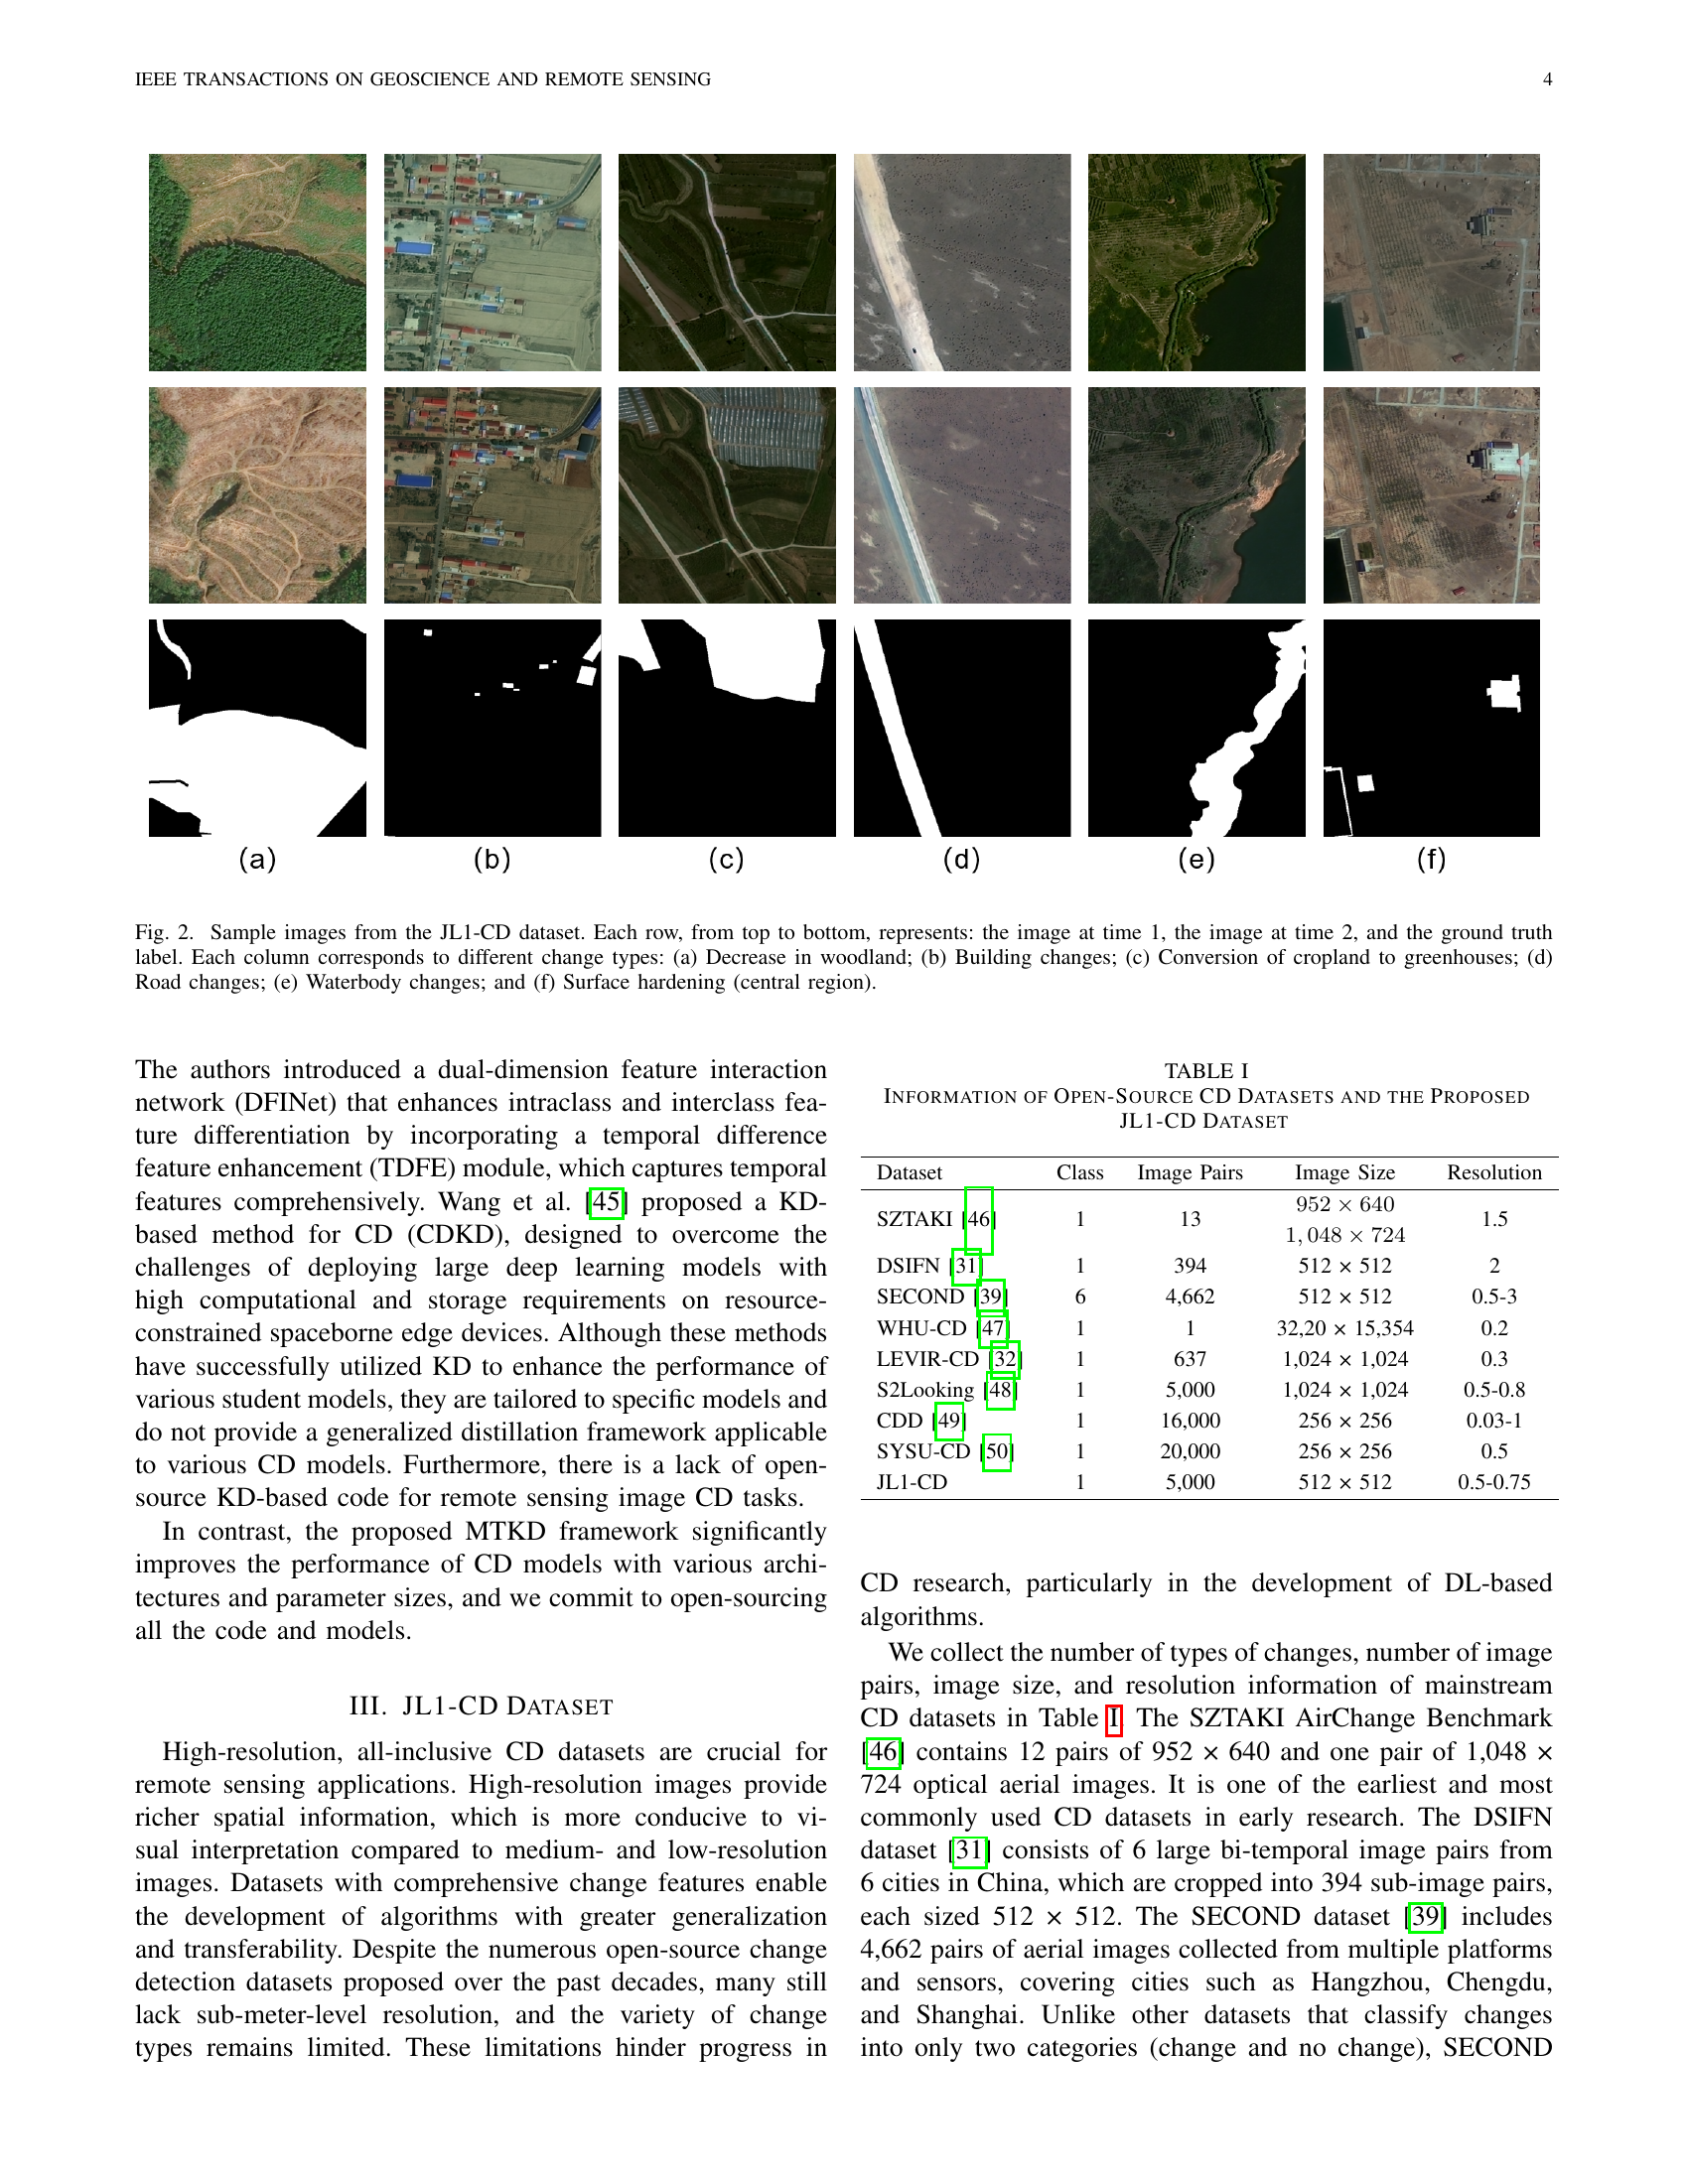
🔼 Figure 2 presents sample images from the JL1-CD dataset, a new benchmark dataset for remote sensing change detection. Each row shows a pair of images acquired at two different times (Time 1 and Time 2) along with the corresponding ground truth change mask, which highlights the changed areas. The six columns showcase six distinct change types frequently observed in remote sensing imagery: (a) decrease in woodland, showing deforestation or natural dieback; (b) building changes, depicting construction, demolition, or modification of structures; (c) conversion of cropland to greenhouses, indicating changes in land use; (d) road changes, such as road construction, widening, or other modifications; (e) waterbody changes, which may involve changes in lake size, river flow, or the appearance of new water bodies; and (f) surface hardening, showing areas where natural surfaces like soil or vegetation have been paved or otherwise hardened.
read the caption
Figure 2: Sample images from the JL1-CD dataset. Each row, from top to bottom, represents: the image at time 1, the image at time 2, and the ground truth label. Each column corresponds to different change types: (a) Decrease in woodland; (b) Building changes; (c) Conversion of cropland to greenhouses; (d) Road changes; (e) Waterbody changes; and (f) Surface hardening (central region).

🔼 Figure 3 illustrates the workflows for training and testing change detection models using two proposed methods: Origin-Partition (O-P) and Multi-Teacher Knowledge Distillation (MTKD). The O-P strategy initially trains a model on the full dataset, then partitions the data based on the Change Area Ratio (CAR) to train specialized models for different CAR levels (small, medium, large). The MTKD framework builds upon O-P by training a student model that learns from these specialized models (teachers) using knowledge distillation. The student model benefits from the strengths of each teacher but requires only a single inference step, improving efficiency. The figure visually distinguishes training steps (green boxes) from testing steps (pink boxes) for both strategies.
read the caption
Figure 3: Overview of the training (green boxes) and testing (pink boxes) pipelines of the proposed Origin-Partition (O-P) strategy and Multi-Teacher Knowledge Distillation (MTKD) framework.

🔼 Figure 4 displays a series of image pairs illustrating varying change area ratios (CARs) within the JL1-CD dataset. Each row presents a different scene, showcasing the evolution from a completely unchanged area (0% CAR) to an area with a complete change (100% CAR). Intermediate columns show progressive increases in CAR. This figure visually demonstrates the diverse range of change levels present in the dataset and highlights the challenge of creating a change detection model robust enough to handle such variation. The images illustrate different types of changes such as land cover shifts, construction, and deforestation.
read the caption
Figure 4: Sample images with different change area ratios (CAR). Each column represents a specific CAR: (a) 0.00%; (b) 19.98%; (c) 39.93%; (d) 59.96%; (e) 80.25%; and (f) 100.00%.

🔼 This figure shows the distribution of Change Area Ratio (CAR) values across the training, validation, and test sets of the JL1-CD dataset. The x-axis represents the CAR, ranging from 0.0 to 1.0, and the y-axis represents the frequency of images with that CAR. The distributions are shown as histograms, with separate plots for each set. This visualization helps to understand the balance of different change amounts in the dataset, which is important for evaluating the performance of change detection models. For example, a dataset with a large proportion of images with low CAR values may favor models that perform well on detecting minor changes but not necessarily major changes.
read the caption
Figure 5: CAR distribution of the training, validation and test sets in JL1-CD.

🔼 Figure 6 is a histogram showing the distribution of Change Area Ratio (CAR) values in the training and test sets of the SYSU-CD dataset. The x-axis represents the CAR, ranging from 0 to 1 (or 0% to 100%), indicating the proportion of changed pixels in an image. The y-axis represents the frequency of images with a given CAR value. Separate histograms are provided for the training and testing sets, allowing for a comparison of CAR distribution between the two sets used in the training and testing of models for change detection. The figure helps to visualize the range and frequency of different change magnitudes within the SYSU-CD dataset.
read the caption
Figure 6: CAR distribution of the training and test sets in SYSU-CD.

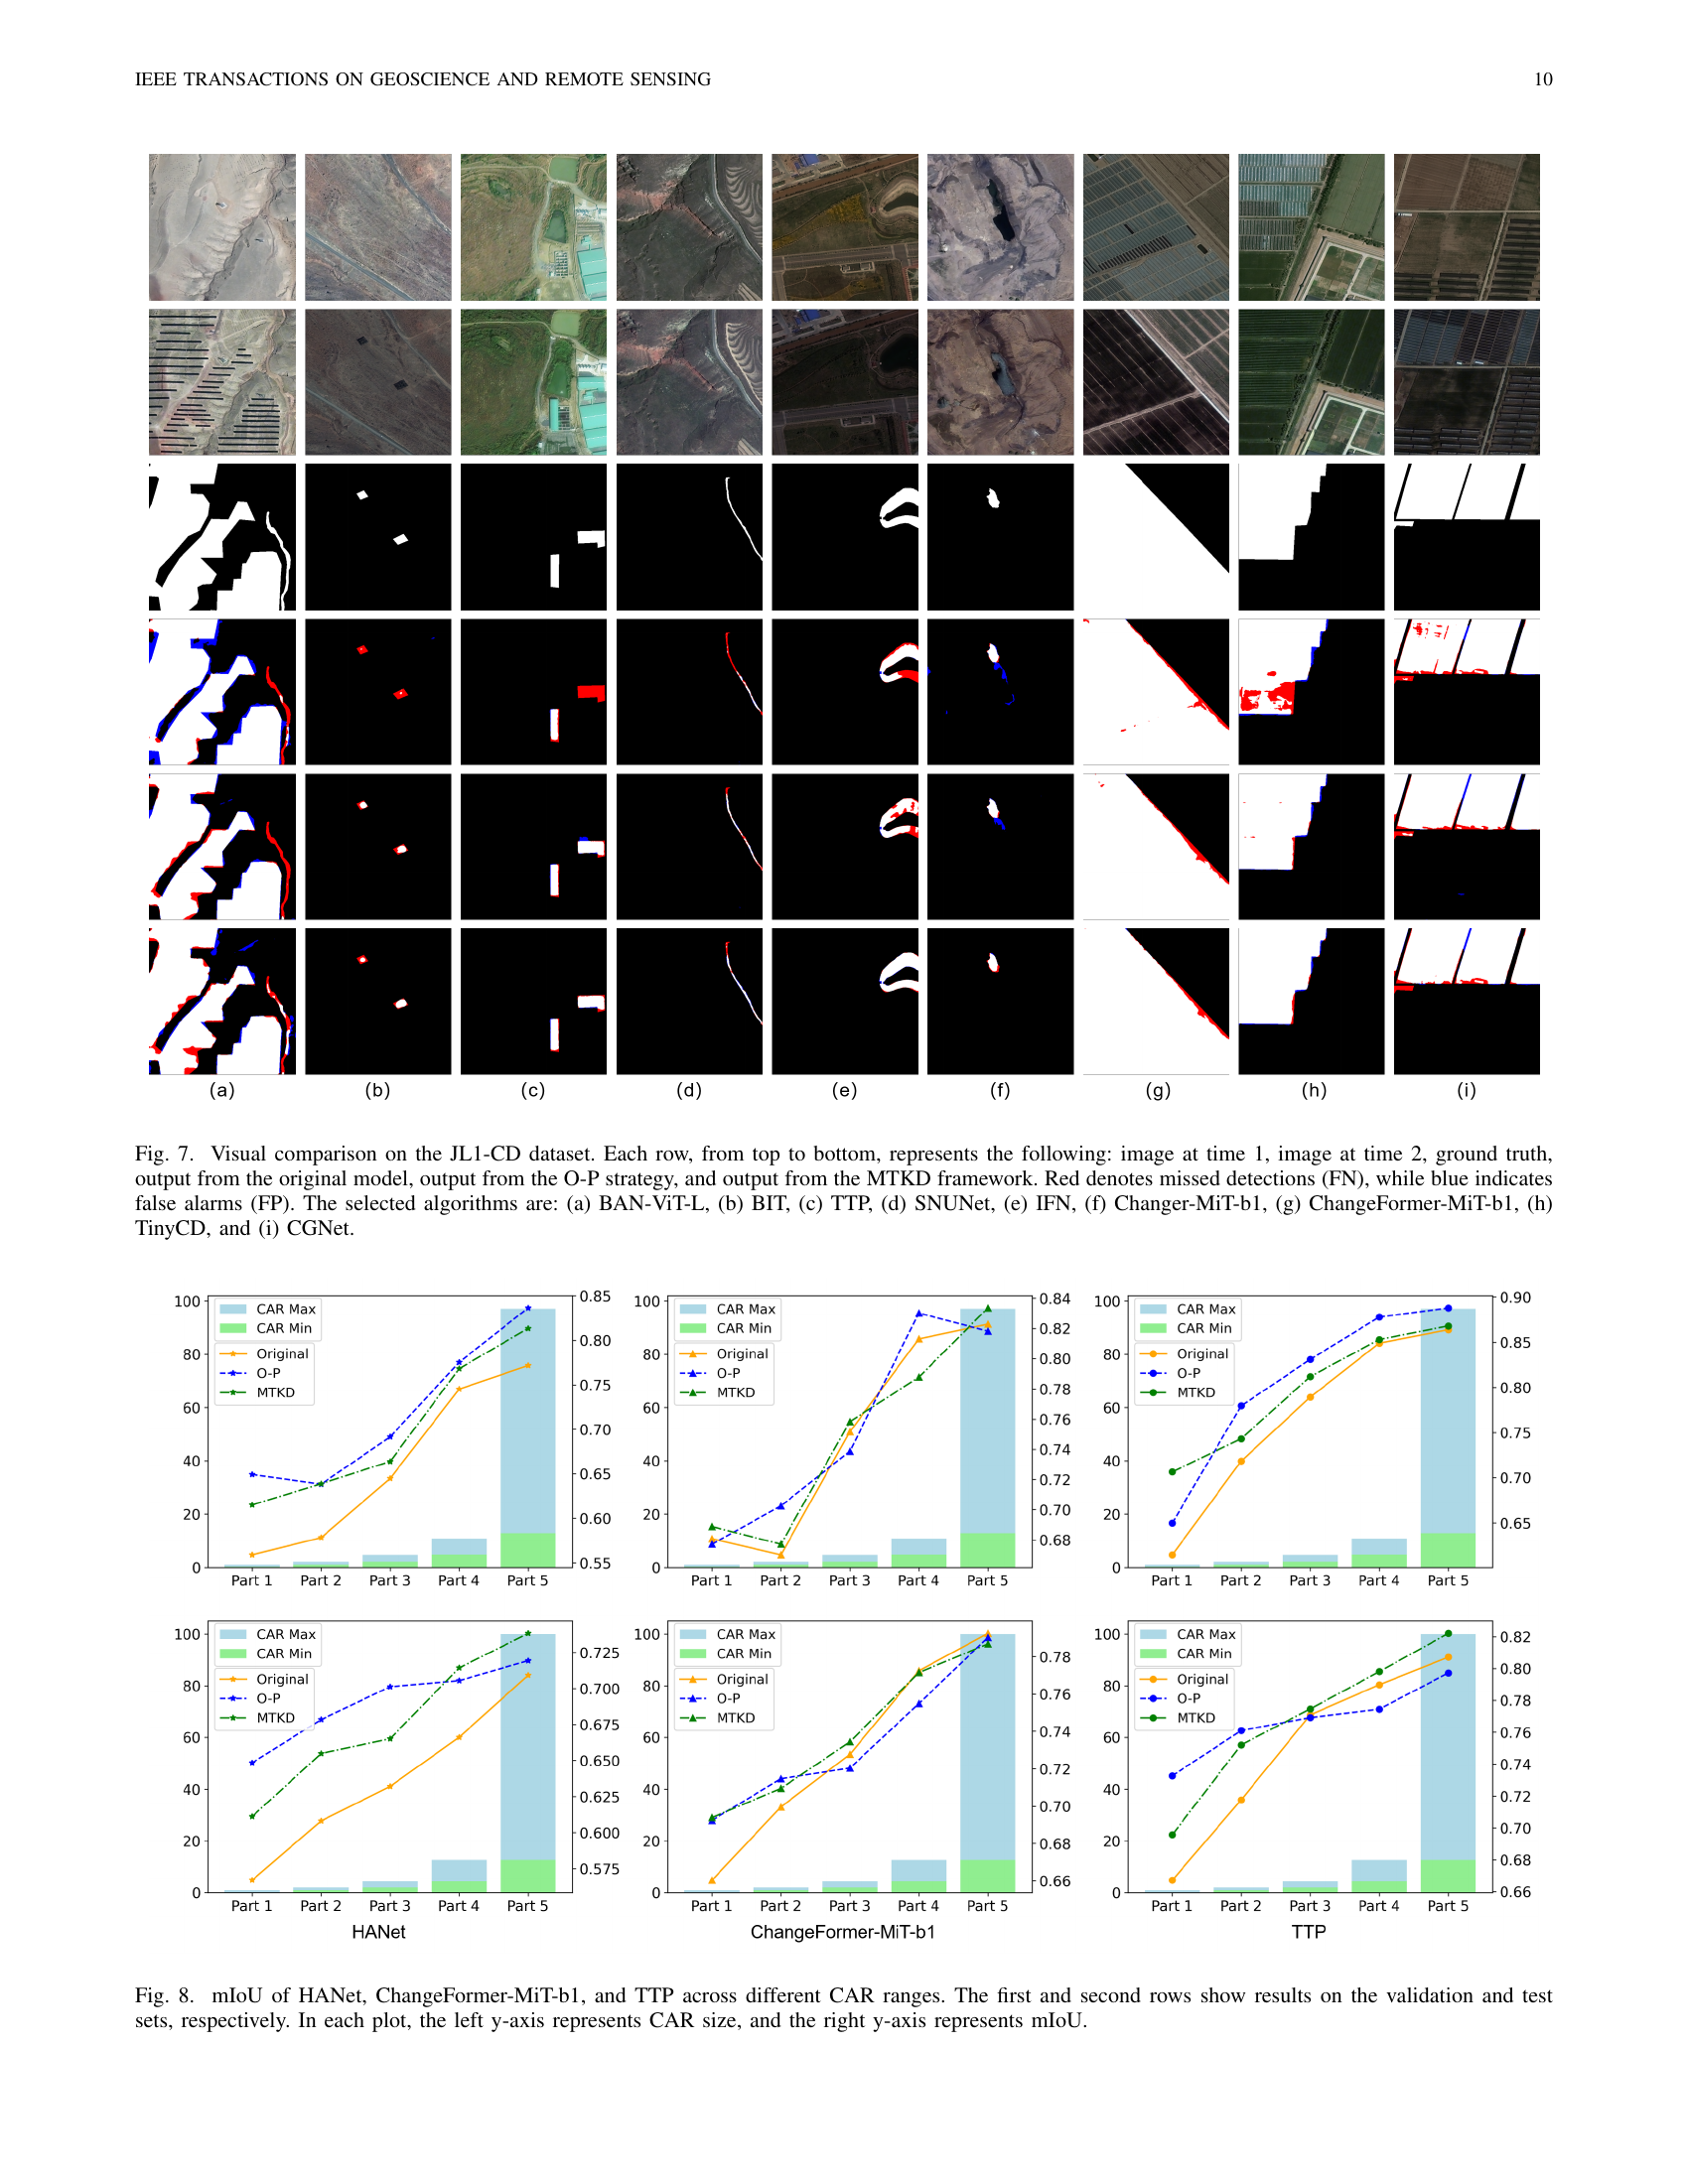
🔼 Figure 7 presents a visual comparison of change detection results on the JL1-CD dataset for nine different algorithms. Each row displays a sample image pair (time 1 and time 2), the corresponding ground truth change mask, and change detection outputs from three different model training approaches: the original model, the model trained with the Origin-Partition (O-P) strategy, and the model trained with the Multi-Teacher Knowledge Distillation (MTKD) framework. Red highlights missed detections (false negatives), and blue highlights false alarms (false positives). The specific algorithms shown are BAN-ViT-L, BIT, TTP, SNUNet, IFN, Changer-MiT-b1, ChangeFormer-MiT-b1, TinyCD, and CGNet, each in a separate column.
read the caption
Figure 7: Visual comparison on the JL1-CD dataset. Each row, from top to bottom, represents the following: image at time 1, image at time 2, ground truth, output from the original model, output from the O-P strategy, and output from the MTKD framework. Red denotes missed detections (FN), while blue indicates false alarms (FP). The selected algorithms are: (a) BAN-ViT-L, (b) BIT, (c) TTP, (d) SNUNet, (e) IFN, (f) Changer-MiT-b1, (g) ChangeFormer-MiT-b1, (h) TinyCD, and (i) CGNet.
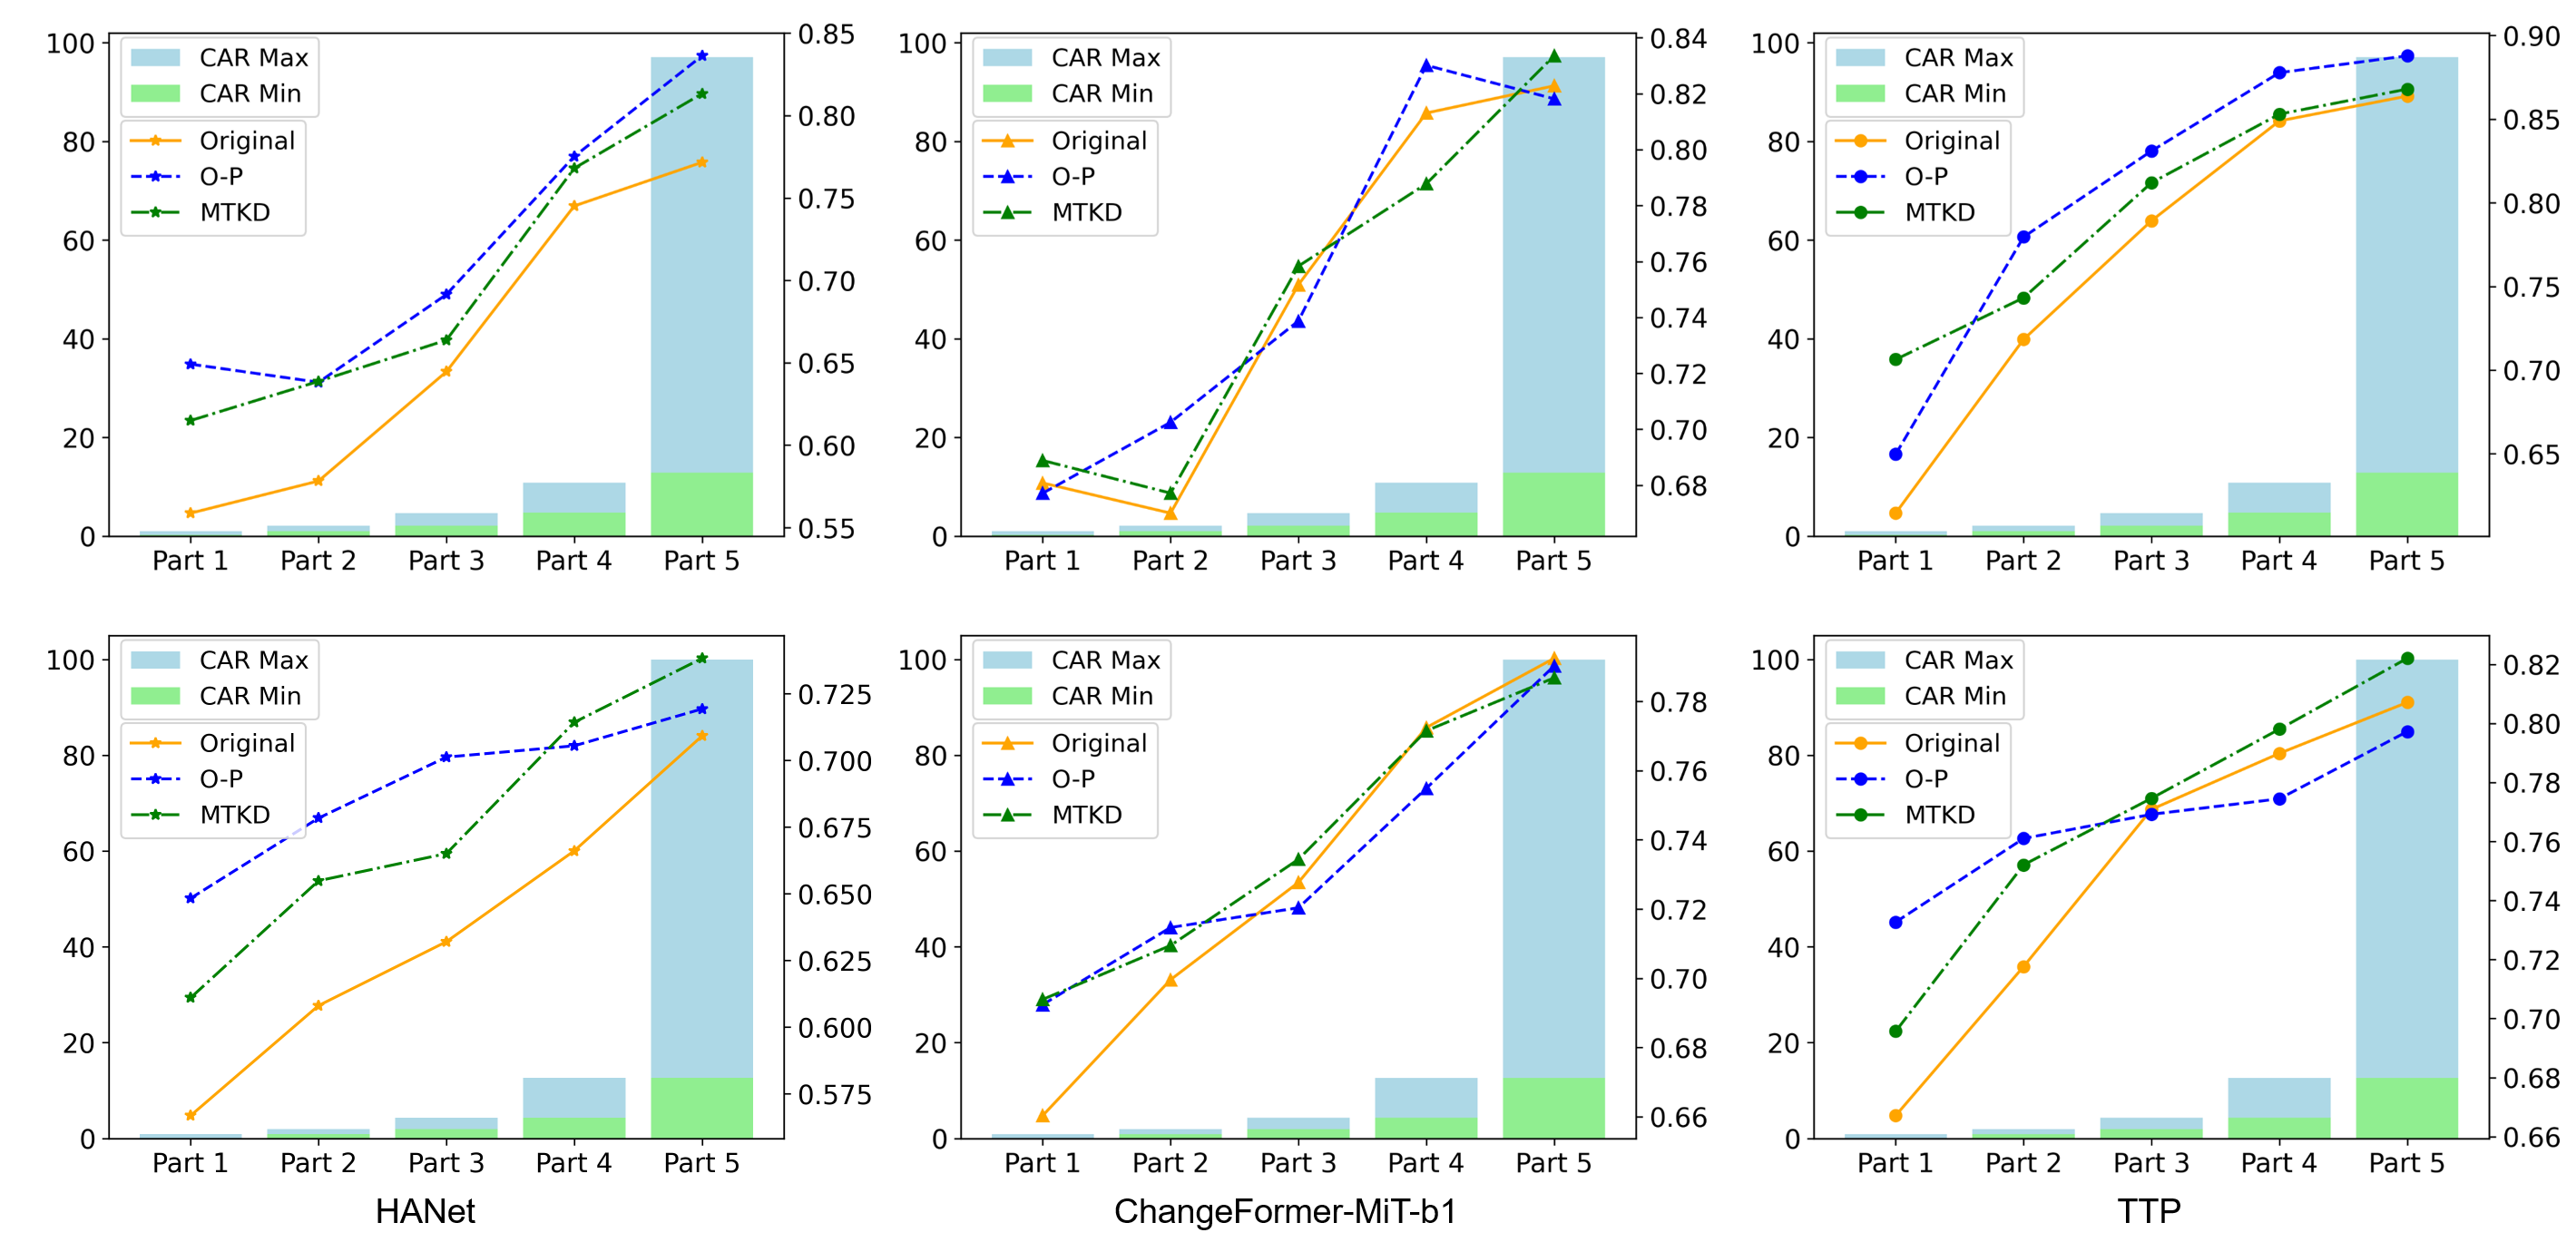
🔼 Figure 8 displays the performance of three distinct change detection models (HANet, ChangeFormer-MiT-b1, and TTP) across various change area ratios (CARs). The results are presented for both validation and test datasets, with each row representing a separate dataset. Each model’s mIoU (mean Intersection over Union) score is shown as a line graph, plotted against the CAR. The left y-axis displays the CAR range (percentage of changed pixels), while the right y-axis represents the resulting mIoU. This figure effectively demonstrates how the performance of each model varies depending on the extent of the change present in an image.
read the caption
Figure 8: mIoU of HANet, ChangeFormer-MiT-b1, and TTP across different CAR ranges. The first and second rows show results on the validation and test sets, respectively. In each plot, the left y-axis represents CAR size, and the right y-axis represents mIoU.

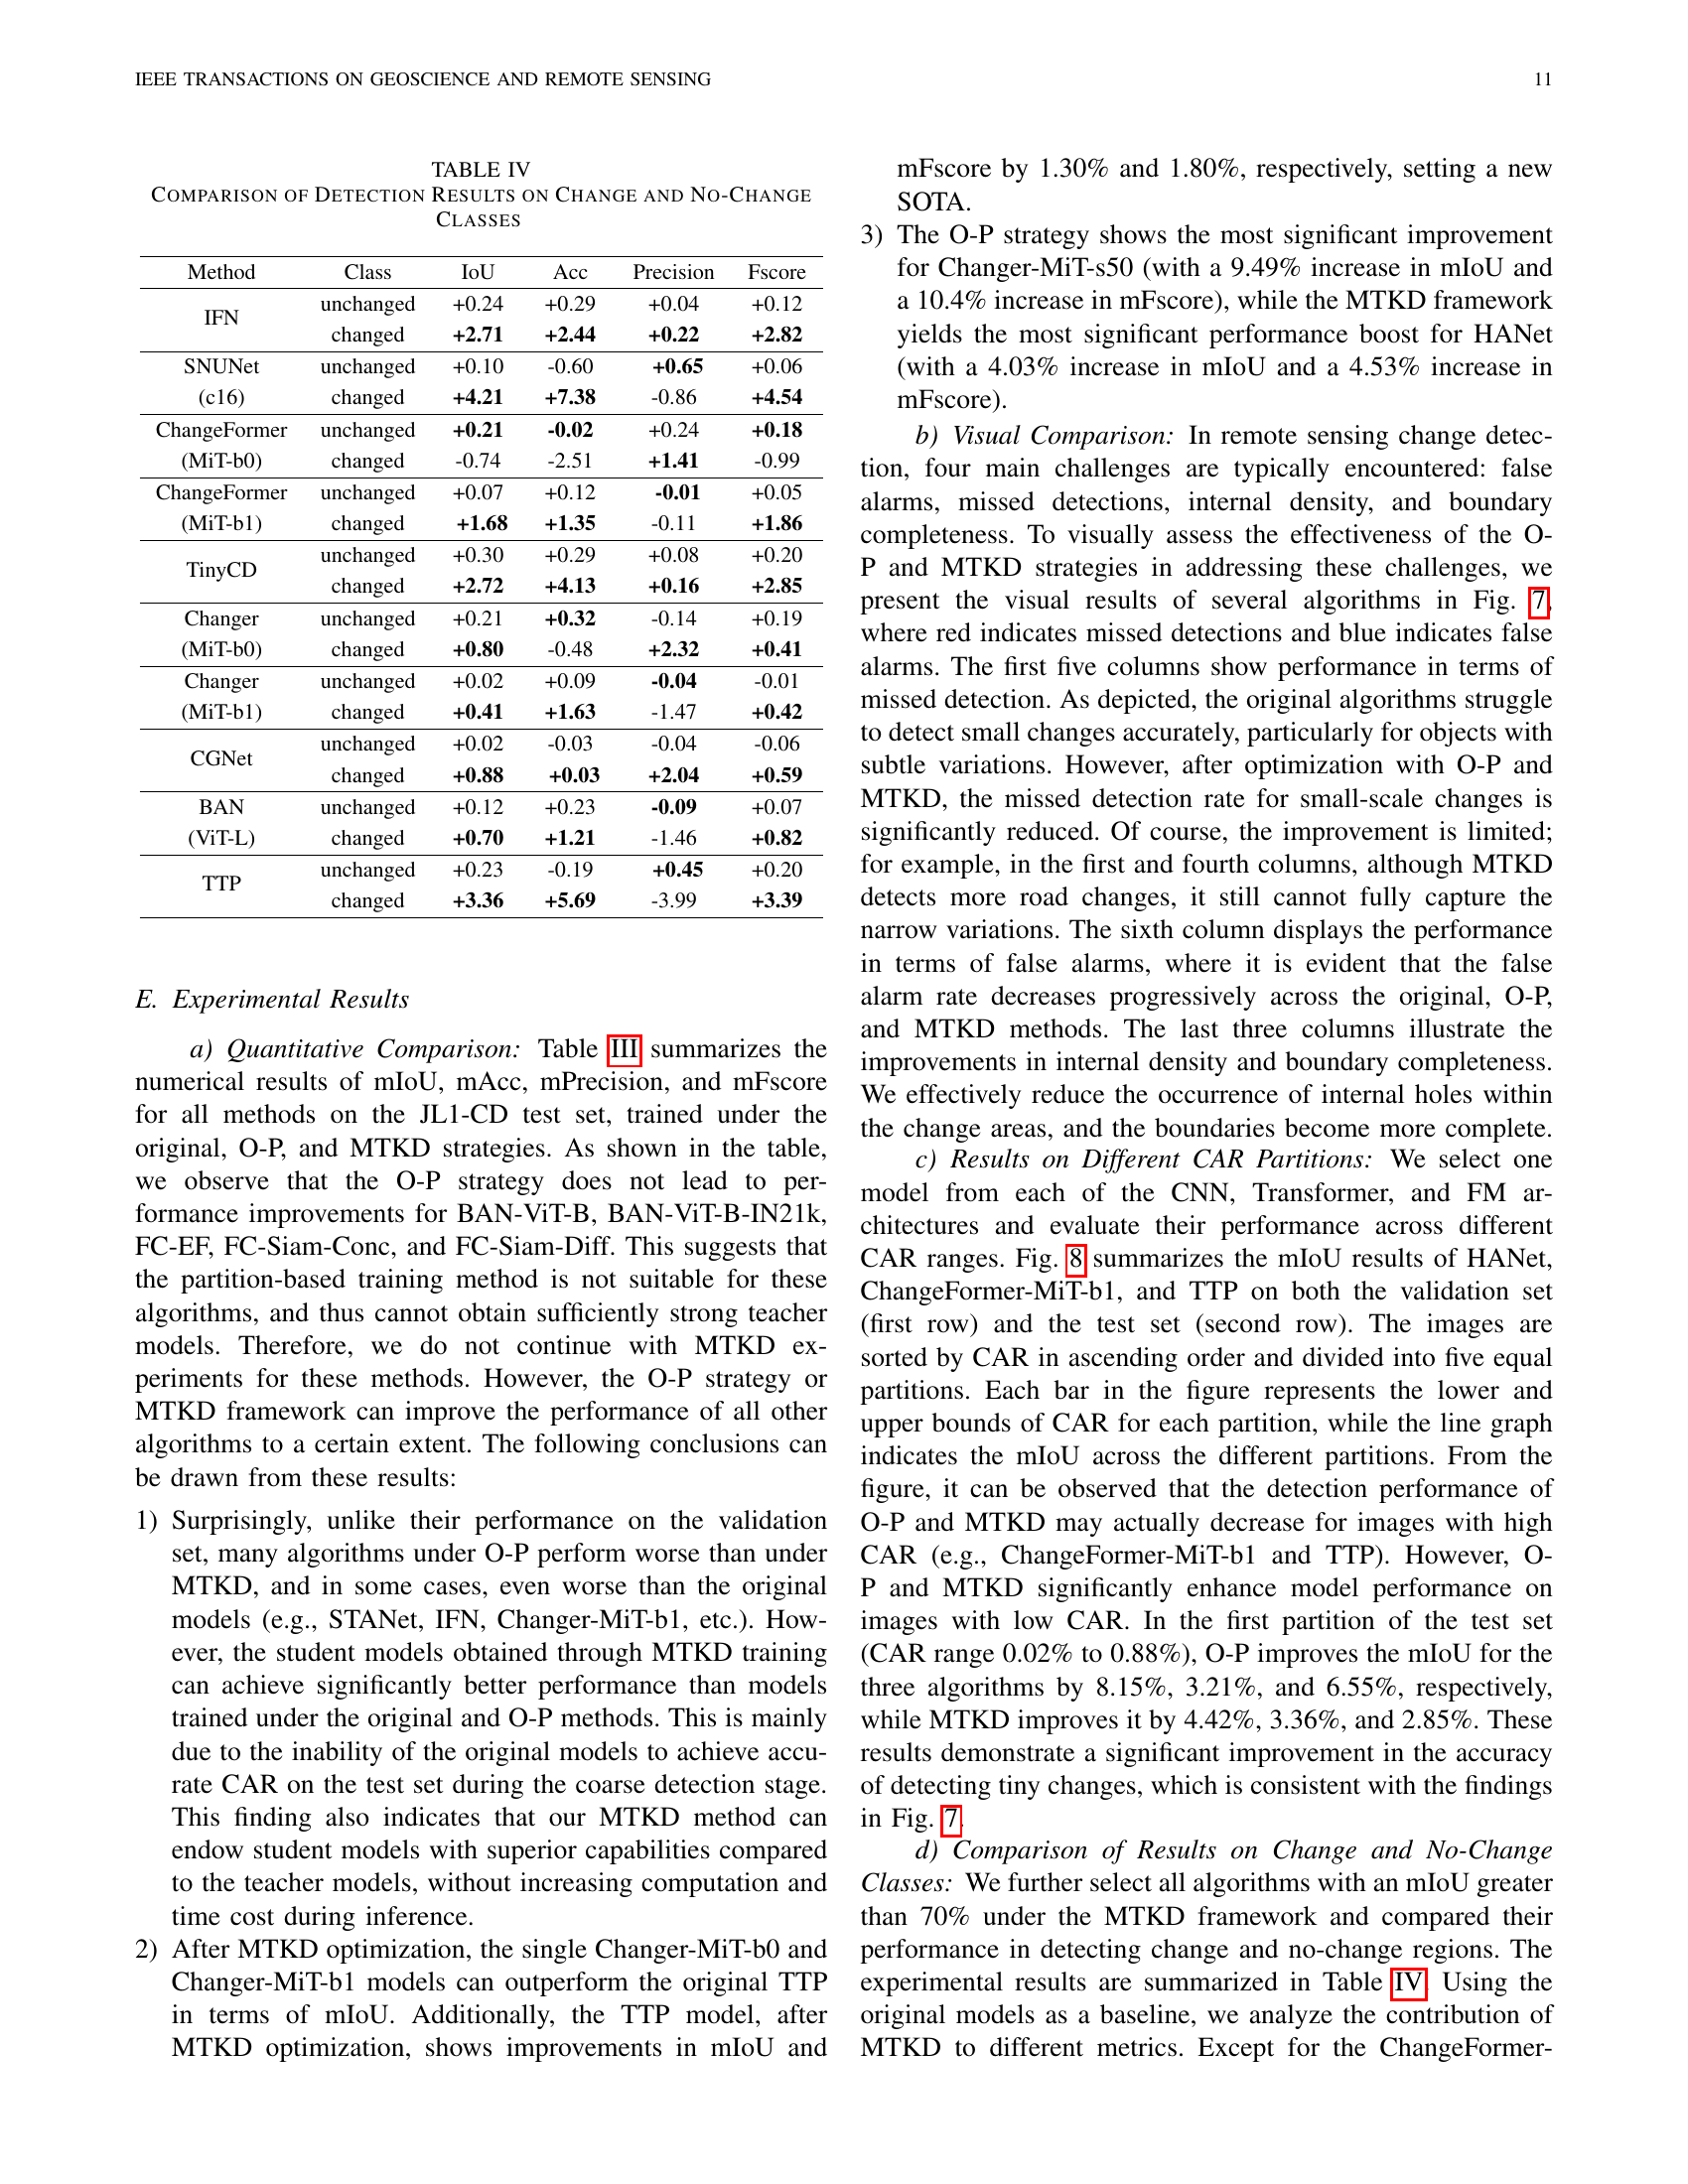
🔼 Figure 9 presents a visual comparison of change detection results on the SYSU-CD dataset using three different models: Changer-MiT-b1, CGNet, and TTP. Each row shows a pair of images (Time 1 and Time 2), the ground truth change mask, and the change detection results from each model under two training scenarios: ‘Original’ (standard training) and ‘MTKD’ (multi-teacher knowledge distillation). Red highlights missed detections (false negatives), while blue shows false alarms (false positives). The comparison aims to visually demonstrate the impact of the MTKD framework on improving the accuracy and reducing errors in change detection.
read the caption
Figure 9: Visual comparison on the SYSU-CD dataset. Red denotes missed detections (FN). Blue indicates false alarms (FP). (a) Image at Time 1. (b) Image at Time 2. (c) Ground Truth. (d) Changer-MiT-b1 (Original). (e) Changer-MiT-b1 (MTKD). (f) CGNet (Original). (g) CGNet (MTKD). (h) TTP (Original). (i) TTP (MTKD).
More on tables
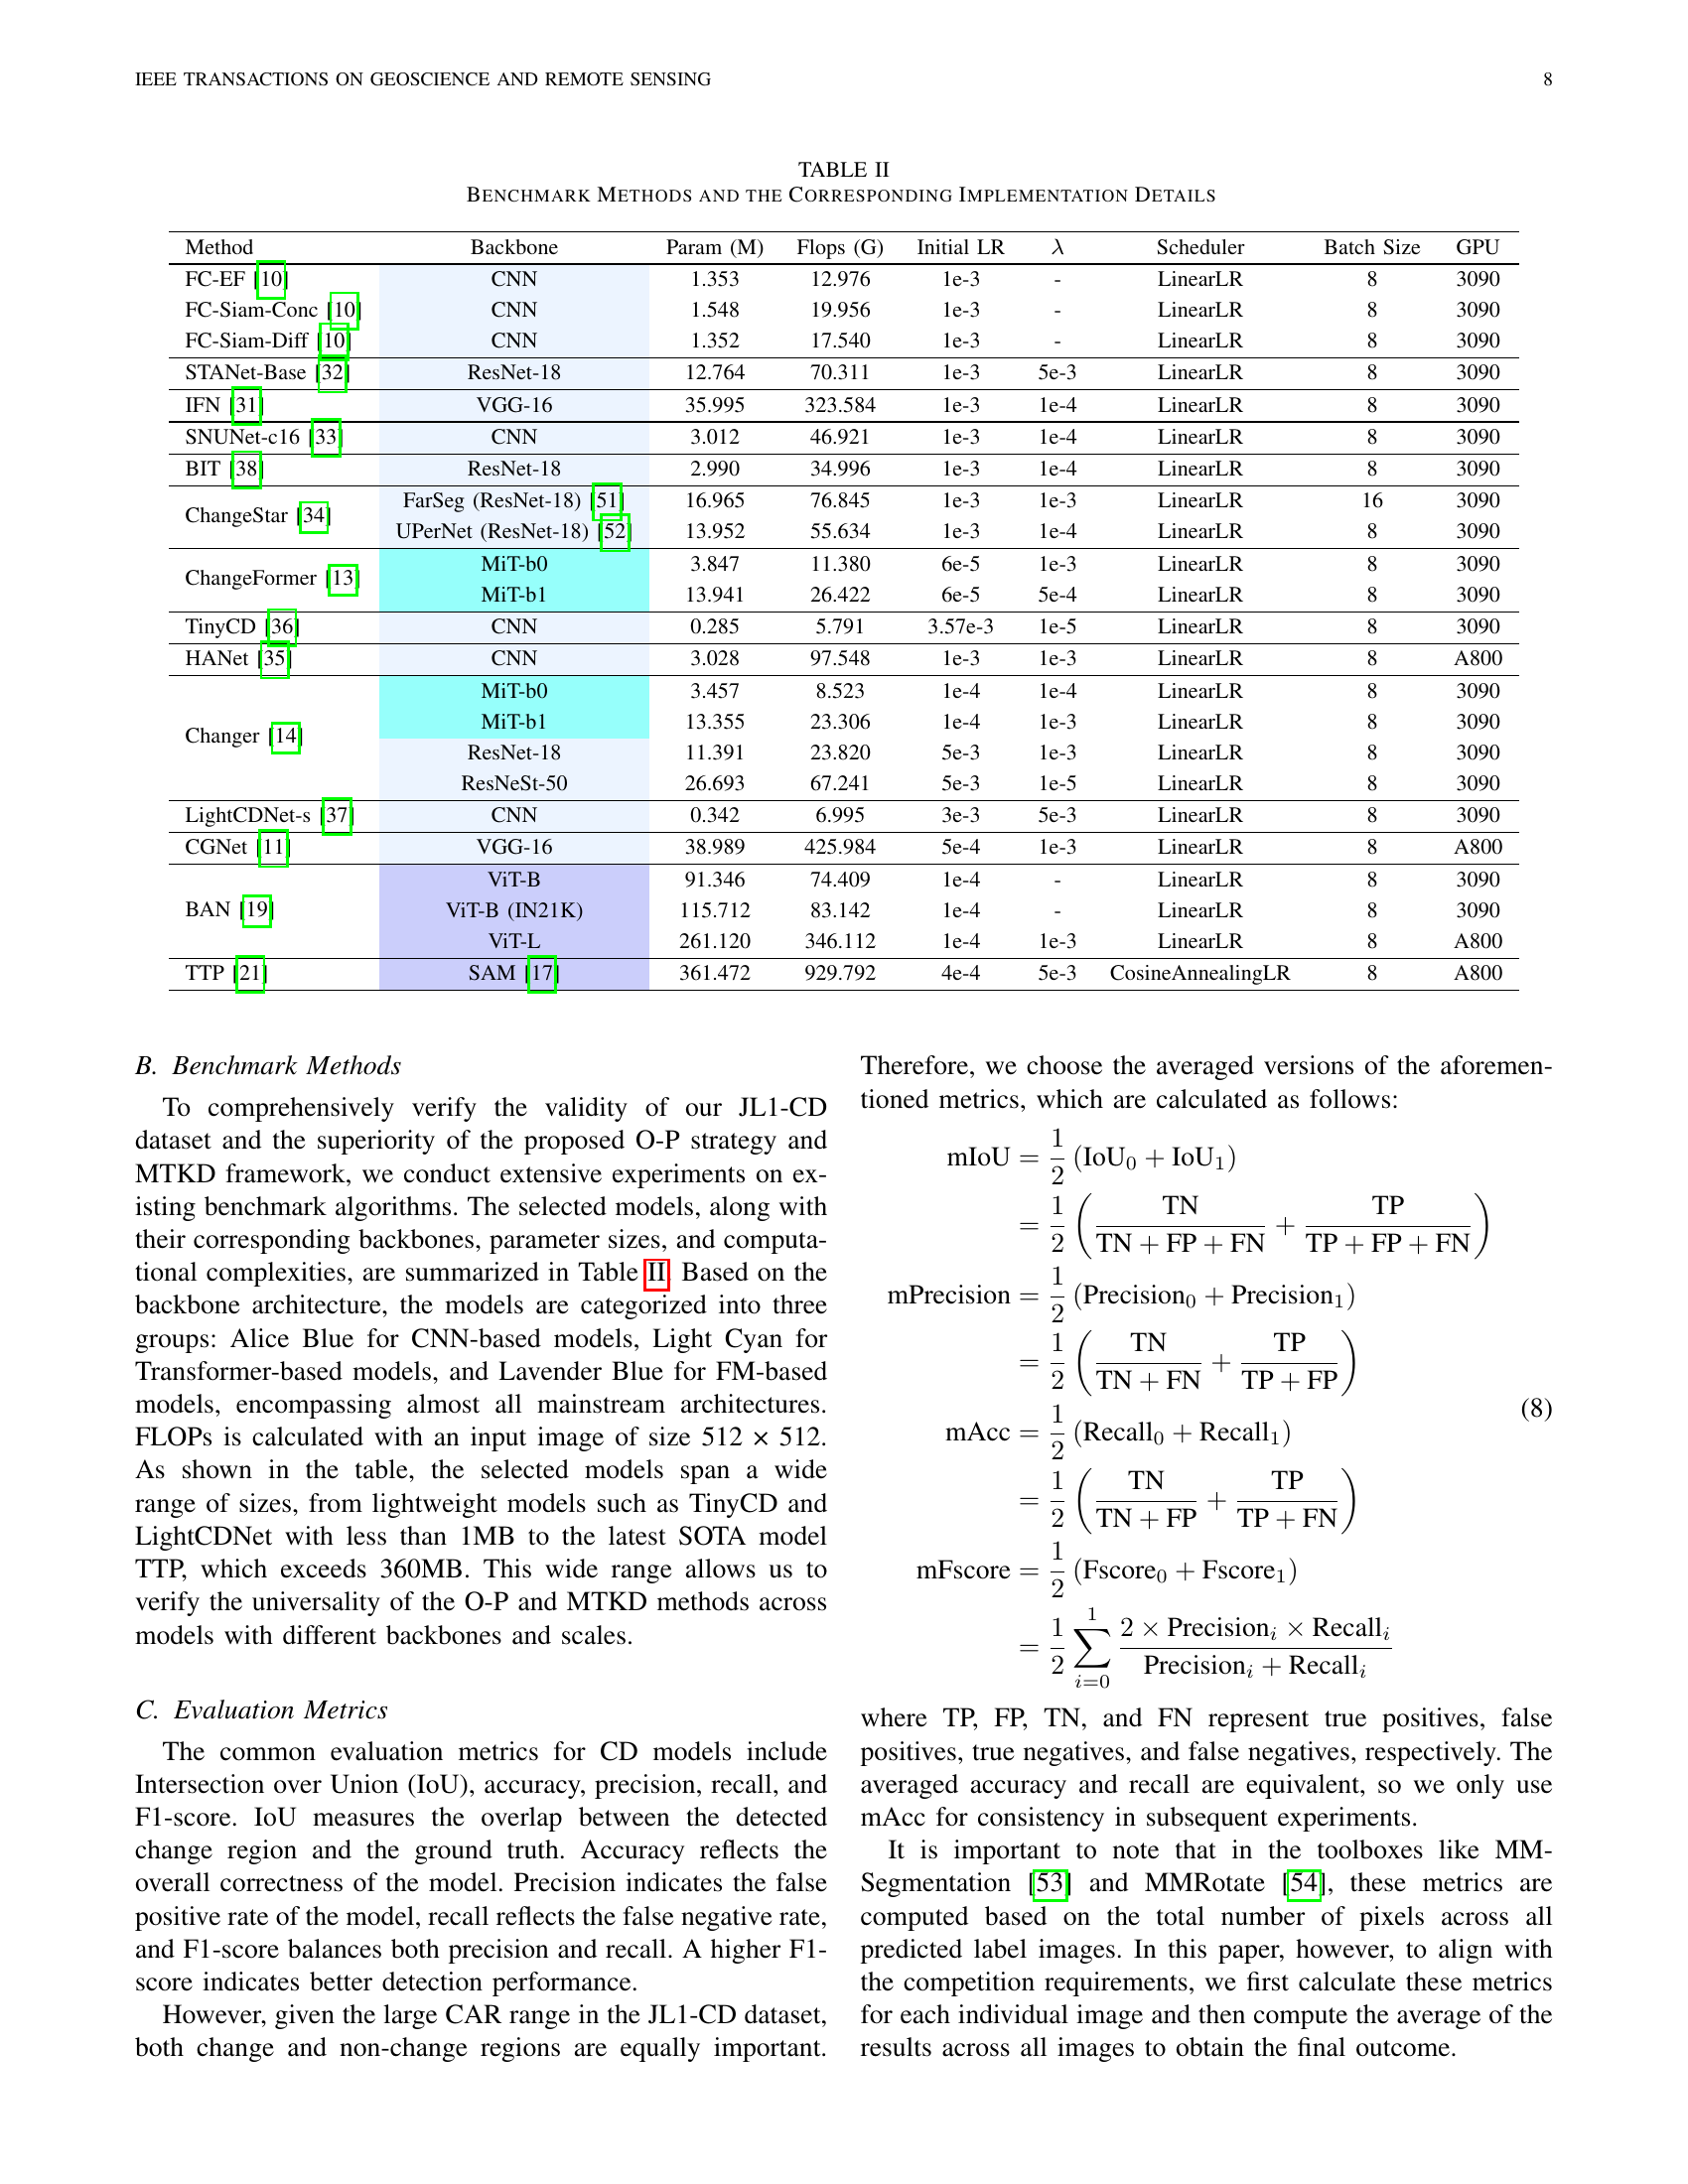
🔼 Table II provides a detailed overview of the benchmark models used in the paper’s experiments. For each model, it lists the backbone network architecture (e.g., CNN, ResNet, Transformer), the number of model parameters (in millions), the number of floating point operations (in billions), the initial learning rate used for training, the lambda value (λ, a hyperparameter), the learning rate scheduler employed, the batch size used during training, and the type of GPU used for training. This information allows readers to understand the computational complexity and resources required for each model and facilitates reproducibility of the results.
read the caption
TABLE II: Benchmark Methods and the Corresponding Implementation Details
| Method | Backbone | Param (M) | Flops (G) | Initial LR | Scheduler | Batch Size | GPU | |
| FC-EF[10] | CNN | 1.353 | 12.976 | 1e-3 | - | LinearLR | 8 | 3090 |
| FC-Siam-Conc[10] | CNN | 1.548 | 19.956 | 1e-3 | - | LinearLR | 8 | 3090 |
| FC-Siam-Diff[10] | CNN | 1.352 | 17.540 | 1e-3 | - | LinearLR | 8 | 3090 |
| STANet-Base[32] | ResNet-18 | 12.764 | 70.311 | 1e-3 | 5e-3 | LinearLR | 8 | 3090 |
| IFN[31] | VGG-16 | 35.995 | 323.584 | 1e-3 | 1e-4 | LinearLR | 8 | 3090 |
| SNUNet-c16[33] | CNN | 3.012 | 46.921 | 1e-3 | 1e-4 | LinearLR | 8 | 3090 |
| BIT[38] | ResNet-18 | 2.990 | 34.996 | 1e-3 | 1e-4 | LinearLR | 8 | 3090 |
| FarSeg (ResNet-18)[51] | 16.965 | 76.845 | 1e-3 | 1e-3 | LinearLR | 16 | 3090 | |
| ChangeStar[34] | UPerNet (ResNet-18)[52] | 13.952 | 55.634 | 1e-3 | 1e-4 | LinearLR | 8 | 3090 |
| MiT-b0 | 3.847 | 11.380 | 6e-5 | 1e-3 | LinearLR | 8 | 3090 | |
| ChangeFormer[13] | MiT-b1 | 13.941 | 26.422 | 6e-5 | 5e-4 | LinearLR | 8 | 3090 |
| TinyCD[36] | CNN | 0.285 | 5.791 | 3.57e-3 | 1e-5 | LinearLR | 8 | 3090 |
| HANet[35] | CNN | 3.028 | 97.548 | 1e-3 | 1e-3 | LinearLR | 8 | A800 |
| MiT-b0 | 3.457 | 8.523 | 1e-4 | 1e-4 | LinearLR | 8 | 3090 | |
| MiT-b1 | 13.355 | 23.306 | 1e-4 | 1e-3 | LinearLR | 8 | 3090 | |
| ResNet-18 | 11.391 | 23.820 | 5e-3 | 1e-3 | LinearLR | 8 | 3090 | |
| Changer[14] | ResNeSt-50 | 26.693 | 67.241 | 5e-3 | 1e-5 | LinearLR | 8 | 3090 |
| LightCDNet-s[37] | CNN | 0.342 | 6.995 | 3e-3 | 5e-3 | LinearLR | 8 | 3090 |
| CGNet[11] | VGG-16 | 38.989 | 425.984 | 5e-4 | 1e-3 | LinearLR | 8 | A800 |
| ViT-B | 91.346 | 74.409 | 1e-4 | - | LinearLR | 8 | 3090 | |
| ViT-B (IN21K) | 115.712 | 83.142 | 1e-4 | - | LinearLR | 8 | 3090 | |
| BAN[19] | ViT-L | 261.120 | 346.112 | 1e-4 | 1e-3 | LinearLR | 8 | A800 |
| TTP[21] | SAM[17] | 361.472 | 929.792 | 4e-4 | 5e-3 | CosineAnnealingLR | 8 | A800 |
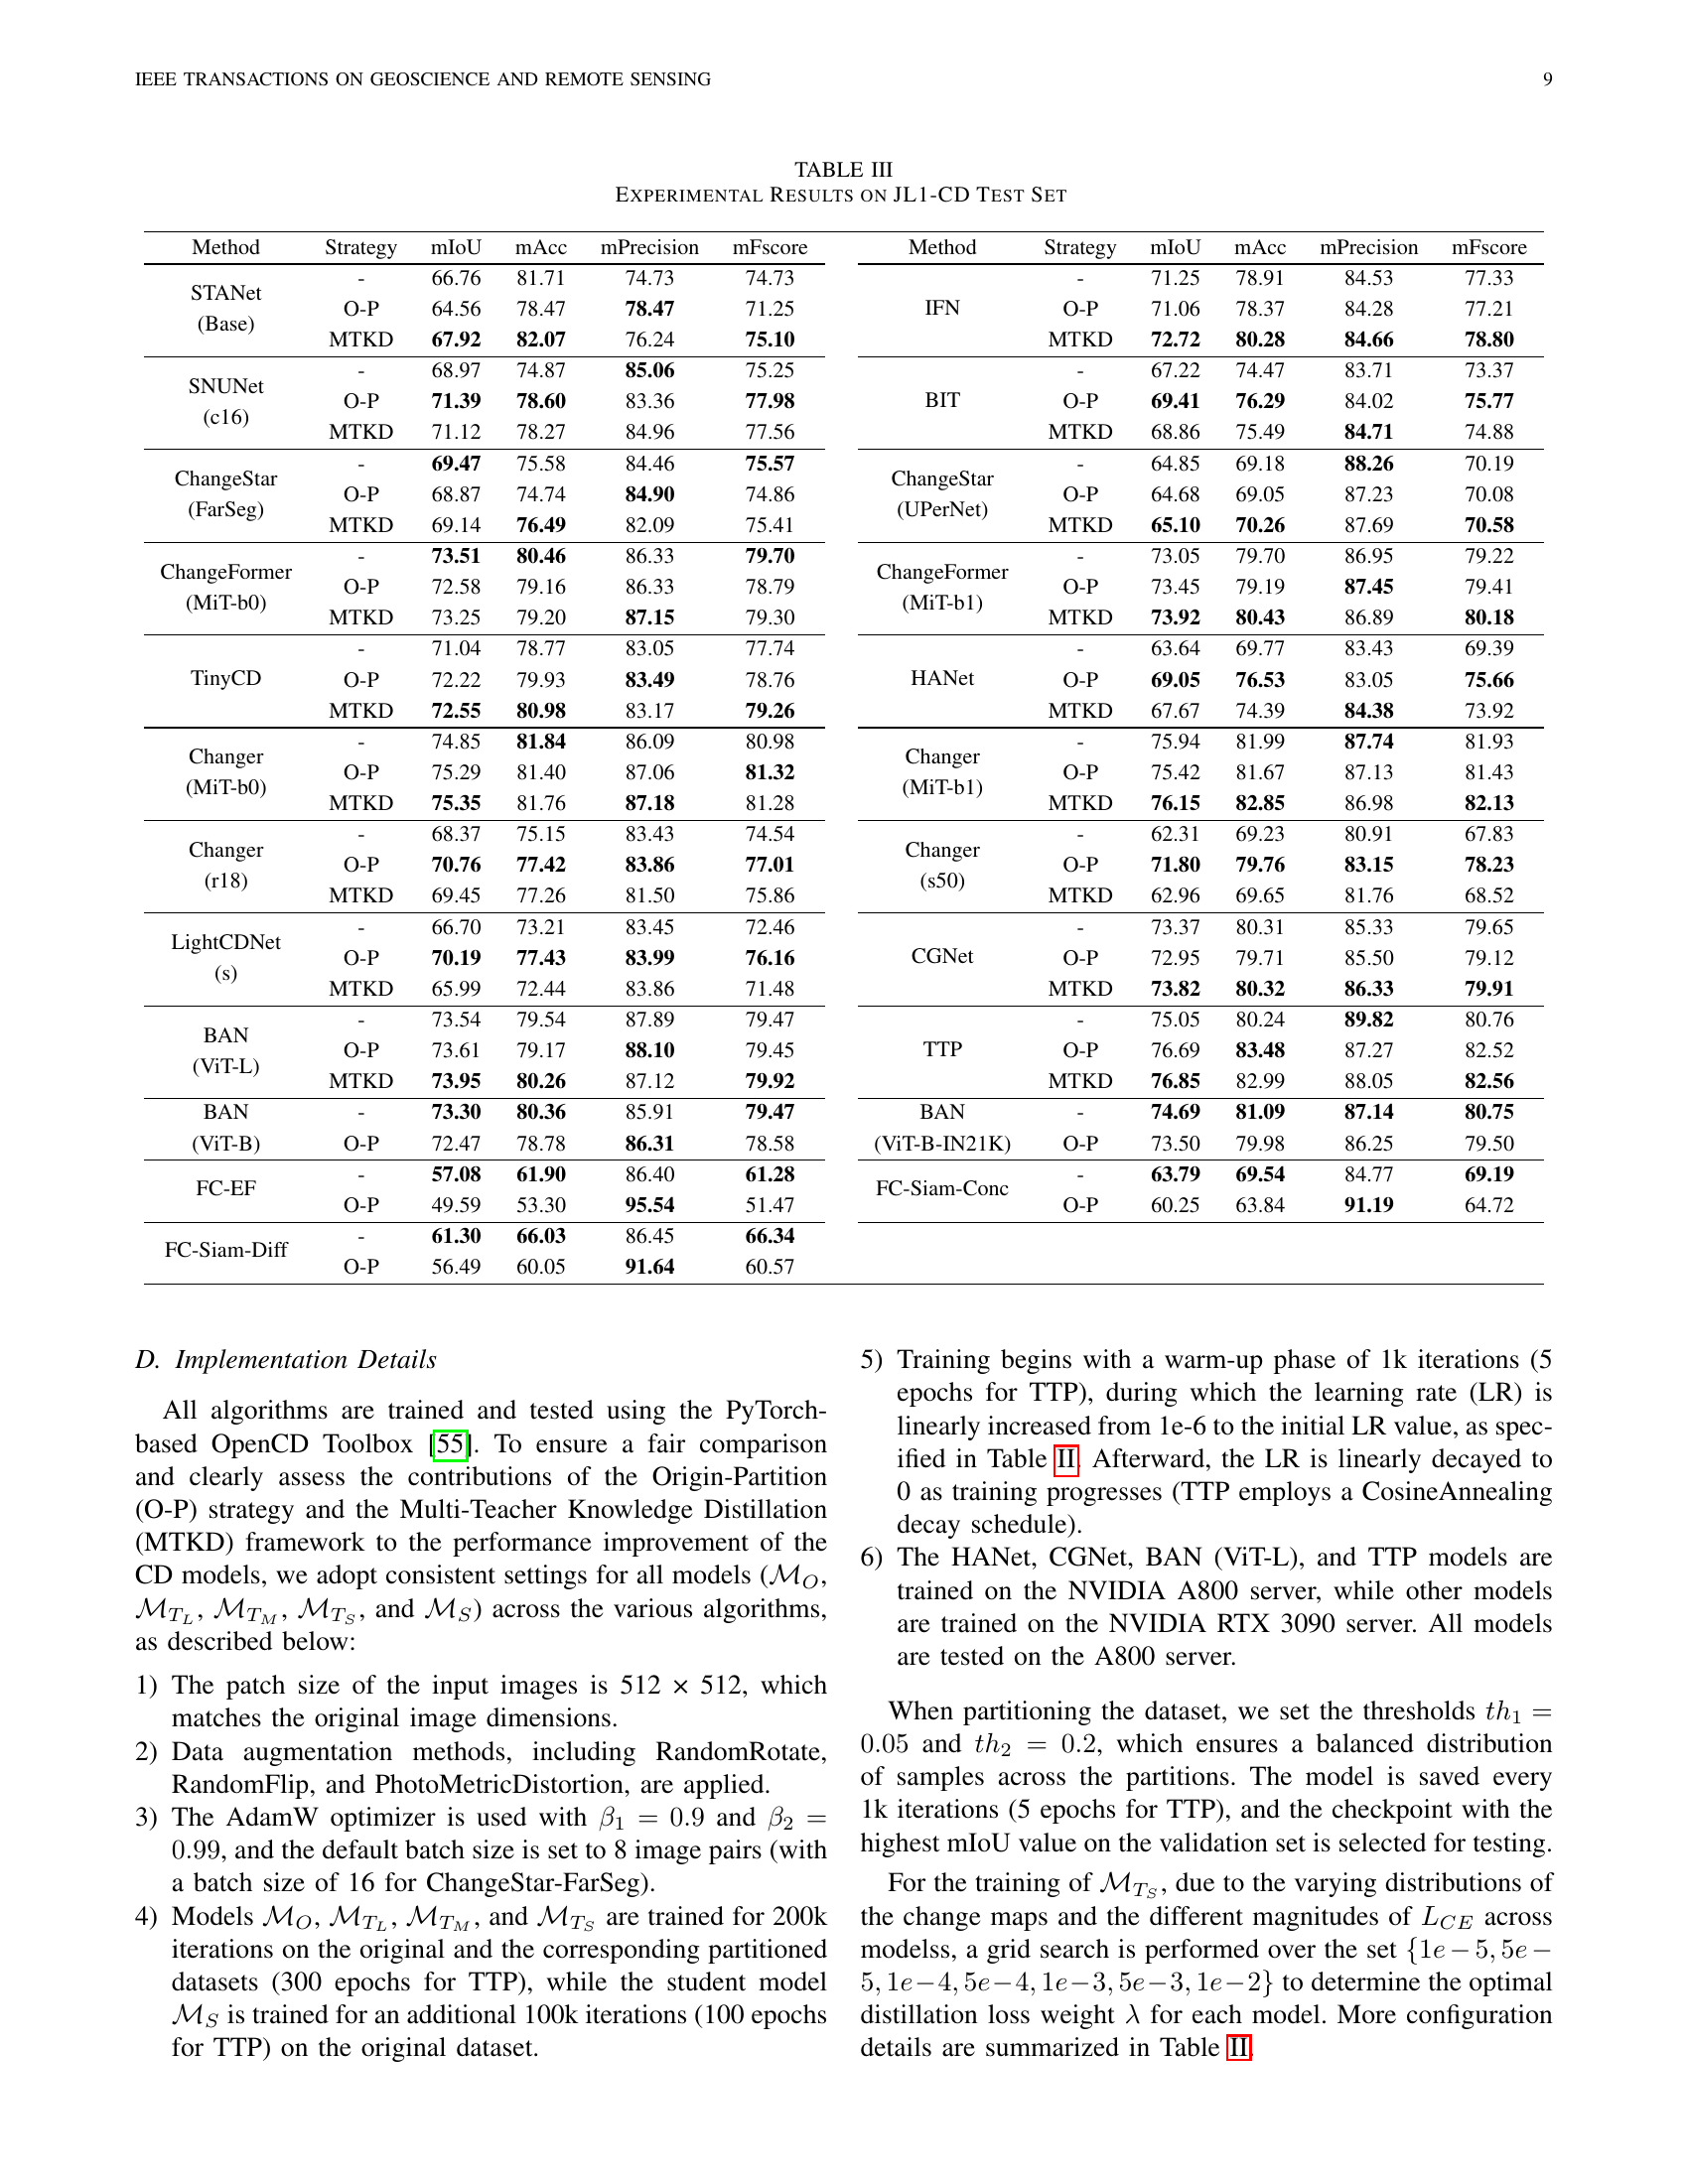
🔼 This table presents the quantitative results of various change detection models evaluated on the JL1-CD test dataset. The models are categorized by their strategy (original, O-P, and MTKD) and compared using metrics like mIoU (mean Intersection over Union), mAcc (mean accuracy), mPrecision (mean precision), and mFscore (mean F1-score). Higher scores generally indicate better change detection performance.
read the caption
TABLE III: Experimental Results on JL1-CD Test Set
| Method | Strategy | mIoU | mAcc | mPrecision | mFscore | Method | Strategy | mIoU | mAcc | mPrecision | mFscore | |
| STANet (Base) | - | 66.76 | 81.71 | 74.73 | 74.73 | IFN | - | 71.25 | 78.91 | 84.53 | 77.33 | |
| O-P | 64.56 | 78.47 | 78.47 | 71.25 | O-P | 71.06 | 78.37 | 84.28 | 77.21 | |||
| MTKD | 67.92 | 82.07 | 76.24 | 75.10 | MTKD | 72.72 | 80.28 | 84.66 | 78.80 | |||
| SNUNet (c16) | - | 68.97 | 74.87 | 85.06 | 75.25 | BIT | - | 67.22 | 74.47 | 83.71 | 73.37 | |
| O-P | 71.39 | 78.60 | 83.36 | 77.98 | O-P | 69.41 | 76.29 | 84.02 | 75.77 | |||
| MTKD | 71.12 | 78.27 | 84.96 | 77.56 | MTKD | 68.86 | 75.49 | 84.71 | 74.88 | |||
| ChangeStar (FarSeg) | - | 69.47 | 75.58 | 84.46 | 75.57 | ChangeStar (UPerNet) | - | 64.85 | 69.18 | 88.26 | 70.19 | |
| O-P | 68.87 | 74.74 | 84.90 | 74.86 | O-P | 64.68 | 69.05 | 87.23 | 70.08 | |||
| MTKD | 69.14 | 76.49 | 82.09 | 75.41 | MTKD | 65.10 | 70.26 | 87.69 | 70.58 | |||
| ChangeFormer (MiT-b0) | - | 73.51 | 80.46 | 86.33 | 79.70 | ChangeFormer (MiT-b1) | - | 73.05 | 79.70 | 86.95 | 79.22 | |
| O-P | 72.58 | 79.16 | 86.33 | 78.79 | O-P | 73.45 | 79.19 | 87.45 | 79.41 | |||
| MTKD | 73.25 | 79.20 | 87.15 | 79.30 | MTKD | 73.92 | 80.43 | 86.89 | 80.18 | |||
| TinyCD | - | 71.04 | 78.77 | 83.05 | 77.74 | HANet | - | 63.64 | 69.77 | 83.43 | 69.39 | |
| O-P | 72.22 | 79.93 | 83.49 | 78.76 | O-P | 69.05 | 76.53 | 83.05 | 75.66 | |||
| MTKD | 72.55 | 80.98 | 83.17 | 79.26 | MTKD | 67.67 | 74.39 | 84.38 | 73.92 | |||
| Changer (MiT-b0) | - | 74.85 | 81.84 | 86.09 | 80.98 | Changer (MiT-b1) | - | 75.94 | 81.99 | 87.74 | 81.93 | |
| O-P | 75.29 | 81.40 | 87.06 | 81.32 | O-P | 75.42 | 81.67 | 87.13 | 81.43 | |||
| MTKD | 75.35 | 81.76 | 87.18 | 81.28 | MTKD | 76.15 | 82.85 | 86.98 | 82.13 | |||
| Changer (r18) | - | 68.37 | 75.15 | 83.43 | 74.54 | Changer (s50) | - | 62.31 | 69.23 | 80.91 | 67.83 | |
| O-P | 70.76 | 77.42 | 83.86 | 77.01 | O-P | 71.80 | 79.76 | 83.15 | 78.23 | |||
| MTKD | 69.45 | 77.26 | 81.50 | 75.86 | MTKD | 62.96 | 69.65 | 81.76 | 68.52 | |||
| LightCDNet (s) | - | 66.70 | 73.21 | 83.45 | 72.46 | CGNet | - | 73.37 | 80.31 | 85.33 | 79.65 | |
| O-P | 70.19 | 77.43 | 83.99 | 76.16 | O-P | 72.95 | 79.71 | 85.50 | 79.12 | |||
| MTKD | 65.99 | 72.44 | 83.86 | 71.48 | MTKD | 73.82 | 80.32 | 86.33 | 79.91 | |||
| BAN (ViT-L) | - | 73.54 | 79.54 | 87.89 | 79.47 | TTP | - | 75.05 | 80.24 | 89.82 | 80.76 | |
| O-P | 73.61 | 79.17 | 88.10 | 79.45 | O-P | 76.69 | 83.48 | 87.27 | 82.52 | |||
| MTKD | 73.95 | 80.26 | 87.12 | 79.92 | MTKD | 76.85 | 82.99 | 88.05 | 82.56 | |||
| BAN (ViT-B) | - | 73.30 | 80.36 | 85.91 | 79.47 | BAN (ViT-B-IN21K) | - | 74.69 | 81.09 | 87.14 | 80.75 | |
| O-P | 72.47 | 78.78 | 86.31 | 78.58 | O-P | 73.50 | 79.98 | 86.25 | 79.50 | |||
| FC-EF | - | 57.08 | 61.90 | 86.40 | 61.28 | FC-Siam-Conc | - | 63.79 | 69.54 | 84.77 | 69.19 | |
| O-P | 49.59 | 53.30 | 95.54 | 51.47 | O-P | 60.25 | 63.84 | 91.19 | 64.72 | |||
| FC-Siam-Diff | - | 61.30 | 66.03 | 86.45 | 66.34 | |||||||
| O-P | 56.49 | 60.05 | 91.64 | 60.57 |
🔼 Table IV presents a detailed comparison of change and no-change detection performance metrics for several models. It breaks down the Intersection over Union (IoU), Accuracy, Precision, and F1-score for each model, separately showing the change in these metrics compared to a baseline for both change and no-change regions. This allows for a more nuanced understanding of how effectively each model differentiates between changed and unchanged areas in the images.
read the caption
TABLE IV: Comparison of Detection Results on Change and No-Change Classes
| Method | Class | IoU | Acc | Precision | Fscore |
|---|---|---|---|---|---|
| unchanged | +0.24 | +0.29 | +0.04 | +0.12 | |
| IFN | changed | +2.71 | +2.44 | +0.22 | +2.82 |
| unchanged | +0.10 | -0.60 | +0.65 | +0.06 | |
| SNUNet (c16) | changed | +4.21 | +7.38 | -0.86 | +4.54 |
| unchanged | +0.21 | -0.02 | +0.24 | +0.18 | |
| ChangeFormer (MiT-b0) | changed | -0.74 | -2.51 | +1.41 | -0.99 |
| unchanged | +0.07 | +0.12 | -0.01 | +0.05 | |
| ChangeFormer (MiT-b1) | changed | +1.68 | +1.35 | -0.11 | +1.86 |
| unchanged | +0.30 | +0.29 | +0.08 | +0.20 | |
| TinyCD | changed | +2.72 | +4.13 | +0.16 | +2.85 |
| unchanged | +0.21 | +0.32 | -0.14 | +0.19 | |
| Changer (MiT-b0) | changed | +0.80 | -0.48 | +2.32 | +0.41 |
| unchanged | +0.02 | +0.09 | -0.04 | -0.01 | |
| Changer (MiT-b1) | changed | +0.41 | +1.63 | -1.47 | +0.42 |
| unchanged | +0.02 | -0.03 | -0.04 | -0.06 | |
| CGNet | changed | +0.88 | +0.03 | +2.04 | +0.59 |
| unchanged | +0.12 | +0.23 | -0.09 | +0.07 | |
| BAN (ViT-L) | changed | +0.70 | +1.21 | -1.46 | +0.82 |
| unchanged | +0.23 | -0.19 | +0.45 | +0.20 | |
| TTP | changed | +3.36 | +5.69 | -3.99 | +3.39 |
🔼 This table investigates how the number of teacher models used in the Multi-Teacher Knowledge Distillation (MTKD) framework affects the performance of change detection. It compares the results obtained using two versus three teacher models within both the Origin-Partition (O-P) strategy and the MTKD framework. The metrics evaluated include mean Intersection over Union (mIoU), mean Accuracy (mAcc), mean Precision (mPrecision), and mean F1-score (mFscore). The table allows for a comparison of the effectiveness of different teacher model configurations on overall change detection accuracy.
read the caption
TABLE V: Impact of Different Numbers of Teacher Models on O-P and MTKD Performance
| Method | Strategy | No. of | mIOU | mAcc | mPrecision | mFscore |
|---|---|---|---|---|---|---|
| 3 | 75.29 (+0.44) | 81.40 (-0.44) | 87.06 (+0.97) | 81.32 (+0.34) | ||
| O-P | 2 | 75.44 (+0.59) | 81.96 (+0.12) | 85.85 (-0.24) | 81.51 (+0.53) | |
| 3 | 75.35 (+0.50) | 81.76 (-0.08) | 87.18 (+1.09) | 81.28 (+0.30) | ||
| Changer (MiT-b0) | MTKD | 2 | 75.72 (+0.87) | 82.30 (+0.46) | 86.80 (+0.71) | 81.66 (+0.68) |
| 3 | 75.42 (-0.52) | 81.67 (-0.32) | 87.13 (-0.61) | 81.43 (-0.50) | ||
| O-P | 2 | 75.91 (-0.03) | 82.11 (+0.12) | 87.87 (+0.13) | 81.97 (+0.04) | |
| 3 | 76.15 (+0.21) | 82.85 (+0.86) | 86.98 (-0.76) | 82.13 (+0.20) | ||
| Changer (MiT-b1) | MTKD | 2 | 76.77 (+0.83) | 83.38 (+1.39) | 87.30 (-0.44) | 82.66 (+0.73) |
| 3 | 72.95 (-0.42) | 79.71 (-0.60) | 85.50 (+0.17) | 79.12 (-0.53) | ||
| O-P | 2 | 73.56 (+0.19) | 80.76 (+0.45) | 85.07 (-0.26) | 79.92 (+0.27) | |
| 3 | 73.82 (+0.45) | 80.32 (+0.01) | 86.33 (+1.00) | 79.91 (+0.26) | ||
| CGNet | MTKD | 2 | 73.78 (+0.41) | 80.61 (+0.29) | 85.67 (+0.34) | 79.89 (+0.24) |
| 3 | 76.69 (+1.64) | 83.48 (+3.24) | 87.27 (-2.55) | 82.52 (+1.76) | ||
| O-P | 2 | 76.65 (+1.60) | 82.98 (+2.74) | 87.39 (-2.43) | 82.49 (+1.73) | |
| 3 | 76.85 (+1.80) | 82.99 (+2.75) | 88.05 (-1.77) | 82.56 (+1.80) | ||
| TTP | MTKD | 2 | 76.31 (+1.26) | 83.24 (+3.00) | 86.81 (-3.01) | 82.22 (+1.46) |
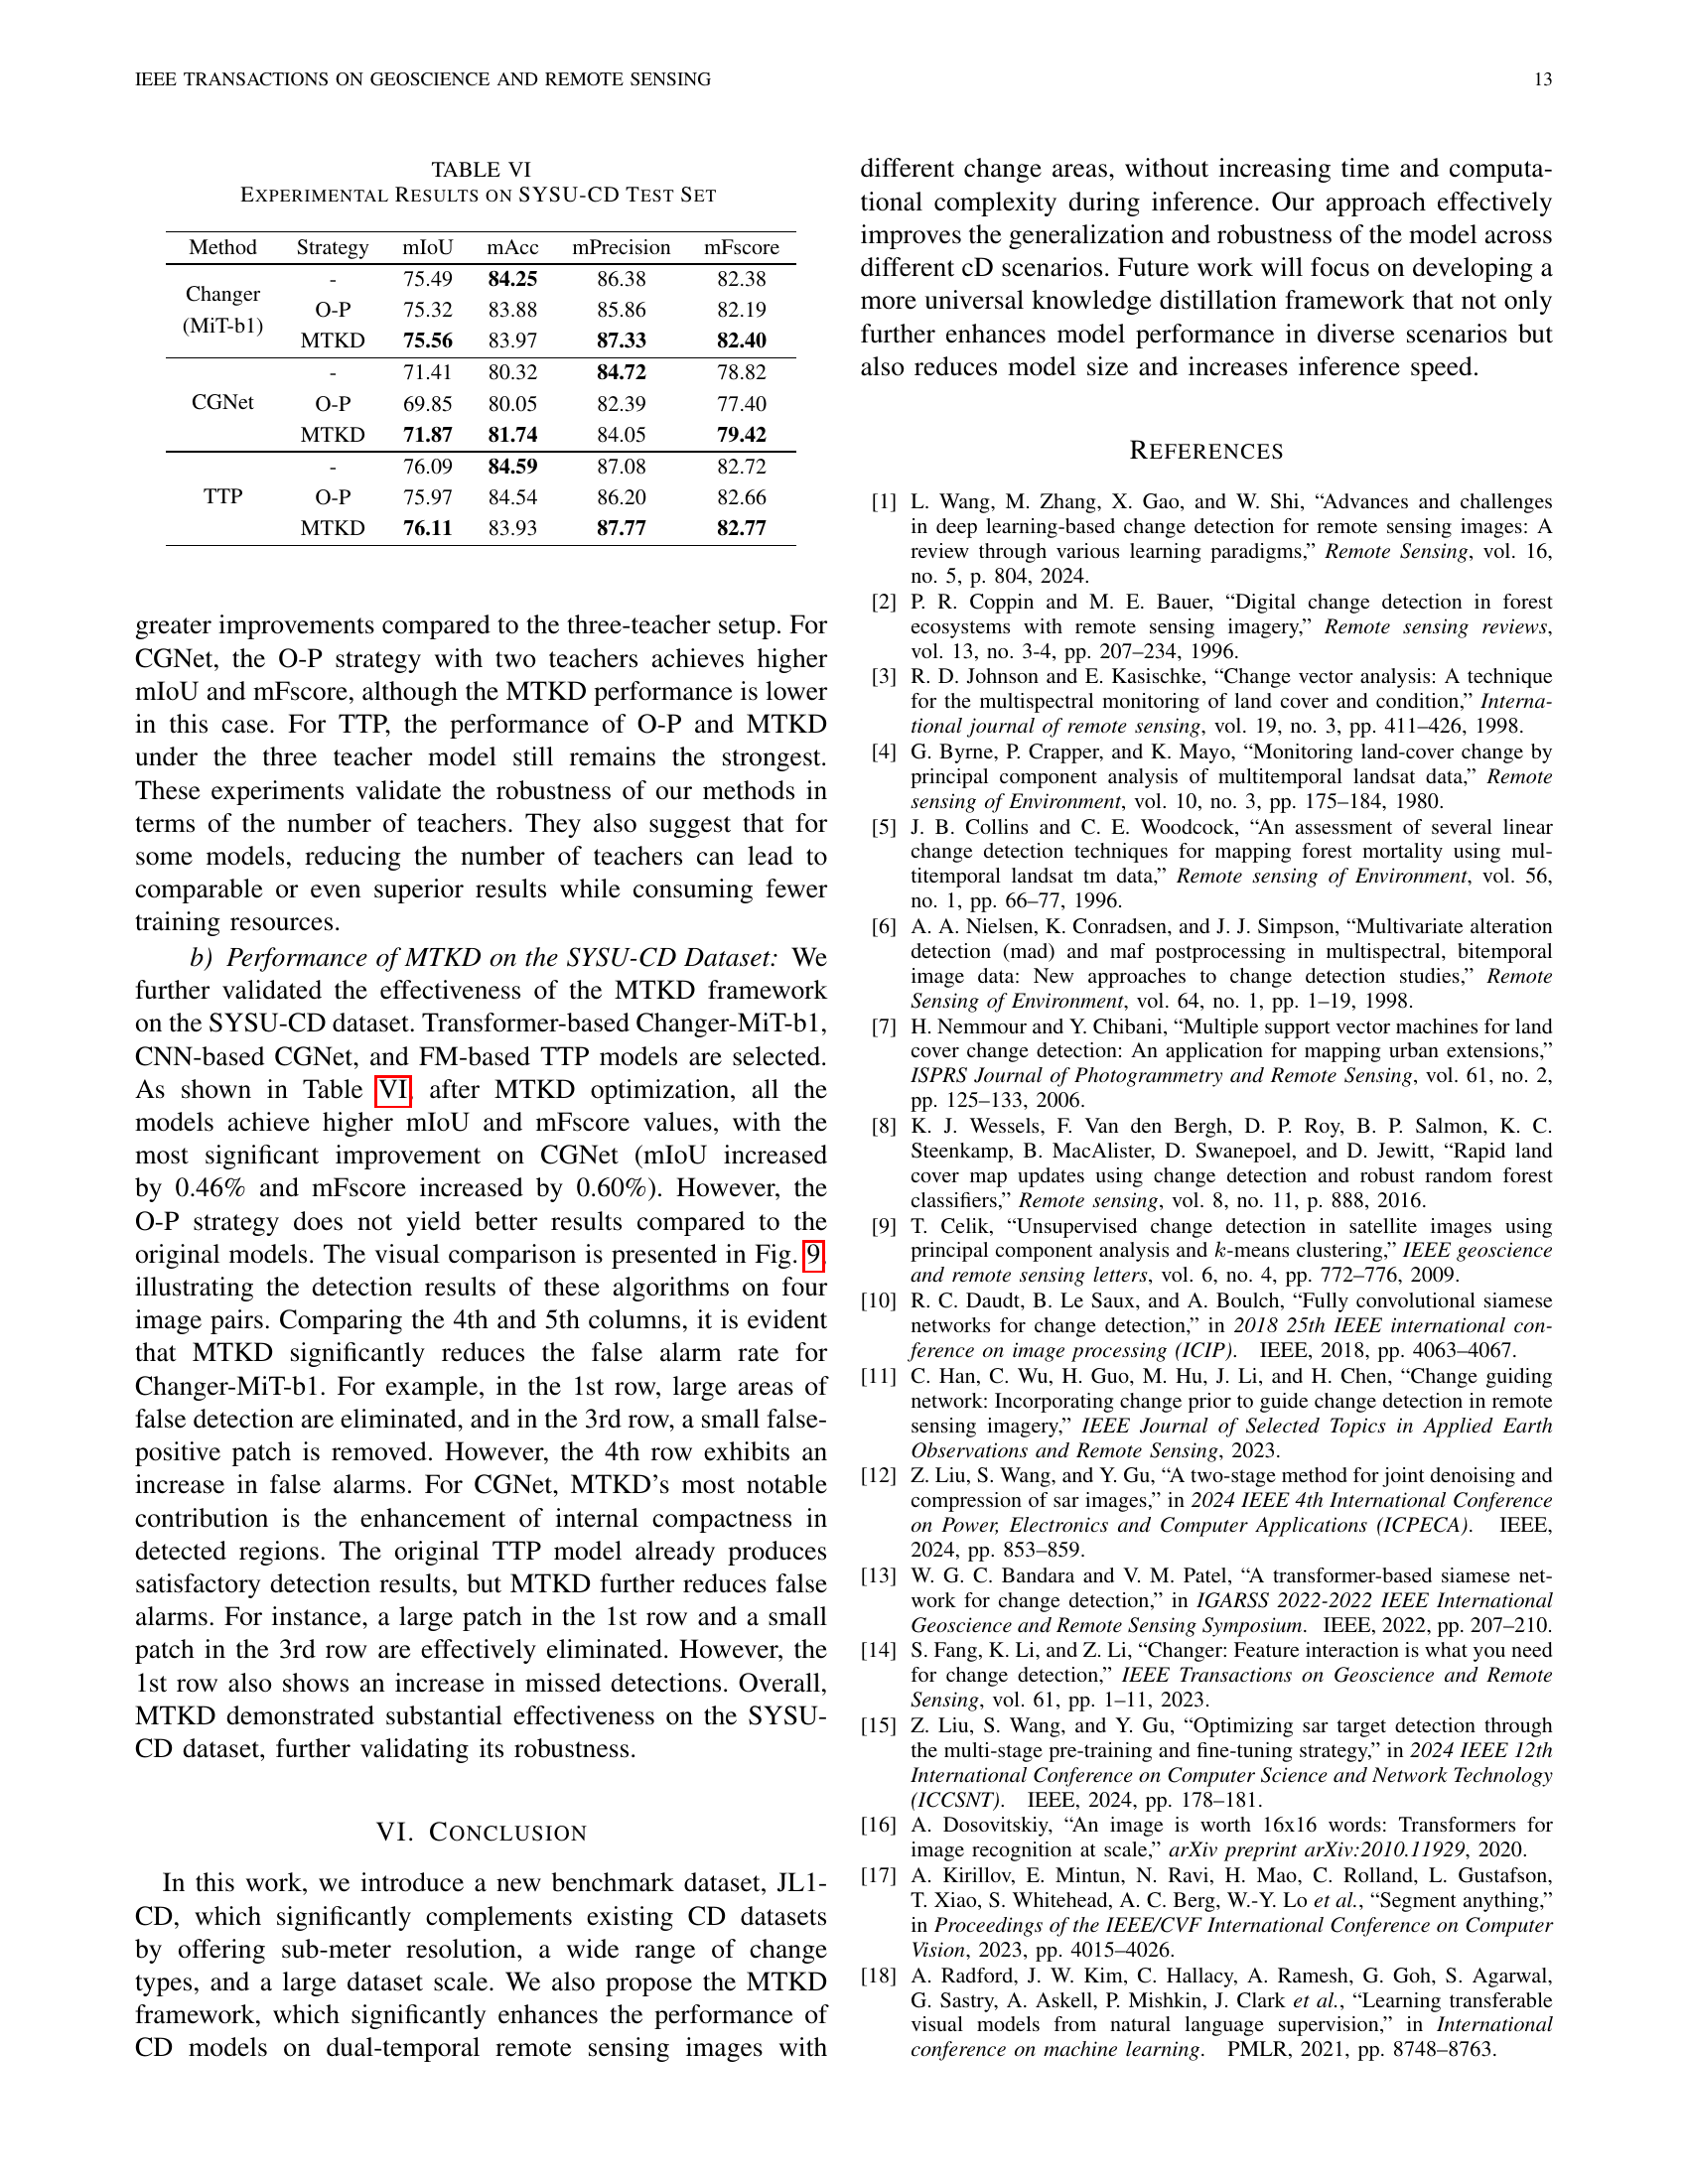
🔼 This table presents the quantitative results of various change detection (CD) models evaluated on the SYSU-CD test dataset. It displays the performance metrics of different models using different training strategies: the original training approach, the Origin-Partition (O-P) strategy, and the Multi-Teacher Knowledge Distillation (MTKD) framework. The metrics shown include mean Intersection over Union (mIoU), mean accuracy (mAcc), mean precision (mPrecision), and mean F1-score (mFscore). These metrics assess the accuracy and robustness of each CD model in identifying changes in the images.
read the caption
TABLE VI: Experimental Results on SYSU-CD Test Set
Full paper#