TL;DR#
Automated survey generation is challenging due to the need for comprehensive, up-to-date references and standardized evaluation metrics. Existing methods suffer from limitations in retrieval, reference pre-processing, and expressive diversity, hindering their applicability in large-scale academic settings. Thus, there is a need to develop efficient systems for automated survey generation.
This paper introduces SURVEYX, a system that divides the survey composing process into Preparation and Generation phases. By introducing online reference retrieval, AttributeTree, and a re-polishing process, SURVEYX enhances survey composition efficacy. The system outperforms existing methods in content and citation quality.
Key Takeaways#
Why does it matter?#
SURVEYX automates academic survey generation, enhancing content and citation quality, offering a new approach to tackle information overload and boost research efficiency. This research is relevant to automate literature review and improve academic productivity.
Visual Insights#

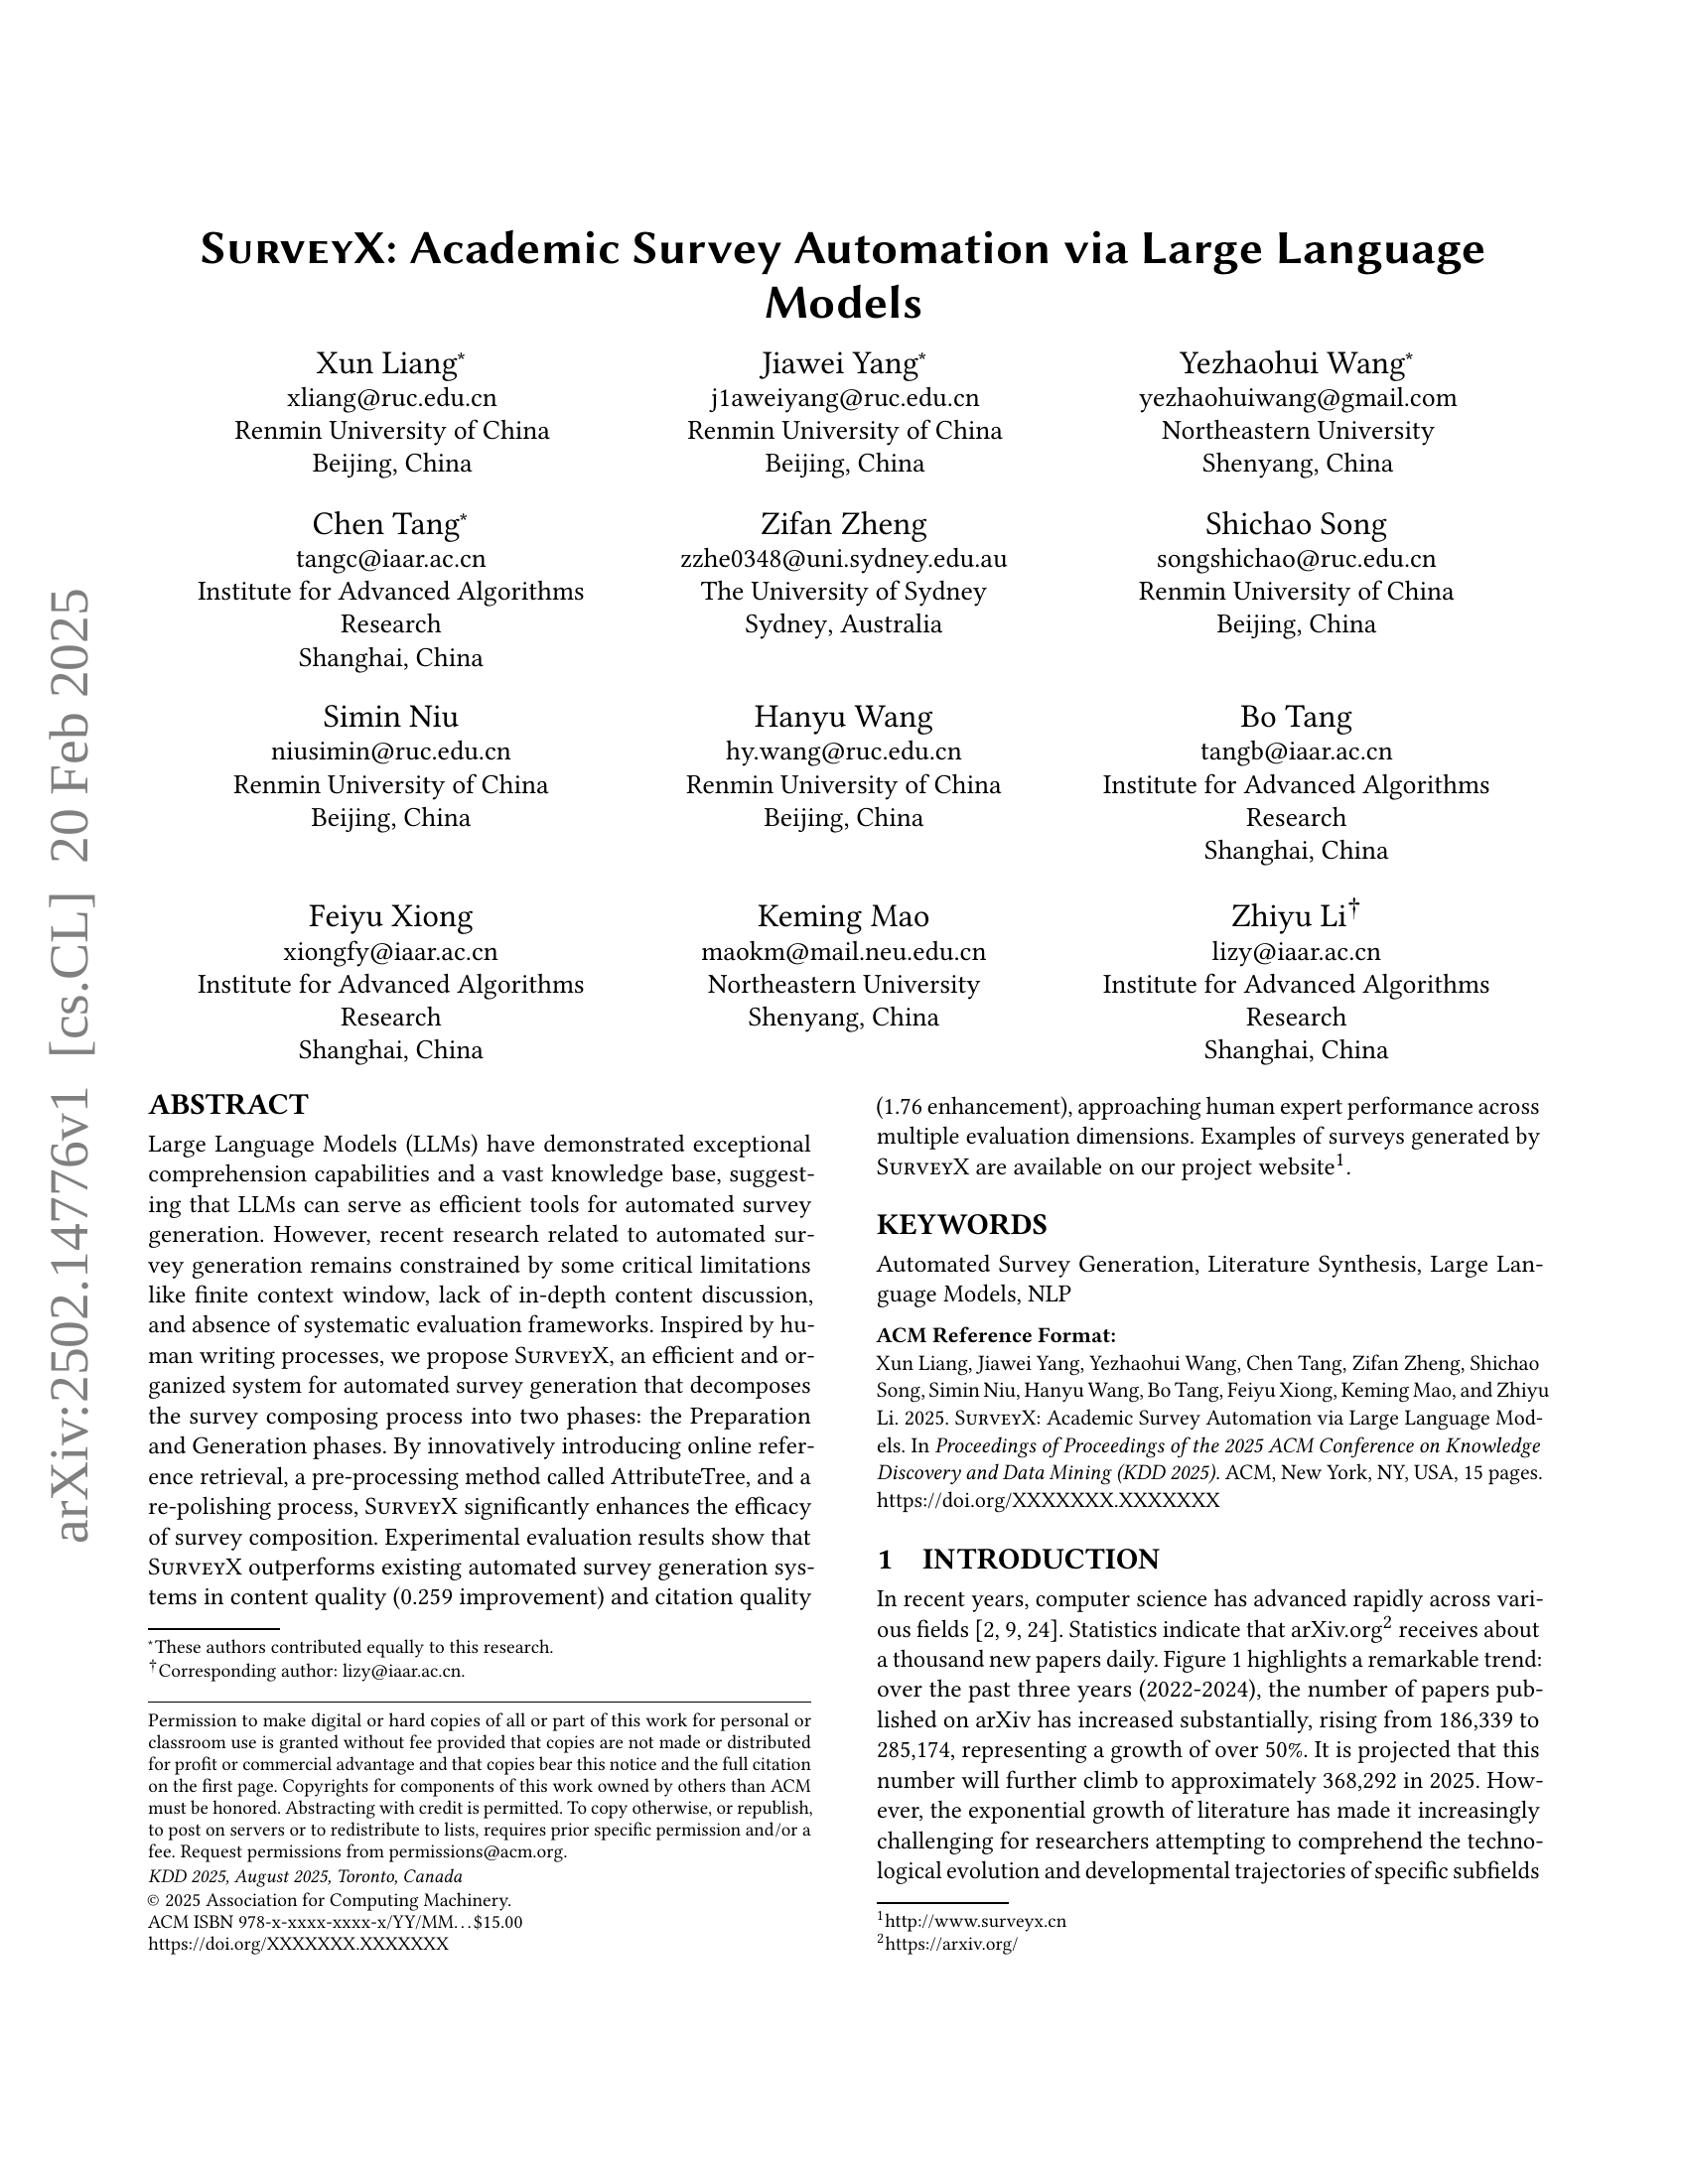
🔼 This figure shows a line graph illustrating the significant growth in the number of research papers submitted to arXiv.org over time, from 2010 to 2025. The data, sourced from the authors’ own arXiv database, reveals an exponential increase in submissions, culminating in a projected number for 2025 that is five times higher than the number in 2010. This visually represents the substantial increase in research output and the challenges this presents for researchers seeking to keep up with the latest advancements.
read the caption
Figure 1. The number of papers received annually by the arXiv website from 2010 to 2025, with data sourced from our arXiv database. The projected number of submissions for 2025 is anticipated to be five times greater than that of 2010.
| Model | Coverage | Structure | Relevance | Synthesis |
| Avg | Recall | Precision | F1 | |||
|---|---|---|---|---|---|---|---|---|---|---|---|---|
| naive RAG | 4.40 | 3.66 | 4.66 | 3.82 | 2.82 | 3.872 | 68.79 | 61.97 | 65.20 | |||
| AutoSurvey | 4.73 | 4.33 | 4.86 | 4.00 | 3.73 | 4.331 | 82.25 | 77.41 | 79.76 | |||
| SurveyX | 4.95 | 4.91 | 4.94 | 4.10 | 4.05 | 4.590 | 85.23 | 78.12 | 81.52 | |||
| Human | 5.00 | 4.95 | 5.00 | 4.44 | 4.38 | 4.754 | 86.33 | 77.78 | 81.83 |
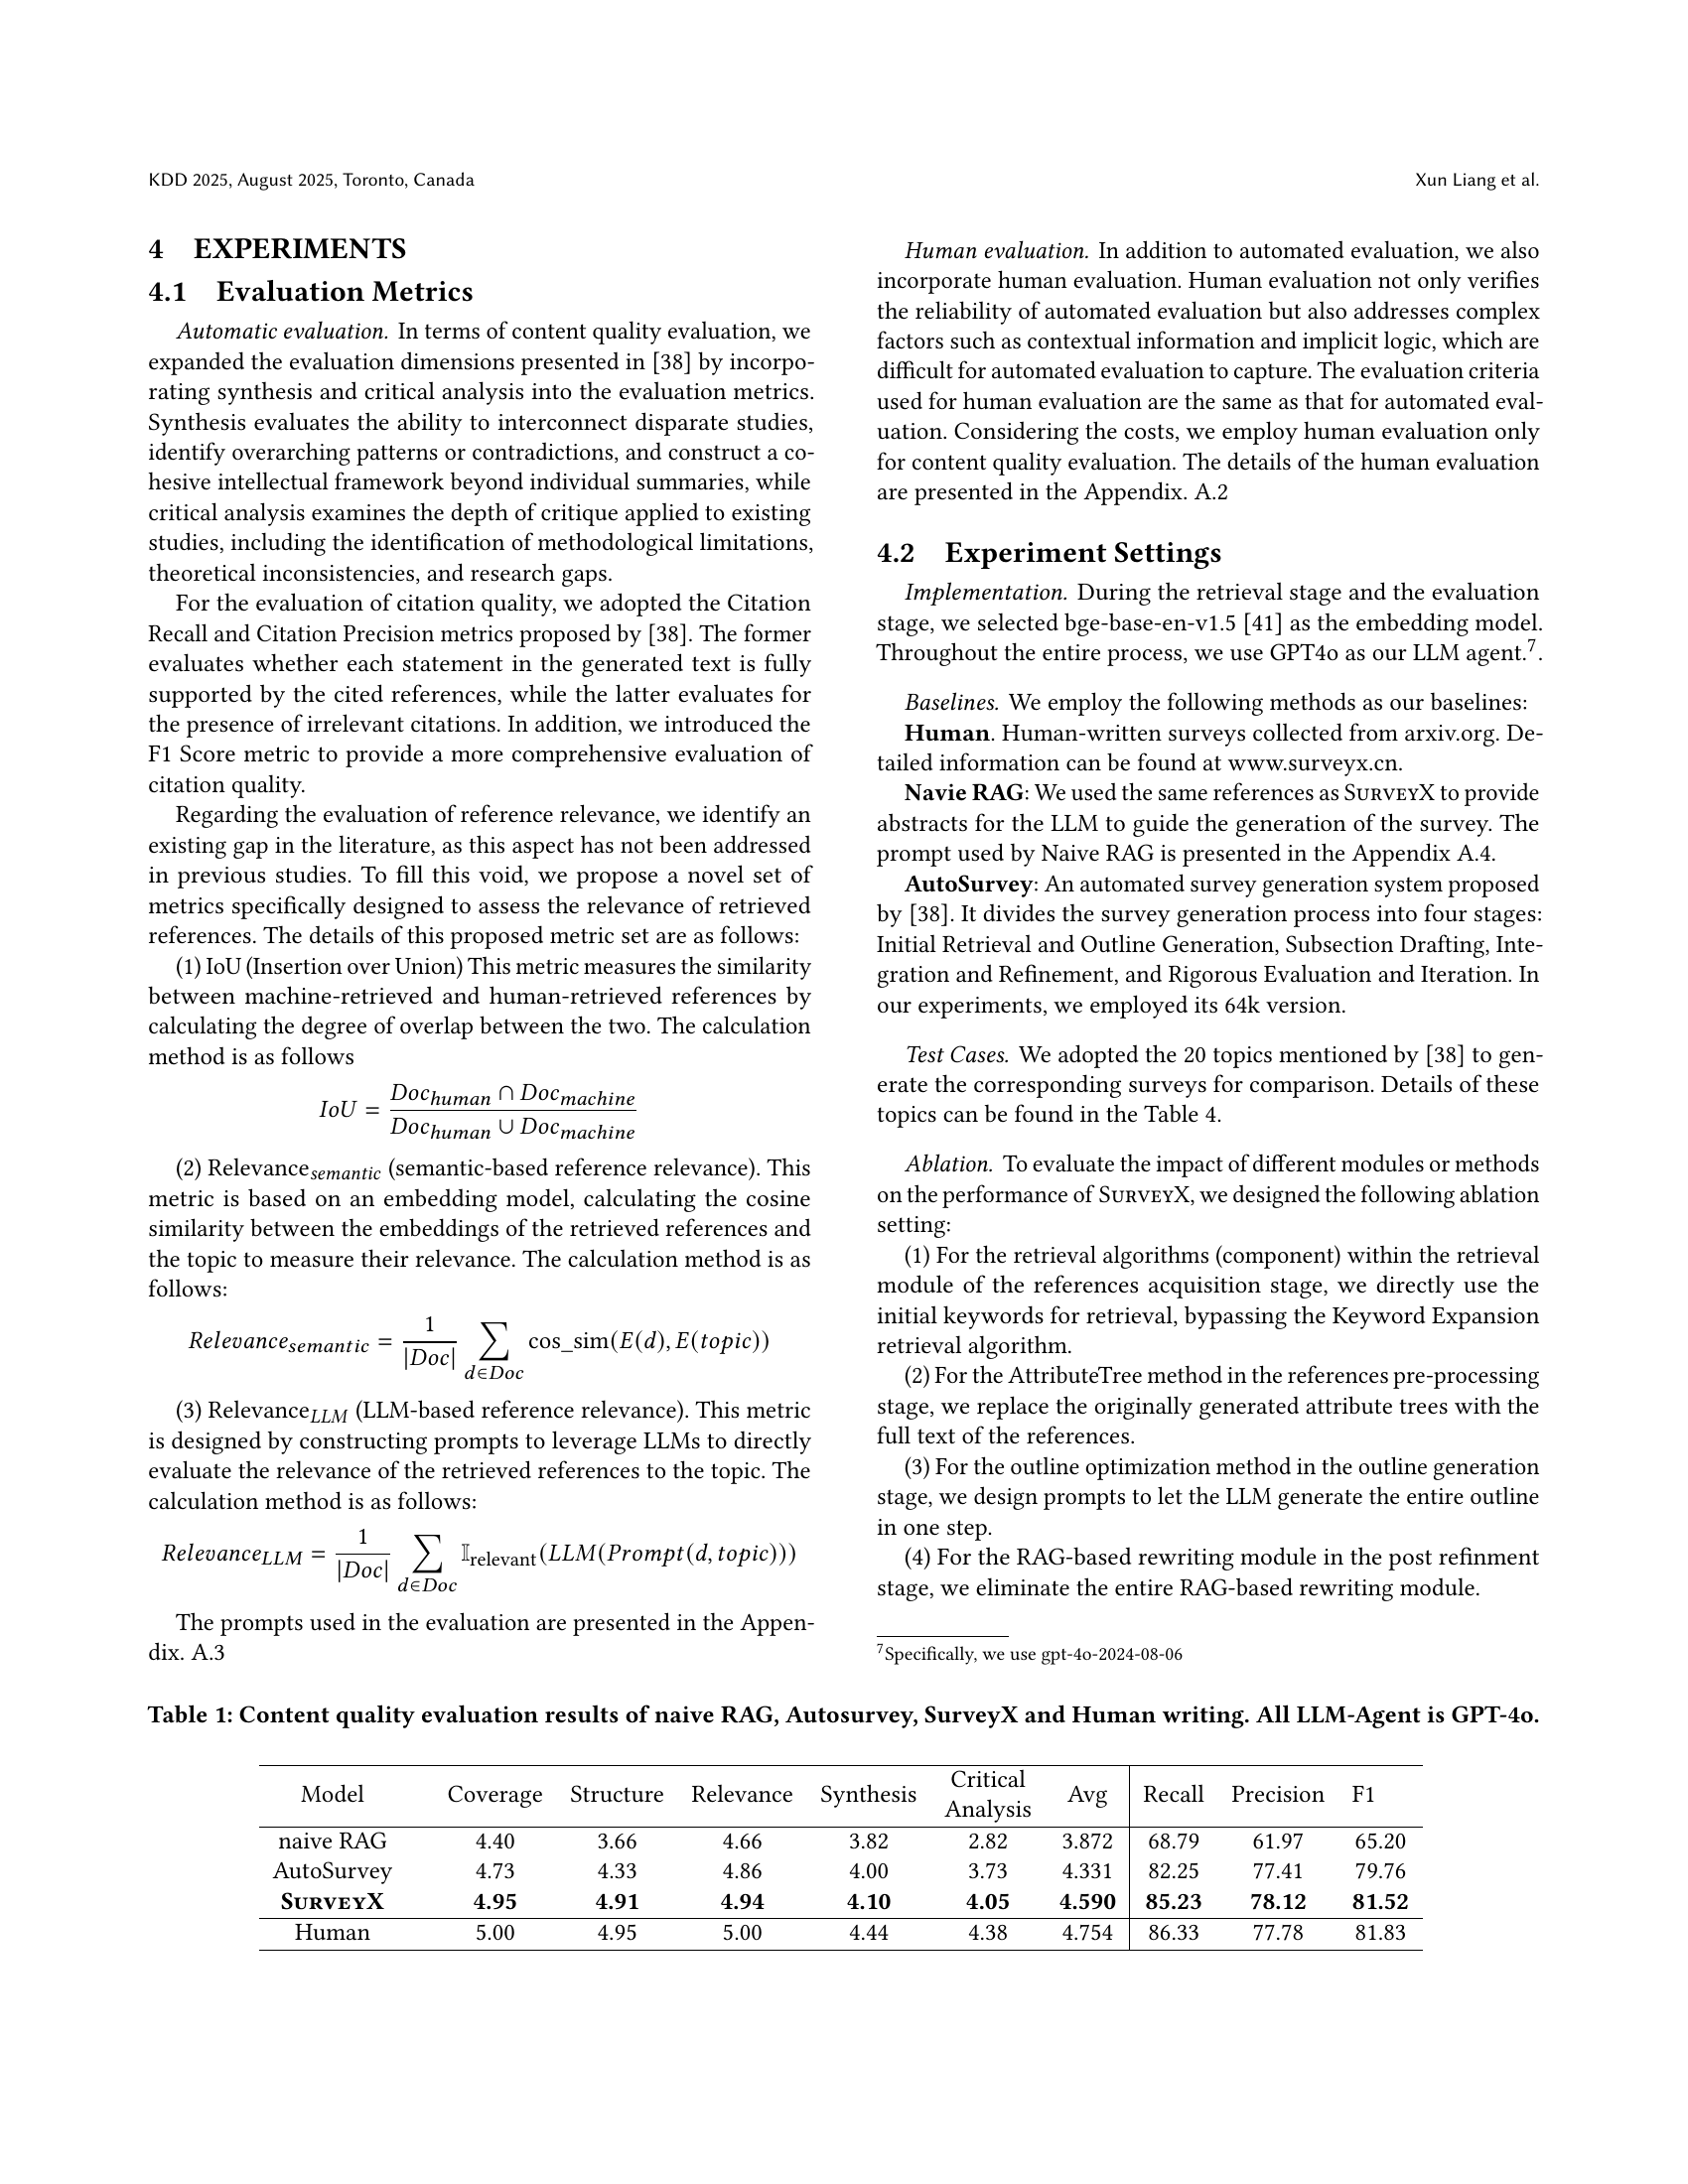
🔼 This table presents a quantitative comparison of the content quality achieved by four different methods for automated survey generation: naive RAG, AutoSurvey, SurveyX, and human writing. The content quality is assessed using multiple metrics: Coverage, Structure, Relevance, Synthesis, and Critical Analysis. Each metric is scored on a scale, allowing for a comprehensive evaluation of the strengths and weaknesses of each approach. The use of human writing provides a baseline representing expert-level performance against which the automated methods are judged. The fact that all methods use GPT-40 as the LLM agent ensures consistent conditions across the comparisons.
read the caption
Table 1. Content quality evaluation results of naive RAG, Autosurvey, SurveyX and Human writing. All LLM-Agent is GPT-4o.
In-depth insights#
SurveyX Overview#
SurveyX is a novel system for automated survey generation, addressing limitations in LLM-based approaches. It innovatively combines online reference retrieval, a pre-processing method called AttributeTree, and a re-polishing process to enhance survey composition. By decomposing the process into Preparation and Generation phases, SurveyX aims to improve content quality and citation accuracy. The system leverages LLMs and RAG efficiently, using attribute trees, and enhancing context, surpassing existing solutions. Experimental results confirm SurveyX’s superiority in content quality and citation quality, making it a valuable tool for researchers facing information overload.
Retrieval System#
The retrieval system is a core component, it significantly impacts the quality of the generated surveys. Efficient retrieval is crucial due to the vast amount of available literature. The system should incorporate methods for expanding keywords to ensure coverage. A two-step filtering process refines the results. This emphasizes the need to balance recall (capturing all relevant papers) and precision (filtering out irrelevant ones). Semantic relevance is a key metric, suggesting embedding models and potentially LLMs for fine-grained filtering are used. The consideration of both offline and online data sources showcases a commitment to efficiency and timeliness. Effective retrieval enables high-quality surveys approaching human expert performance.
Outline Methods#
While the paper doesn’t explicitly use “Outline Methods” as a distinct heading, the creation of a structured survey is heavily reliant on outlining. SURVEYX emphasizes outline generation as a critical step, employing ‘Outline Optimization’ to produce logically rigorous and clear structures, vital for coherence. The method synthesizes LLM generated hints, removing redundancy using a separate-then-reorganize’ approach. This indicates a thought process similar to human outlining, ensuring logical flow and comprehensive coverage before deep content generation, thereby enhancing the quality and readability of the final survey.
RAG Rewriting#
The RAG-based rewriting module addresses content consistency and citation accuracy in generated surveys. It works by retrieving relevant reference materials from the attribute forest using initial draft paragraphs as queries. This is followed by constructing a prompt using these materials to rewrite the paragraph using LLMs. The rewriting process aims to improve content consistency, remove irrelevant citations, and add highly relevant ones, significantly enhancing citation quality and ensuring context relevance. This module plays a crucial role to maintain the integrity and reliability of the automated surveys.
SurveyX Results#
Based on the text, SURVEYX outperforms existing automated survey generation systems and approaches human expert performance, specifically in content and citation quality. Key to SURVEYX is the ability to retrieve high-quality, relevant references and utilize them effectively for survey composition. Results reveal that converting reference content into an attribute tree enables the LLM to better organize information, improving outline coherence and content depth, thus reducing reliance on internal knowledge and promoting external knowledge integration. Additionally, a RAG-based rewriting module helps enhance the survey’s citation quality. These findings highlight SURVEYX’s potential as a valuable tool for academic survey automation, offering a substantial performance boost. The paper also points to the future improvement scope such as retrieval algorithms to match human retrieval level. Finally, all ablation experiments point to a large performance boost.
More visual insights#
More on figures

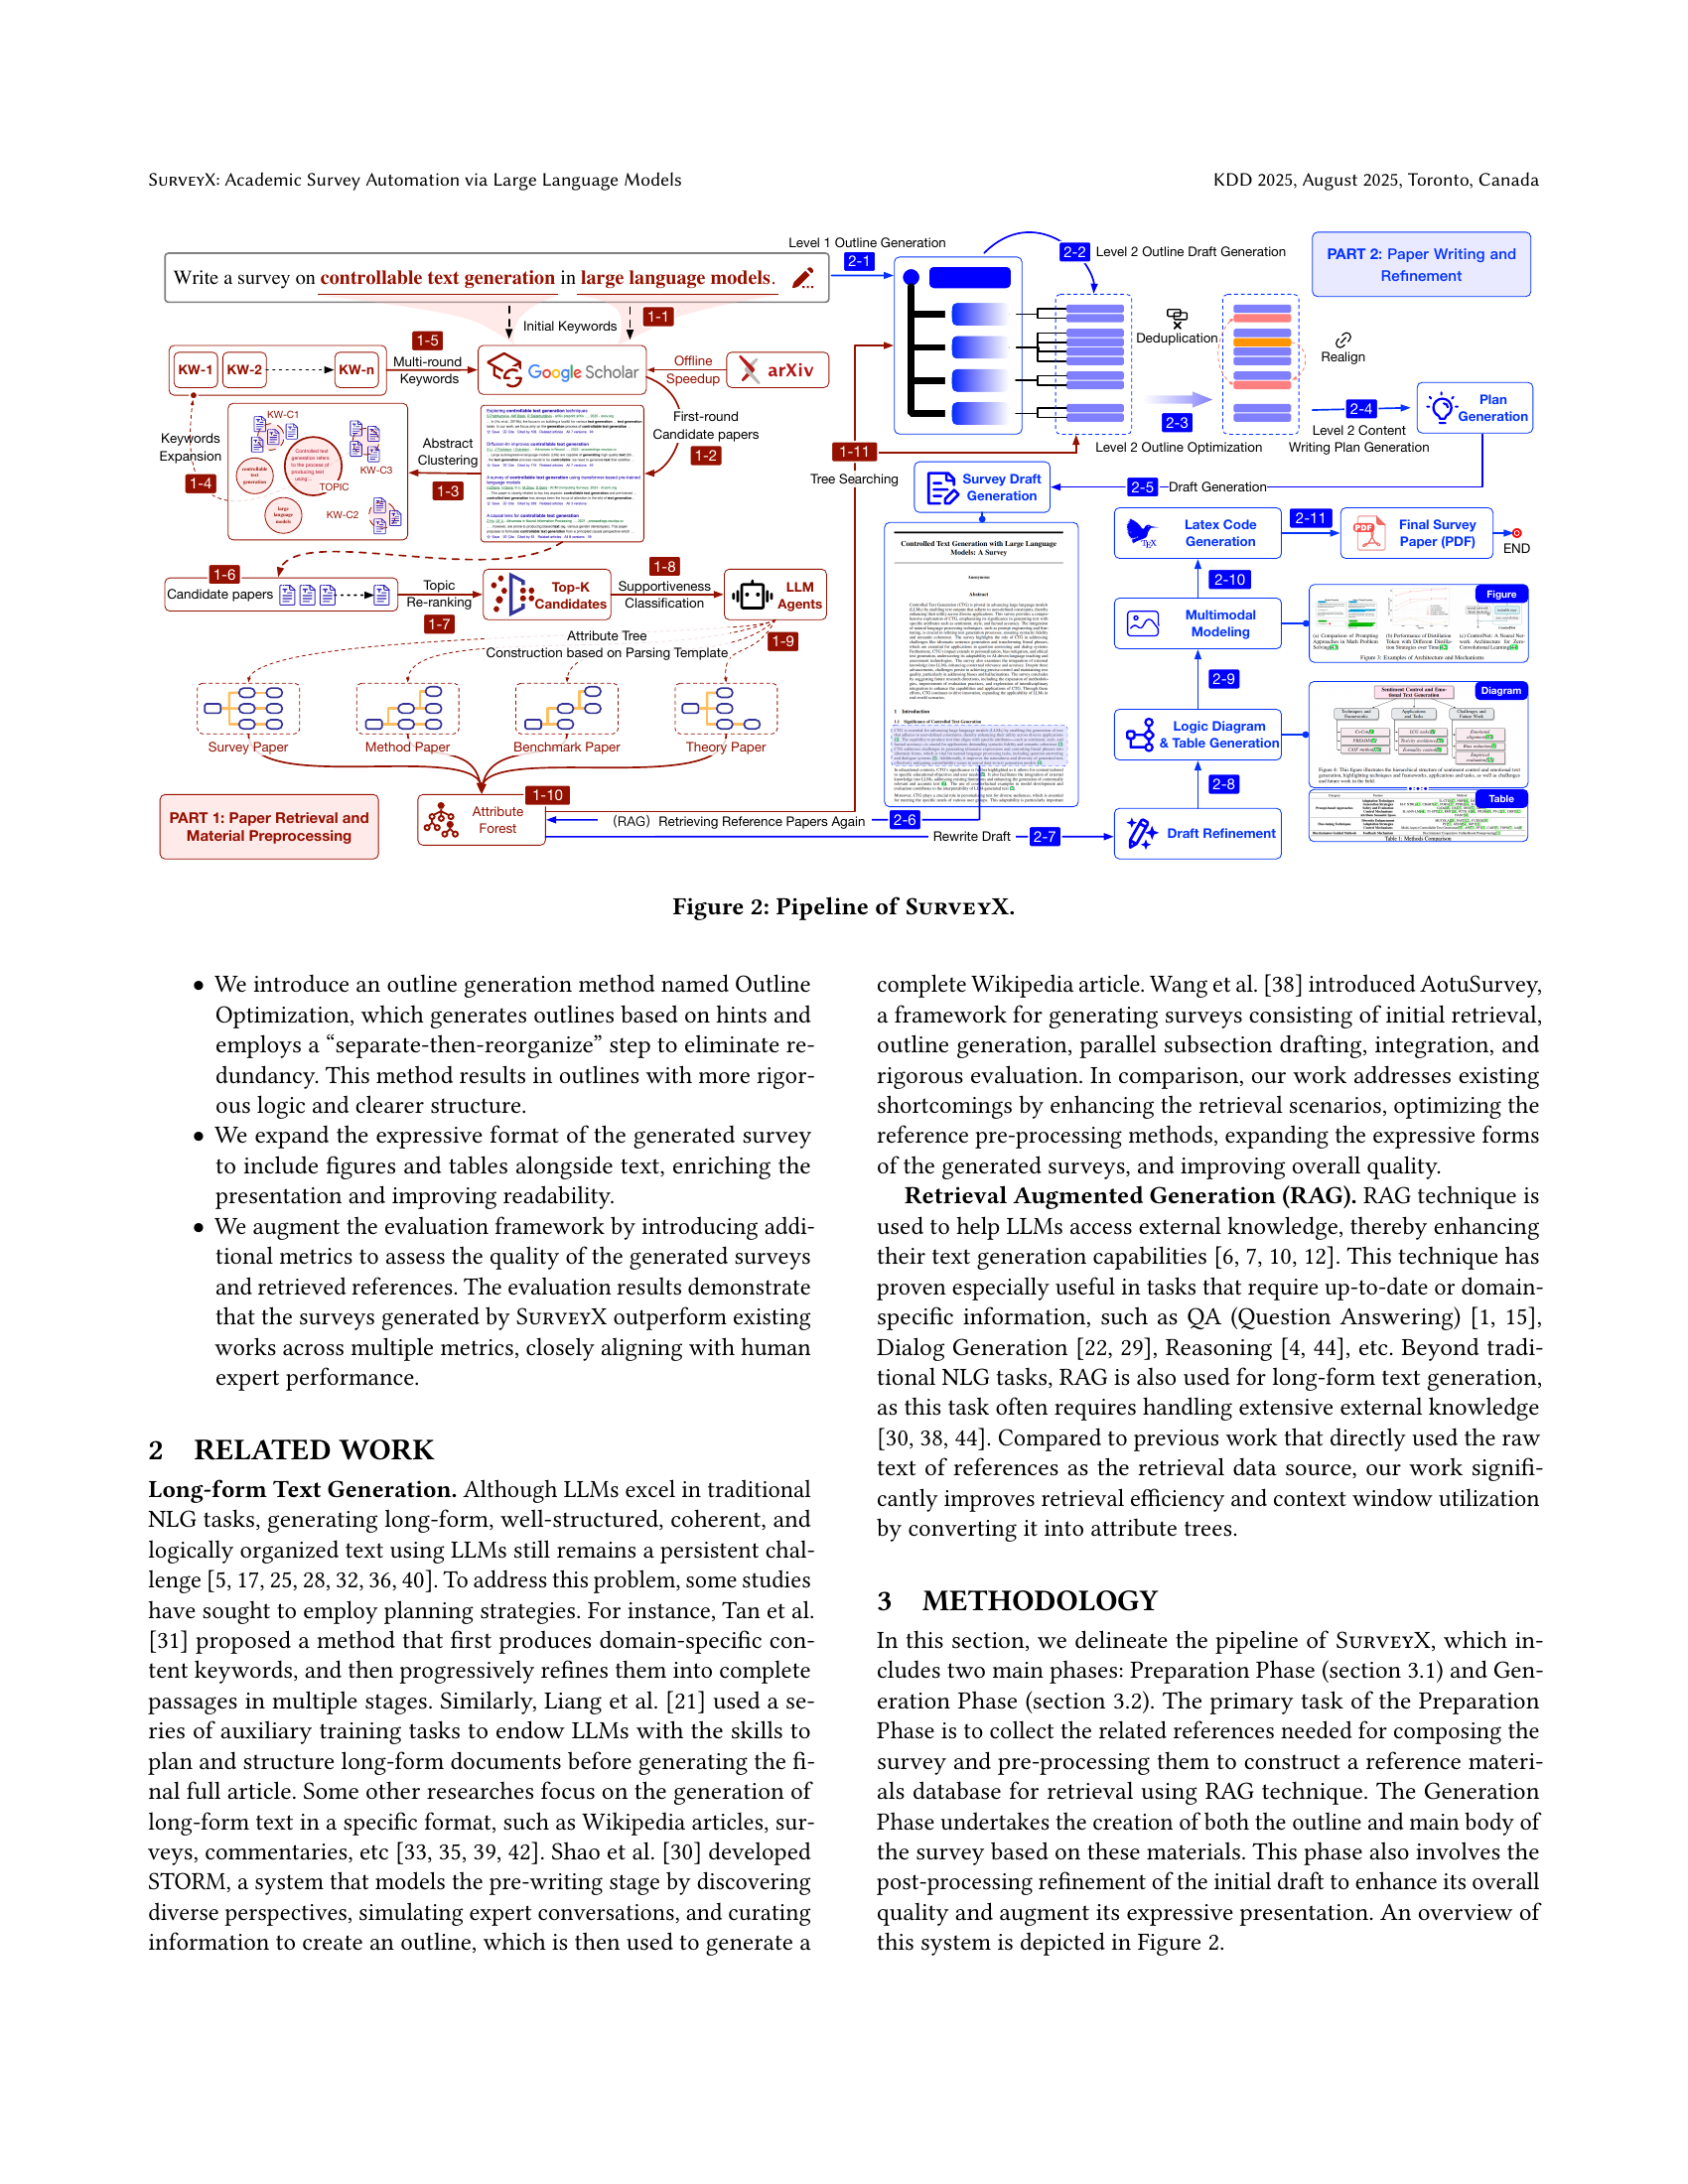
🔼 This figure details the pipeline of the SURVEYX system for automated survey generation. It visually depicts the two main phases: the Preparation Phase and the Generation Phase. The Preparation Phase involves acquiring and pre-processing relevant references using techniques like keyword expansion and the AttributeTree method. The Generation Phase then utilizes this processed information to generate the survey’s outline and content, incorporating figures and tables, and finally refining the draft for improved quality and presentation.
read the caption
Figure 2. Pipeline of SurveyX.

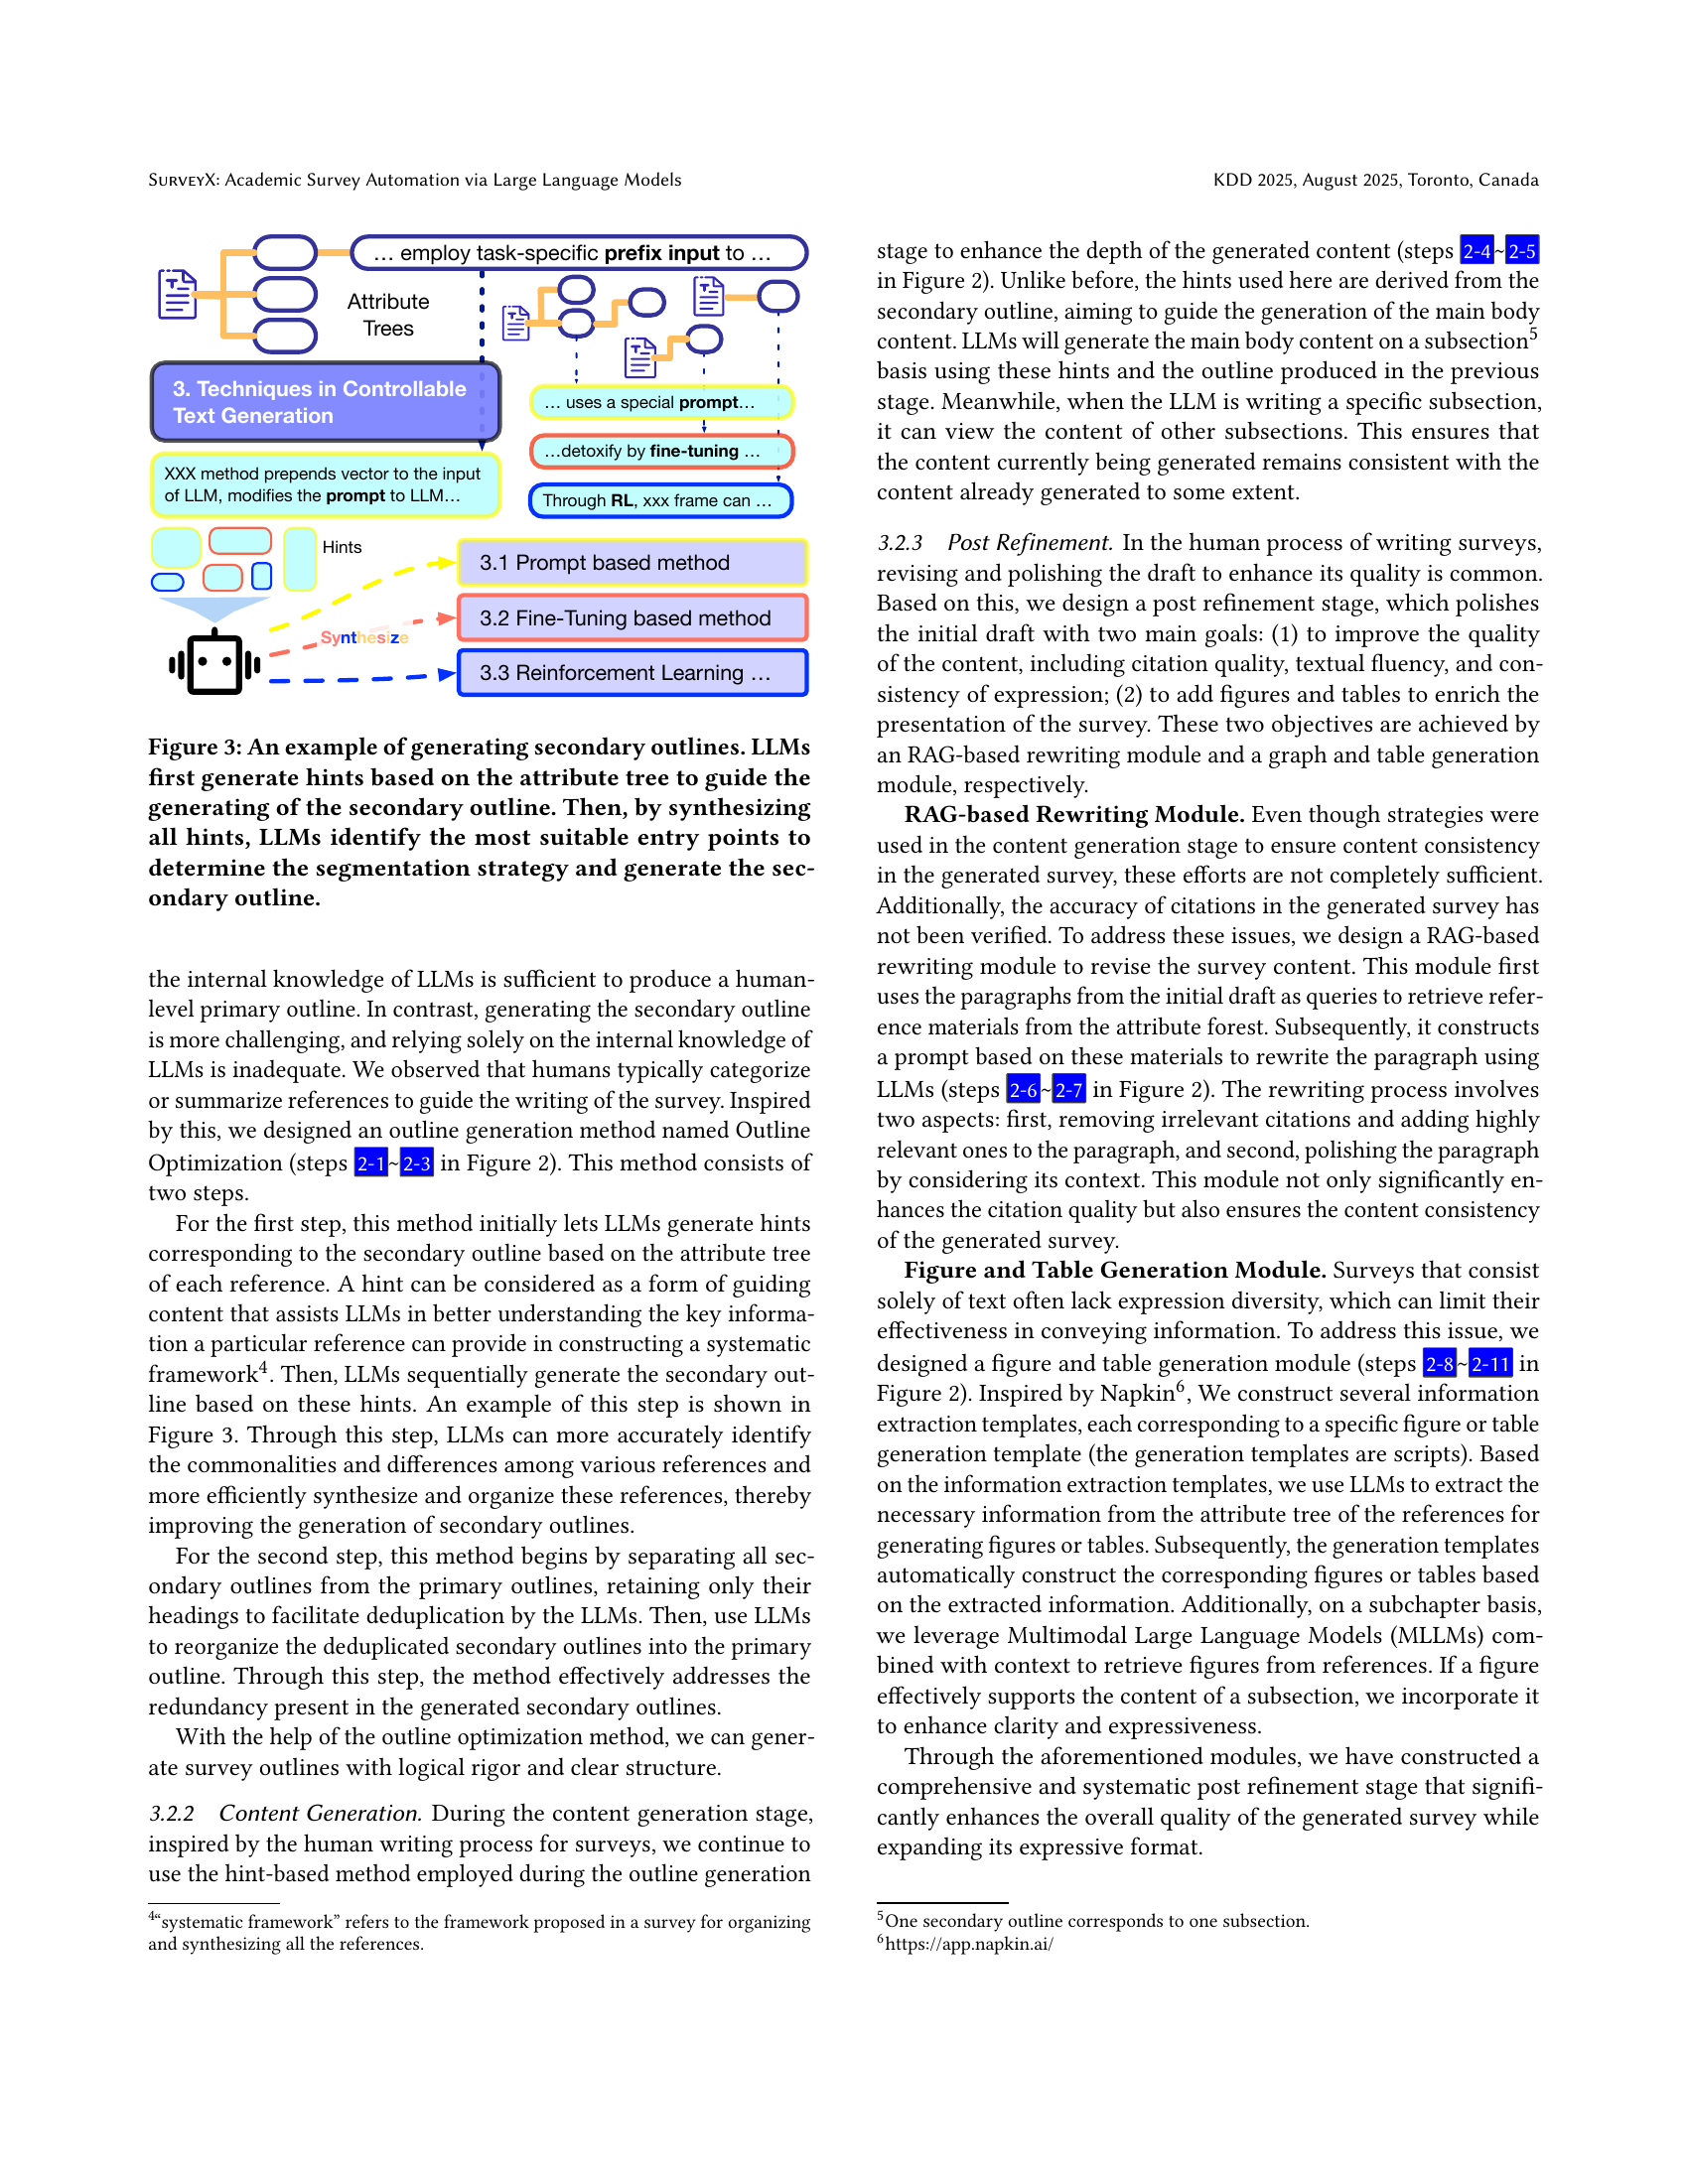
🔼 This figure illustrates the process of generating secondary outlines using Large Language Models (LLMs). The process starts with LLMs generating hints based on information extracted from the Attribute Tree (a pre-processing method described in the paper). These hints guide the LLM in creating the secondary outline. Subsequently, the LLM synthesizes all generated hints to identify the most appropriate entry points for creating a well-structured outline. This method helps ensure the resulting outline is comprehensive and well-organized.
read the caption
Figure 3. An example of generating secondary outlines. LLMs first generate hints based on the attribute tree to guide the generating of the secondary outline. Then, by synthesizing all hints, LLMs identify the most suitable entry points to determine the segmentation strategy and generate the secondary outline.
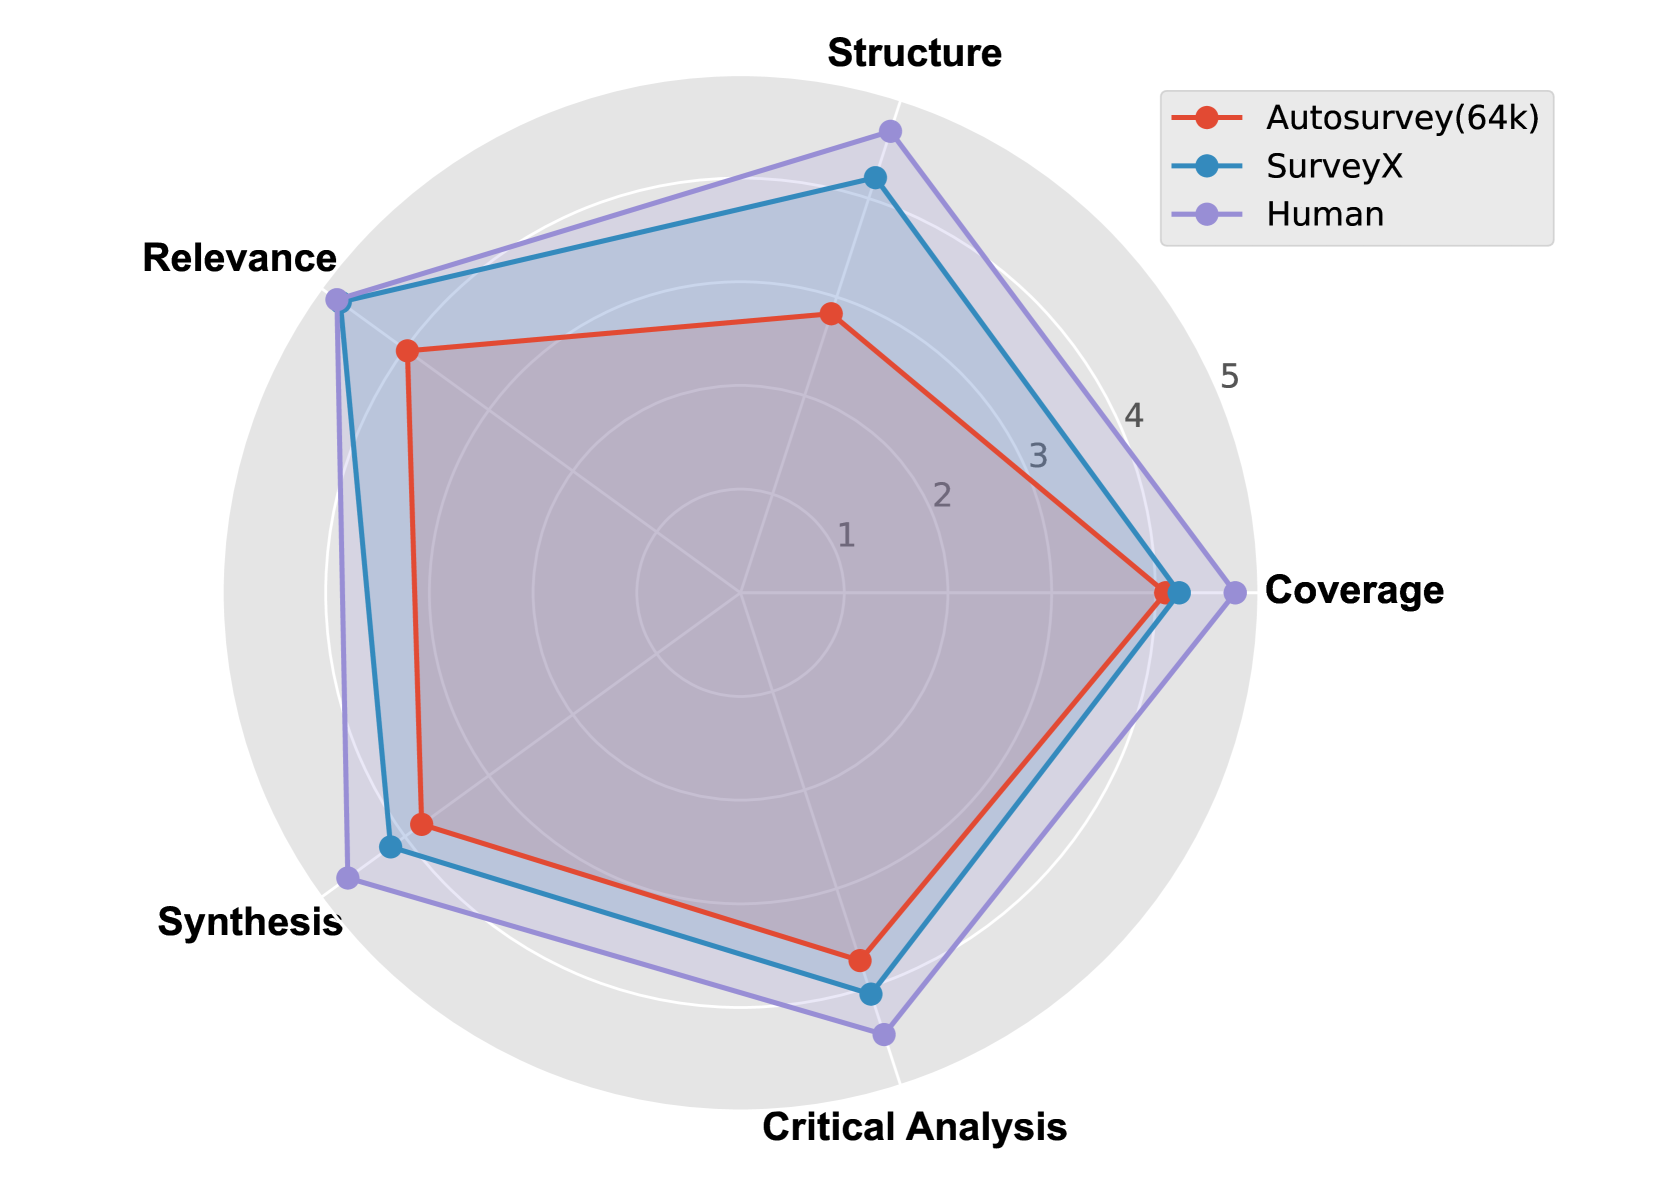
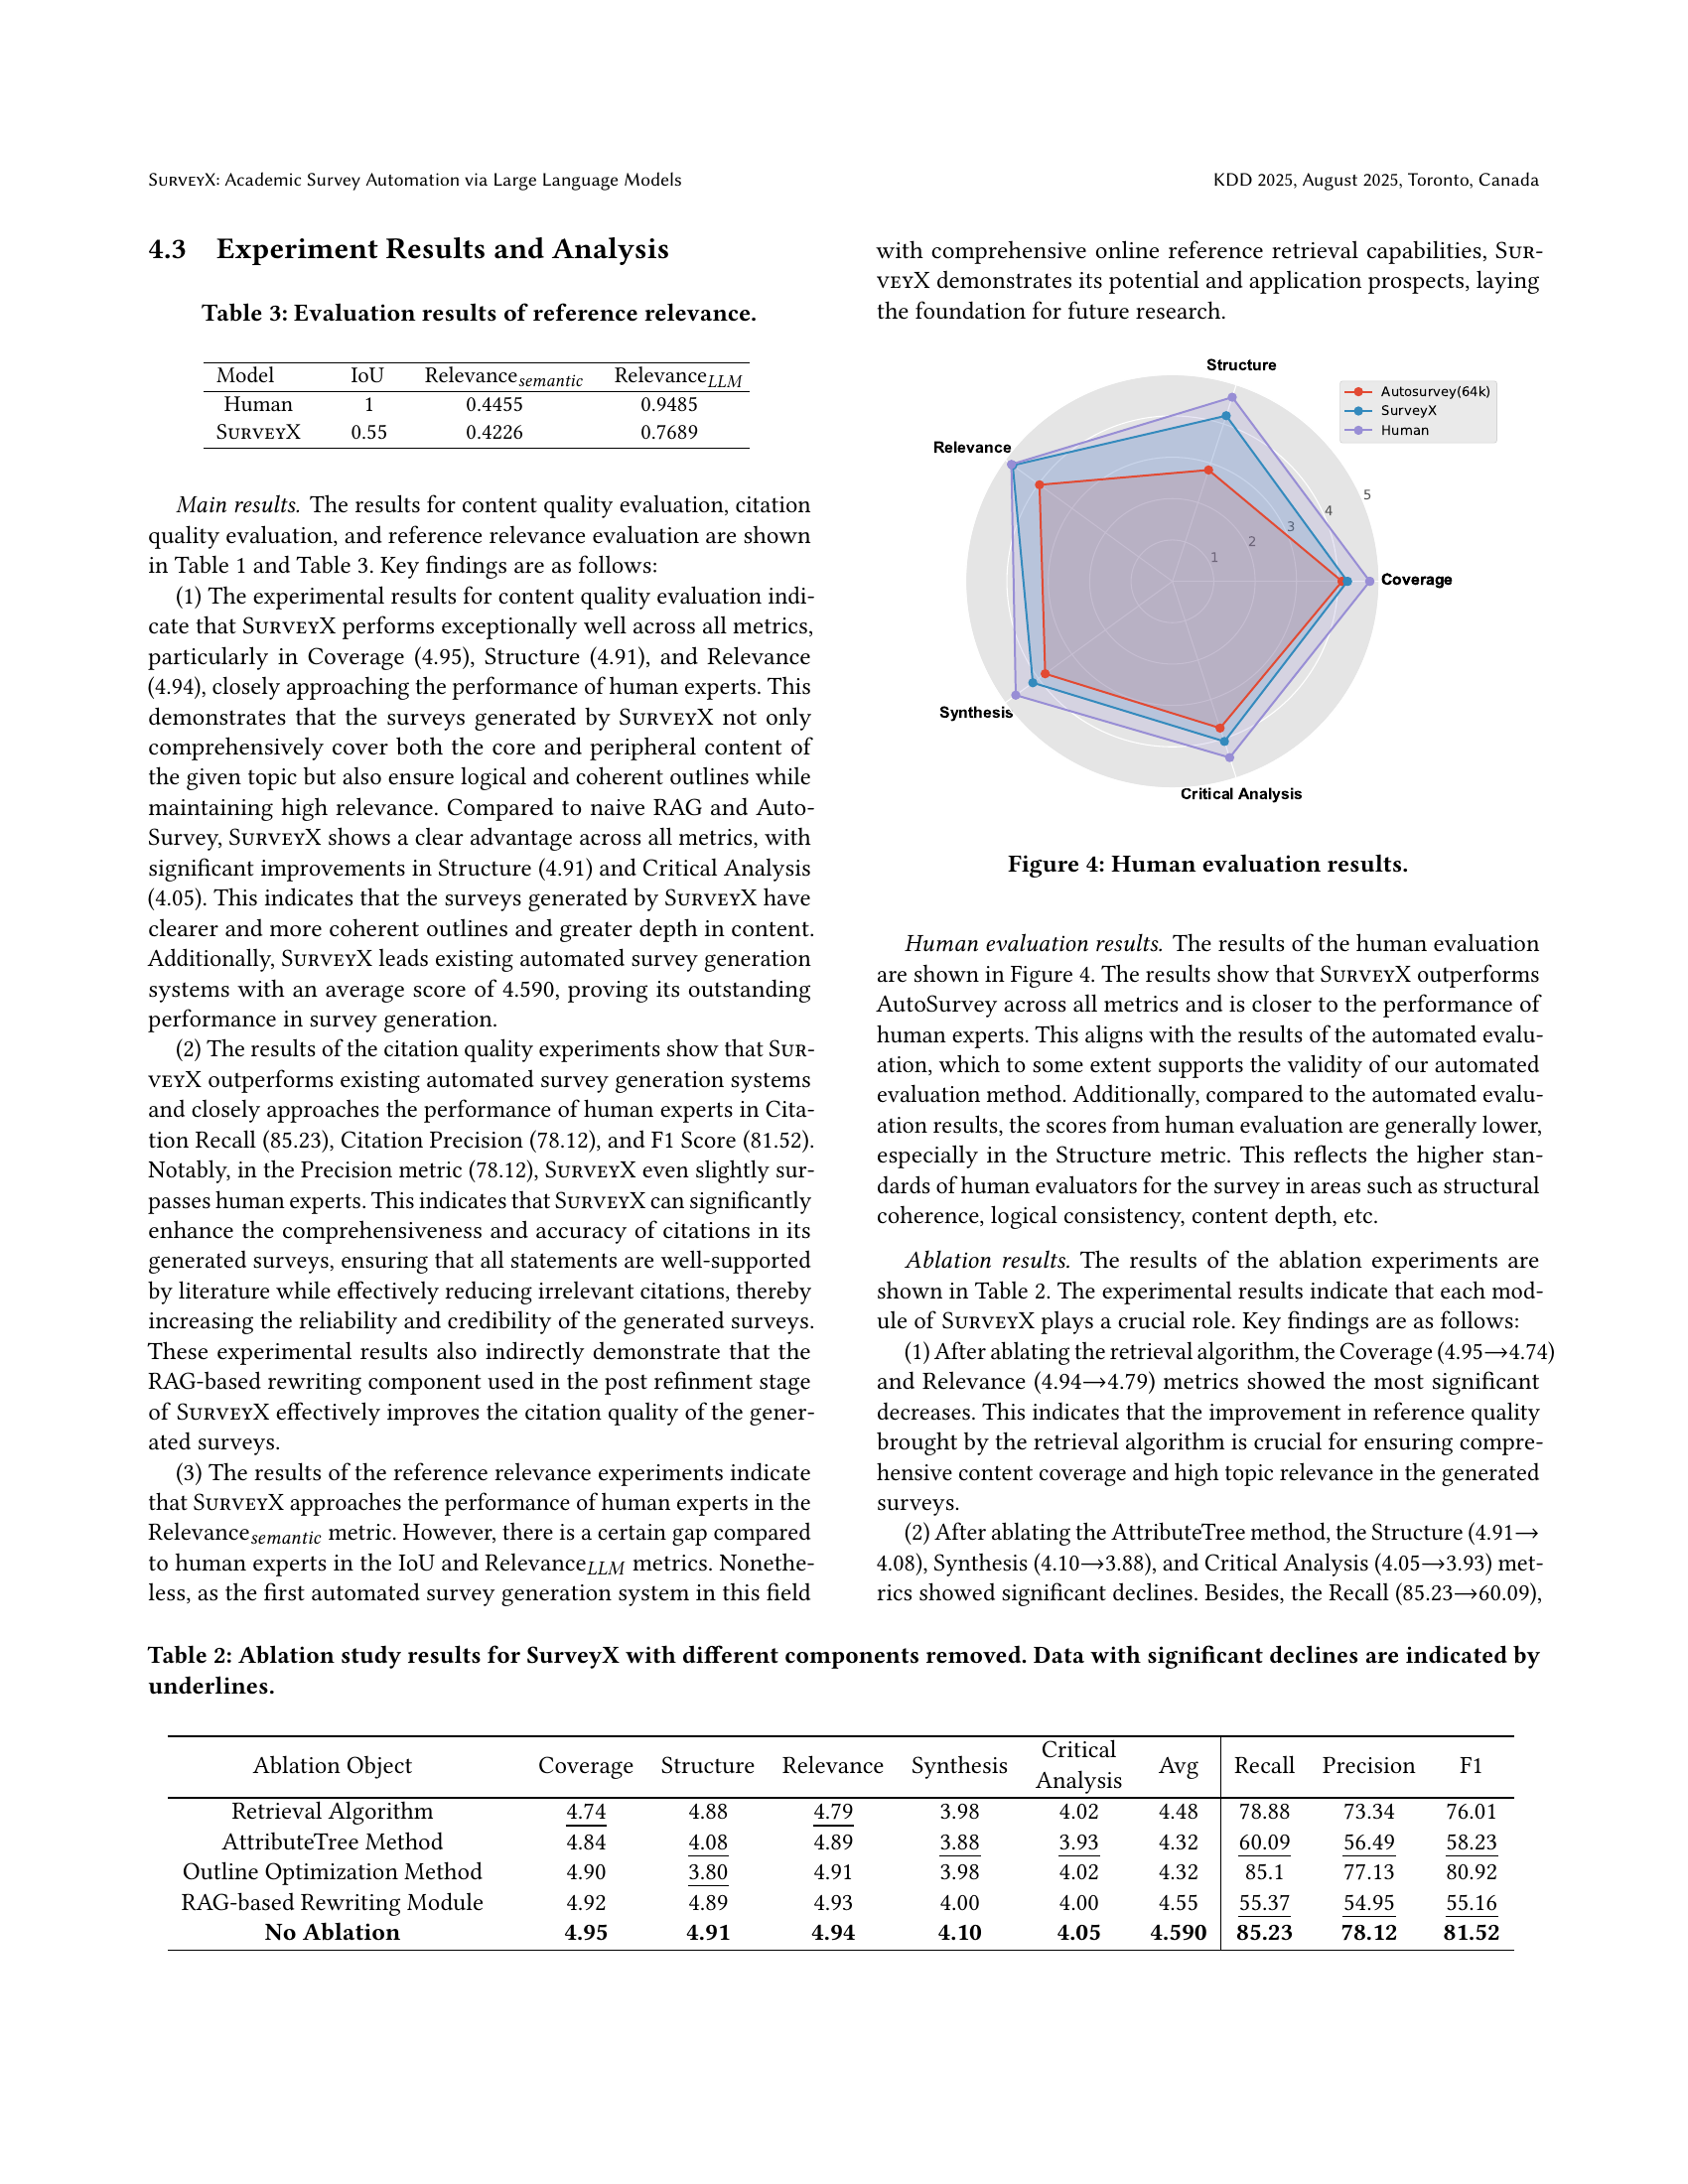
🔼 This figure presents a radar chart visualizing the results of human evaluation for the SURVEYX system and its baselines. Each axis represents a key aspect of survey quality (Coverage, Structure, Relevance, Synthesis, and Critical Analysis). The chart compares the performance of SURVEYX against human-written surveys and two baseline automated methods, illustrating SURVEYX’s strengths and weaknesses across multiple evaluation dimensions and highlighting its performance relative to both automated and human expert-level survey generation.
read the caption
Figure 4. Human evaluation results.

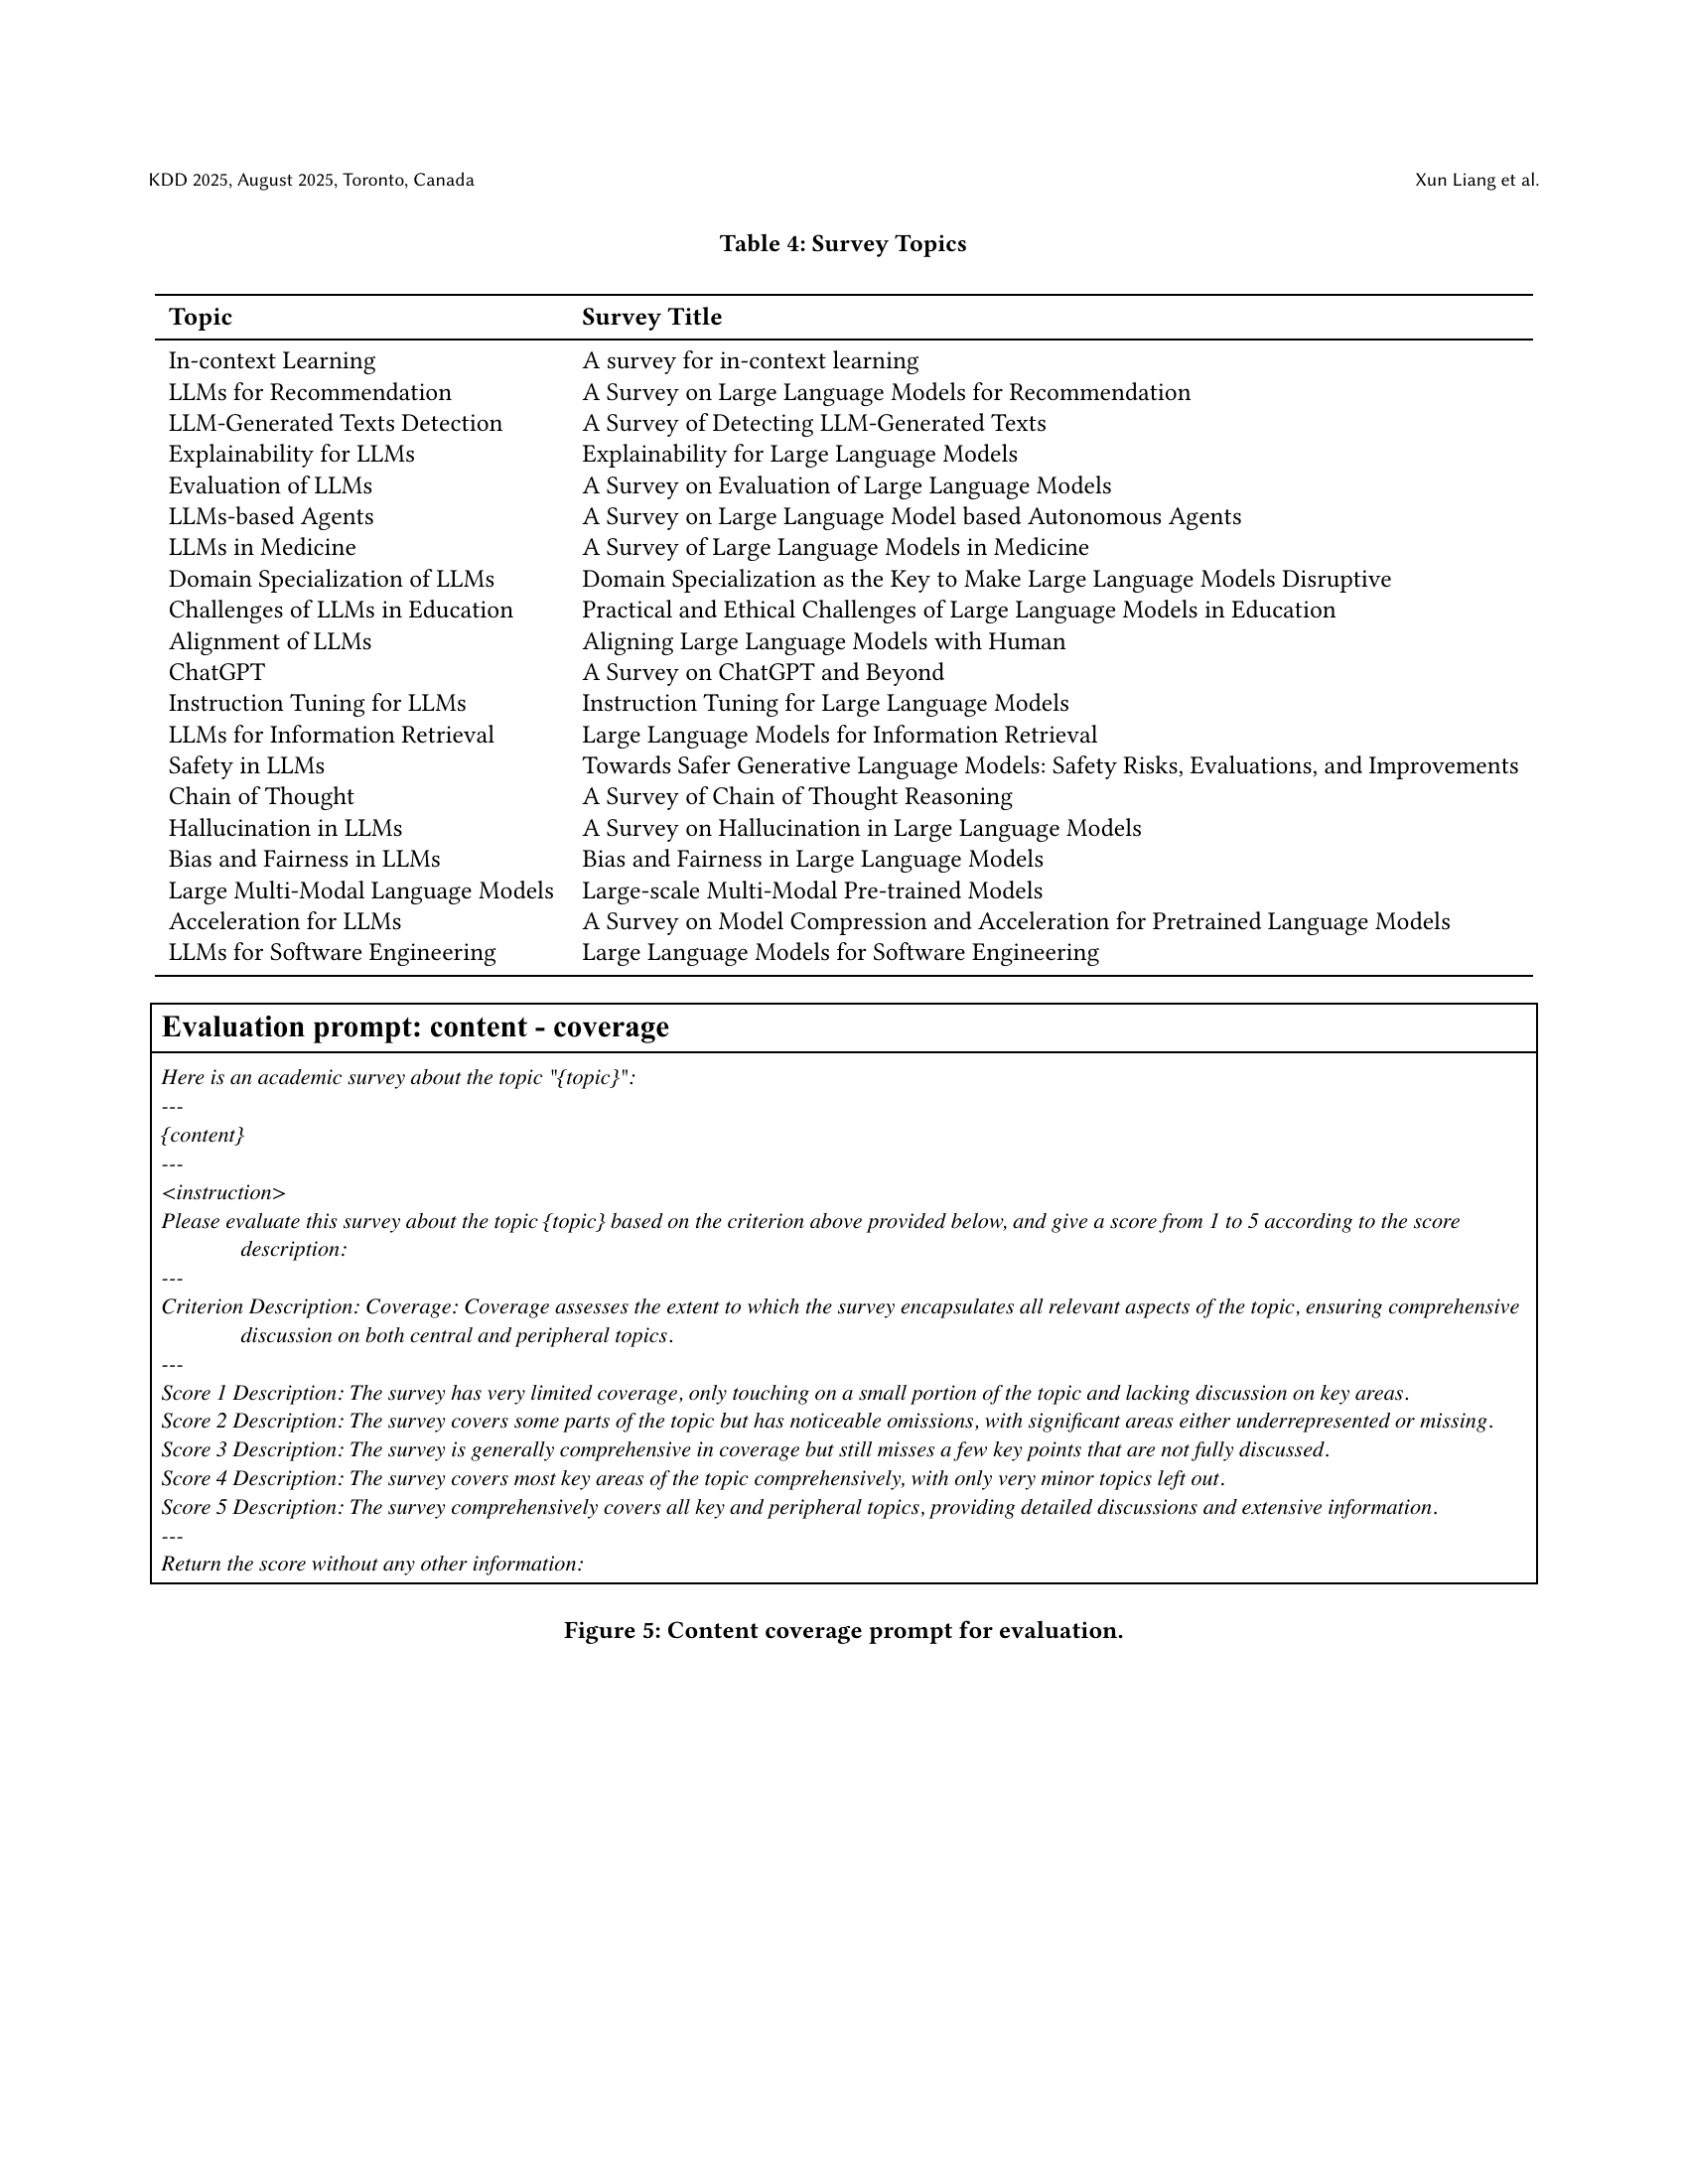
🔼 This figure shows the prompt used for evaluating the ‘content coverage’ aspect of automatically generated surveys. The prompt instructs evaluators to rate the survey’s comprehensiveness based on five levels: (1) very limited coverage, (2) some coverage but with significant omissions, (3) generally comprehensive but with a few missing points, (4) comprehensive but with only very minor omissions, and (5) completely comprehensive. This structured approach helps ensure consistent and reliable evaluation of the generated survey content.
read the caption
Figure 5. Content coverage prompt for evaluation.

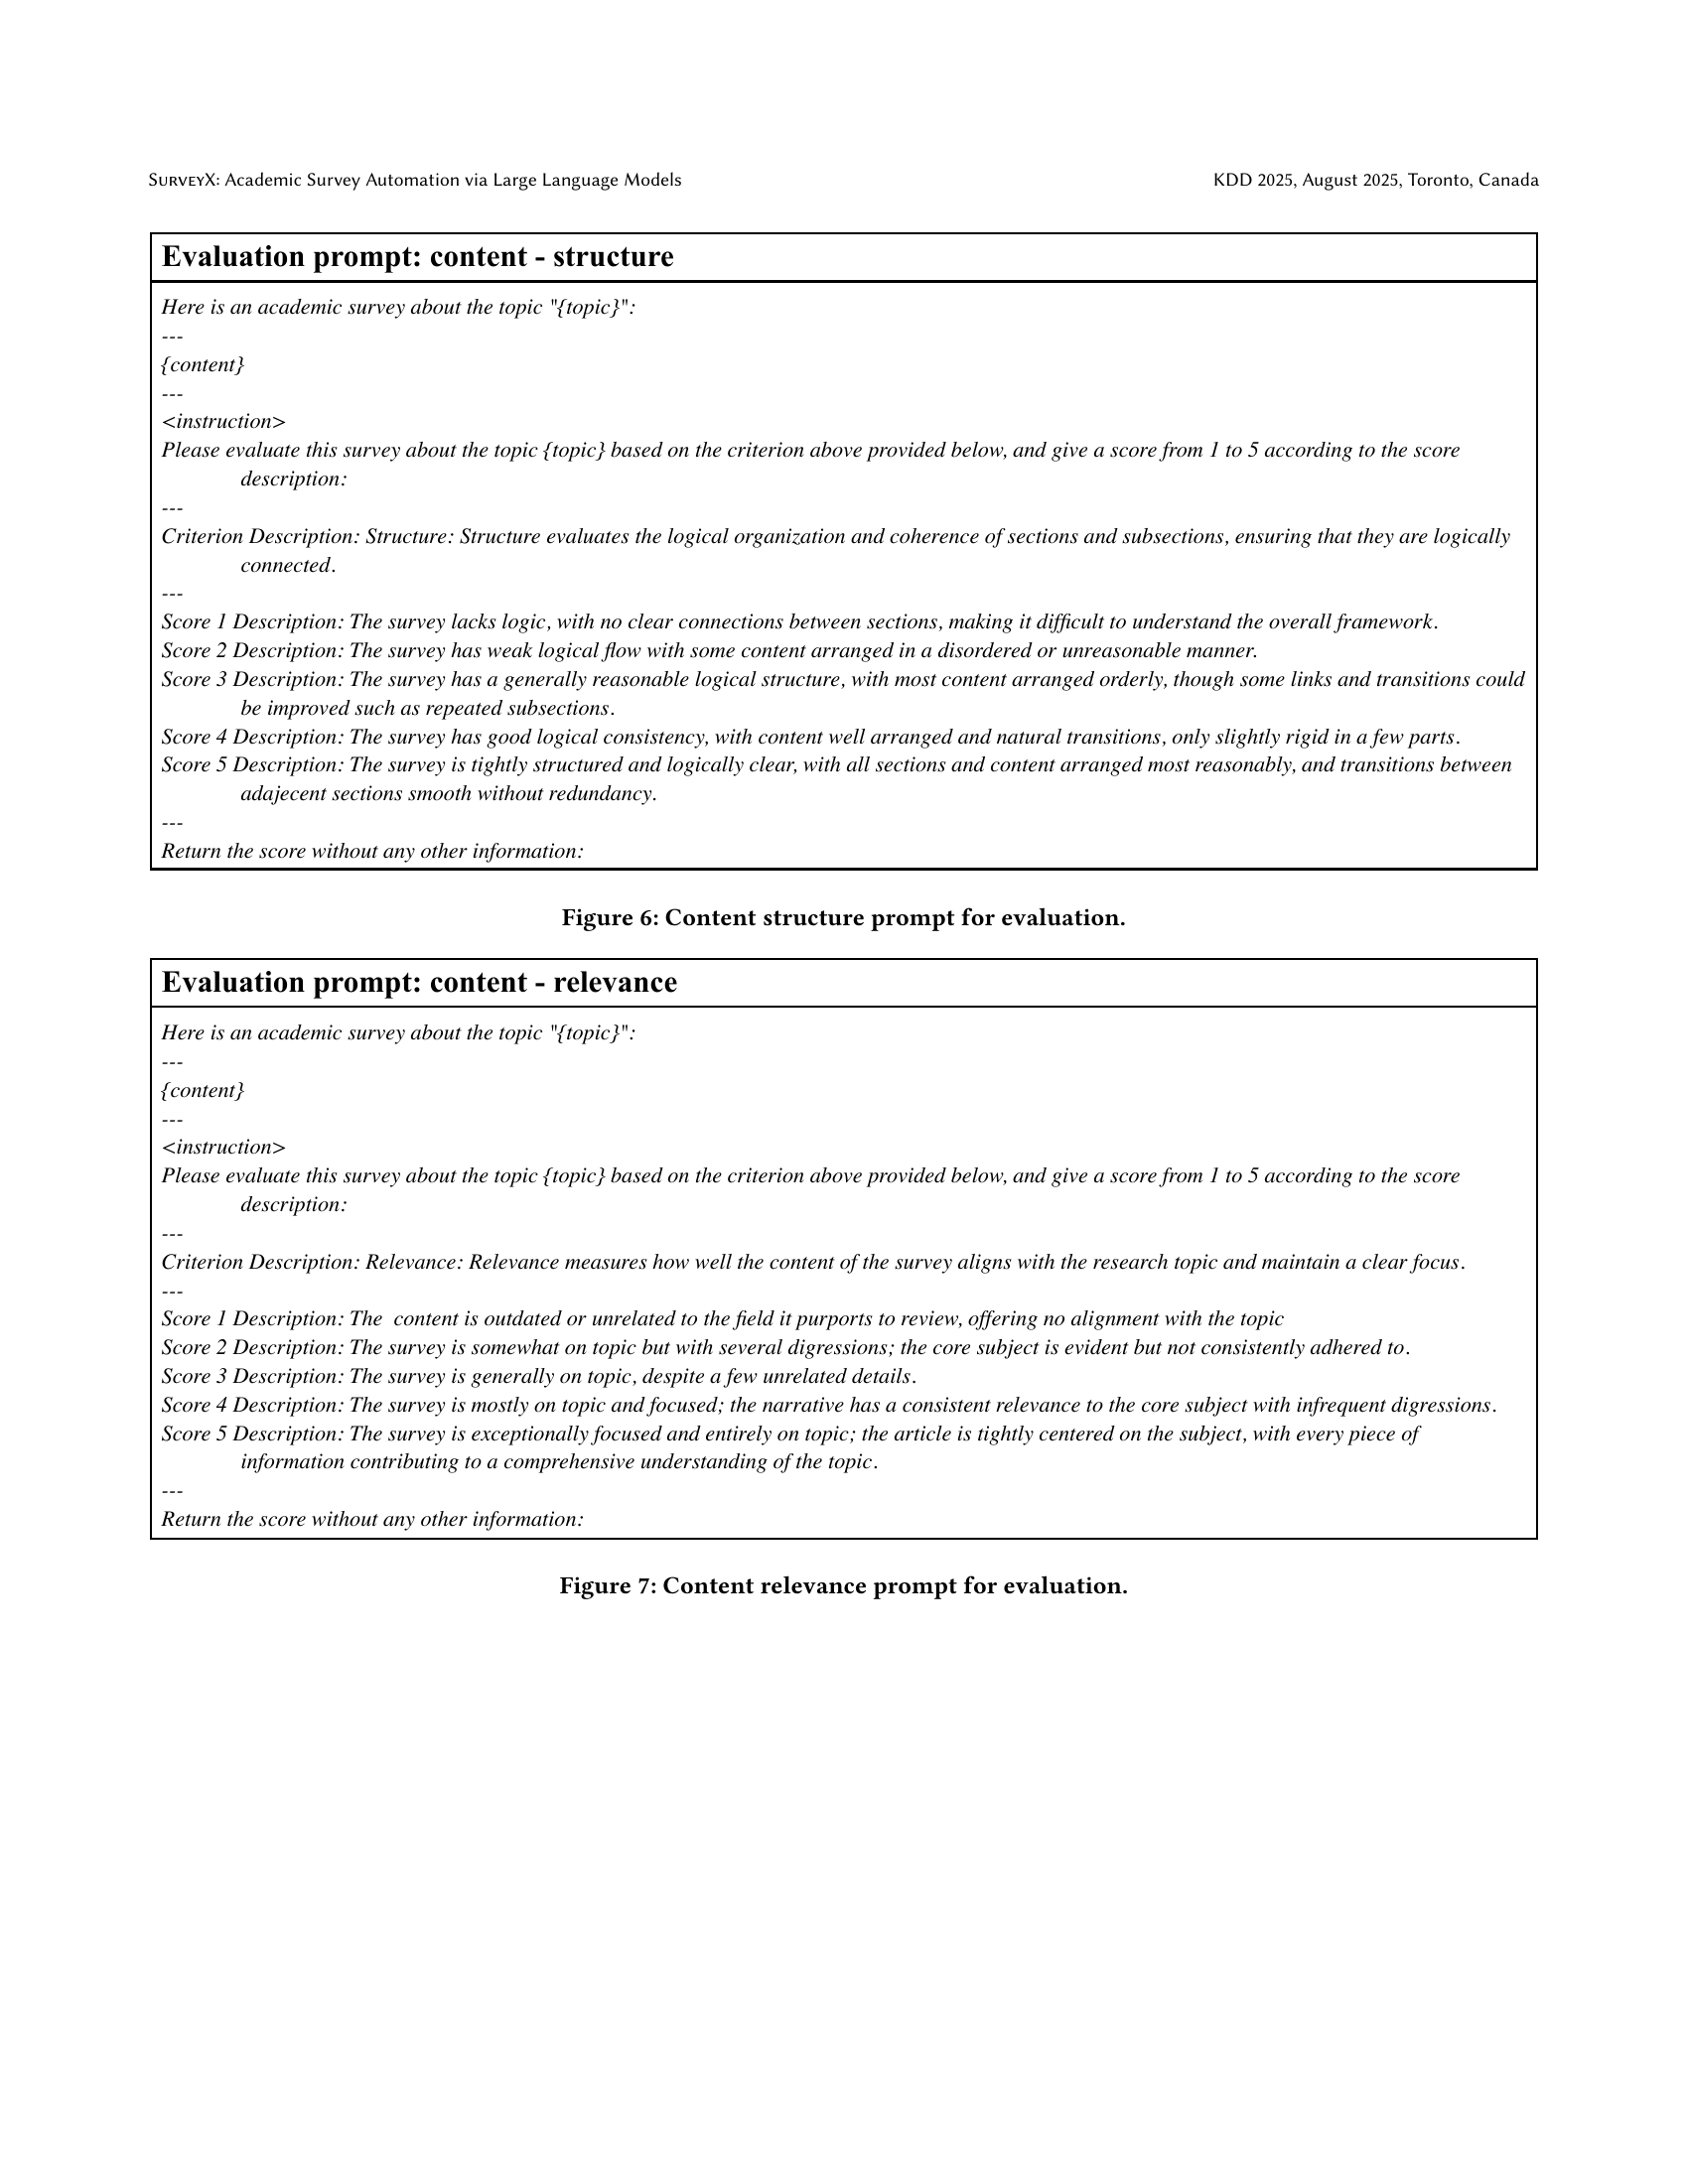
🔼 This figure presents the prompt used for evaluating the structure of the automatically generated surveys. The prompt guides evaluators to assess the logical organization and coherence of the generated survey’s sections and subsections, considering aspects like clarity of connections, orderliness, and the presence of any redundancies or inconsistencies. Scores from 1 to 5 are used to rate the survey’s structure, with 1 representing a poorly structured survey and 5 signifying a highly organized and logically sound structure.
read the caption
Figure 6. Content structure prompt for evaluation.

🔼 This figure shows the prompt used for evaluating the relevance of the content in a generated academic survey. The prompt instructs the evaluator to score the survey’s relevance to the given topic on a scale of 1 to 5, with detailed descriptions for each score level. The descriptions range from completely off-topic (score 1) to entirely focused and relevant (score 5). This detailed rubric helps ensure consistent and objective evaluation of content relevance.
read the caption
Figure 7. Content relevance prompt for evaluation.

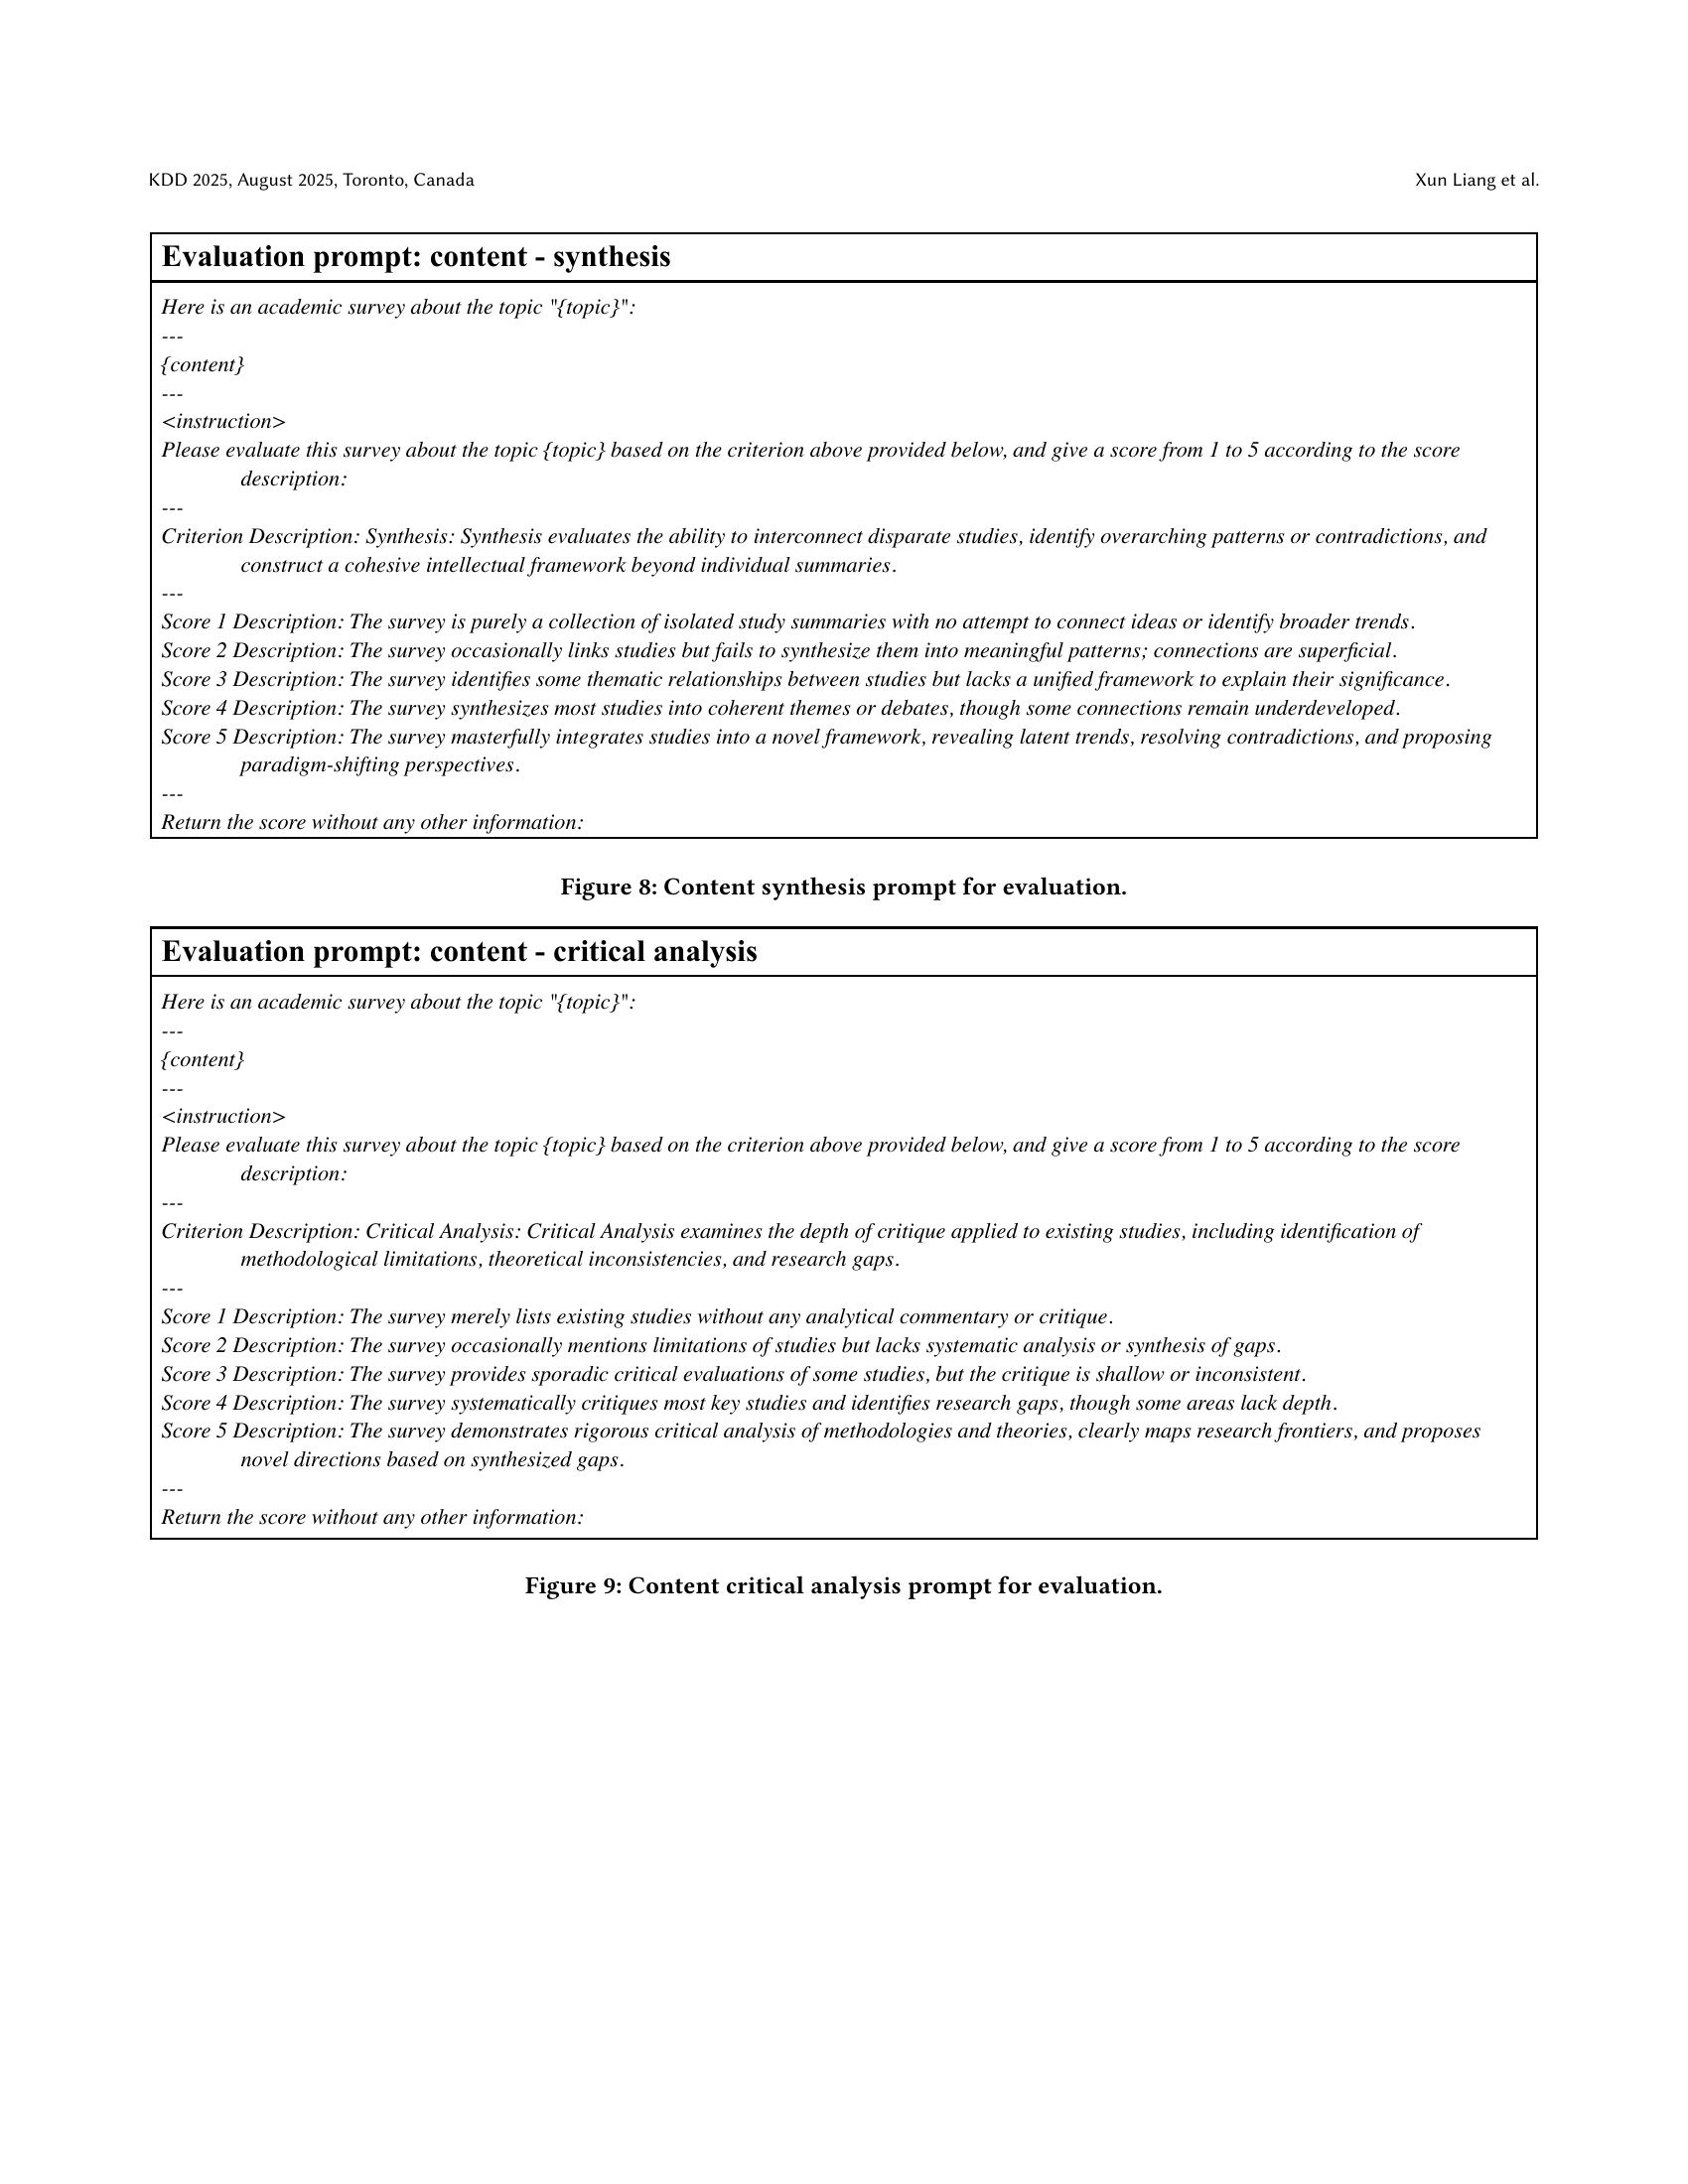
🔼 This figure shows the prompt used for evaluating the ‘synthesis’ aspect of content quality in automatically generated surveys. The prompt instructs evaluators to assess how well the survey integrates different studies, identifies patterns or contradictions, and builds a cohesive framework beyond simple summaries. A 5-point Likert scale is provided, ranging from a purely descriptive summary (score 1) to a masterfully integrated analysis with novel perspectives (score 5).
read the caption
Figure 8. Content synthesis prompt for evaluation.

🔼 This figure presents the prompt used for human evaluators to assess the ‘critical analysis’ aspect of automatically generated surveys. The prompt instructs evaluators to score the survey based on the depth of critique applied to existing studies, including identification of methodological limitations, theoretical inconsistencies, and research gaps. A 5-point Likert scale is provided, ranging from a score of 1 (no critical analysis) to 5 (rigorous critical analysis with identified research gaps and proposed future directions).
read the caption
Figure 9. Content critical analysis prompt for evaluation.

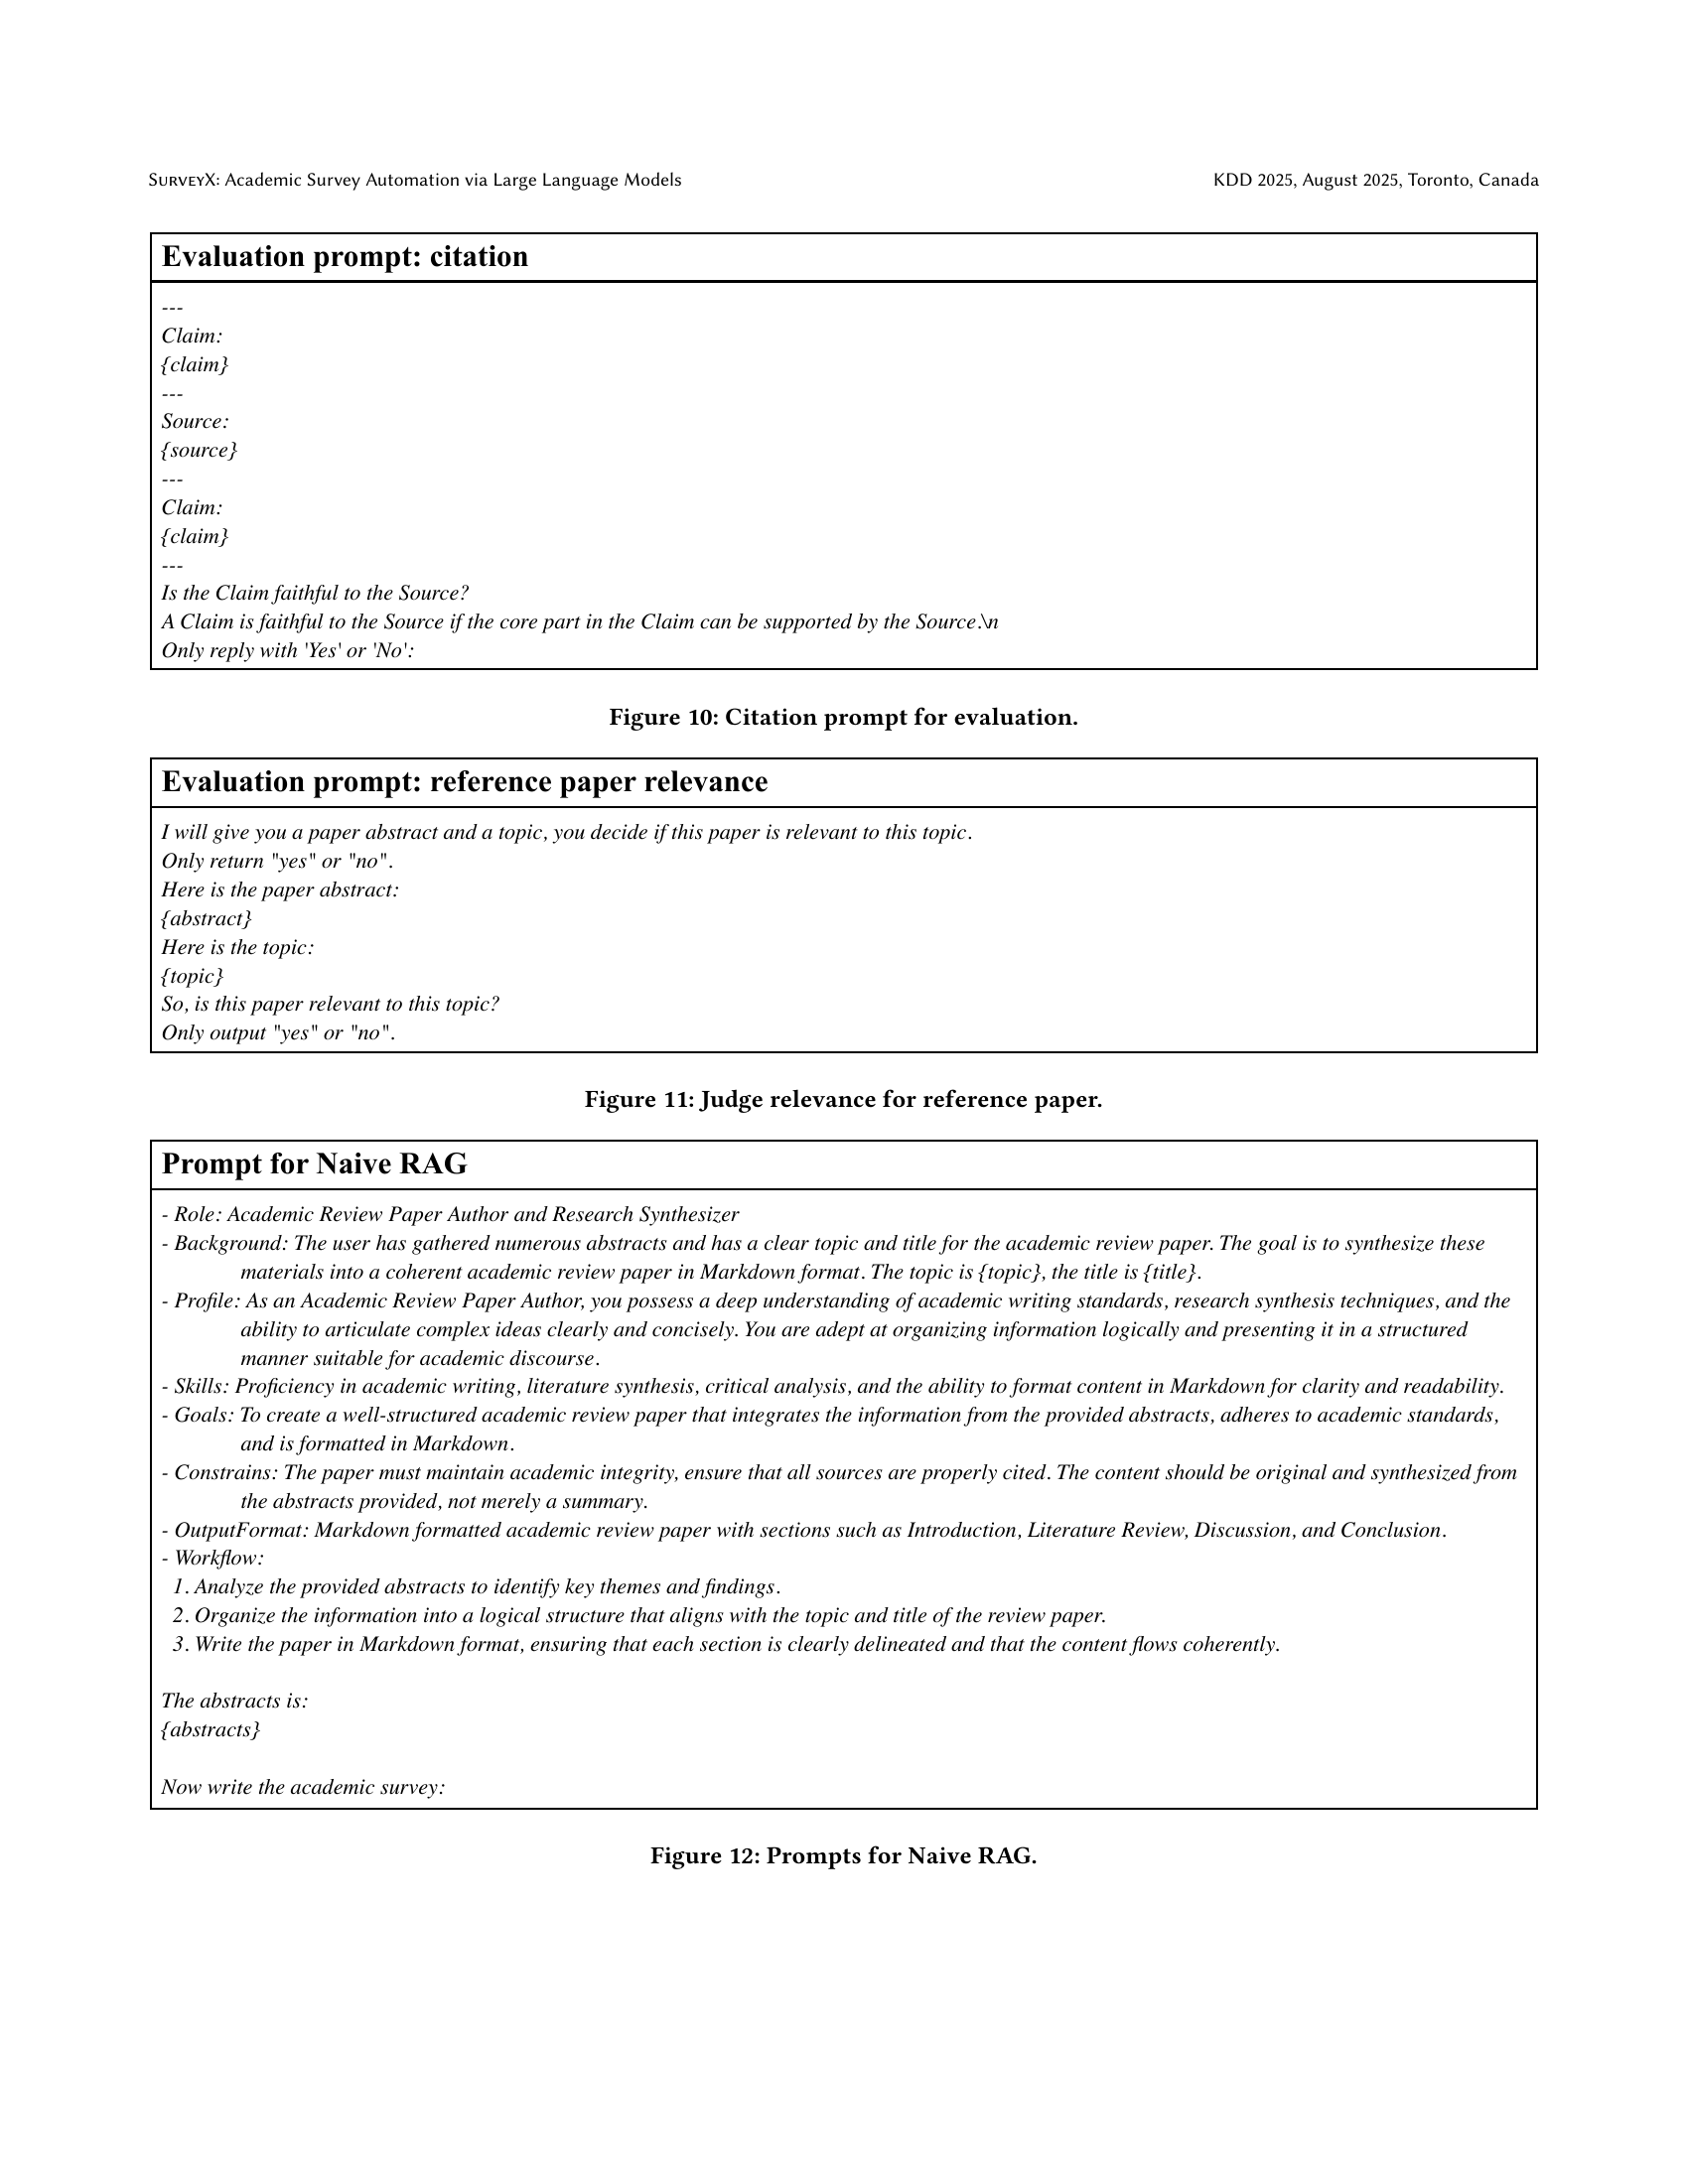
🔼 This figure shows the prompt used for evaluating the quality of citations in the automatically generated surveys. The prompt presents evaluators with a claim and its purported source. The evaluators are then asked to judge if the claim faithfully reflects the information presented in the source. This helps assess whether the generated surveys accurately cite and represent the information from referenced sources.
read the caption
Figure 10. Citation prompt for evaluation.

🔼 This figure shows the prompt used for evaluating the relevance of a reference paper to a given topic. Evaluators are presented with a paper abstract and the topic, then asked to determine if the paper is relevant. The prompt is designed to elicit a simple ‘yes’ or ’no’ response, facilitating efficient evaluation.
read the caption
Figure 11. Judge relevance for reference paper.

🔼 This figure shows the prompt used for the Naive RAG (Retrieval Augmented Generation) baseline method in the paper’s experiments. The prompt provides the role of an academic reviewer and research synthesizer, outlining the background, goals, constraints, and desired output format (Markdown). It includes instructions for analyzing abstracts, organizing information, and writing a coherent review paper that meets academic standards. Specific instructions are given on how to handle formatting, citations, and originality. The provided abstracts are a placeholder that would be replaced with actual text during experimentation.
read the caption
Figure 12. Prompts for Naive RAG.

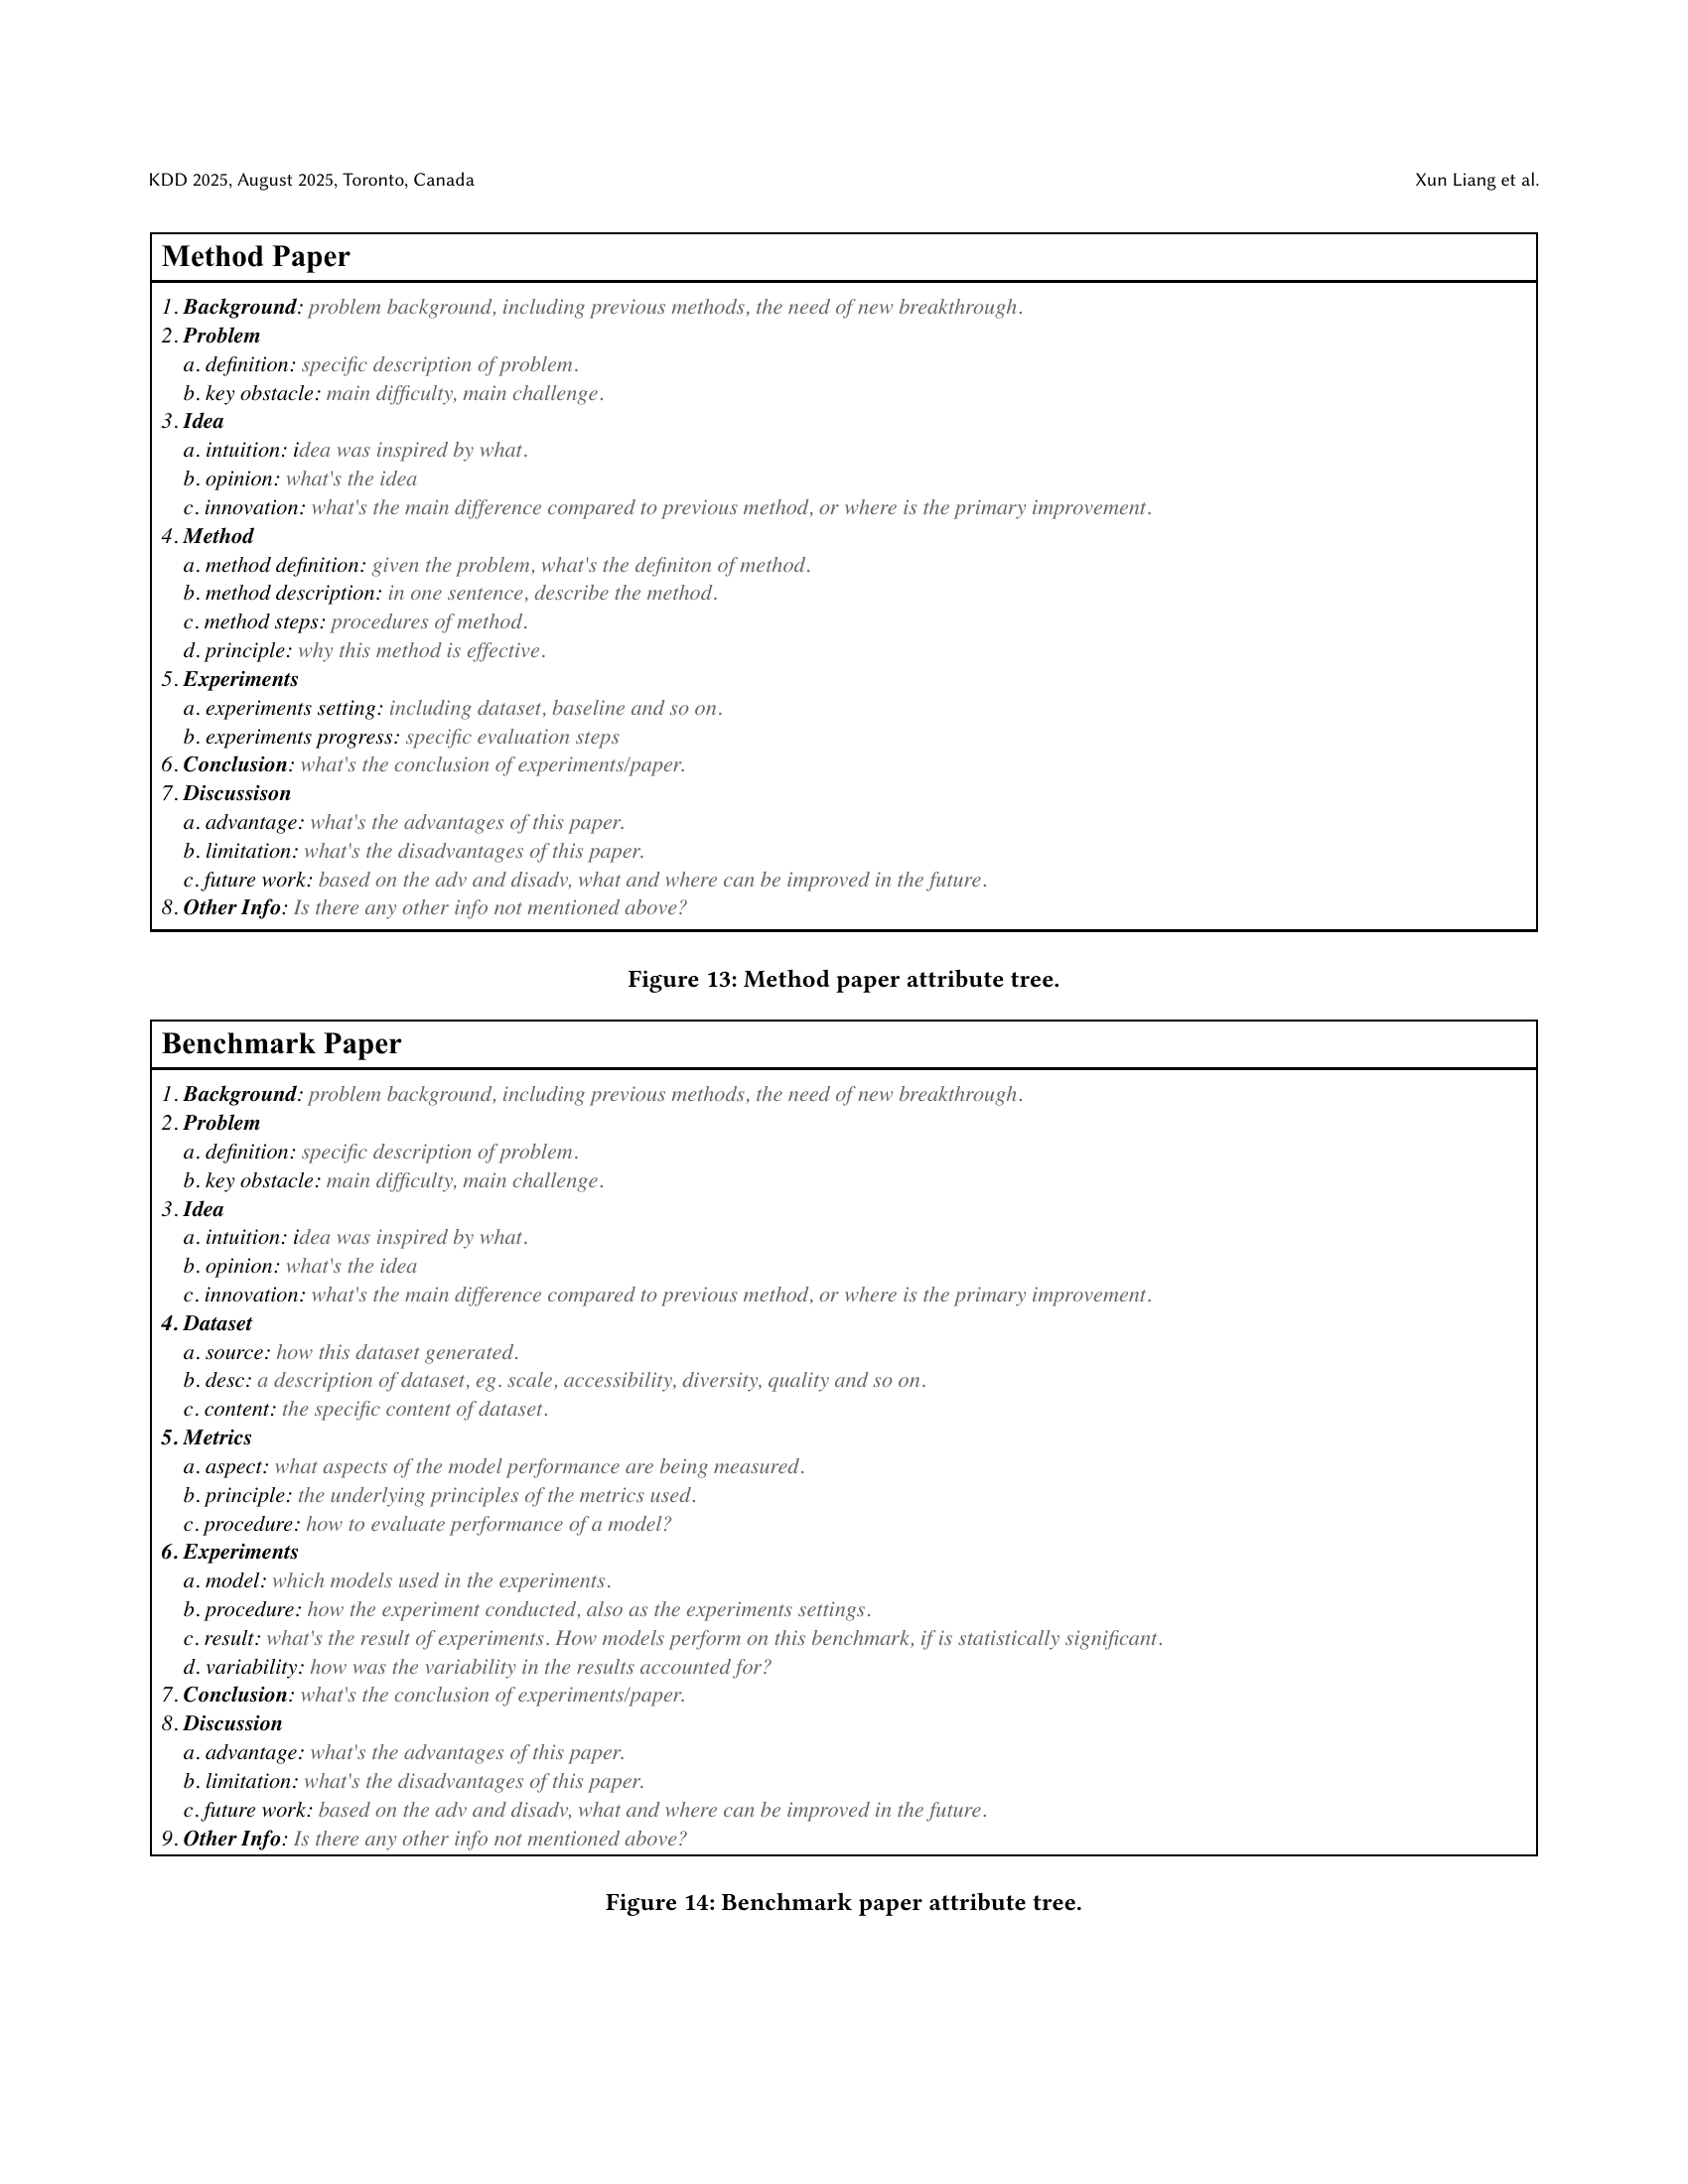
🔼 This figure presents a hierarchical tree structure representing the key attributes and sub-attributes used to categorize and analyze method papers. Each node in the tree signifies a crucial aspect of a method paper, providing a systematic framework for extracting key information and facilitating a comprehensive understanding. The top-level node is ‘Method Paper,’ which branches down into sections like ‘Background,’ ‘Problem,’ ‘Idea,’ ‘Method,’ ‘Experiments,’ ‘Conclusion,’ ‘Discussion,’ and ‘Other Info.’ Each of these sections contains further granular sub-attributes that allow for detailed extraction of specific information concerning each aspect. This detailed breakdown aids in the efficient pre-processing of research papers for automated survey generation.
read the caption
Figure 13. Method paper attribute tree.

🔼 This figure presents a hierarchical tree structure that outlines the key attributes or components typically found in a benchmark paper. It’s designed to aid in the extraction of relevant information from benchmark papers, efficiently structuring the data for use in subsequent survey generation processes. The tree is broken down into several main categories (Background, Problem, Idea, Dataset, Metrics, Experiments, Conclusion, Discussion, and Other Info) with sub-categories under each to capture specific details like problem definition, dataset characteristics, and experimental methodology.
read the caption
Figure 14. Benchmark paper attribute tree.

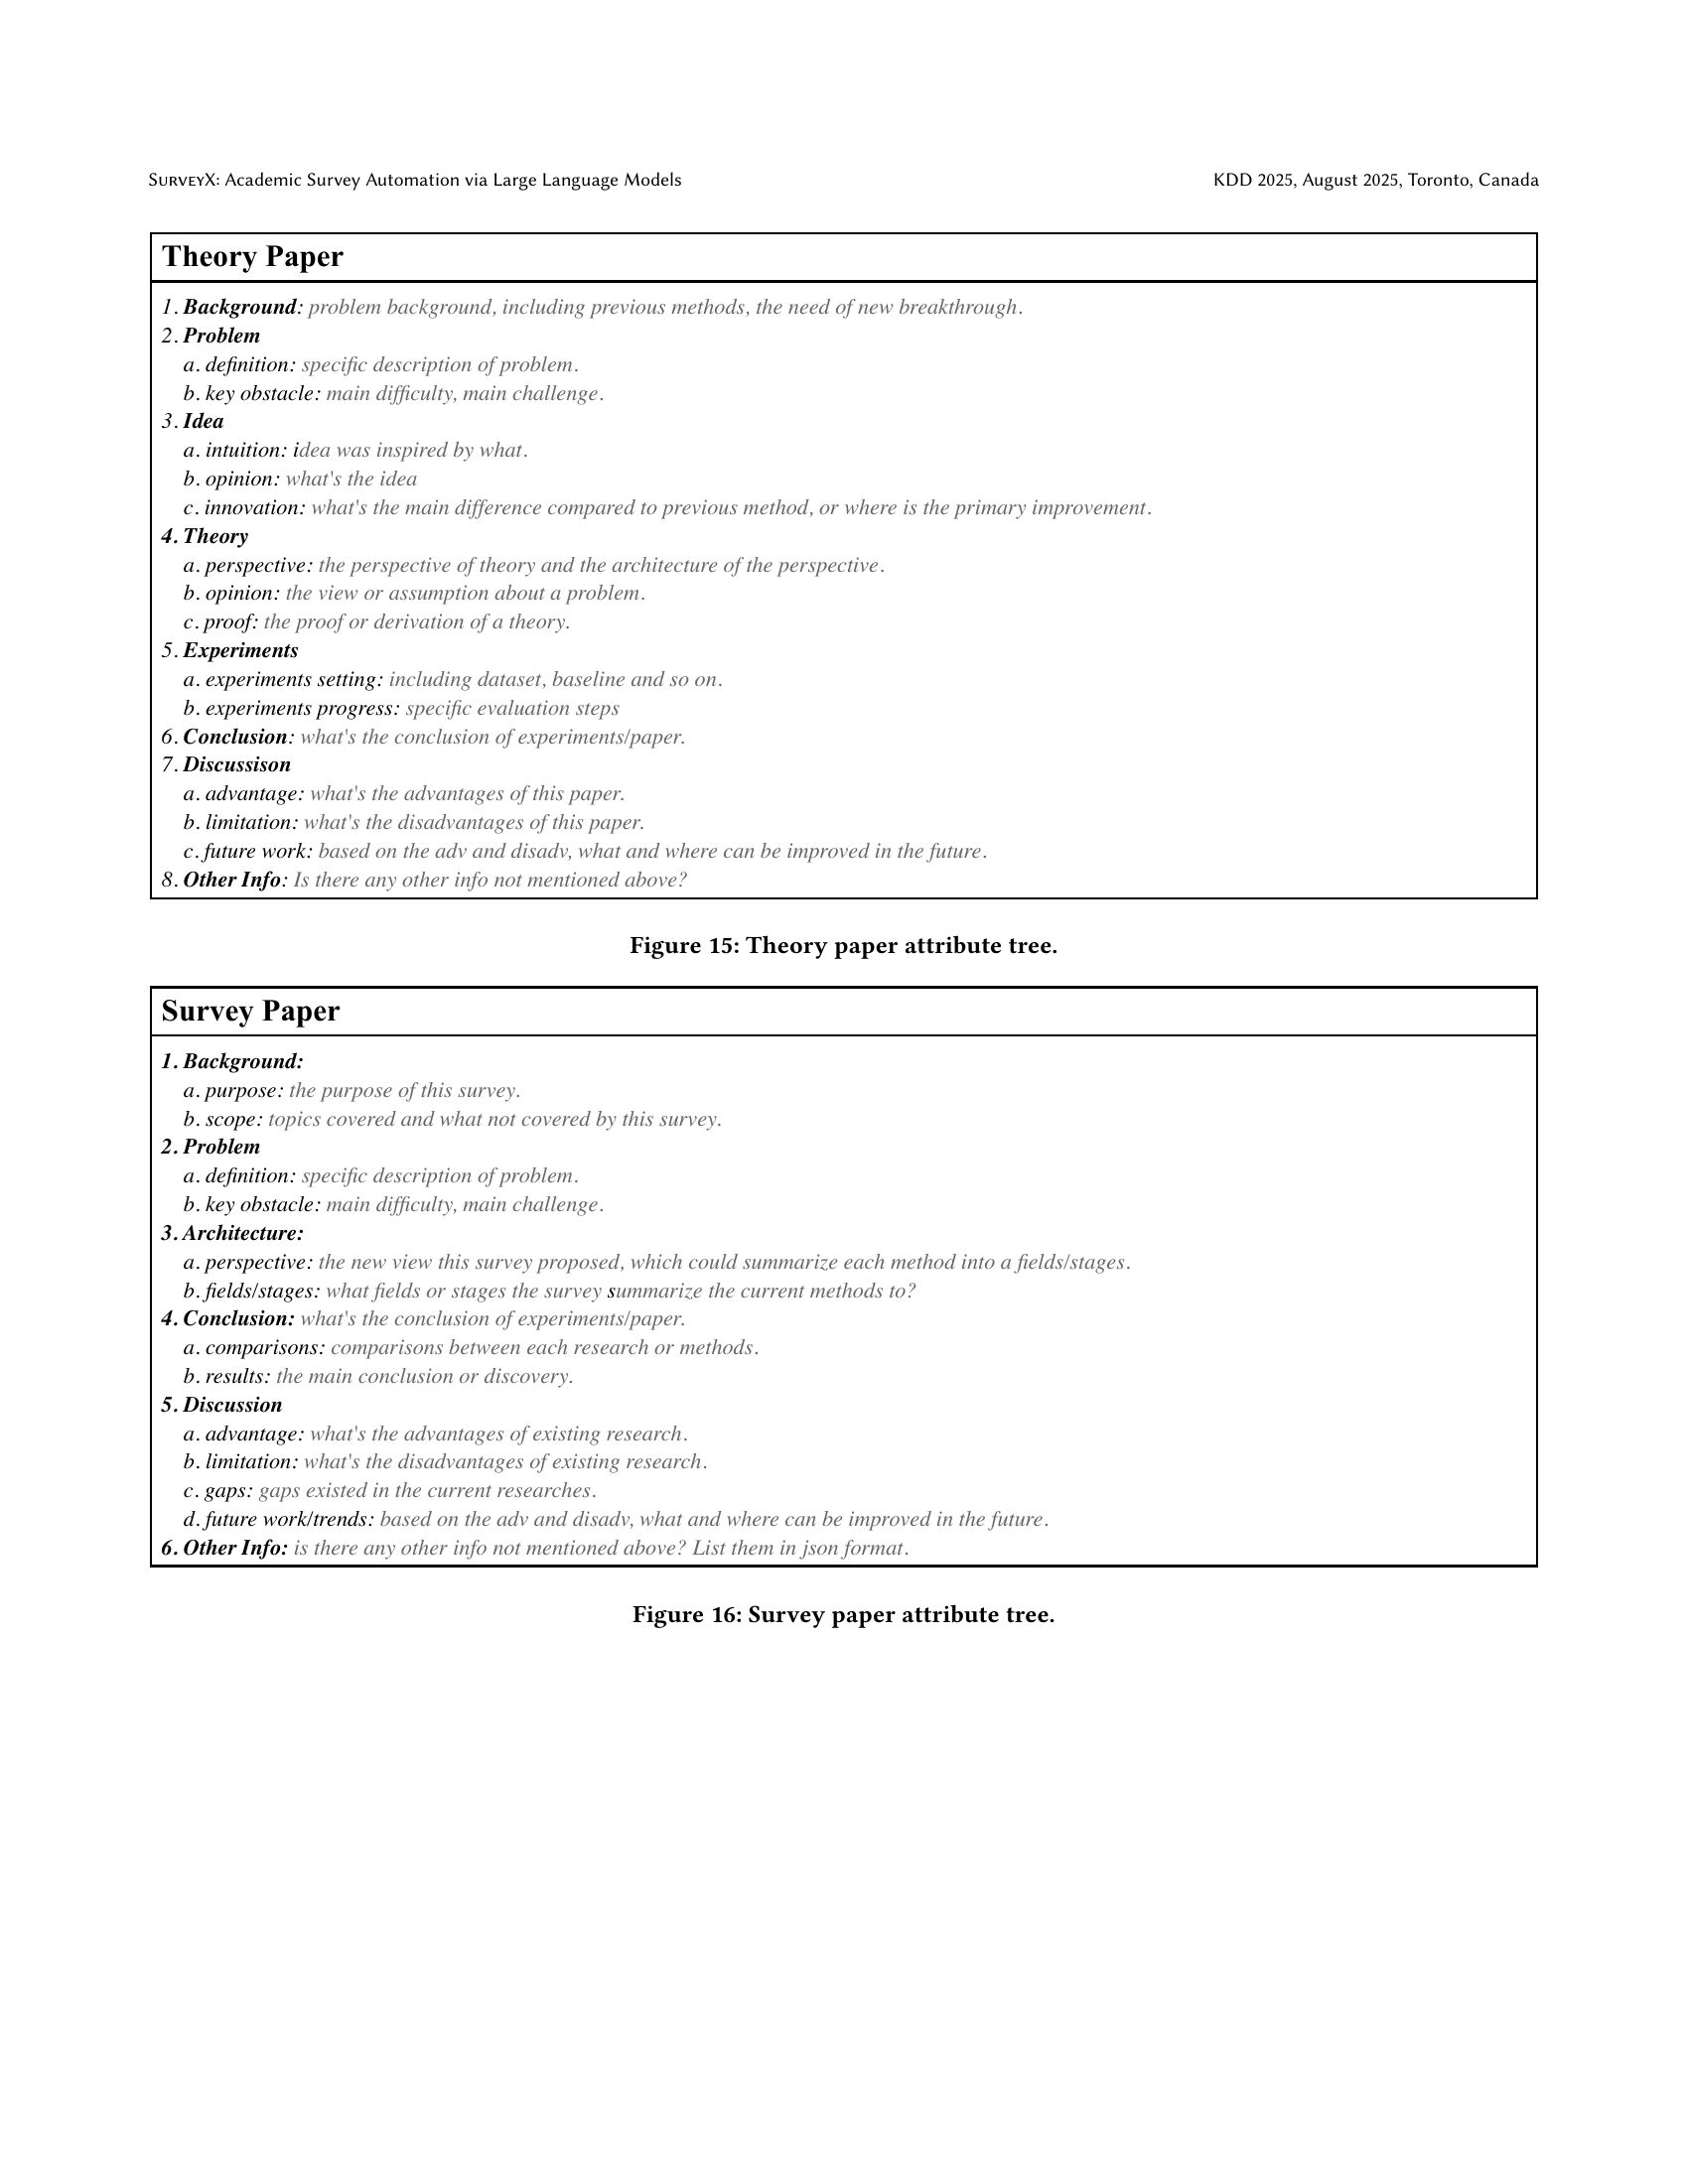
🔼 This figure presents a hierarchical structure, or tree, that outlines the key attributes typically found in a theory paper. It’s a template to guide the extraction of essential information from theory papers for use in the SURVEYX system. The tree organizes information into categories like Background (problem context), Problem (definition and challenges), Idea (intuition, innovation), Theory (perspective, proof), Experiments (setup and process), Conclusion, Discussion (advantages, limitations, future work), and Other Info (additional details). Each category has sub-attributes to ensure comprehensive data capture for accurate and thorough survey generation.
read the caption
Figure 15. Theory paper attribute tree.

🔼 This figure presents a hierarchical structure, or tree, outlining the key attributes that constitute a survey paper. It’s a template for organizing information when generating survey papers automatically. The tree includes sections such as background (purpose, scope), problem (definition, key obstacles), architecture (perspective, fields/stages), conclusion (comparisons, results), discussion (advantages, limitations, gaps, future work/trends), and other relevant details. This breakdown helps structure the writing process by providing a systematic framework for the information included in a survey paper.
read the caption
Figure 16. Survey paper attribute tree.
More on tables
| Critical |
| Analysis |
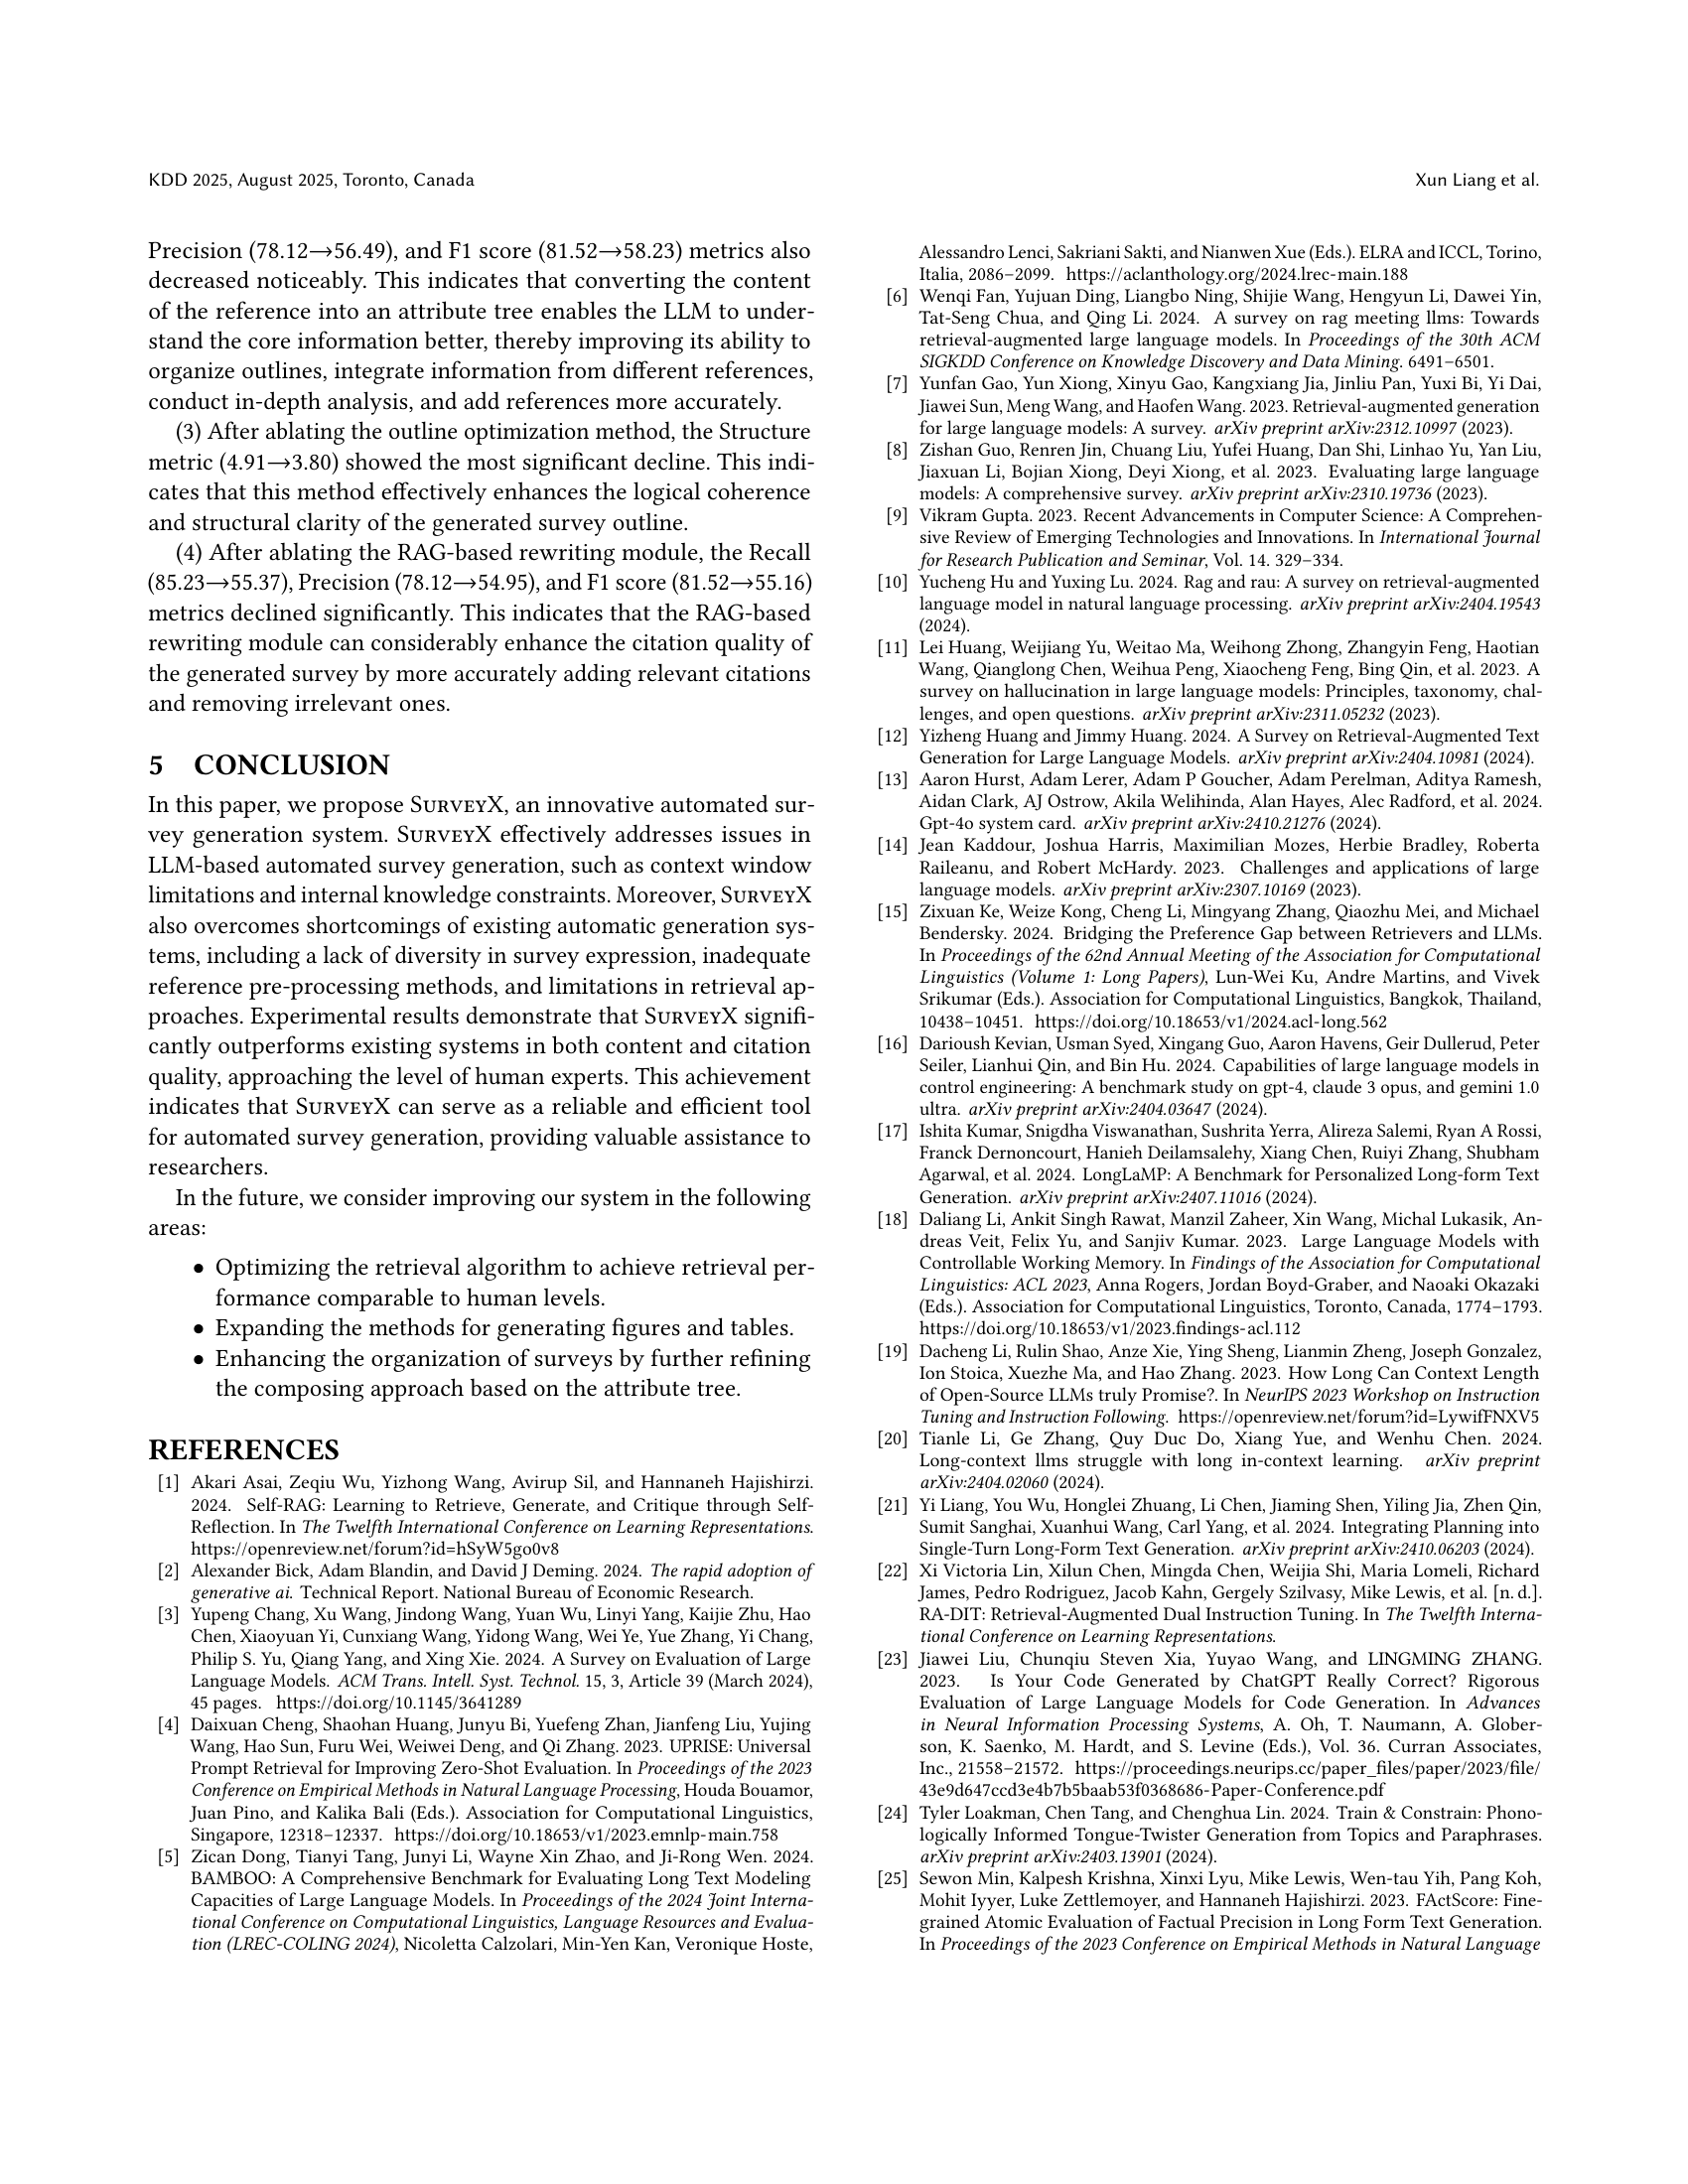
🔼 This table presents the results of an ablation study conducted on the SURVEYX system. The study systematically removes individual components of SURVEYX to assess their individual contributions to the overall system performance. The table shows the performance metrics (Coverage, Structure, Relevance, Synthesis, Critical Analysis, Avg Recall, Precision, F1) achieved by SURVEYX with various components removed. Data points representing significant performance decreases compared to the complete SURVEYX model are underlined for emphasis. The results highlight the importance of each component in achieving optimal performance.
read the caption
Table 2. Ablation study results for SurveyX with different components removed. Data with significant declines are indicated by underlines.
| Ablation Object | Coverage | Structure | Relevance | Synthesis |
| Avg | Recall | Precision | F1 | |||
|---|---|---|---|---|---|---|---|---|---|---|---|---|
| Retrieval Algorithm | \ul4.74 | 4.88 | \ul4.79 | 3.98 | 4.02 | 4.48 | 78.88 | 73.34 | 76.01 | |||
| AttributeTree Method | 4.84 | \ul4.08 | 4.89 | \ul3.88 | \ul3.93 | 4.32 | \ul60.09 | \ul56.49 | \ul58.23 | |||
| Outline Optimization Method | 4.90 | \ul3.80 | 4.91 | 3.98 | 4.02 | 4.32 | 85.1 | 77.13 | 80.92 | |||
| RAG-based Rewriting Module | 4.92 | 4.89 | 4.93 | 4.00 | 4.00 | 4.55 | \ul55.37 | \ul54.95 | \ul55.16 | |||
| No Ablation | 4.95 | 4.91 | 4.94 | 4.10 | 4.05 | 4.590 | 85.23 | 78.12 | 81.52 |
🔼 This table presents the quantitative evaluation results of the reference relevance module of the SURVEYX system. It compares the system’s performance against human expert performance using three metrics: IoU (Intersection over Union), Relevance_semantic (a semantic similarity score), and Relevance_LLM (a score based on Large Language Model judgment). The IoU metric measures the overlap between references retrieved by SURVEYX and those retrieved by human experts. Relevance_semantic assesses the semantic similarity between the retrieved references and the target survey topic using an embedding model. Relevance_LLM utilizes an LLM to evaluate the relevance of the retrieved references to the topic. The table shows the scores obtained by SURVEYX and human experts for each metric, providing a comparative analysis of the system’s effectiveness in retrieving relevant references.
read the caption
Table 3. Evaluation results of reference relevance.
| Critical |
| Analysis |
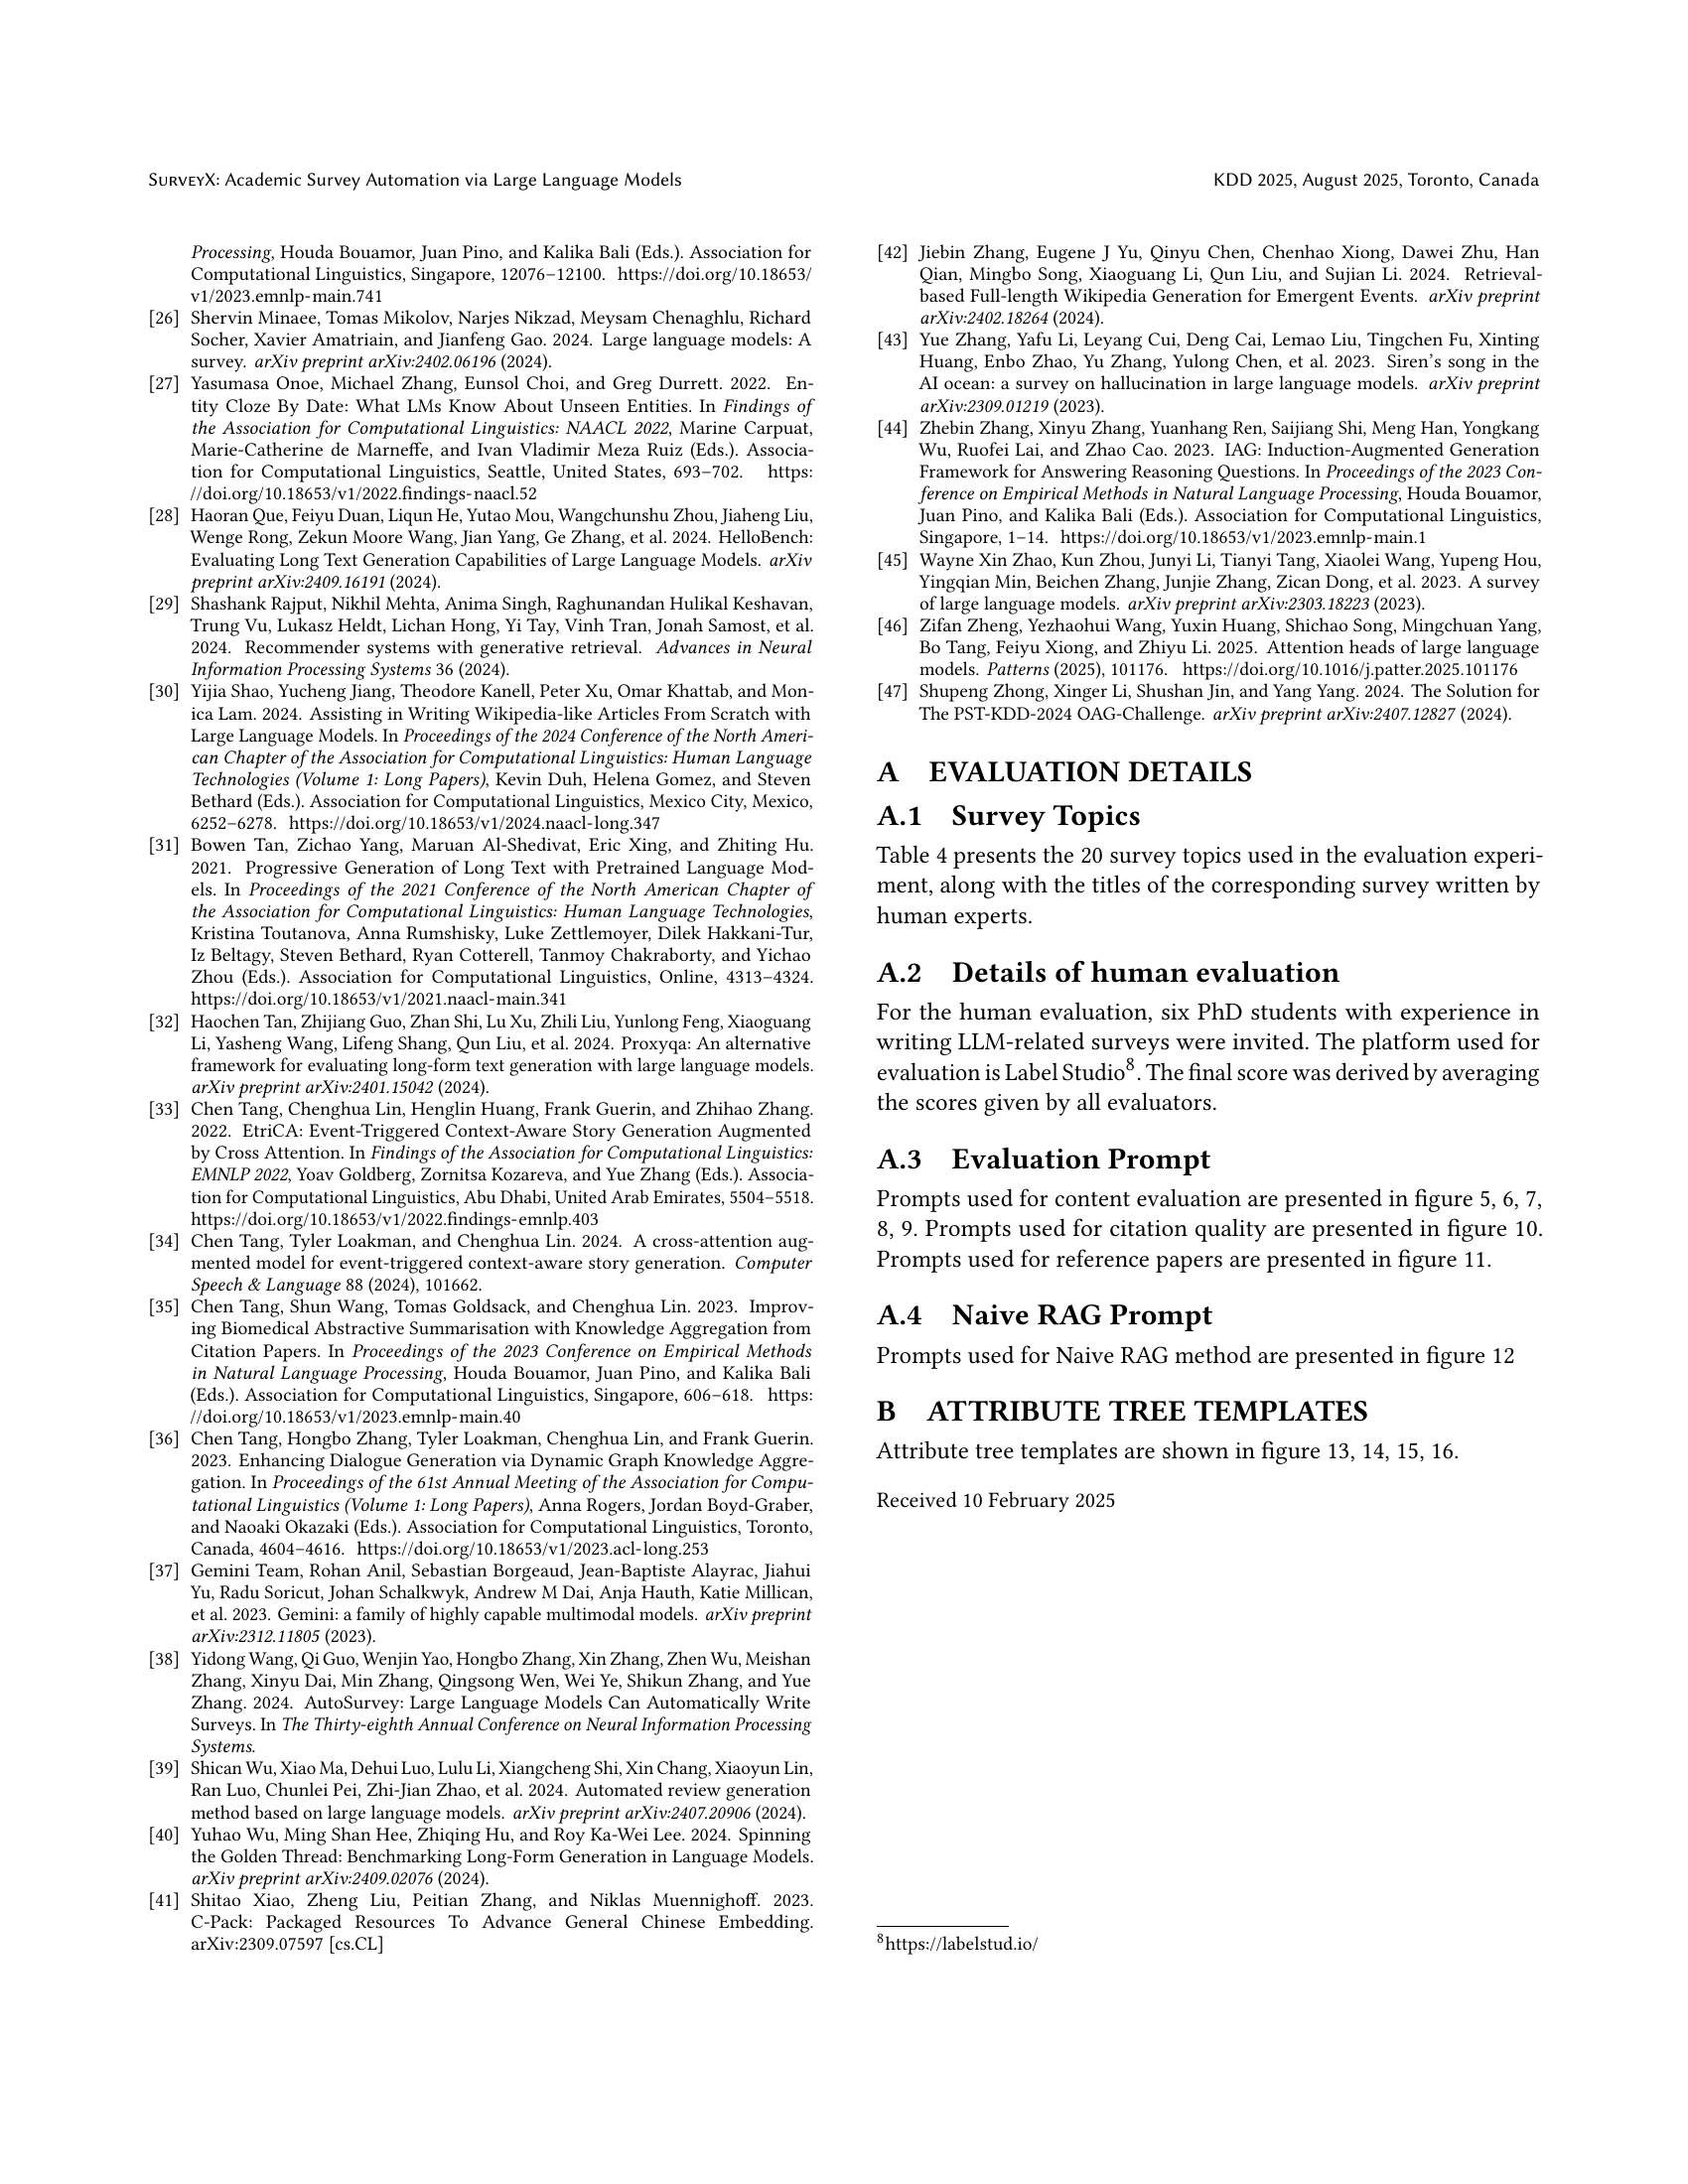
🔼 This table lists twenty topics related to large language models (LLMs), each paired with a suggested title for a survey paper on that topic. These topics encompass various aspects of LLMs, including their applications in recommendation systems, evaluation methodologies, safety considerations, and educational uses. The table serves as a representative sample of potential research areas within the field of LLMs, highlighting the diverse range of applications and challenges associated with this technology.
read the caption
Table 4. Survey Topics
Full paper#