TL;DR#
LLMs often misinterpret the context, leading to factual errors. This is a significant problem, as even advanced models can struggle with contextual awareness. This paper identifies the issue of misinterpretation and hallucination of key information by the LLMs, a vulnerability termed as factual drift. The issue may lead to incorrect logical steps and reasoning errors.
To address this, the paper introduces the novel Stick to the Facts(SIFT). SIFT is a post-training approach that enhances LLM reasoning by grounding it in the context. SIFT leverages the model to generate a Sticker that emphasizes key information. SIFT can improve the performance of cutting-edge LLMs and establish a new state-of-the-art.
Key Takeaways#
Why does it matter?#
This research is vital as it addresses a key limitation in LLMs: their vulnerability to misinterpreting the context. By introducing SIFT, the study provides a training-free method, and the insights will likely promote the creation of more robust and reliable LLMs.
Visual Insights#

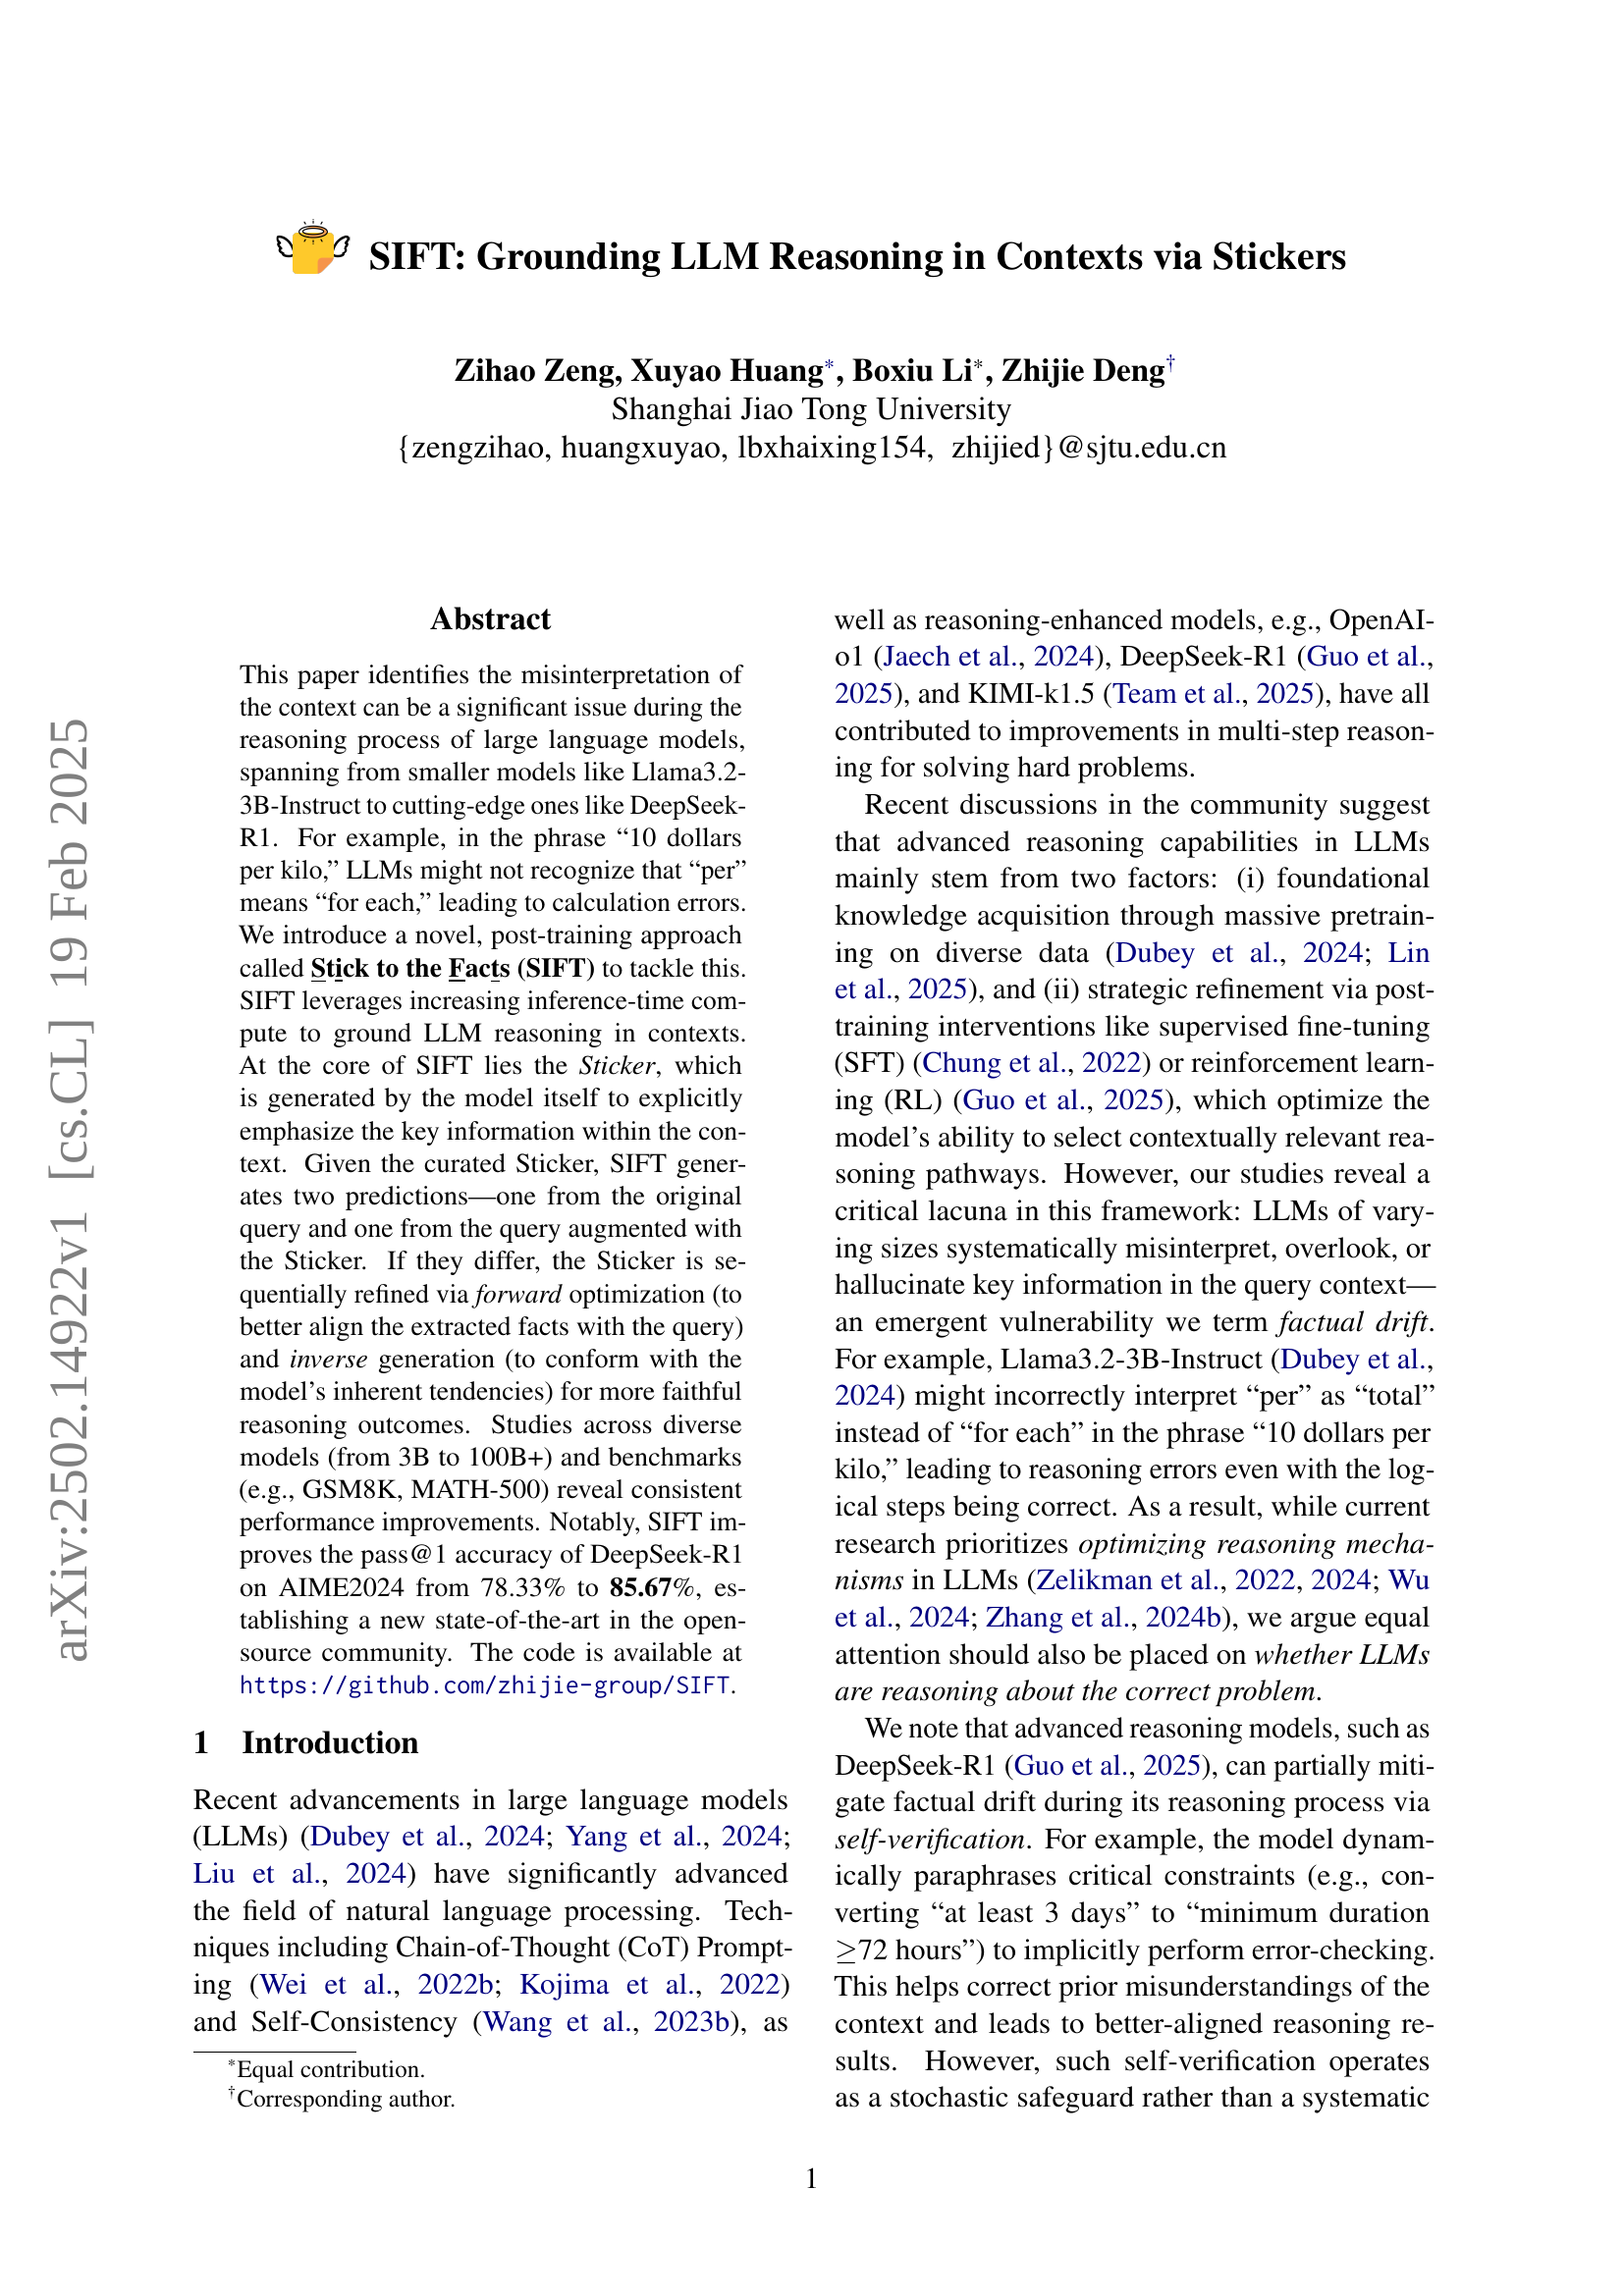
🔼 This figure showcases the effectiveness of the Stick to the Facts (SIFT) method when applied to the DeepSeek-R1 large language model. The bar chart presents the pass@1 accuracy (meaning the model correctly answered the question on the first try) across three different reasoning benchmarks: AIME2024, AIME2025, and MATH-500. For context, the performance of o1-mini and o3-mini models on the AIME benchmarks (as reported in a separate study by Ye et al., 2025) is also shown for comparison. The results clearly demonstrate that SIFT significantly boosts the accuracy of DeepSeek-R1 on all three benchmarks, highlighting its ability to enhance the reasoning capabilities of large language models.
read the caption
Figure 1: Applying SIFT to DeepSeek-R1 demonstrates highly competitive reasoning performance on AIME2024, AIME2025, and MATH-500 (pass@1 accuracy). The results for o1-mini and o3-mini on AIME are referenced from Ye et al. (2025).
| Consistency | Stage 1 | Stage 2 | Stage 3 |
|---|---|---|---|
| Dimension | |||
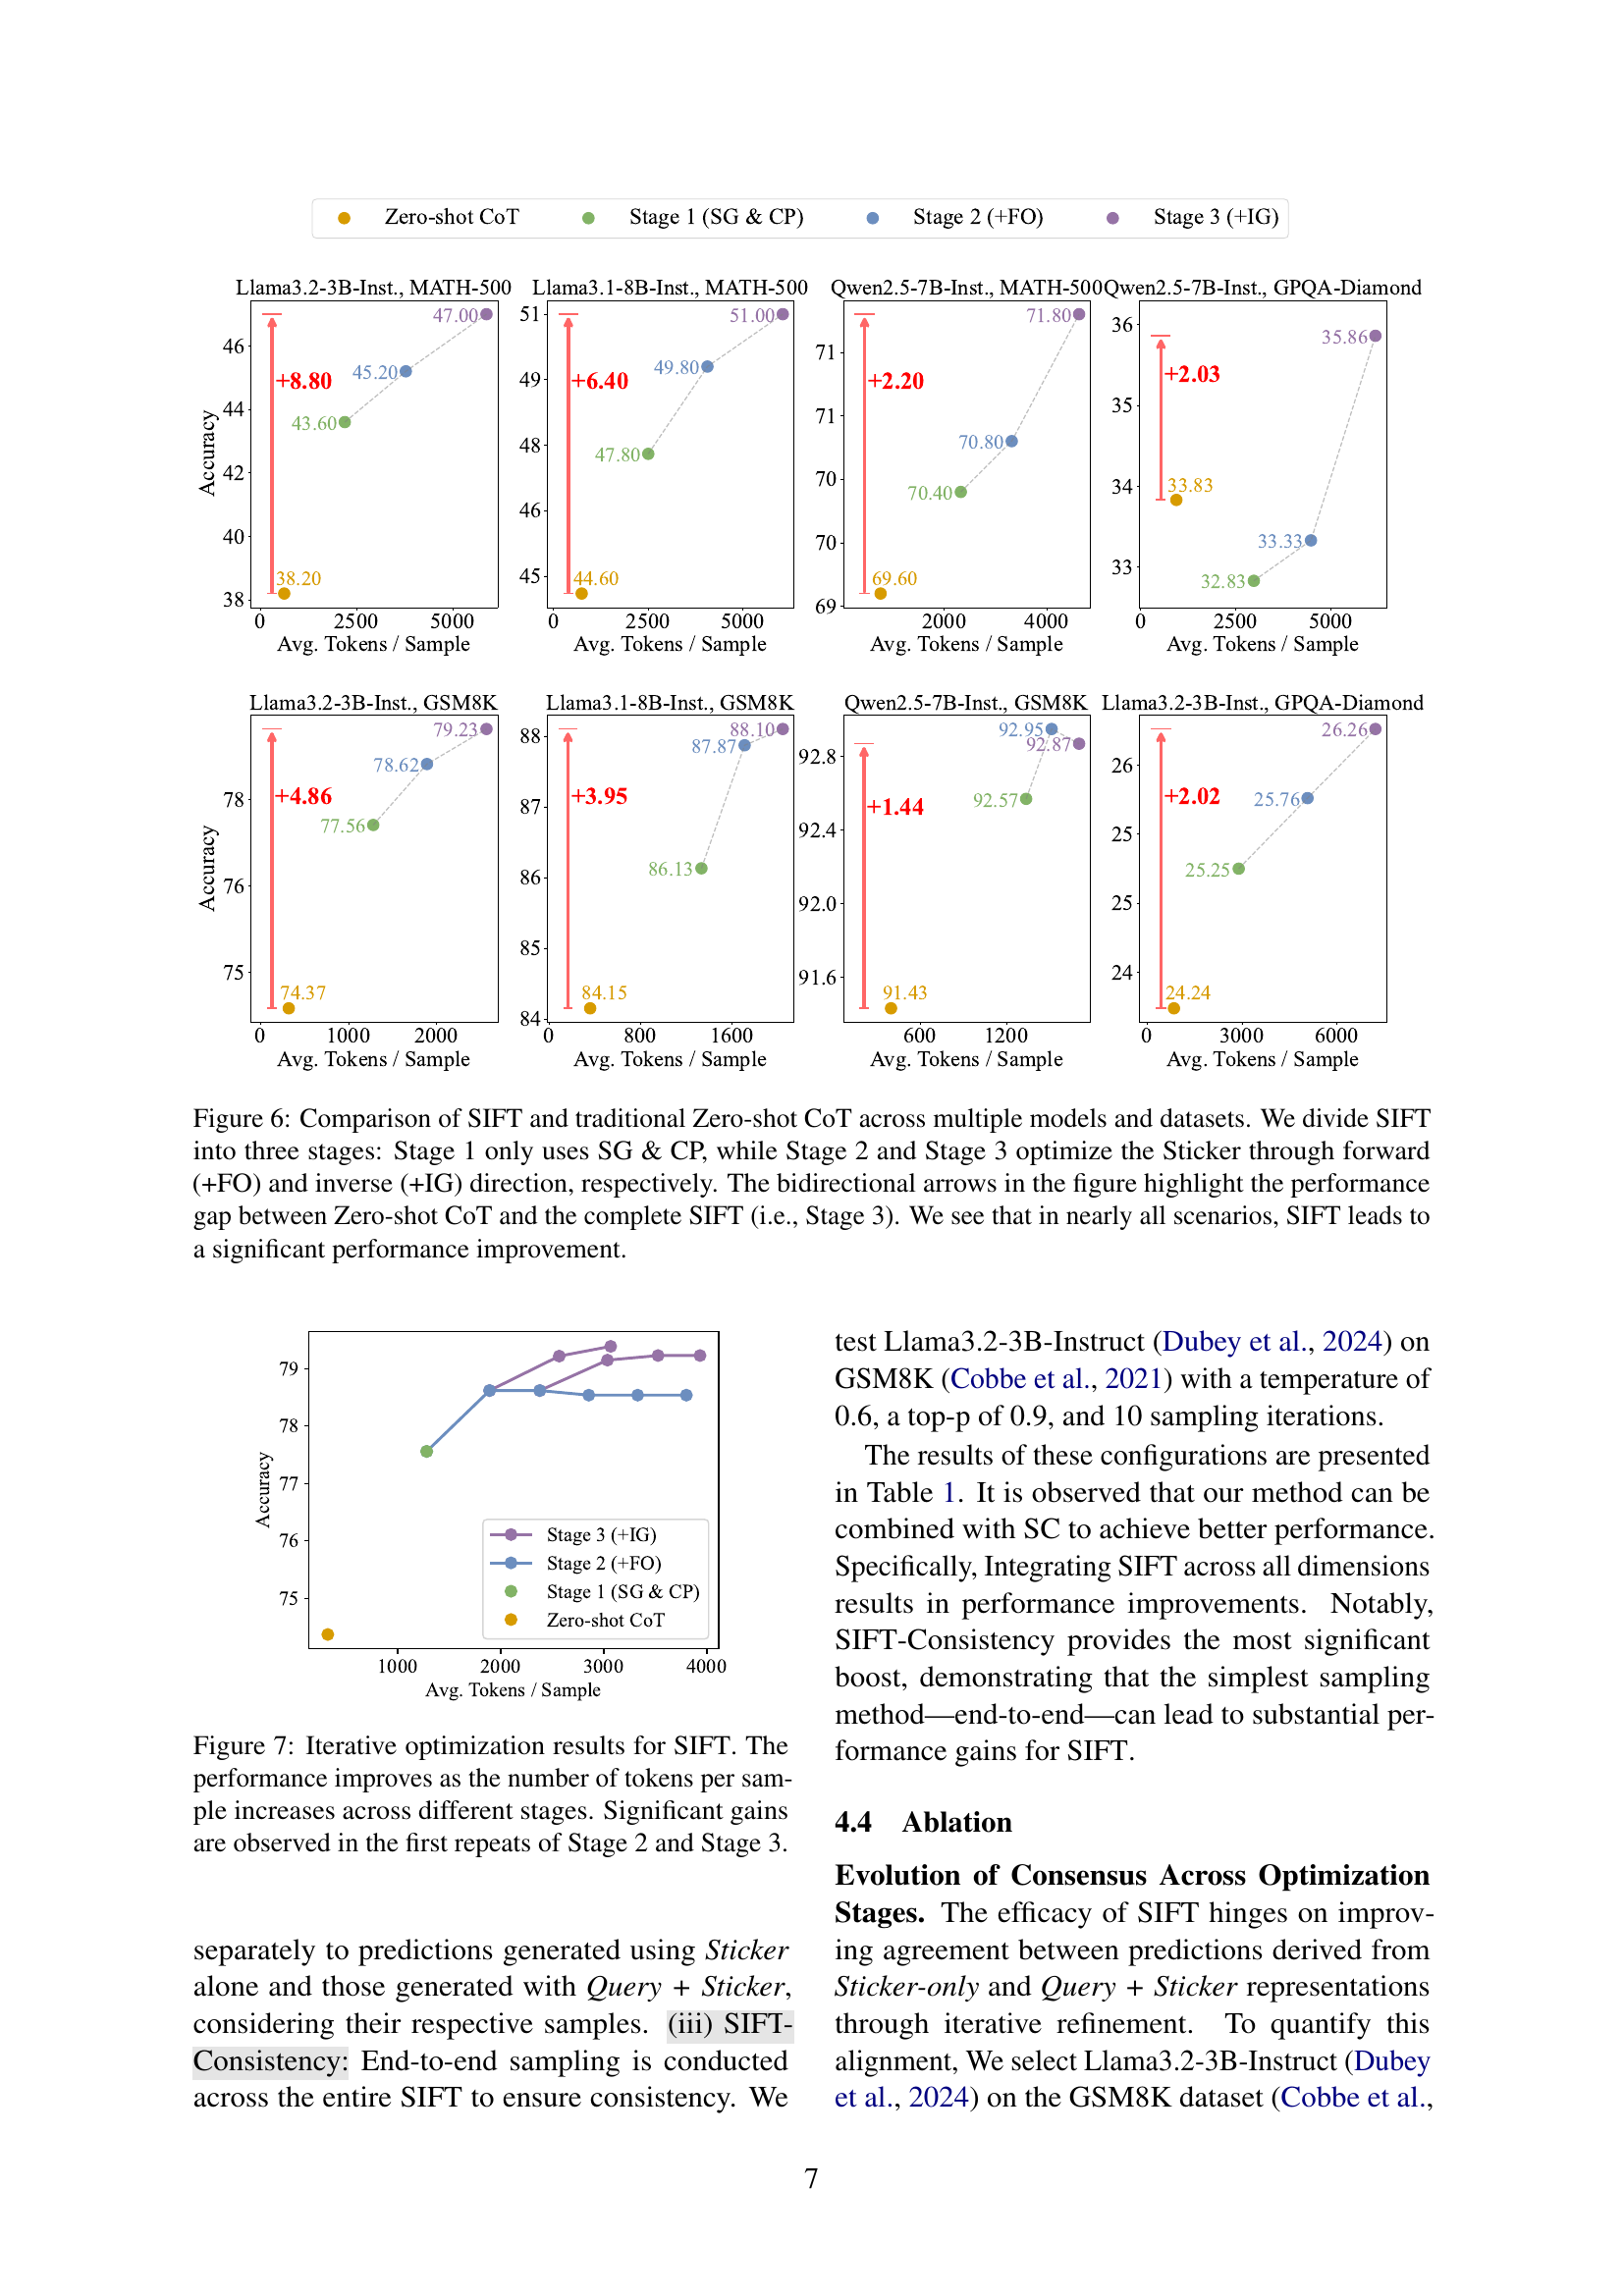
| Greedy | 77.56 | 78.62 | 79.23 |
| (i) Sticker | 78.85 | 79.65 | 80.29 |
| (ii) Prediction | 85.37 | 86.20 | 86.28 |
| (iii) SIFT | — | — | 88.25 |
🔼 This table compares the performance of various strategies for integrating Self-Consistency with the Stick to the Facts (SIFT) method across different stages of the process. The different strategies involve applying consistency checks to either the Sticker alone, the predictions from the query and Sticker, or both, during the SIFT reasoning steps. The results demonstrate that combining SIFT with Self-Consistency consistently leads to significant accuracy improvements, with the best result achieved when Self-Consistency is applied across all components of SIFT.
read the caption
Table 1: Performance comparison of different consistency integration strategies for SIFT across multiple stages. The results show that integrating SIFT with Self-Consistency Wang et al. (2023a) leads to significant performance improvements, with SIFT-Consistency achieving the highest accuracy boost.
In-depth insights#
LLM Factual Drift#
LLM Factual Drift highlights a critical vulnerability where large language models systematically misinterpret, overlook, or hallucinate key information within the query context. This often emerges from misaligned comprehension, where the LLM reasoning falters not from flawed logic but from an inaccurate understanding of the input context. Such drift can manifest by neglecting constraints, misinterpreting semantic relationships, or even hallucinating conditions during the reasoning process, leading to erroneous conclusions. The paper argues that despite advancements in reasoning capabilities, these models may not necessarily be reasoning about the correct problem, thus leading to the incorrect answer, and the Sift framework is designed to address this issue.
SIFT: Grounding LLMs#
SIFT: Grounding LLMs suggests a methodology to enhance LLMs’ reliability by anchoring their reasoning in factual context. This likely addresses issues where LLMs misinterpret or hallucinate data, leading to flawed conclusions even with sound logic. The grounding aims to make the LLM reason about the correct problem. ‘SIFT’ could involve techniques to verify input data, clarify ambiguities, or use external knowledge sources to validate information. This method ensures LLMs understand the question precisely, minimizing factual drift. The approach probably improves performance by reducing errors stemming from misunderstandings, allowing the models to focus on accurate reasoning based on verified information. SIFT will result in more trustworthy outputs, especially in scenarios where data accuracy is paramount.
Sticker Refinement#
Sticker refinement appears to be a critical process within the methodology, focusing on iteratively improving the quality and alignment of the generated “Stickers.” This is likely achieved through both forward and inverse optimization techniques. Forward optimization aims to better align the Sticker with the original query, ensuring it accurately captures the key information and constraints. Inverse generation, on the other hand, refines the Sticker based on the model’s prediction, thus adhering to the model’s internal reasoning preferences. The goal is to create a Sticker that is both factually accurate and easily understood by the LLM, leading to more reliable reasoning outcomes.
Self-Verification#
Self-verification in LLMs is a fascinating emergent behavior, where the model revisits its own reasoning process to ensure accuracy. Unlike the deterministic nature of traditional algorithms, LLM’s self-verification introduces a degree of stochasticity. It acts as a safeguard but isn’t systematically guaranteed, implying vulnerabilities may persist. Models paraphrase to implicitly perform error-checking. In essence, self-verification is a stochastic check rather than a systematic protocol. Advanced reasoning models exhibit self-verification by revisiting queries, focusing on key information, and paraphrasing, leading to deeper contextual understanding and self-correction. It mitigates factual drift by revisiting the original problem. The model can state “Let’s read the sentence again” or “Wait, the problem states”.
Iterative SIFT#
The section on iterative SIFT explores the potential for continual optimization of the Sticker component within the SIFT framework. The experiments, using Llama3.2-3B-Instruct on GSM8K, reveal a test-time scaling effect where increased tokens per sample generally correlate with improved performance. Rapid saturation is observed for Stage 2, suggesting diminishing returns on forward optimization alone. Stage 3, incorporating inverse generation, offers an additional performance boost. However, the initial optimization round yields the most significant gains, potentially because GSM8K problems have relatively simple Stickers. The study suggests that more complex scenarios might benefit from additional optimization repeats to achieve optimal Sticker extraction. Furthermore, exploring a dedicated training regime for Sticker optimization could further enhance iterative results, as the current approach is training-free. This points towards a future direction for improving the efficiency and effectiveness of the SIFT approach.
More visual insights#
More on figures

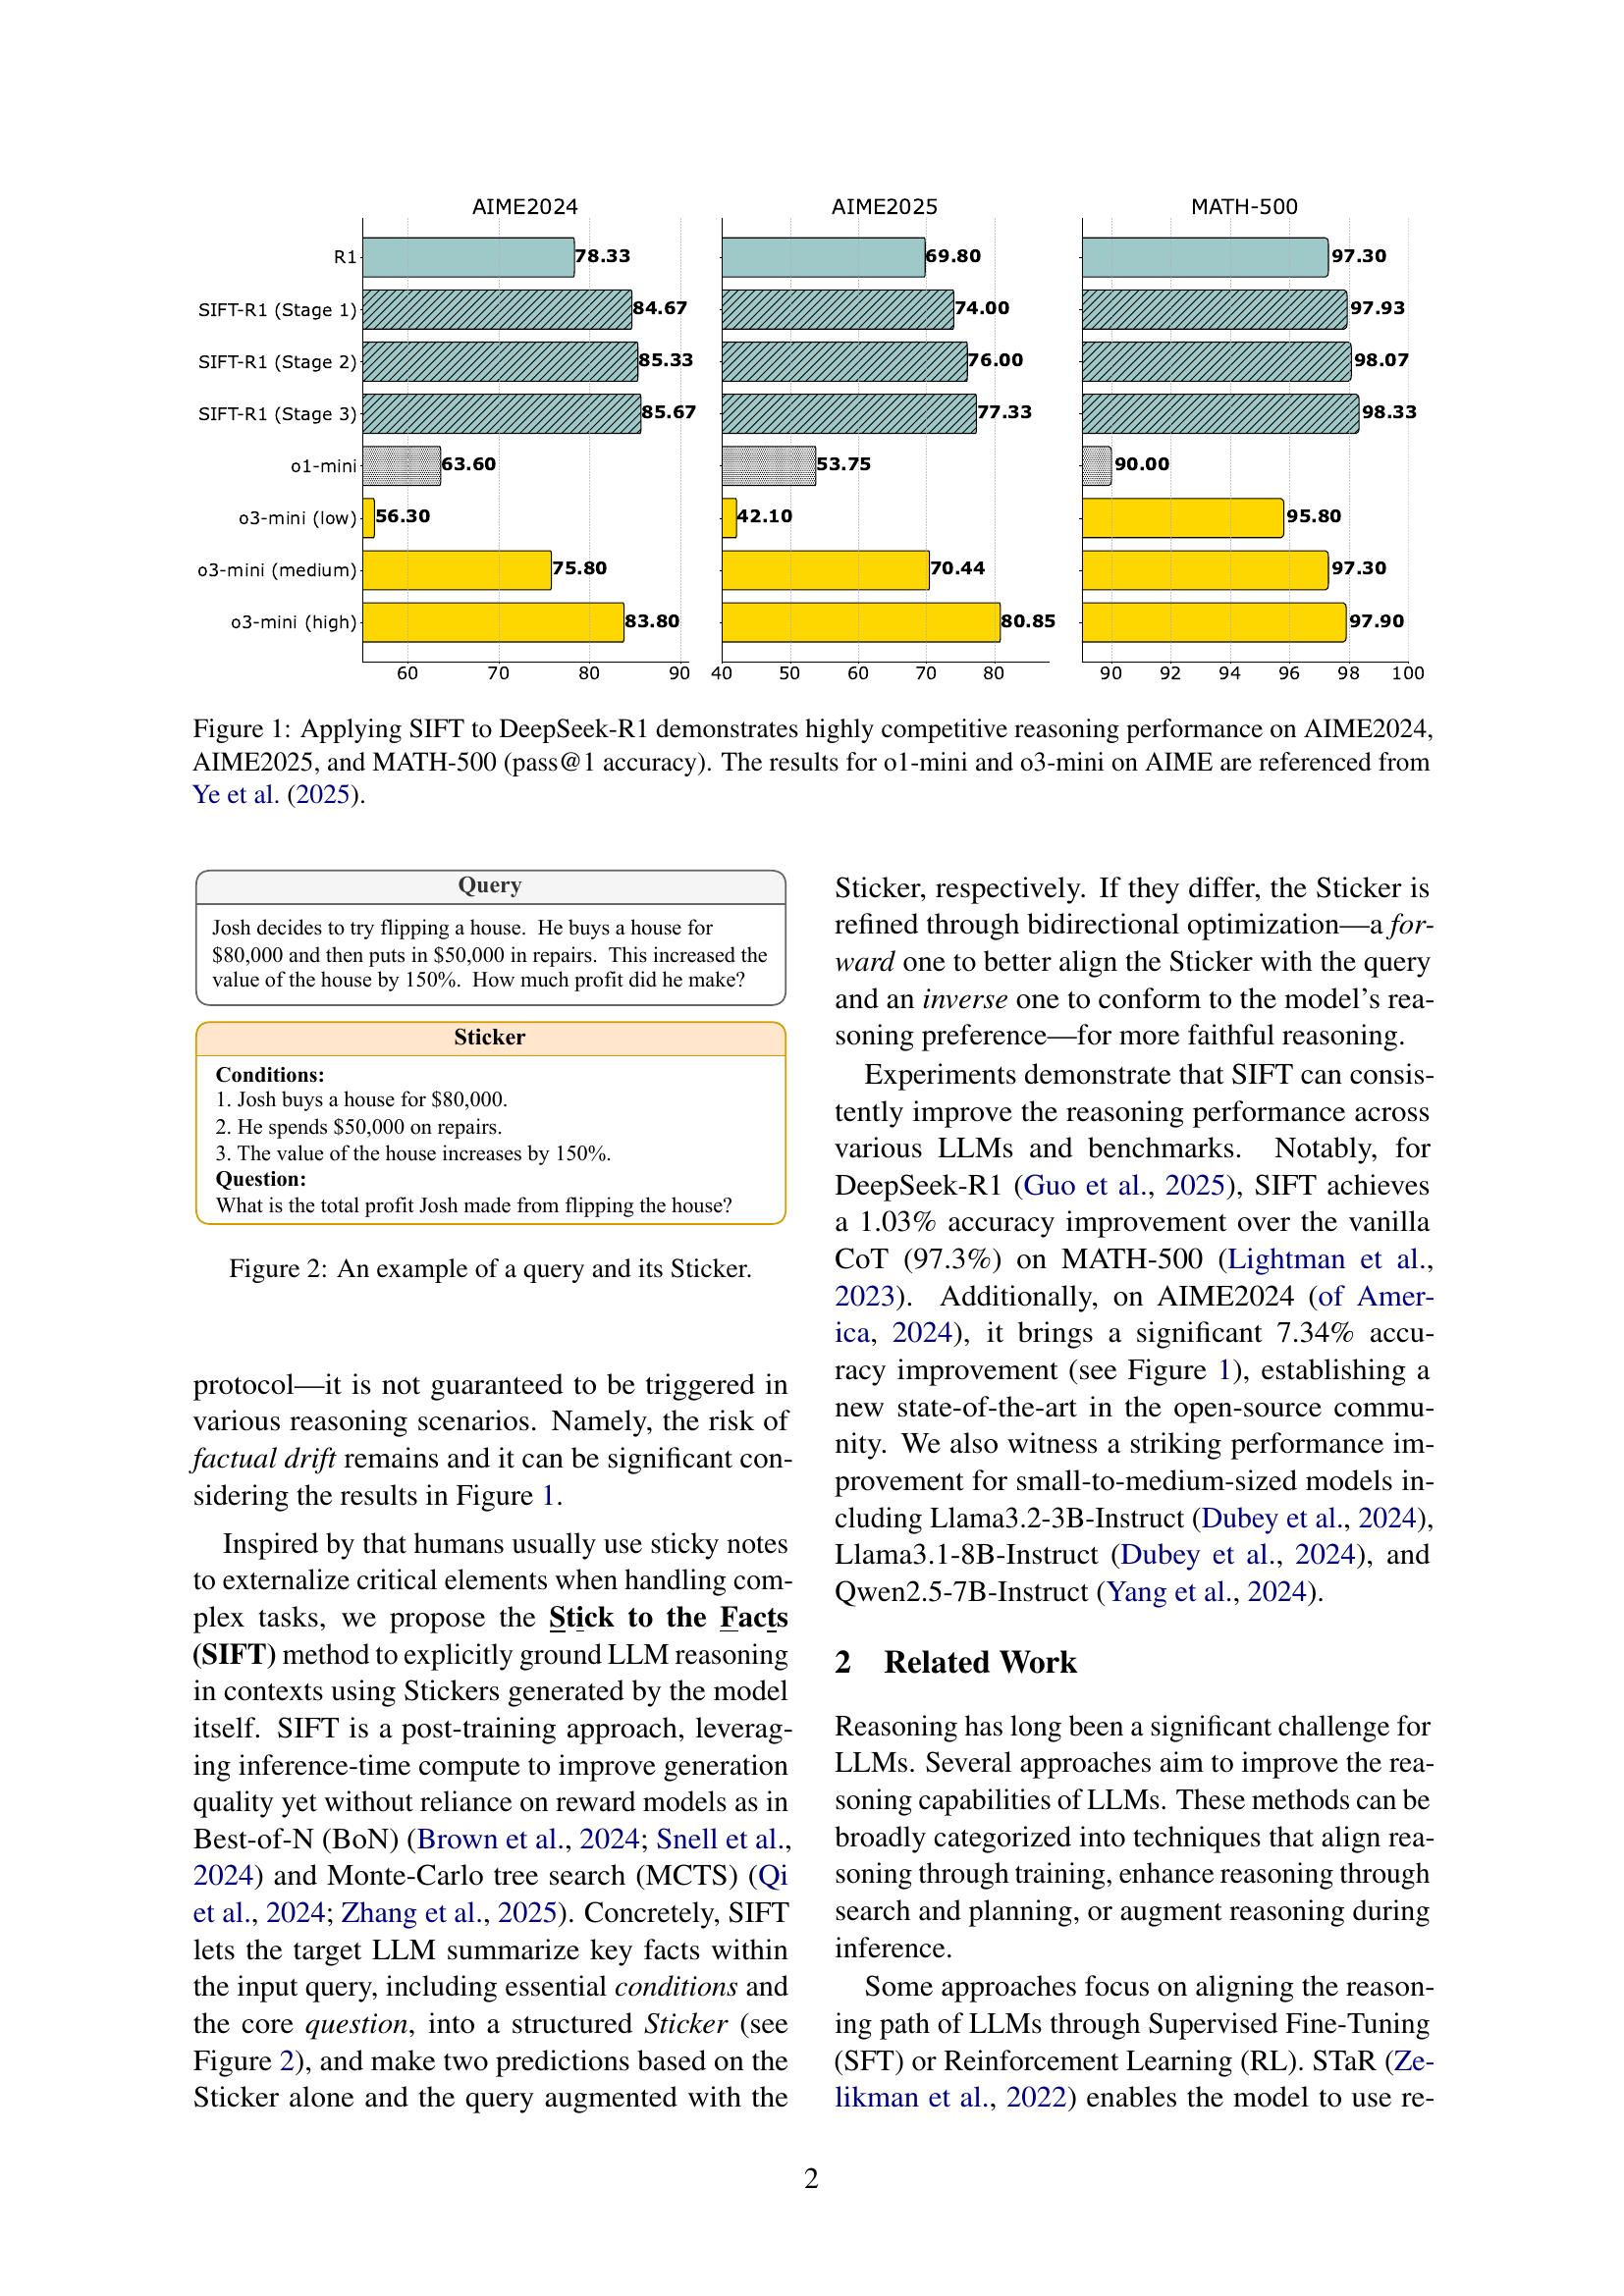
🔼 The figure shows an example of a query used in the SIFT model and the corresponding Sticker generated by the model. The query is a word problem: ‘Josh decides to try flipping a house. He buys a house for $80,000 and then puts in $50,000 in repairs. This increased the value of the house by 150%. How much profit did he make?’ The Sticker summarizes the key information from the query into a structured format, including conditions and the question, such as: ‘1. Josh buys a house for $80,000. 2. He spends $50,000 on repairs. 3. The value of the house increases by 150%. Question: What is the total profit Josh made from flipping the house?’
read the caption
Figure 2: An example of a query and its Sticker.

🔼 This figure illustrates two scenarios where factual drift, the misinterpretation of key information in the context, occurs during the SIFT process. In (i), the model generates an incorrect ‘Sticker’ by neglecting key constraints from the query, demonstrating that factual drift can occur even during the summarization stage. In (ii), the model correctly generates the Sticker but misinterprets its information during prediction generation, highlighting that the problem is not solely limited to the initial summarization.
read the caption
Figure 3: Factual drift occurs during (i) Sticker generation and (ii) prediction generation from Sticker.

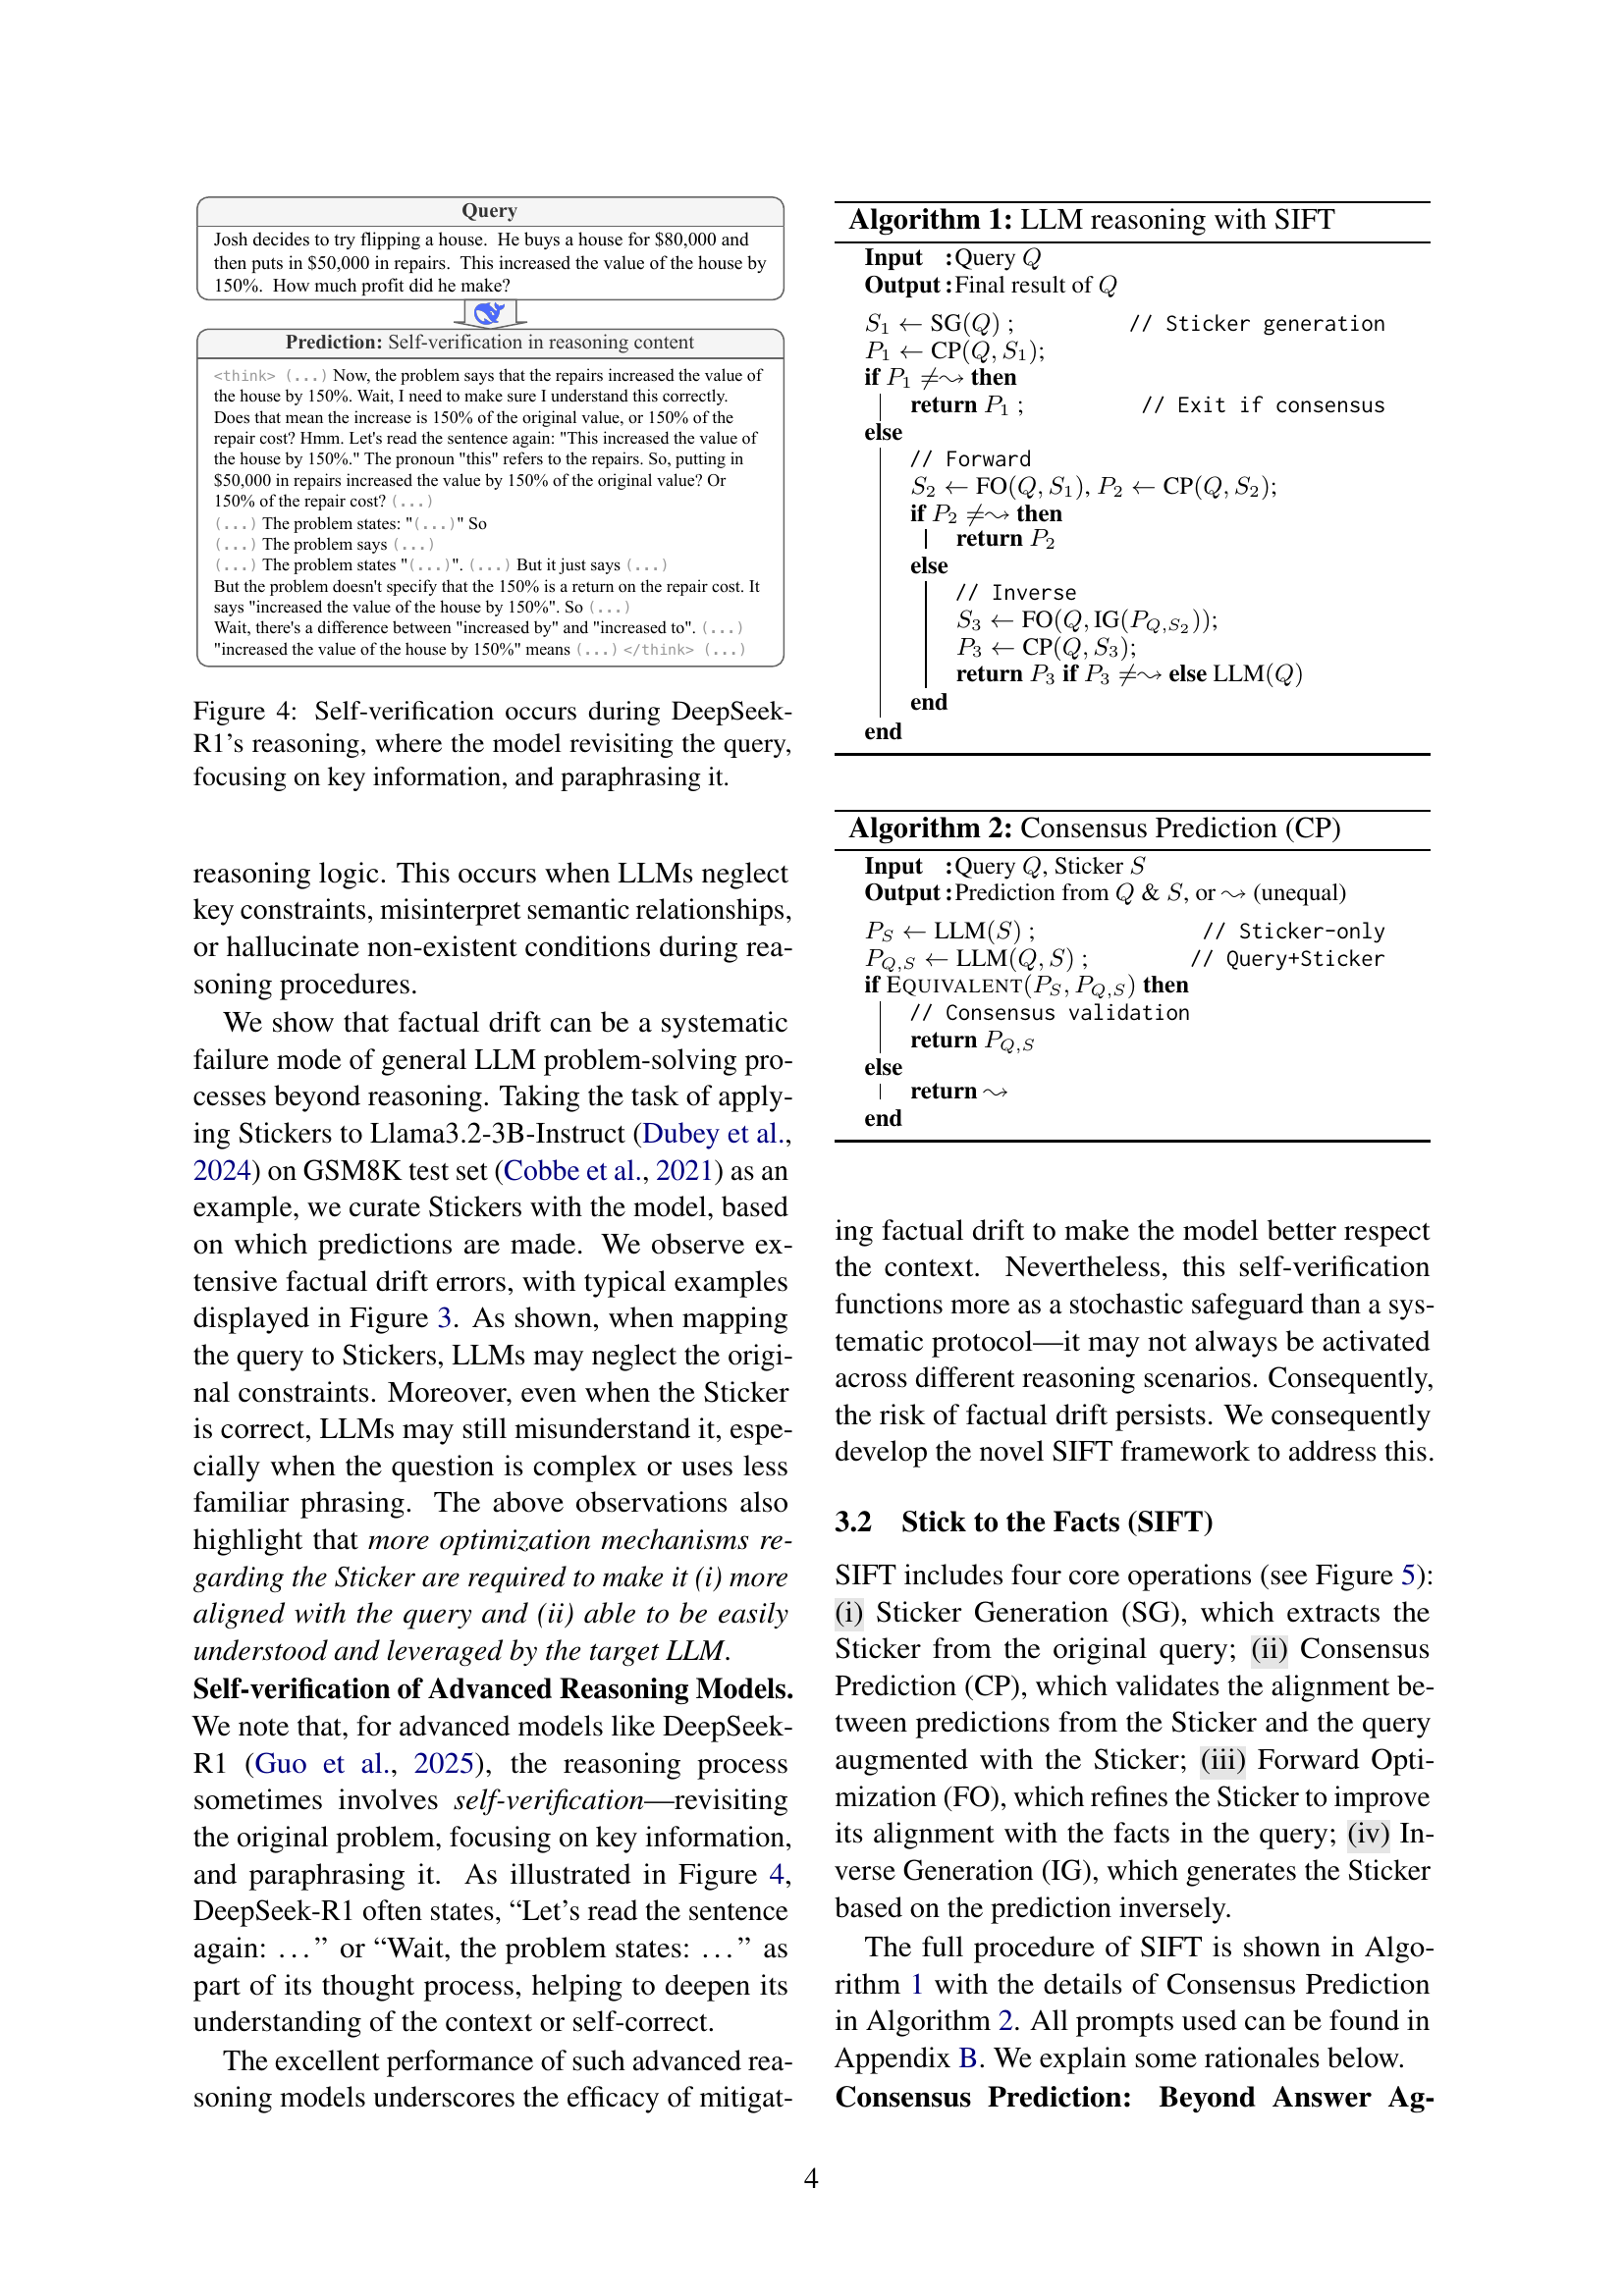
🔼 This figure shows an example of DeepSeek-R1’s self-verification process during reasoning. The model demonstrates its ability to mitigate factual drift by revisiting the original query, identifying key details, and rephrasing critical elements for a more accurate understanding before proceeding with its reasoning steps. This highlights the model’s capacity for introspection and self-correction, improving the overall reliability of its reasoning process.
read the caption
Figure 4: Self-verification occurs during DeepSeek-R1’s reasoning, where the model revisiting the query, focusing on key information, and paraphrasing it.

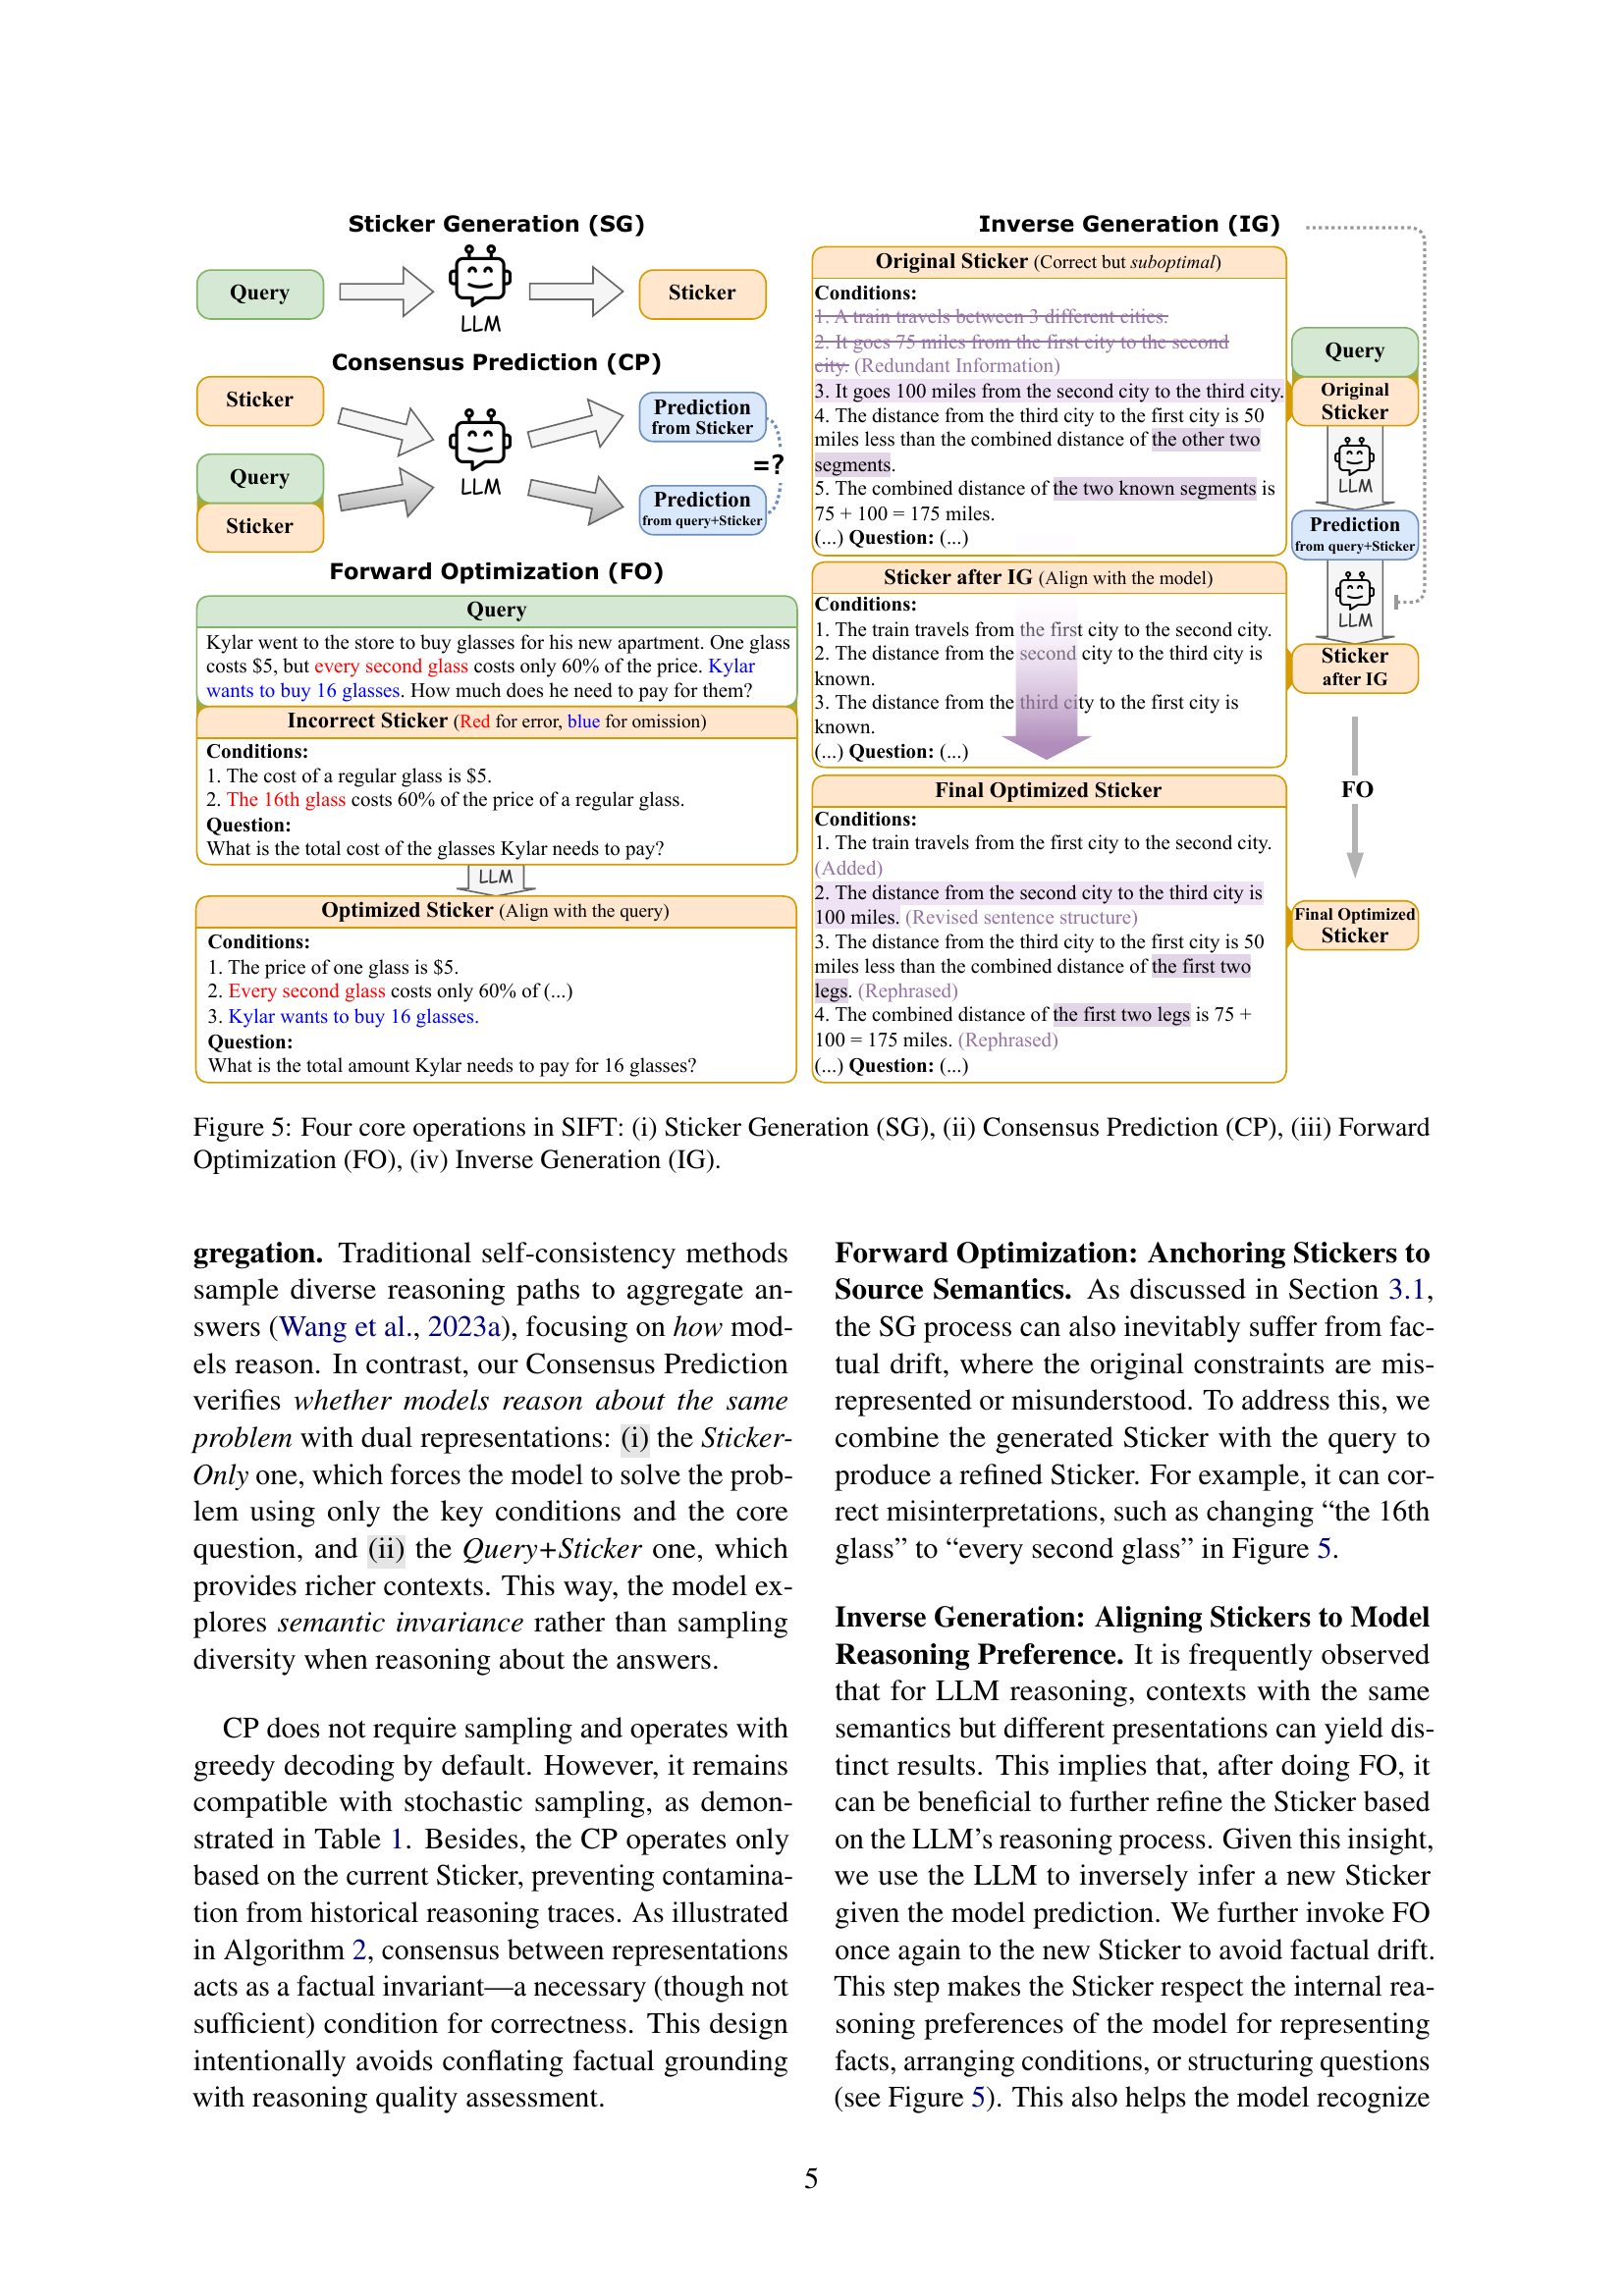
🔼 This figure illustrates the four core components of the Stick to the Facts (SIFT) framework. It details the process of generating a ‘Sticker’ which summarizes key facts from the input query. This sticker is then used in a consensus prediction step to compare two predictions made by the language model: one using only the sticker and the other using both the sticker and the original query. If discrepancies arise, the sticker is refined through forward optimization to better align with the query and through inverse generation to ensure alignment with the model’s inherent reasoning. This iterative refinement aims to improve the faithfulness of the language model’s reasoning by grounding it in the most important details of the problem context.
read the caption
Figure 5: Four core operations in SIFT: (i) Sticker Generation (SG), (ii) Consensus Prediction (CP), (iii) Forward Optimization (FO), (iv) Inverse Generation (IG).

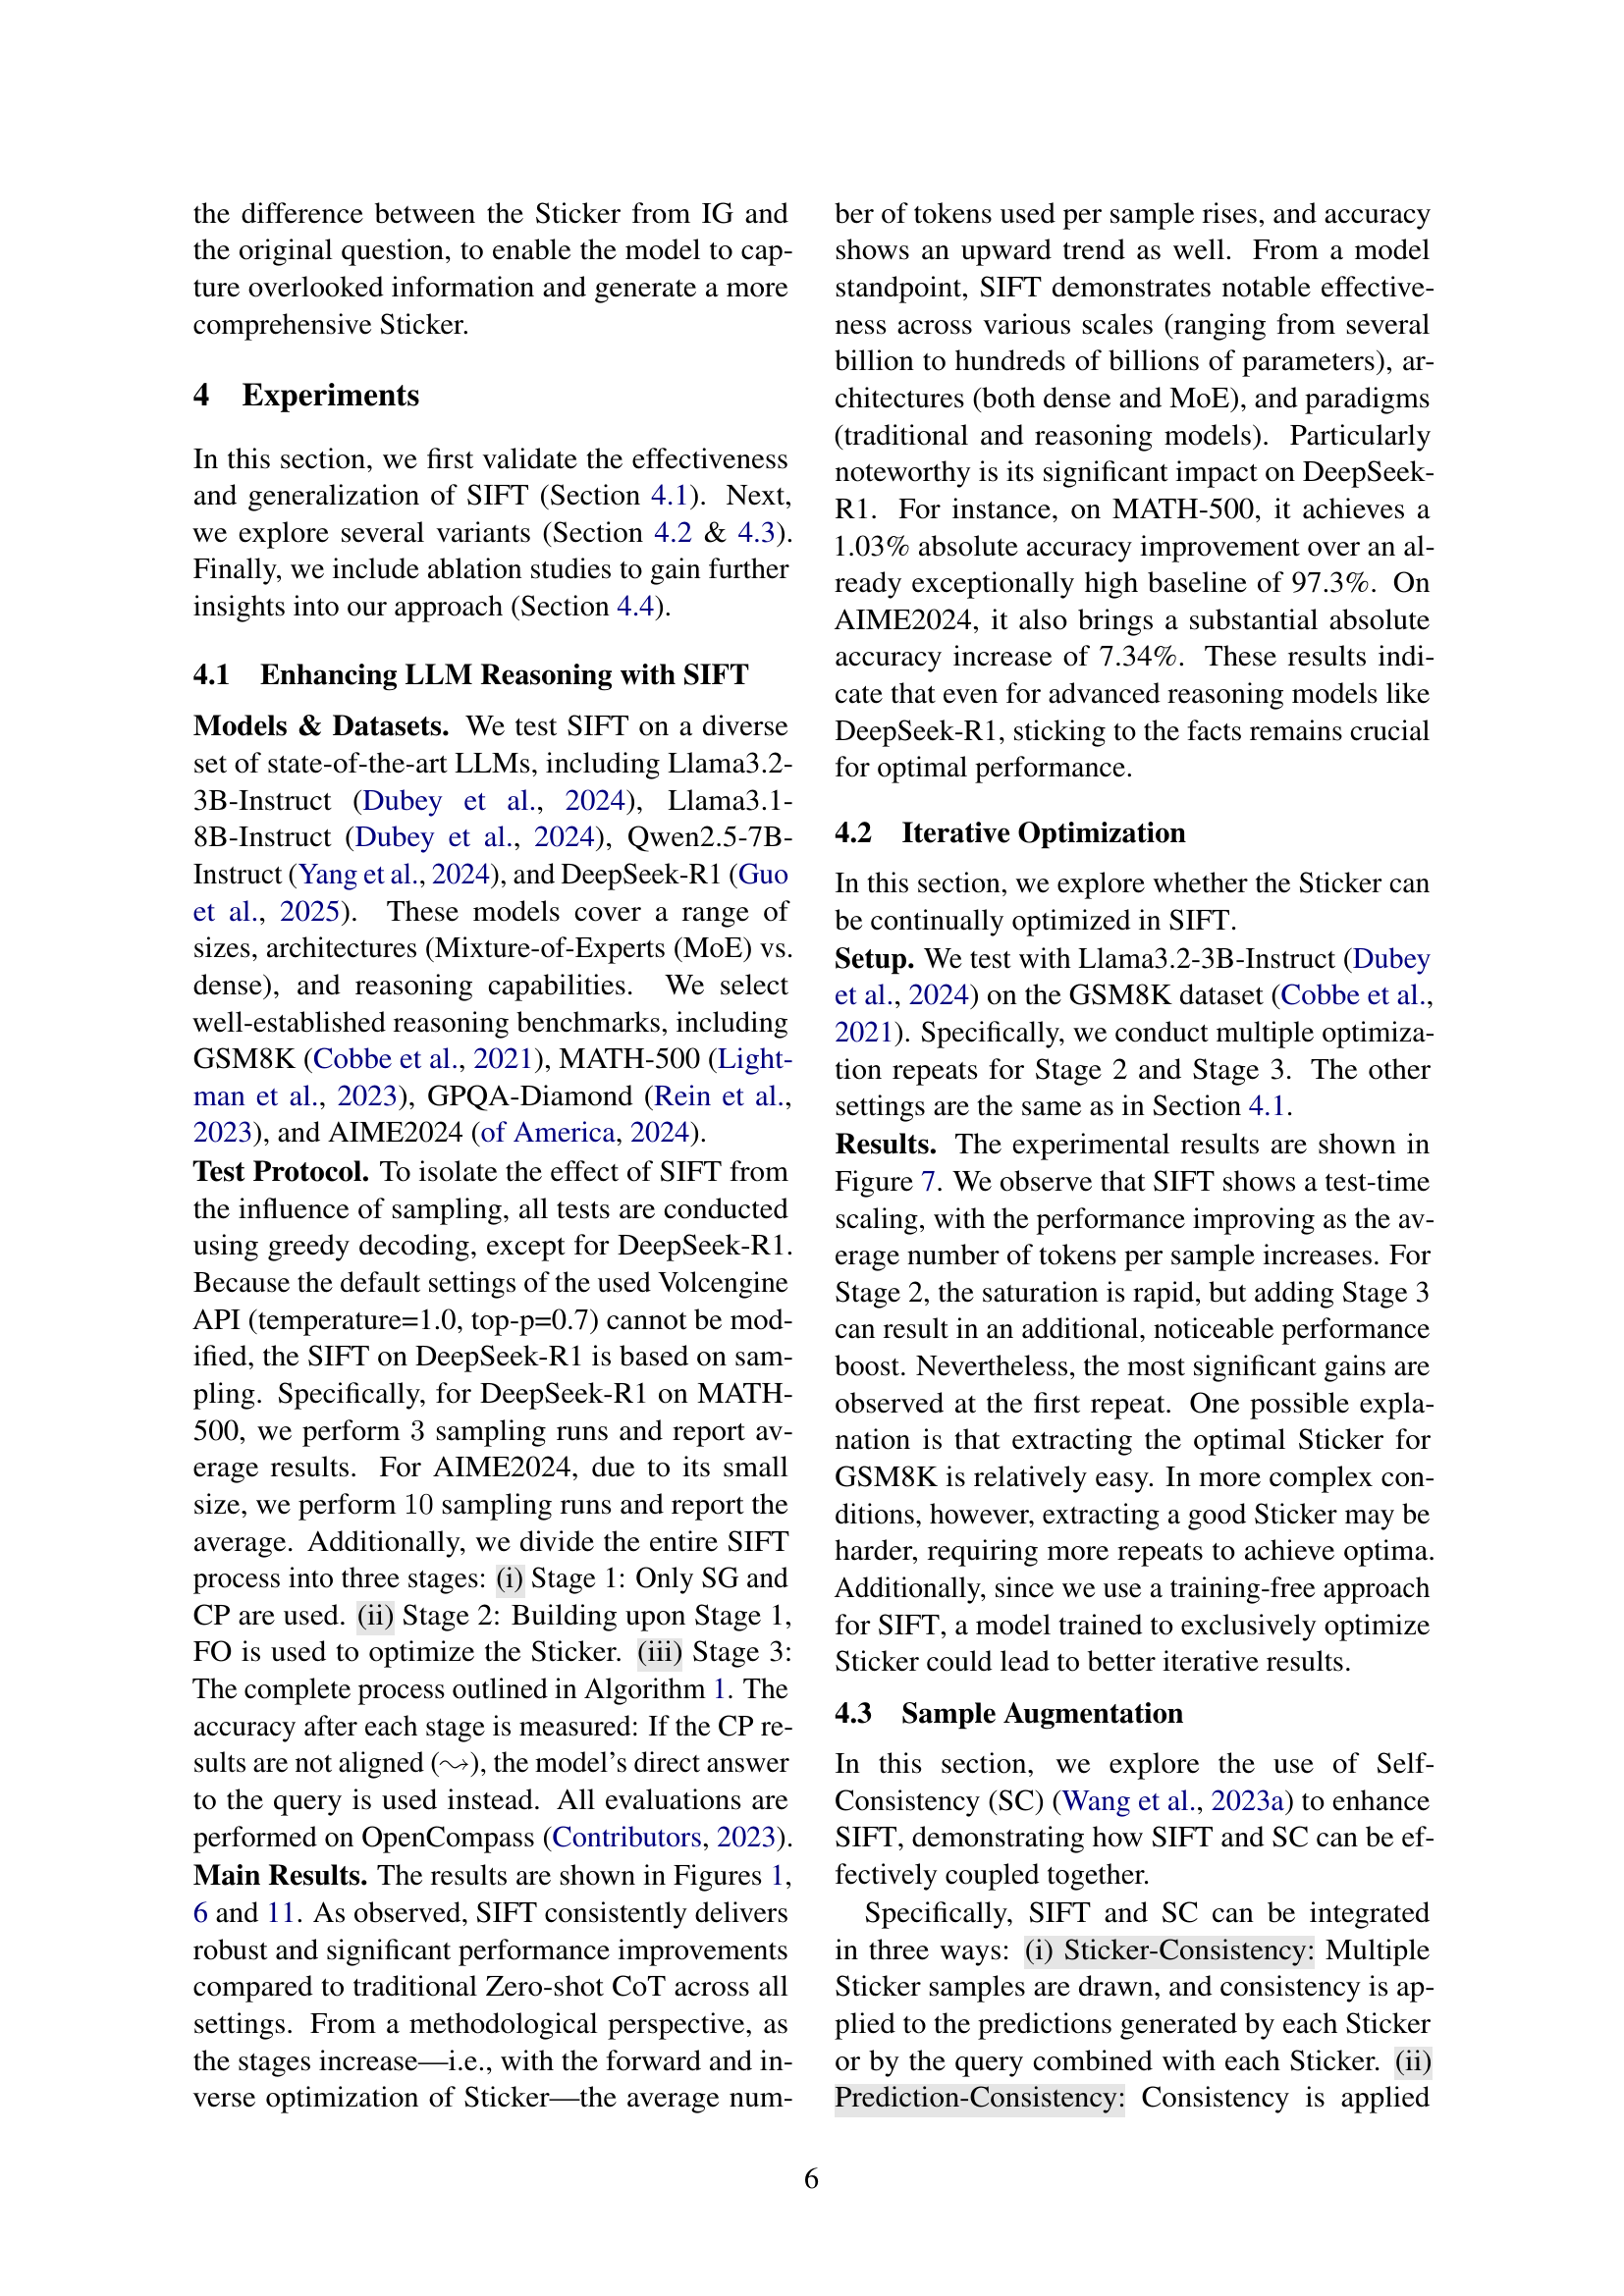
🔼 Figure 6 presents a comprehensive comparison of the proposed SIFT method and the traditional zero-shot Chain-of-Thought (CoT) approach across a range of LLMs and benchmark datasets. SIFT is broken down into three stages to illustrate its iterative improvement process. Stage 1 uses Sticker Generation (SG) and Consensus Prediction (CP). Stages 2 and 3 refine the Sticker through forward optimization (+FO) and inverse generation (+IG), respectively. The figure uses bidirectional arrows to visually emphasize the significant performance gains achieved by the complete SIFT method (Stage 3) over the baseline zero-shot CoT method.
read the caption
Figure 6: Comparison of SIFT and traditional Zero-shot CoT across multiple models and datasets. We divide SIFT into three stages: Stage 1 only uses SG & CP, while Stage 2 and Stage 3 optimize the Sticker through forward (+FO) and inverse (+IG) direction, respectively. The bidirectional arrows in the figure highlight the performance gap between Zero-shot CoT and the complete SIFT (i.e., Stage 3). We see that in nearly all scenarios, SIFT leads to a significant performance improvement.

🔼 Figure 7 shows the performance gains achieved by iteratively optimizing the Sticker in the SIFT framework. The x-axis represents the average number of tokens used per sample, while the y-axis shows the accuracy. Three stages are depicted: Stage 1 (SG & CP), Stage 2 (+FO), and Stage 3 (+IG). As the average number of tokens increases (reflecting more iterative refinement), the accuracy consistently improves. The largest improvements in accuracy are seen in the initial iterations of Stage 2 (introducing forward optimization) and Stage 3 (adding inverse generation). This indicates that the initial refinements of the Sticker are most impactful on the overall reasoning accuracy, with diminishing returns on subsequent iterations.
read the caption
Figure 7: Iterative optimization results for SIFT. The performance improves as the number of tokens per sample increases across different stages. Significant gains are observed in the first repeats of Stage 2 and Stage 3.

🔼 Figure 8 presents Venn diagrams that visually represent the agreement between predictions made using two different approaches: one using only the generated ‘Sticker,’ and the other using both the ‘Sticker’ and the original ‘Query.’ The percentages shown indicate the accuracy of instances where both methods produced identical predictions. Analyzing the diagrams reveals a substantial improvement in prediction alignment. From Stage 1 to Stage 2 (incorporating Forward Optimization), accuracy increases by 6.14%, and from Stage 2 to Stage 3 (adding Inverse Generation), the accuracy improves another 4.85%. This demonstrates that the combination of Forward Optimization and Inverse Generation significantly enhances the consistency of predictions.
read the caption
Figure 8: Venn diagrams illustrating the accuracy of predictions obtained from the “Only Sticker” and “Query & Sticker” representations at each stage. The percentages represent the accuracy where both methods correctly predict the same outcomes. From Stage 1 to Stage 2, the accuracy increases by 6.14%, and from Stage 2 to Stage 3, it increases by 4.85%. The results show the significant impact of Forward Optimization (FO) and Inverse Generation (IG) in improving prediction alignment from the two representations.

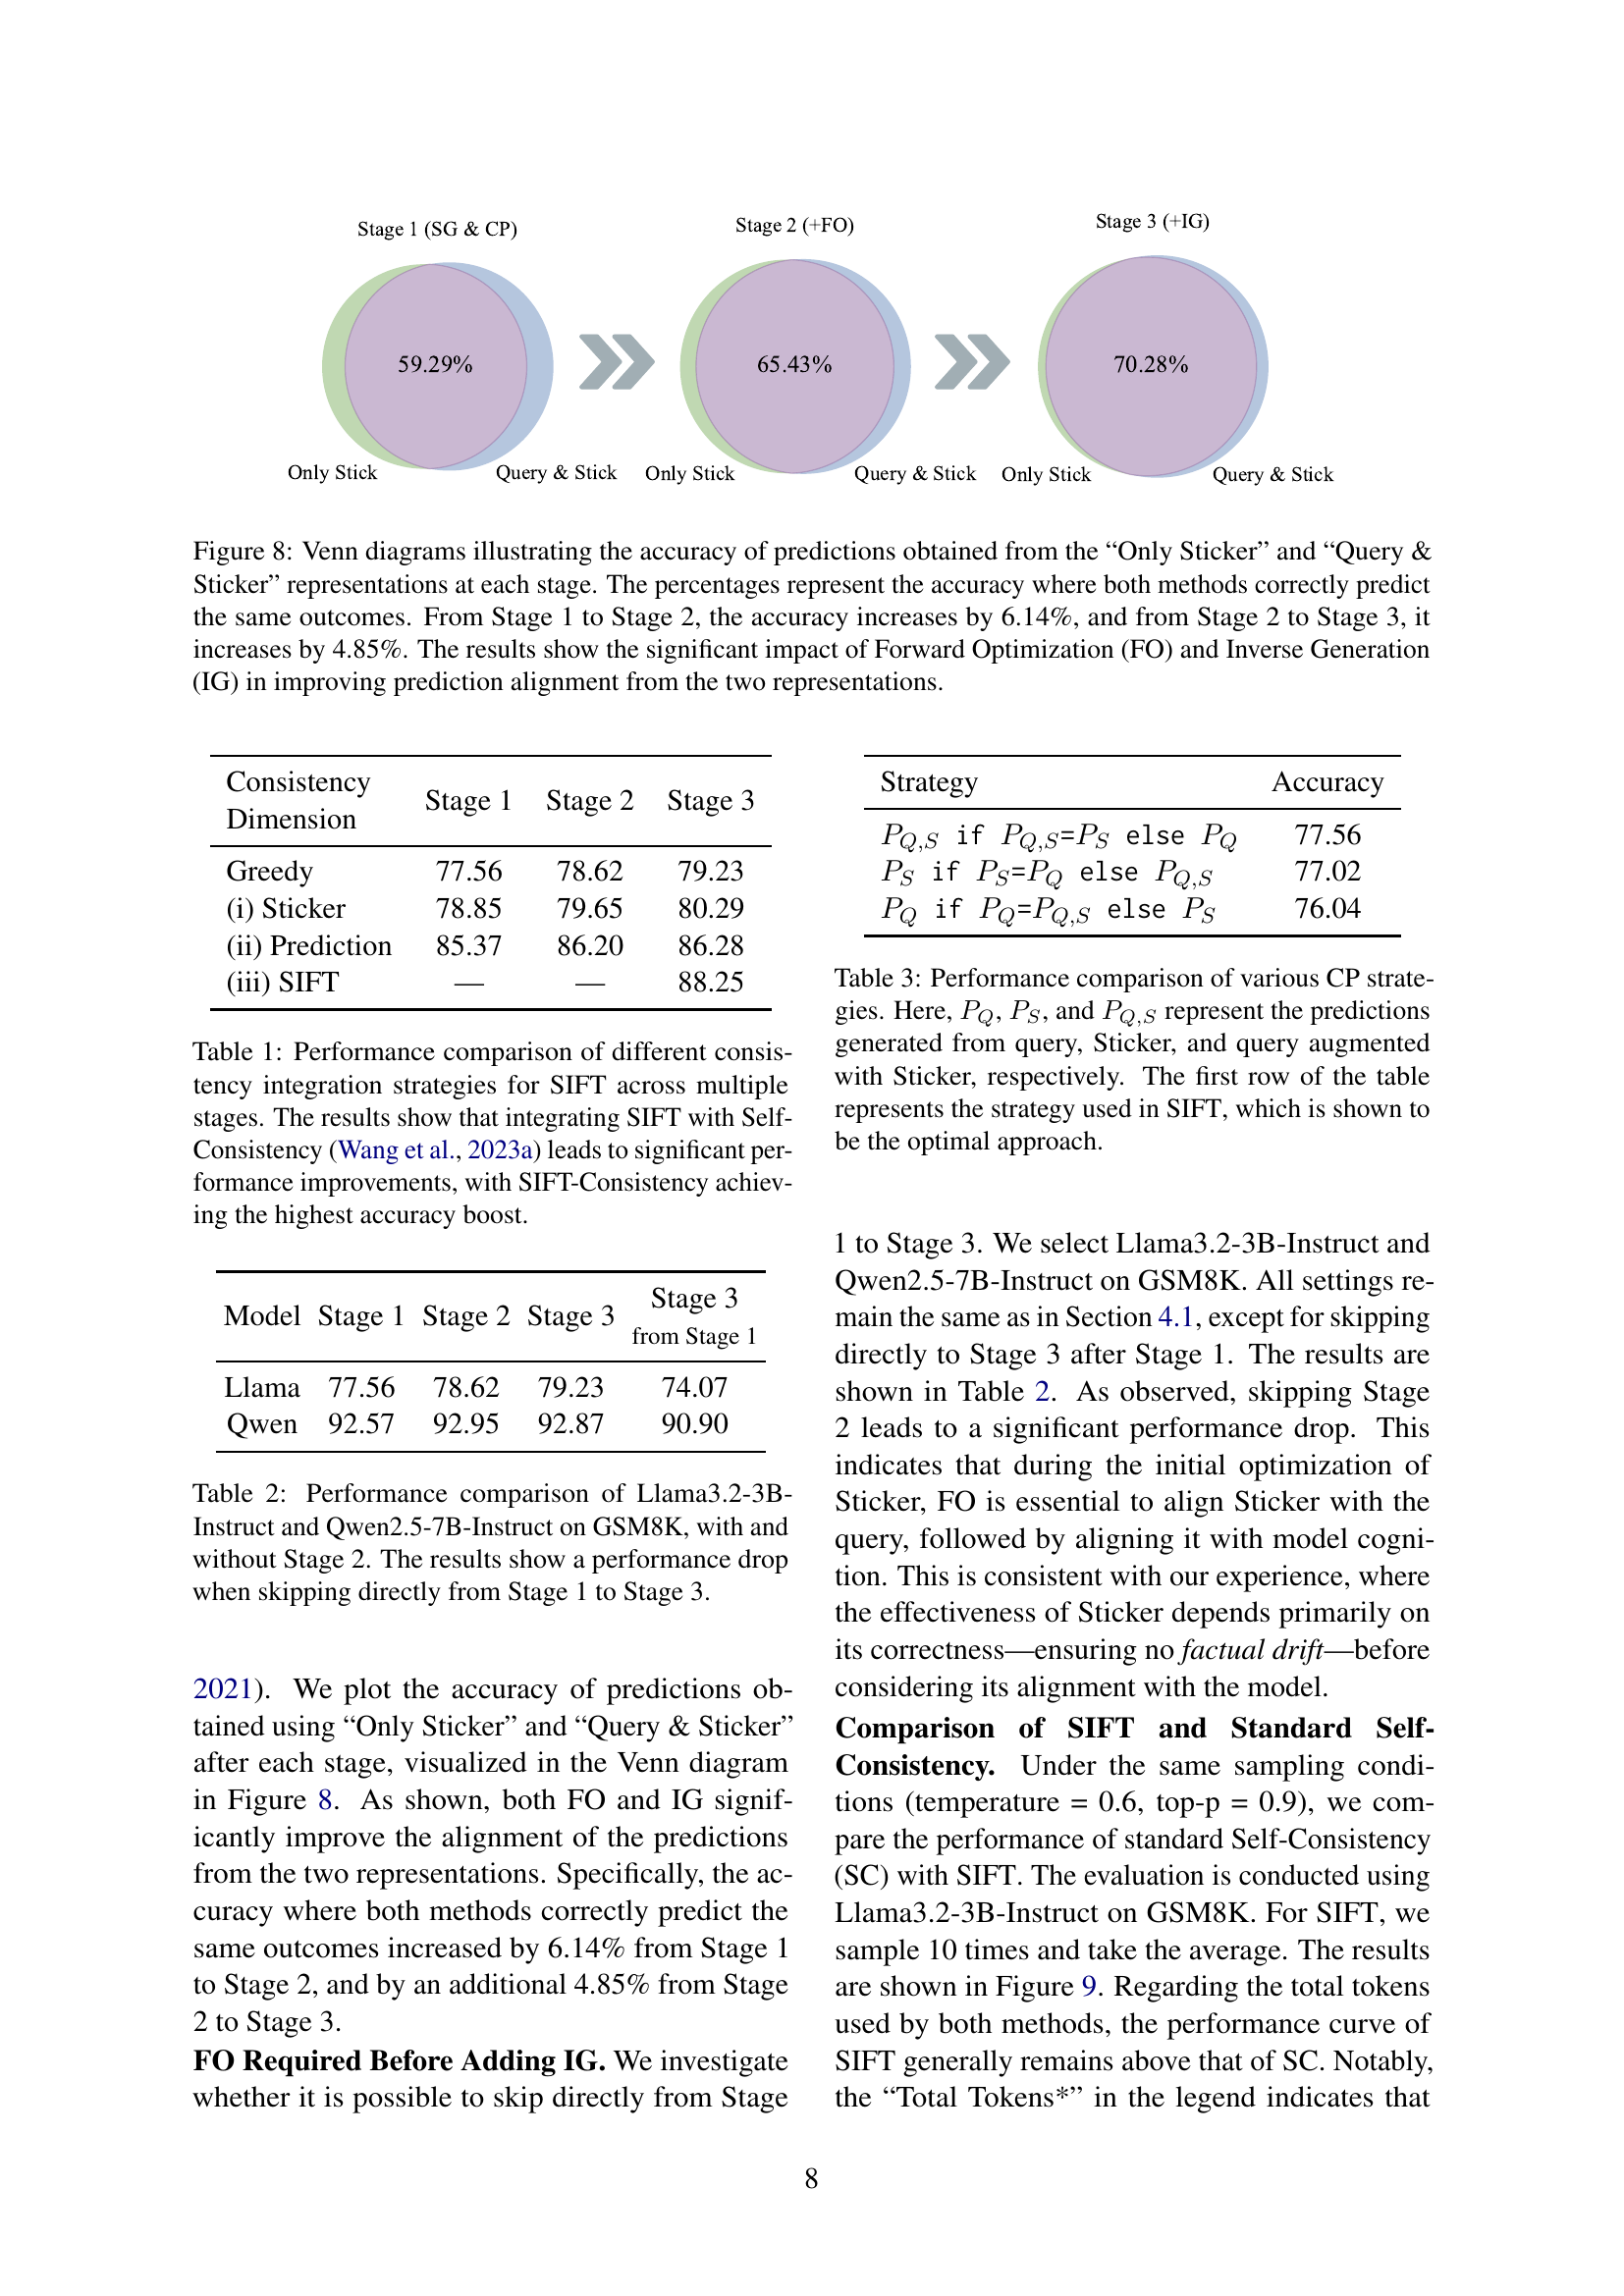
🔼 Figure 9 illustrates a comparison of SIFT and Self-Consistency (SC) methods in terms of their accuracy and efficiency. The x-axis represents the average number of tokens per sample, while the y-axis shows the accuracy achieved. Solid lines depict the number of output tokens used by each method (blue for SC, red for SIFT), and dashed lines represent the total tokens consumed (including prompts and formatting). Crucially, the caption highlights that SIFT’s total token count fluctuates because of additional formatting requirements and example constraints in the prompts. Despite this fluctuation, the results demonstrate that SIFT achieves comparable accuracy to SC while using considerably fewer output tokens, showcasing its superior efficiency.
read the caption
Figure 9: Comparison of SIFT and standard Self-Consistency (SC) in terms of accuracy versus average tokens per sample. The solid lines represent the output tokens used by SC (blue) and SIFT (red), while the dashed lines indicate the total tokens consumed. The “*” symbol in the legend denotes that the total tokens for SIFT fluctuate due to the additional formatting and example constraints used during inference. SIFT achieves comparable accuracy to SC while using significantly fewer output tokens, demonstrating its efficiency.

🔼 This figure compares the performance of SIFT-Consistency and Self-Consistency methods on the GSM8K dataset using Llama3.2-3B-Instruct model. The x-axis represents the number of sampled responses per query, while the y-axis shows the accuracy. The results demonstrate that SIFT-Consistency consistently achieves higher accuracy than Self-Consistency across different sampling numbers.
read the caption
Figure 10: Comparison of SIFT-Consistency and Self-Consistency across different numbers of sampled responses per query. SIFT-Consistency consistently outperforms Self-Consistency.

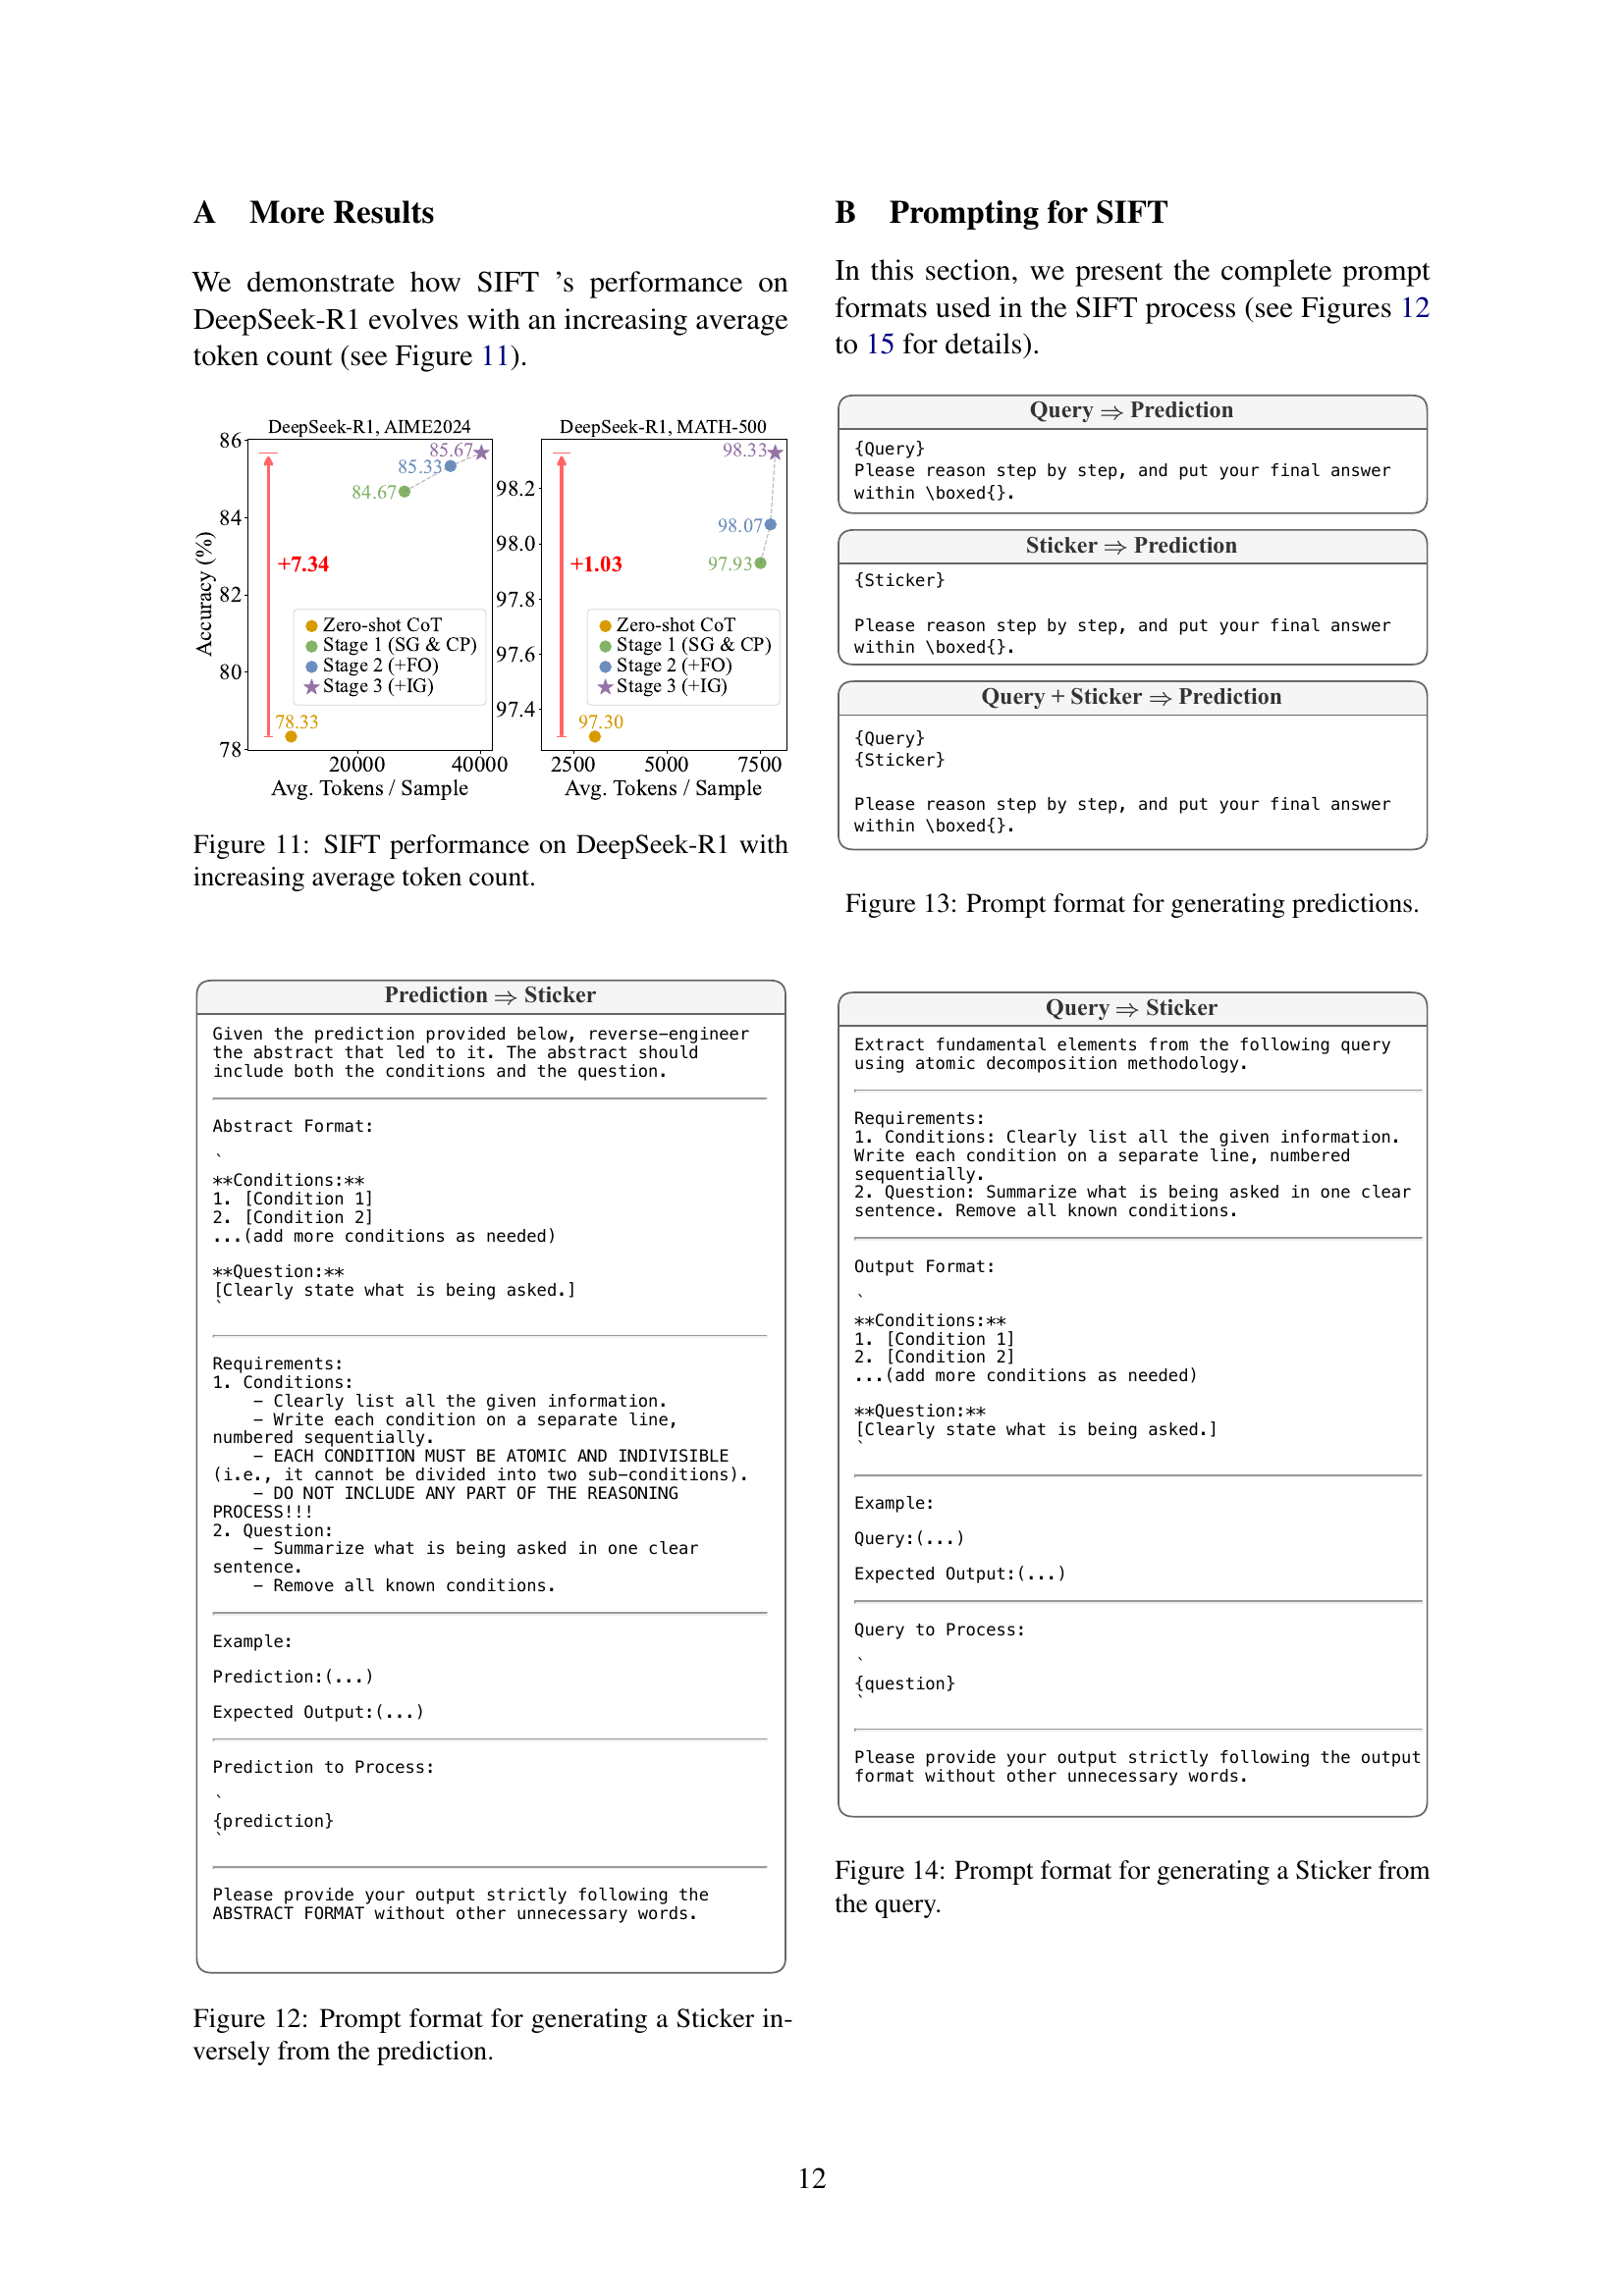
🔼 This figure shows how the performance of the SIFT method changes as the average number of tokens used during inference increases, specifically when applied to the DeepSeek-R1 language model. The x-axis represents the average number of tokens, and the y-axis shows the accuracy achieved on two benchmark datasets: AIME2024 and MATH-500. Multiple lines represent different stages of the SIFT process, revealing performance improvement as more tokens are used.
read the caption
Figure 11: SIFT performance on DeepSeek-R1 with increasing average token count.

🔼 This figure shows the prompt template used in the SIFT framework for generating a sticker from a prediction. The process takes the prediction as input and reconstructs the abstract which led to that prediction. The abstract must include conditions and a question, which are then used to generate the sticker. The prompt is formatted to elicit a response that contains the essential facts and constraints of the problem, which is crucial to SIFT’s ability to ground LLM reasoning in contexts and mitigate factual drift.
read the caption
Figure 12: Prompt format for generating a Sticker inversely from the prediction.

🔼 This figure shows the prompt templates used in the SIFT method for generating predictions. Three different prediction generation scenarios are presented: using only the query, only the sticker, and a combination of both the query and sticker. Each template instructs the large language model (LLM) to reason step-by-step and provide the final answer within a box.
read the caption
Figure 13: Prompt format for generating predictions.

🔼 This figure shows the prompt template used in the SIFT method for generating a ‘Sticker’ from a given query. The prompt instructs the language model to extract key information from the query and organize it into a structured format. This format includes a numbered list of conditions (extracted facts) and a concise statement of the question. The instructions emphasize that each condition should be atomic and indivisible, and that any part of the reasoning process should not be included. The goal is to extract the core factual information, clearly separating it from any inferential or reasoning steps.
read the caption
Figure 14: Prompt format for generating a Sticker from the query.
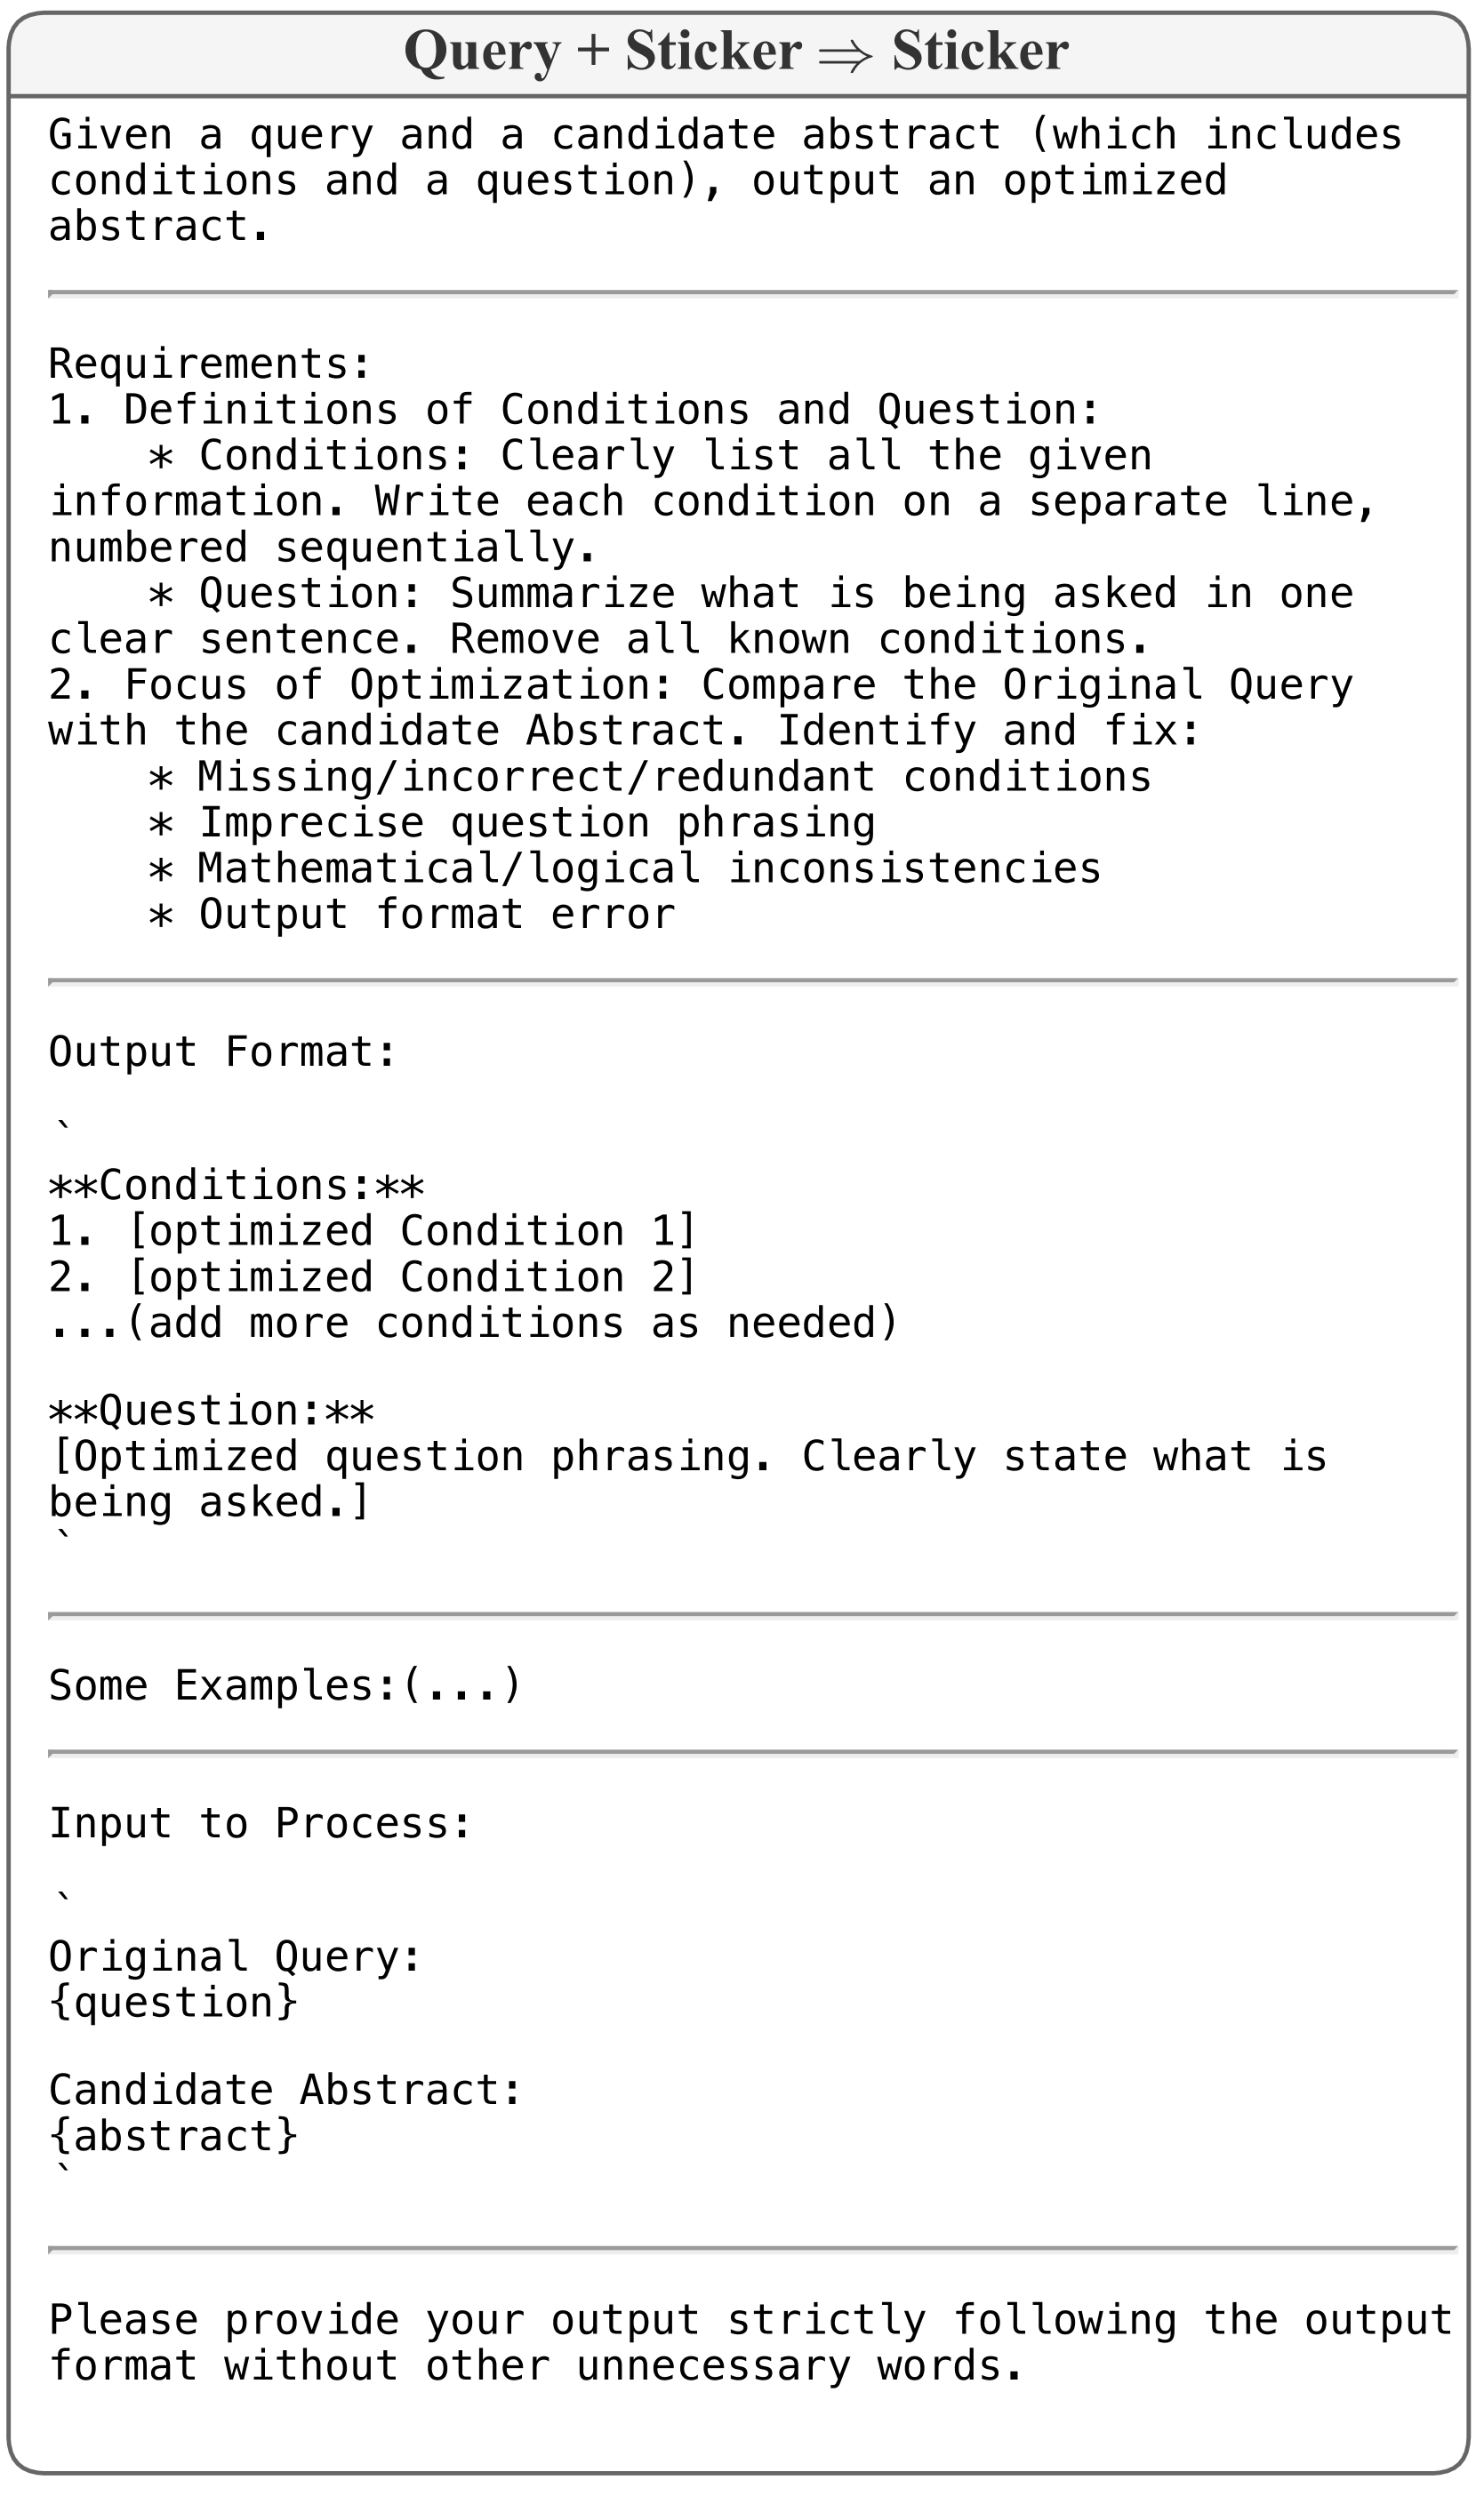
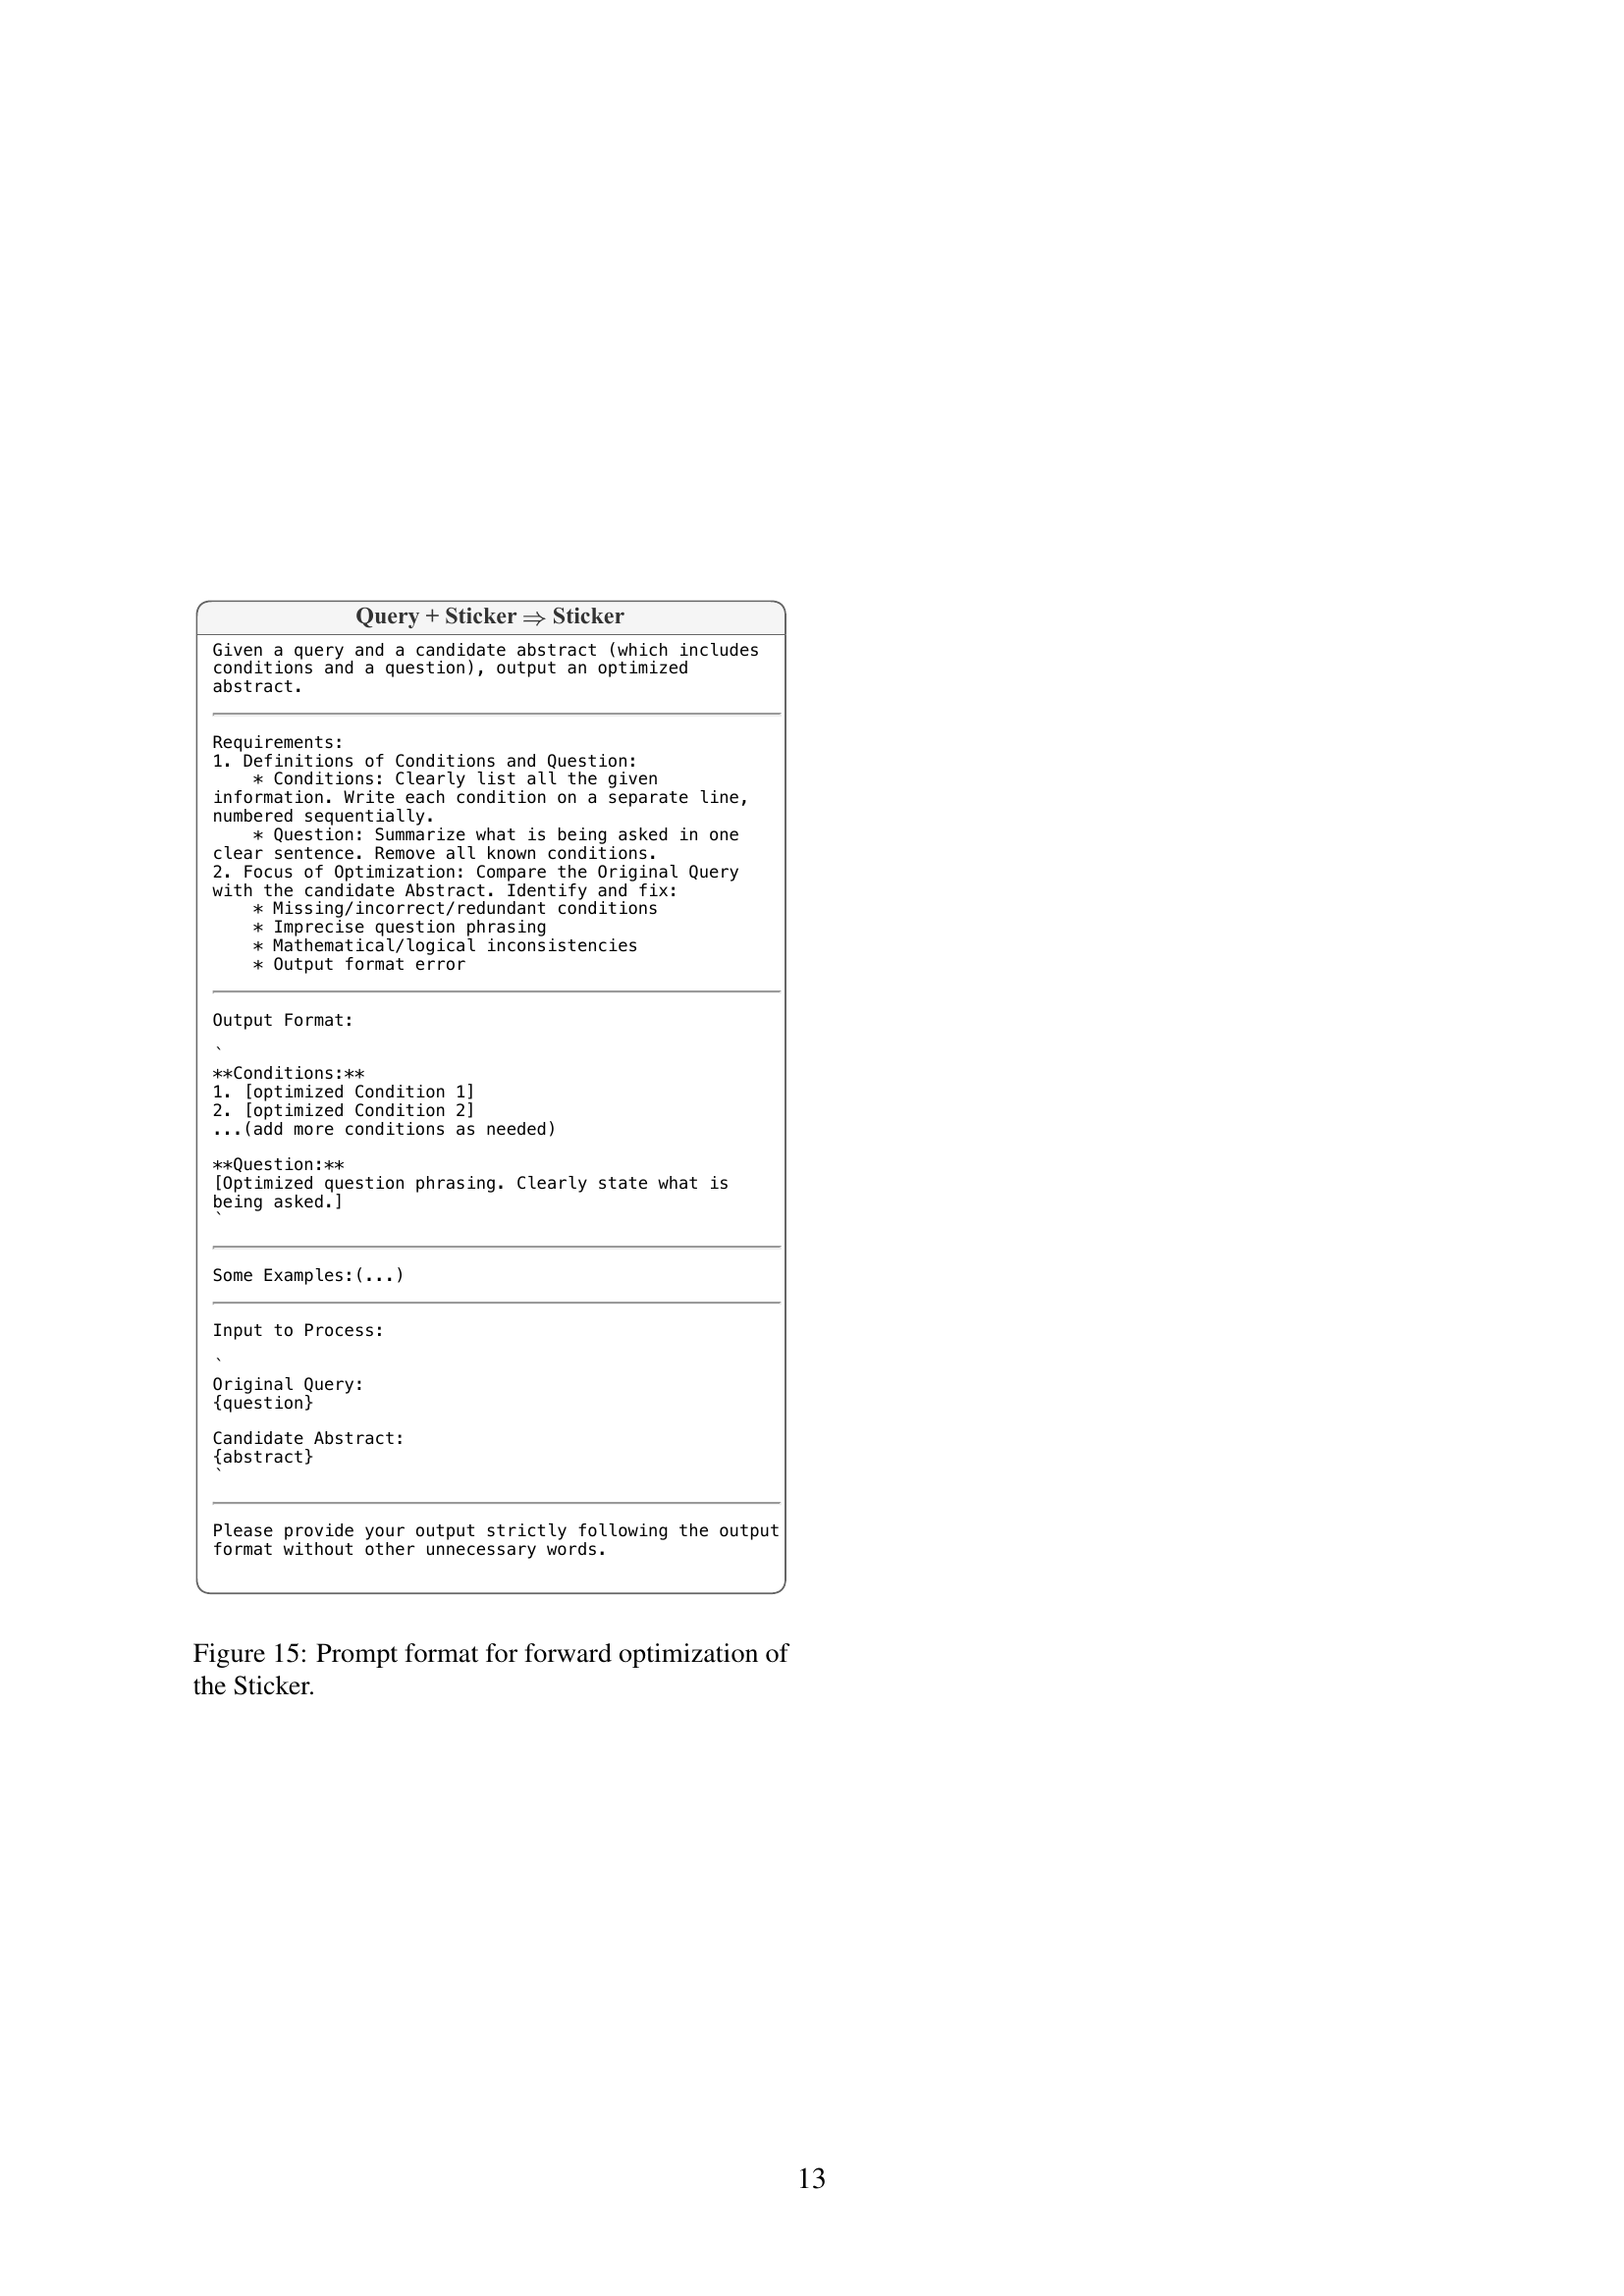
🔼 This figure shows the prompt template used in the forward optimization step of the SIFT algorithm. The prompt aims to refine the ‘Sticker’ (a summary of key information from the query) by comparing it to the original query and correcting any inaccuracies or omissions. The goal is to ensure the Sticker accurately represents the essential facts and question before proceeding with the prediction. The prompt provides detailed instructions, including formats for presenting conditions, and sample inputs and outputs to guide the model’s generation of the optimized sticker.
read the caption
Figure 15: Prompt format for forward optimization of the Sticker.
More on tables
| Model | Stage 1 | Stage 2 | Stage 3 | Stage 3 |
|---|---|---|---|---|
| from Stage 1 | ||||
| Llama | 77.56 | 78.62 | 79.23 | 74.07 |
| Qwen | 92.57 | 92.95 | 92.87 | 90.90 |
🔼 This table compares the performance of two different large language models, Llama3.2-3B-Instruct and Qwen2.5-7B-Instruct, on the GSM8K benchmark. It shows the accuracy achieved at three different stages of the SIFT (Stick to the Facts) process: Stage 1 (only Sticker Generation and Consensus Prediction), Stage 2 (adding Forward Optimization), and Stage 3 (including Inverse Generation). The key finding is that skipping Stage 2 and going directly from Stage 1 to Stage 3 leads to a decrease in accuracy, highlighting the importance of the intermediate optimization step in the SIFT process.
read the caption
Table 2: Performance comparison of Llama3.2-3B-Instruct and Qwen2.5-7B-Instruct on GSM8K, with and without Stage 2. The results show a performance drop when skipping directly from Stage 1 to Stage 3.
| Strategy | Accuracy |
|---|---|
| 77.56 | |
| 77.02 | |
| 76.04 |
🔼 Table 3 compares different strategies for making predictions in the Consensus Prediction (CP) step of the SIFT algorithm. It shows the accuracy achieved when using predictions from the query alone (PQ), the Sticker alone (PS), and the query combined with the Sticker (PQ,S). The table highlights that the prediction strategy used in SIFT (first row) provides the highest accuracy, demonstrating its superiority.
read the caption
Table 3: Performance comparison of various CP strategies. Here, PQsubscript𝑃𝑄P_{Q}italic_P start_POSTSUBSCRIPT italic_Q end_POSTSUBSCRIPT, PSsubscript𝑃𝑆P_{S}italic_P start_POSTSUBSCRIPT italic_S end_POSTSUBSCRIPT, and PQ,Ssubscript𝑃𝑄𝑆P_{Q,S}italic_P start_POSTSUBSCRIPT italic_Q , italic_S end_POSTSUBSCRIPT represent the predictions generated from query, Sticker, and query augmented with Sticker, respectively. The first row of the table represents the strategy used in SIFT, which is shown to be the optimal approach.
Full paper#