TL;DR#
Optical Character Recognition (OCR) for Arabic lags behind English OCR due to challenges like cursive script, right-to-left text, complex typography. Current Arabic OCR datasets lack comprehensive coverage and advanced document processing challenges such as table parsing, font detection, and numeral recognition. There is a need for a comprehensive framework to evaluate and compare Arabic OCR solutions by offering diverse document types and evaluation tasks to facilitate in-depth assessments of modern OCR systems.
This paper introduces KITAB-Bench, a comprehensive Arabic OCR benchmark spanning 9 domains and 36 sub-domains. The framework evaluates layout detection, multi-format recognition, and structured output generation. It facilitates in-depth assessments of modern OCR systems. The contributions include a comprehensive Arabic OCR benchmark covering multiple document types and recognition tasks, detailed evaluation metrics, baseline results for OCR systems and VLMs, and a standardized framework for comparing Arabic OCR systems.
Key Takeaways#
Why does it matter?#
This paper introduces KITAB-Bench, a new Arabic OCR benchmark, addressing current gaps and limitations. It provides a rigorous evaluation framework to drive improvements in Arabic document analysis methods, bridging the performance gap with English OCR tech.
Visual Insights#

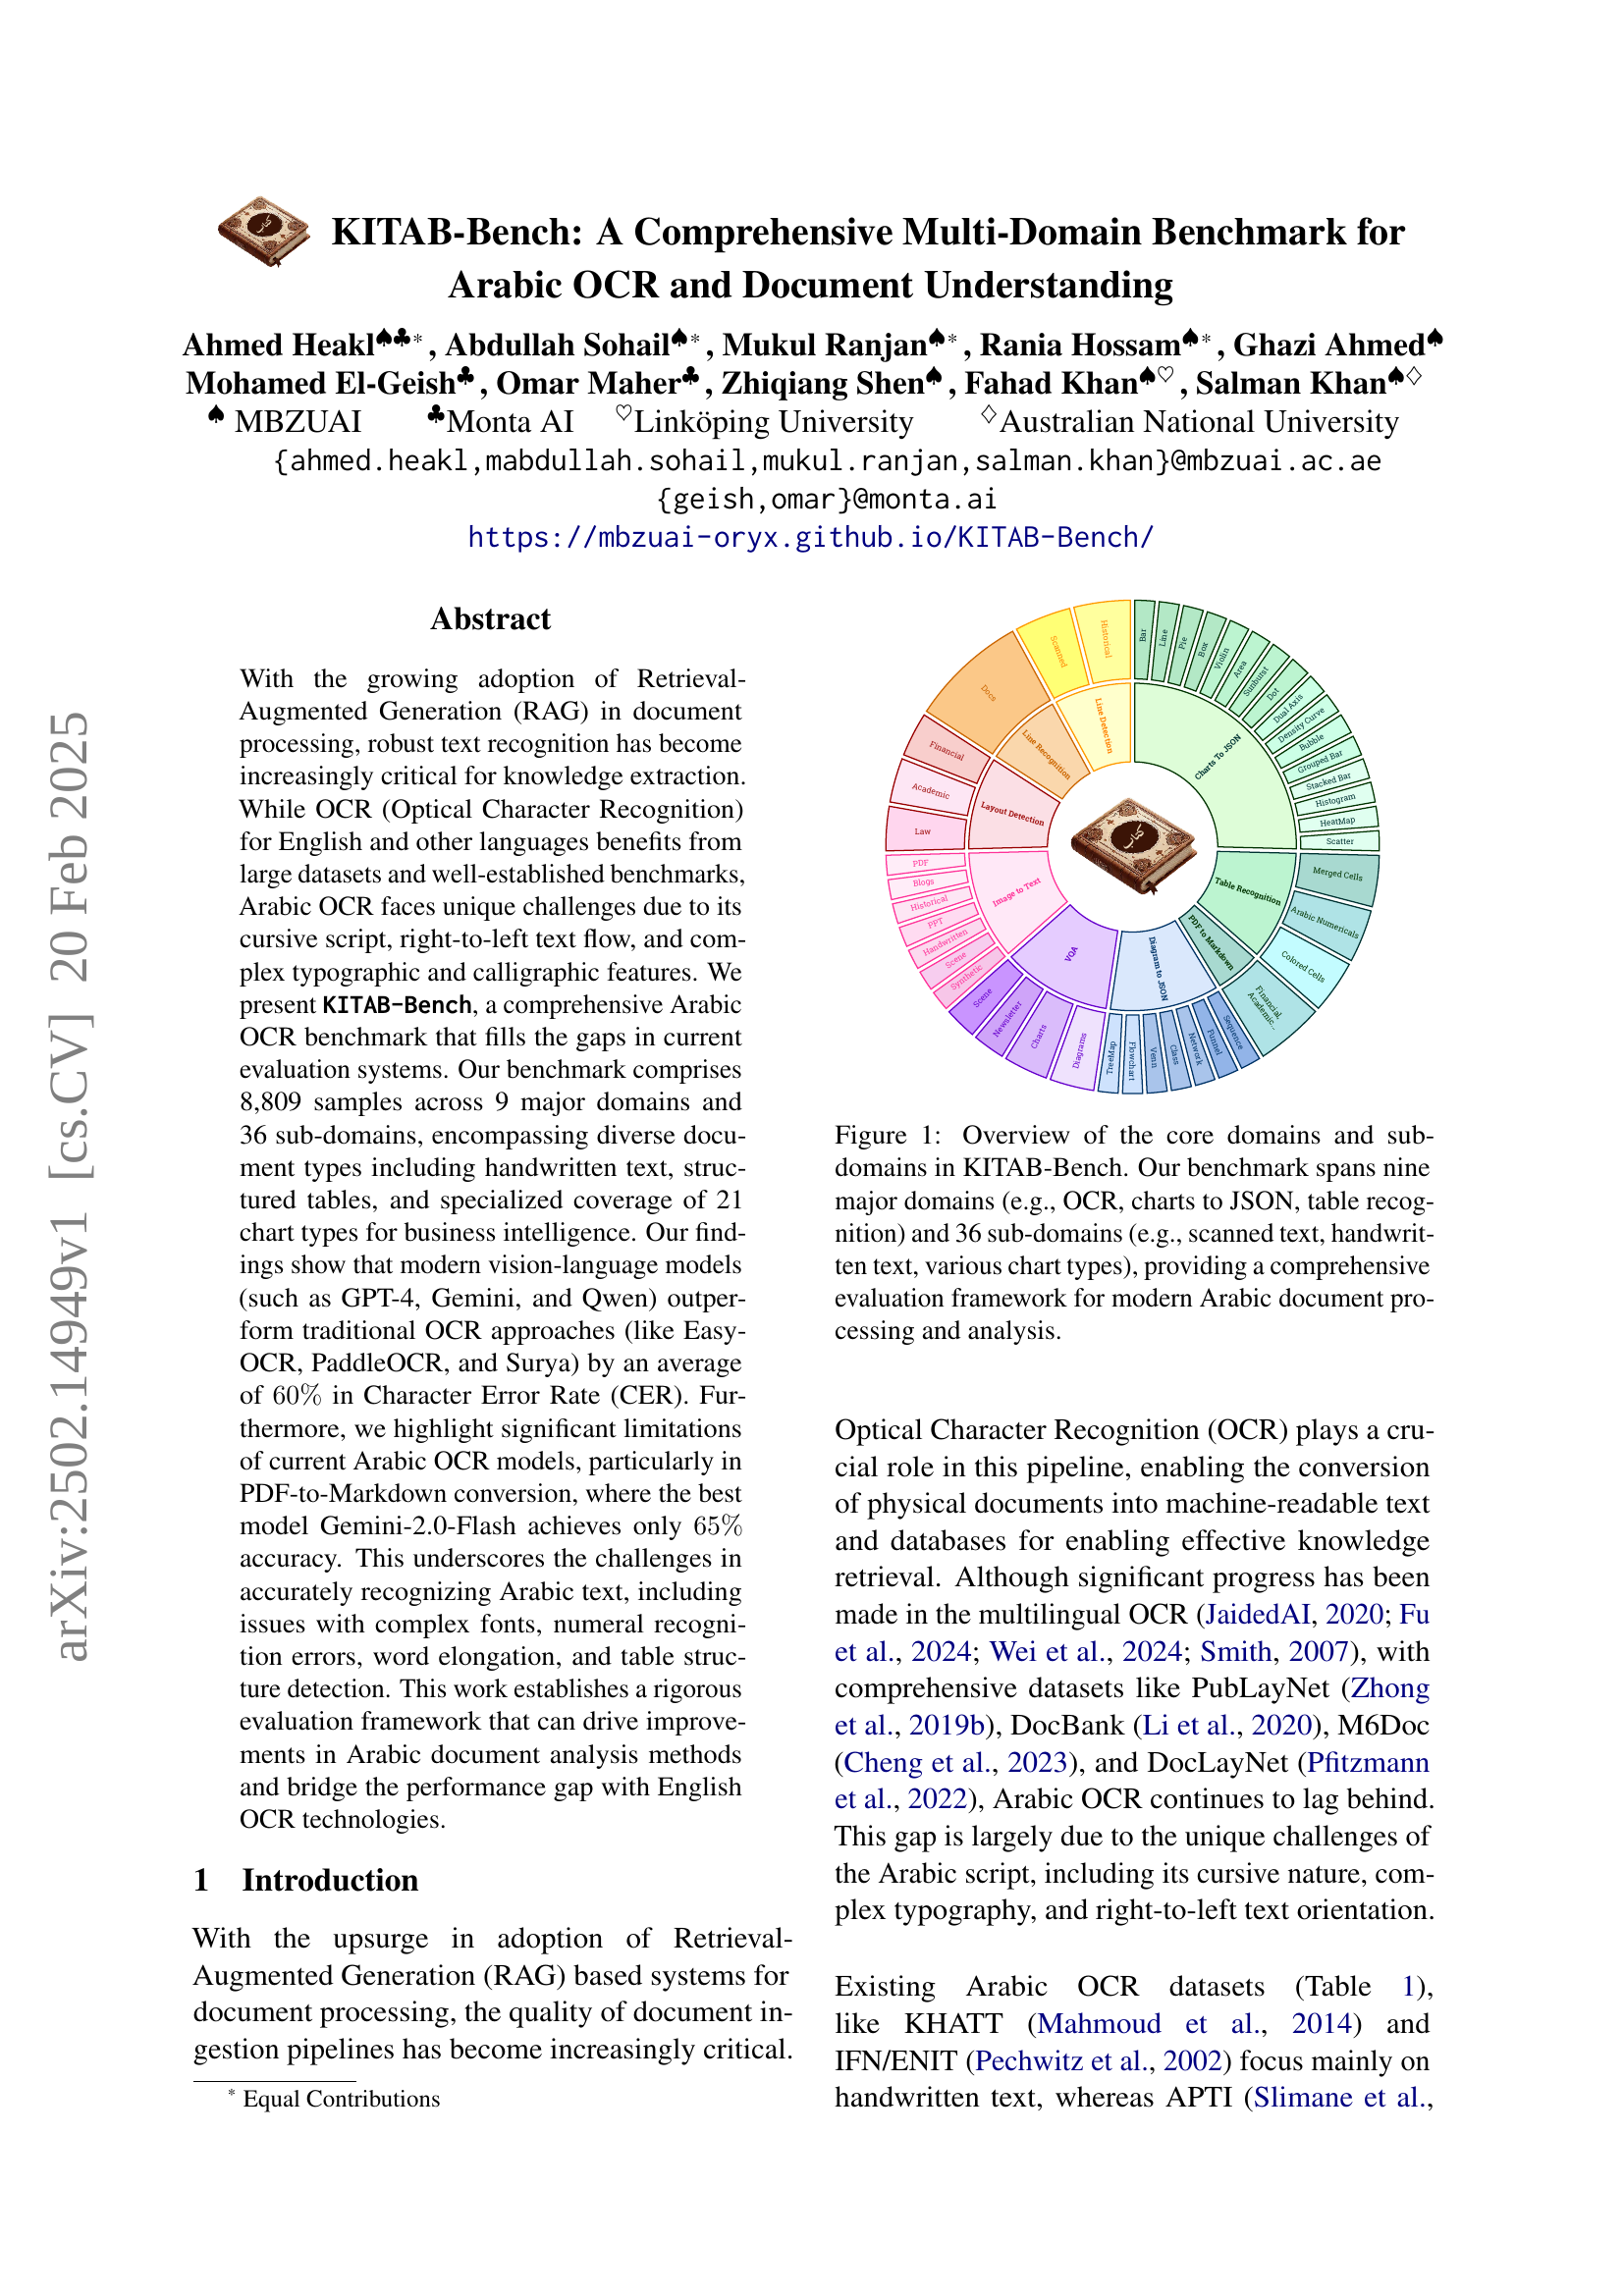
🔼 Figure 1 provides a visual representation of the KITAB-Bench benchmark’s structure. It illustrates the nine core domains and 36 sub-domains included in the benchmark. The domains cover key tasks in Arabic document understanding, such as OCR, chart-to-JSON conversion, and table recognition. The sub-domains further specify the types of documents and data used within each domain (e.g., handwritten text, scanned text, various chart types). KITAB-Bench’s goal is to offer a comprehensive evaluation of Arabic document processing and analysis systems, enabling researchers to assess the performance of their methods across a diverse range of document formats and complexity levels.
read the caption
Figure 1: Overview of the core domains and sub-domains in KITAB-Bench. Our benchmark spans nine major domains (e.g., OCR, charts to JSON, table recognition) and 36 sub-domains (e.g., scanned text, handwritten text, various chart types), providing a comprehensive evaluation framework for modern Arabic document processing and analysis.
| Domain/ | EXAMS-V∗ | Camel- | MIDAD† | KHATT | KITAB- |
| Characteristics | Bench | Bench (Ours) | |||
| PDF to Markdown | ✗ | ✗ | ✗ | ✗ | ✓ |
| Layout Detection | ✗ | ✗ | ✗ | ✗ | ✓ |
| Line Detection | ✗ | ✗ | ✗ | ✗ | ✓ |
| Line Recognition | ✗ | ✓ | ✗ | ✗ | ✓ |
| Table Recognition | ✗ | ✗ | ✗ | ✗ | ✓ |
| Image to Text | ✓ | ✓ | ✓ | ✓ | ✓ |
| Charts to JSON | ✗ | ✗ | ✗ | ✗ | ✓ |
| Diagram to Code | ✗ | ✗ | ✗ | ✗ | ✓ |
| VQA | ✓ | ✓ | ✗ | ✗ | ✓ |
| Handwritten Samples | ✗ | ✗ | ✓ | ✓ | ✓ |
| Open Source | ✓ | ✓ | ✗ | ✓ | ✓ |
| Total Samples (#) | 823 | 3,004 | 29,435 | 5,000 | 8,809 |
🔼 This table compares several Arabic OCR benchmarks across different domains, including the newly proposed KITAB-Bench. It highlights the number of samples, the domains covered (such as PDF to Markdown conversion, layout detection, table recognition, etc.), and the specific characteristics of each benchmark, pointing out which benchmarks only consider Arabic samples or use only the test sets for their evaluations. This comparison helps to showcase the comprehensiveness and unique features of KITAB-Bench in relation to existing benchmarks.
read the caption
Table 1: Comparison of Arabic OCR Benchmarks Across Different Domains. Benchmarks compared: LaraBench Abdelali et al. (2023), CamelBench Ghaboura et al. (2024), MIDAD Bhatia et al. (2024), KHATT Mahmoud et al. (2014), and KITAB-Bench (Ours). (∗*∗: Only the Arabic samples are considered.) (††\dagger†: The test set of the dataset is considered.)
In-depth insights#
Arabic OCR Bench#
KITAB-Bench is a comprehensive Arabic OCR benchmark addressing the gaps in the current evaluation system. It comprises 8,809 samples across 9 major domains and 36 sub-domains, encompassing diverse document types, including handwritten text, structured tables, and specialized coverage of 21 chart types. The findings highlight the significant limitations of current Arabic OCR models, particularly in PDF-to-Markdown conversion. This OCR enables conversion of physical documents into machine-readable text & databases for effective knowledge retrieval. The dataset combines existing data, manual annotation, and LLM-assisted synthetic data generation to represent a comprehensive & diverse challenge for Arabic OCR and document understanding systems.
KITAB-Bench Details#
The research paper introduces KITAB-Bench, a novel and comprehensive benchmark specifically designed for Arabic Optical Character Recognition (OCR) and document understanding. KITAB-Bench addresses a significant gap in existing evaluation systems, which often lack the depth and breadth required to accurately assess the challenges inherent in Arabic text processing, such as cursive script, right-to-left orientation, and complex typography. It includes a wide array of document types across various domains, ensuring a robust evaluation of OCR systems. Key areas of focus include layout detection, table recognition, chart understanding, and handwritten text recognition, going beyond basic text extraction to assess higher-level document understanding capabilities, paving the path towards bridging the gap between English and Arabic OCR technologies. The KITAB-Bench comprises of manually curated samples and real time data
LLM Data Assist#
LLM (Large Language Model) Data Assistance focuses on leveraging the capabilities of LLMs to streamline and enhance data-related processes. This involves using LLMs for data augmentation, where the model generates additional data points to enrich existing datasets, particularly useful when dealing with limited or sparse information. LLMs can also play a crucial role in data cleaning and validation, identifying and correcting errors or inconsistencies in the data, thereby improving its quality and reliability. The application extends to data labeling and annotation, where LLMs automatically assign labels to data entries, reducing the need for manual effort and accelerating the preparation of data for machine learning tasks. Furthermore, LLMs can assist in data summarization, extracting key insights and generating concise summaries from large volumes of data, facilitating efficient information retrieval and decision-making. The utilization of LLMs in data assistance presents a paradigm shift, enabling more efficient, accurate, and scalable data management and analysis.
End-to-End PDF#
The end-to-end PDF evaluation task is crucial because it assesses the entire document processing pipeline, from initial PDF input to final structured output like Markdown. This is more complex than evaluating individual components like OCR or table detection in isolation. Performance in end-to-end PDF processing highlights the challenges of integrating various modules, such as layout analysis, text recognition, and structural understanding. Closed-source models generally show superior end-to-end PDF results due to optimized integration. Framework approaches often exhibit better stability, achieving higher scores than open-source models by bridging the gap with complete processing tasks. The difference in these models reveal the level of task difficulty.
Future Arabic VLMs#
Arabic VLMs have significant potential for future development. Expanding datasets to include historical manuscripts and low-resource dialects is essential. Improved OCR accuracy, especially for tables and charts, will enhance data extraction. Future research should focus on developing robust multimodal OCR capable of processing text and images in Arabic, paving the way for advanced document analysis and understanding. Key areas to explore include dataset expansion, novel evaluation metrics, and innovative deep learning techniques, ultimately promoting cross-lingual OCR innovations. The goal is to reduce reliance on proprietary AI models and improve access to information.
More visual insights#
More on figures

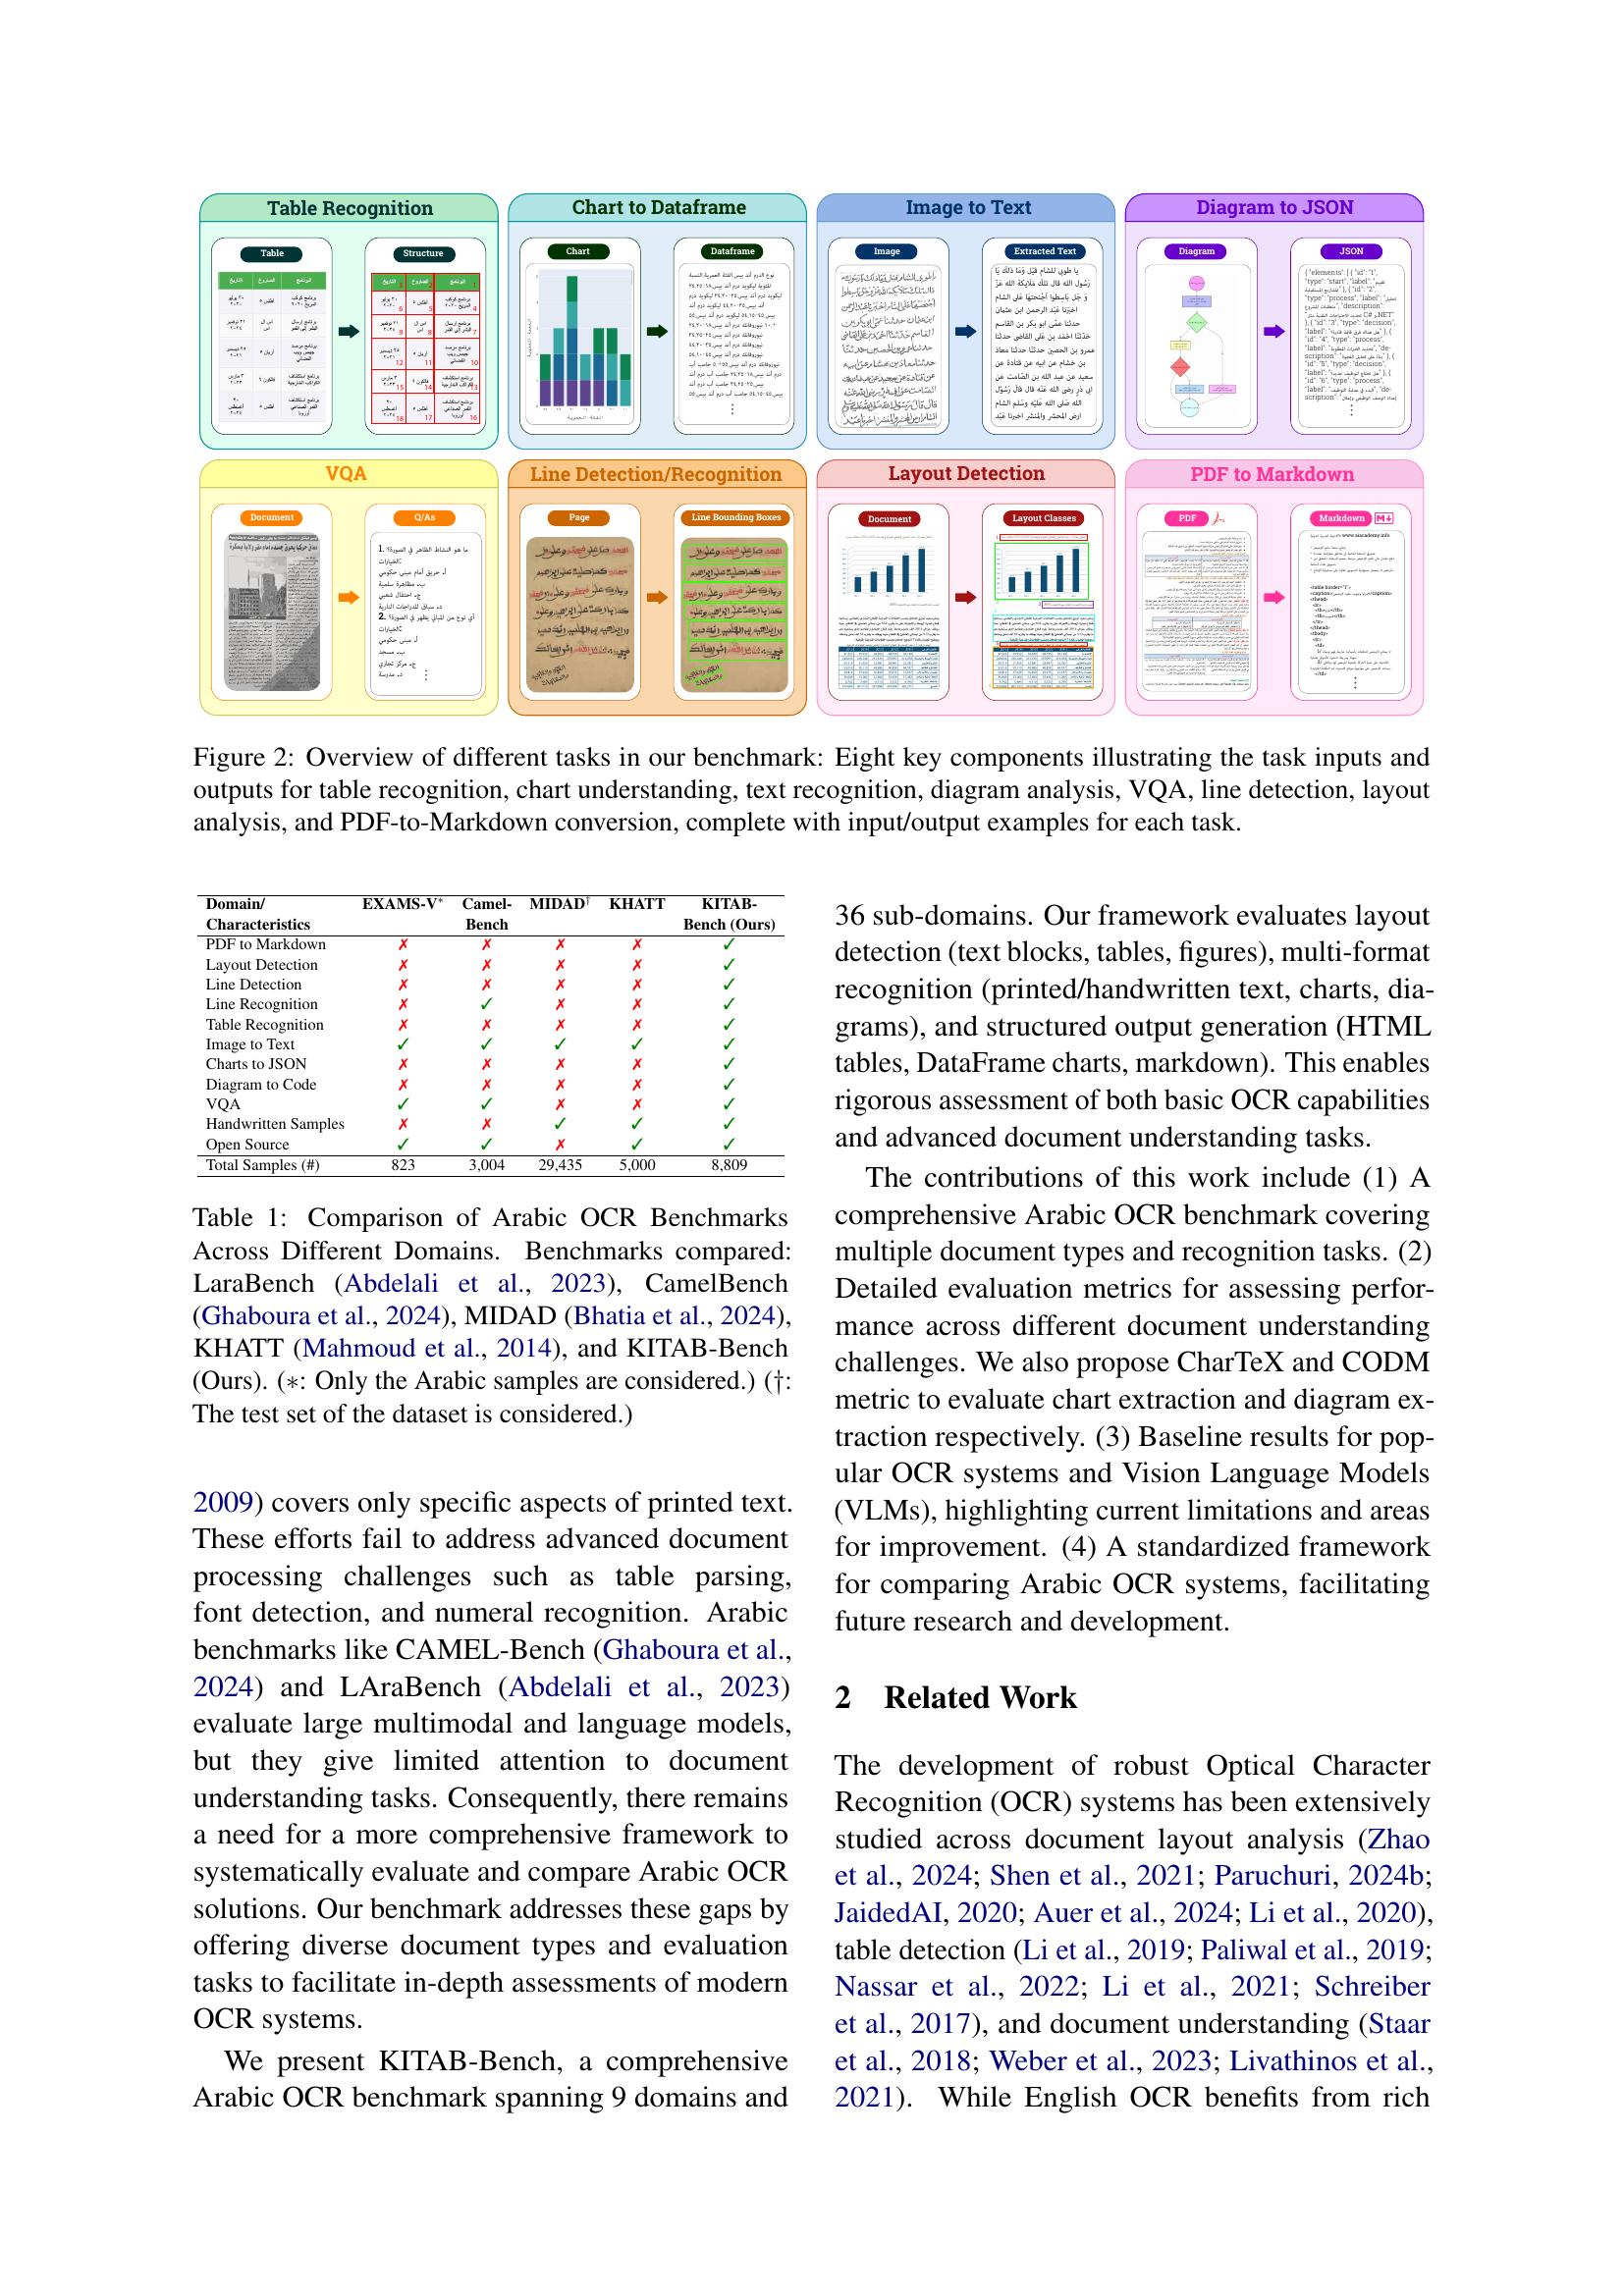
🔼 Figure 2 presents a comprehensive overview of the eight key tasks included in the KITAB-Bench benchmark. Each task is visually represented with an example of its input and corresponding output. The tasks cover various aspects of Arabic document understanding, including table recognition (extracting structured data from tables), chart understanding (converting charts into dataframes), text recognition (converting images of text into machine-readable text), diagram analysis (converting diagrams to JSON), visual question answering (VQA), line detection (identifying and bounding lines in documents), layout analysis (detecting the layout structure of a document), and PDF-to-Markdown conversion (converting a PDF document into a Markdown format). This figure provides a visual summary of the types of data and the transformations involved in each task within the benchmark.
read the caption
Figure 2: Overview of different tasks in our benchmark: Eight key components illustrating the task inputs and outputs for table recognition, chart understanding, text recognition, diagram analysis, VQA, line detection, layout analysis, and PDF-to-Markdown conversion, complete with input/output examples for each task.
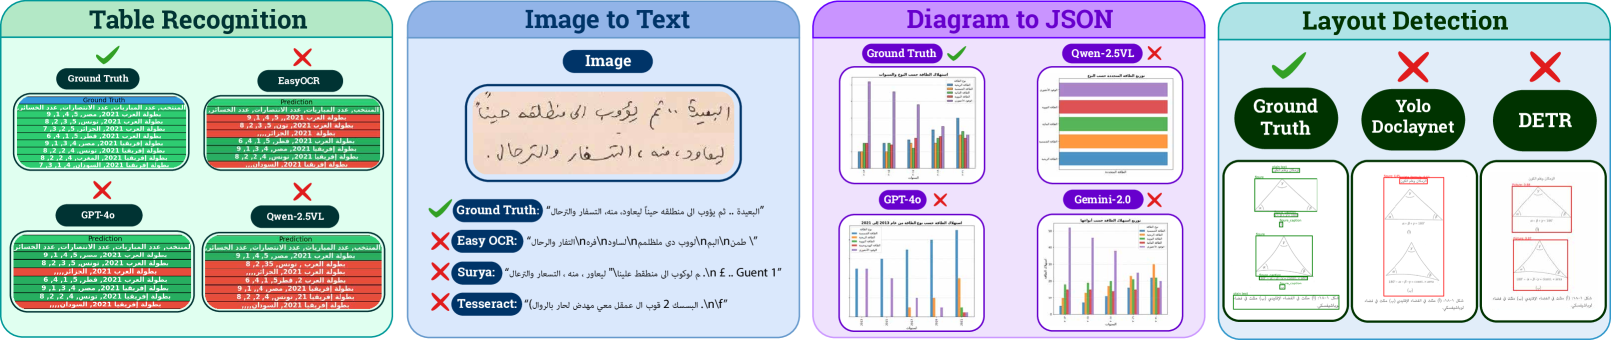
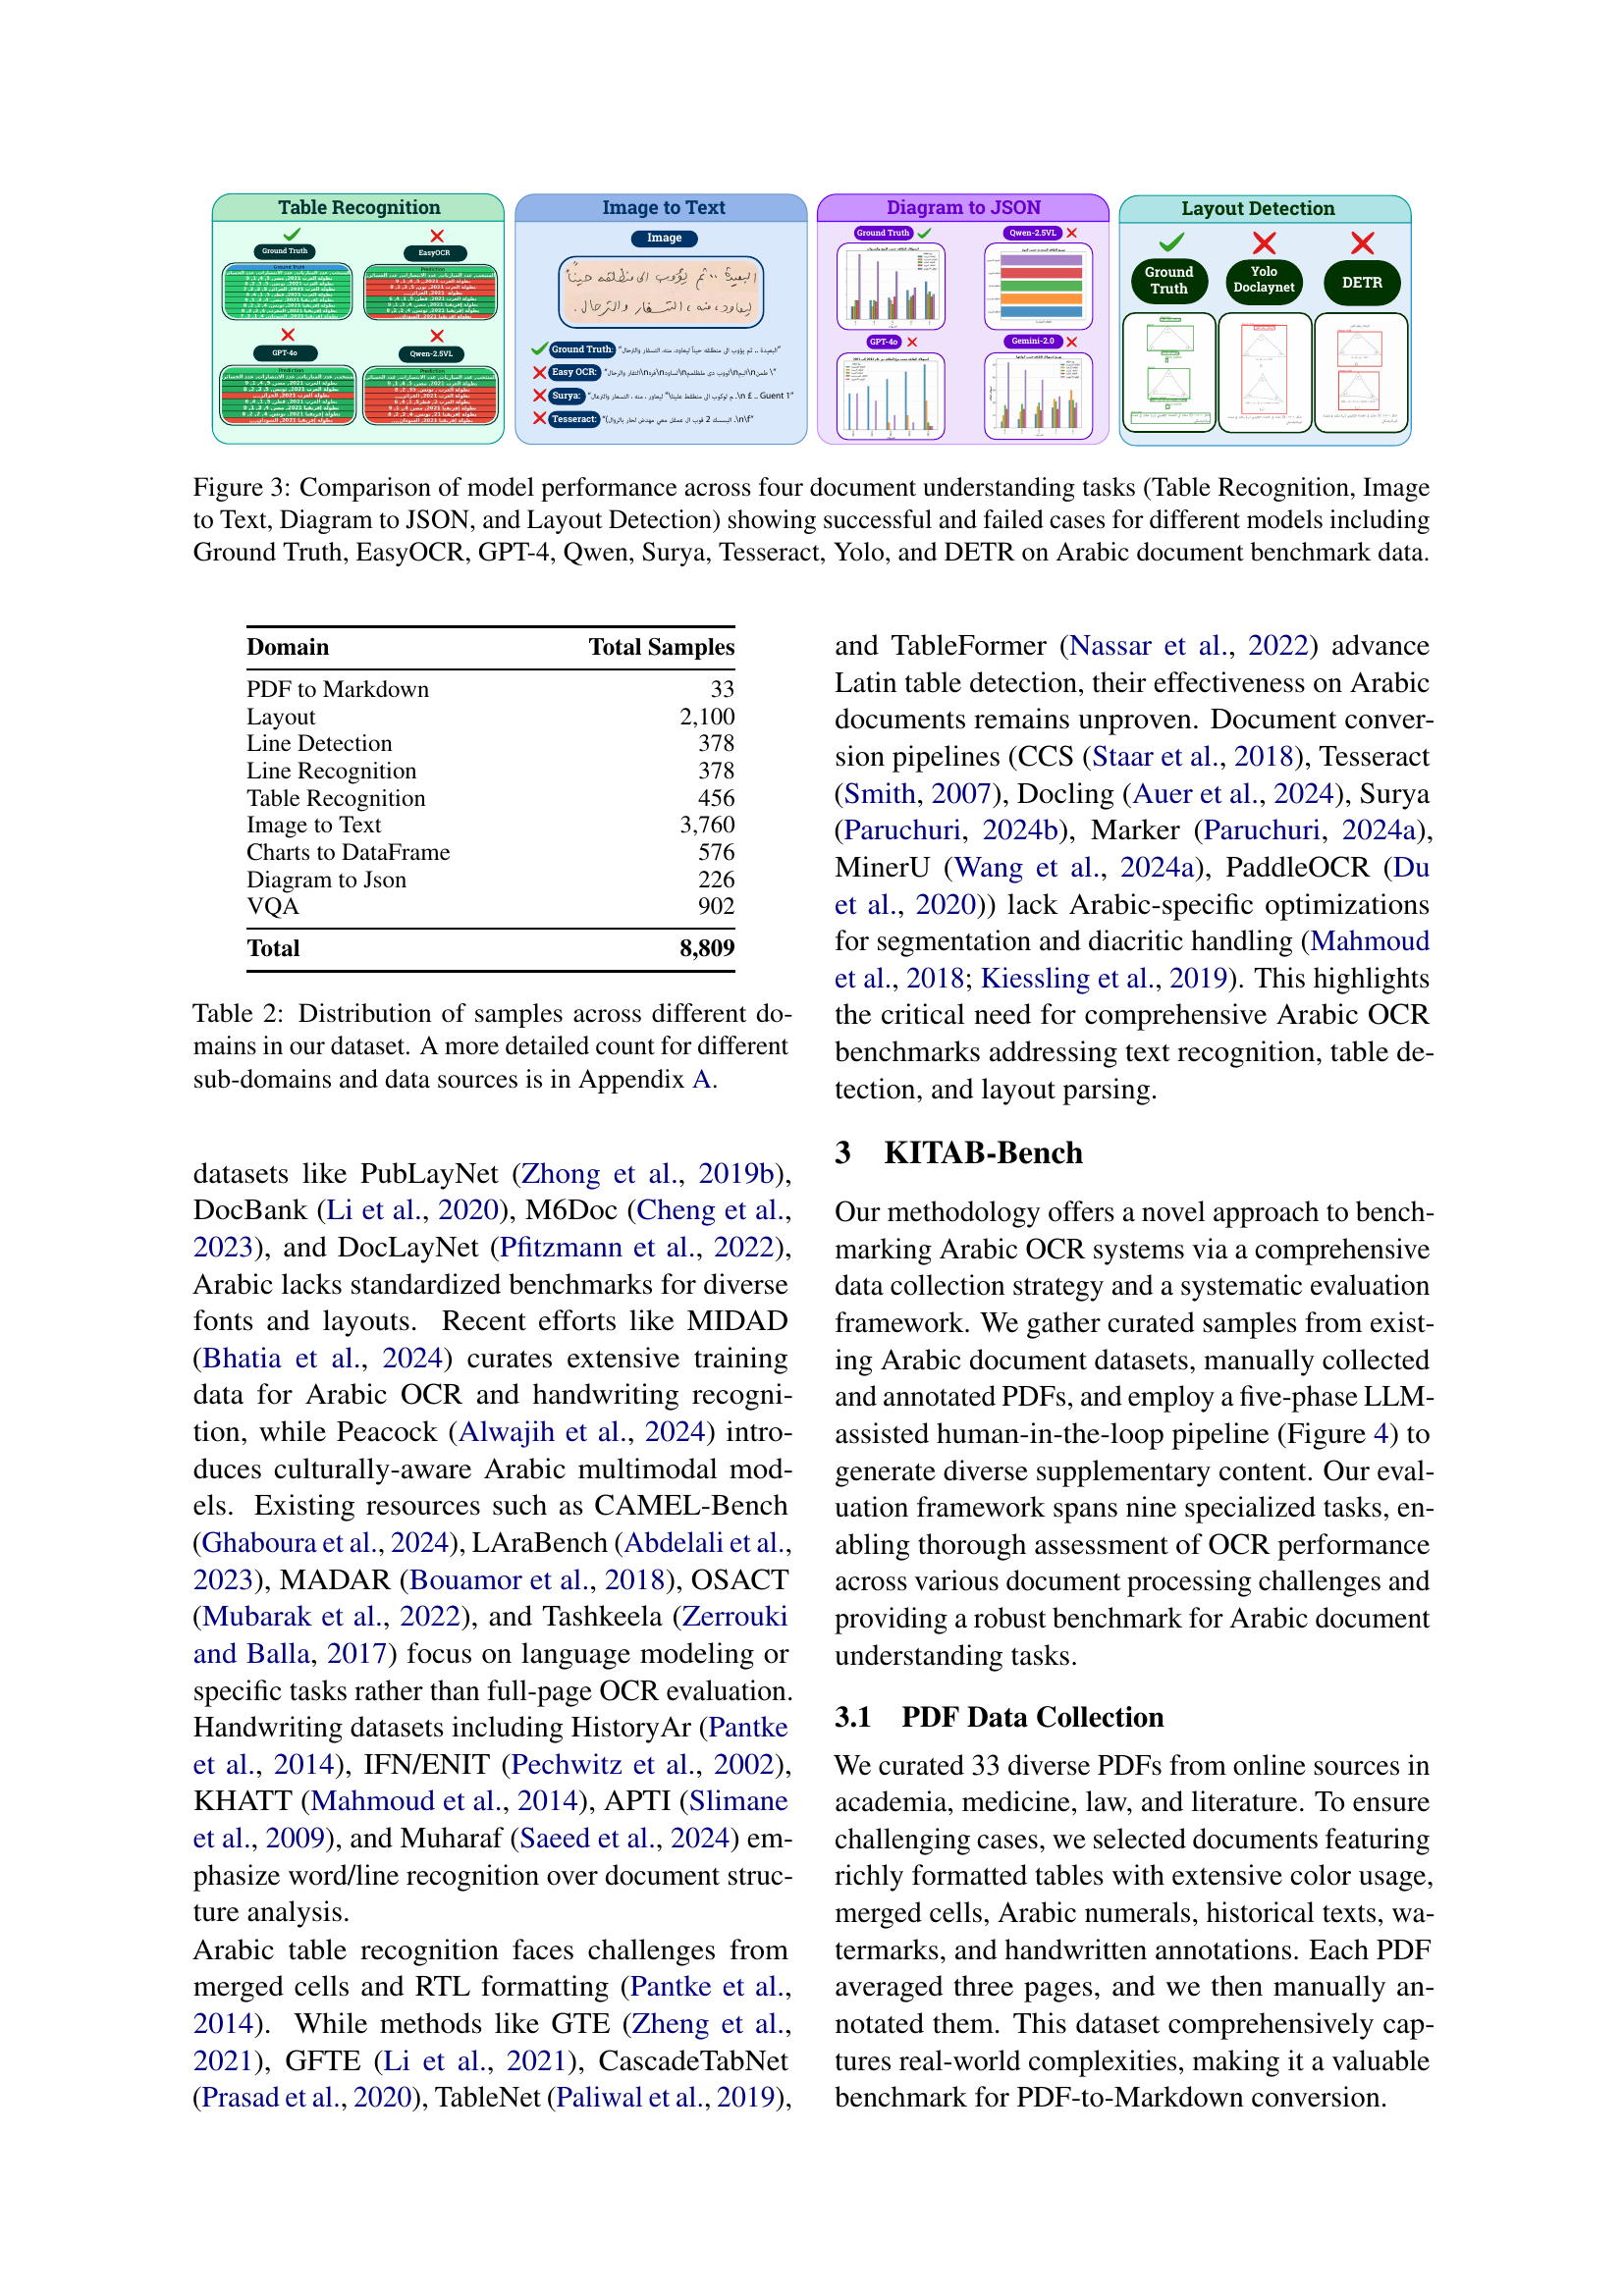
🔼 This figure displays a comparison of various model performances across four key document understanding tasks: Table Recognition, Image to Text, Diagram to JSON, and Layout Detection. It showcases both successful and unsuccessful examples for each task, using Arabic benchmark data. Models compared include Ground Truth, EasyOCR, GPT-4, Qwen, Surya, Tesseract, Yolo, and DETR. This provides a visual representation of the strengths and weaknesses of each model in handling different aspects of Arabic document understanding, highlighting the challenges presented by the language’s unique characteristics.
read the caption
Figure 3: Comparison of model performance across four document understanding tasks (Table Recognition, Image to Text, Diagram to JSON, and Layout Detection) showing successful and failed cases for different models including Ground Truth, EasyOCR, GPT-4, Qwen, Surya, Tesseract, Yolo, and DETR on Arabic document benchmark data.

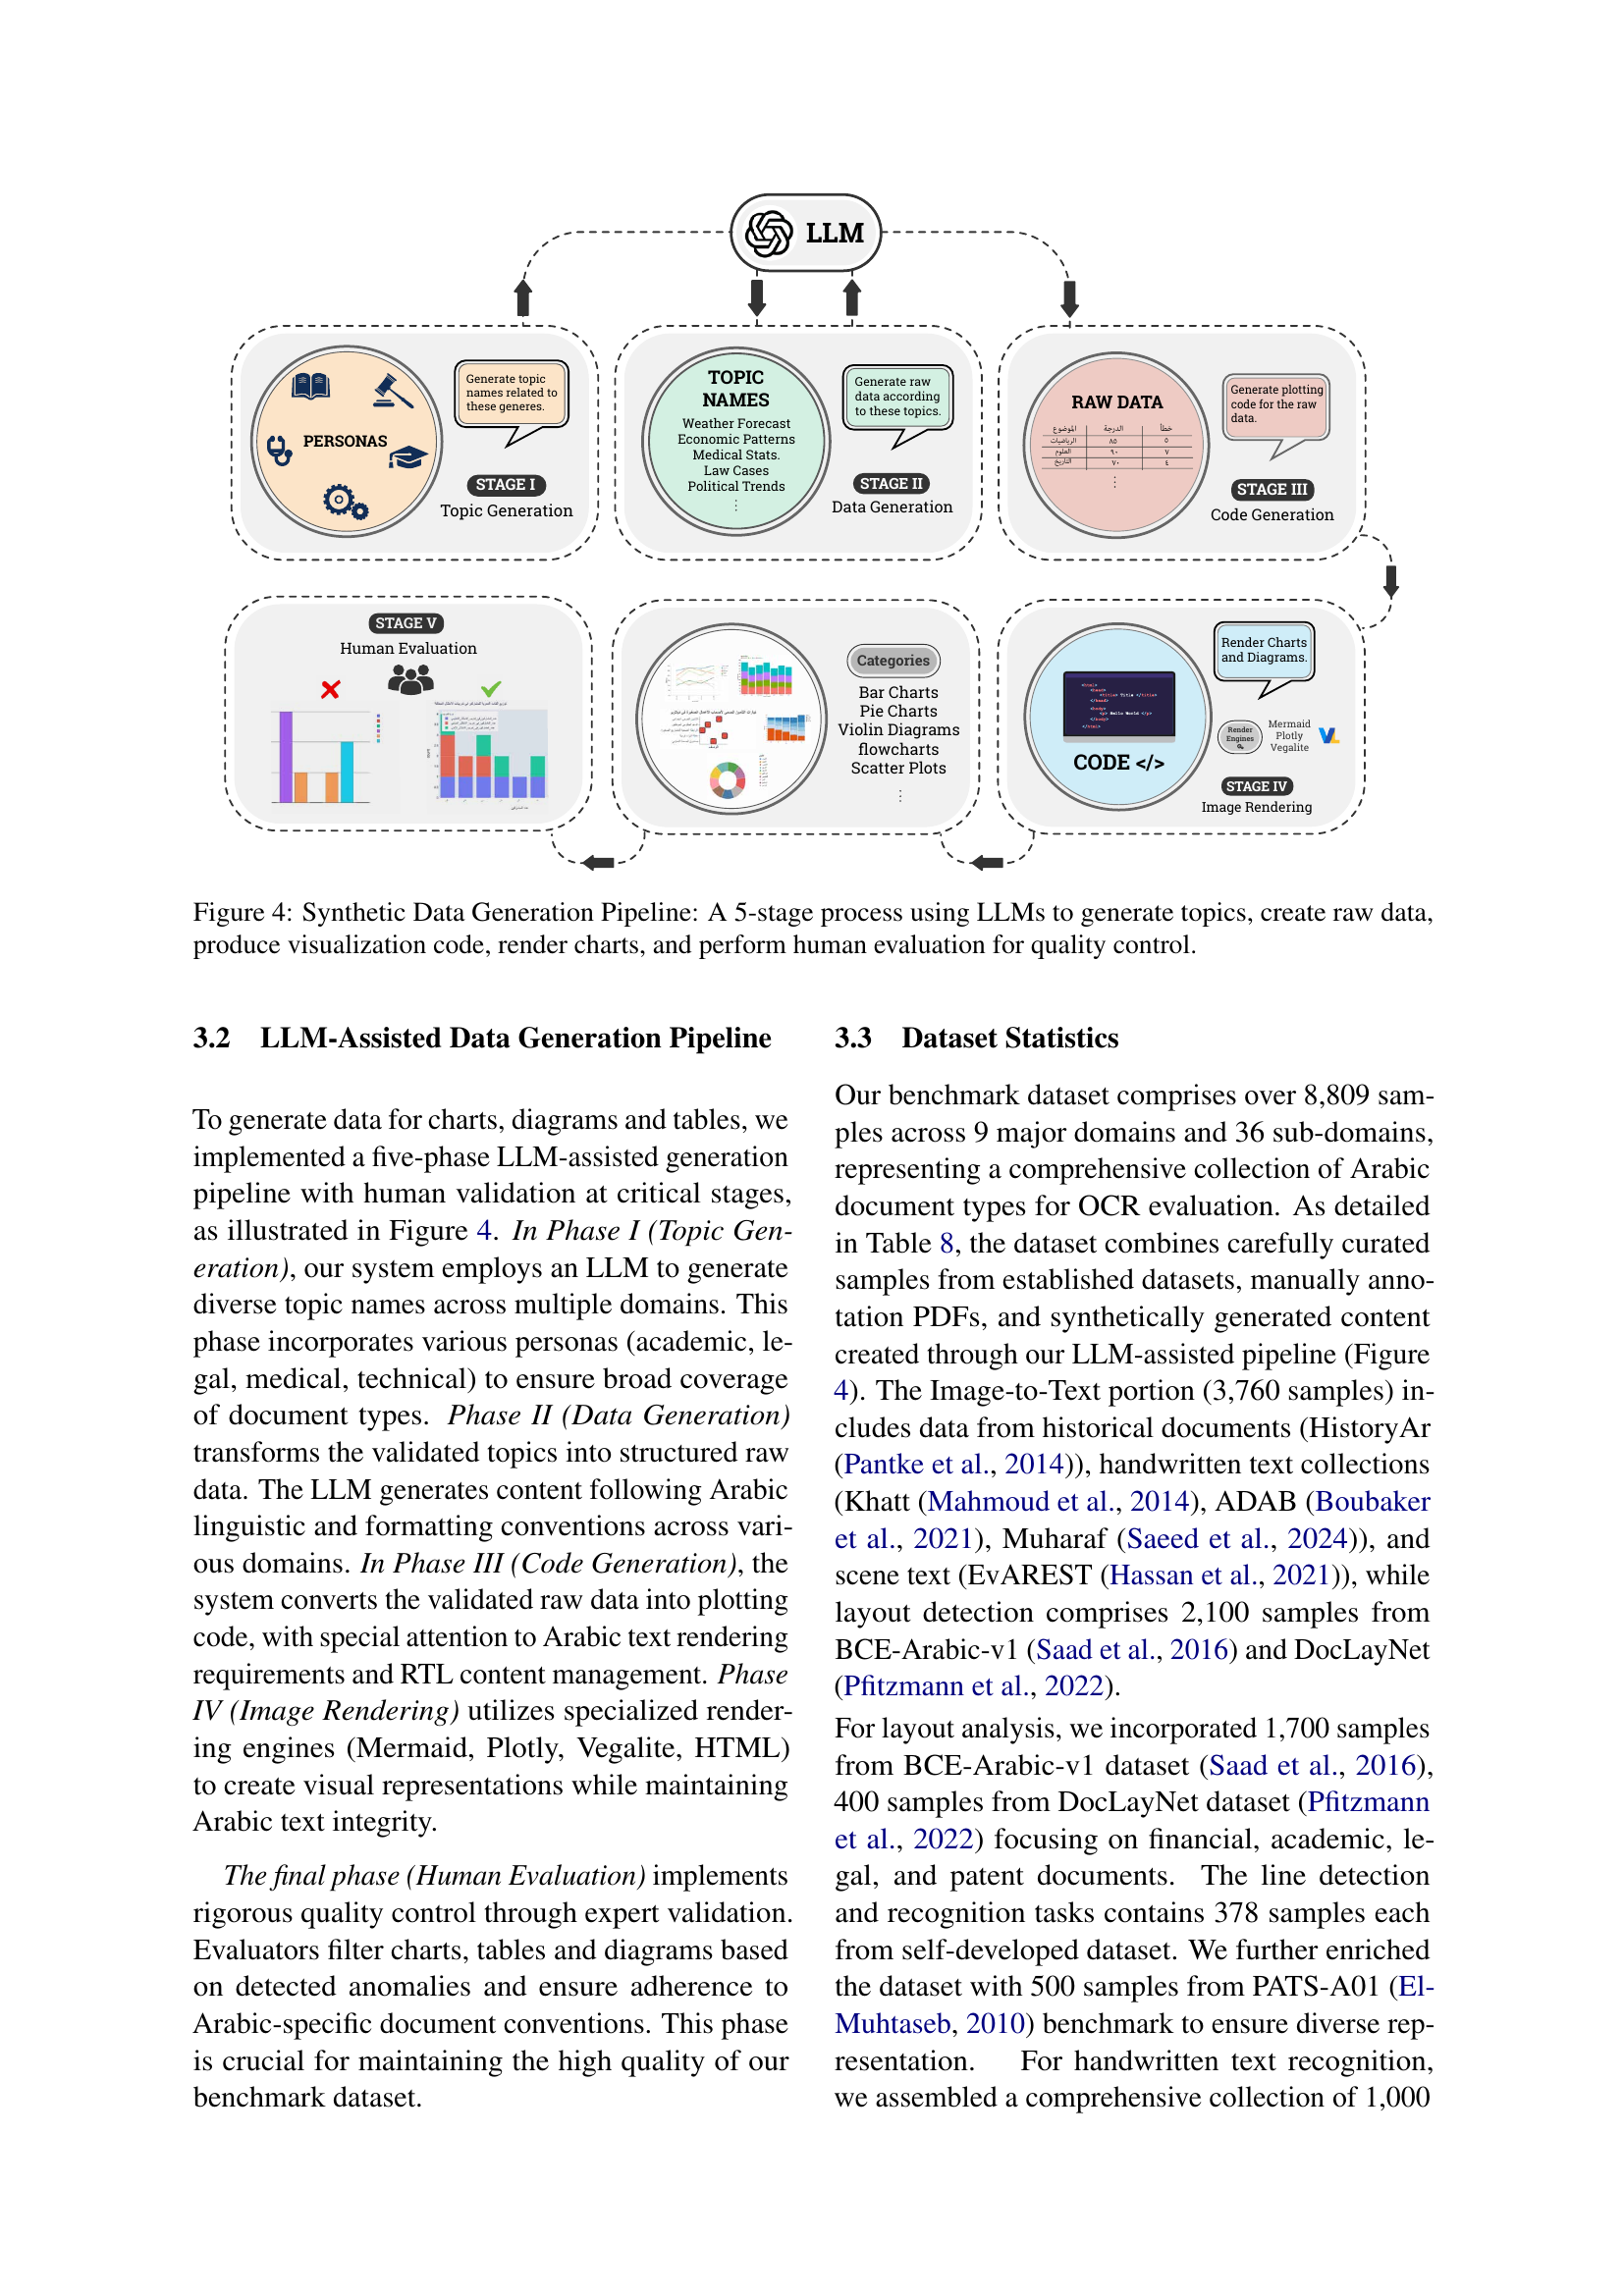
🔼 This figure illustrates the five-stage pipeline used to generate synthetic data for charts and diagrams. The process begins with Large Language Models (LLMs) generating relevant topics. These topics then inform the generation of raw data by the LLMs. Next, the LLMs create code to visualize this data. This code is then used to render the charts and diagrams. Finally, human evaluators assess the quality of the generated content, ensuring accuracy and adherence to Arabic linguistic conventions. This iterative process ensures high-quality synthetic data for the benchmark.
read the caption
Figure 4: Synthetic Data Generation Pipeline: A 5-stage process using LLMs to generate topics, create raw data, produce visualization code, render charts, and perform human evaluation for quality control.

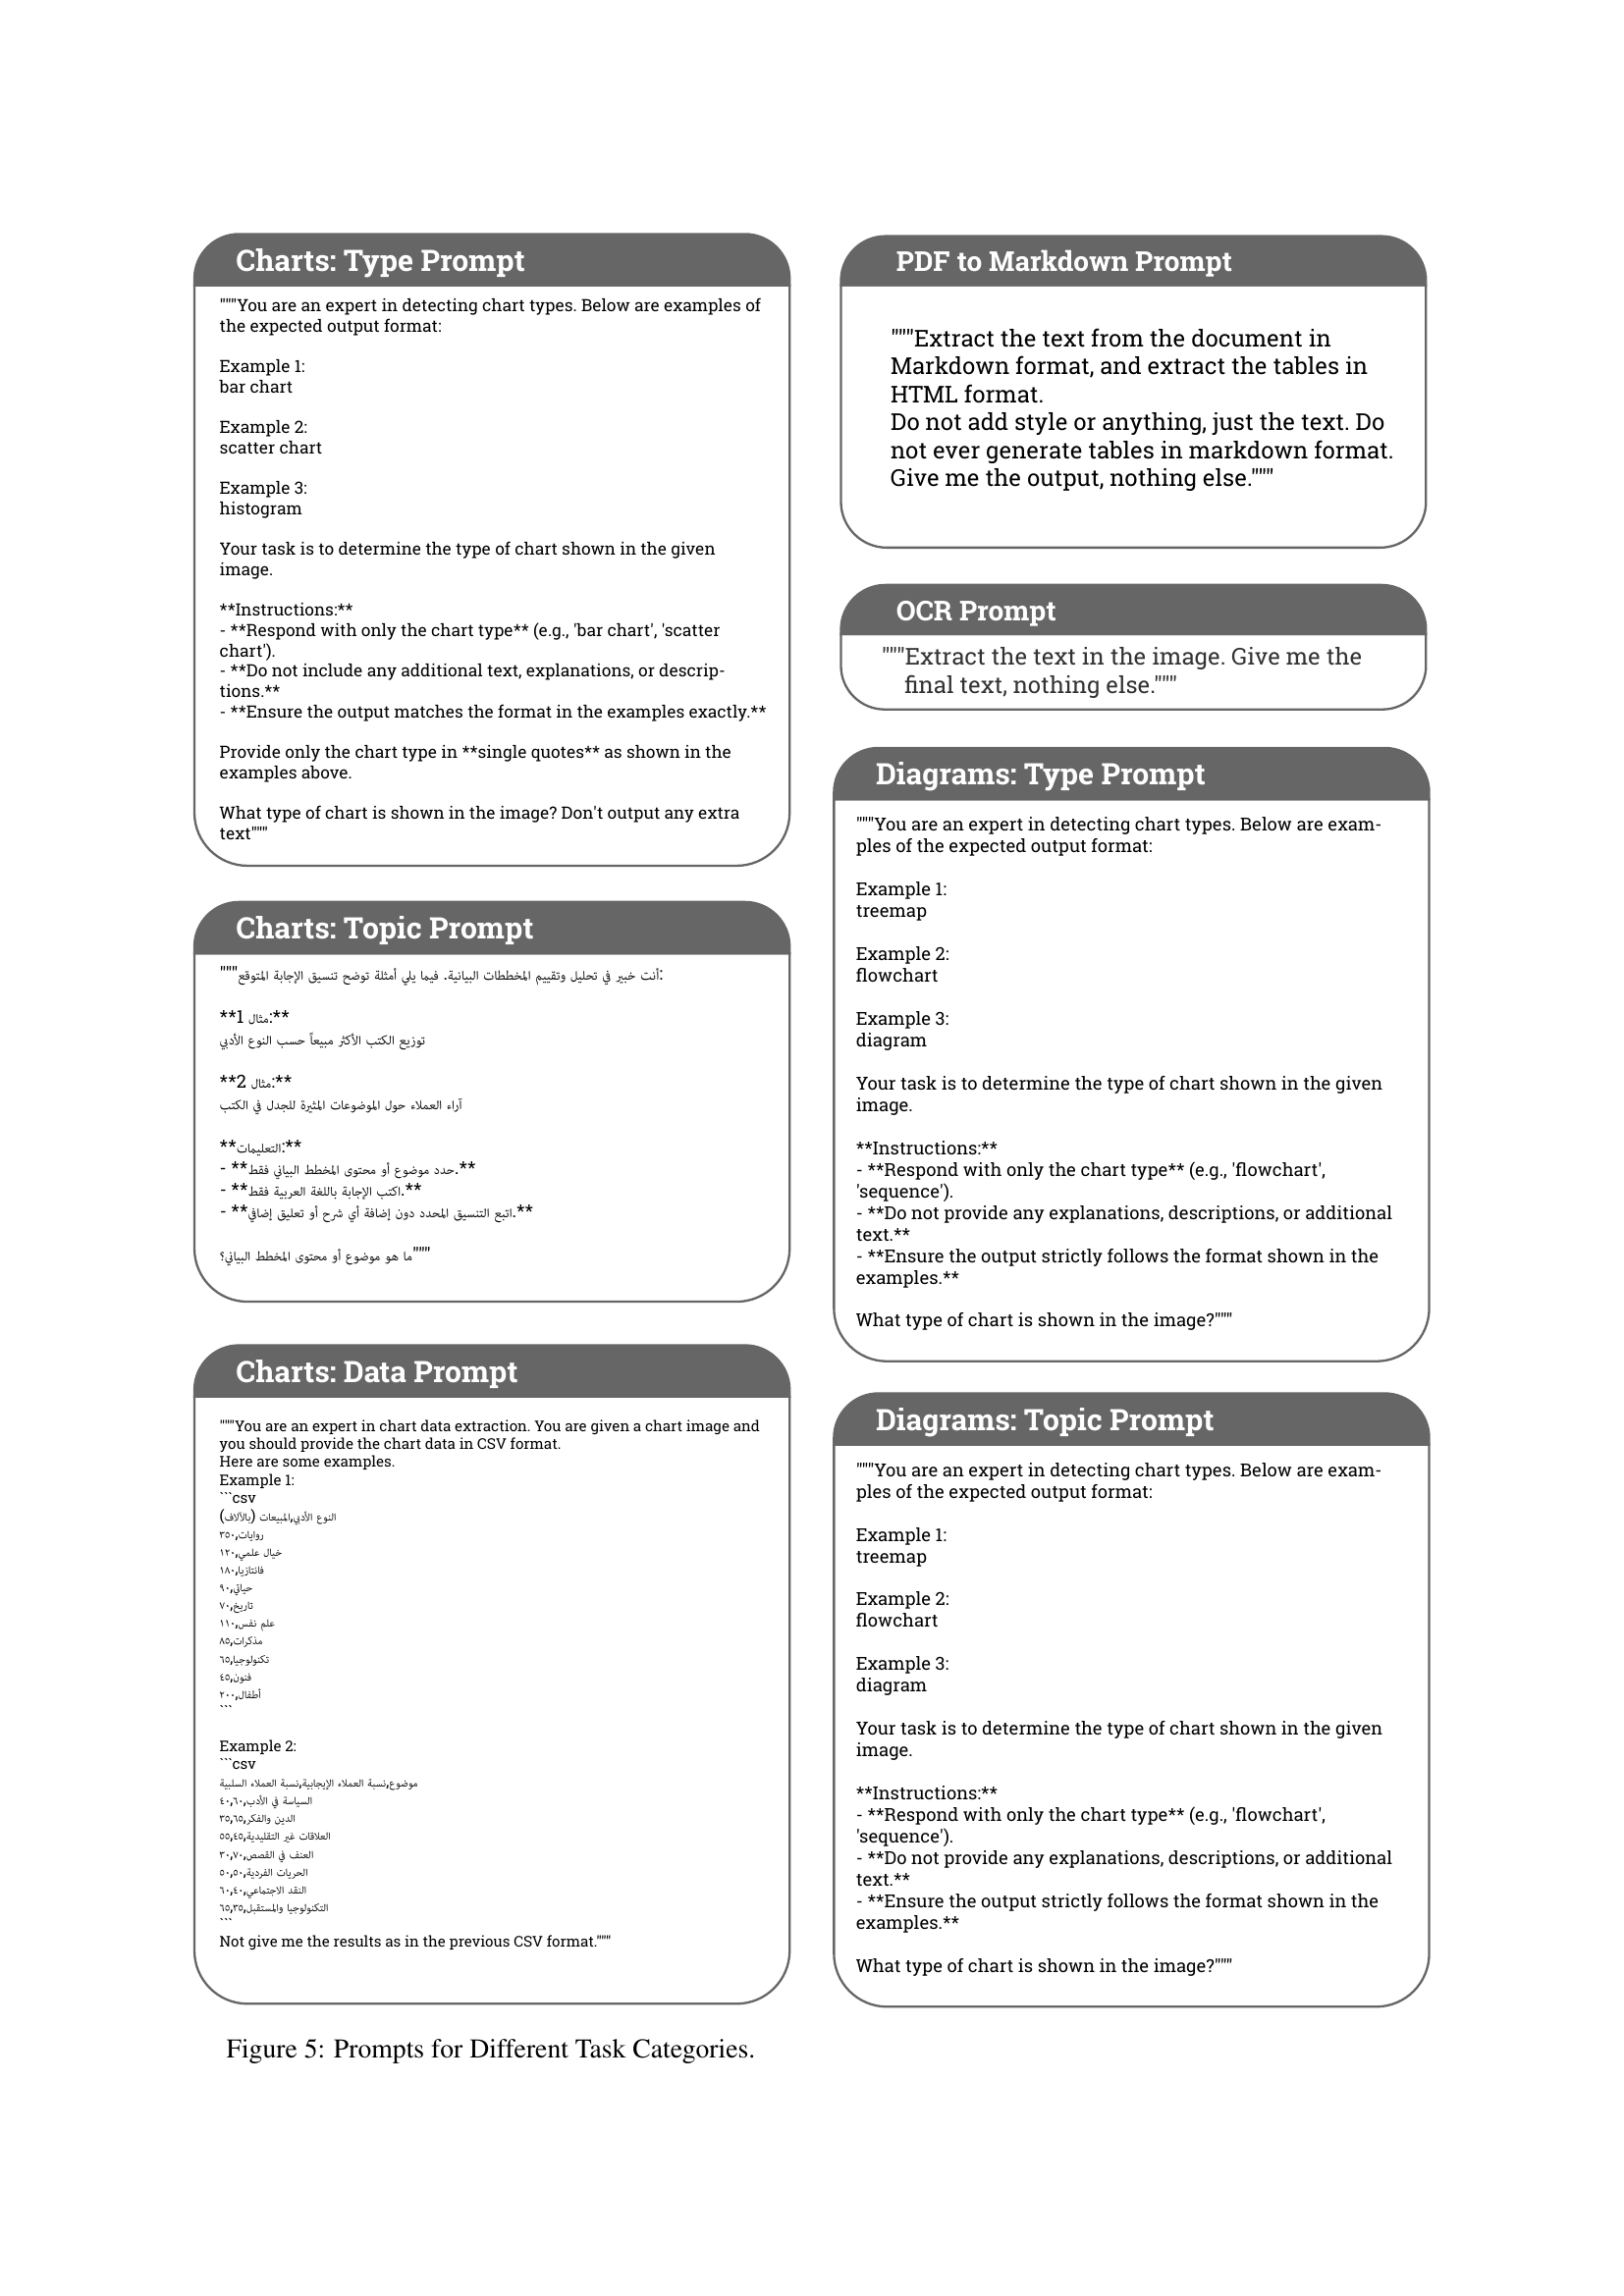
🔼 Figure 5 displays example prompts used in the KITAB-Bench benchmark for different task categories. Each prompt is designed to guide an LLM or other model toward a specific output format, ensuring consistent and comparable results across various tasks. The prompts cover detailed instructions on expected output formats, specify the language (Arabic), and address potential ambiguities to minimize human bias in the evaluation process. The showcased prompts include examples for Chart Type, Chart Topic, Chart Data, PDF to Markdown conversion, OCR, Diagram Type, Diagram Topic, and Diagram Data, as well as Table and Table Data. The prompts are meticulously structured to evaluate different aspects of Arabic document understanding such as visual recognition (charts, diagrams, tables) and text extraction/conversion, highlighting the complexity and nuance required for accurate evaluation.
read the caption
Figure 5: Prompts for Different Task Categories.

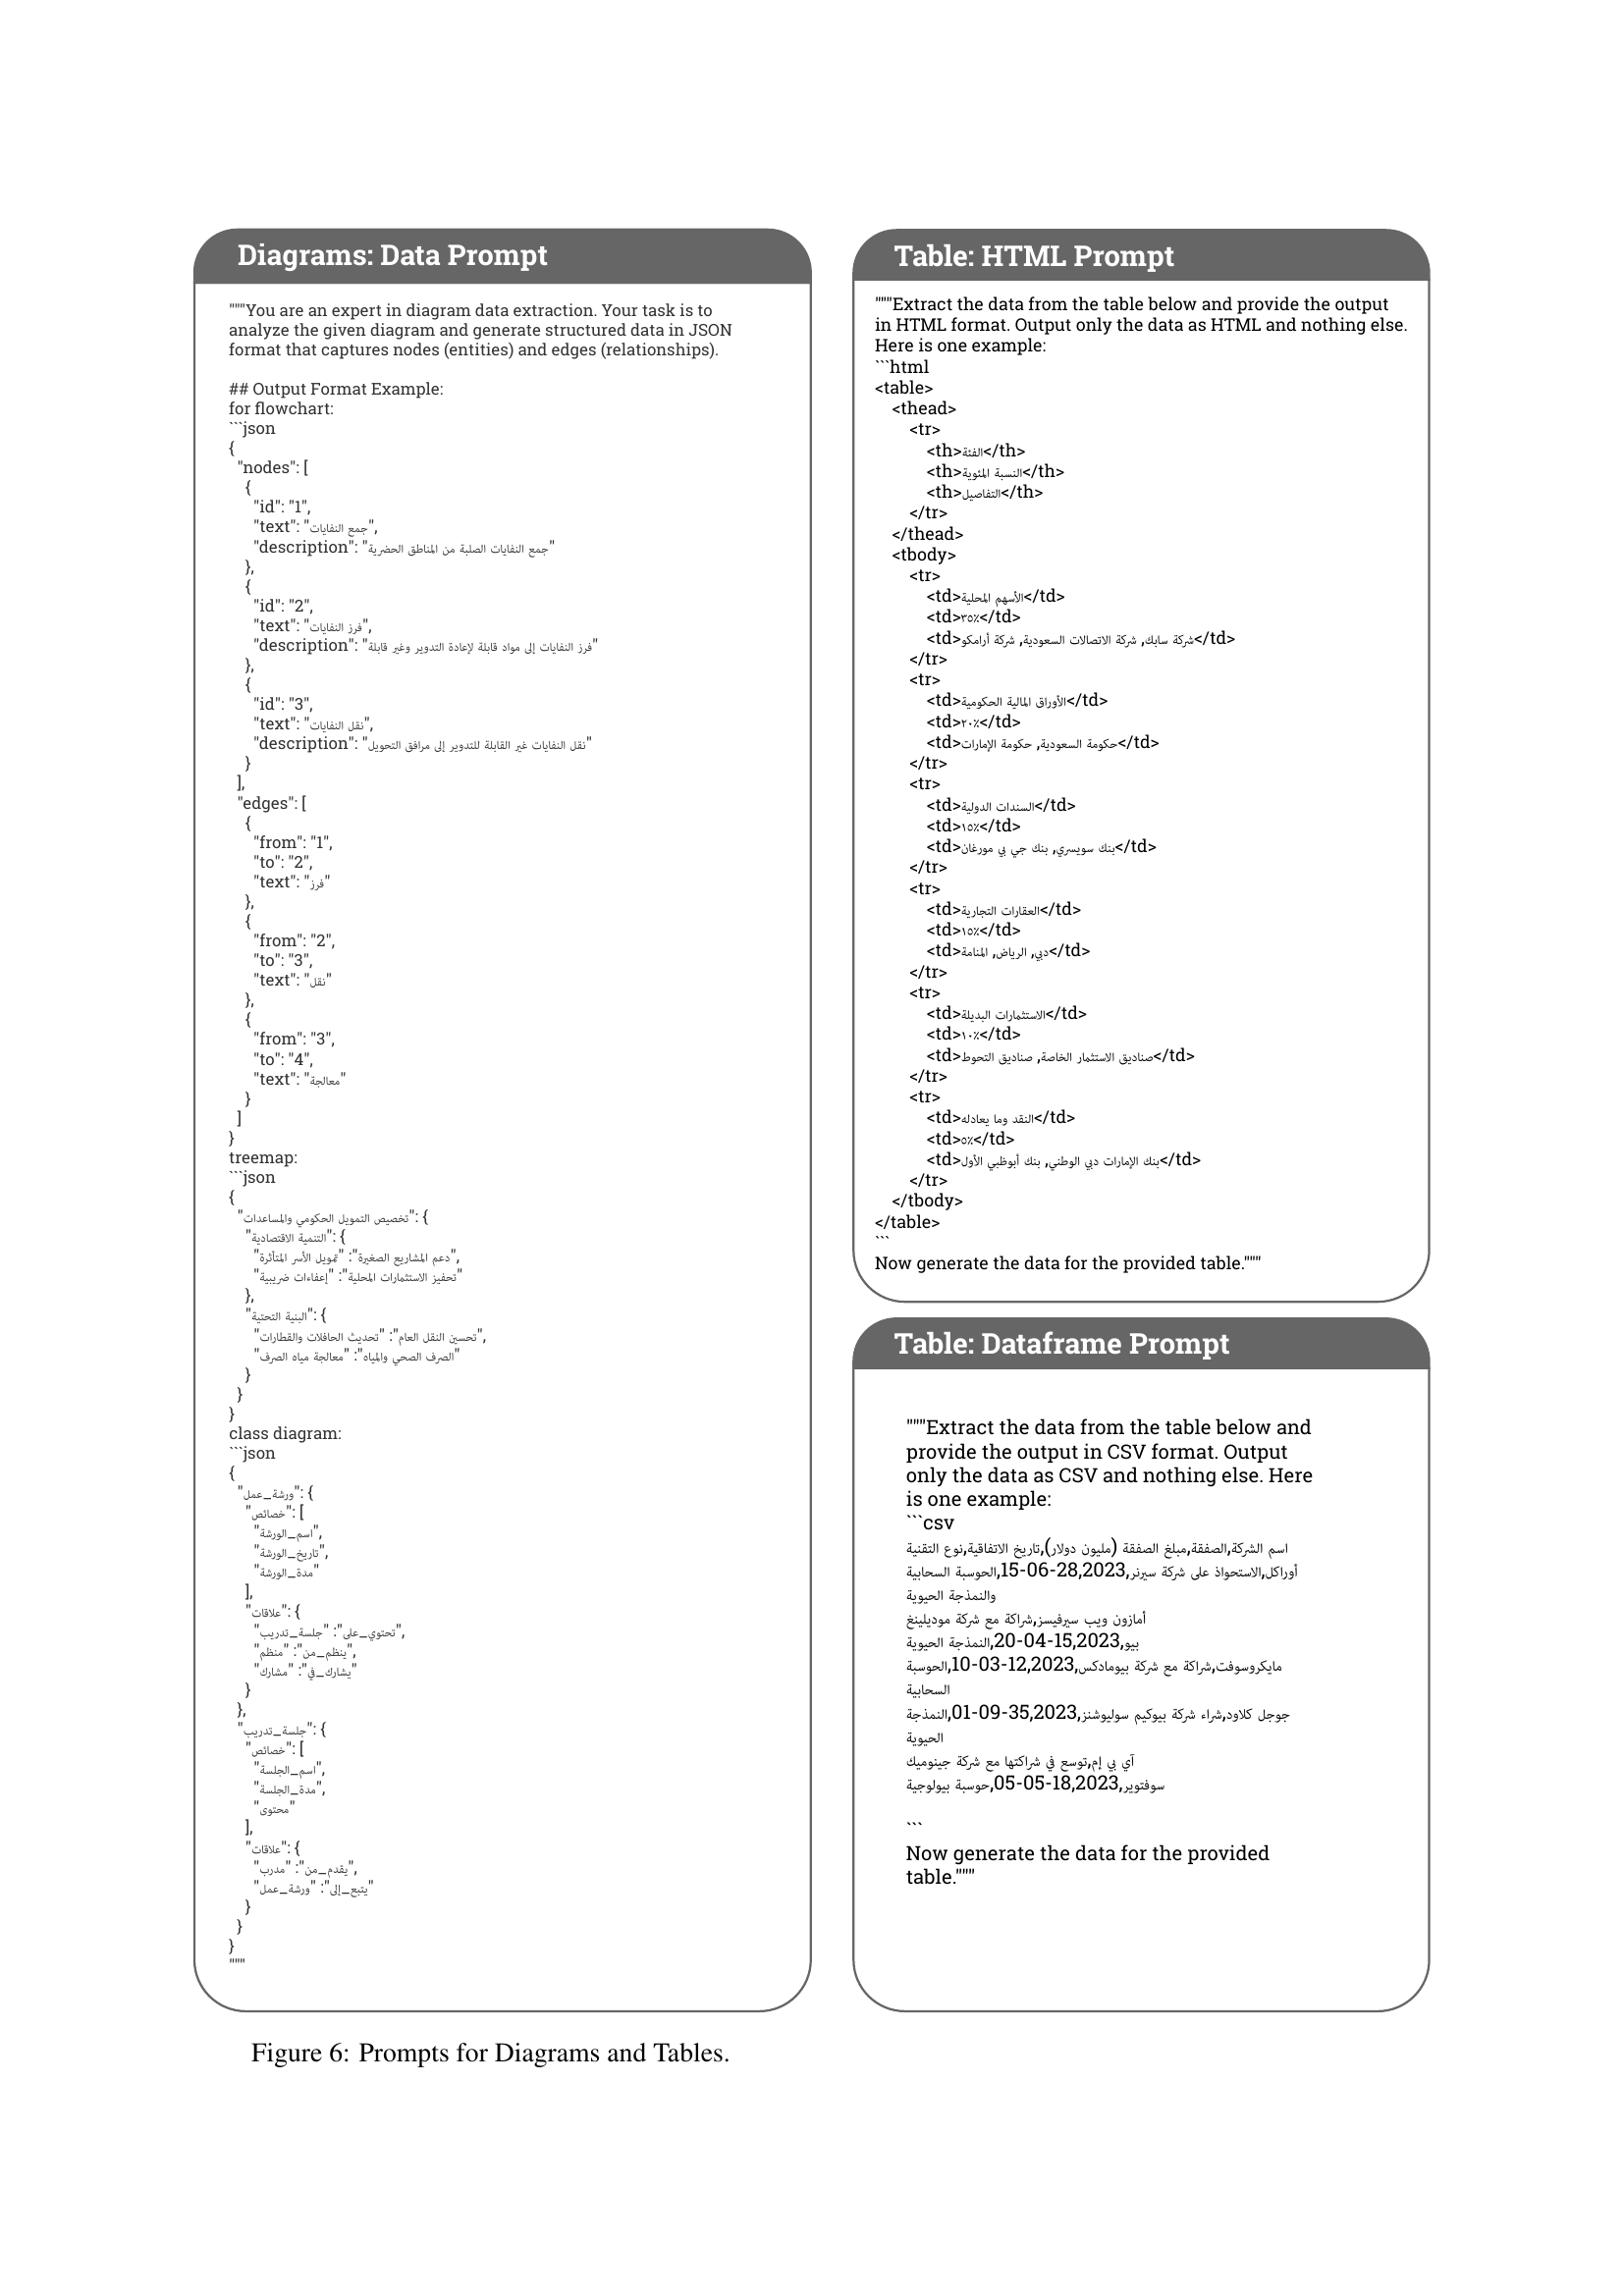
🔼 Figure 6 shows example prompts used in the KITAB-Bench benchmark dataset for evaluating diagram and table understanding tasks. The prompts are designed to guide large language models (LLMs) in generating structured data outputs (JSON for diagrams, CSV and HTML for tables). Each prompt specifies the desired output format and includes instructions for ensuring consistency and accuracy. The goal is to test the ability of LLMs to correctly interpret diagram and table information and generate machine-readable representations.
read the caption
Figure 6: Prompts for Diagrams and Tables.
More on tables
| Domain | Total Samples |
| PDF to Markdown | 33 |
| Layout | 2,100 |
| Line Detection | 378 |
| Line Recognition | 378 |
| Table Recognition | 456 |
| Image to Text | 3,760 |
| Charts to DataFrame | 576 |
| Diagram to Json | 226 |
| VQA | 902 |
| Total | 8,809 |
🔼 This table presents the distribution of samples across various domains within the KITAB-Bench dataset. It shows the total number of samples for each of the nine main domains (PDF to Markdown, Layout Detection, Line Detection, Line Recognition, Table Recognition, Image to Text, Charts to DataFrame, Diagram to JSON, VQA). A more detailed breakdown of the sample counts for the 36 sub-domains and their respective data sources is available in Appendix A of the paper. This table provides a high-level overview of the dataset’s composition and its coverage across different document understanding tasks.
read the caption
Table 2: Distribution of samples across different domains in our dataset. A more detailed count for different sub-domains and data sources is in Appendix A.
| Task | Metric | Surya | Tesseract | EasyOCR |
| Detection | mAP@50 | 79.67 | 46.39 | 68.02 |
| mAP@0.5:0.95 | 27.40 | 14.30 | 32.74 | |
| Recognition | WER | 1.01 | 1.00 | 0.53 |
| CER | 0.87 | 0.66 | 0.20 |
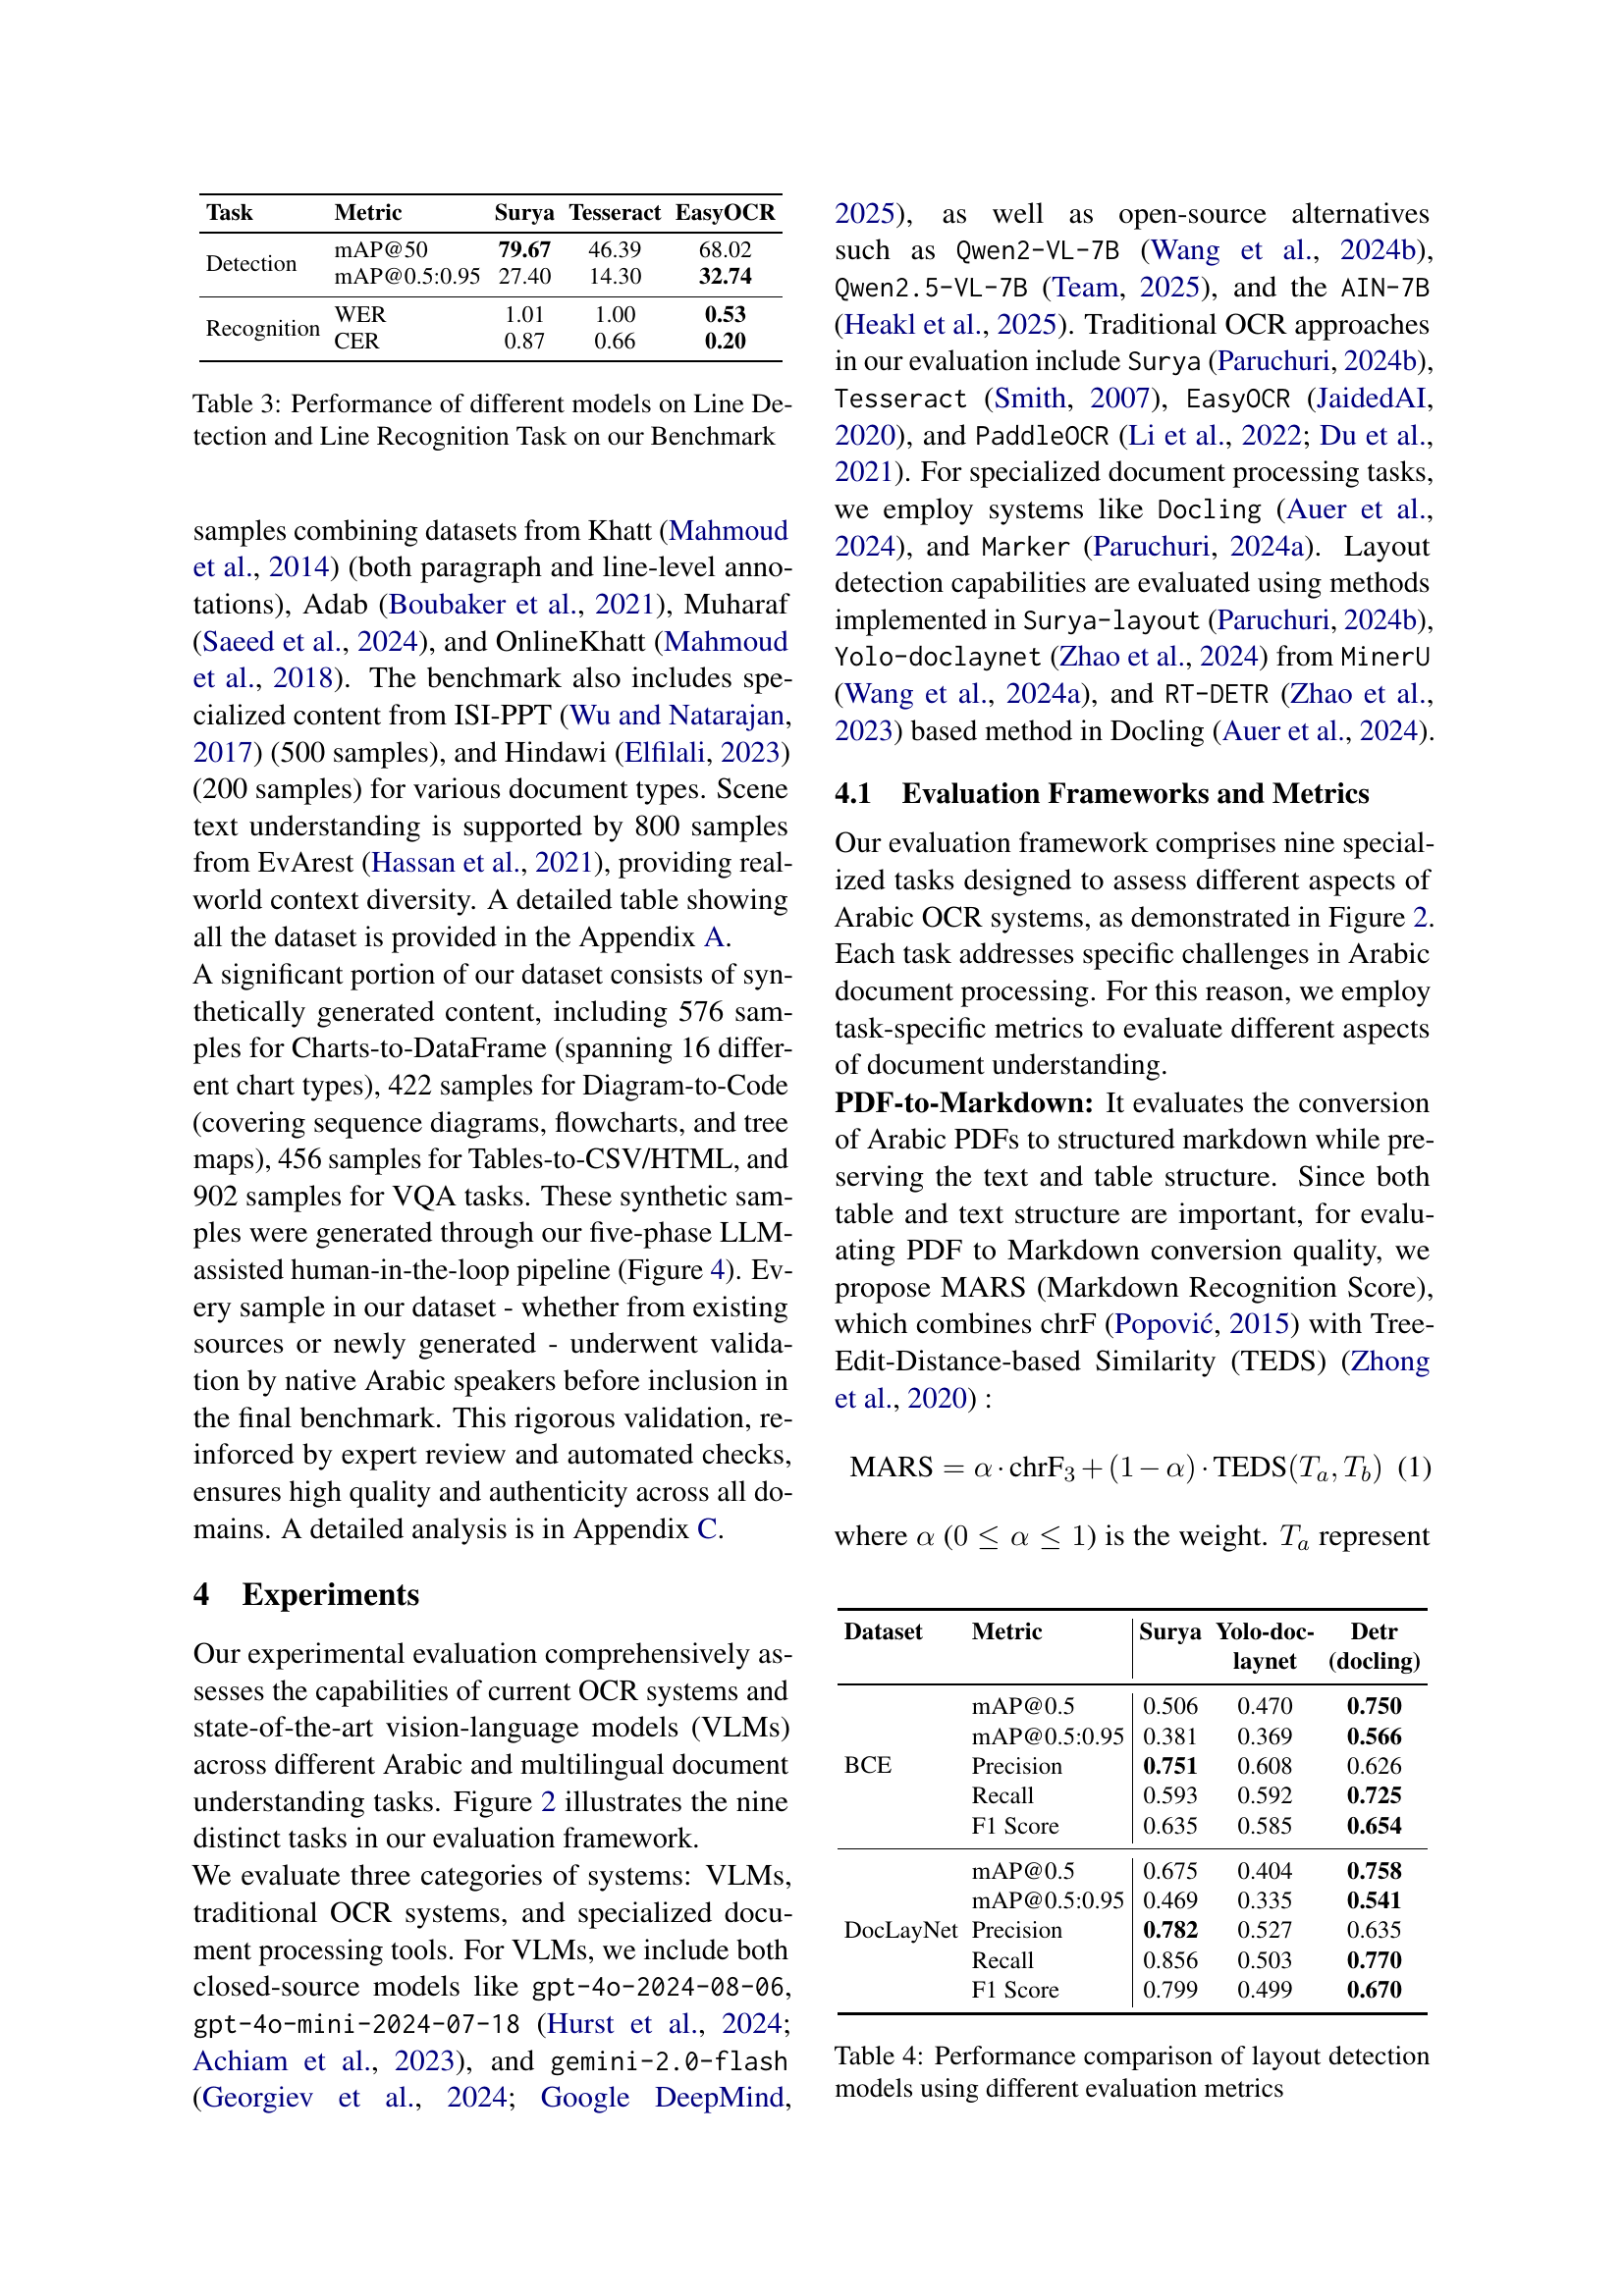
🔼 This table presents the performance comparison of various models on line detection and recognition tasks within the KITAB-Bench benchmark. It shows the results using metrics like mean Average Precision (mAP) at different Intersection over Union (IoU) thresholds for line detection, and Word Error Rate (WER) and Character Error Rate (CER) for line recognition. The models evaluated include both traditional OCR systems (like Surya, Tesseract, and EasyOCR) and more modern, advanced models. The results highlight the relative strengths and weaknesses of different model architectures on this specific task within the Arabic script context.
read the caption
Table 3: Performance of different models on Line Detection and Line Recognition Task on our Benchmark
| Dataset | Metric | Surya | Yolo-doc- | Detr |
| laynet | (docling) | |||
| BCE | mAP@0.5 | 0.506 | 0.470 | 0.750 |
| mAP@0.5:0.95 | 0.381 | 0.369 | 0.566 | |
| Precision | 0.751 | 0.608 | 0.626 | |
| Recall | 0.593 | 0.592 | 0.725 | |
| F1 Score | 0.635 | 0.585 | 0.654 | |
| DocLayNet | mAP@0.5 | 0.675 | 0.404 | 0.758 |
| mAP@0.5:0.95 | 0.469 | 0.335 | 0.541 | |
| Precision | 0.782 | 0.527 | 0.635 | |
| Recall | 0.856 | 0.503 | 0.770 | |
| F1 Score | 0.799 | 0.499 | 0.670 |
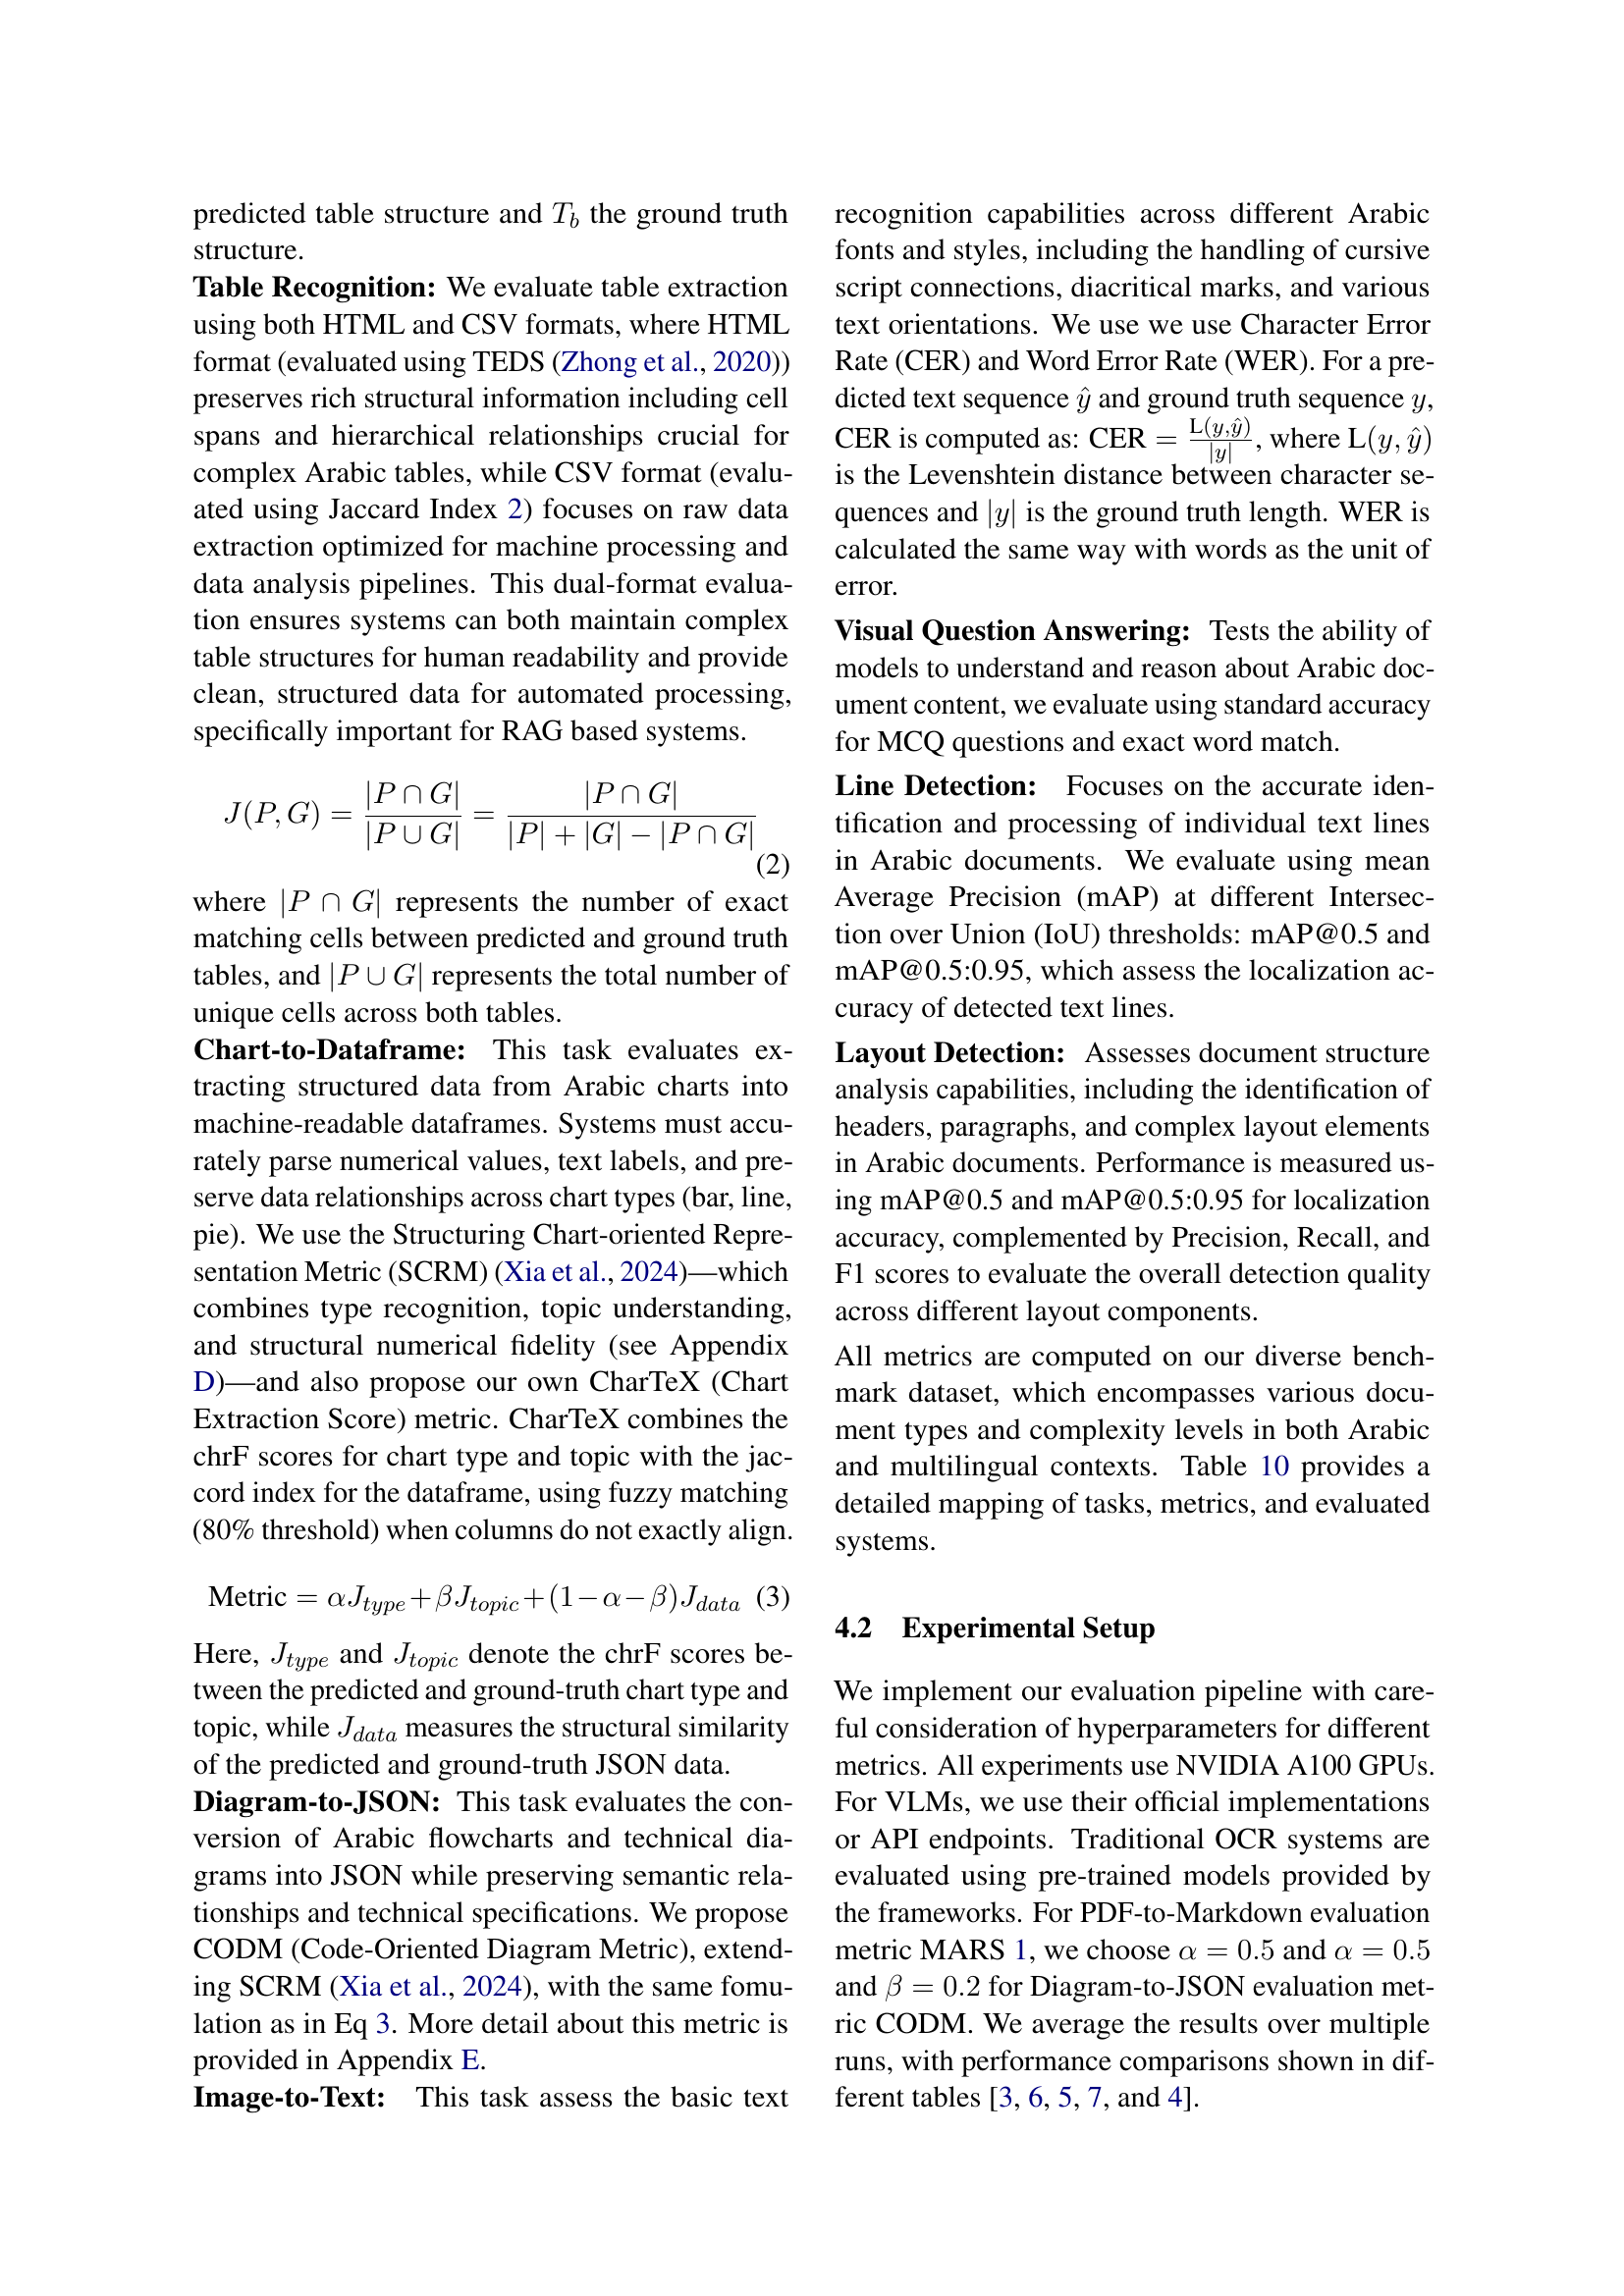
🔼 This table presents a comparison of the performance of different layout detection models. The models are evaluated using several metrics, including mAP@0.5, mAP@0.5:0.95, precision, recall, and F1 score. These metrics are calculated on two different datasets: BCE and DocLayNet. The results allow for a quantitative comparison of the effectiveness of various layout detection approaches.
read the caption
Table 4: Performance comparison of layout detection models using different evaluation metrics
| Table Extraction | End-to-End PDF | |||||
| Model Group | Models | TEDS (HTML) | Jaccard (CSV) | CHrF (Text) | TEDS (Table) | MARS |
| Closed | GPT-4o | 85.76 | 66.36 | 69.62 | 60.61 | 65.12 |
| GPT-4o-mini | 69.32 | 49.50 | 56.59 | 52.69 | 54.64 | |
| Gemini-2.0-Flash | 83.08 | 65.55 | 75.75 | 55.55 | 65.65 | |
| Open | Qwen2-VL-7B | 57.83 | 40.20 | 40.30 | 2.54 | 21.42 |
| Qwen2.5-VL-7B | 59.31 | 59.58 | 69.21 | 11.65 | 40.43 | |
| AIN-7B | 75.94 | 64.83 | 56.52 | 49.32 | 52.92 | |
| Framework | Tesseract | 28.23D 38.64I | 14.85D 16.04I | 59.91D | 45.44D | 52.68D |
| EasyOCR | 49.10D 39.09I | 23.83D 17.88I | 57.46D | 51.12D | 54.29D | |
| Surya | 50.15M | 70.42M | 58.38M | 44.29M | 51.34M | |
| DDocling Auer et al. (2024) pipeline IImg2Table Cattan (2021) pipeline MMarker Paruchuri (2024a) pipeline | ||||||
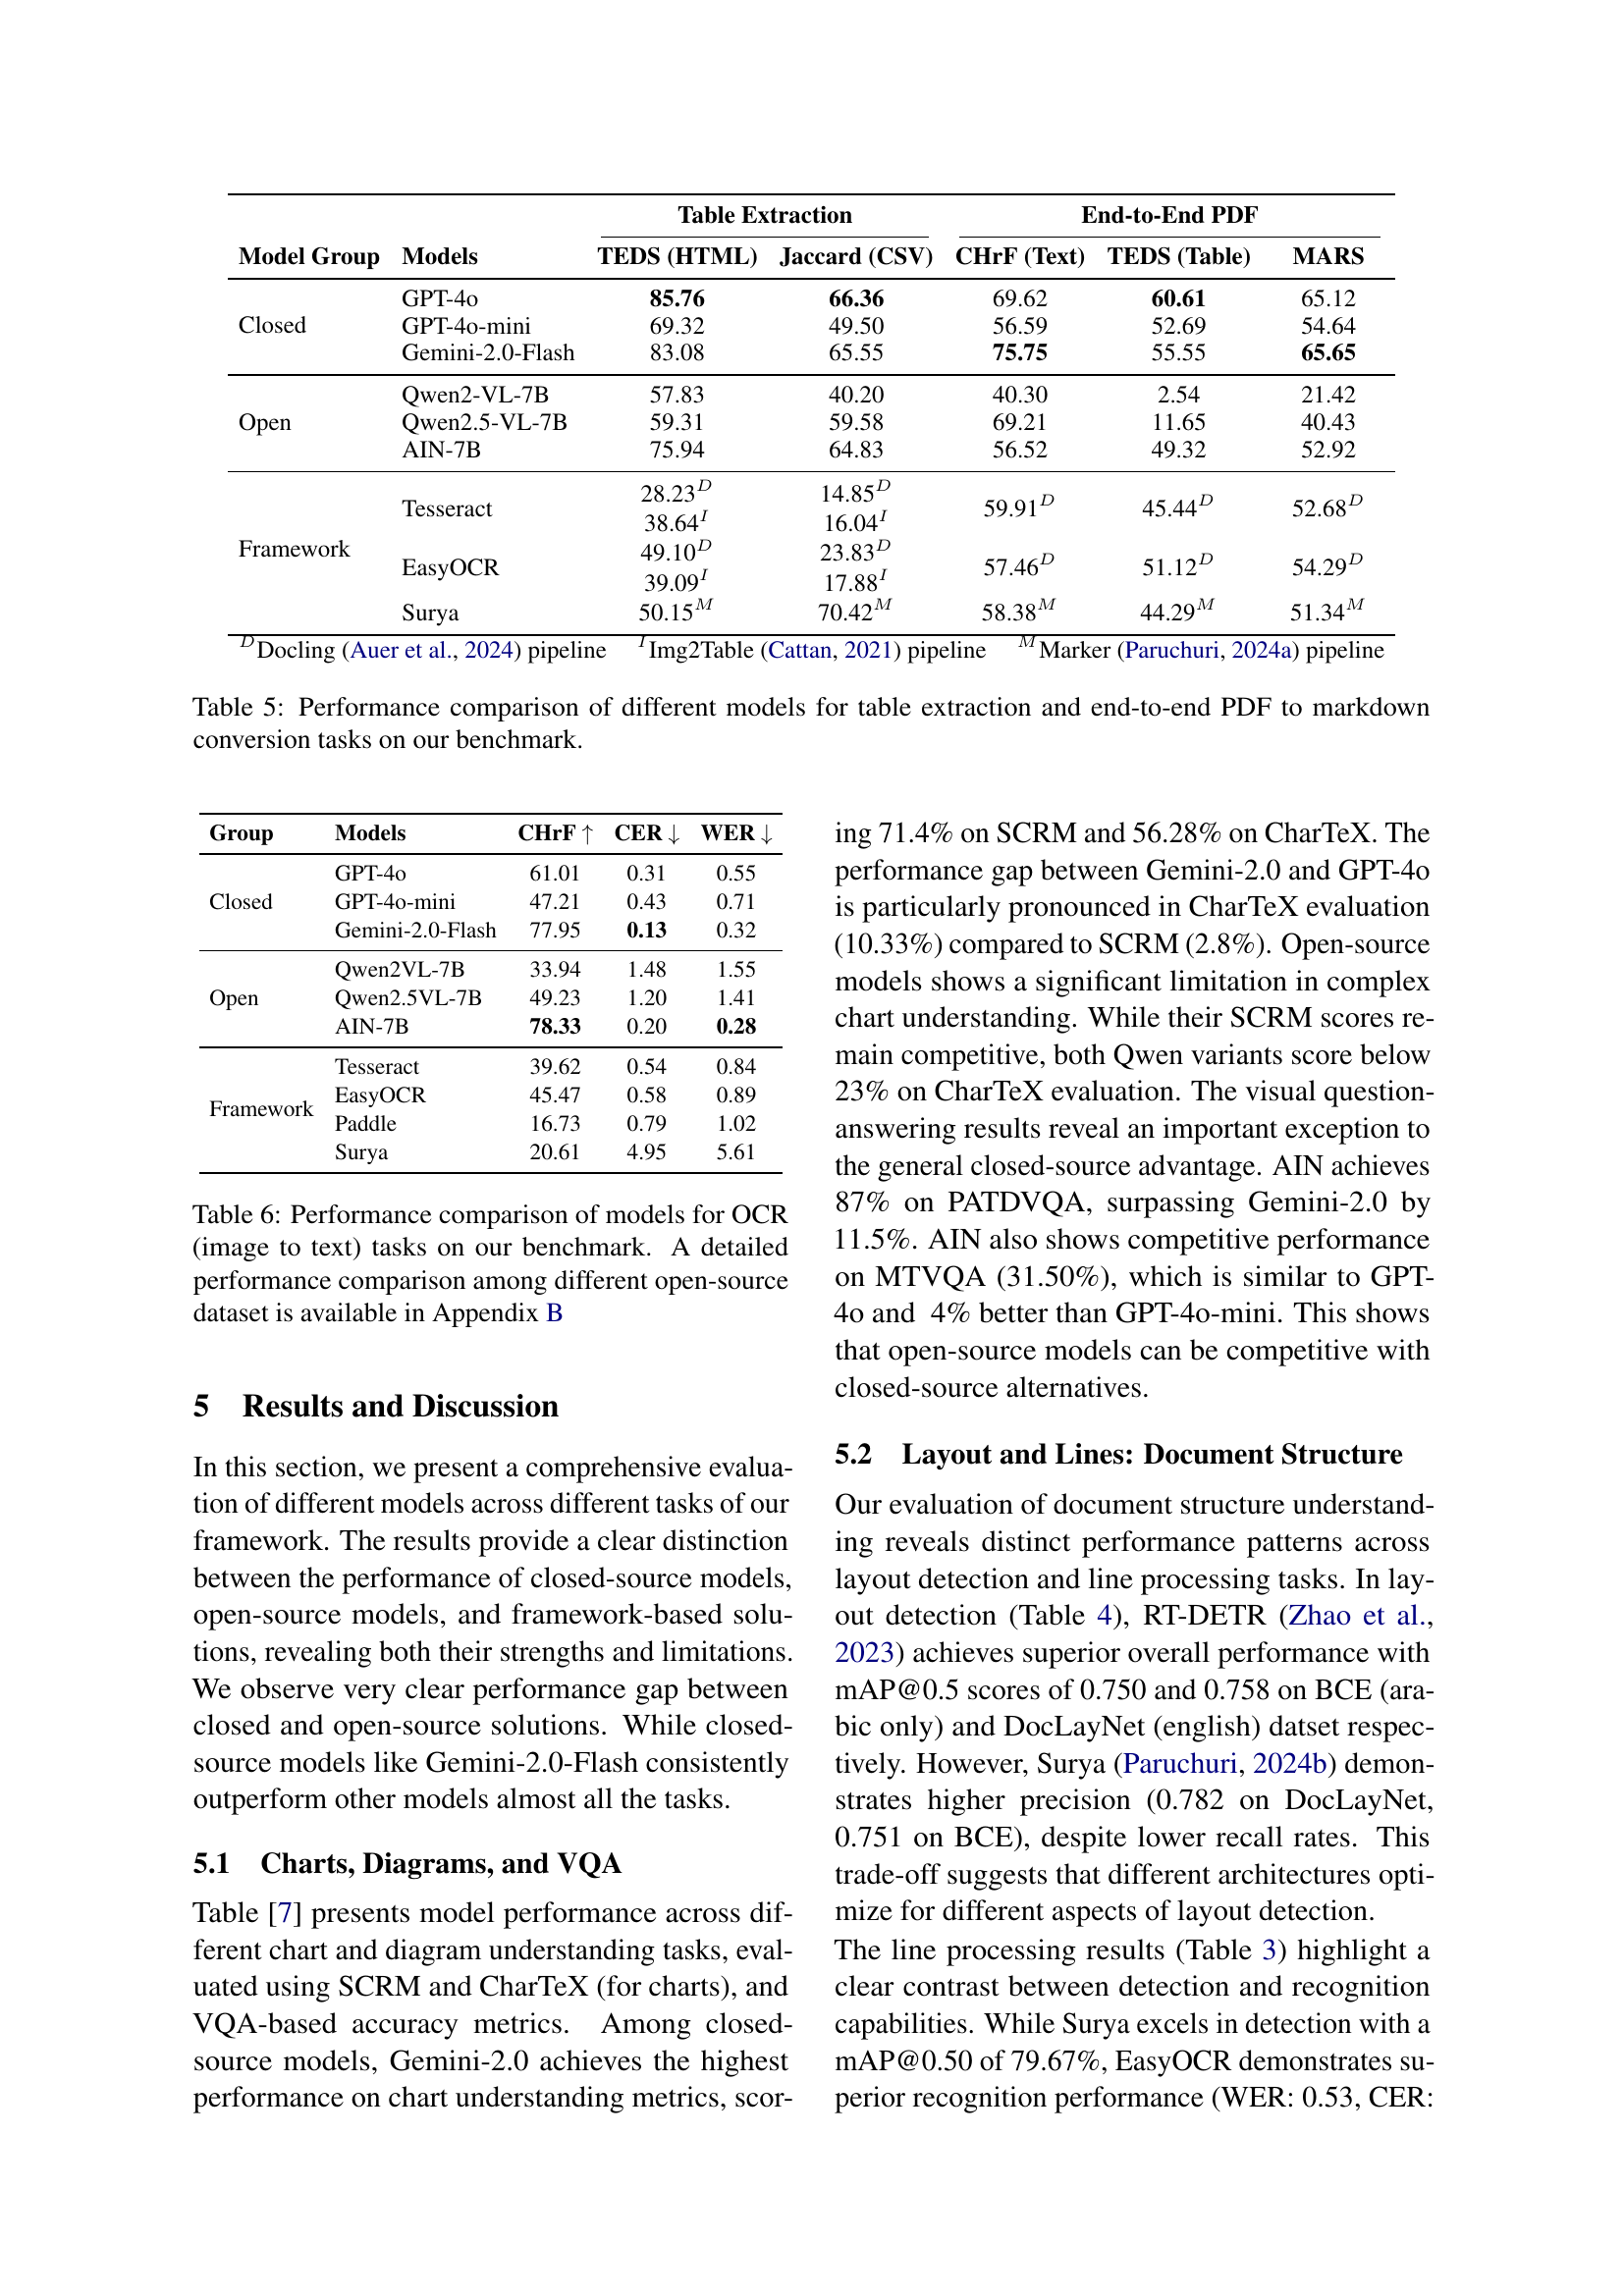
🔼 This table presents a performance comparison of various models on two key tasks: table extraction and end-to-end PDF-to-Markdown conversion. It showcases the capabilities of different models (including closed-source models like GPT-4 and open-source alternatives) in accurately extracting tabular data from documents and converting PDFs into Markdown format. The metrics used allow for a comprehensive evaluation of the models’ abilities in both tasks, highlighting the strengths and weaknesses of each model.
read the caption
Table 5: Performance comparison of different models for table extraction and end-to-end PDF to markdown conversion tasks on our benchmark.
| Group | Models | CHrF | CER | WER |
| Closed | GPT-4o | 61.01 | 0.31 | 0.55 |
| GPT-4o-mini | 47.21 | 0.43 | 0.71 | |
| Gemini-2.0-Flash | 77.95 | 0.13 | 0.32 | |
| Open | Qwen2VL-7B | 33.94 | 1.48 | 1.55 |
| Qwen2.5VL-7B | 49.23 | 1.20 | 1.41 | |
| AIN-7B | 78.33 | 0.20 | 0.28 | |
| Framework | Tesseract | 39.62 | 0.54 | 0.84 |
| EasyOCR | 45.47 | 0.58 | 0.89 | |
| Paddle | 16.73 | 0.79 | 1.02 | |
| Surya | 20.61 | 4.95 | 5.61 |
🔼 This table presents a detailed performance comparison of various models on the Image-to-Text task within the KITAB-Bench benchmark. It compares the performance of closed-source models (GPT-4, GPT-4-mini, Gemini-2.0-Flash) against open-source models (Qwen2-VL-7B, Qwen2.5-VL-7B, AIN-7B), traditional OCR systems (Tesseract, EasyOCR, PaddleOCR, Surya), and includes metrics such as Character Error Rate (CER) and Word Error Rate (WER). The results are broken down across multiple datasets within the benchmark to showcase model performance across diverse text styles and complexity levels. More detailed results comparing open-source datasets can be found in Appendix B.
read the caption
Table 6: Performance comparison of models for OCR (image to text) tasks on our benchmark. A detailed performance comparison among different open-source dataset is available in Appendix B
| Group | Model | Chart | Diagram | Visual QA | |||||
| SCRM | CharTeX | CODM | MTVQAO | ChartsVQAM | DiagramsVQAM | PATDVQAM | Average | ||
| Closed | GPT-4o | 68.6 | 45.95 | 61.6 | 32.00 | 77.00 | 85.29 | 82.50 | 69.19 |
| GPT-4o-mini | 67.2 | 43.33 | 61.4 | 26.80 | 58.00 | 83.33 | 80.00 | 62.03 | |
| Gemini-2.0-Flash | 71.4 | 56.28 | 71.8 | 35.00 | 72.00 | 88.24 | 75.50 | 67.68 | |
| Open | Qwen2-VL-7B | 56.6 | 21.59 | 63.0 | 19.60 | 59.00 | 82.35 | 77.50 | 59.61 |
| Qwen2.5-VL-7B | 36.2 | 22.08 | 59.2 | 23.00 | 74.00 | 79.41 | 74.50 | 62.72 | |
| AIN-7B | 66.6 | 34.61 | 66.40 | 31.50 | 75.00 | 85.29 | 87.00 | 69.69 | |
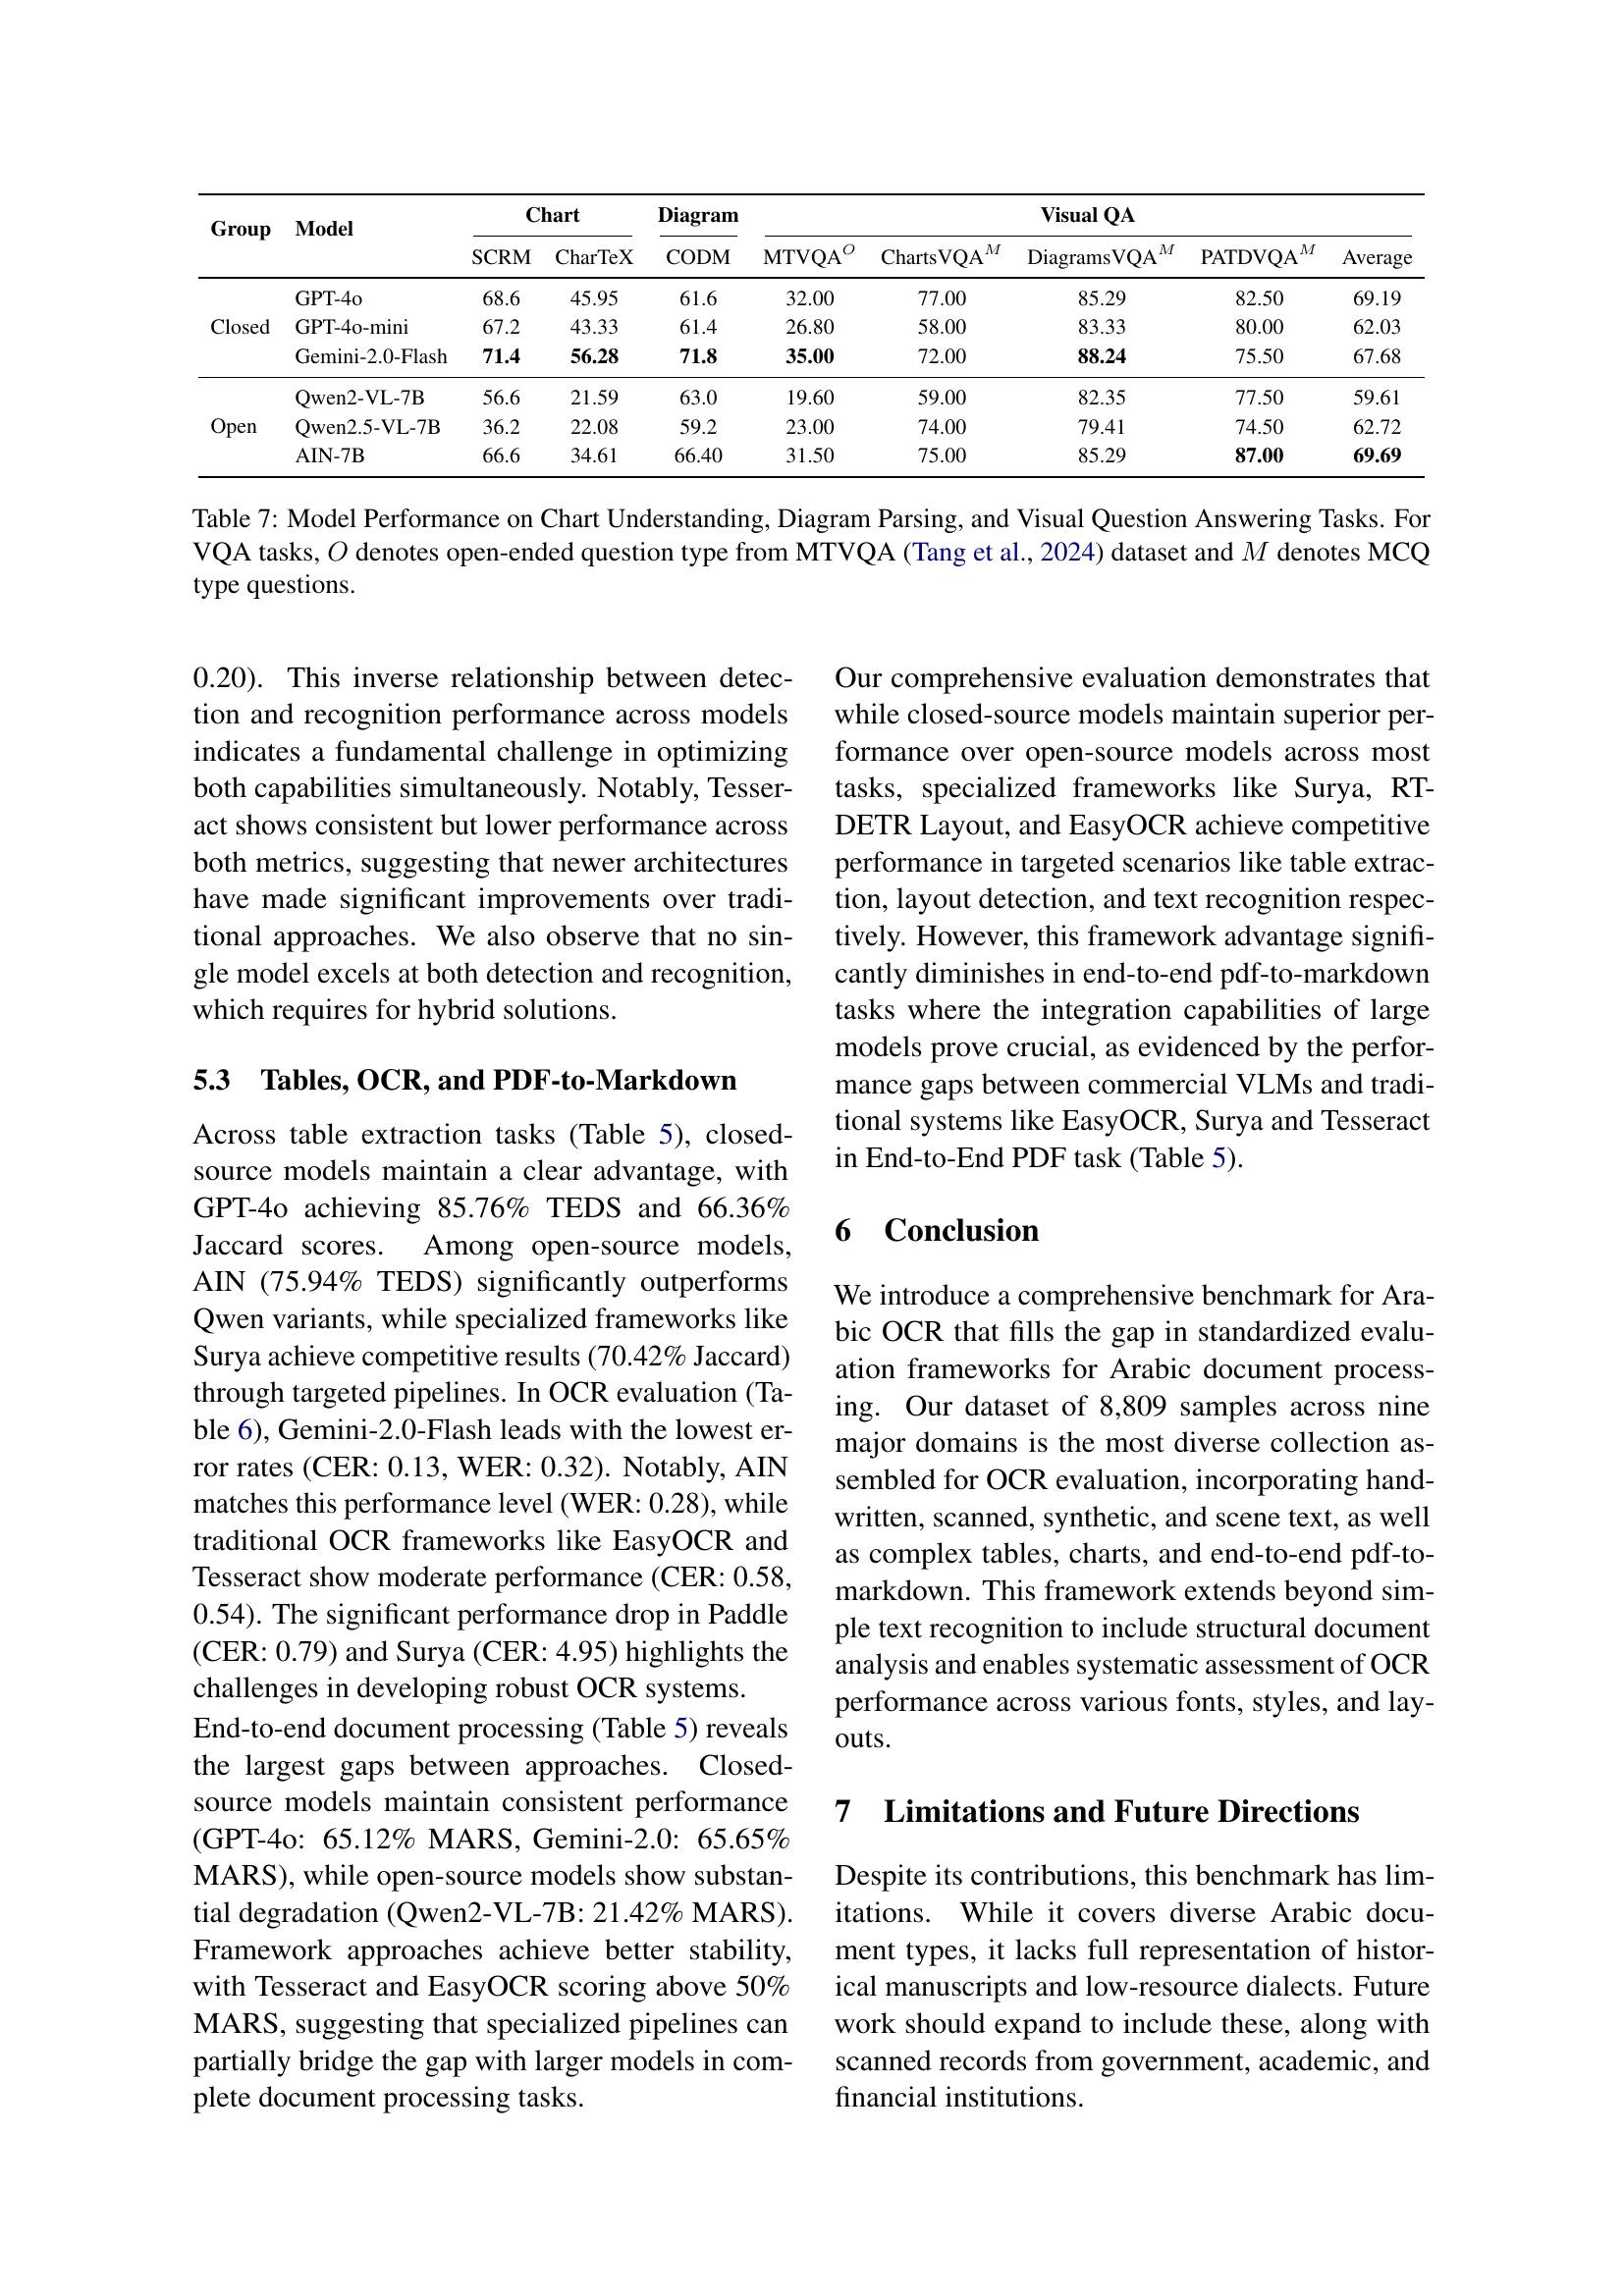
🔼 This table presents a comprehensive evaluation of various models’ performance across three key tasks: chart understanding, diagram parsing, and visual question answering (VQA). For chart understanding, the models’ ability to extract relevant information from charts is evaluated using SCRM and CharTeX metrics. Diagram parsing assesses the models’ capacity to convert diagrams into structured JSON format, measured by CODM. The VQA section evaluates the models’ performance on both open-ended and multiple-choice questions using the MTVQA dataset, evaluating their ability to both understand and reason about visual information in Arabic documents. The results provide insights into the strengths and weaknesses of different model types (closed-source vs. open-source) across these tasks.
read the caption
Table 7: Model Performance on Chart Understanding, Diagram Parsing, and Visual Question Answering Tasks. For VQA tasks, O𝑂Oitalic_O denotes open-ended question type from MTVQA Tang et al. (2024) dataset and M𝑀Mitalic_M denotes MCQ type questions.
| Domain | Sub-Domain | Dataset Source | Original | Selected | Total |
| PDF to Markdown | General | Manual | 33 | 33 | 33 |
| Layout Detection | Docs | BCE-Arabic-v1 Saad et al. (2016) | 1.9k | 1,700 | 2,100 |
| DocLayNet Pfitzmann et al. (2022) | 80k | 400 | |||
| Line Detection | Docs | Manual | 375 | 378 | 378 |
| Line Recognition | Docs | Manual | 375 | 378 | 378 |
| Table Recognition | Financial | Pixmo Deitke et al. (2024) | 490 | 456 | 456 |
| Image to Text | Synthetic | PATS El-Muhtaseb (2010) | 21.6k | 500 | 3,760 |
| SythenAR | 39.1k | 500 | |||
| Historical | HistoryAr Pantke et al. (2014) | 1.5k | 200 | ||
| HistoricalBooks | 40 | 10 | |||
| Hand. Paragraph | Khatt Mahmoud et al. (2014) | 2.72k | 200 | ||
| Hand. Word | ADAB Boubaker et al. (2021) | 15k | 200 | ||
| Hand. Line | Muharaf Saeed et al. (2024) | 24.5k | 200 | ||
| OnlineKhatt Mahmoud et al. (2018) | 8.5k | 200 | |||
| Khatt Mahmoud et al. (2014) | 13.4k | 200 | |||
| PPT | ISI-PPT Wu and Natarajan (2017) | 86.5k | 500 | ||
| Blogs | ArabicOCR | 20.3k | 50 | ||
| Hindawi Elfilali (2023) | 79k | 200 | |||
| Scene | EvAREST Hassan et al. (2021) | 5.59k | 800 | ||
| Charts to DataFrame | Bar | Synthetic | 100 | 61 | 576 |
| Line | Synthetic | 100 | 43 | ||
| Pie | Synthetic | 100 | 56 | ||
| Box | Synthetic | 100 | 31 | ||
| Violin | Synthetic | 100 | 36 | ||
| Area | Synthetic | 50 | 29 | ||
| SunBurst | Synthetic | 30 | 15 | ||
| Dot | Synthetic | 30 | 15 | ||
| Dual Axis | Synthetic | 20 | 26 | ||
| Density Curve | Synthetic | 10 | 5 | ||
| Bubble | Synthetic | 20 | 13 | ||
| Grouped Bar | Synthetic | 50 | 60 | ||
| Stacked Bar | Synthetic | 50 | 82 | ||
| Histogram | Synthetic | 100 | 70 | ||
| HeatMap | Synthetic | 10 | 11 | ||
| Scatter | Synthetic | 100 | 23 | ||
| Diagram to Json | Sequence | Synthetic | 50 | 46 | 226 |
| Funnel | Synthetic | 20 | 52 | ||
| Class | Synthetic | 20 | 30 | ||
| Network | Synthetic | 20 | 18 | ||
| Venn | Synthetic | 20 | 7 | ||
| FlowChart | Synthetic | 100 | 112 | ||
| TreeMap | Synthetic | 100 | 157 | ||
| VQA | Diagrams | Manual | 102 | 102 | 902 |
| Charts | Manual | 105 | 100 | ||
| News Letter | PATD Bouressace and Csirik (2019) | 2.42k | 200 | ||
| Scene | MTVQA | 818 | 500 | ||
| Total Dataset Size | – | 8,809 | |||
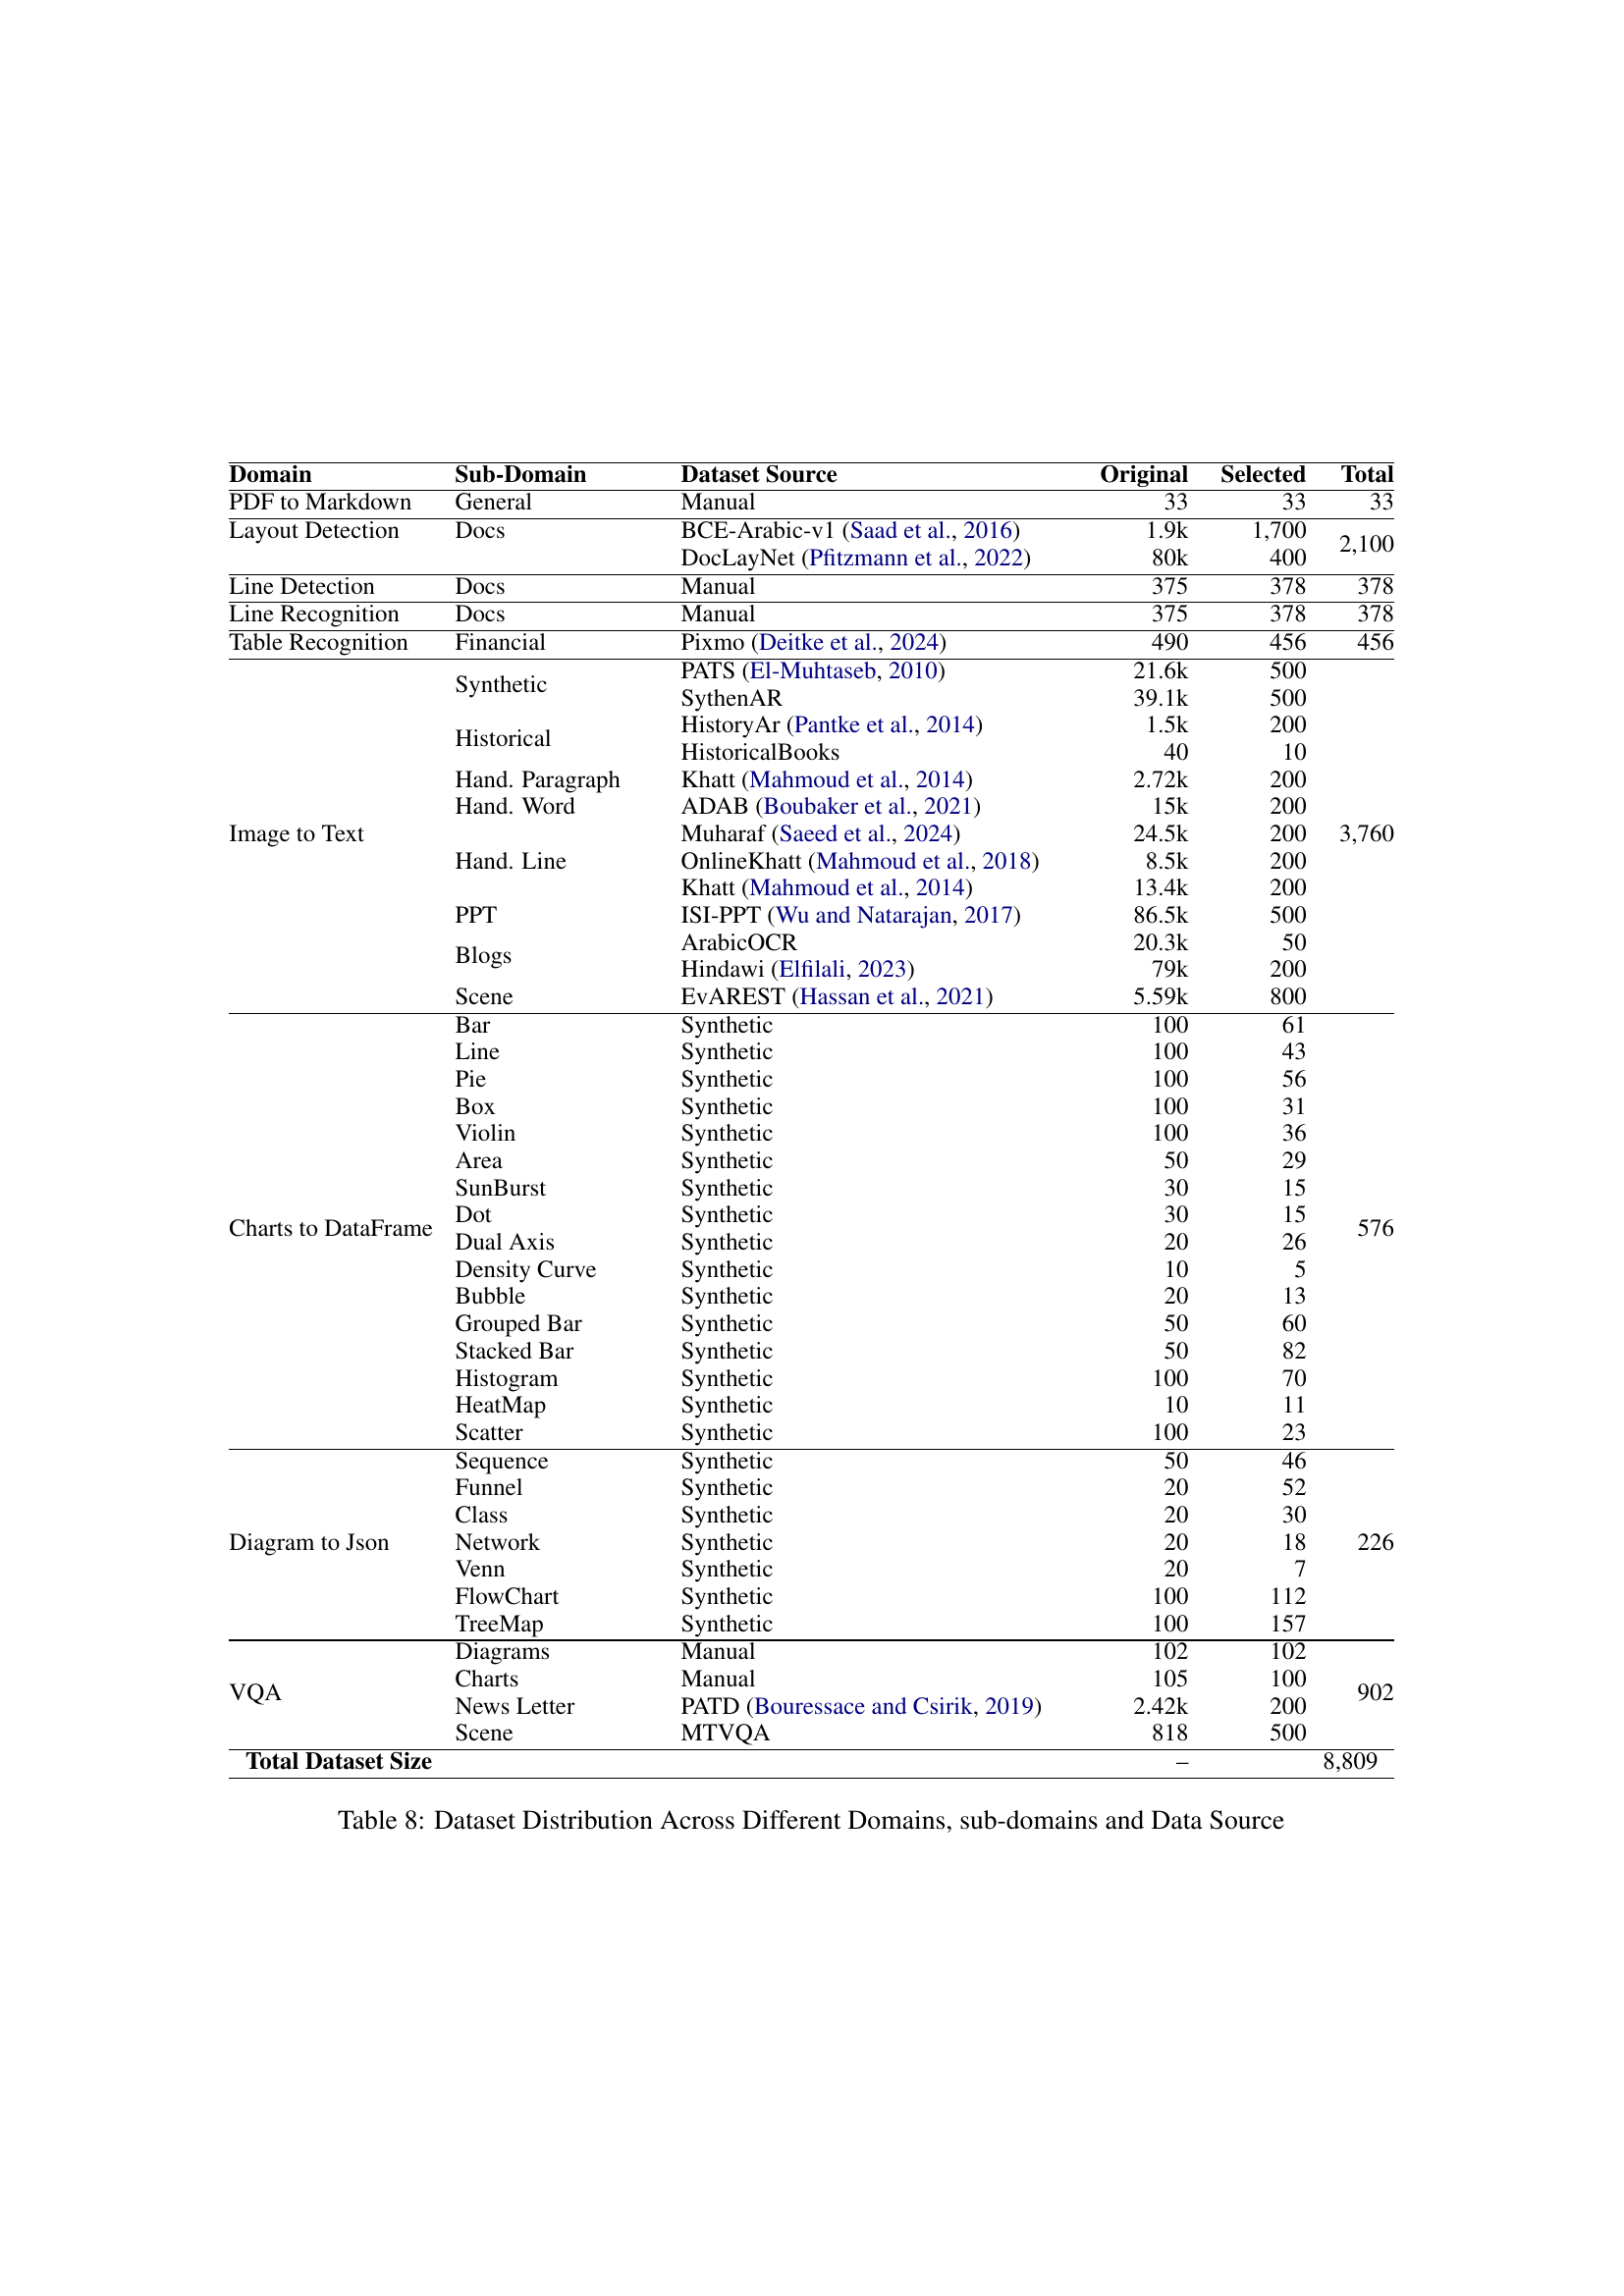
🔼 Table 8 shows a detailed breakdown of the KITAB-Bench dataset, categorizing its 8,809 samples across nine main domains (e.g., OCR, charts to JSON, table recognition) and 36 sub-domains (e.g., scanned text, handwritten text, various chart types). For each sub-domain, the table specifies the original and selected number of samples, their source (manual annotation, synthetic generation, or specific existing datasets like KHATT and DocLayNet), and the type of document they represent.
read the caption
Table 8: Dataset Distribution Across Different Domains, sub-domains and Data Source
| Dataset | Size | GPT-4o | GPT-4o-mini | Gemini-2.0-Flash | Qwen2-VL | ||||
| CER | WER | CER | WER | CER | WER | CER | WER | ||
| PATS | 500 | 0.23 | 0.30 | 0.53 | 0.71 | 0.01 | 0.02 | 1.02 | 1.02 |
| SythenAR | 500 | 0.09 | 0.20 | 0.14 | 0.32 | 0.07 | 0.17 | 0.59 | 1.13 |
| HistoryAr | 200 | 0.51 | 0.82 | 0.67 | 0.96 | 0.28 | 0.64 | 3.46 | 2.86 |
| HistoricalBooks | 10 | 0.41 | 0.76 | 0.59 | 0.88 | 0.05 | 0.22 | 1.90 | 2.16 |
| Khatt | 200 | 0.45 | 0.74 | 0.64 | 0.91 | 0.19 | 0.45 | 1.12 | 5.04 |
| Adab | 200 | 0.30 | 0.73 | 0.35 | 0.83 | 0.19 | 0.56 | 0.63 | 1.08 |
| Muharaf | 200 | 0.56 | 0.90 | 0.63 | 0.94 | 0.33 | 0.69 | 3.57 | 2.87 |
| OnlineKhatt | 200 | 0.29 | 0.63 | 0.41 | 0.76 | 0.17 | 0.44 | 1.30 | 2.01 |
| ISI-PPT | 500 | 0.08 | 0.18 | 0.15 | 0.31 | 0.06 | 0.15 | 1.03 | 1.06 |
| ArabicOCR | 50 | 0.06 | 0.26 | 0.16 | 0.46 | 0.00 | 0.02 | 1.25 | 1.50 |
| Hindawi | 200 | 0.34 | 0.56 | 0.48 | 0.71 | 0.01 | 0.04 | 1.82 | 2.05 |
| EvArest | 800 | 0.20 | 0.38 | 0.25 | 0.51 | 0.18 | 0.36 | 0.41 | 0.95 |
| 3,760 | 0.31 | 0.55 | 0.43 | 0.71 | 0.13 | 0.32 | 1.48 | 1.20 | |
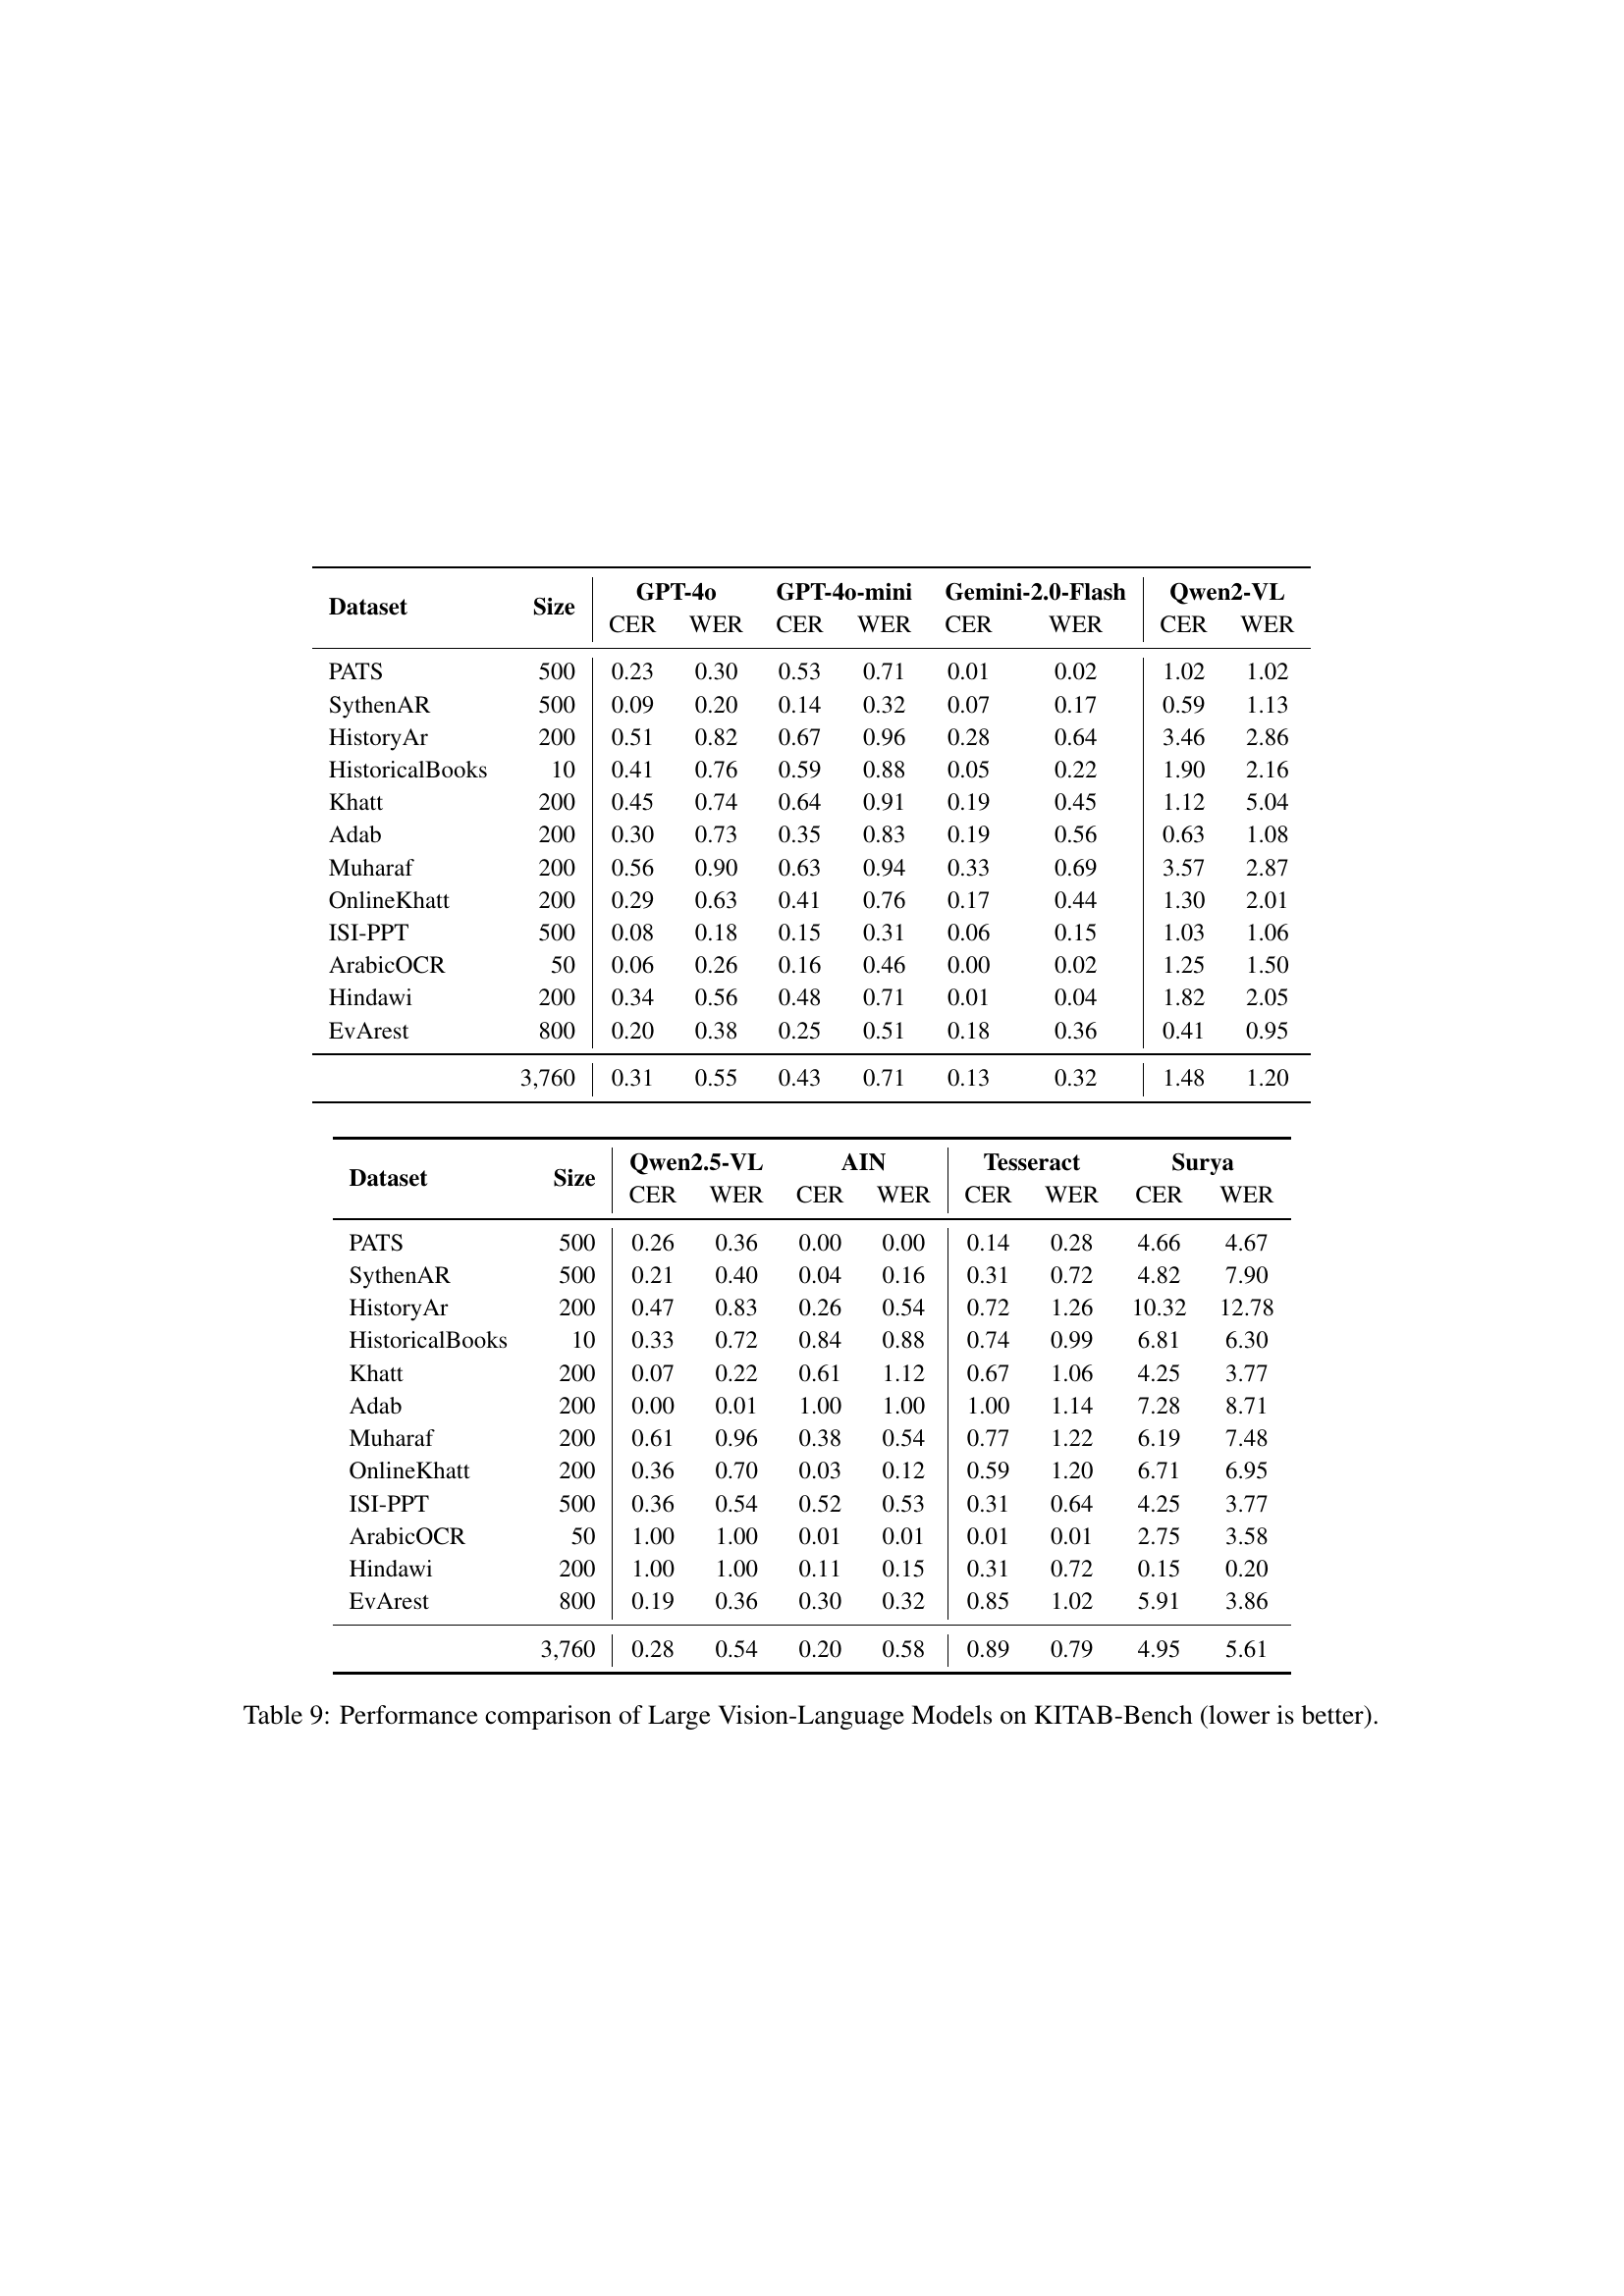
🔼 This table presents a detailed comparison of the performance of several large vision-language models (LLMs) on the KITAB-Bench benchmark. The benchmark itself focuses on Arabic OCR and document understanding tasks. The table shows Character Error Rate (CER) and Word Error Rate (WER) for each model across various datasets within the benchmark. Lower CER and WER values indicate better performance. The datasets represent different types of Arabic text, including handwritten, printed, scene text, and specialized document formats, allowing for a thorough evaluation of the models’ capabilities in various scenarios.
read the caption
Table 9: Performance comparison of Large Vision-Language Models on KITAB-Bench (lower is better).
| Dataset | Size | Qwen2.5-VL | AIN | Tesseract | Surya | ||||
| CER | WER | CER | WER | CER | WER | CER | WER | ||
| PATS | 500 | 0.26 | 0.36 | 0.00 | 0.00 | 0.14 | 0.28 | 4.66 | 4.67 |
| SythenAR | 500 | 0.21 | 0.40 | 0.04 | 0.16 | 0.31 | 0.72 | 4.82 | 7.90 |
| HistoryAr | 200 | 0.47 | 0.83 | 0.26 | 0.54 | 0.72 | 1.26 | 10.32 | 12.78 |
| HistoricalBooks | 10 | 0.33 | 0.72 | 0.84 | 0.88 | 0.74 | 0.99 | 6.81 | 6.30 |
| Khatt | 200 | 0.07 | 0.22 | 0.61 | 1.12 | 0.67 | 1.06 | 4.25 | 3.77 |
| Adab | 200 | 0.00 | 0.01 | 1.00 | 1.00 | 1.00 | 1.14 | 7.28 | 8.71 |
| Muharaf | 200 | 0.61 | 0.96 | 0.38 | 0.54 | 0.77 | 1.22 | 6.19 | 7.48 |
| OnlineKhatt | 200 | 0.36 | 0.70 | 0.03 | 0.12 | 0.59 | 1.20 | 6.71 | 6.95 |
| ISI-PPT | 500 | 0.36 | 0.54 | 0.52 | 0.53 | 0.31 | 0.64 | 4.25 | 3.77 |
| ArabicOCR | 50 | 1.00 | 1.00 | 0.01 | 0.01 | 0.01 | 0.01 | 2.75 | 3.58 |
| Hindawi | 200 | 1.00 | 1.00 | 0.11 | 0.15 | 0.31 | 0.72 | 0.15 | 0.20 |
| EvArest | 800 | 0.19 | 0.36 | 0.30 | 0.32 | 0.85 | 1.02 | 5.91 | 3.86 |
| 3,760 | 0.28 | 0.54 | 0.20 | 0.58 | 0.89 | 0.79 | 4.95 | 5.61 | |
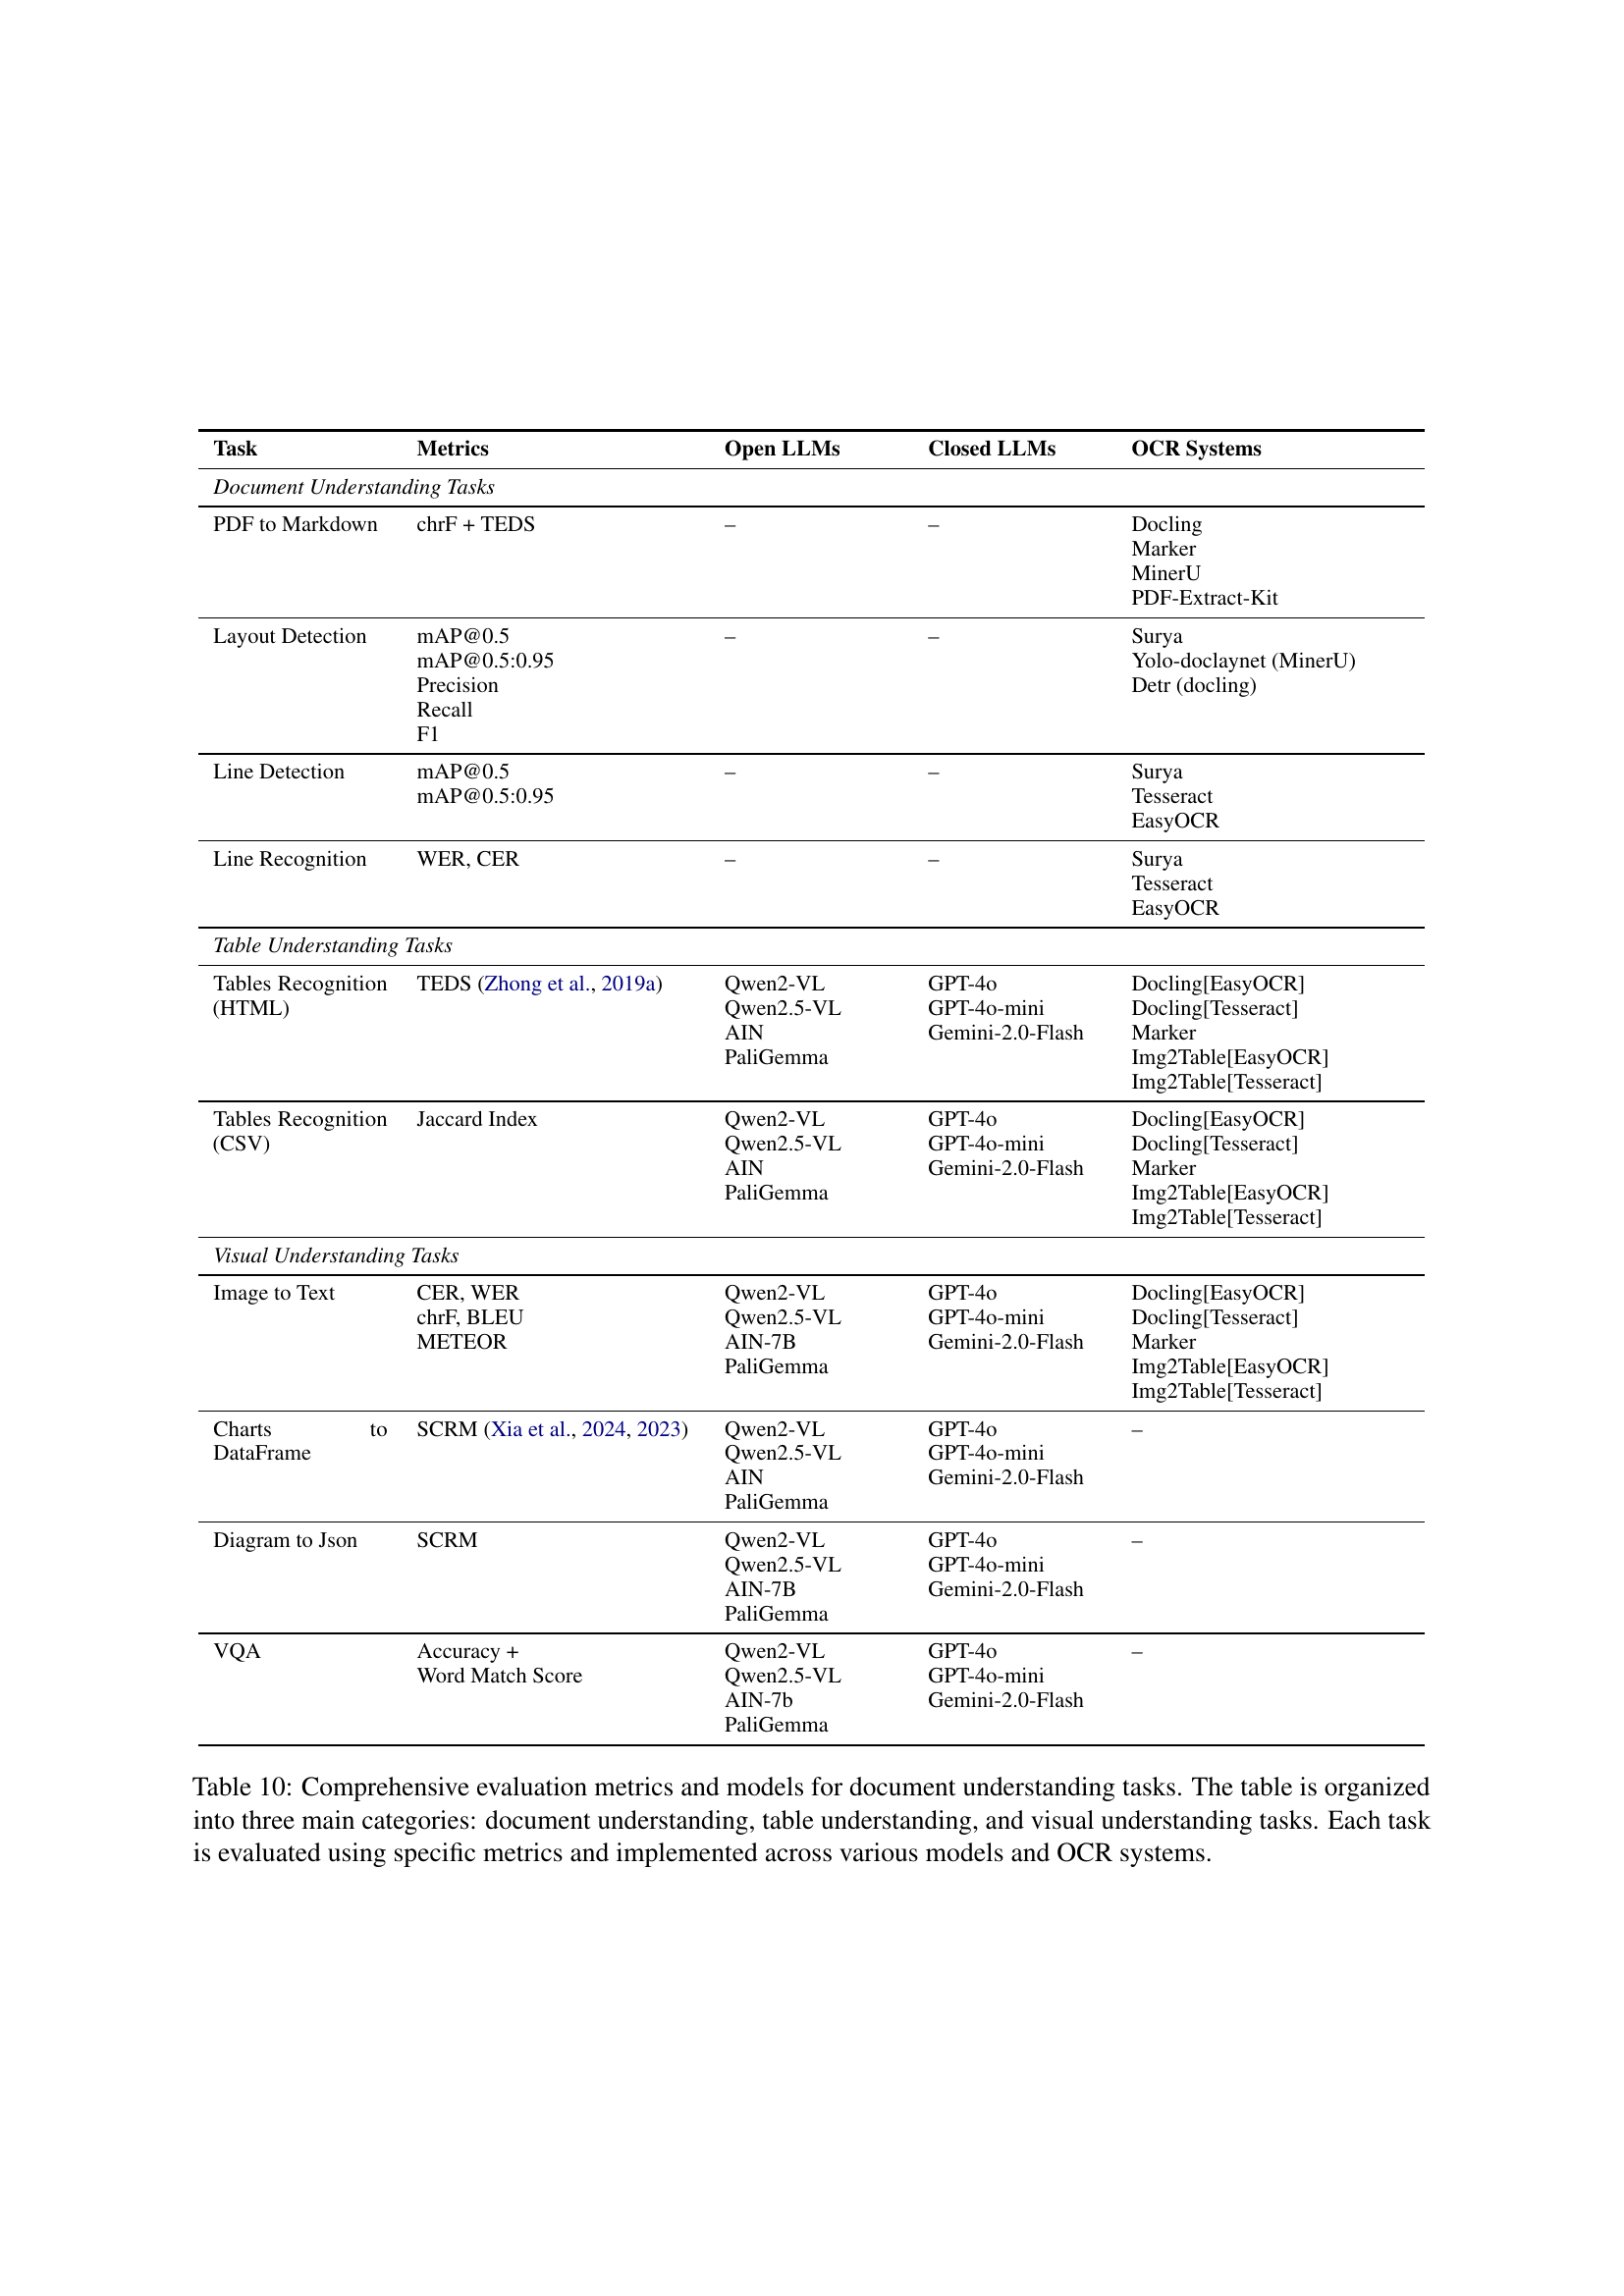
🔼 Table 10 presents a comprehensive evaluation of various models and OCR systems across diverse document understanding tasks. It’s structured into three main sections: document understanding (layout analysis, line detection, PDF to markdown conversion), table understanding (table recognition, chart to dataframe conversion), and visual understanding (image to text, diagram to JSON conversion, visual question answering). Each task uses specific metrics to assess model performance, allowing for a detailed comparison of different approaches.
read the caption
Table 10: Comprehensive evaluation metrics and models for document understanding tasks. The table is organized into three main categories: document understanding, table understanding, and visual understanding tasks. Each task is evaluated using specific metrics and implemented across various models and OCR systems.
Full paper#