TL;DR#
Large language models (LLMs) have shown progress in math reasoning, utilizing chain-of-thought and compute scaling. It’s unclear if better performance comes from longer reasoning or efficiency, especially across generations. It remains unclear whether improved performance in newer models stems from using longer reasoning chains or from reasoning more efficiently. The paper focuses on the relationship between reasoning token usage and accuracy gains, across the series of OpenAI models.
The research systematically analyzes chain-of-thought length using the Omni-MATH benchmark, comparing 01-mini and 03-mini variants. 03-mini (m) shows better accuracy with shorter reasoning chains than 01-mini. Accuracy generally decreases with longer reasoning chains across all models and compute setups, even when question difficulty is controlled. This decline is less in proficient models, indicating more effective compute use. Though 03-mini (h) gains marginal accuracy over 03-mini (m), it uses more tokens on all problems.
Key Takeaways#
Why does it matter?#
This paper offers insights into the relationship between reasoning and performance in LLMs, potentially influencing future model designs, scaling strategies, and evaluation methodologies. It highlights efficiency and offers a direction for test-time compute optimization. The findings prompt the development of more targeted benchmark evaluations and refined training techniques, helping researchers to better evaluate models.
Visual Insights#

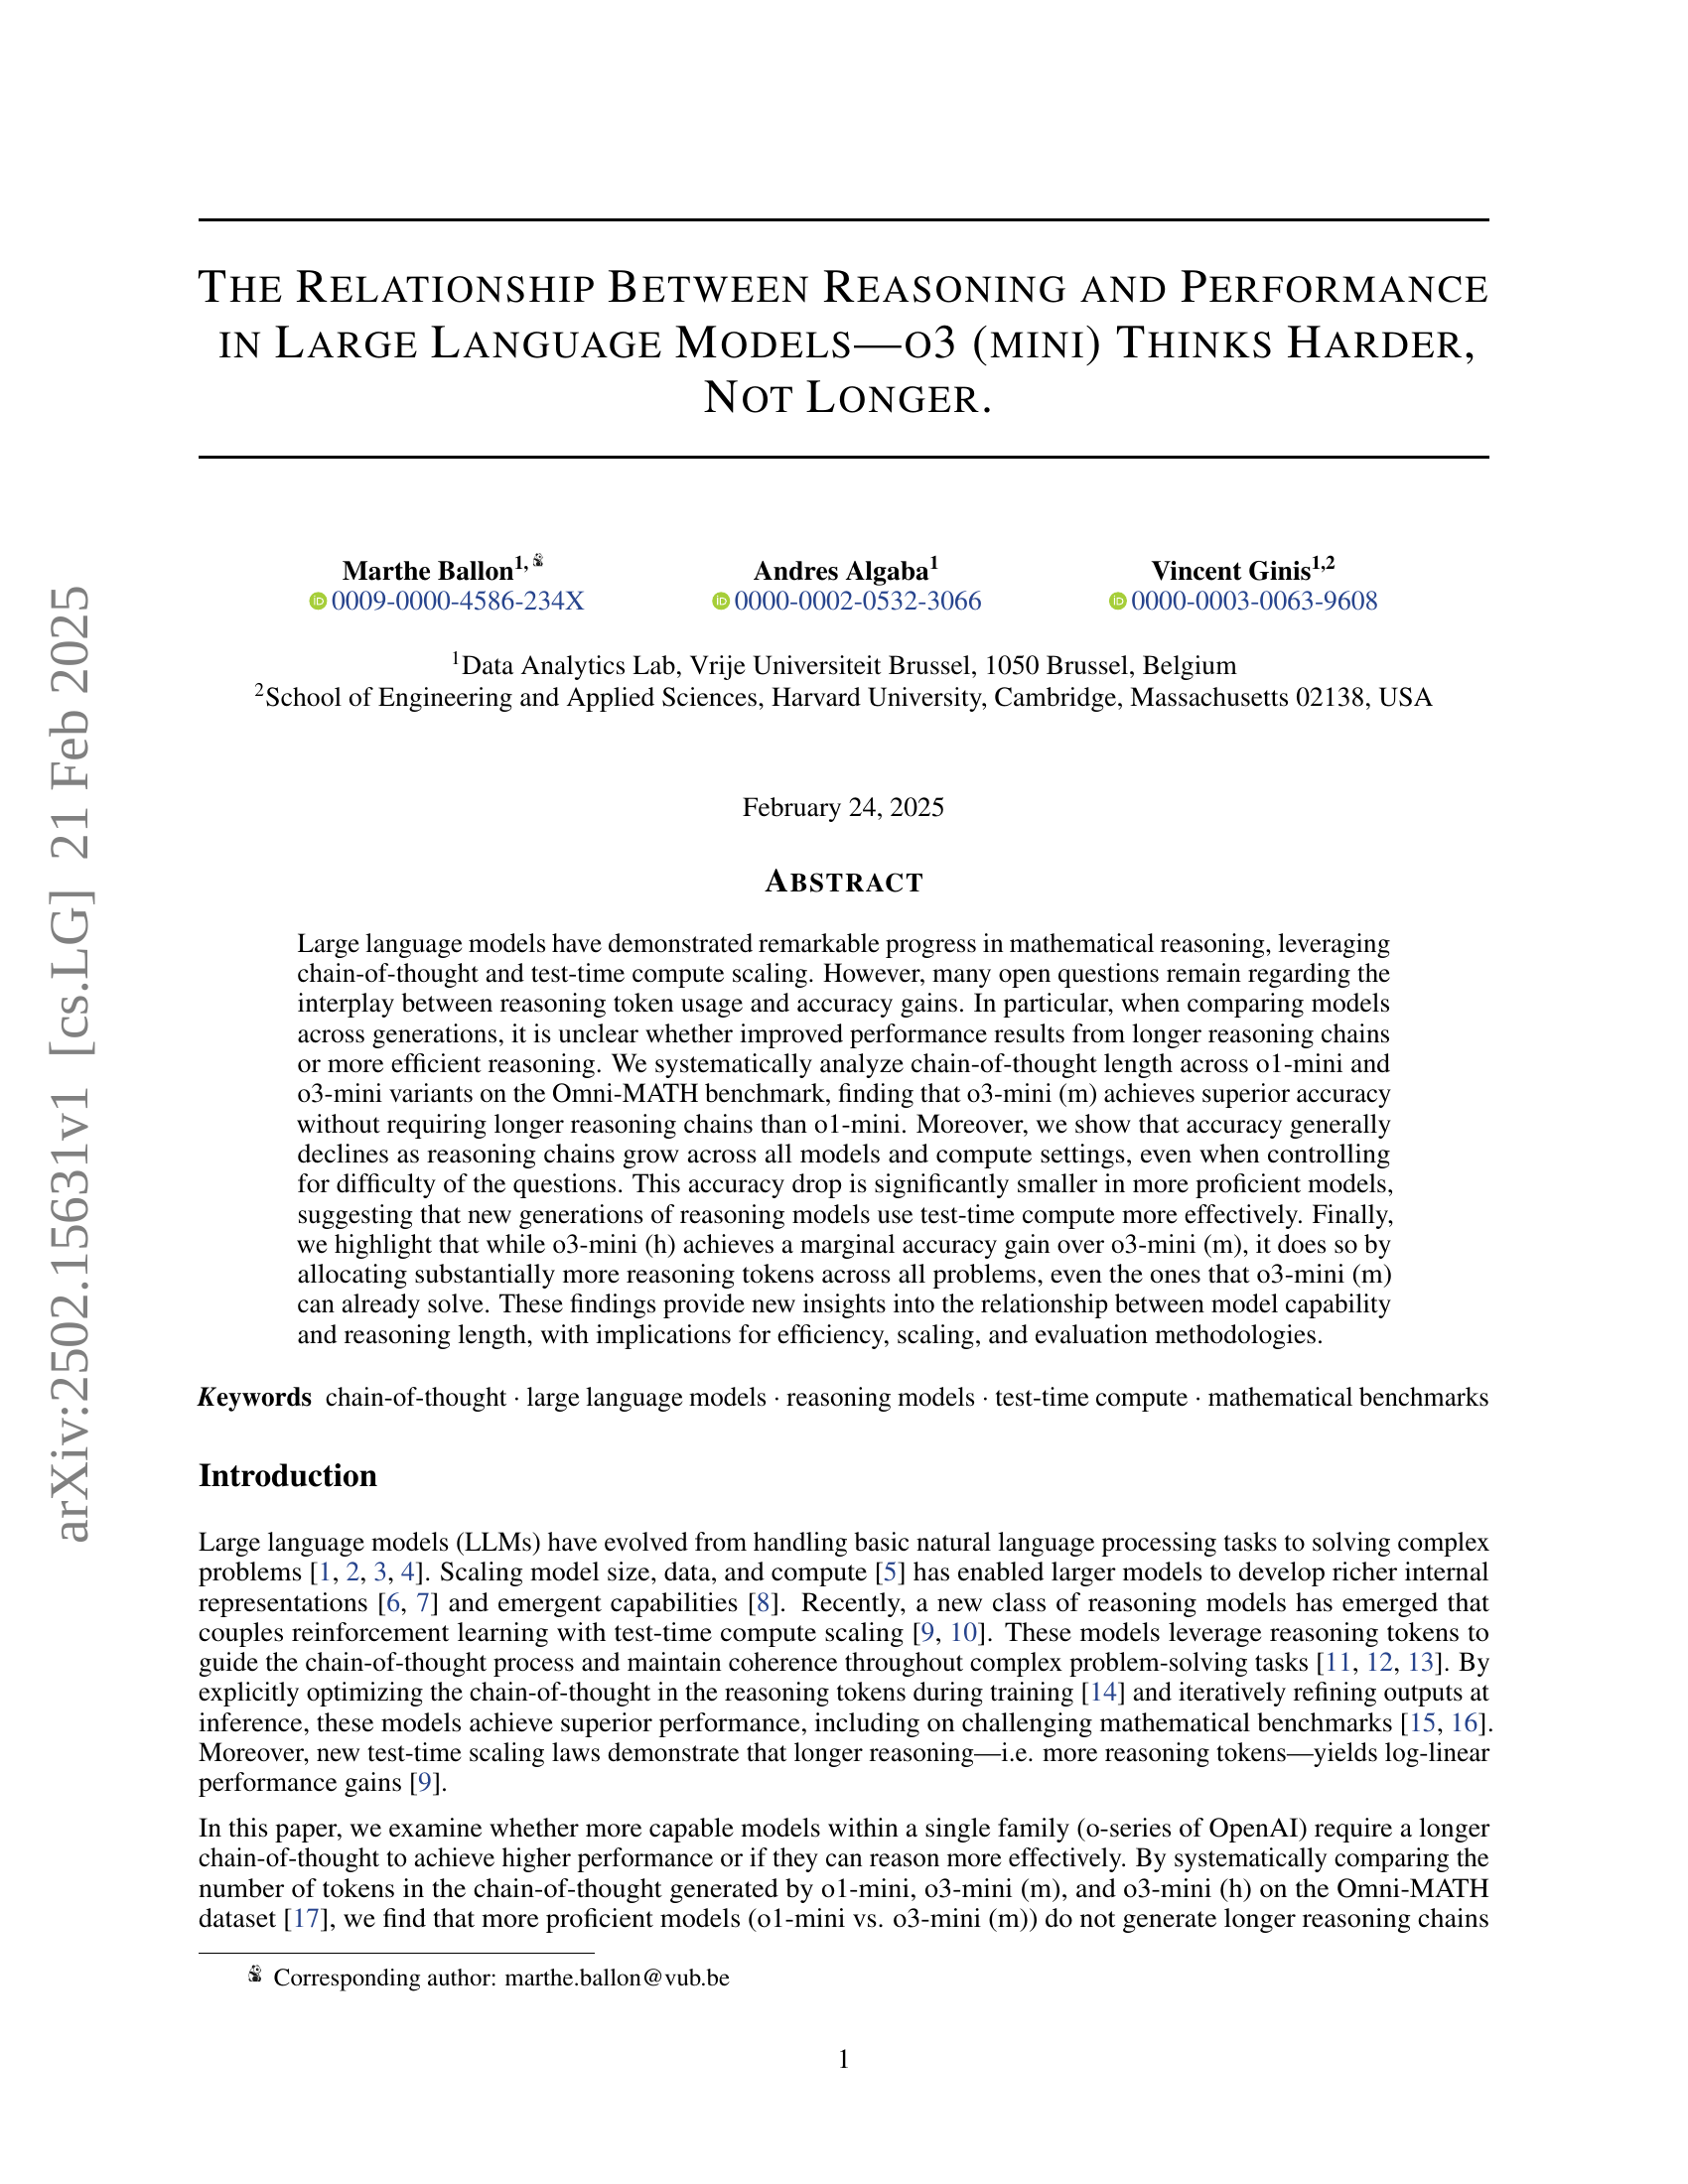
🔼 Figure 1 presents a comparative analysis of four OpenAI language models (gpt-4, o1-mini, o3-mini (m), and o3-mini (h)) on the Omni-MATH benchmark, assessing their performance across various mathematical disciplines and difficulty levels. The graph displays the accuracy of each model for each category. It reveals that gpt-4 underperforms considerably, never reaching 50% accuracy in any category. The o1-mini model demonstrates a significant improvement, achieving 40-60% accuracy across all areas. The o3-mini models show even better performance, exceeding 50% accuracy consistently. A notable observation is the general decline in accuracy as the problem difficulty increases, with the exception of the gpt-4 model which shows inconsistent performance across difficulty tiers.
read the caption
Fig. 1: Accuracy comparison of OpenAI models gpt-4o, o1-mini, o3-mini (m) and o3-mini (h) on the Omni-MATH benchmark. This figure displays the accuracy of gpt-4o, o1-mini, o3-mini (m) and o3-mini (h) on the Omni-MATH benchmark across disciplines and difficulty tiers. The gpt-4o model fails to attain 50%percent5050\%50 % in any category and consistently lags behind the reasoning models. o1-mini significantly improves accuracy, reaching accuracies of 40404040-60%percent6060\%60 % across all domains, while the o3-models surpass 50%percent5050\%50 % accuracy in all categories. In general, accuracy declines as difficulty increases, with the exception of gpt-4o, which shows accuracy vs. difficulty level imbalance for Tiers 2222, 3333, and 4444.
In-depth insights#
Efficient Reason#
Efficient reasoning in large language models is a critical area explored within the paper, focusing on how models can achieve higher accuracy without proportionally increasing reasoning token usage. The study highlights that more proficient models, like o3-mini (m), do not necessarily require longer reasoning chains compared to less capable models like 01-mini to achieve superior performance, suggesting a more efficient use of test-time compute. This efficiency is crucial for scaling language models effectively, as it indicates that advancements in model architecture and training algorithms can lead to better reasoning capabilities without the added computational cost of processing longer sequences of reasoning tokens. The findings further reveal that accuracy tends to decline as reasoning chains grow, a trend less pronounced in more proficient models, implying they overthink less and reason more effectively. This aspect is significant for optimizing the balance between reasoning depth and resource usage in next-generation models, suggesting that ’thinking harder’ is more beneficial than ’thinking longer’. This insight has important implications for developing evaluation methodologies that account for both accuracy and the efficiency of reasoning processes.
Shorter Is Better#
Efficiency in reasoning is paramount: a shorter chain-of-thought, indicative of direct and effective processing, is often superior to prolonged deliberation. This suggests that more capable models can arrive at accurate solutions with less computational effort, contrasting with the notion that more tokens are always better. It raises questions about the nature of reasoning itself; perhaps true understanding minimizes steps. Models should focus on minimizing steps to find solution.
Token Trade-Offs#
The concept of “Token Trade-Offs” in large language models (LLMs) highlights a crucial aspect of their design and performance. It encapsulates the idea that optimizing for one attribute, like reasoning depth (longer chains of thought), can often come at the expense of another, such as efficiency or accuracy. While increasing the number of tokens allocated for reasoning might seem beneficial, leading to more thorough exploration of the problem space, it can also introduce issues. LLMs may overthink, getting lost in irrelevant details or generating more opportunities for errors to creep in, which is known as diminishing returns. There’s a subtle balance between providing enough computational budget for effective reasoning and avoiding excessive consumption, which can reduce both accuracy and efficiency. The best models are therefore those that “think smarter”, as opposed to “longer", by maximizing information extraction.
Beyond Overthink#
The concept of “beyond overthink” suggests moving past excessive computation in LLMs towards more efficient reasoning. Current models, like 03-mini, achieve higher accuracy not by generating longer reasoning chains, but by reasoning more effectively. This implies a shift from brute-force computation to smarter algorithms and more refined internal representations. Future research should focus on developing models that can discern relevant information and prioritize computations, avoiding unnecessary processing. The diminishing returns observed with increased token usage highlight the need for novel architectures and training strategies that promote efficient reasoning. This includes exploring methods to constrain the chain-of-thought process and develop mathematical benchmarks with reference reasoning templates to evaluate the quality of reasoning, not just the length. By shifting the focus to efficient reasoning, future LLMs can achieve higher accuracy with fewer computational resources.
Scale with Care#
Scaling AI systems demands caution, not just brute-force expansion. Increasing model size or compute without careful consideration can lead to diminishing returns or even detrimental outcomes. It’s crucial to monitor efficiency metrics alongside performance gains. Over-parameterization can result in wasted resources and increased inference costs, while neglecting data quality can amplify biases and lead to unreliable results. A thoughtful scaling strategy involves analyzing the specific task requirements, optimizing model architecture, and curating a diverse and representative dataset. Furthermore, rigorous evaluation and interpretability are essential to ensure that the scaled system remains aligned with intended goals and avoids unintended consequences. Ethical considerations, such as fairness and privacy, should also guide the scaling process to prevent exacerbating existing societal inequalities. Scaling should prioritize responsible development over simply chasing higher numbers.
More visual insights#
More on figures

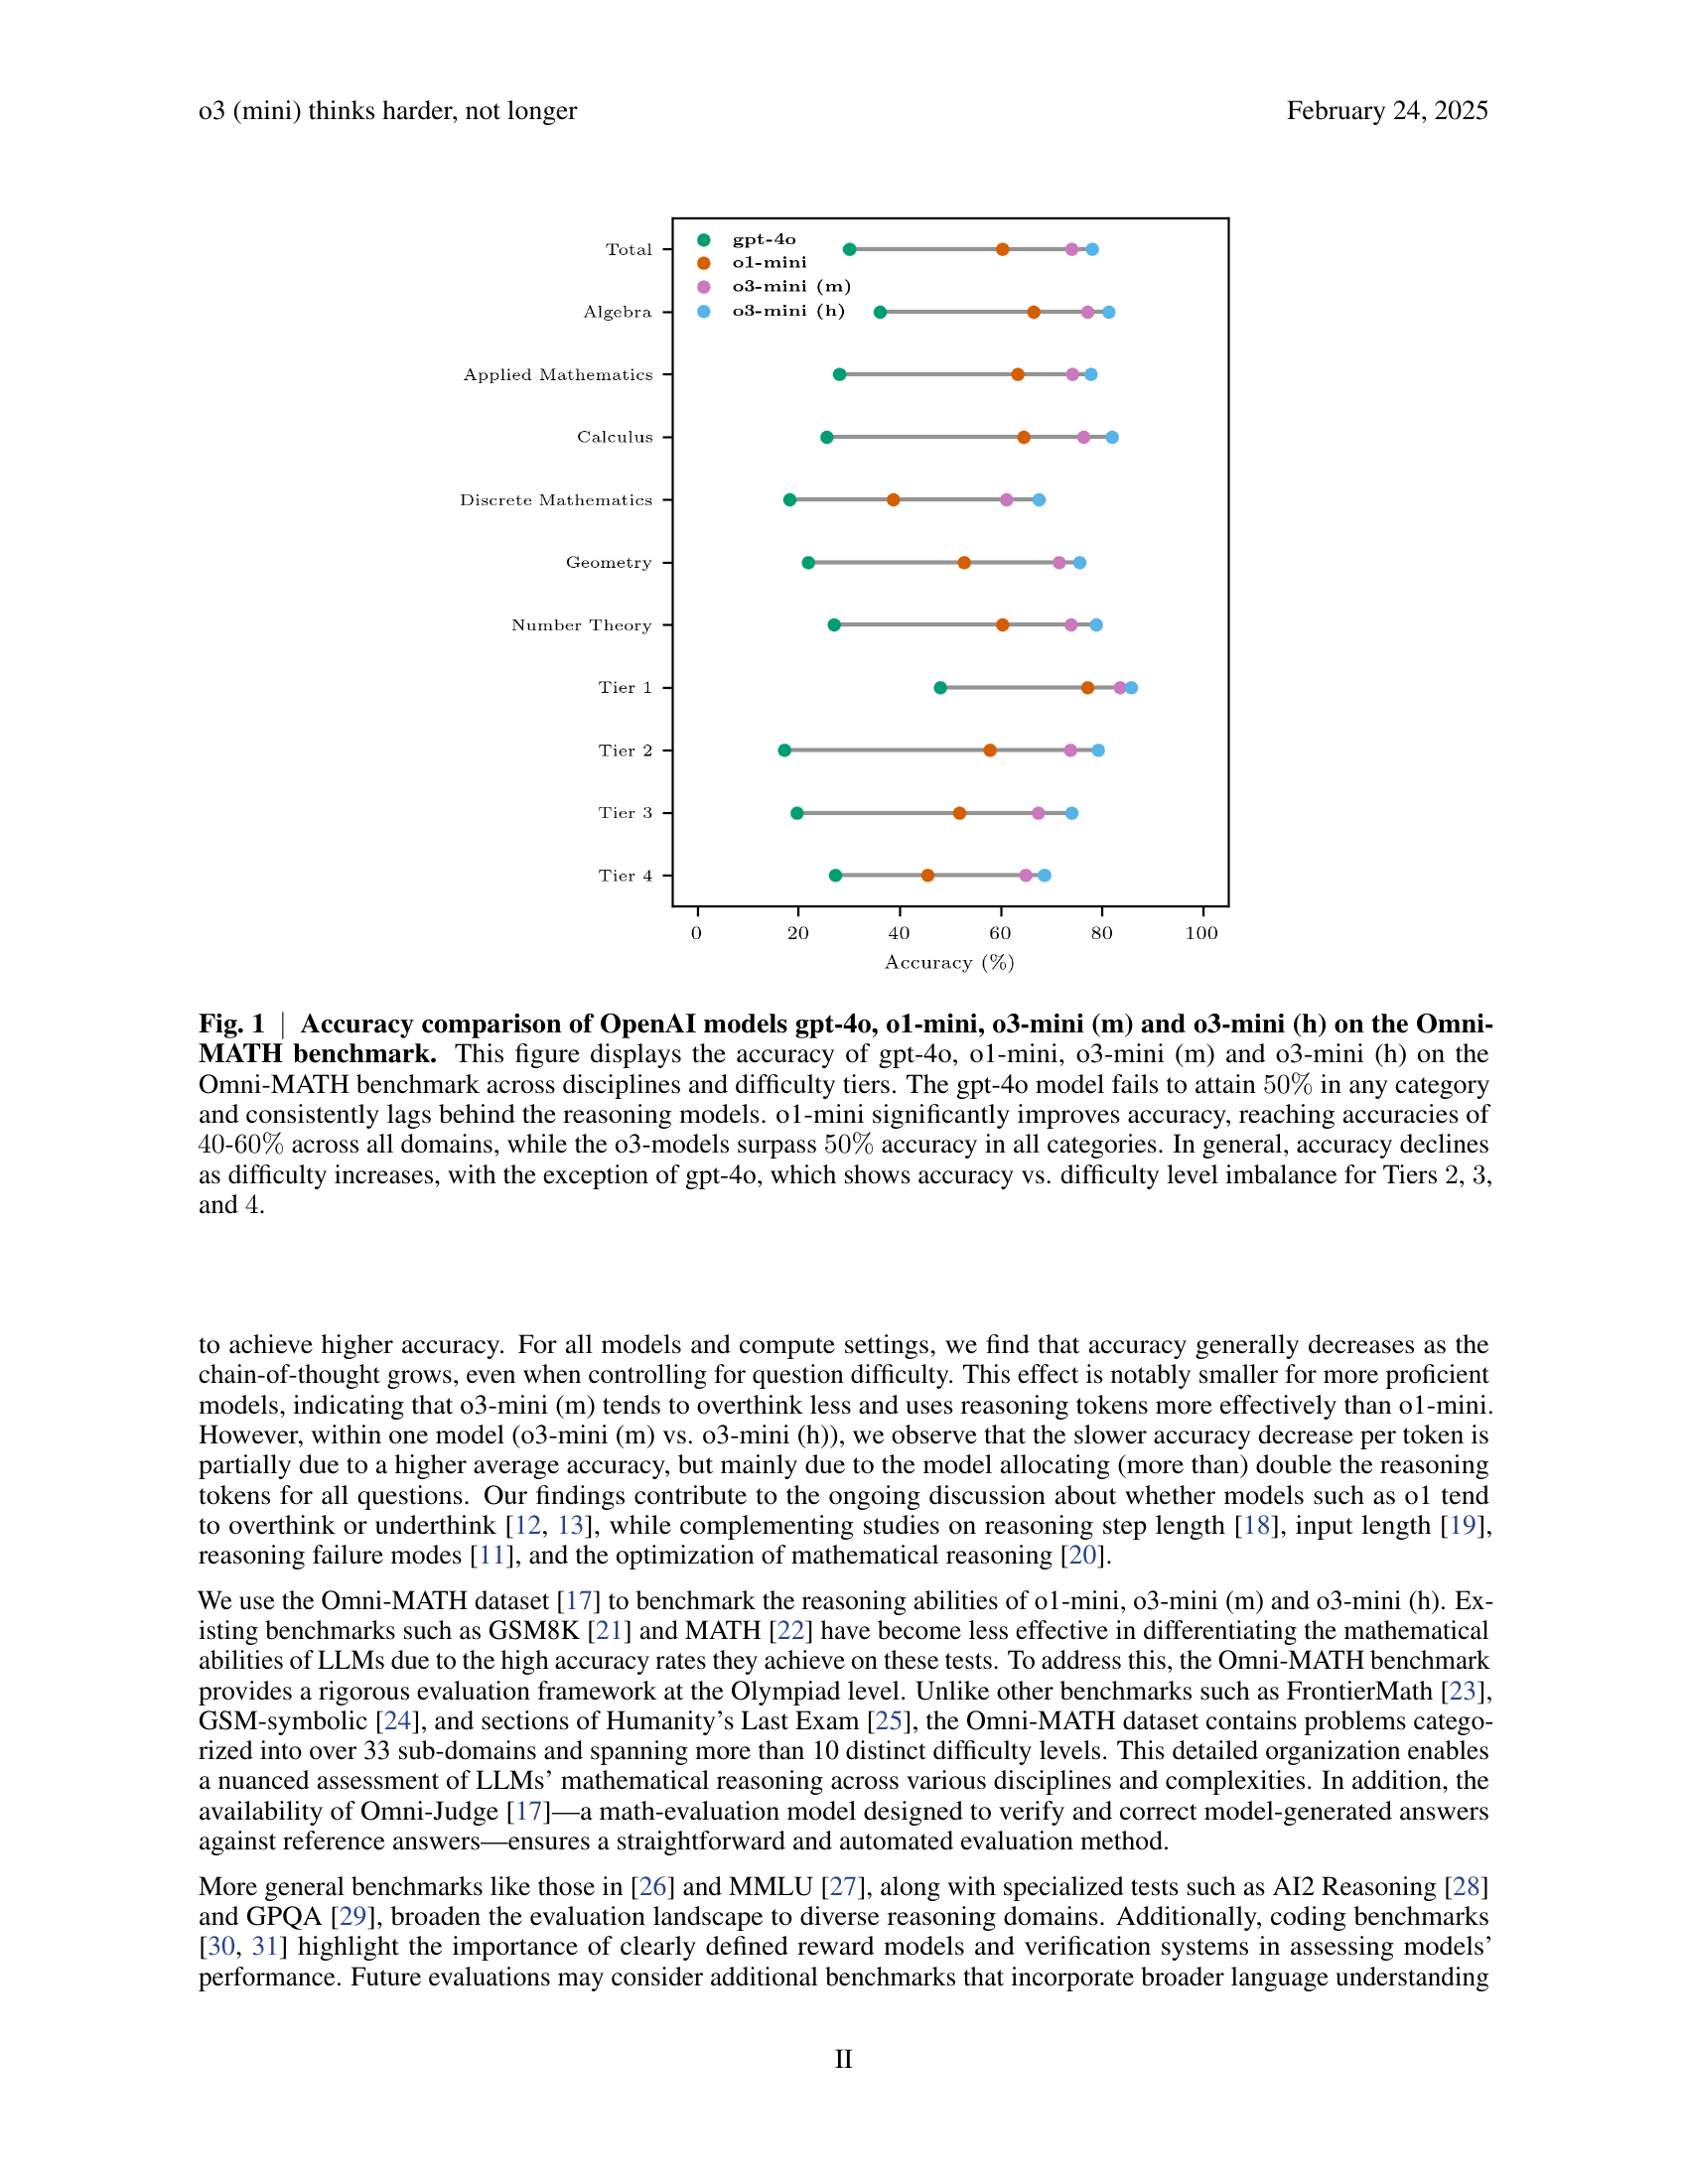
🔼 Figure 2 presents a detailed analysis of the performance and reasoning token usage of four different language models (gpt-40, o1-mini, o3-mini (m), and o3-mini (h)) on the Omni-MATH benchmark. The performance is broken down across various mathematical domains (Algebra, Applied Mathematics, Calculus, Discrete Mathematics, Geometry, and Number Theory) and difficulty levels (Tiers 1-4). Heatmaps effectively visualize the accuracy (0-100%) for each model within each domain and difficulty tier, with the color intensity of the bar representing the accuracy level. The length of each bar also indicates the relative amount of reasoning tokens used by each model for that specific problem. Averages across domains and difficulty tiers are calculated and displayed to give equal weight to multi-domain questions, providing a more comprehensive overview. The figure highlights that models tend to allocate more computational resources to problems requiring complex reasoning (like Geometry, Discrete Mathematics, and Number Theory), while simpler problems (Algebra and arithmetic) require fewer resources. It is also shown that, on average, the number of tokens used increases as the problem difficulty increases.
read the caption
Fig. 2: Granular performance and reasoning token usage evaluation across domains and difficulty tiers of gpt-4o, o1-mini, o3-mini (m) and o3-mini (h) on the Omni-MATH benchmark. The heatmaps visualize cross-sectional performance scores on a 00-100%percent100100\%100 % scale, represented by the color of the progress bar. The length of the progress bar in each cell represents relative token usage for the test-time scaled models. The extra column is computed by averaging over the rows. The extra row and “average” cell are computed independently to give equal weight to multi-domain questions (see Methods). This figure shows that models allocate more computational resources to problems that require complex combinatorial reasoning (Geometry, Discrete Mathematics and Number Theory), whereas foundational arithmetic and algebra problems demand relatively fewer resources. On average, token usage scales with difficulty level.
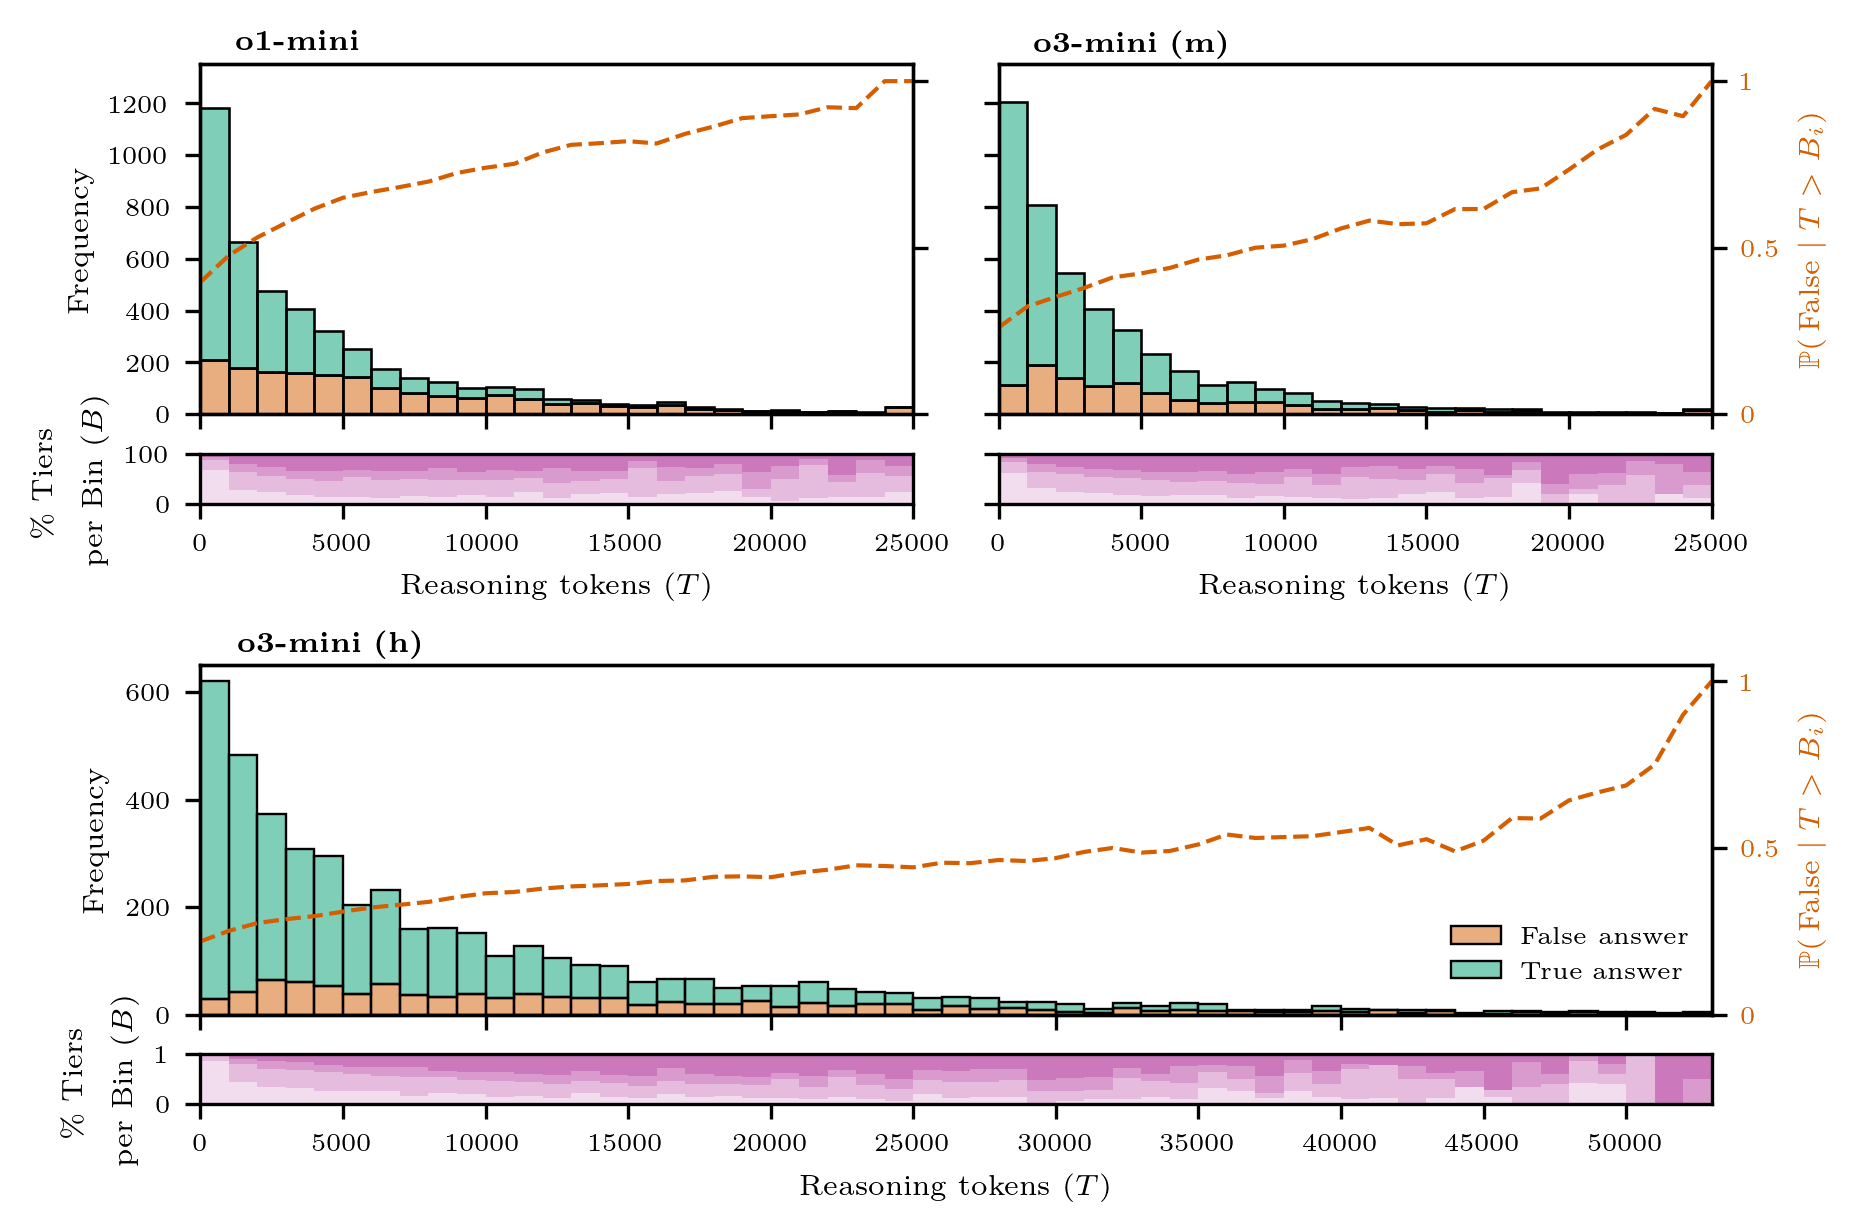
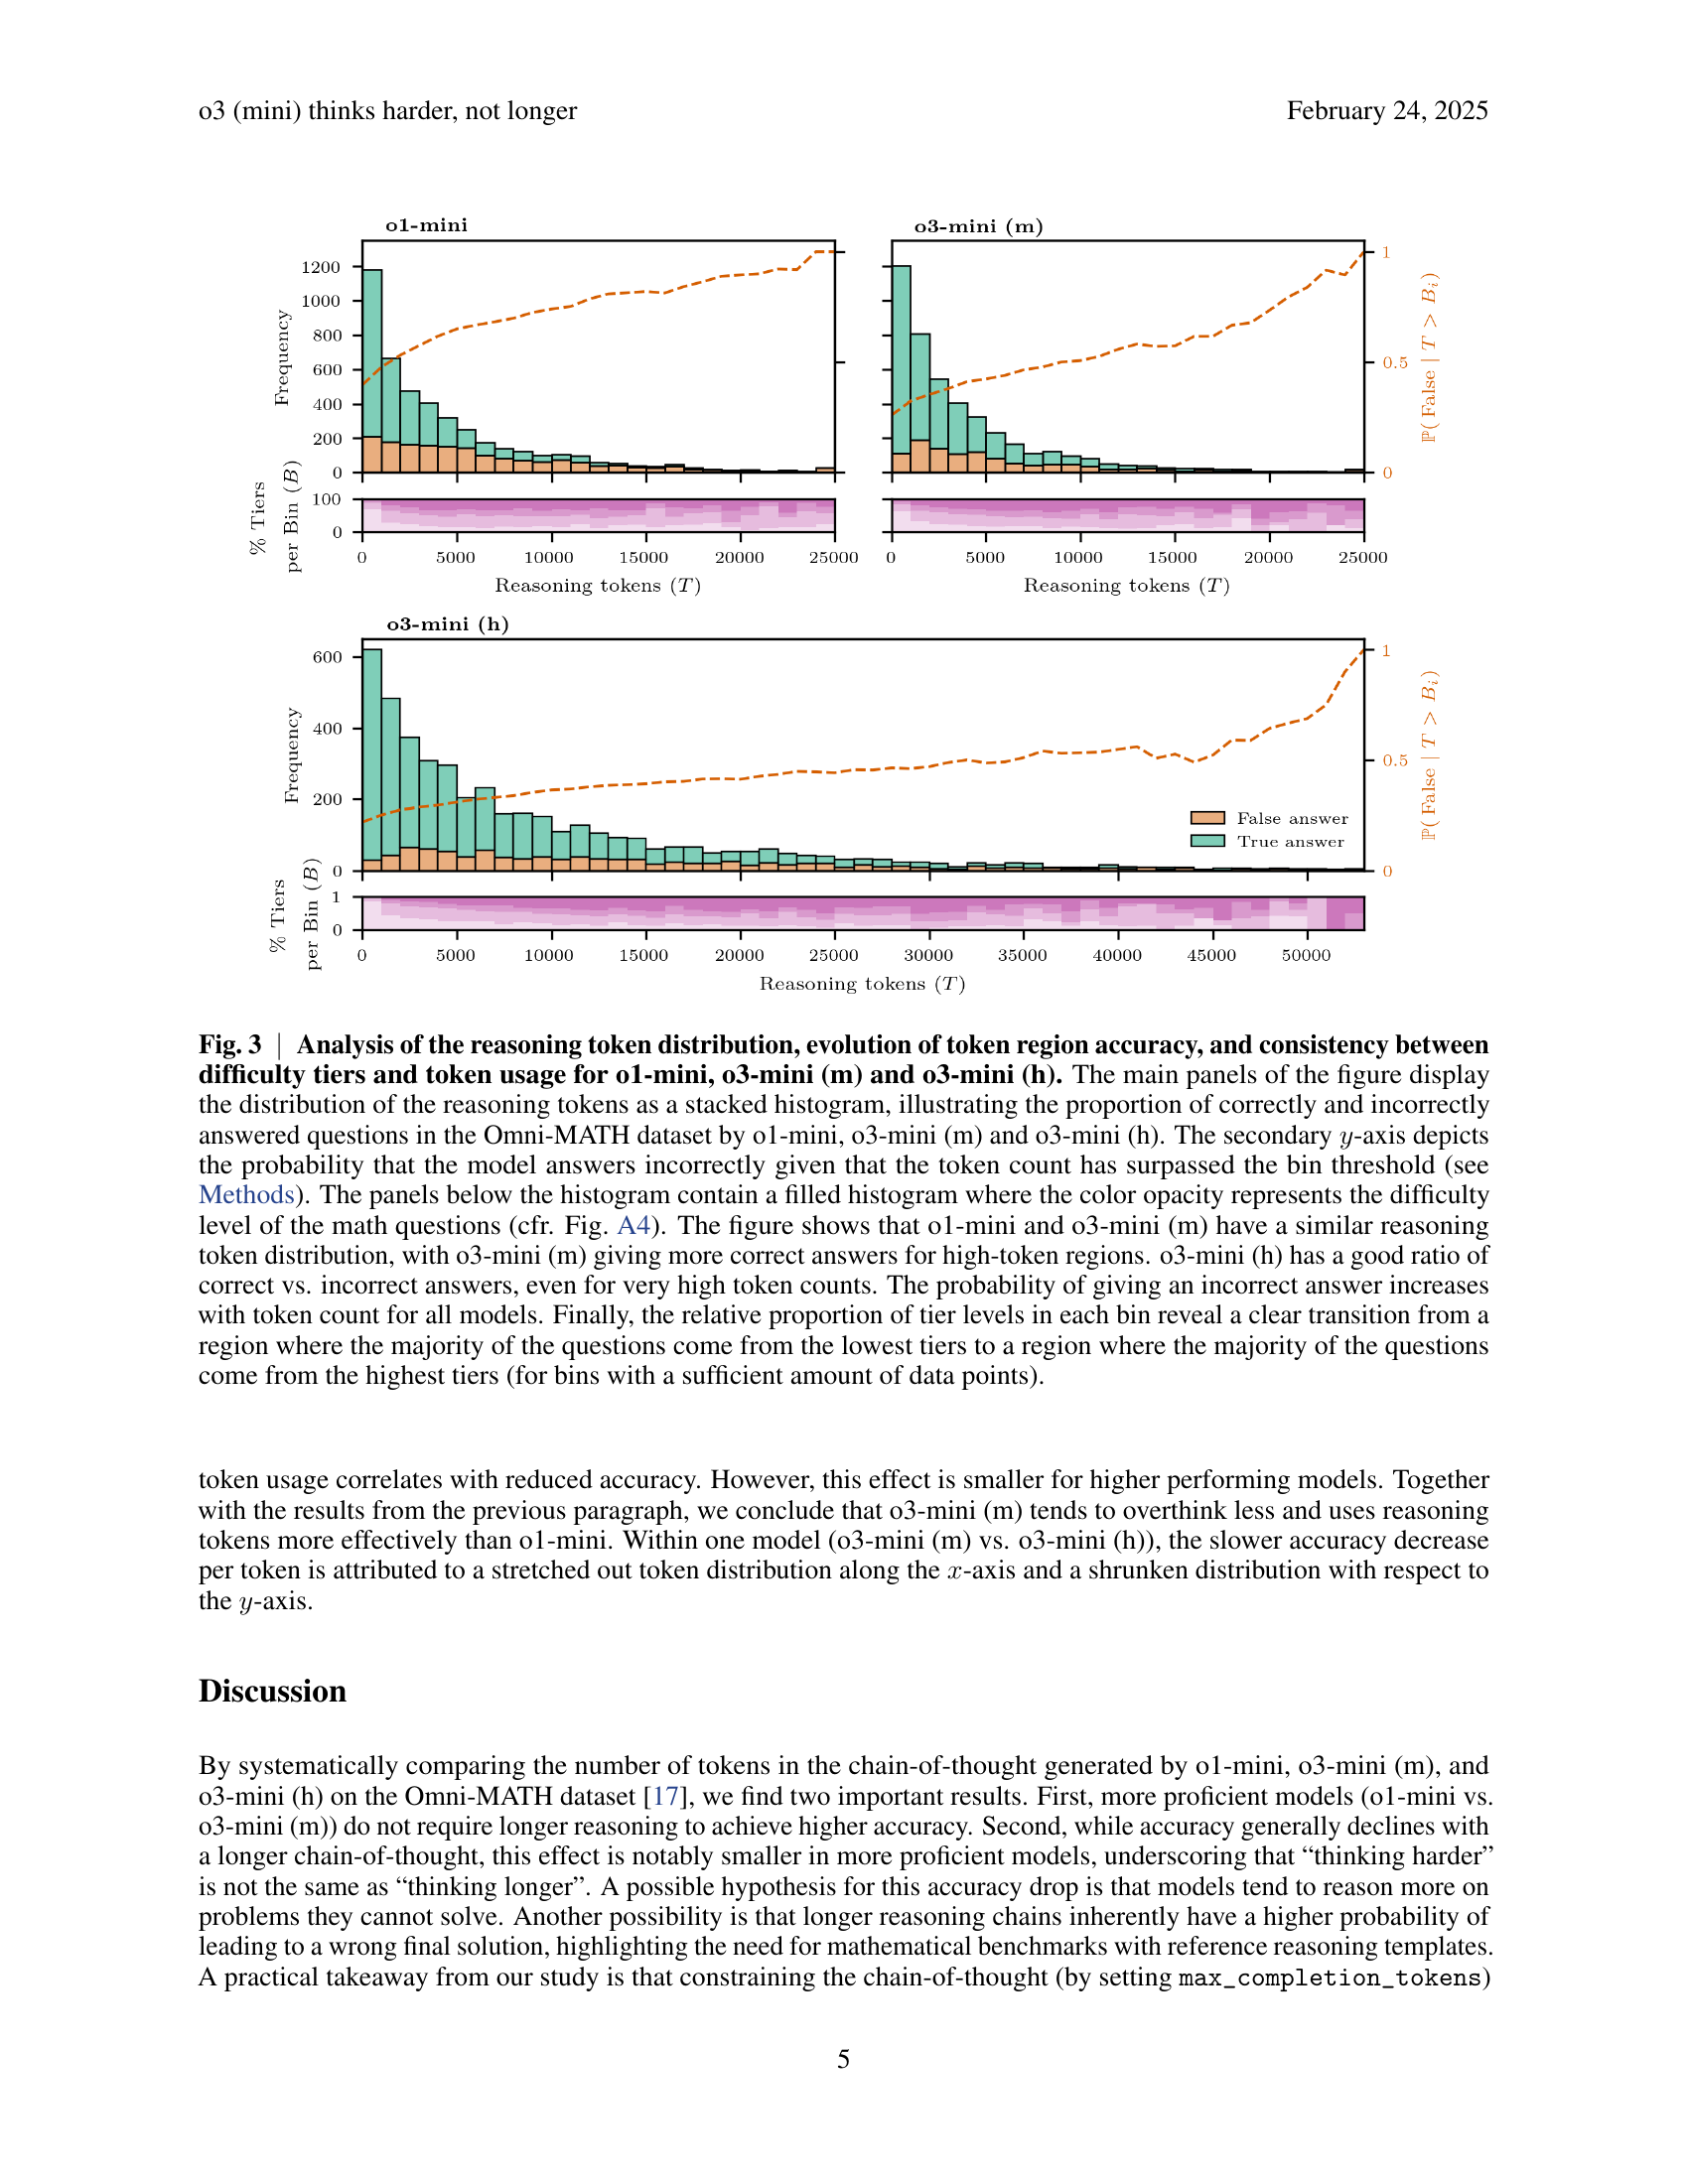
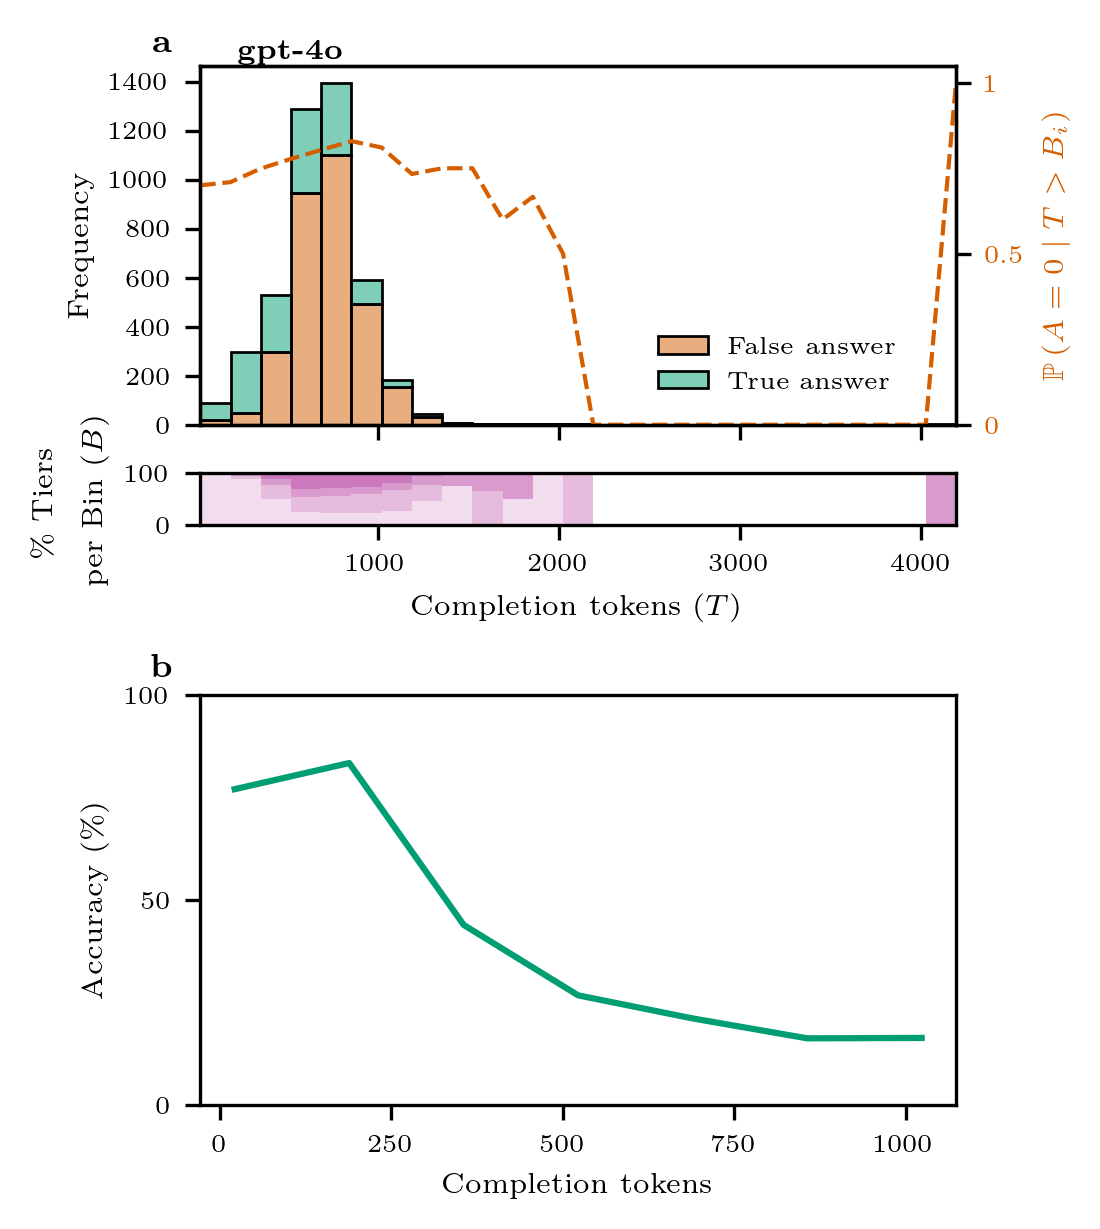
🔼 Figure 3 analyzes the distribution of reasoning tokens used by three OpenAI language models (o1-mini, o3-mini (m), and o3-mini (h)) when solving math problems from the Omni-MATH dataset. The main part shows stacked histograms for each model, separating correct and incorrect answers based on the number of reasoning tokens used. A secondary y-axis displays the probability of an incorrect answer given a certain token count. The lower panels show the distribution of question difficulty levels within each token range, visually demonstrating how higher token counts correlate with more difficult problems. The analysis reveals that o3-mini (m) and o1-mini have similar token distributions, but o3-mini (m) achieves higher accuracy with larger token counts. o3-mini (h), while exhibiting good accuracy even at very high token counts, utilizes significantly more tokens overall.
read the caption
Fig. 3: Analysis of the reasoning token distribution, evolution of token region accuracy, and consistency between difficulty tiers and token usage for o1-mini, o3-mini (m) and o3-mini (h). The main panels of the figure display the distribution of the reasoning tokens as a stacked histogram, illustrating the proportion of correctly and incorrectly answered questions in the Omni-MATH dataset by o1-mini, o3-mini (m) and o3-mini (h). The secondary y𝑦yitalic_y-axis depicts the probability that the model answers incorrectly given that the token count has surpassed the bin threshold (see Methods). The panels below the histogram contain a filled histogram where the color opacity represents the difficulty level of the math questions (cfr. Fig. A4). The figure shows that o1-mini and o3-mini (m) have a similar reasoning token distribution, with o3-mini (m) giving more correct answers for high-token regions. o3-mini (h) has a good ratio of correct vs. incorrect answers, even for very high token counts. The probability of giving an incorrect answer increases with token count for all models. Finally, the relative proportion of tier levels in each bin reveal a clear transition from a region where the majority of the questions come from the lowest tiers to a region where the majority of the questions come from the highest tiers (for bins with a sufficient amount of data points).

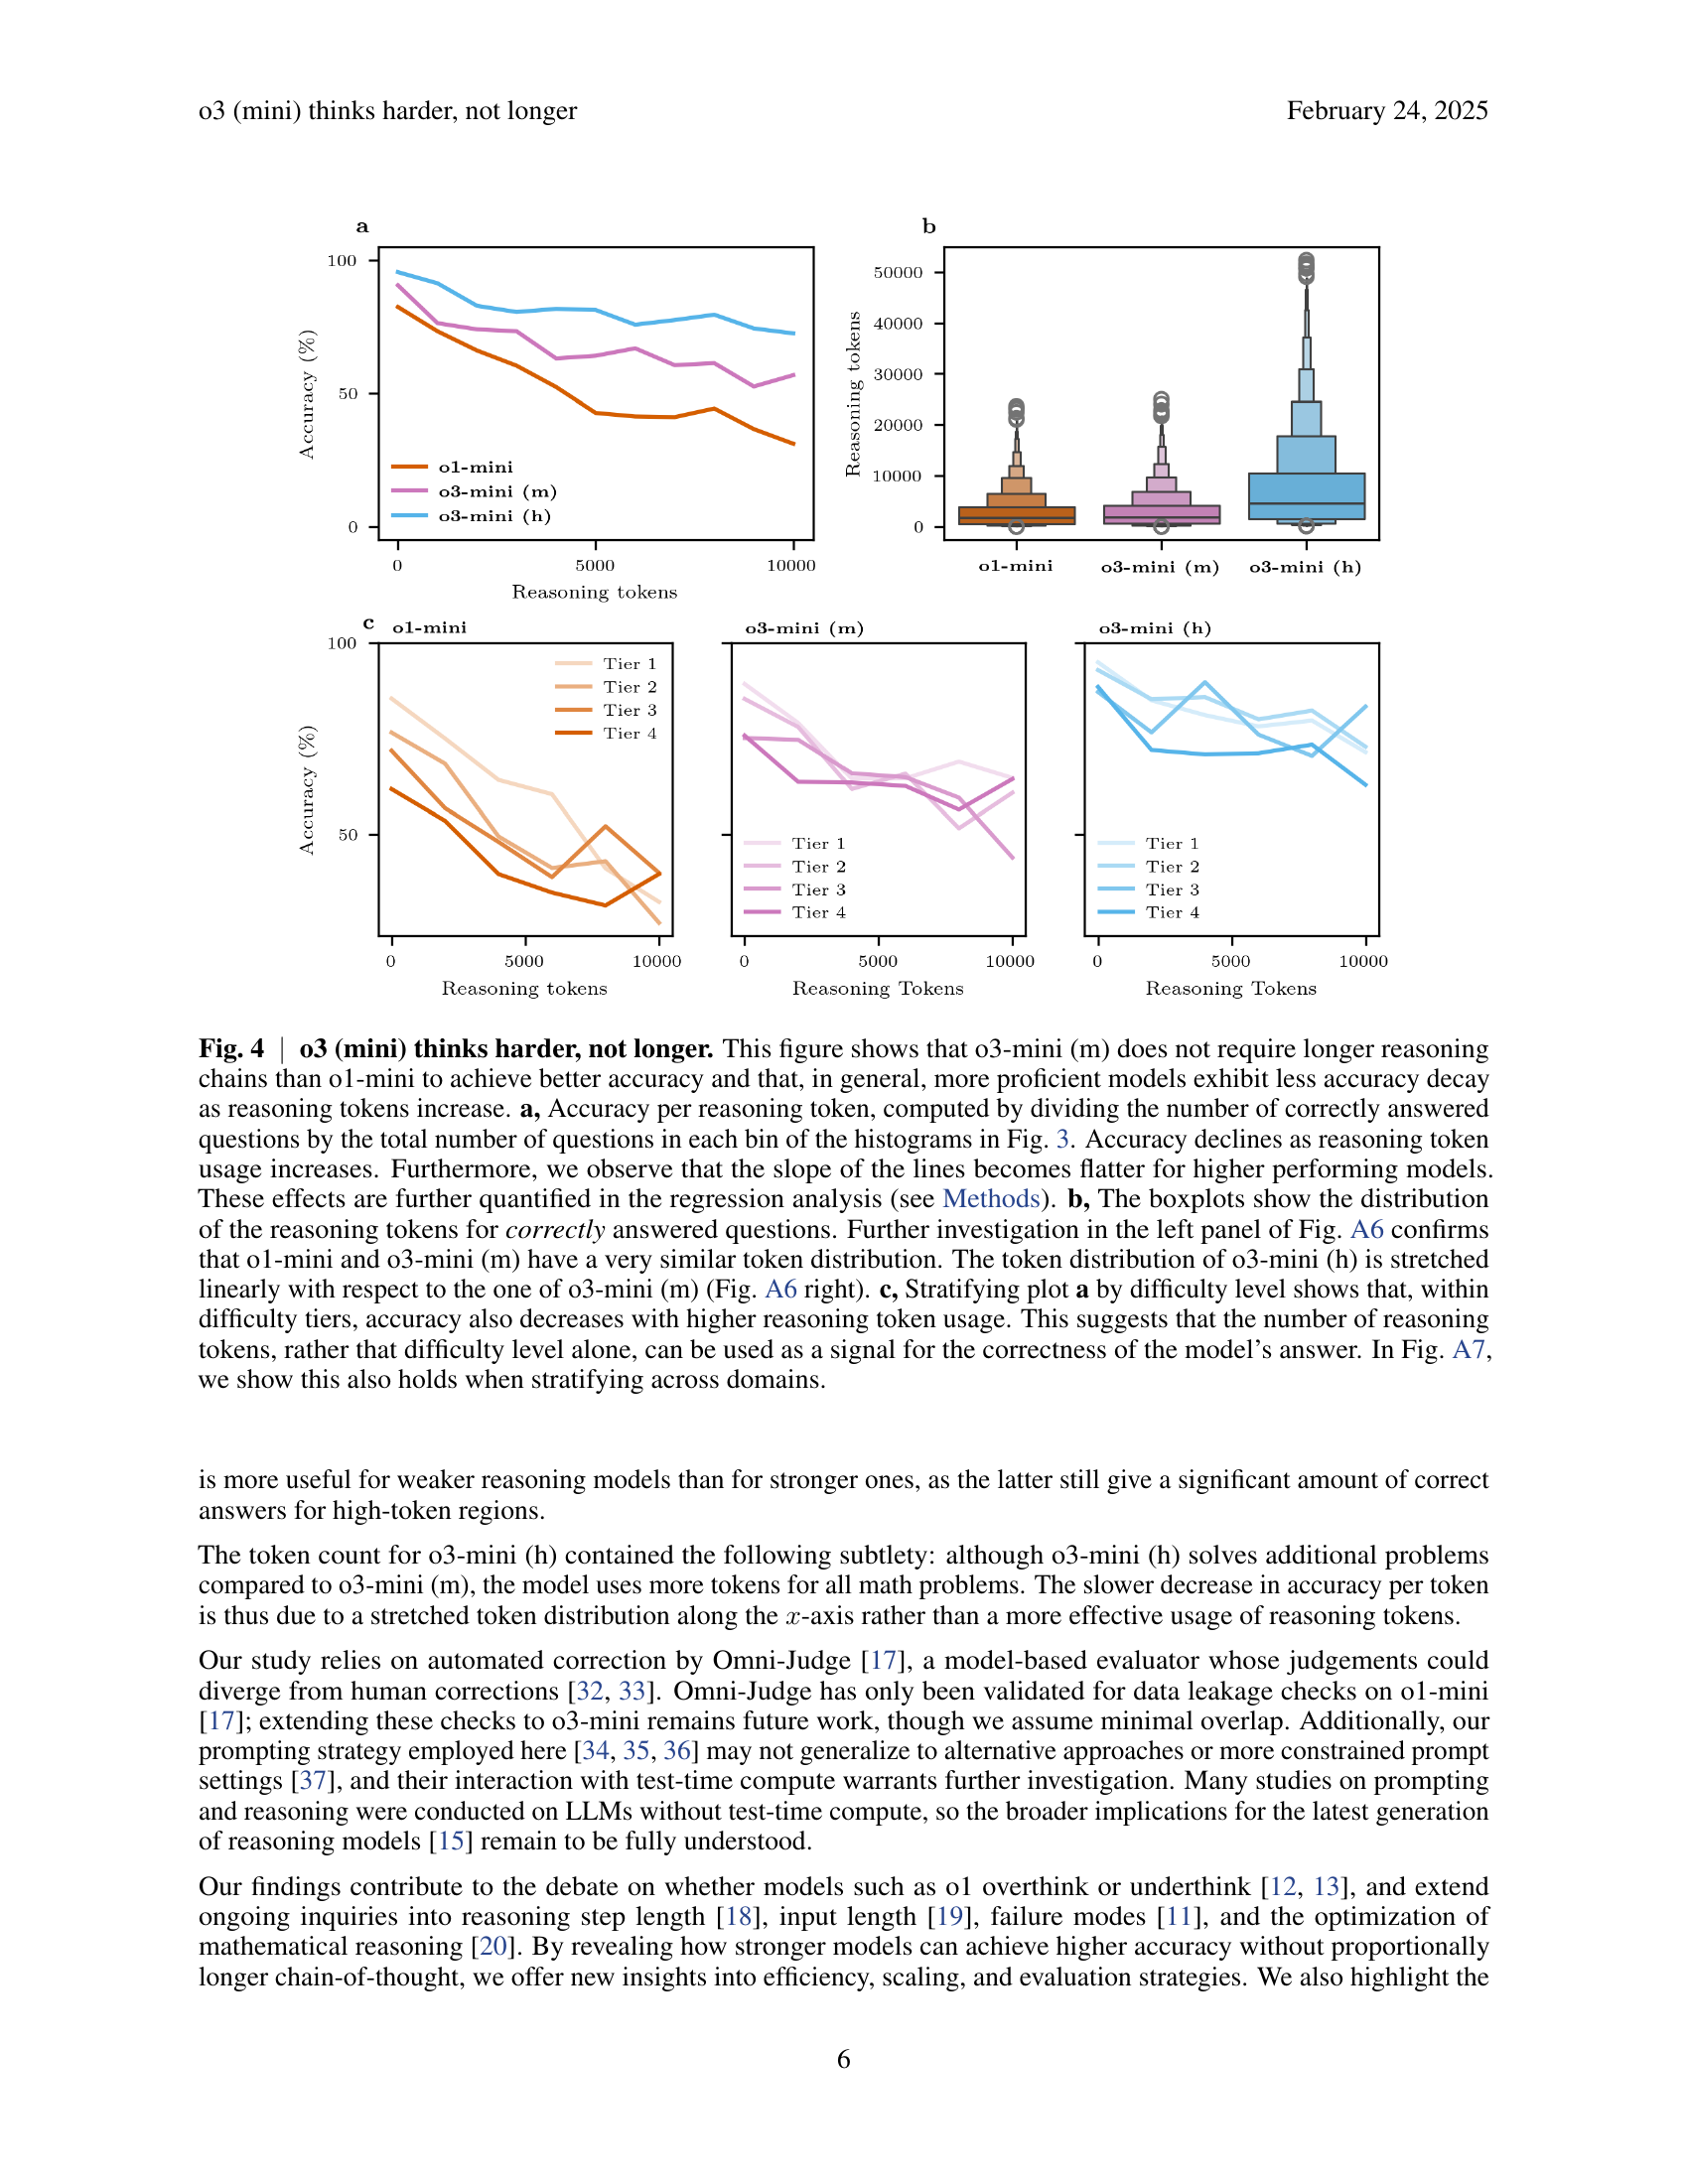
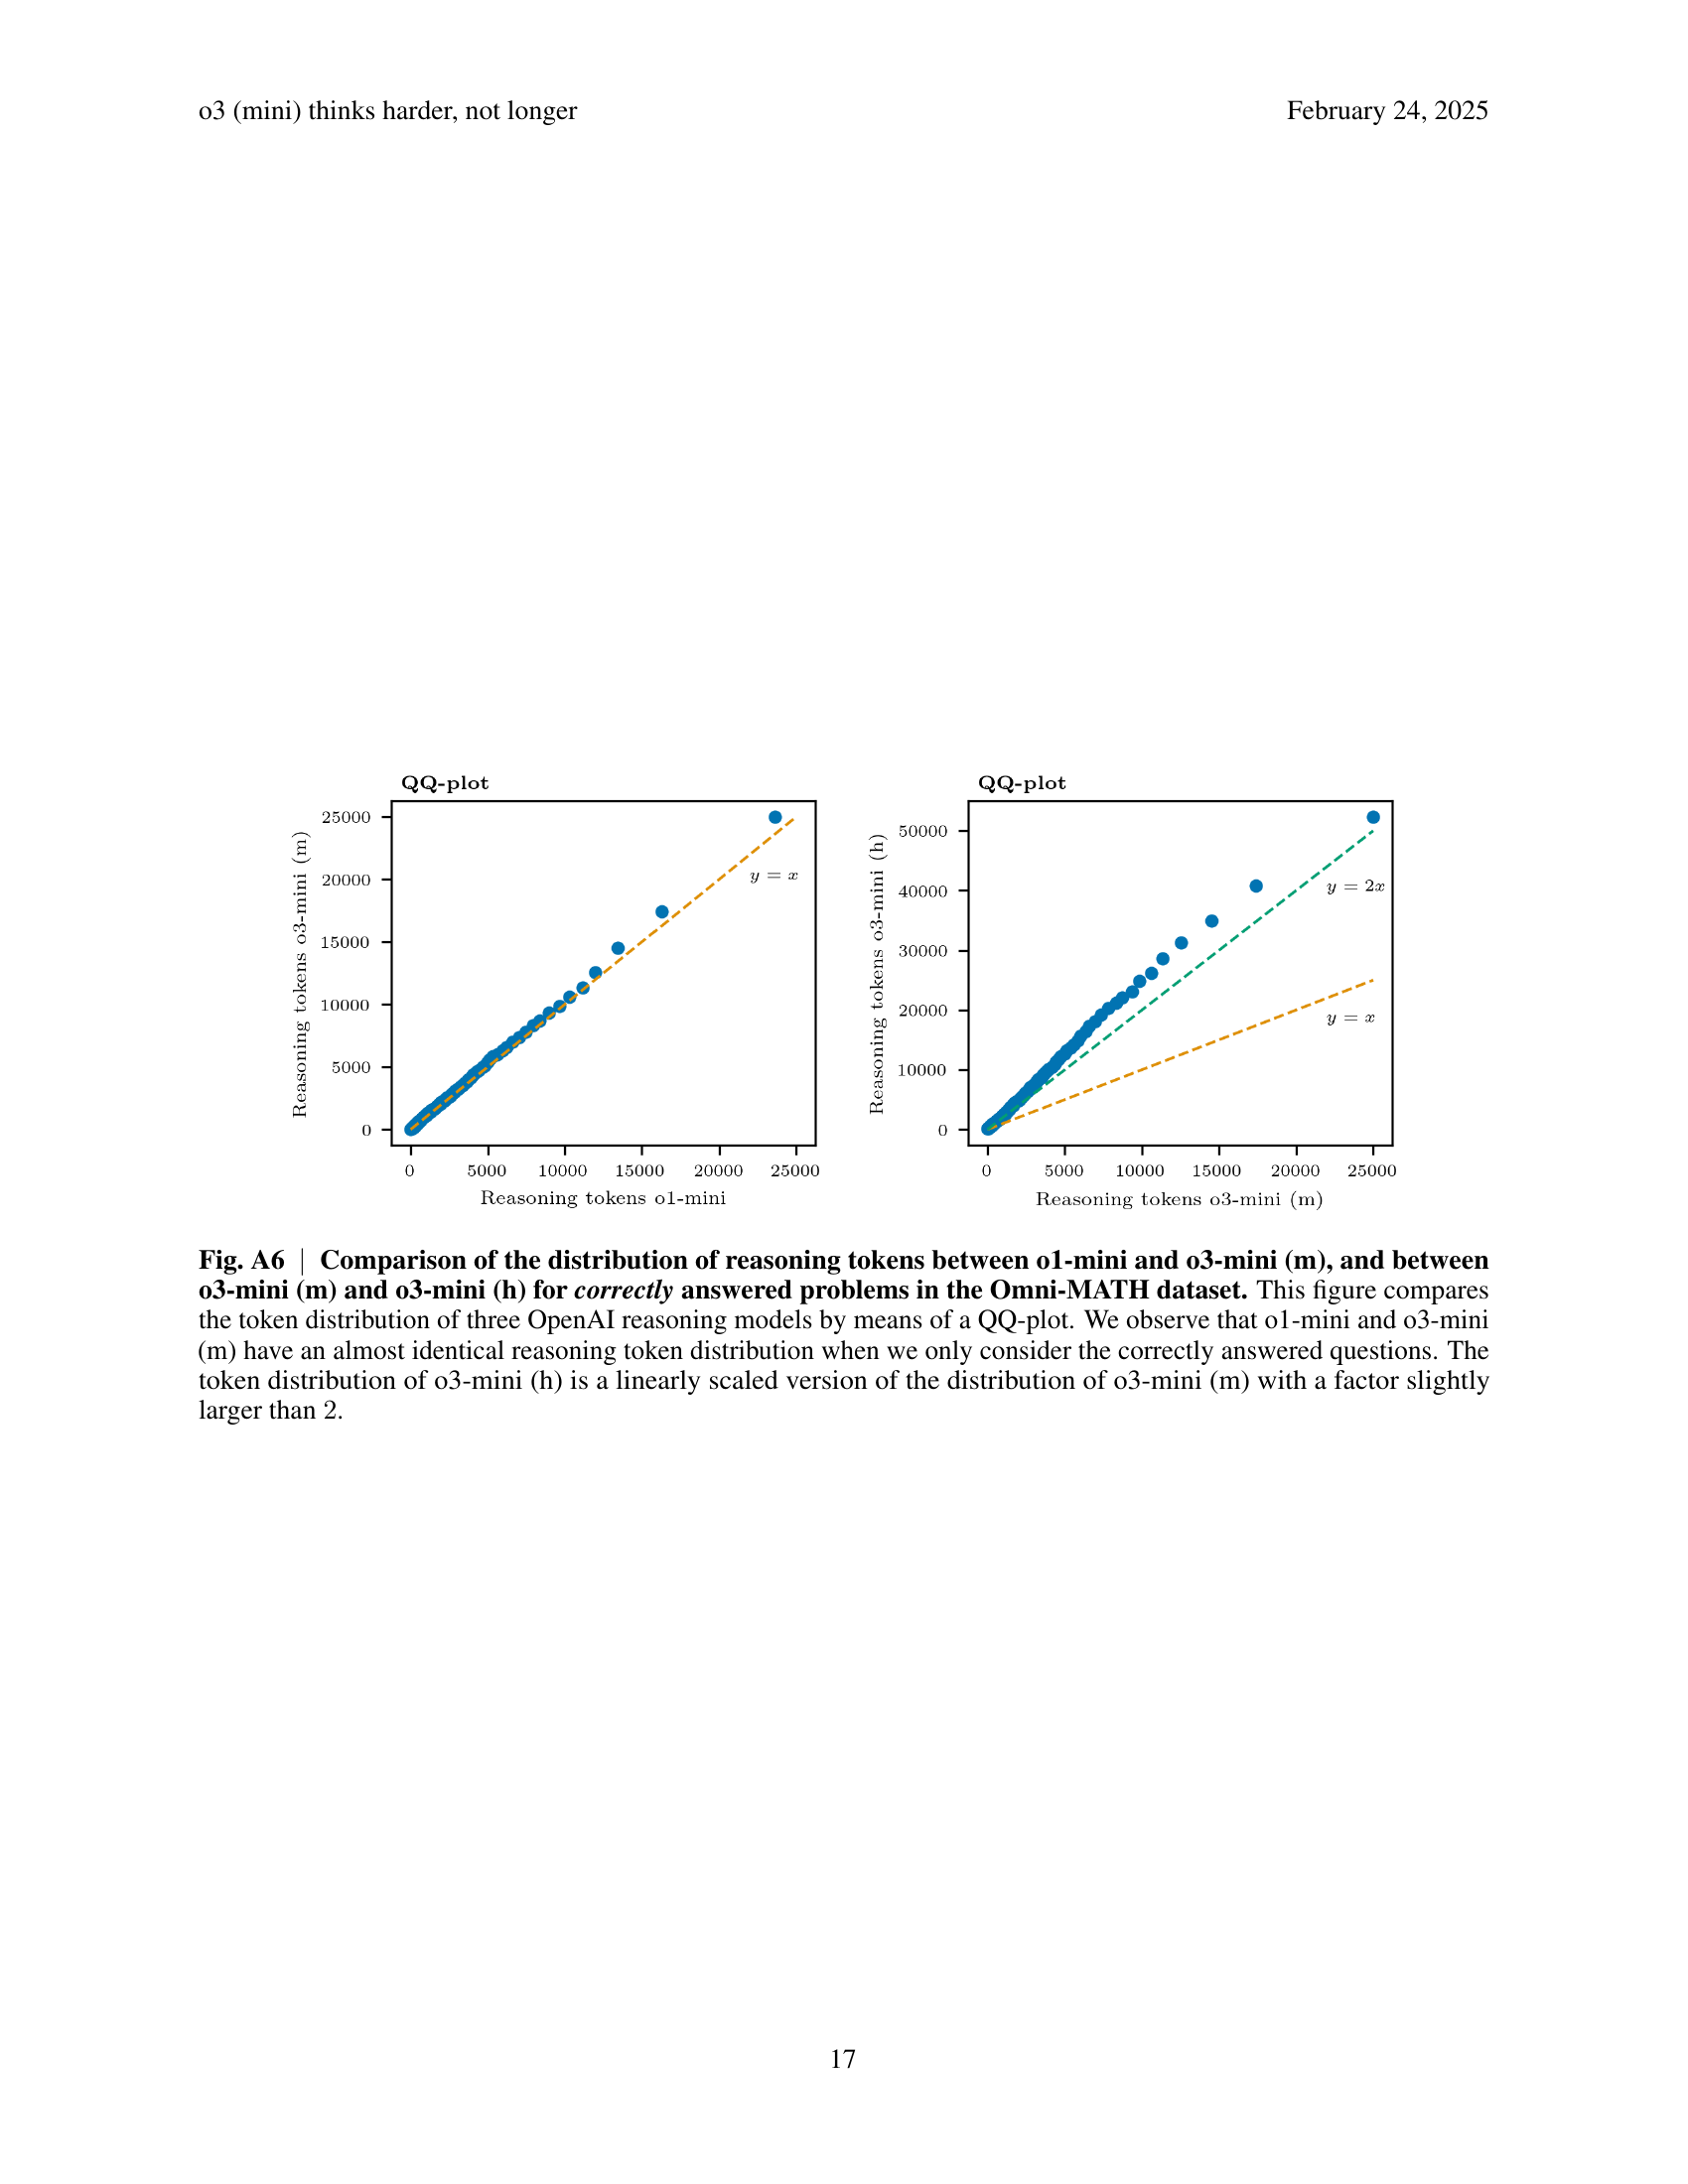
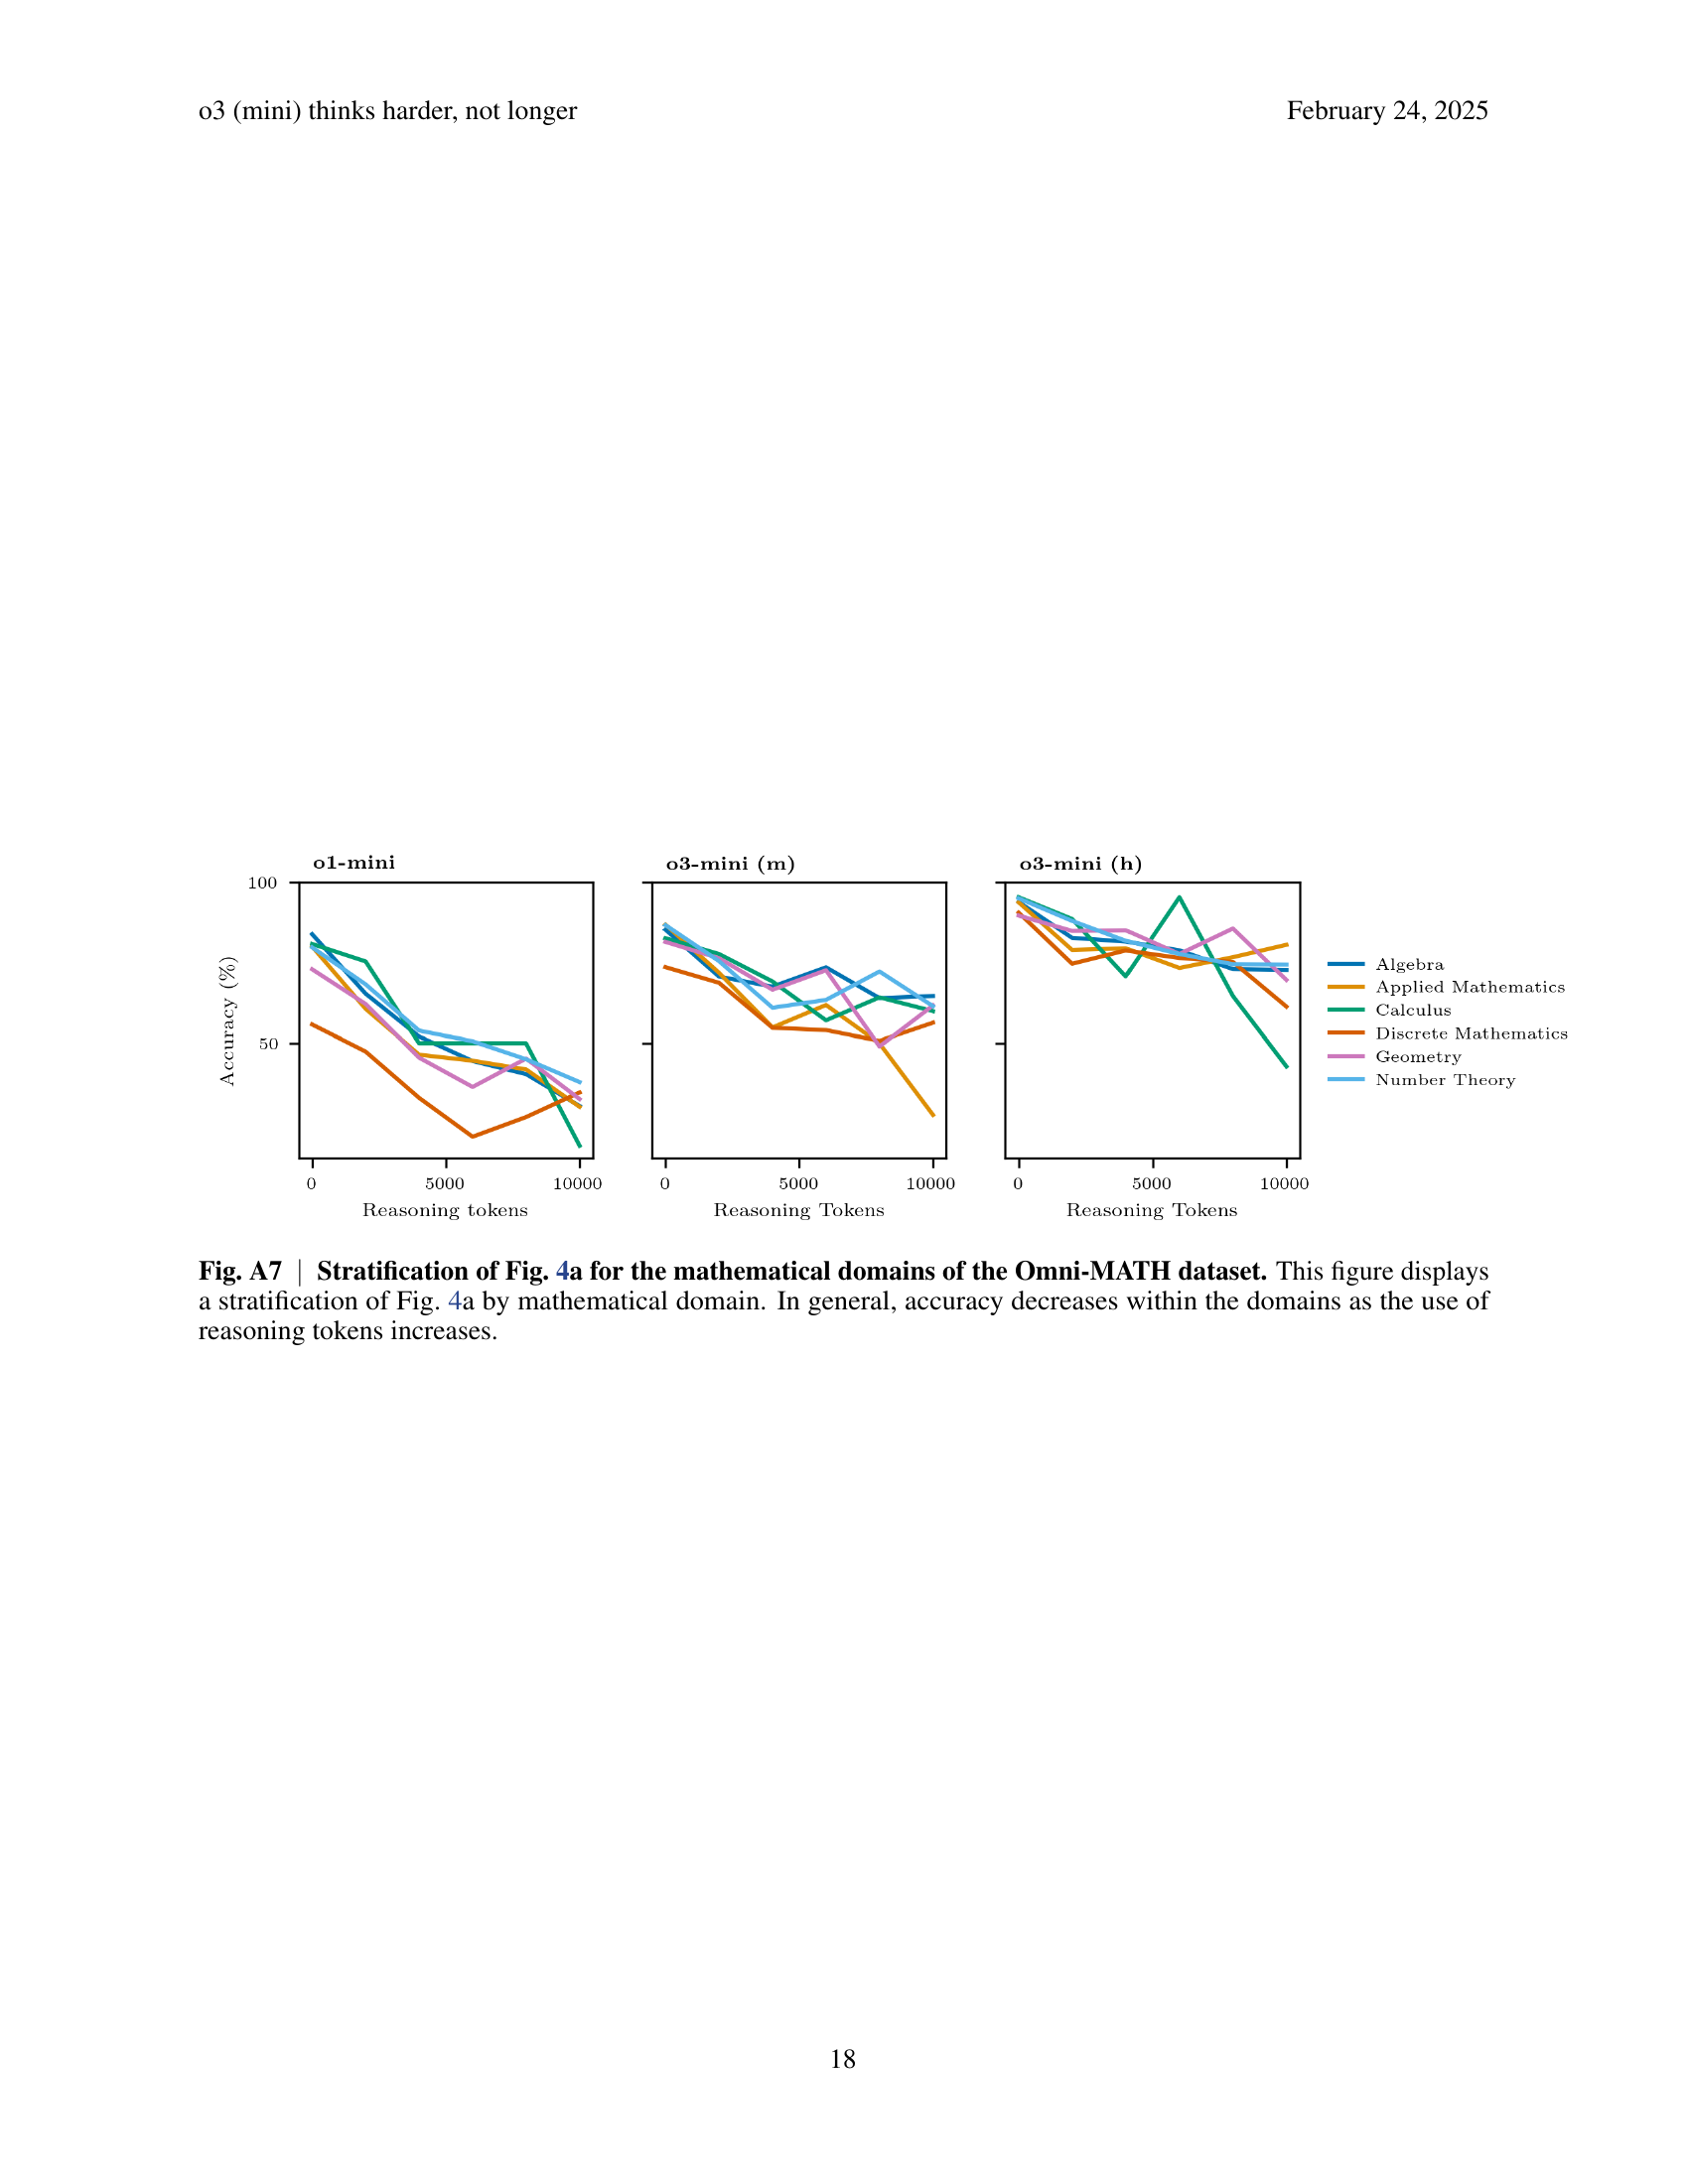
🔼 Figure 4 demonstrates that the o3-mini (m) model achieves higher accuracy without needing longer reasoning chains compared to the o1-mini model. Across all models, accuracy decreases as the number of reasoning tokens increases, but this decline is less steep for the more capable models. Panel (a) shows accuracy per reasoning token, illustrating this trend. Panel (b) compares the distributions of reasoning tokens used for correctly answered questions, revealing similar distributions for o1-mini and o3-mini (m), while o3-mini (h) uses significantly more tokens. Panel (c) shows that the negative relationship between accuracy and reasoning tokens persists even when considering different difficulty levels, suggesting reasoning token count may be a better indicator of model performance than problem difficulty alone. This observation is further supported by analysis in Figure A7.
read the caption
Fig. 4: o3 (mini) thinks harder, not longer. This figure shows that o3-mini (m) does not require longer reasoning chains than o1-mini to achieve better accuracy and that, in general, more proficient models exhibit less accuracy decay as reasoning tokens increase. a, Accuracy per reasoning token, computed by dividing the number of correctly answered questions by the total number of questions in each bin of the histograms in Fig. 3. Accuracy declines as reasoning token usage increases. Furthermore, we observe that the slope of the lines becomes flatter for higher performing models. These effects are further quantified in the regression analysis (see Methods). b, The boxplots show the distribution of the reasoning tokens for correctly answered questions. Further investigation in the left panel of Fig. A6 confirms that o1-mini and o3-mini (m) have a very similar token distribution. The token distribution of o3-mini (h) is stretched linearly with respect to the one of o3-mini (m) (Fig. A6 right). c, Stratifying plot a by difficulty level shows that, within difficulty tiers, accuracy also decreases with higher reasoning token usage. This suggests that the number of reasoning tokens, rather that difficulty level alone, can be used as a signal for the correctness of the model’s answer. In Fig. A7, we show this also holds when stratifying across domains.
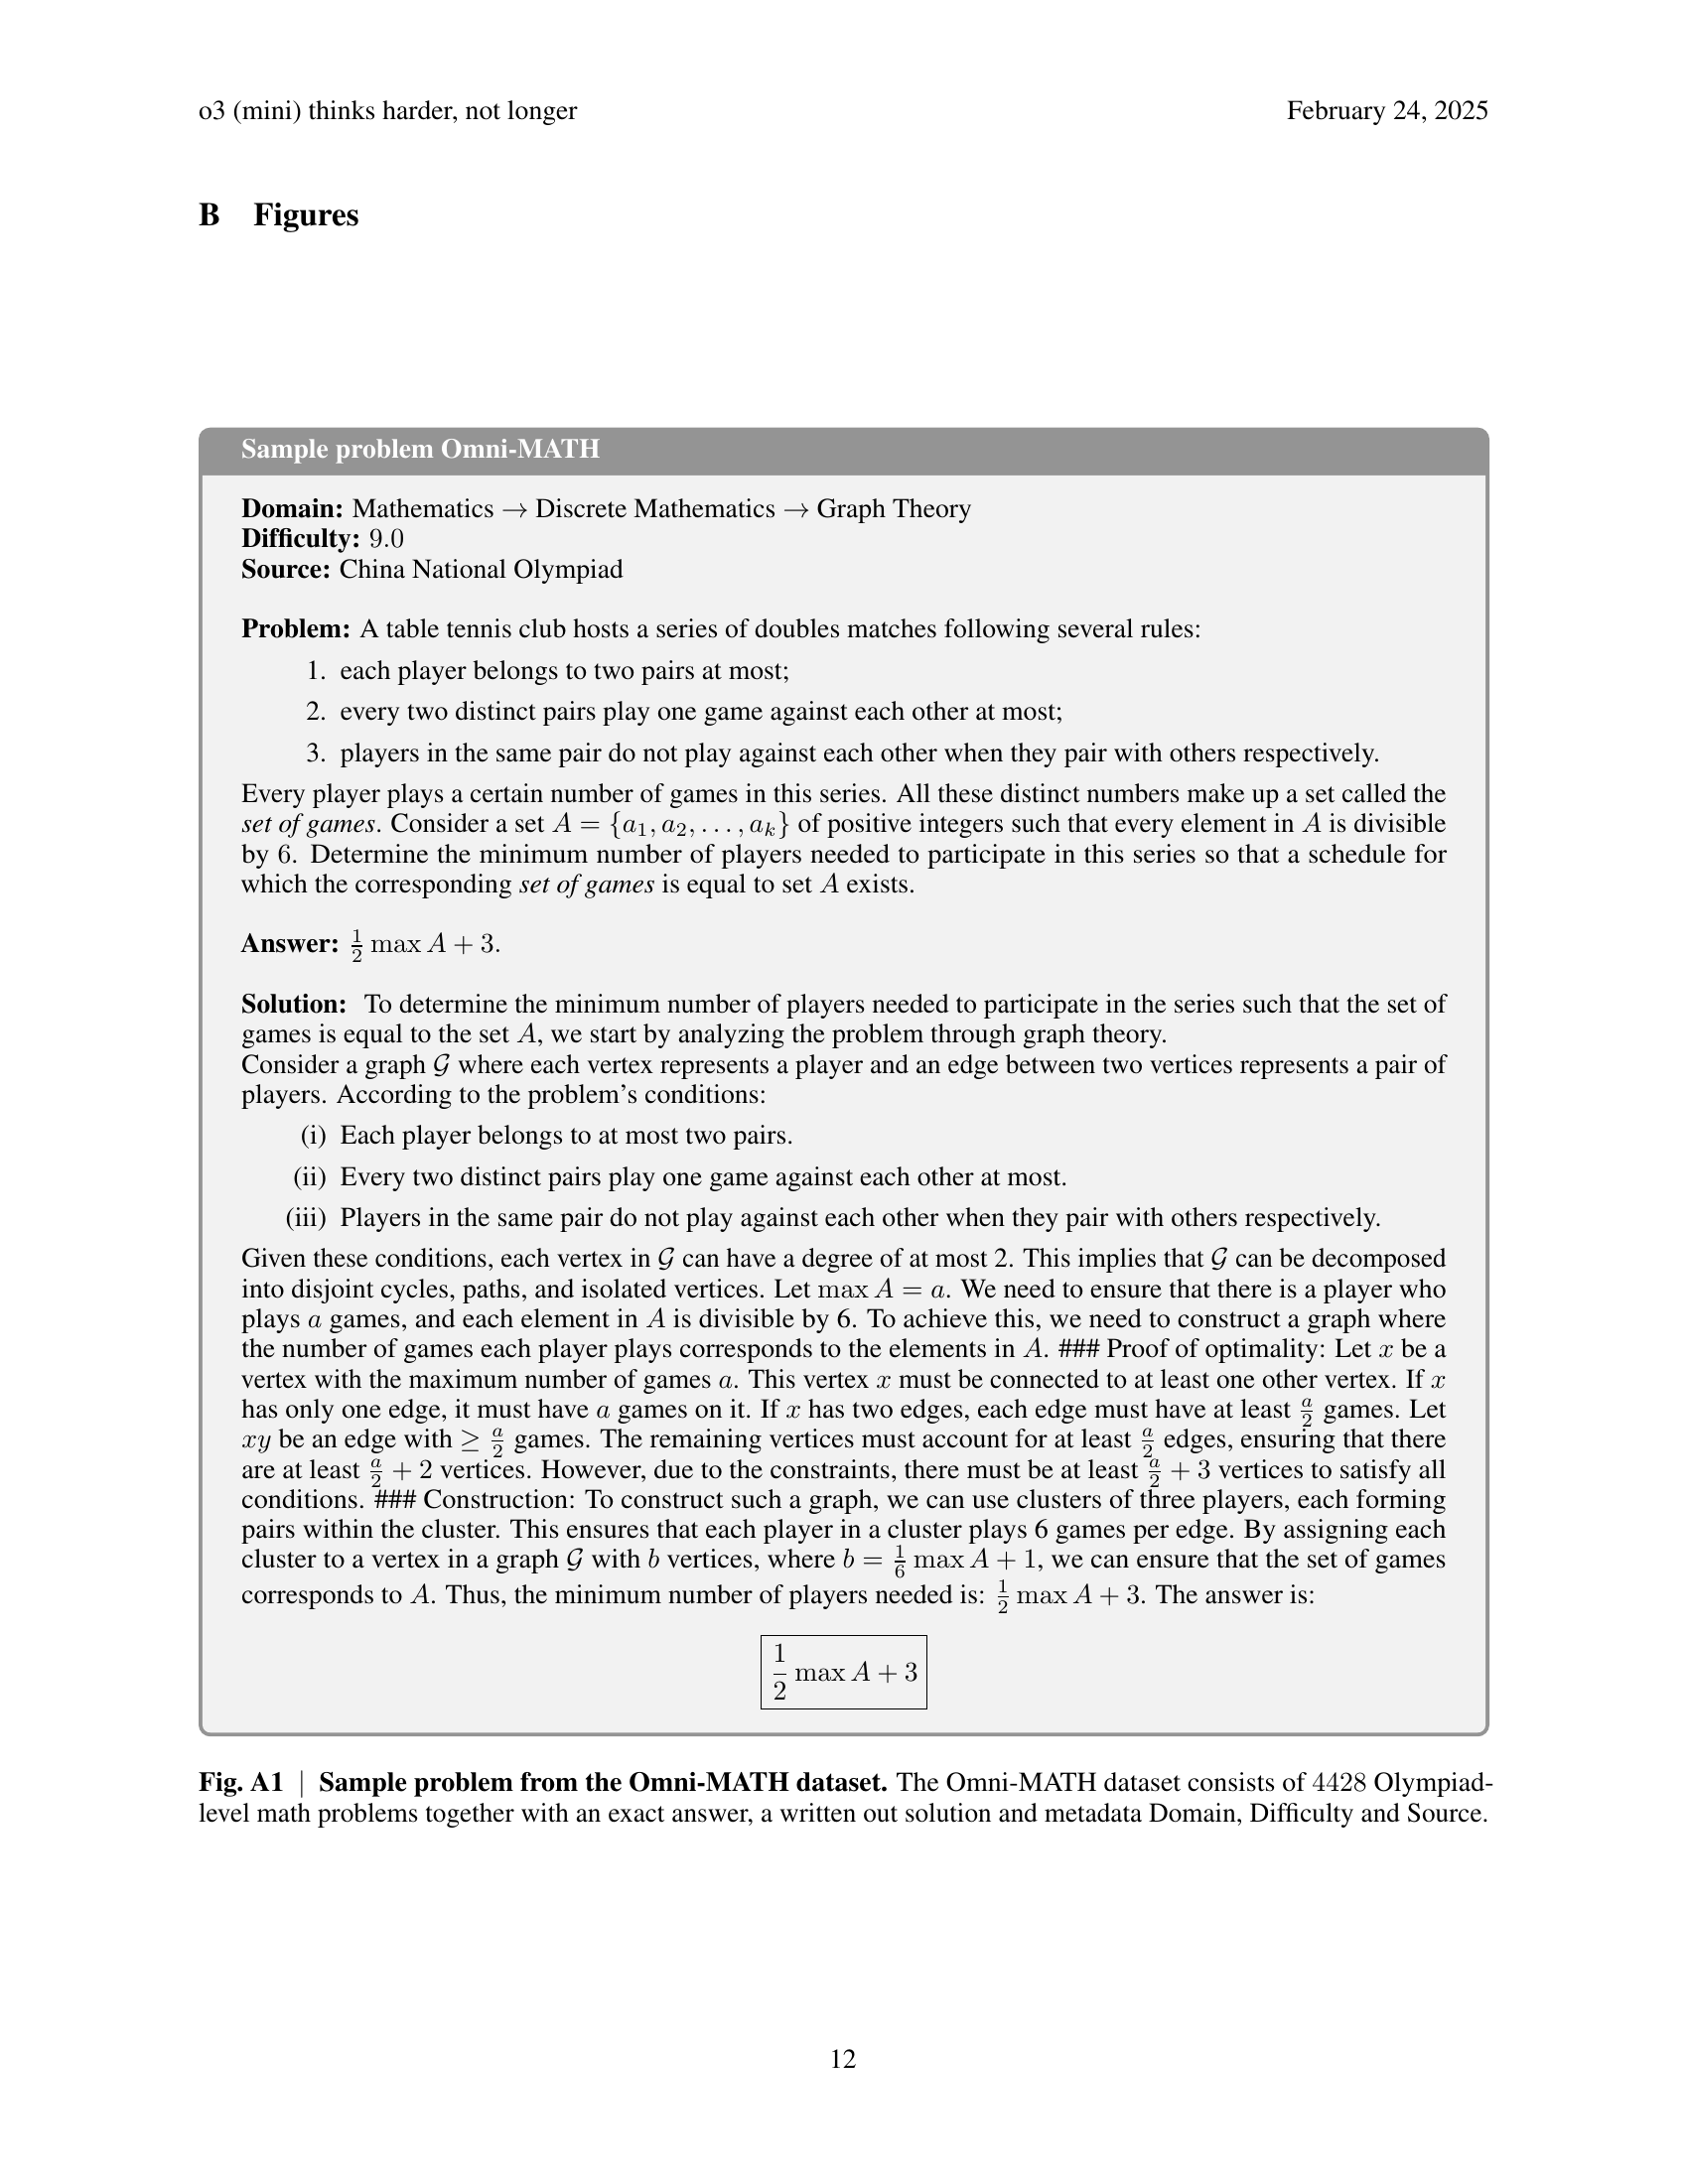
🔼 Figure A1 displays a sample problem from the Omni-MATH dataset. The figure showcases the problem’s statement, solution, and metadata. The metadata includes the problem’s domain (Discrete Mathematics -> Graph Theory), difficulty level (9.0), and source (China National Olympiad). This exemplifies the structure and content of the 4428 Olympiad-level math problems within the Omni-MATH dataset. Each problem in the dataset is accompanied by its exact answer, a complete solution, and metadata such as domain, difficulty level, and source.
read the caption
Fig. A1: Sample problem from the Omni-MATH dataset. The Omni-MATH dataset consists of 4428442844284428 Olympiad-level math problems together with an exact answer, a written out solution and metadata Domain, Difficulty and Source.
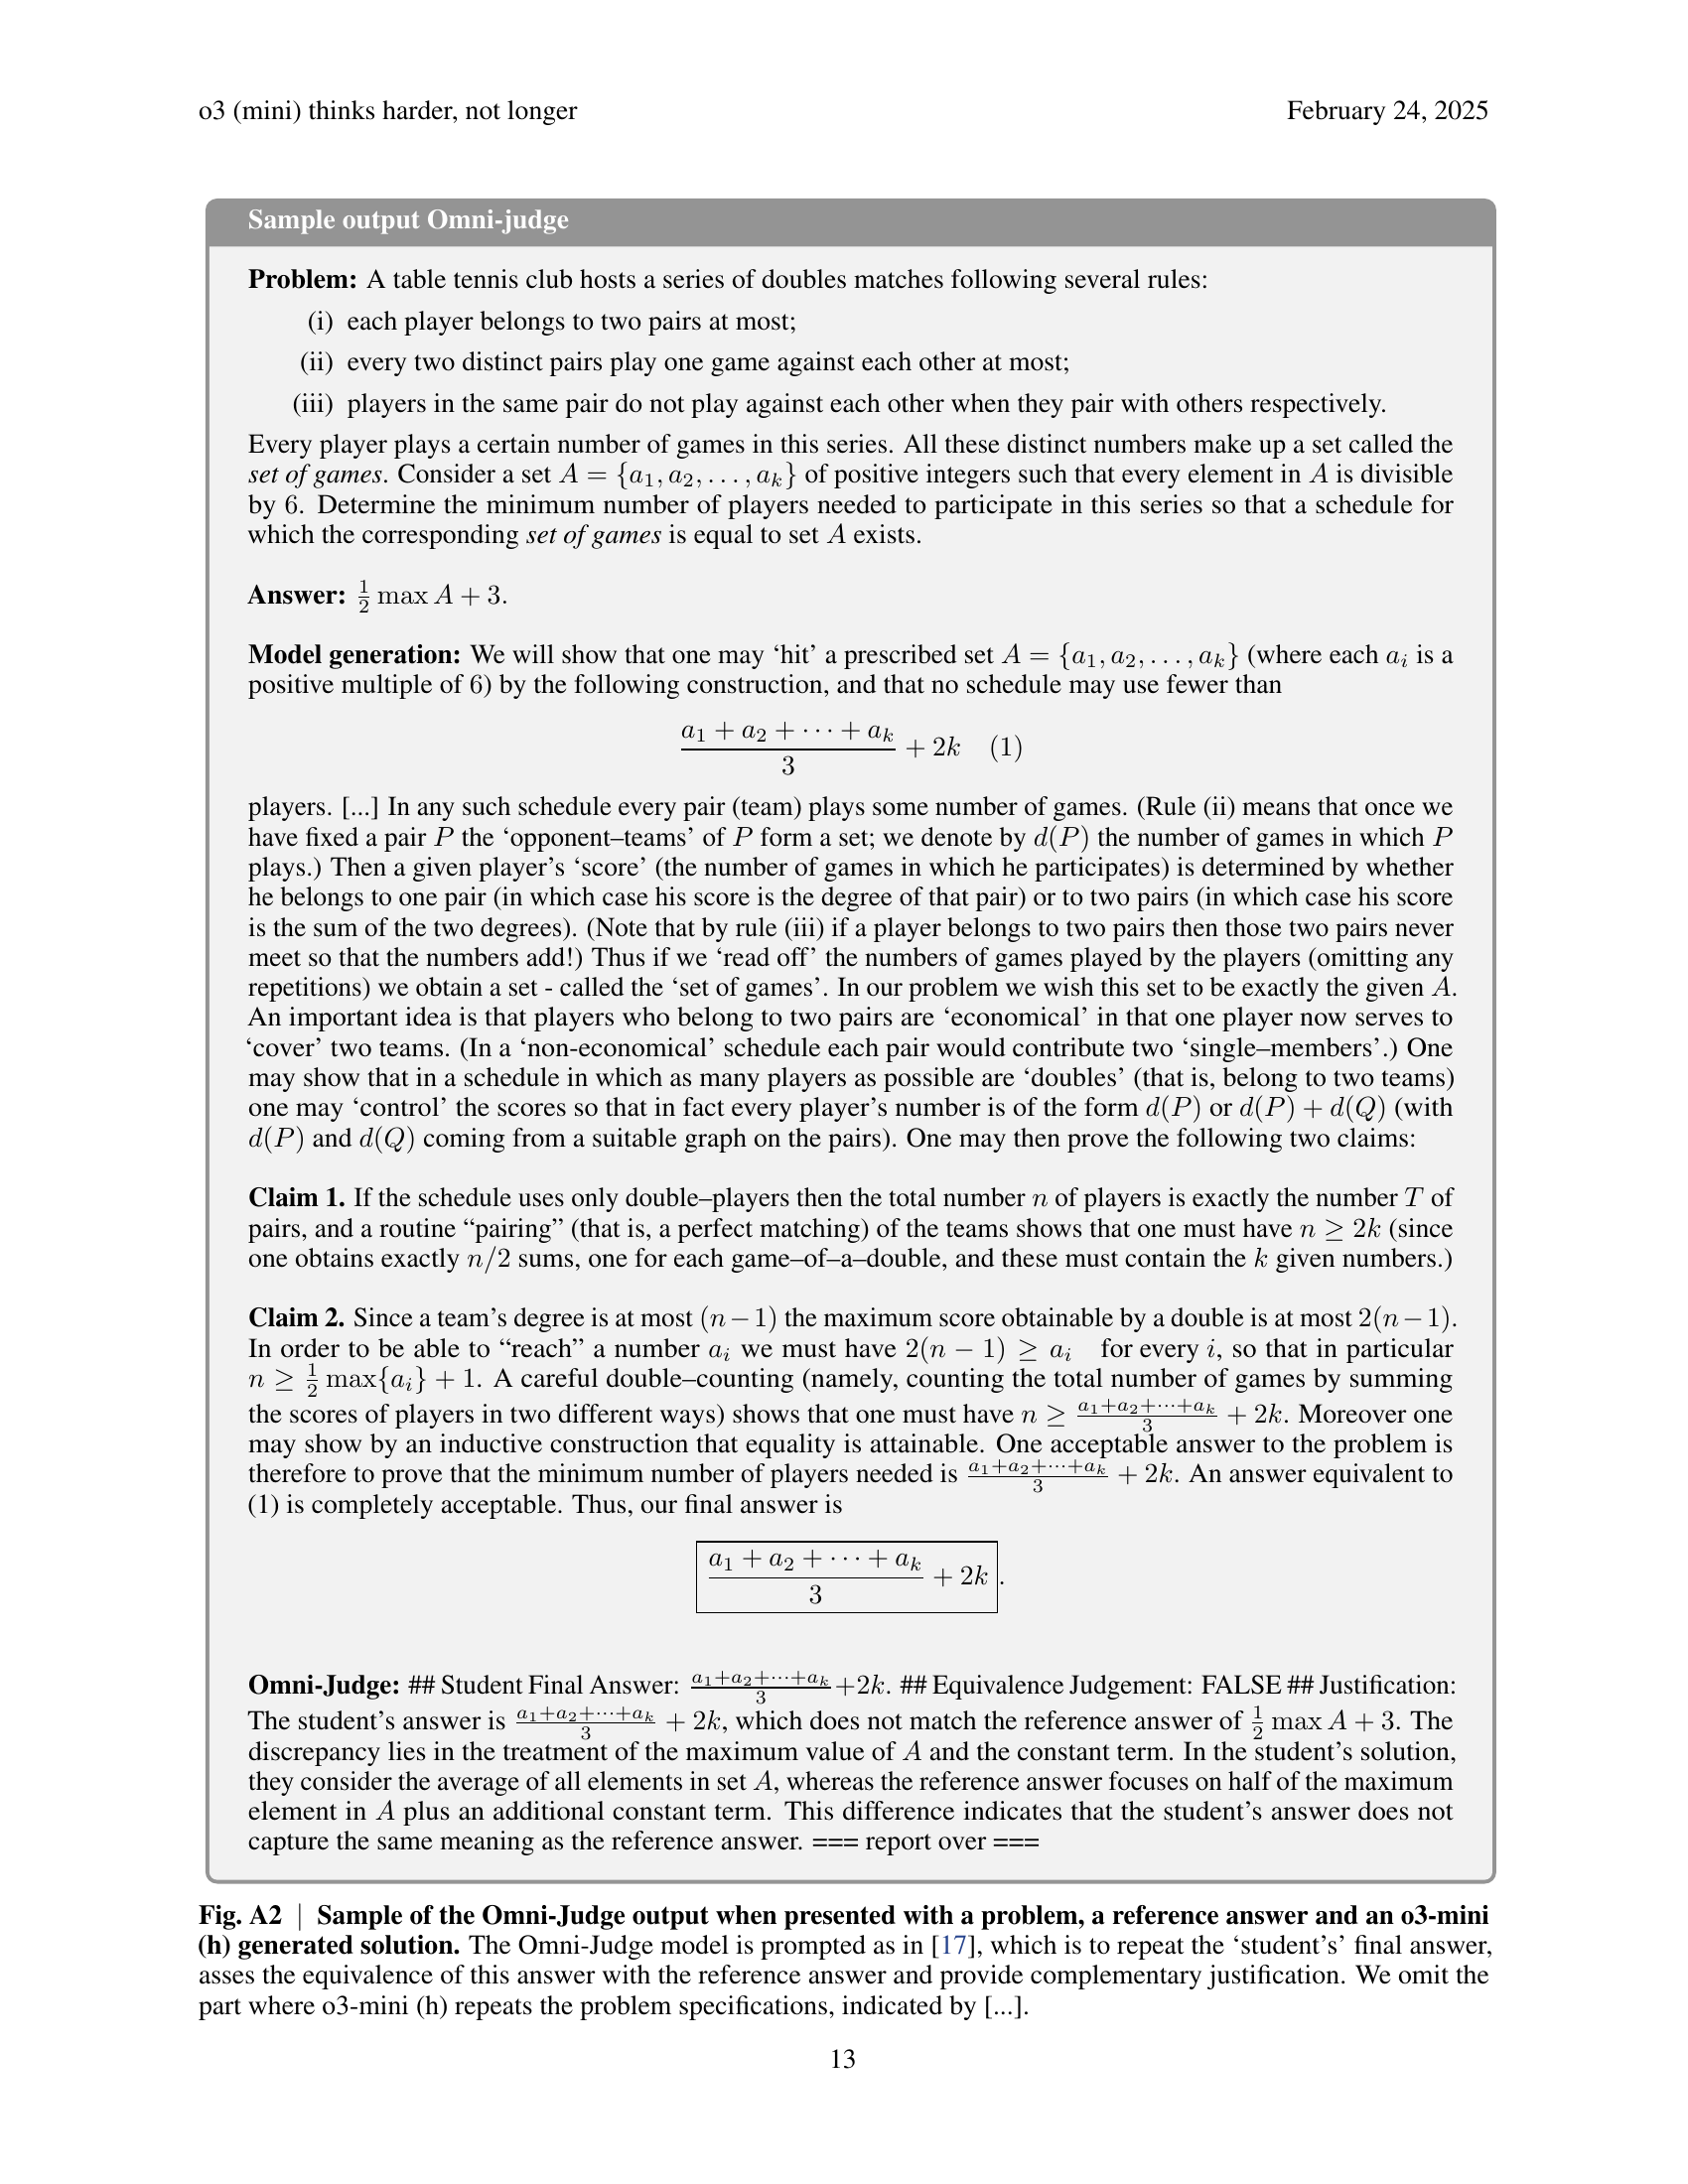
🔼 Figure A2 displays an example of Omni-Judge’s output when evaluating a response generated by the o3-mini (h) model. The figure shows Omni-Judge’s process: it first repeats the model’s answer, then assesses whether this answer matches the reference answer, and finally provides a justification for its equivalence judgment. The excerpt focuses only on Omni-Judge’s evaluation and justification, omitting the problem statement and the initial part of the model’s response for brevity.
read the caption
Fig. A2: Sample of the Omni-Judge output when presented with a problem, a reference answer and an o3-mini (h) generated solution. The Omni-Judge model is prompted as in [17], which is to repeat the ‘student’s’ final answer, asses the equivalence of this answer with the reference answer and provide complementary justification. We omit the part where o3-mini (h) repeats the problem specifications, indicated by […].

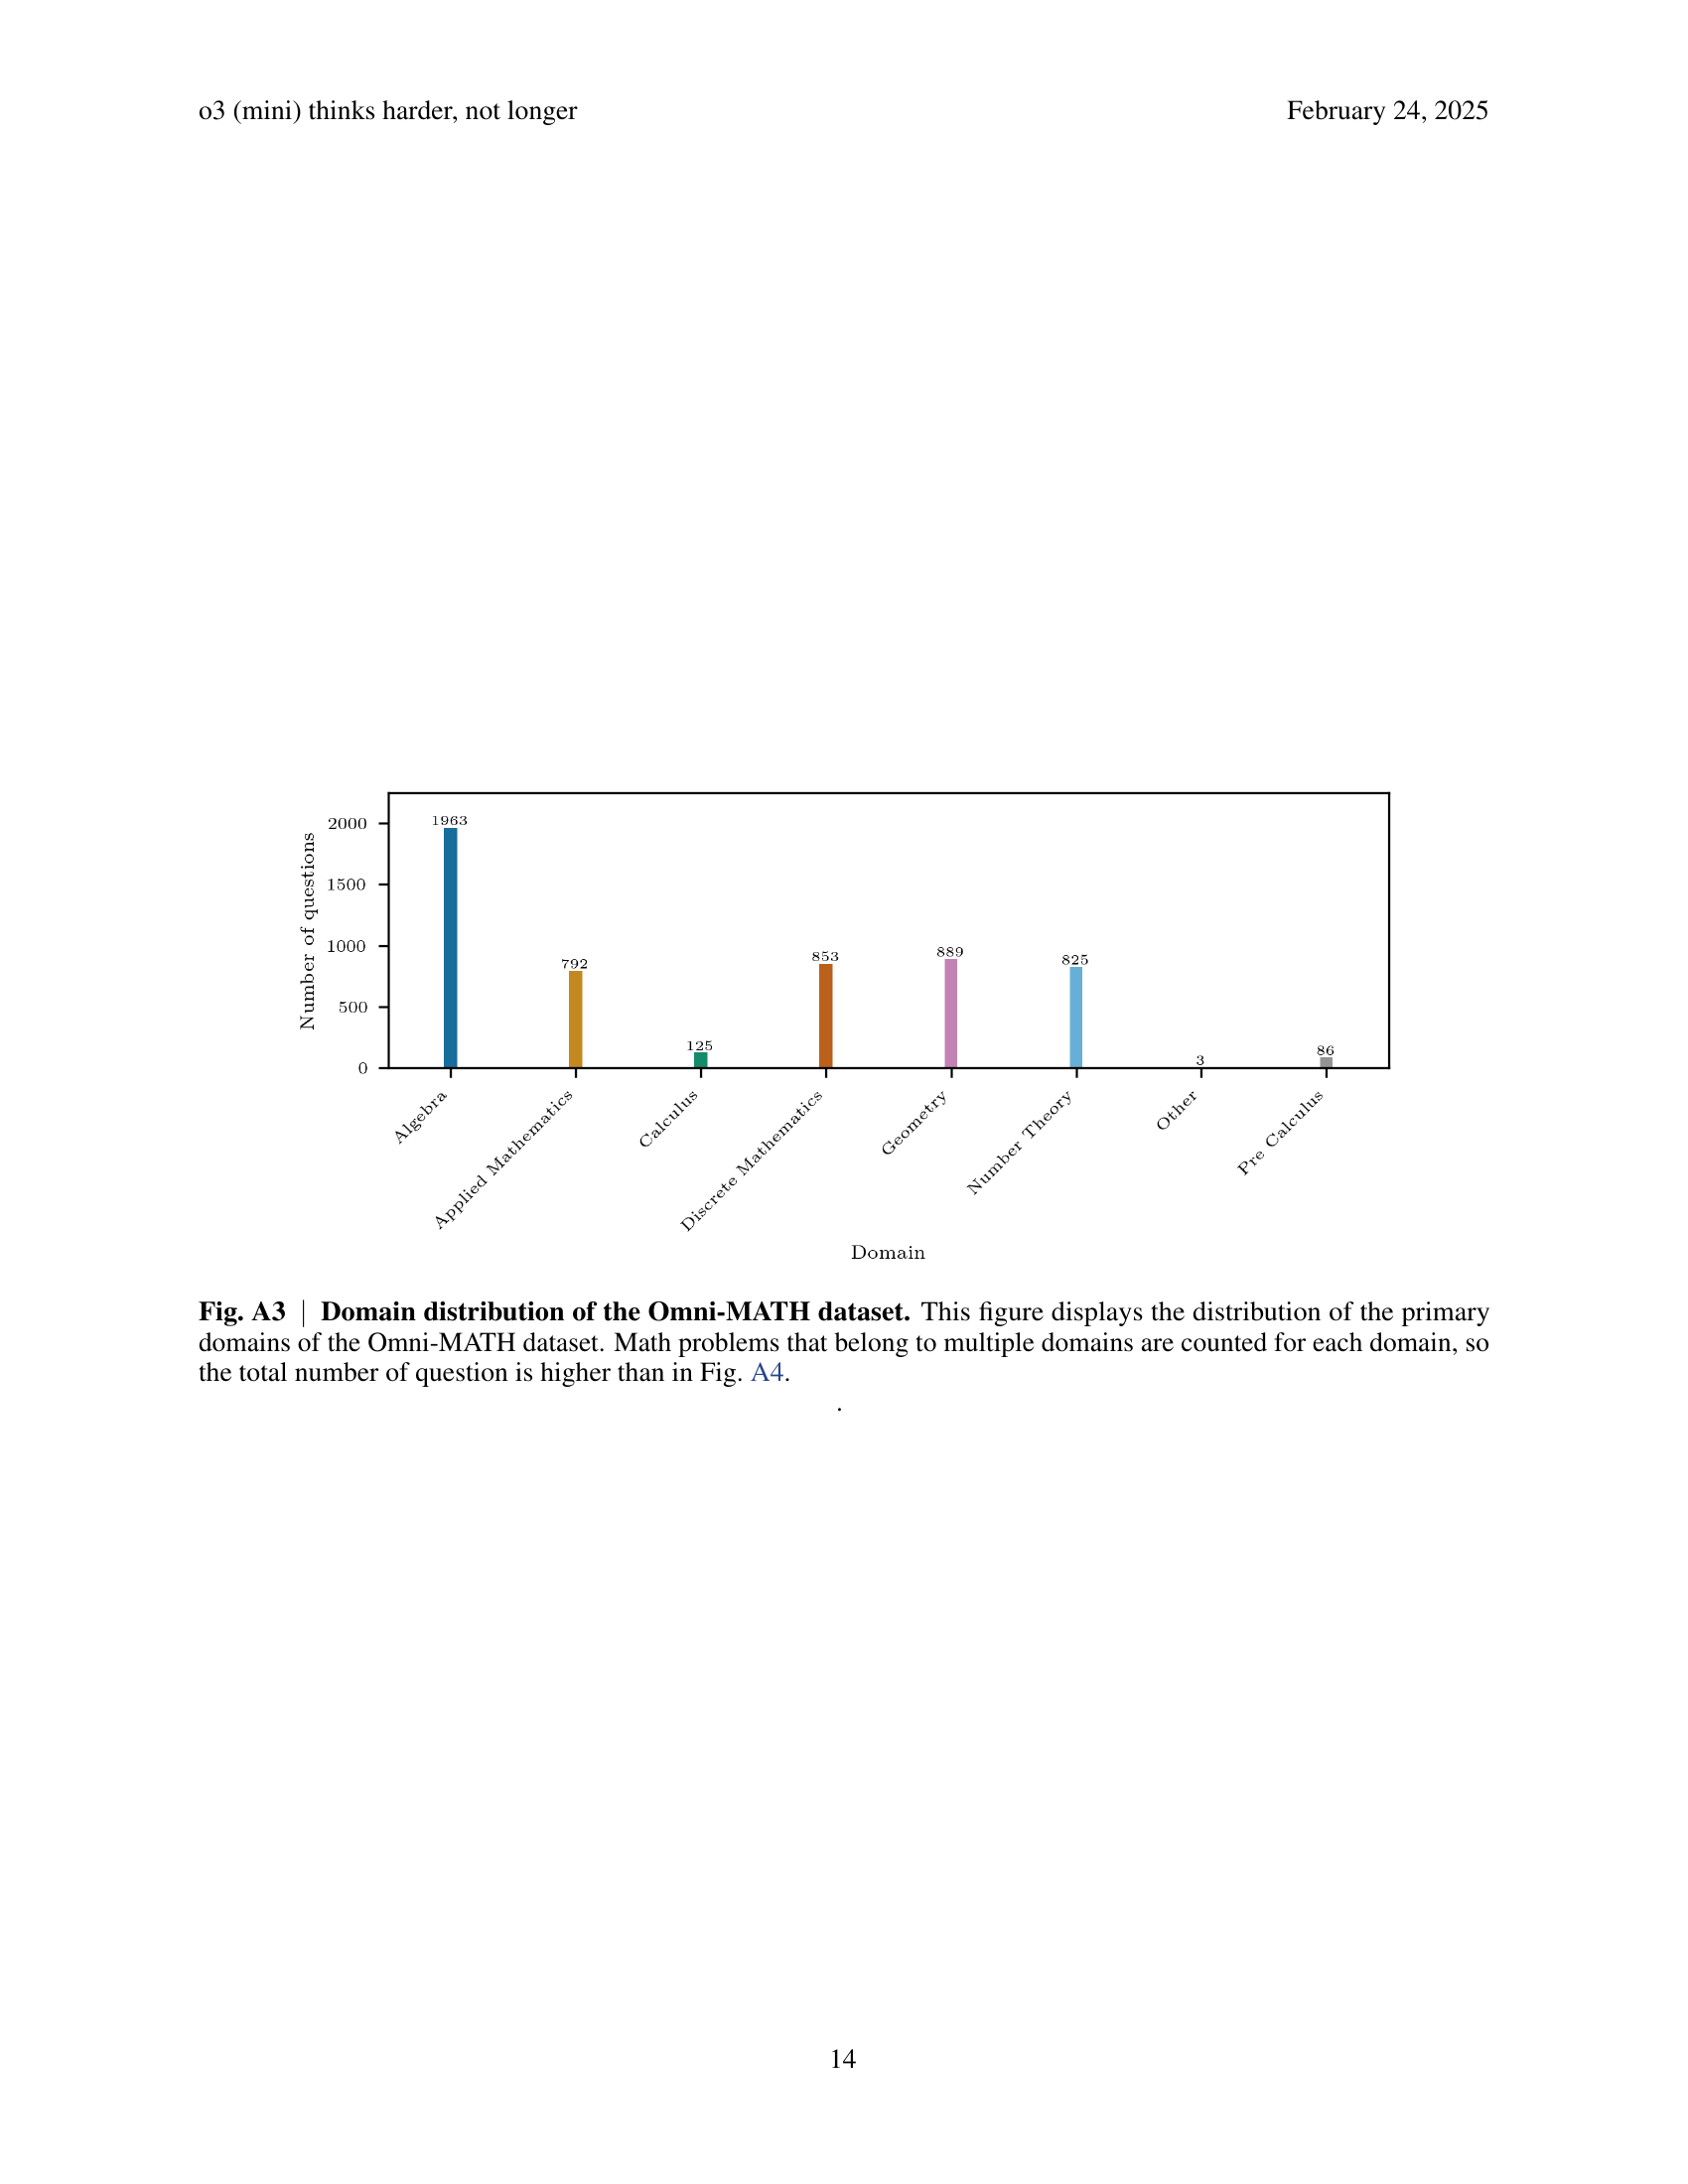
🔼 Figure A3 presents a bar chart illustrating the distribution of math problems across different subject areas within the Omni-MATH dataset. The x-axis lists the primary mathematical domains (Algebra, Applied Mathematics, Calculus, Discrete Mathematics, Geometry, Number Theory, Other, Pre-Calculus), while the y-axis represents the count of problems. Importantly, since some problems fall under multiple domains, each problem is counted for every relevant domain; thus, the total number of problems shown exceeds the overall number of unique questions in the dataset (as depicted in Figure A4). This visualization highlights the relative frequency of various mathematical topics within the benchmark.
read the caption
Fig. A3: Domain distribution of the Omni-MATH dataset. This figure displays the distribution of the primary domains of the Omni-MATH dataset. Math problems that belong to multiple domains are counted for each domain, so the total number of question is higher than in Fig. A4.

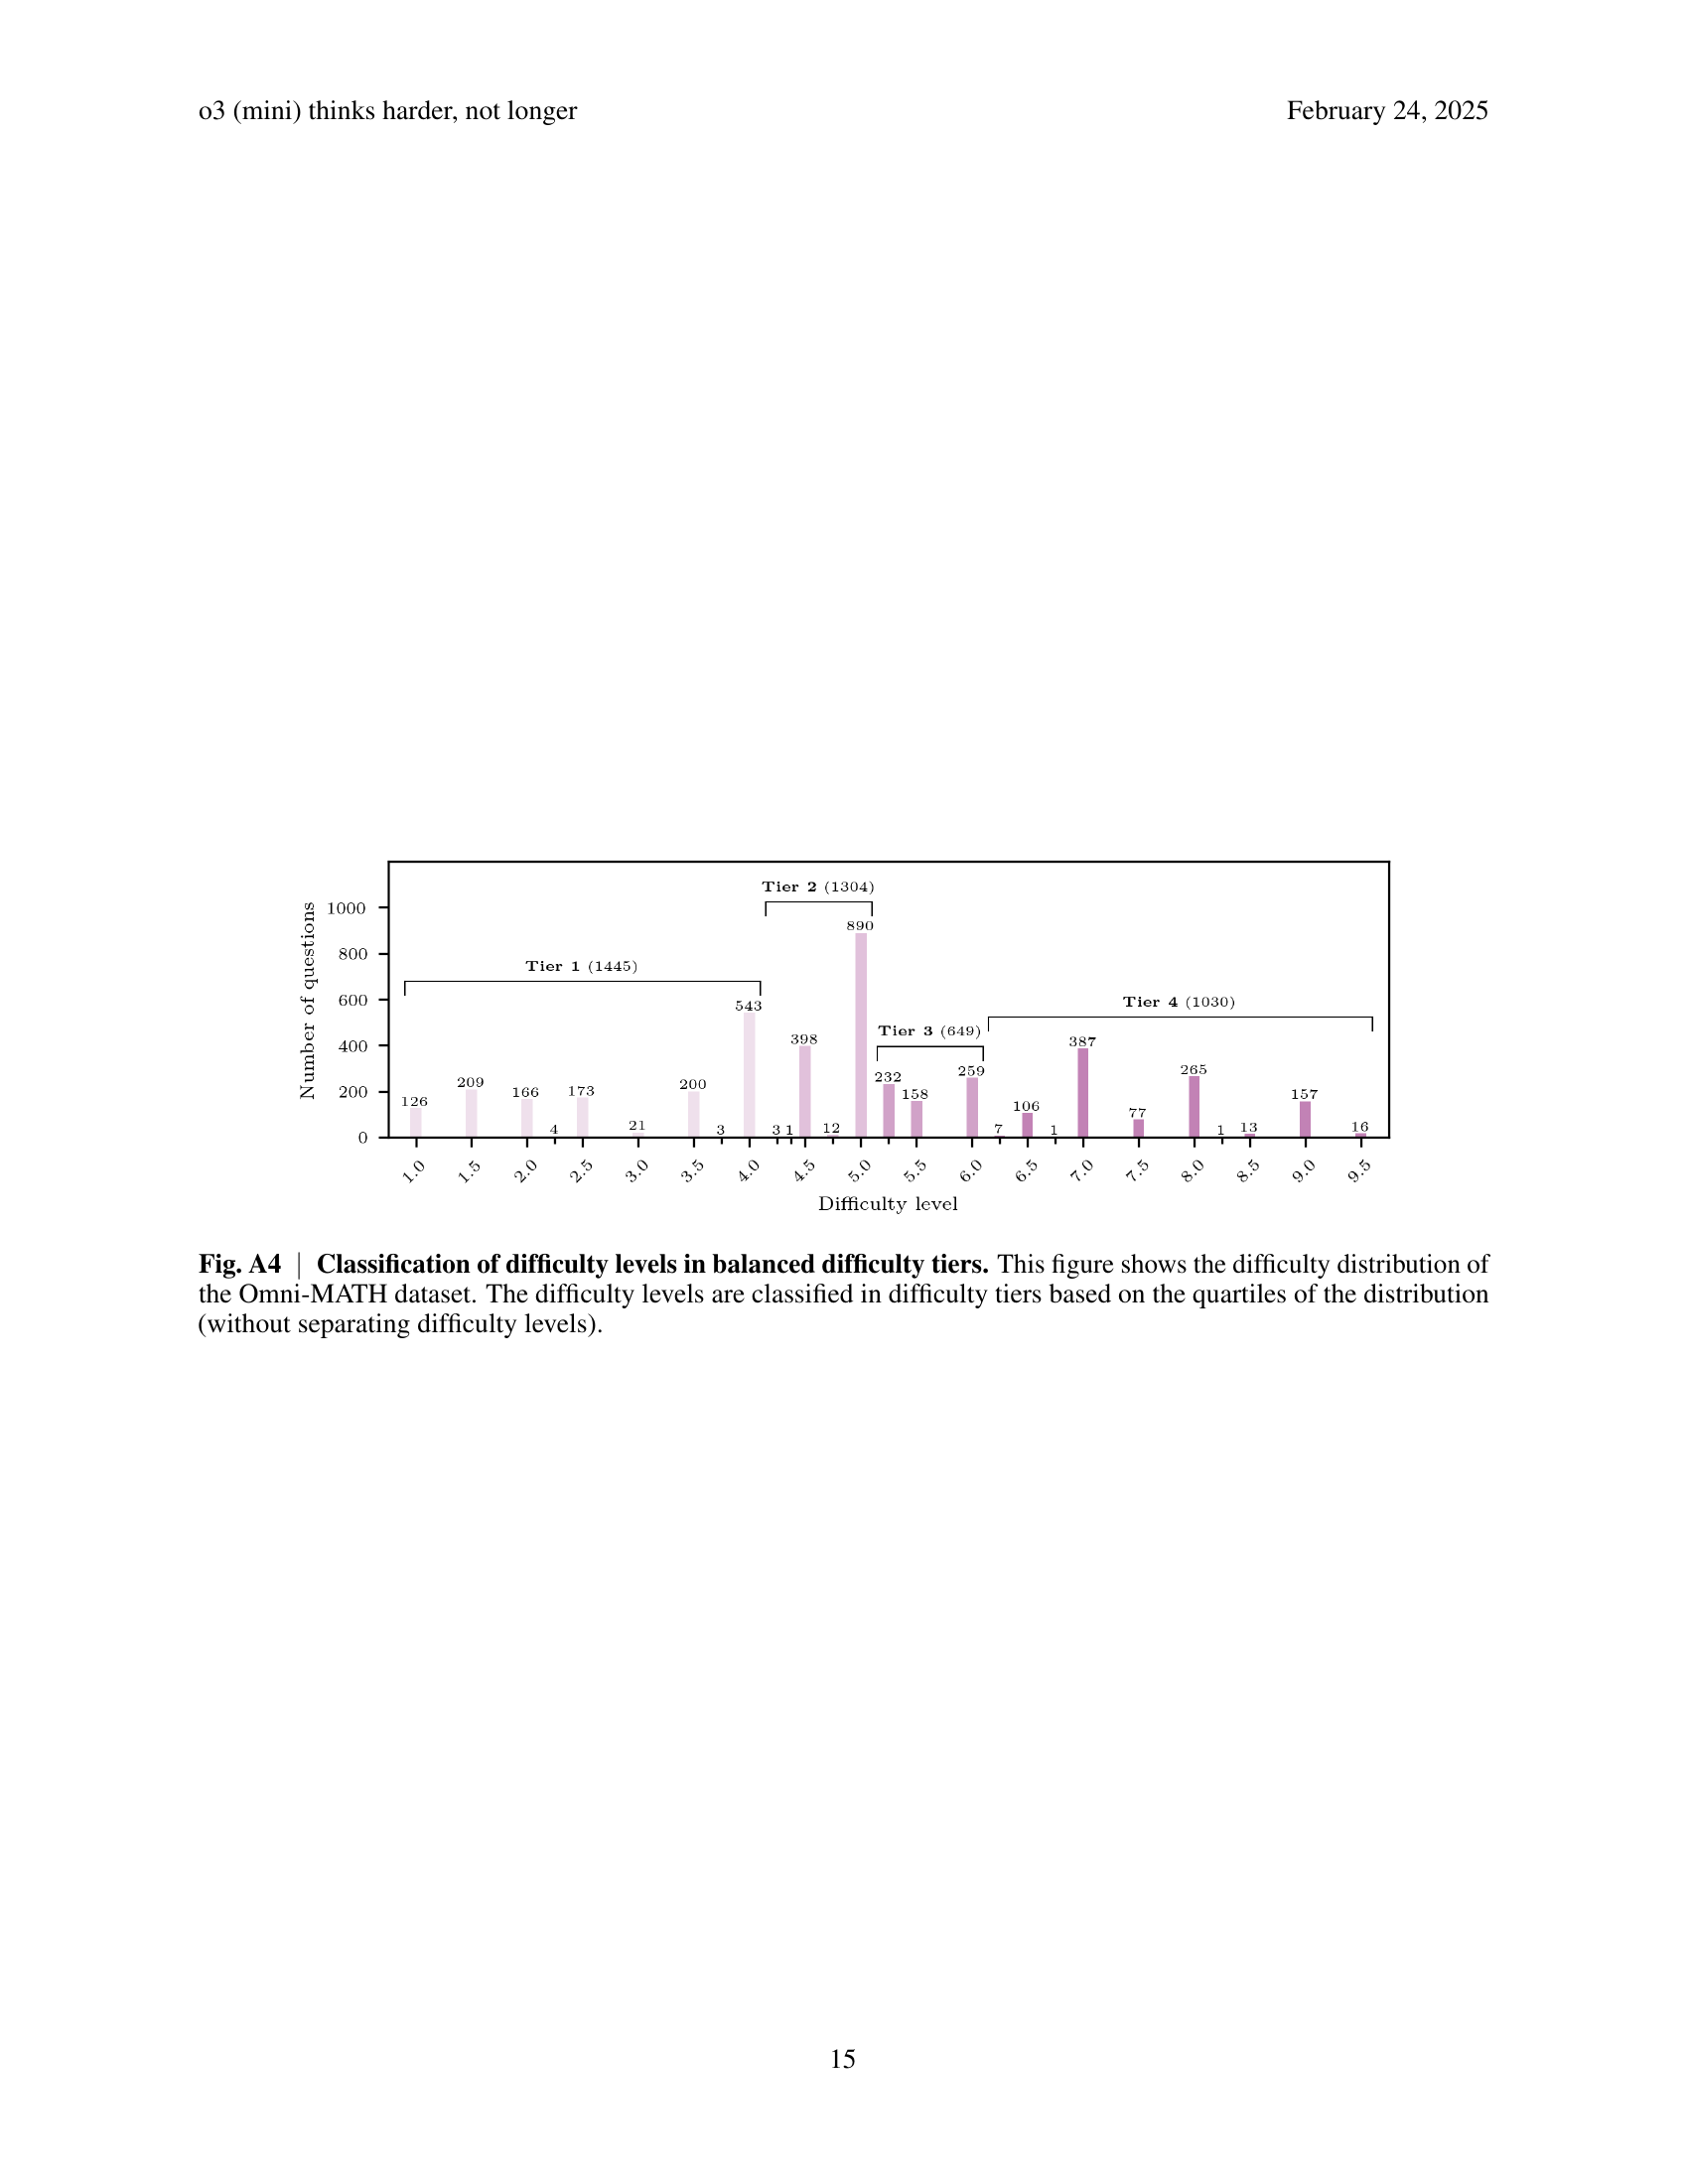
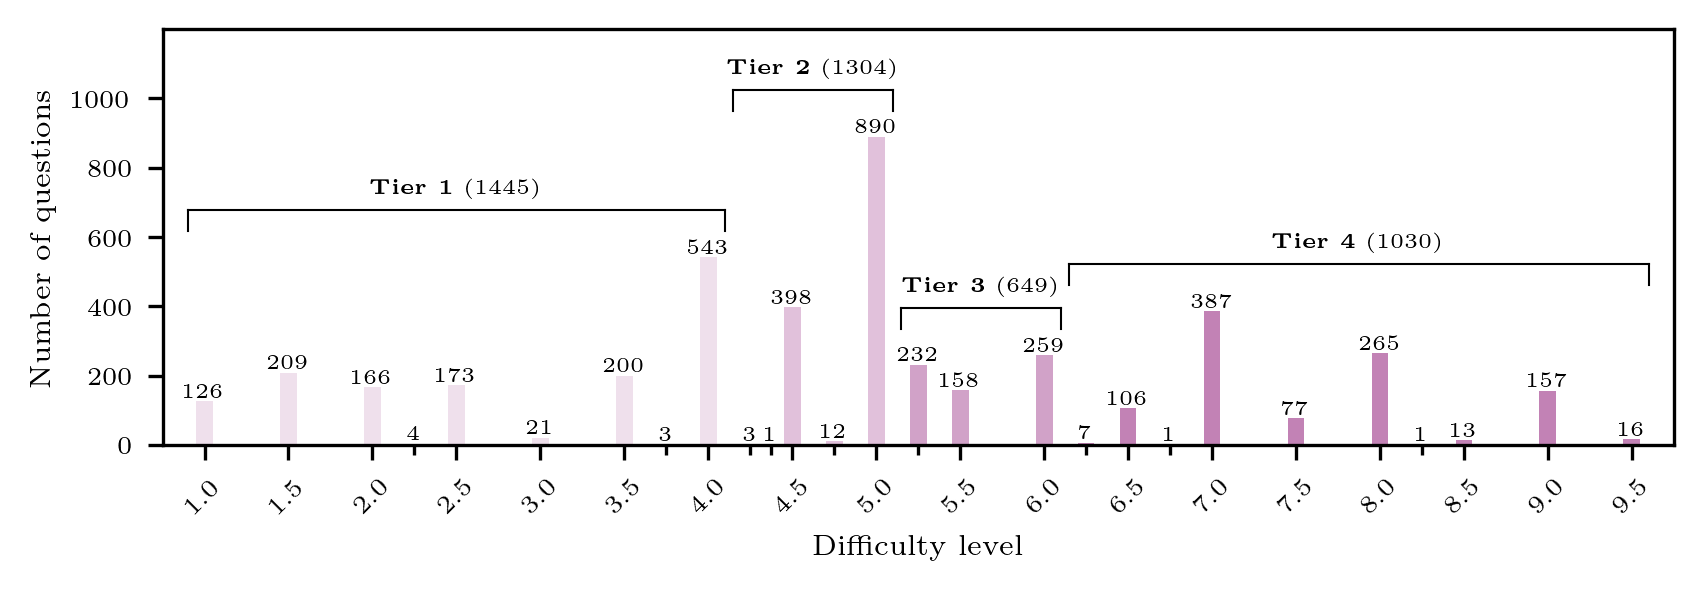
🔼 Figure A4 displays the distribution of difficulty levels in the Omni-MATH dataset. Instead of showing each individual difficulty level, the data is grouped into four ‘difficulty tiers.’ Each tier represents a range of difficulty levels, with the boundaries of the tiers determined by the quartiles of the overall difficulty distribution. For example, Tier 1 would include the 25% easiest problems, Tier 2 the next 25%, Tier 3 the next 25%, and Tier 4 the 25% most difficult problems. This grouping helps to balance the number of problems within each tier and makes analysis simpler.
read the caption
Fig. A4: Classification of difficulty levels in balanced difficulty tiers. This figure shows the difficulty distribution of the Omni-MATH dataset. The difficulty levels are classified in difficulty tiers based on the quartiles of the distribution (without separating difficulty levels).
Full paper#