TL;DR#
The open-weight AI ecosystem’s expansion raises questions about model influence. This paper draws parallels with scientific literature, using a citation dynamics framework to predict which open-weight models will drive innovation. It examines critical questions about long-term influence and impact in the AI landscape, highlighting governance, strategy, and scientific progress.
The paper adapts Wang et al.’s scientific citation model, using immediacy, longevity, and relative fitness to track the number of fine-tuned models. Findings show this approach captures diverse adoption trajectories, identifying influential factors. The analysis underscores the value of this framework and provides insights for strategic decisions.
Key Takeaways#
Why does it matter?#
This paper is important for researchers in AI governance, business strategy, and open-source AI development. By providing a predictive model for open-weight AI adoption, the study offers valuable tools for stakeholders navigating the evolving AI landscape, enhancing strategic decision-making and future research.
Visual Insights#

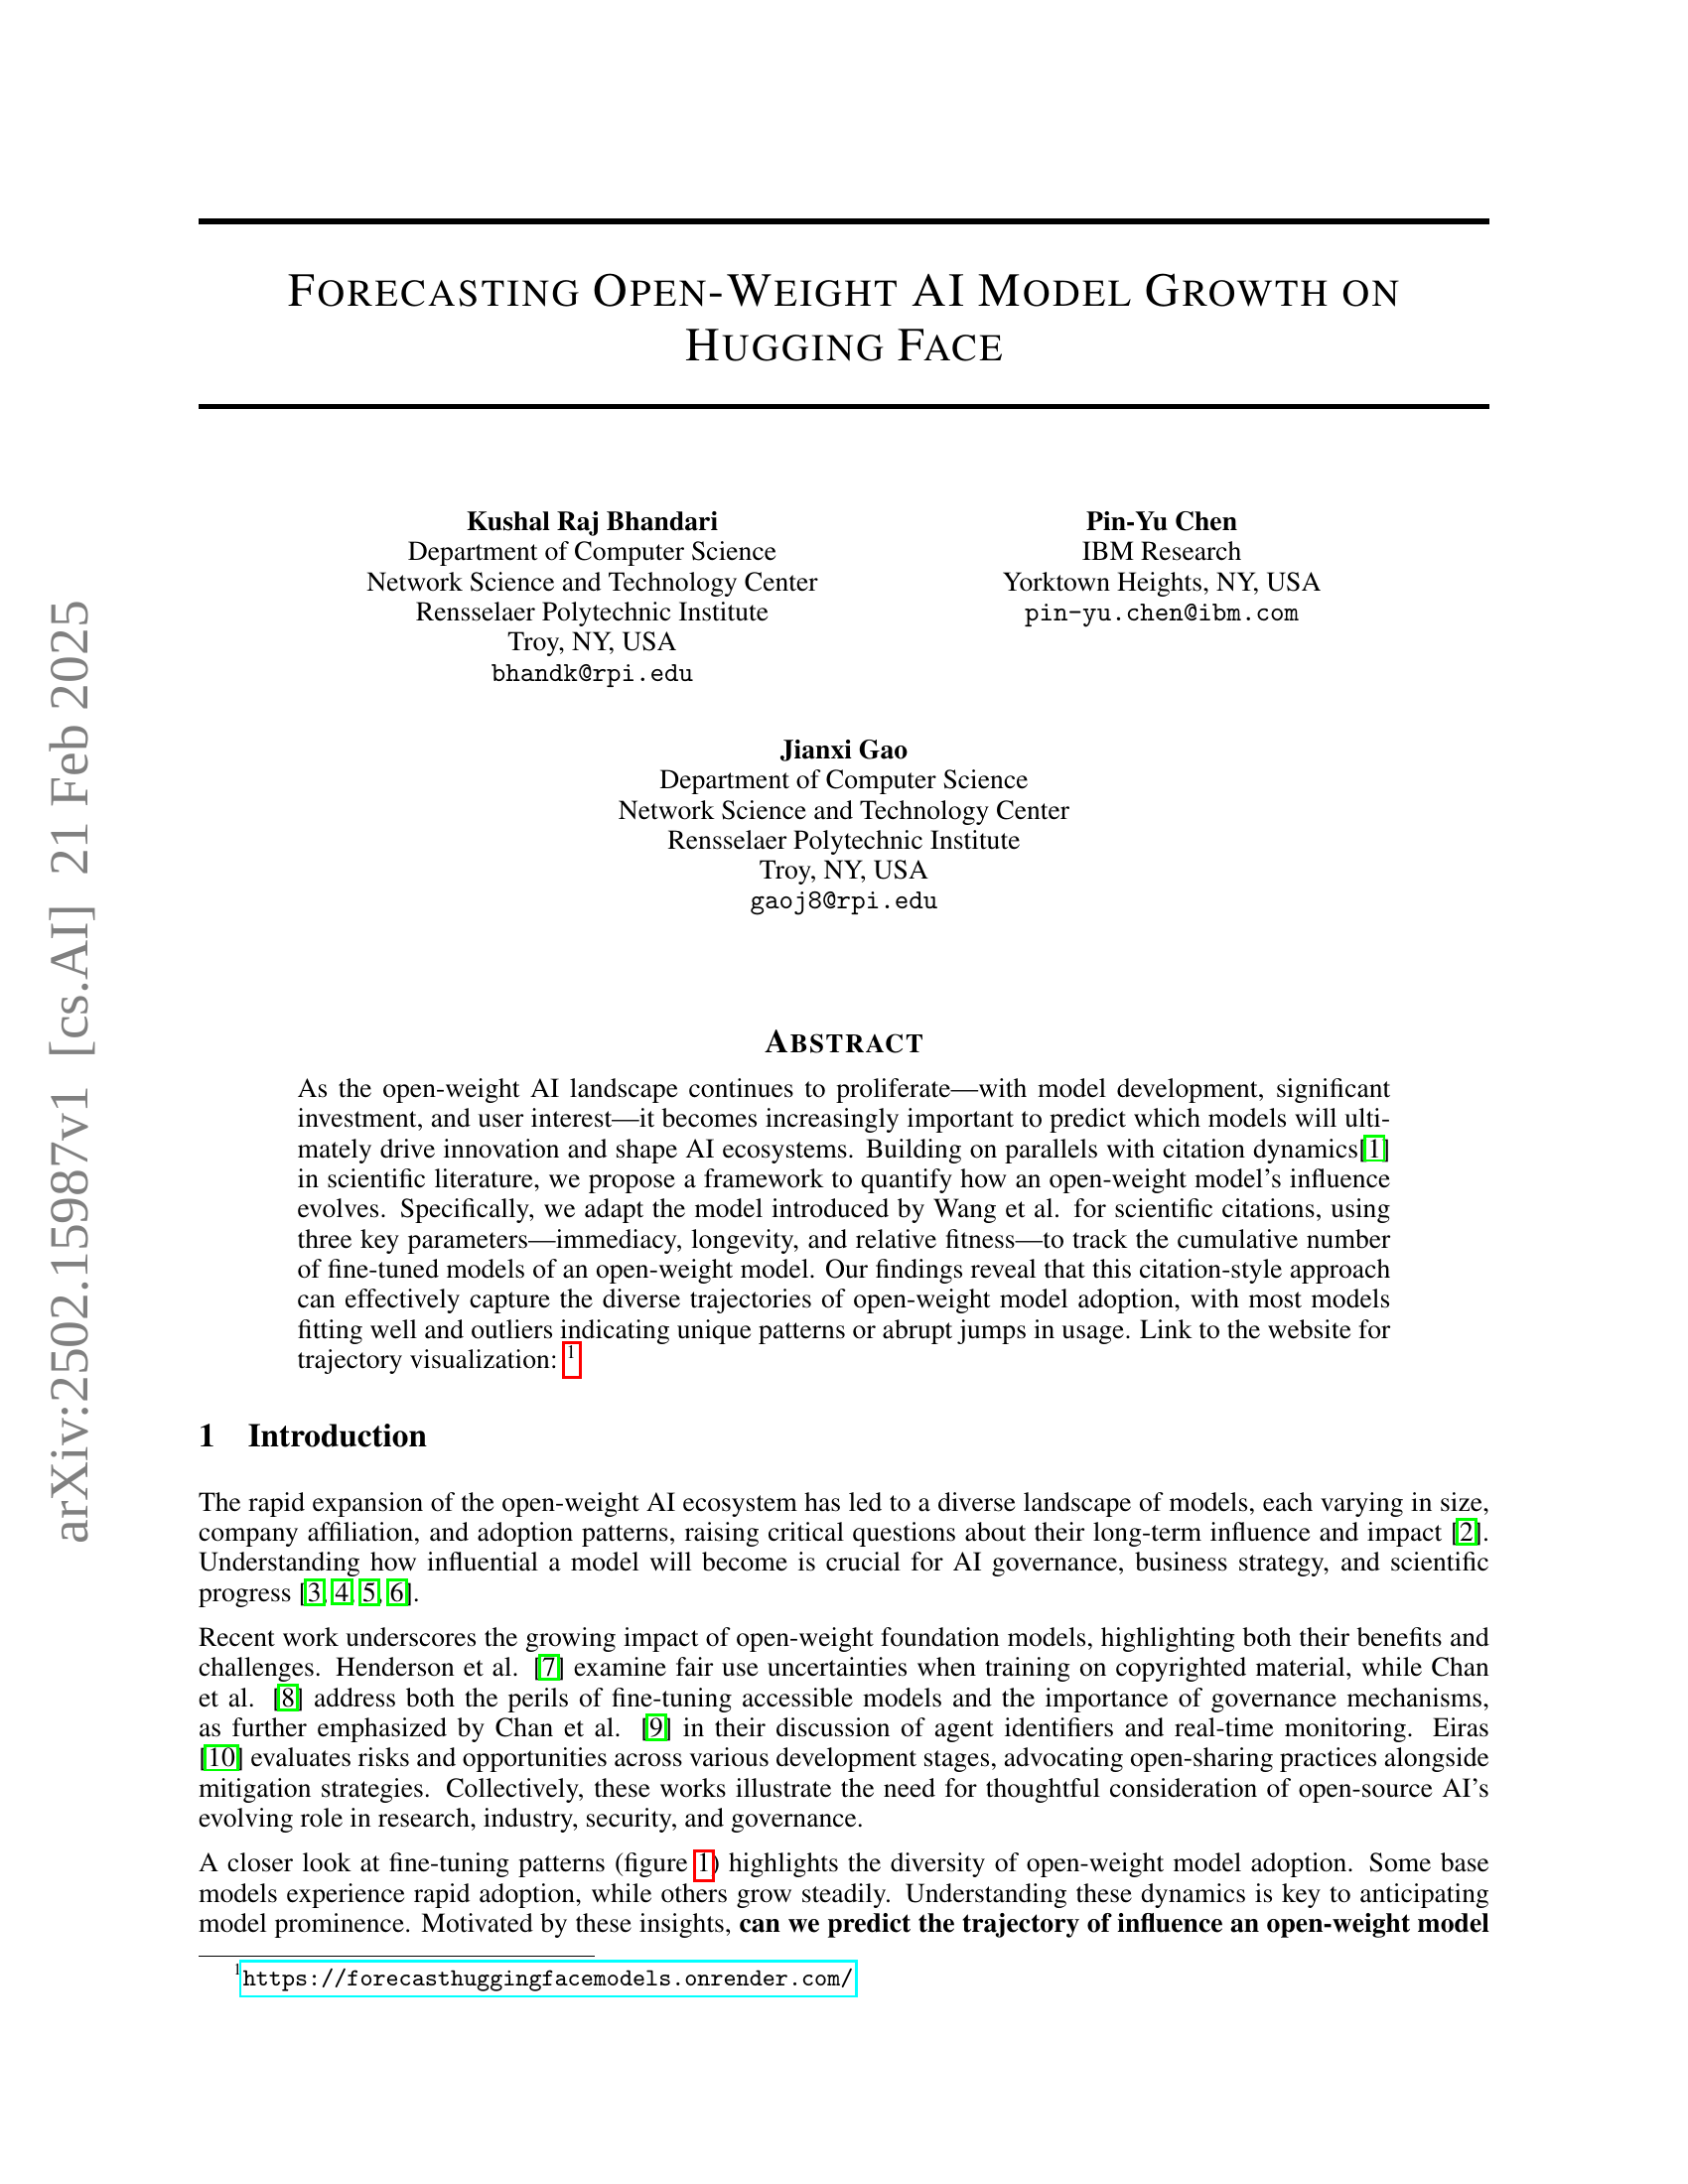
🔼 This figure visualizes the growth of fine-tuned models derived from various base open-weight AI models over time. The x-axis represents the time elapsed since the release of each base model, and the y-axis shows the cumulative number of fine-tuned models created. Each line represents a different base model, and the color of the line indicates the model’s release date. This allows for a visual comparison of the adoption rates and overall popularity of different open-weight AI models over their lifespans.
read the caption
Figure 1: Monthly number of fine-tuned models after a base model’s release, with colors denoting the time when it was created.
| Model Name | |||
|---|---|---|---|
| Qwen/Qwen1.5-0.5B | 21.2340 | 1.18e-15 | 3.9044 |
| Qwen/Qwen1.5-1.8B | 21.1198 | 1.00e-15 | 3.8795 |
| google/gemma-2b | 20.7799 | 2.56e-14 | 4.8182 |
| google/gemma-7b | 18.9374 | 9.78e-15 | 4.5854 |
| Qwen/Qwen1.5-7B | 18.0948 | 1.41e-19 | 4.6136 |
| openai/whisper-small | 294604.7393 | 90.9031 | 22.4477 |
| meta-llama/Llama-2-7b | 17.2144 | 1.04e-17 | 8.8424 |
| stabilityai/stable-diffusion-xl-base-1.0 | 16.9046 | 5.80e-11 | 7.8304 |
| BAAI/EVA | 454253.6120 | 95.8721 | 23.0329 |
| mistralai/Mistral-7B-Instruct-v0.2 | 16.1882 | 7.18e-15 | 7.7386 |
| meta-llama/Llama-2-7b-hf | 15.3191 | 1.76e-14 | 4.9636 |
| mistralai/Mistral-7B-v0.1 | 15.9177 | 1.03e-15 | 8.2057 |
| meta-llama/Llama-2-7b-chat-hf | 15.2853 | 9.88e-12 | 5.5452 |
| meta-llama/Llama-3.1-8B-Instruct | 0.5* | 2.0* | 0.5* |
| meta-llama/Llama-3.1-8B | 0.5* | 2.0* | 0.5* |
| allenai/DREAM | 24.2332 | 4.9102 | 9.2243 |
| meta-llama/Meta-Llama-3-8B-Instruct | 15.9664 | 1.47e-10 | 10.6965 |
| openai/whisper-tiny | 13.4653 | 2.04e-15 | 4.1449 |
| microsoft/phi-2 | 15.2437 | 8.83e-18 | 9.5035 |
| openai/whisper-large-v3 | 528070.6635 | 66.4680 | 15.8209 |
| openai/whisper-medium | 460695.9213 | 88.9759 | 21.2067 |
| Qwen/Qwen2-1.5B | 16.0543 | 4.44e-12 | 6.1988 |
| meta-llama/Meta-Llama-3-8B | 15.2420 | 1.06e-10 | 11.5625 |
| meta-llama/Llama-3.2-3B-Instruct | 0.5* | 2.0* | 0.5* |
| meta-llama/Llama-3.2-1B-Instruct | 0.5* | 2.0* | 0.5* |
| microsoft/Phi-3-mini-4k-instruct | 114364.7070 | 142.1125 | 37.0978 |
| microsoft/speecht5_tts | 12.3327 | 6.40e-10 | 3.5563 |
| openai/whisper-large-v2 | 68.7205 | 13.4940 | 10.0765 |
| meta-llama/Llama-3.2-1B | 0.5* | 2.0* | 0.5* |
| Qwen/Qwen2-1.5B-Instruct | 15.1078 | 1.70e-17 | 4.9109 |
| apple/AIM | 120131.6996 | 66.9603 | 17.3784 |
| Qwen/Qwen2-0.5B | 32058.6364 | 76.6518 | 21.8903 |
| Qwen/Qwen2-7B-Instruct | 415361.3050 | 78.3713 | 18.9740 |
| openai/whisper-base | 11.2185 | 6.13e-20 | 2.7420 |
| google/gemma-2-2b | 0.5* | 2.0* | 0.5* |
| meta-llama/Llama-3.2-3B | 0.5* | 2.0* | 0.5* |
| mistralai/Mistral-7B-Instruct-v0.1 | 13.4460 | 7.33e-15 | 8.2182 |
| google/gemma-2-2b-it | 0.5* | 2.0* | 0.5* |
| facebook/opt-125m | 9.2155 | 1.68e-14 | 1.4702 |
| Salesforce/BLIP | 11.6421 | 0.2335 | 2.7321 |
| mistralai/Mistral-7B-Instruct-v0.3 | 14.0439 | 3.31e-09 | 7.2751 |
| microsoft/resnet-50 | 9.0884 | 4.48e-21 | 1.6266 |
| facebook/esm2_t12_35M_UR50D | 11.4140 | 6.74e-19 | 3.5063 |
| google/flan-t5-base | 10.3708 | 1.28e-19 | 1.9899 |
| google/flan-t5-large | 11.8440 | 8.27e-14 | 4.6042 |
| openai/whisper-large | 364711.2741 | 64.2591 | 15.3622 |
| microsoft/Phi-3.5-mini-instruct | 0.5* | 2.0* | 0.5* |
| microsoft/phi-1.5 | 12.9090 | 6.94e-10 | 9.6670 |
| google/gemma-2-9b-it | 280939.5667 | 102.4015 | 25.2924 |
| Qwen/Qwen2.5-7B-Instruct | 0.5* | 2.0* | 0.5* |
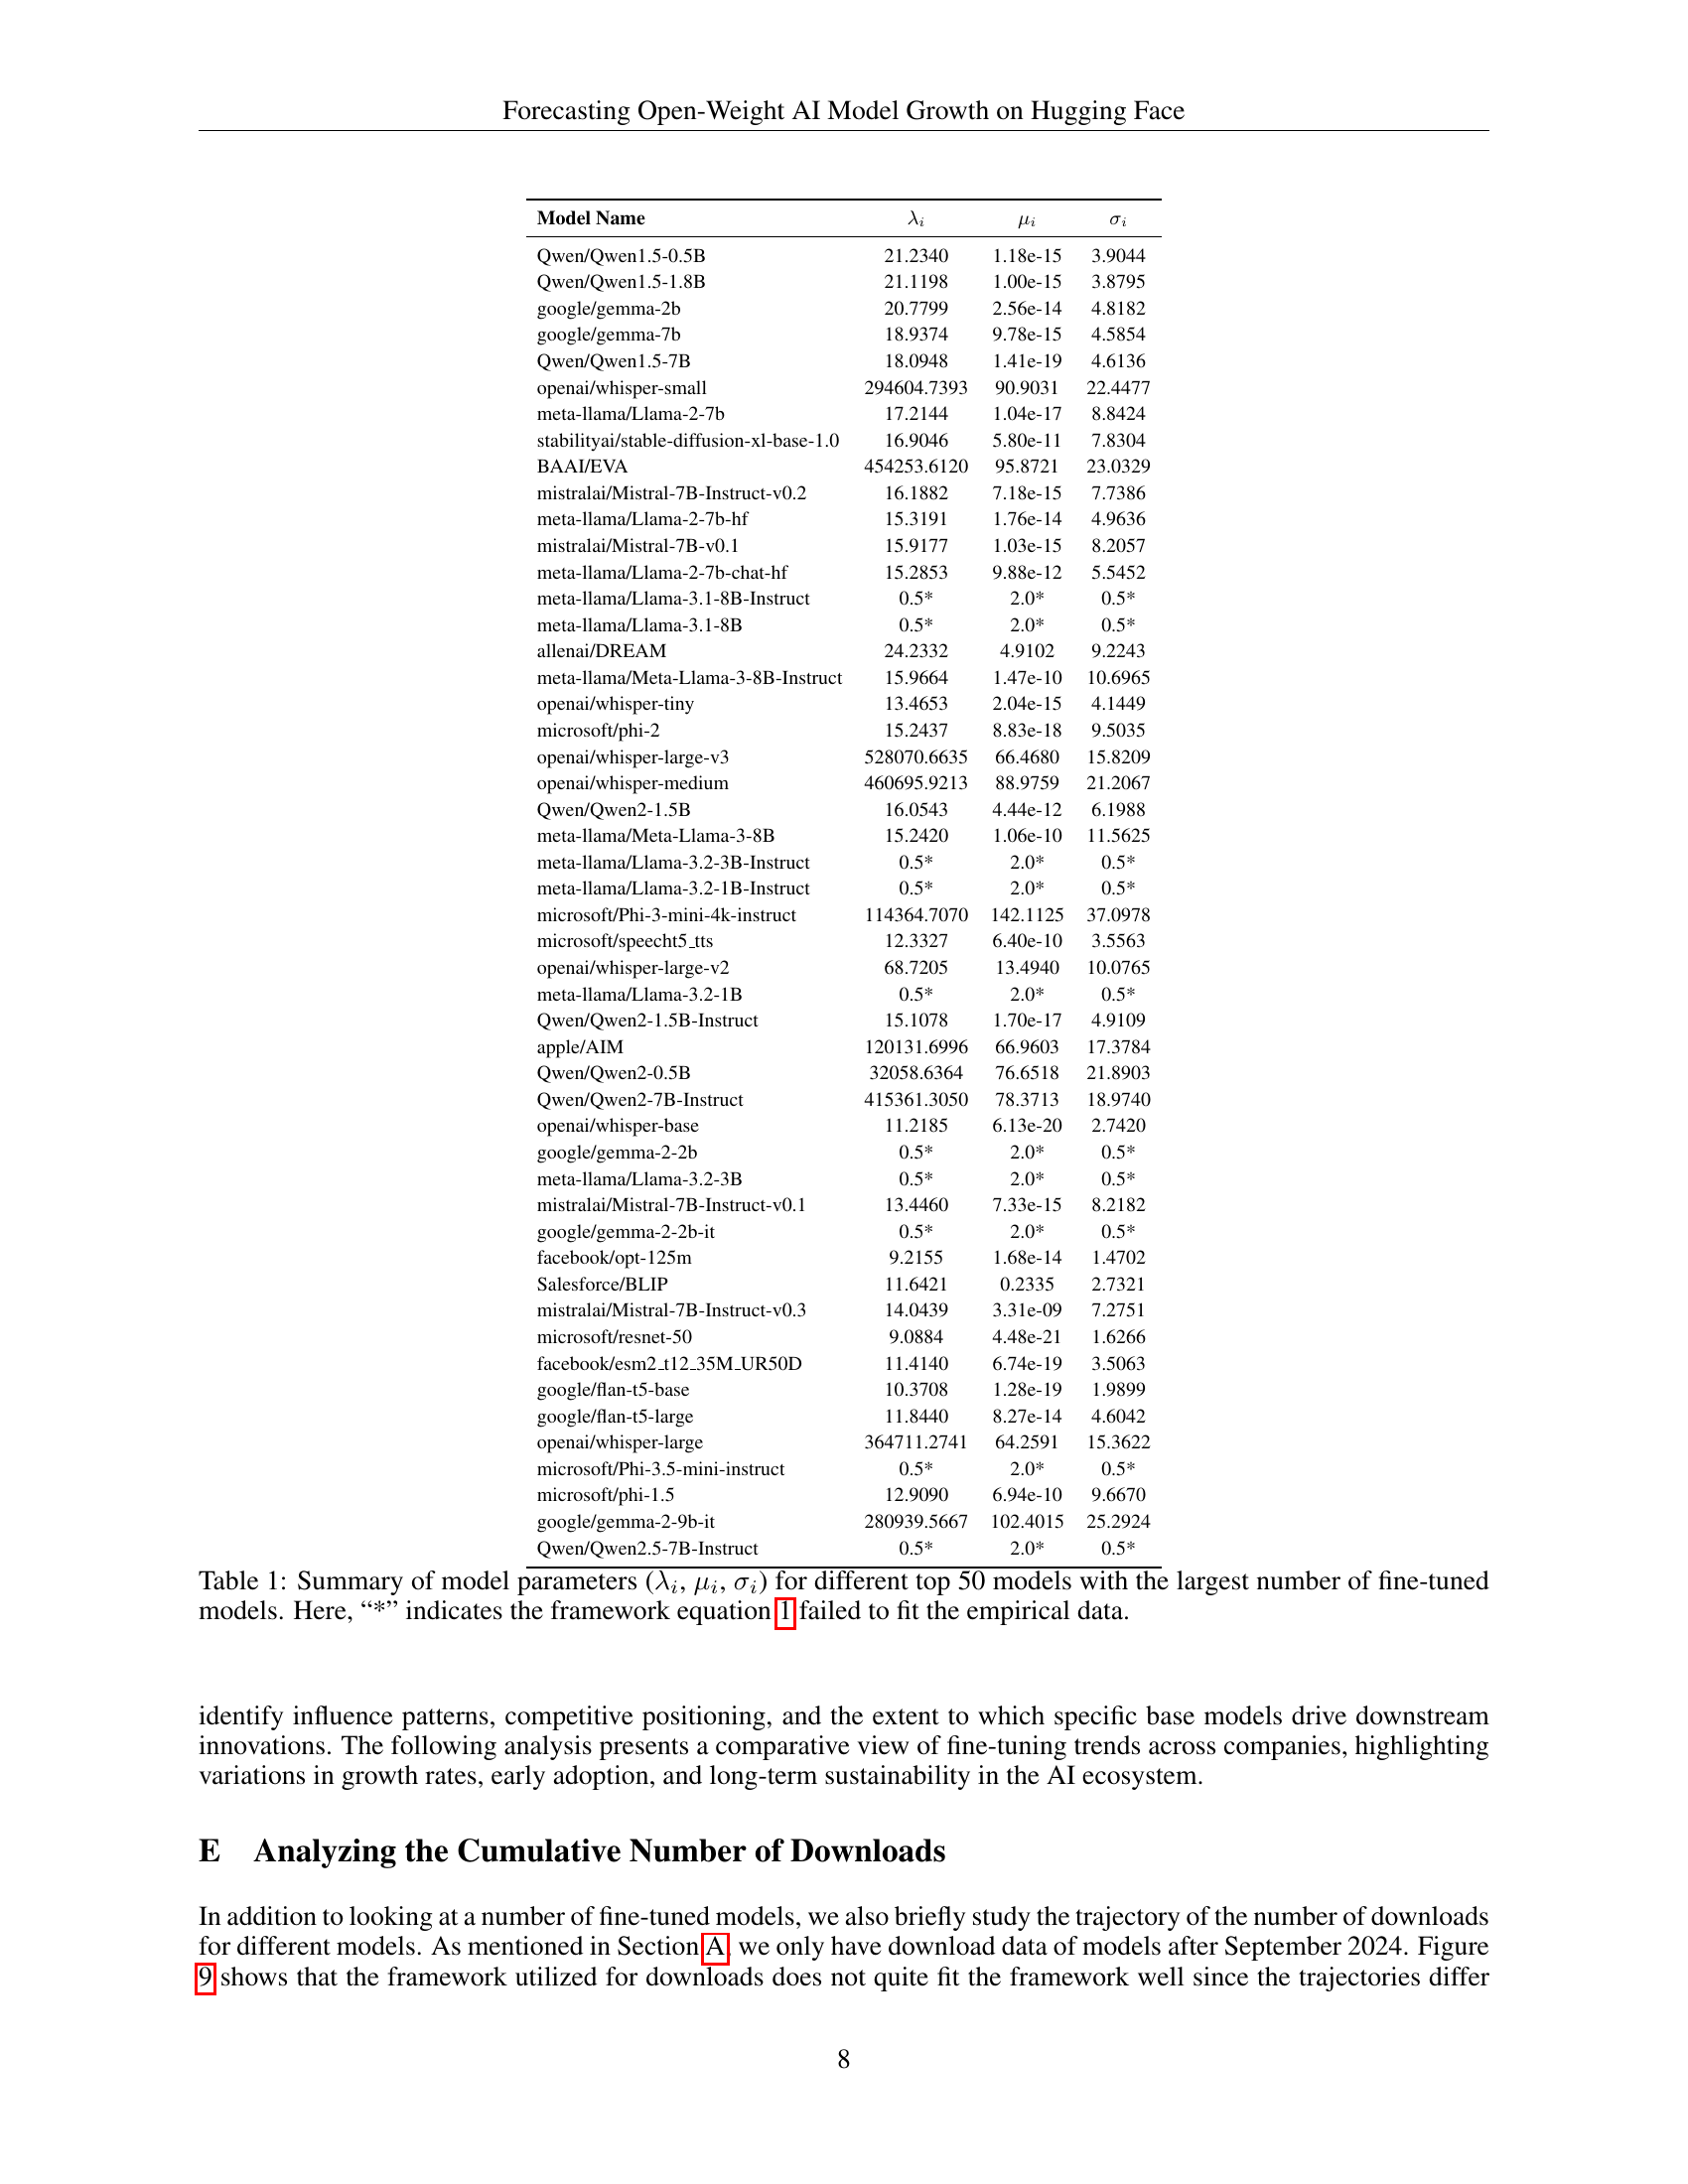
🔼 Table 1 presents a comprehensive summary of the key parameters derived from fitting a citation-based model to the adoption data of the top 50 open-weight AI models on Hugging Face. These parameters—λᵢ (relative fitness), μᵢ (immediacy), and σᵢ (longevity)—quantify how quickly a model gains popularity, how long its influence lasts, and its overall relative success compared to others. The table highlights the diversity of model adoption trajectories by showing the values of these parameters for each model. The asterisk (*) indicates cases where the model failed to fit the data well, suggesting that some models’ adoption patterns may deviate significantly from the assumed dynamics of the citation model and may require alternative modeling approaches.
read the caption
Table 1: Summary of model parameters (λisubscript𝜆𝑖\lambda_{i}italic_λ start_POSTSUBSCRIPT italic_i end_POSTSUBSCRIPT, μisubscript𝜇𝑖\mu_{i}italic_μ start_POSTSUBSCRIPT italic_i end_POSTSUBSCRIPT, σisubscript𝜎𝑖\sigma_{i}italic_σ start_POSTSUBSCRIPT italic_i end_POSTSUBSCRIPT) for different top 50 models with the largest number of fine-tuned models. Here, “*” indicates the framework equation 1 failed to fit the empirical data.
In-depth insights#
AI Model Growth#
AI model growth is a multifaceted phenomenon, encompassing not only the expansion in model size and complexity but also the proliferation of fine-tuned variants and their adoption across diverse applications. Understanding the trajectory of AI model growth requires analyzing factors such as model architecture, training data, computational resources, and community engagement. Rapid growth can signify high utility or novelty, while slower growth may reflect niche applications or limitations in accessibility. Forecasting model growth necessitates considering both intrinsic qualities (performance, efficiency) and extrinsic factors (community support, licensing). Furthermore, growth dynamics vary across organizations, reflecting their strategic priorities and open-source contributions. Analyzing fine-tuning patterns reveals how base models are adapted to different tasks, highlighting their versatility and the ecosystem’s collaborative nature.
Citation Dynamic#
The paper draws a parallel between the dynamics of open-weight AI model adoption on platforms like Hugging Face and the citation dynamics observed in scientific literature. This analogy suggests that the growth and influence of AI models can be understood through a lens similar to how scientific papers gain citations. This ‘citation dynamic’ hinges on factors such as the model’s initial appeal (immediacy), its sustained relevance (longevity), and its overall impact relative to other models (relative fitness). By adapting a citation model, the study tries to offer a framework for quantifying how an open-weight model’s influence evolves, potentially predicting which models will ultimately drive innovation.
Parameter Fit#
Analyzing parameter fits in AI model growth provides valuable insights. Immediacy dictates peak adoption timing, while longevity governs influence decay. Relative fitness measures model attractiveness. Outliers signal unusual adoption, meriting deeper investigation. High fitness paired with low longevity suggests initial appeal fades quickly. Moderate fitness with high longevity indicates sustained engagement. These parameter relationships reveal diverse model lifecycles, crucial for predicting long-term influence. Understanding these dynamics is essential for strategic decisions and AI governance, enabling better forecasting of model impact.
Organizational Role#
The organizational context significantly shapes the adoption of open-weight AI models. Larger, well-resourced organizations like Meta and Google often have the resources to rapidly fine-tune and deploy models, leading to quicker initial adoption. Smaller organizations or individual researchers may face resource constraints, resulting in slower or more specialized adoption patterns. An organization’s strategic priorities also play a role, with some focusing on specific model architectures or application domains, influencing the trajectory of model usage. The open-source community, including companies like BAAI and StabilityAI, support specific ecosystem. This translates into varying levels of community support, documentation, and tooling, all of which influence the model’s long-term popularity and impact.
Download Data#
The research paper explores the topic of ‘Download Data’ by collecting data on open-weight model adoption using the Hugging Face API, a prominent repository for open-source AI models. Quantifying fine-tuning activity involves tracking fine-tuned models after a base model’s release, aggregating monthly counts. The initial models like GPT-2 and BERT variants were excluded to prevent distortion of the adoption timeline. Identifying fine-tuned models relies on tags and model names, with potential labeling inconsistencies affecting data accuracy. Download data collected after September 2024 allows researchers to approximate temporal trends in adoption. The model predicts downloads without scaling by arbitrary reference counts, so it can measure the relative fitness. Finally, the paper also notes it adjusts counting the number of fine tuned models to monthly to reduce any noise.
More visual insights#
More on figures

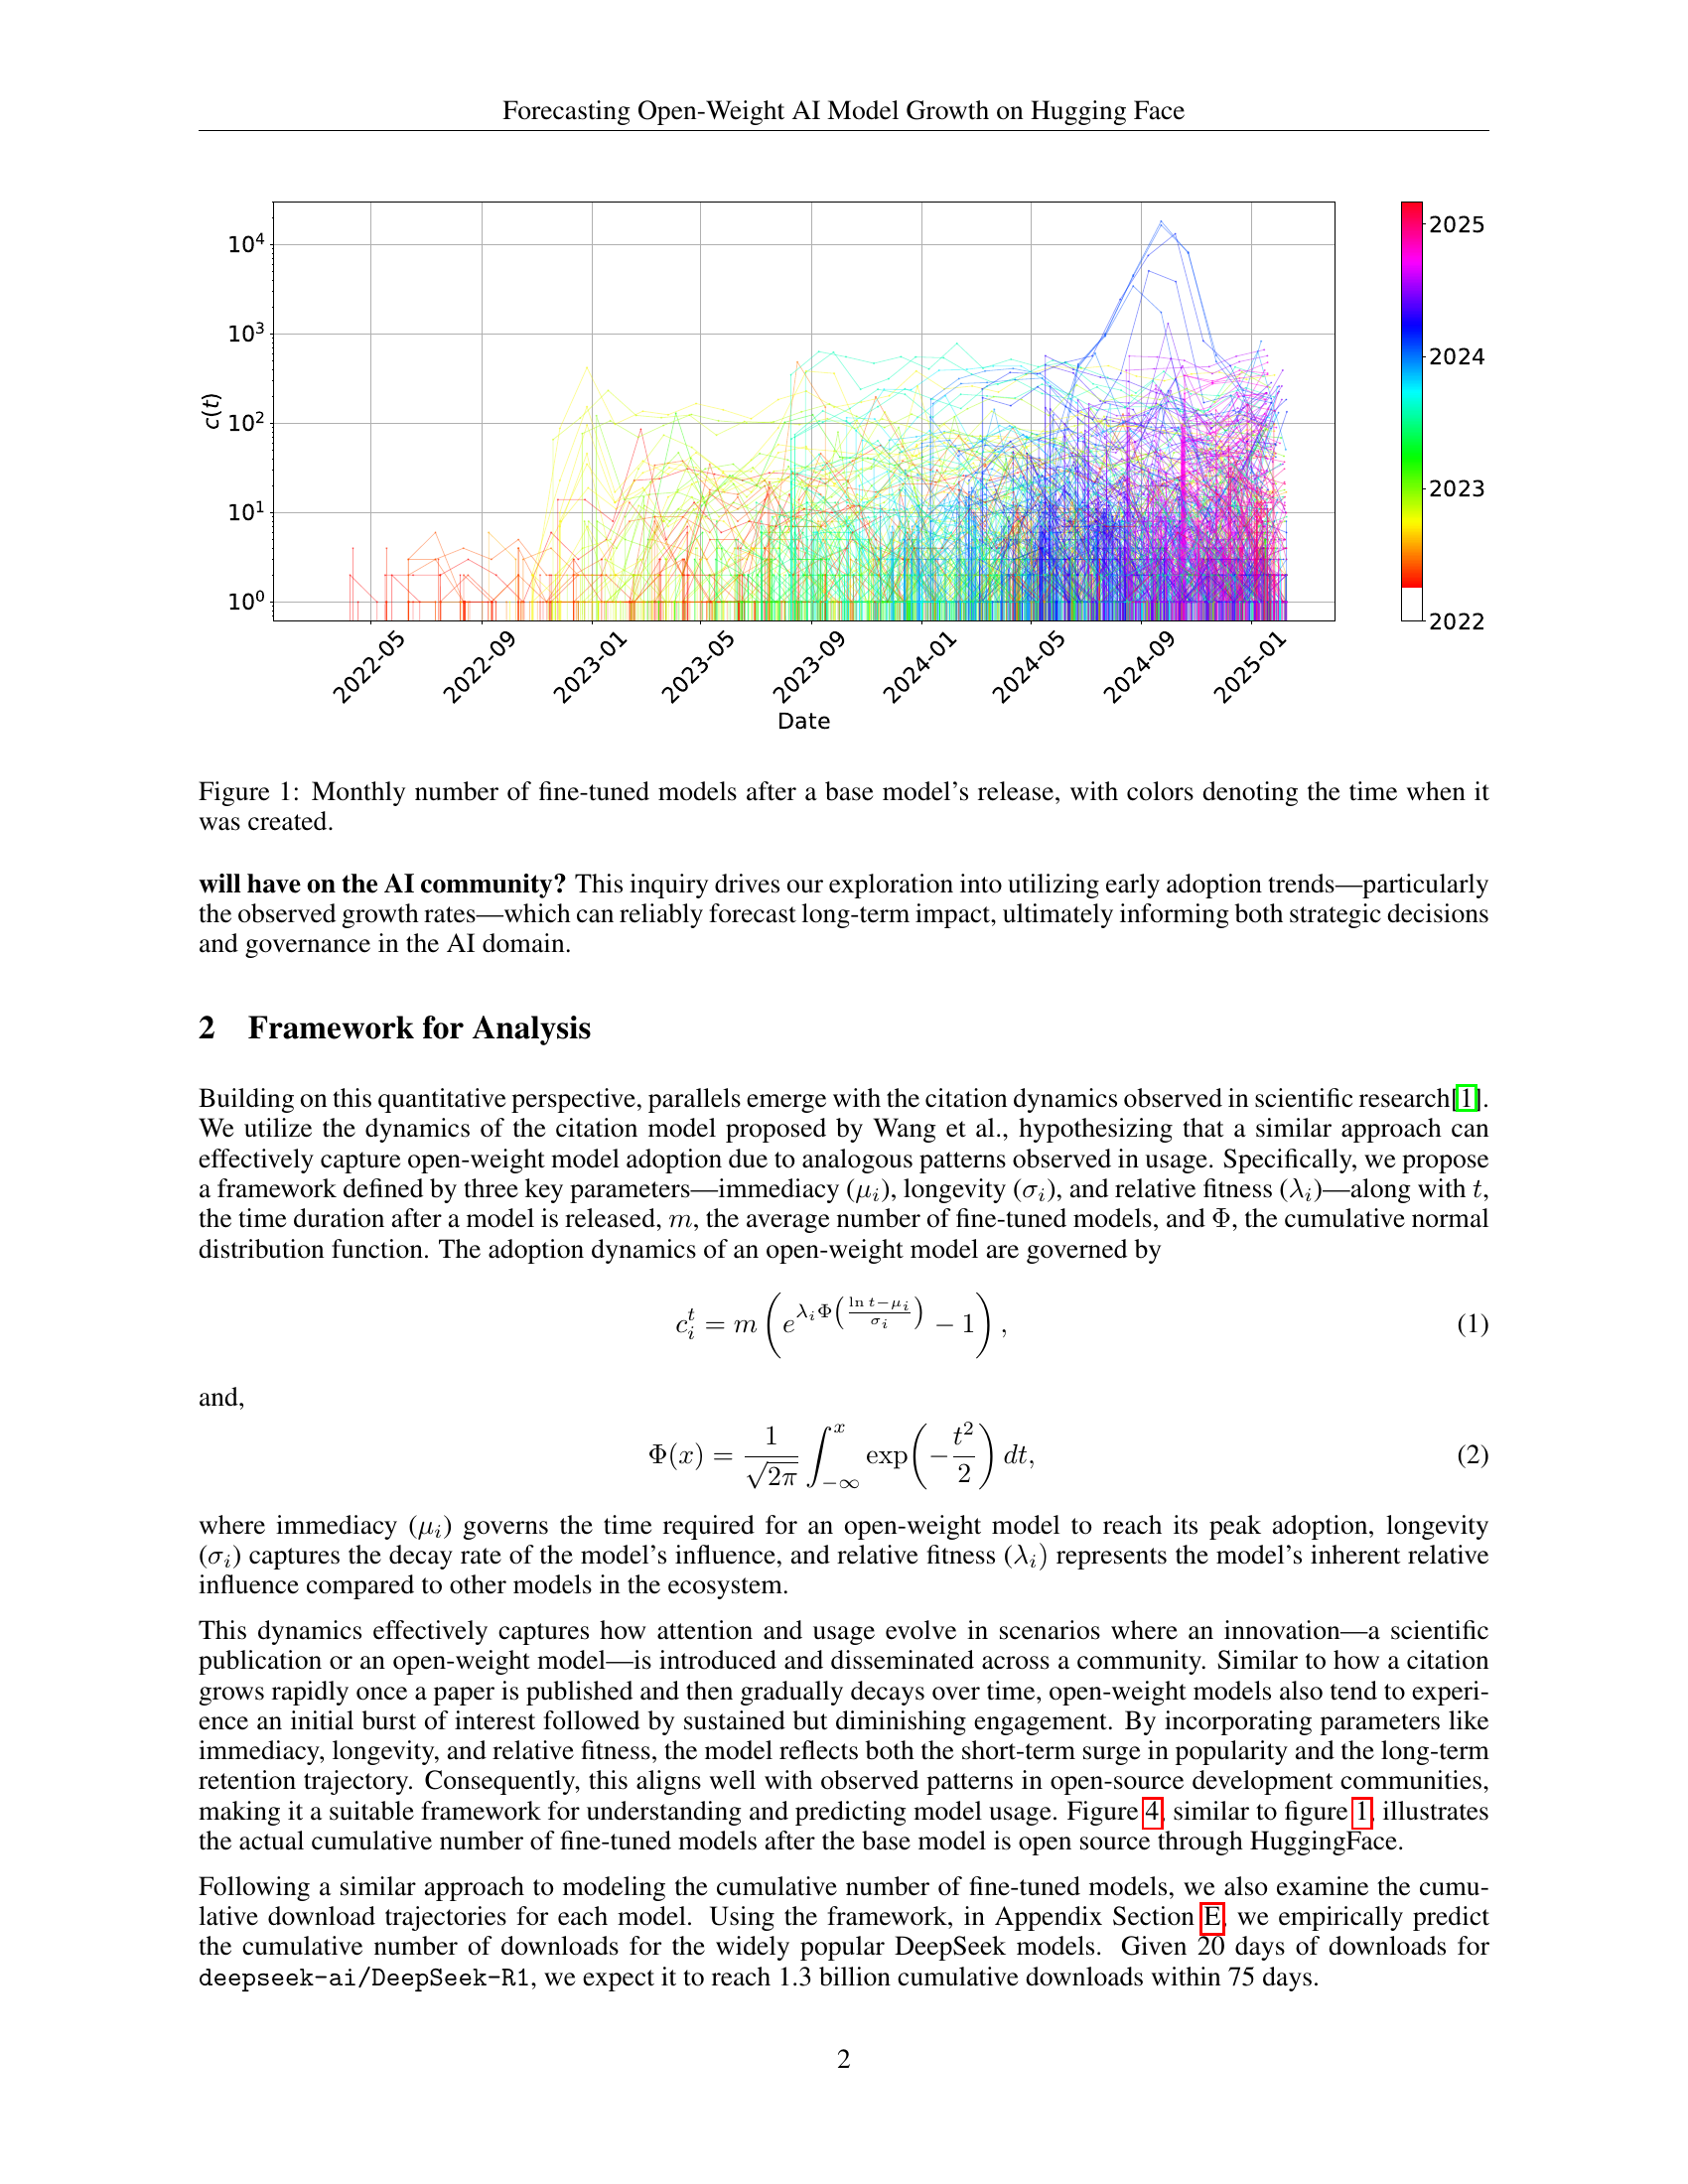
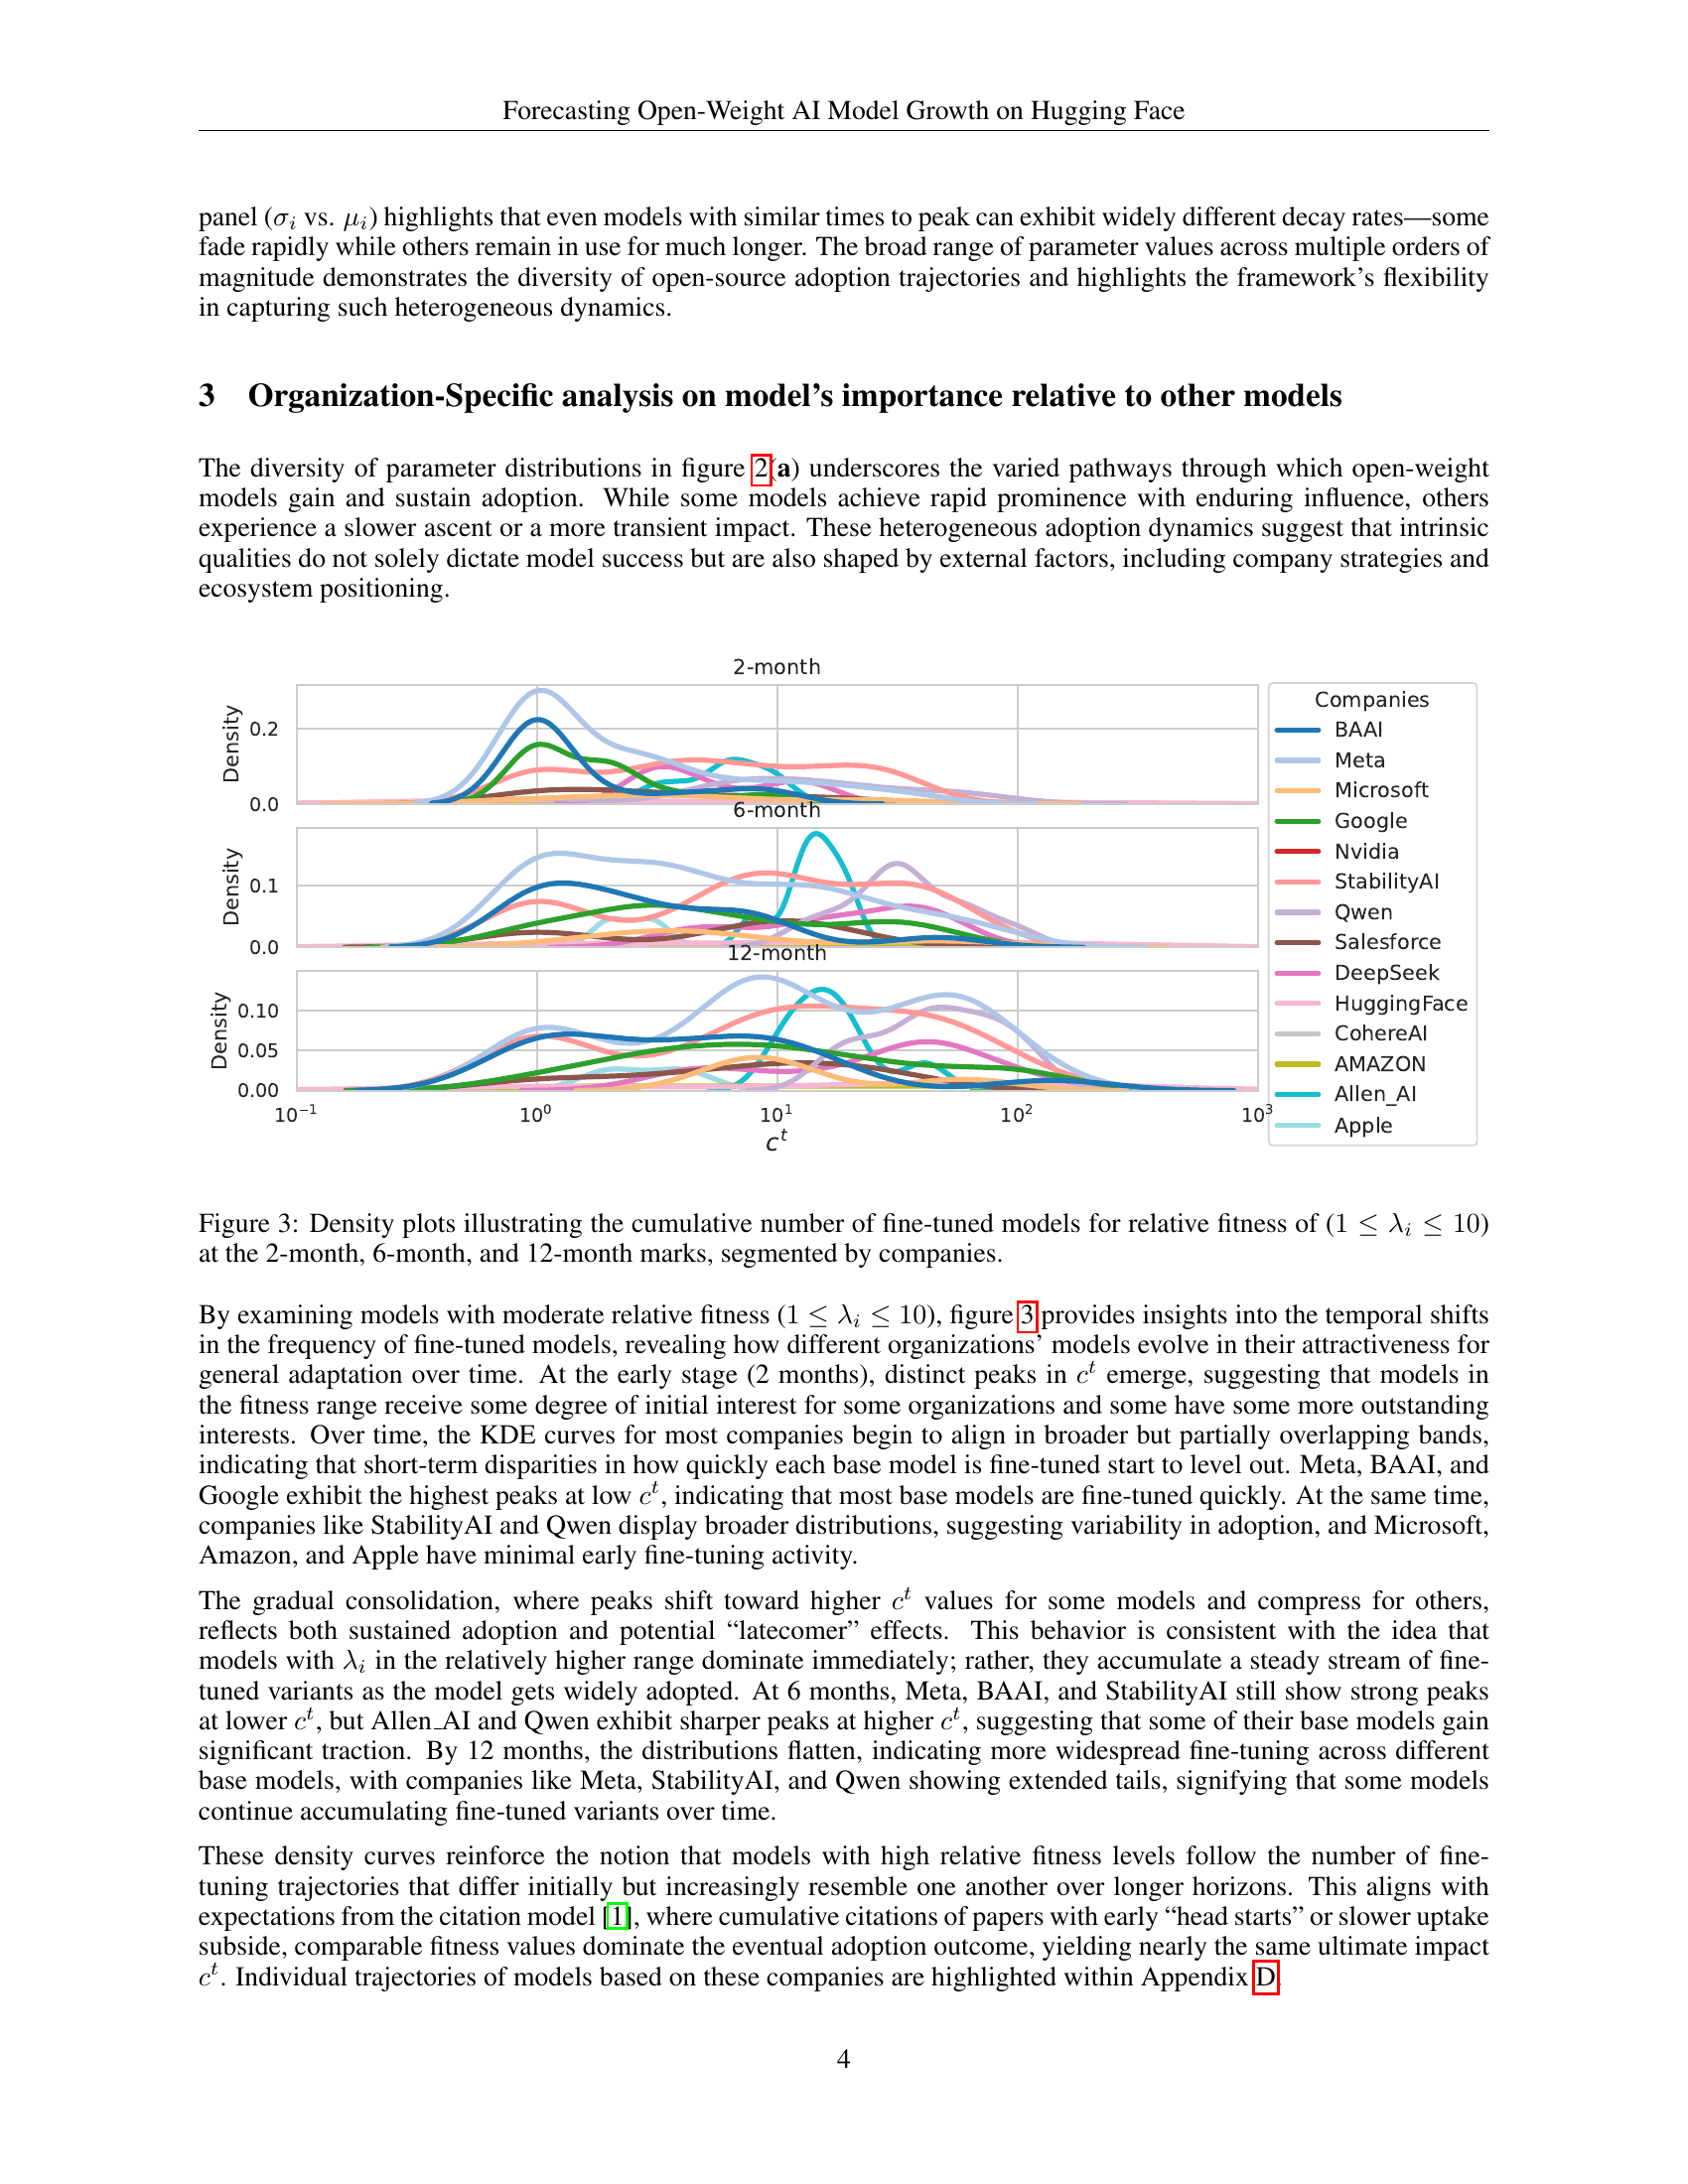
🔼 Figure 2 is a two-part figure that visualizes the distribution and relationships of three key parameters from a model of open-weight AI model adoption. Part (a) shows the distribution of values for immediacy (μi), longevity (σi), and relative fitness (λi) through histograms. This illustrates the range of adoption patterns observed across various AI models. Part (b) presents scatter plots showing the pairwise correlations between these three parameters on log-scale axes. These plots reveal how the parameters interrelate; for instance, they show how models with high relative fitness may have varying immediacy and longevity values.
read the caption
Figure 2: (a) Distribution of values for λ𝜆\lambdaitalic_λ, μ𝜇\muitalic_μ, and σ𝜎\sigmaitalic_σ. (b) Pairwise relationships among immediacy (μisubscript𝜇𝑖\mu_{i}italic_μ start_POSTSUBSCRIPT italic_i end_POSTSUBSCRIPT), longevity (σisubscript𝜎𝑖\sigma_{i}italic_σ start_POSTSUBSCRIPT italic_i end_POSTSUBSCRIPT), and relative fitness (λisubscript𝜆𝑖\lambda_{i}italic_λ start_POSTSUBSCRIPT italic_i end_POSTSUBSCRIPT) on log-scale axes.

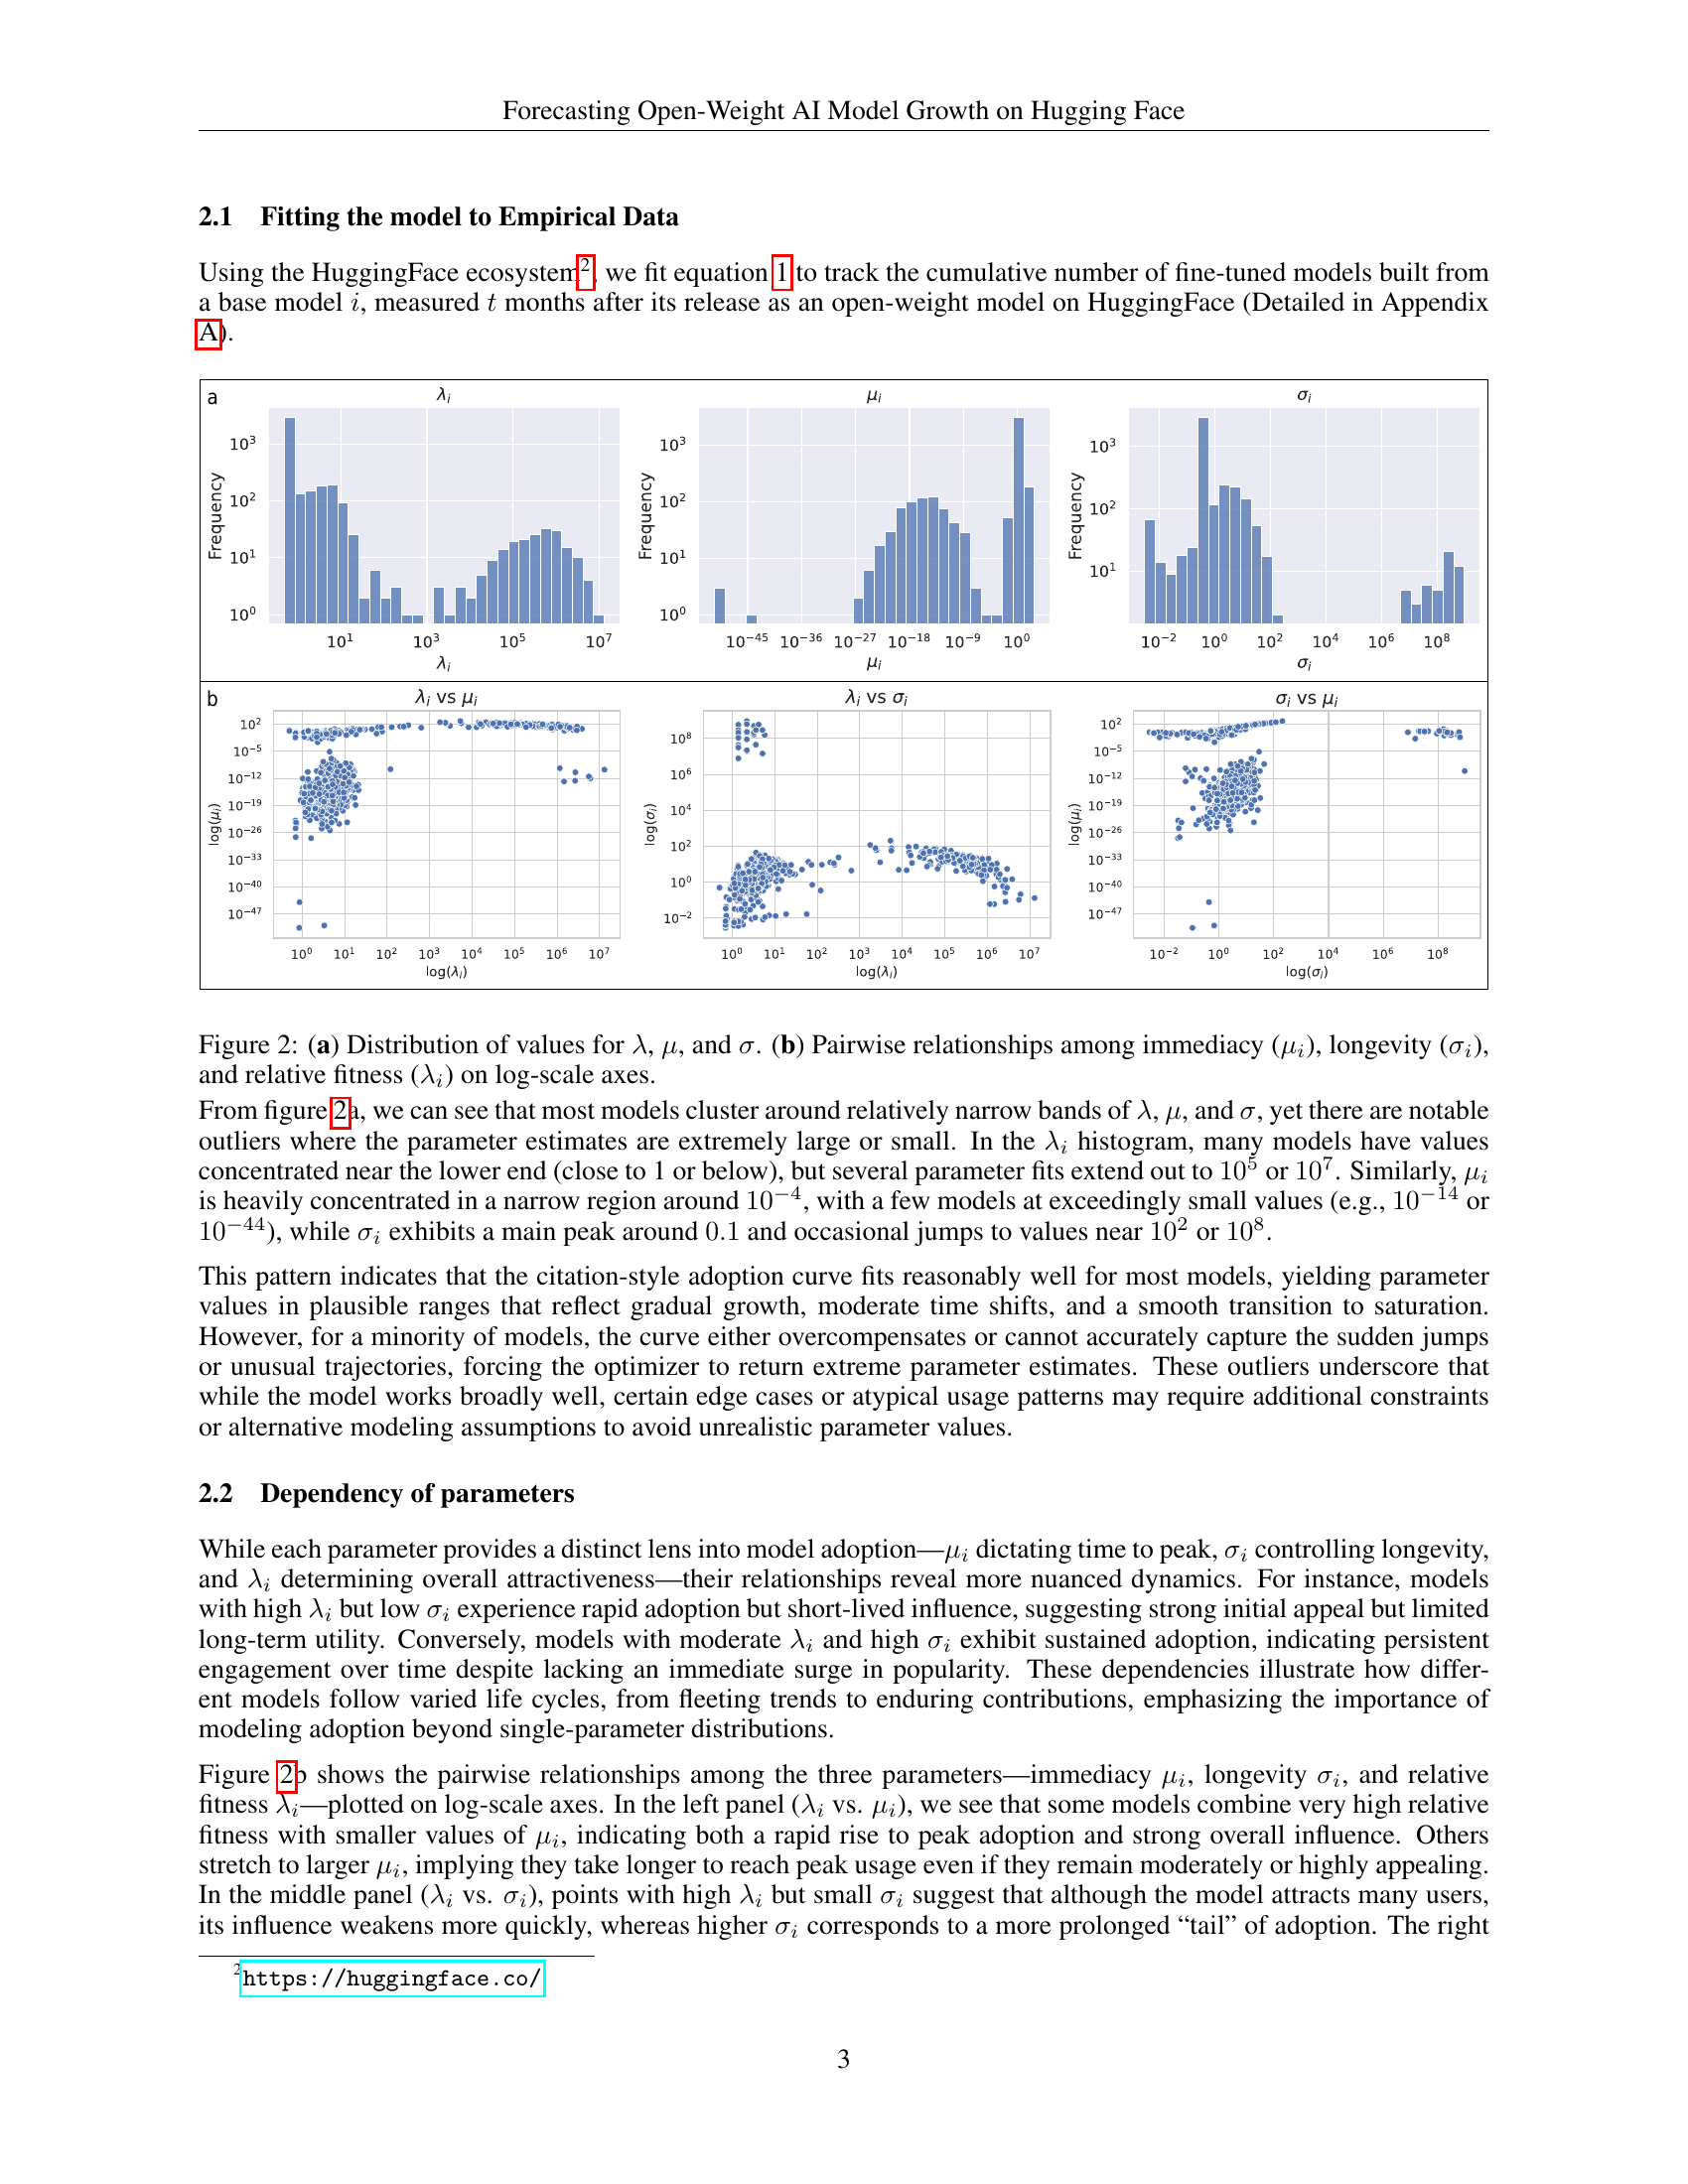
🔼 Figure 3 presents density plots illustrating the distribution of the cumulative number of fine-tuned models for open-weight models with a relative fitness (λi) between 1 and 10. The distributions are shown separately for 2, 6, and 12 months after the model’s release. The plots are further segmented by company to visualize the differences in model adoption patterns across different organizations. This allows for the observation of temporal changes in the frequency of fine-tuned models, revealing how various organizations’ models evolve in their attractiveness over time.
read the caption
Figure 3: Density plots illustrating the cumulative number of fine-tuned models for relative fitness of (1≤λi≤101subscript𝜆𝑖101\leq\lambda_{i}\leq 101 ≤ italic_λ start_POSTSUBSCRIPT italic_i end_POSTSUBSCRIPT ≤ 10) at the 2-month, 6-month, and 12-month marks, segmented by companies.

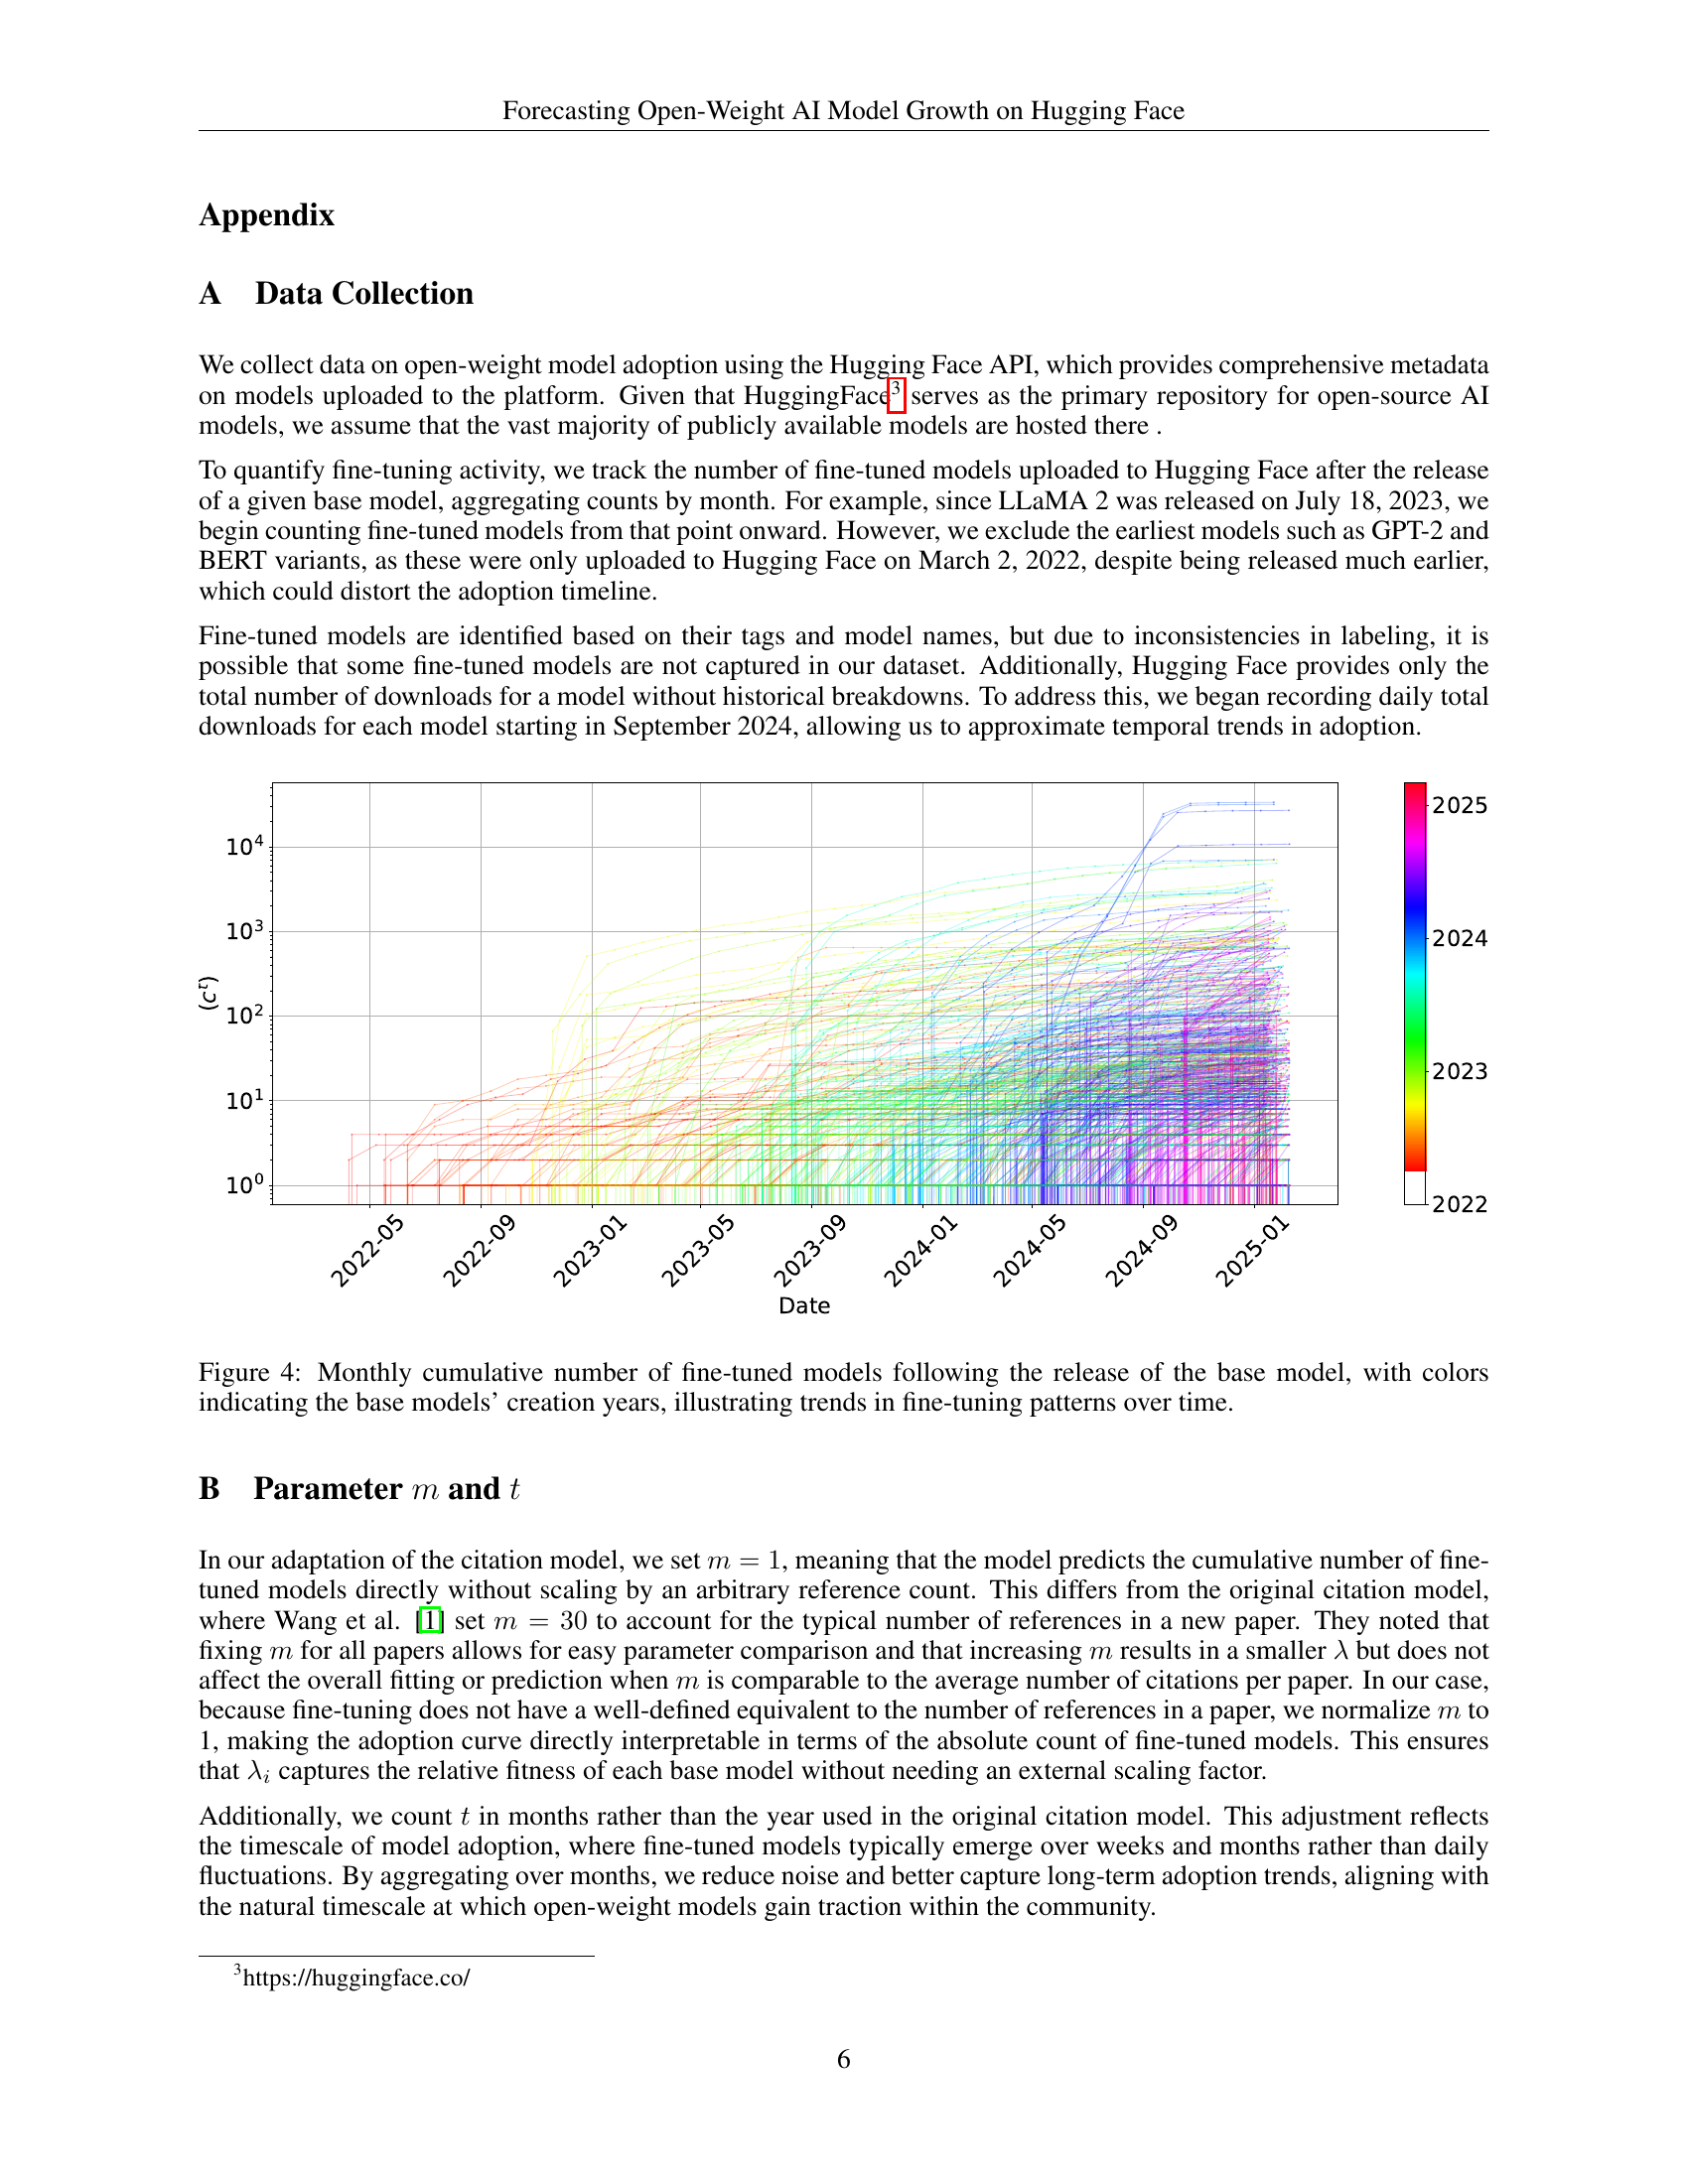
🔼 Figure 4 presents a graph showing the cumulative number of fine-tuned models created each month after the release of various base models. The x-axis represents time in months since the base model’s release, and the y-axis represents the cumulative count of fine-tuned models. Each line on the graph represents a different base model, with the color of the line indicating the year the corresponding base model was created. The figure visually demonstrates the varying adoption rates and overall popularity of different base models over time, highlighting the trends and patterns in the growth of fine-tuned models within the Hugging Face ecosystem.
read the caption
Figure 4: Monthly cumulative number of fine-tuned models following the release of the base model, with colors indicating the base models’ creation years, illustrating trends in fine-tuning patterns over time.

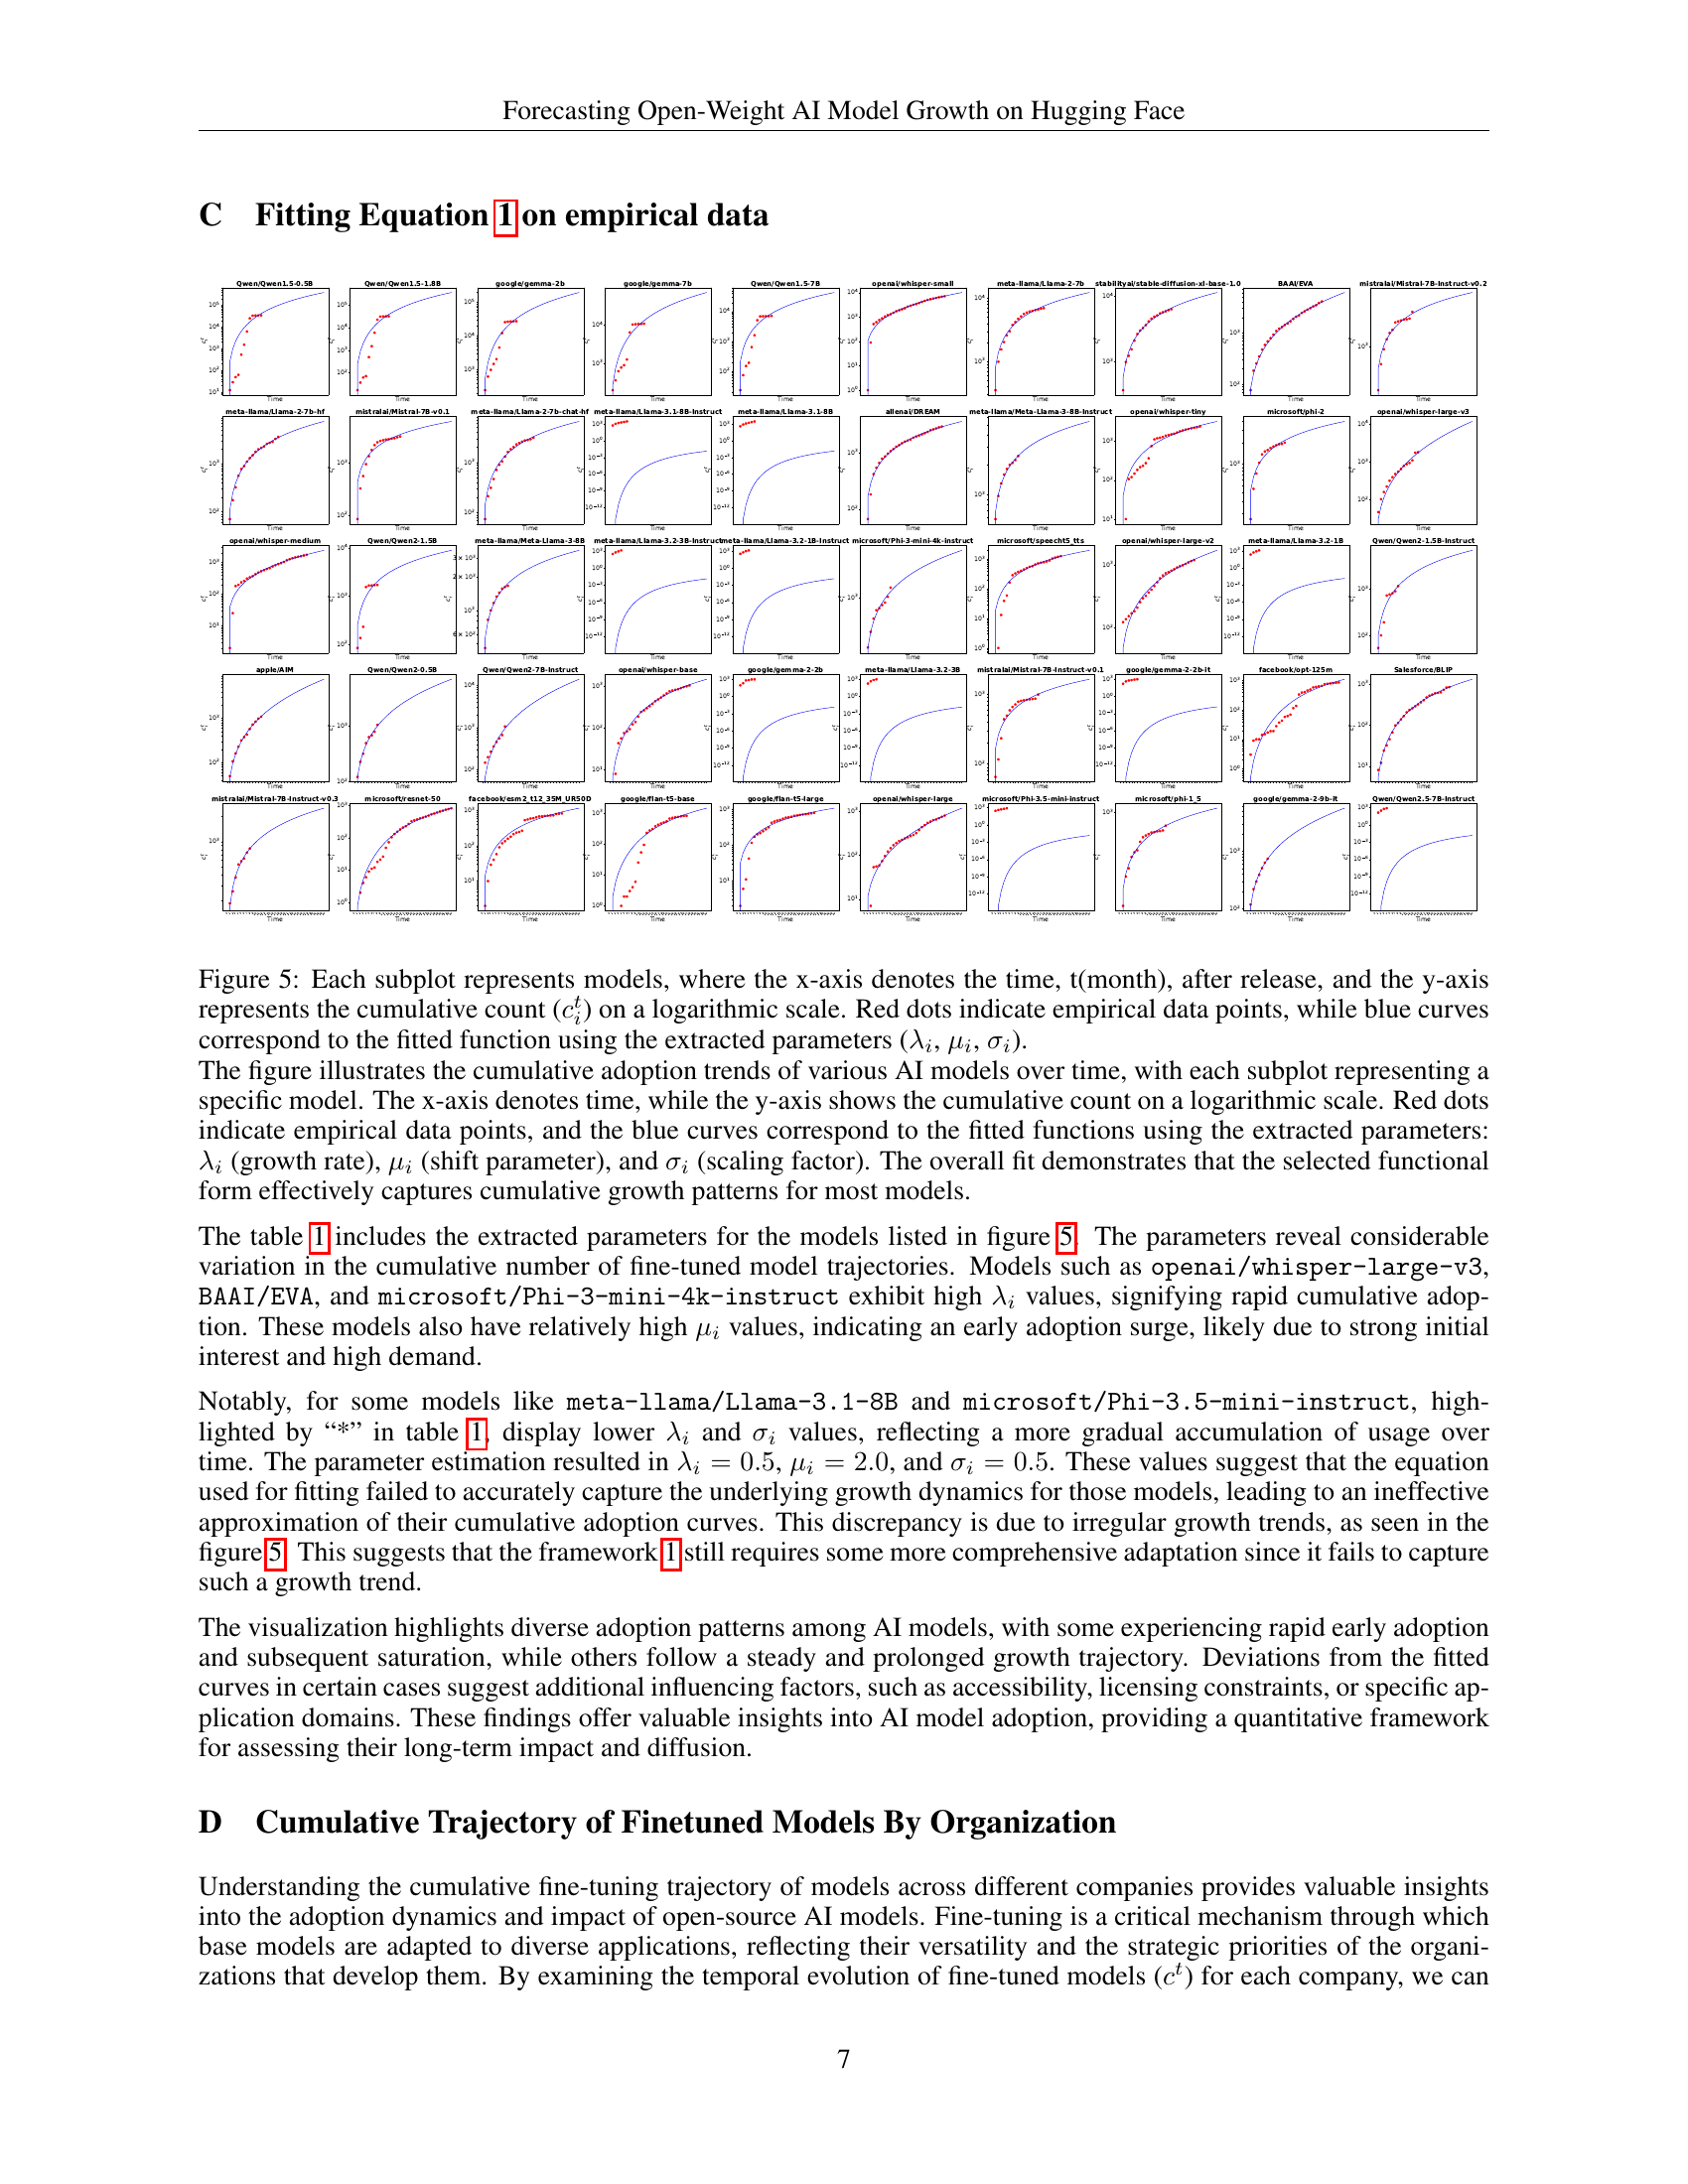
🔼 Figure 5 visualizes the cumulative adoption trajectories of numerous AI models over time. Each subplot focuses on a single model, plotting the cumulative number of fine-tuned models (y-axis) against the time since the model’s release in months (x-axis). The y-axis uses a logarithmic scale to better represent the wide range of adoption levels. Red dots represent the observed, empirical data points. The blue curve in each subplot is a fitted curve generated using a model with three parameters (λᵢ, μᵢ, σᵢ), which were derived from fitting a model to the data. These parameters capture different aspects of the adoption curve’s shape, such as growth rate, the time until peak adoption, and the decay rate of adoption.
read the caption
Figure 5: Each subplot represents models, where the x-axis denotes the time, t(month), after release, and the y-axis represents the cumulative count (citsuperscriptsubscript𝑐𝑖𝑡c_{i}^{t}italic_c start_POSTSUBSCRIPT italic_i end_POSTSUBSCRIPT start_POSTSUPERSCRIPT italic_t end_POSTSUPERSCRIPT) on a logarithmic scale. Red dots indicate empirical data points, while blue curves correspond to the fitted function using the extracted parameters (λisubscript𝜆𝑖\lambda_{i}italic_λ start_POSTSUBSCRIPT italic_i end_POSTSUBSCRIPT, μisubscript𝜇𝑖\mu_{i}italic_μ start_POSTSUBSCRIPT italic_i end_POSTSUBSCRIPT, σisubscript𝜎𝑖\sigma_{i}italic_σ start_POSTSUBSCRIPT italic_i end_POSTSUBSCRIPT).

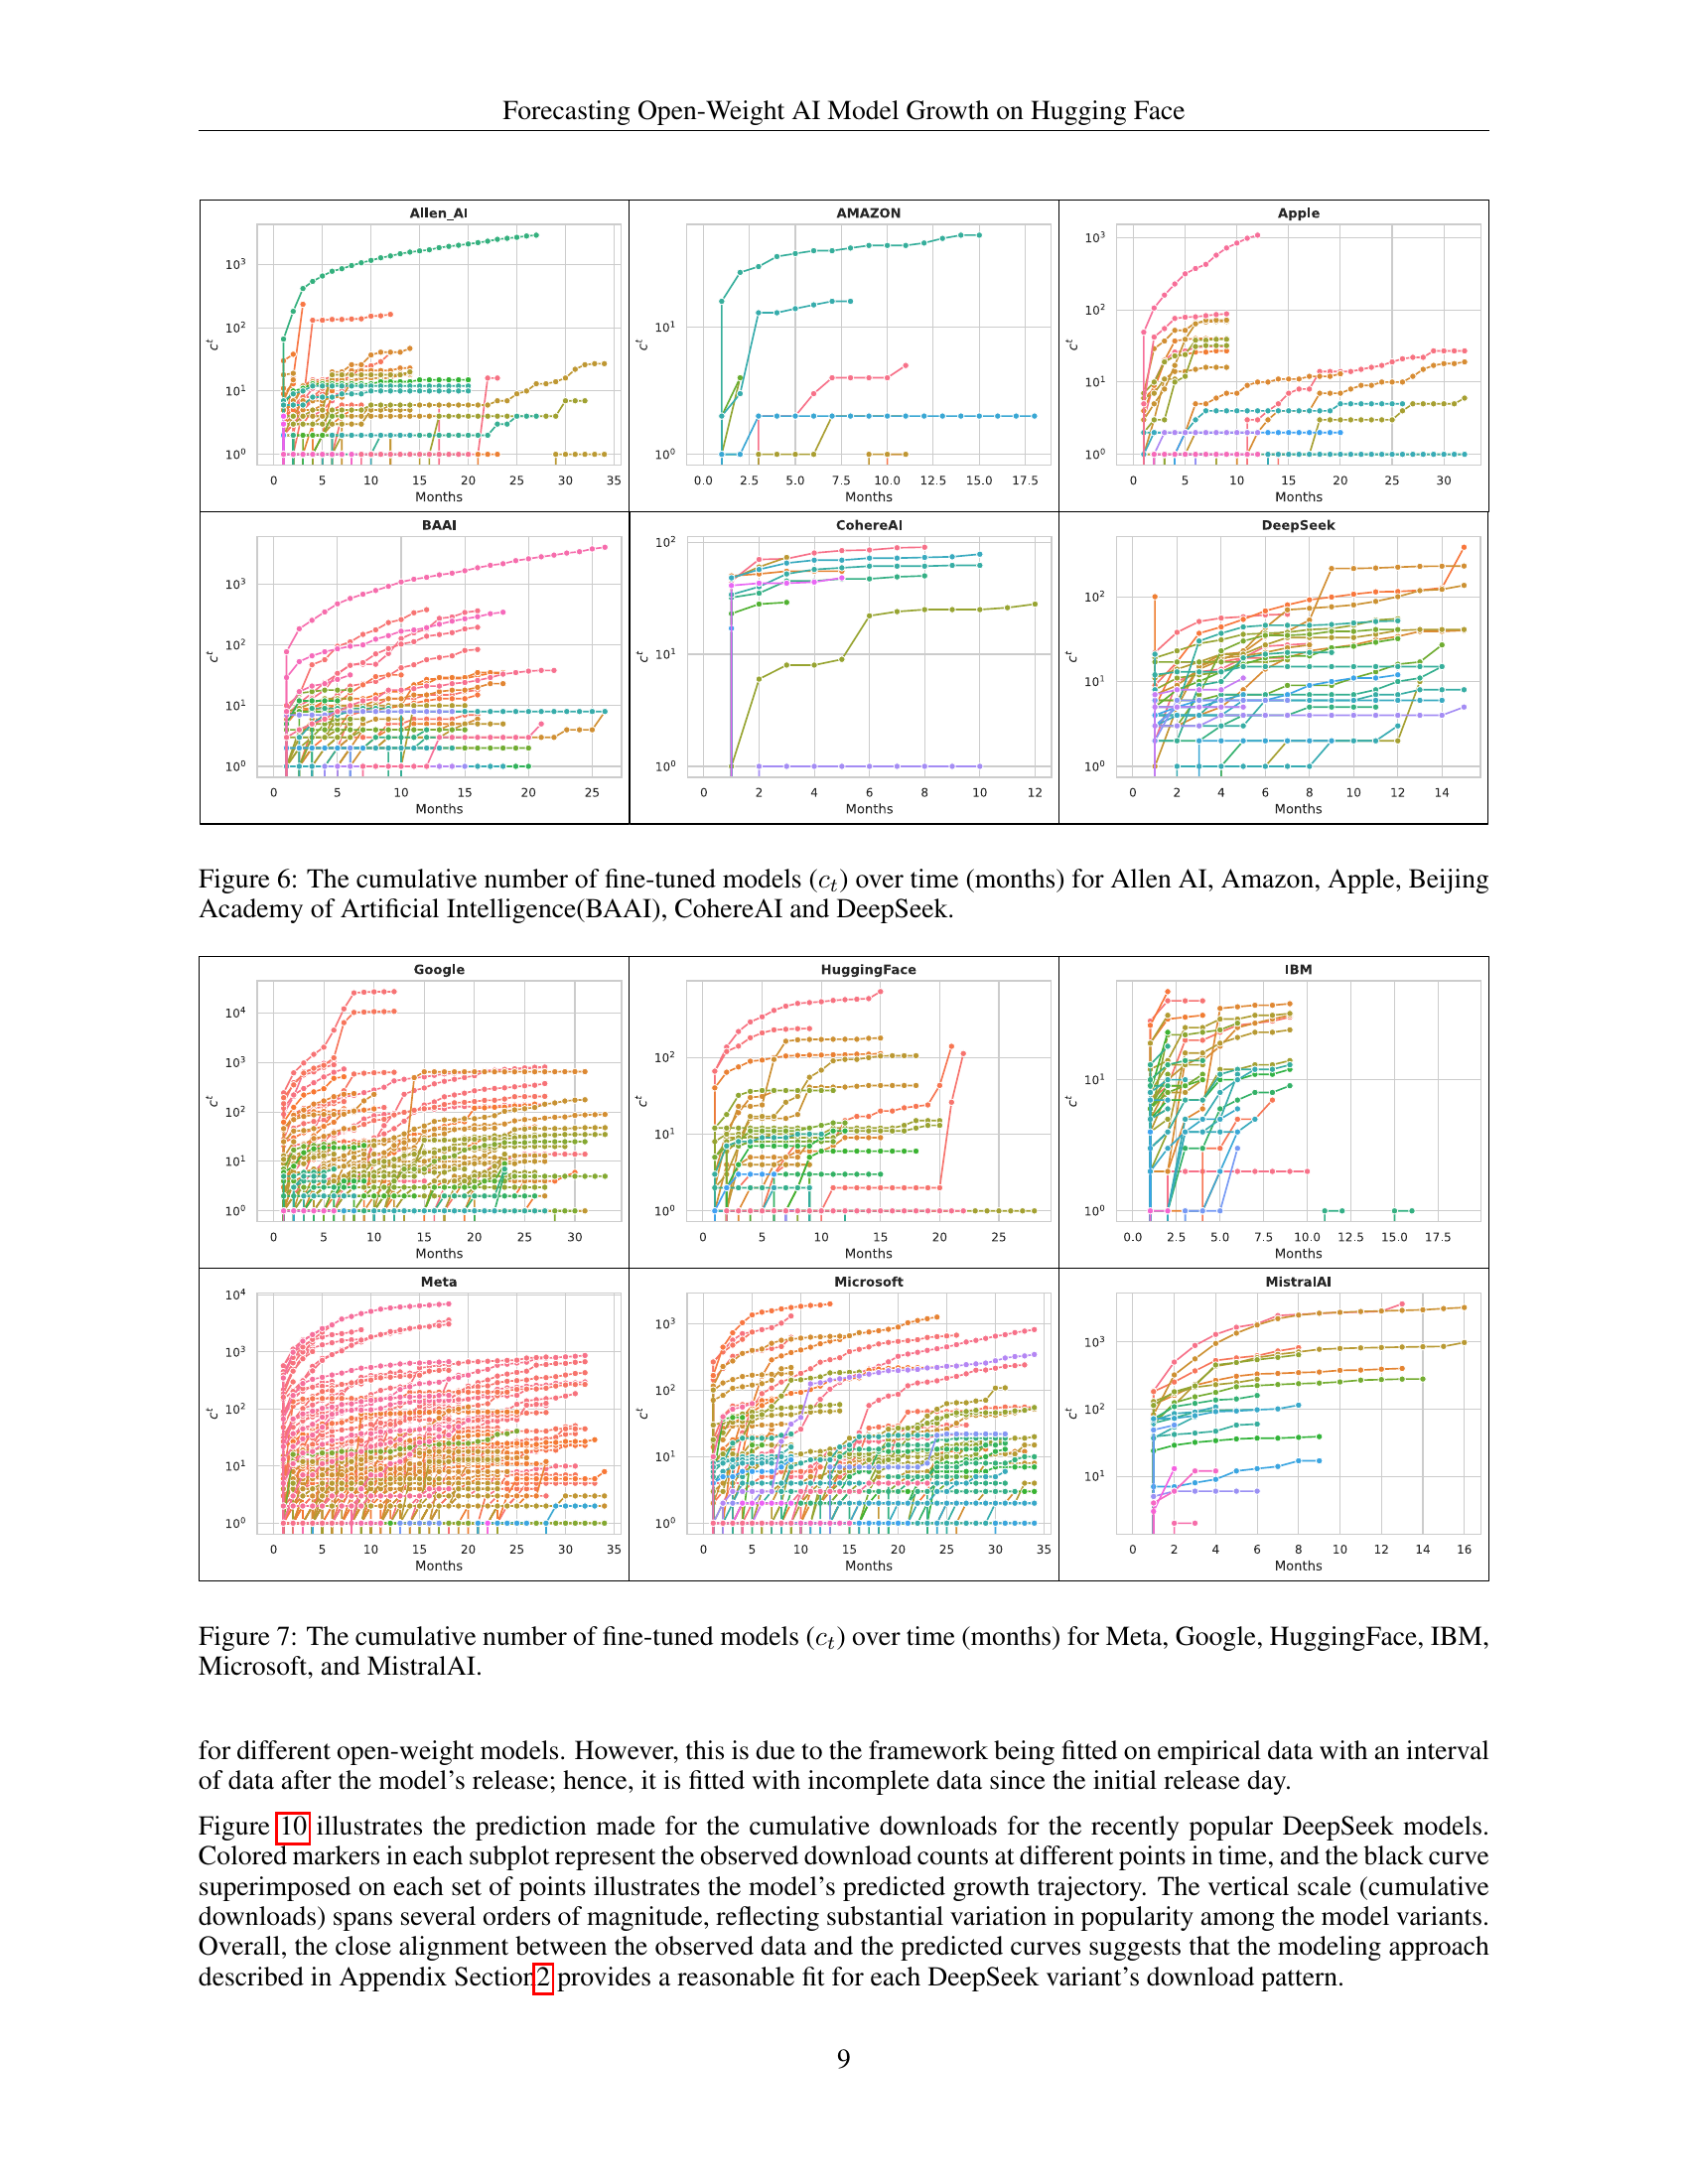
🔼 This figure displays the cumulative number of fine-tuned models created over time (in months) for six different organizations: Allen AI, Amazon, Apple, Beijing Academy of Artificial Intelligence (BAAI), CohereAI, and DeepSeek. Each organization’s data is shown as a separate line graph. The y-axis represents the cumulative number of fine-tuned models, and the x-axis represents the time elapsed in months. This visualization helps illustrate the relative popularity and adoption rates of models from each organization within the Hugging Face ecosystem.
read the caption
Figure 6: The cumulative number of fine-tuned models (ctsubscript𝑐𝑡c_{t}italic_c start_POSTSUBSCRIPT italic_t end_POSTSUBSCRIPT) over time (months) for Allen AI, Amazon, Apple, Beijing Academy of Artificial Intelligence(BAAI), CohereAI and DeepSeek.

🔼 This figure presents a comparison of the cumulative number of fine-tuned models over time (in months) for six prominent AI companies: Meta, Google, Hugging Face, IBM, Microsoft, and MistralAI. Each company’s data is displayed as a separate line graph, allowing for a visual comparison of the adoption rates and overall popularity of their respective base models within the HuggingFace platform. The graph provides insights into the temporal dynamics of model fine-tuning and the relative popularity of models released by these companies.
read the caption
Figure 7: The cumulative number of fine-tuned models (ctsubscript𝑐𝑡c_{t}italic_c start_POSTSUBSCRIPT italic_t end_POSTSUBSCRIPT) over time (months) for Meta, Google, HuggingFace, IBM, Microsoft, and MistralAI.

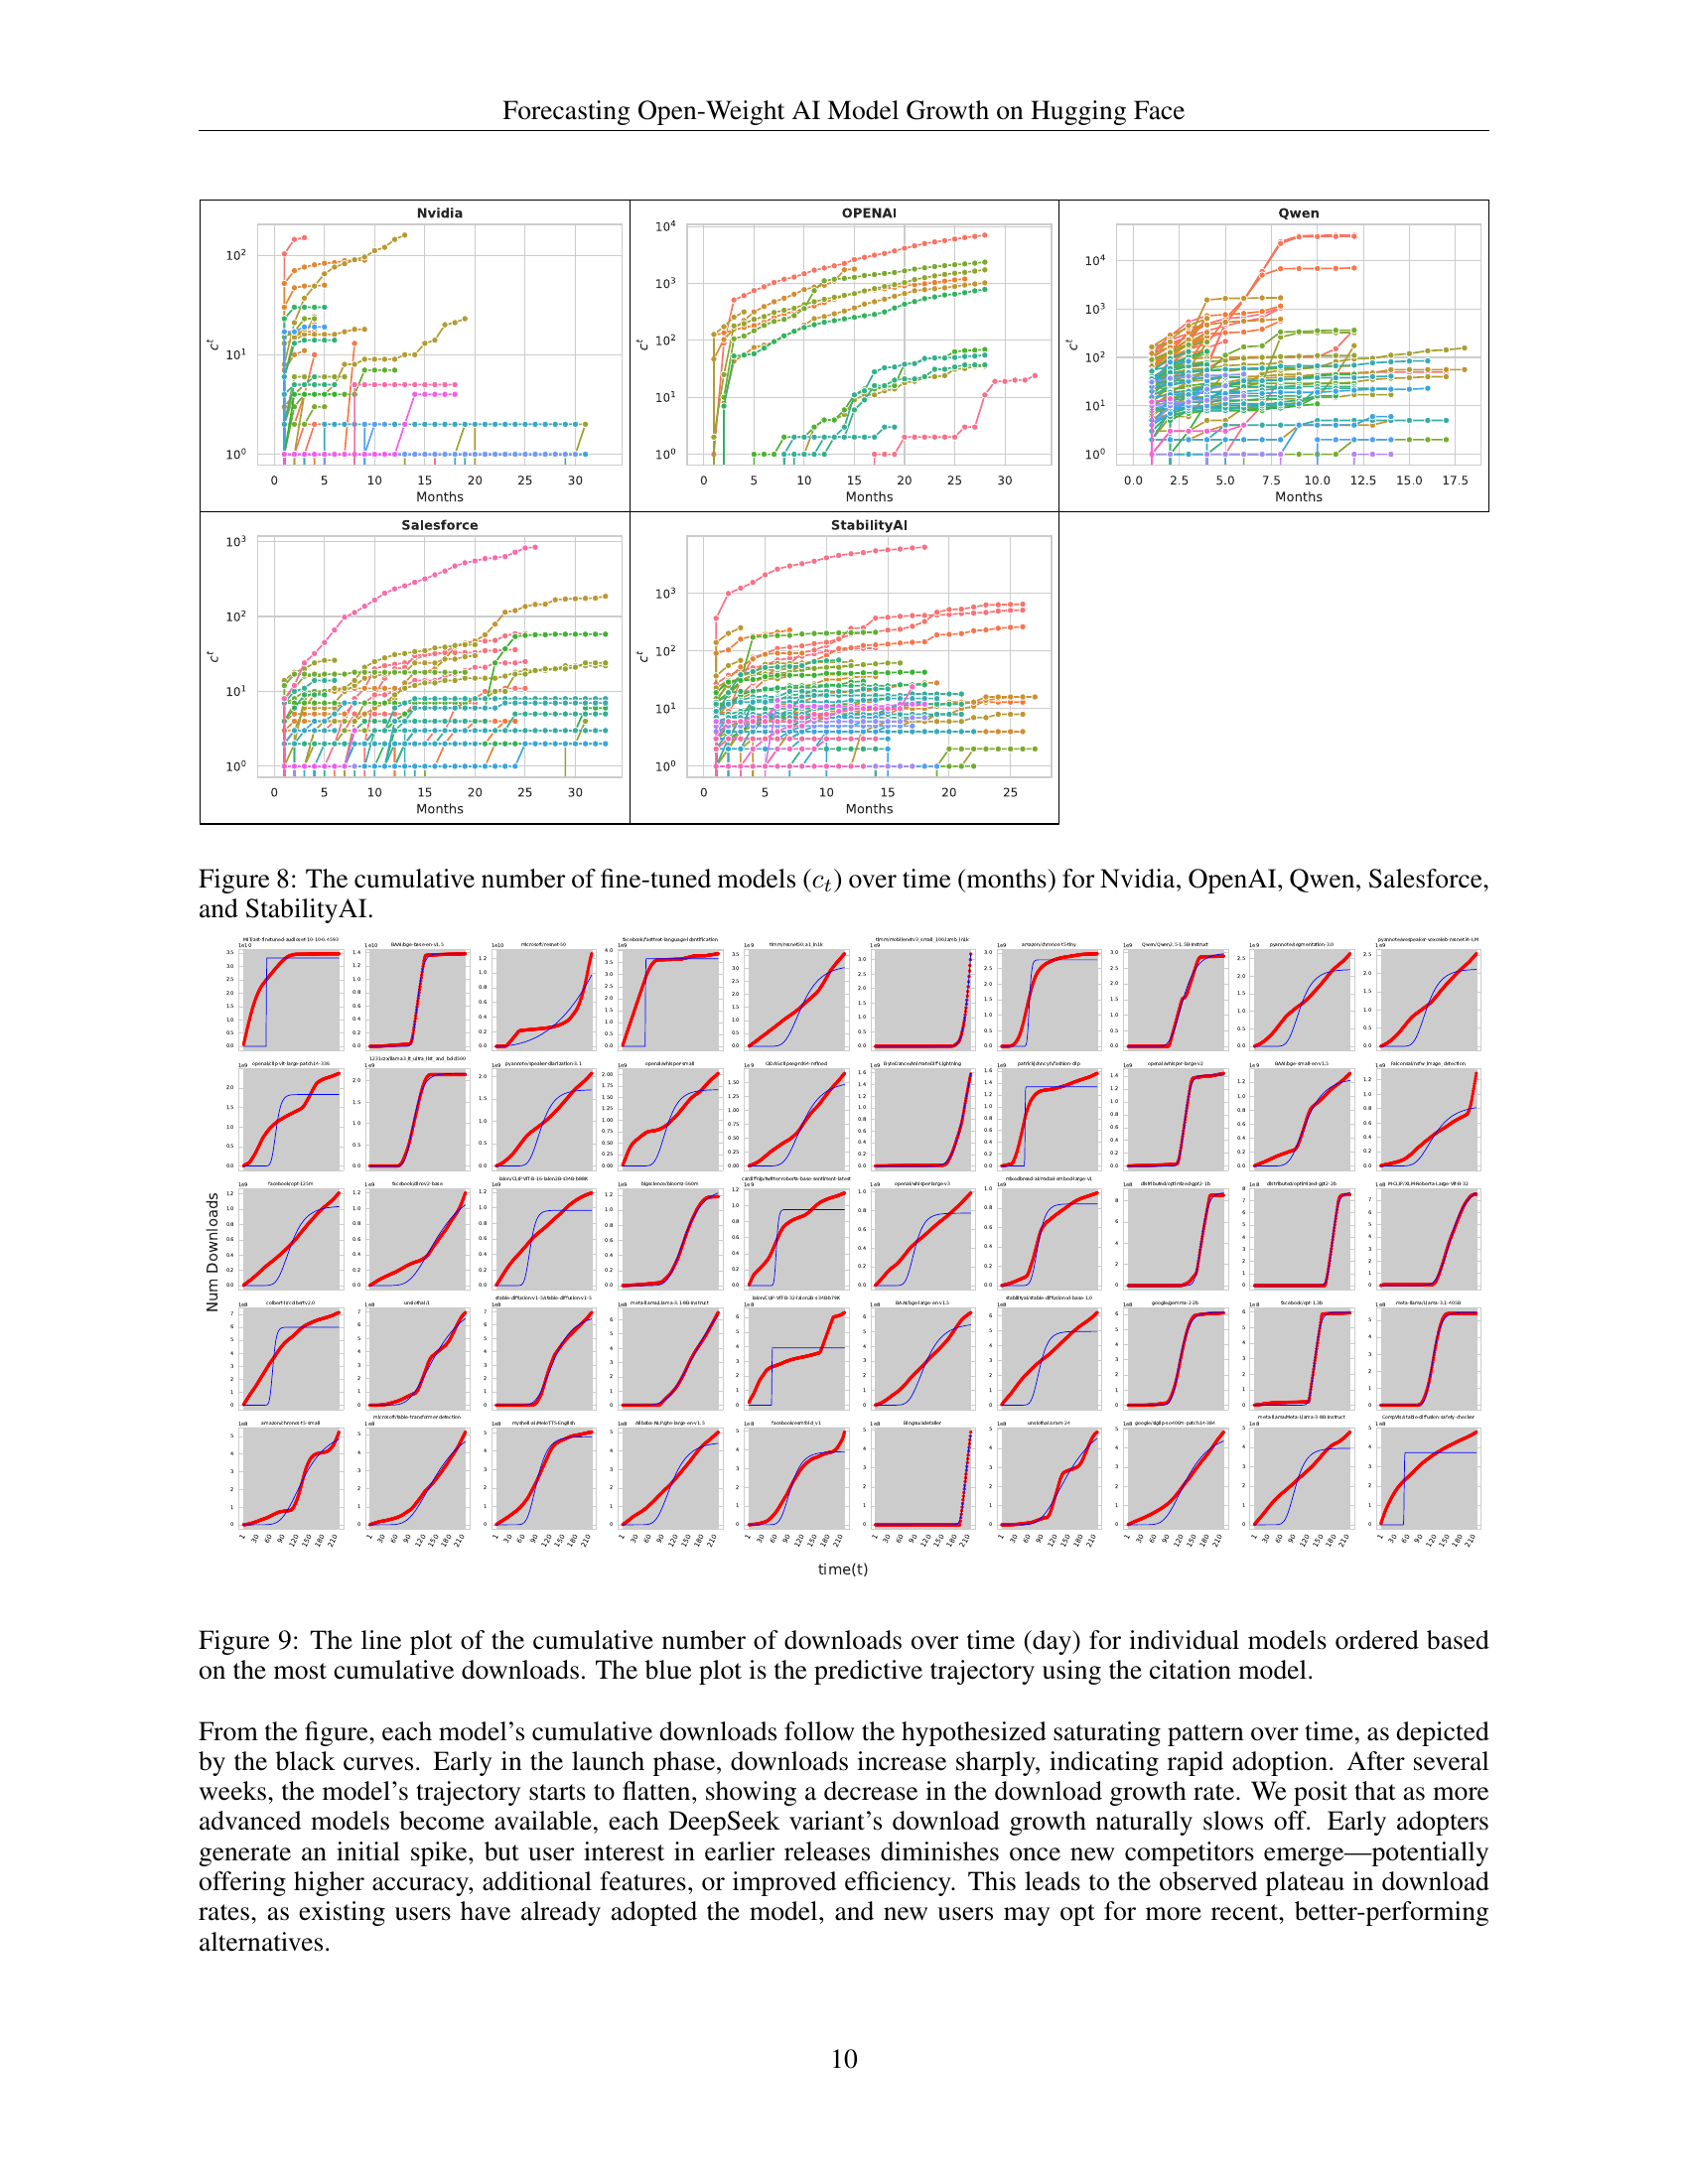
🔼 This figure displays the cumulative number of fine-tuned models created from the base models of Nvidia, OpenAI, Qwen, Salesforce, and StabilityAI over a period of time (in months). Each line represents a specific company and illustrates how the number of fine-tuned models derived from its base models increased over the months. This visualization provides a clear view of the adoption and usage trends for the open-source models released by these companies. The figure shows not only the growth in adoption but also possibly the duration of each company’s model’s popularity.
read the caption
Figure 8: The cumulative number of fine-tuned models (ctsubscript𝑐𝑡c_{t}italic_c start_POSTSUBSCRIPT italic_t end_POSTSUBSCRIPT) over time (months) for Nvidia, OpenAI, Qwen, Salesforce, and StabilityAI.

🔼 This figure visualizes the cumulative downloads of various open-weight AI models over time, displayed as individual line plots ordered by their total downloads. Each line represents a specific model, illustrating its download trajectory. A key aspect of the visualization is the comparison between the actual download counts (represented by colored markers) and the predicted cumulative downloads generated by the citation model (the blue line). This comparison allows for an assessment of the model’s predictive accuracy. The x-axis represents time in days, and the y-axis shows the cumulative number of downloads on a logarithmic scale.
read the caption
Figure 9: The line plot of the cumulative number of downloads over time (day) for individual models ordered based on the most cumulative downloads. The blue plot is the predictive trajectory using the citation model.

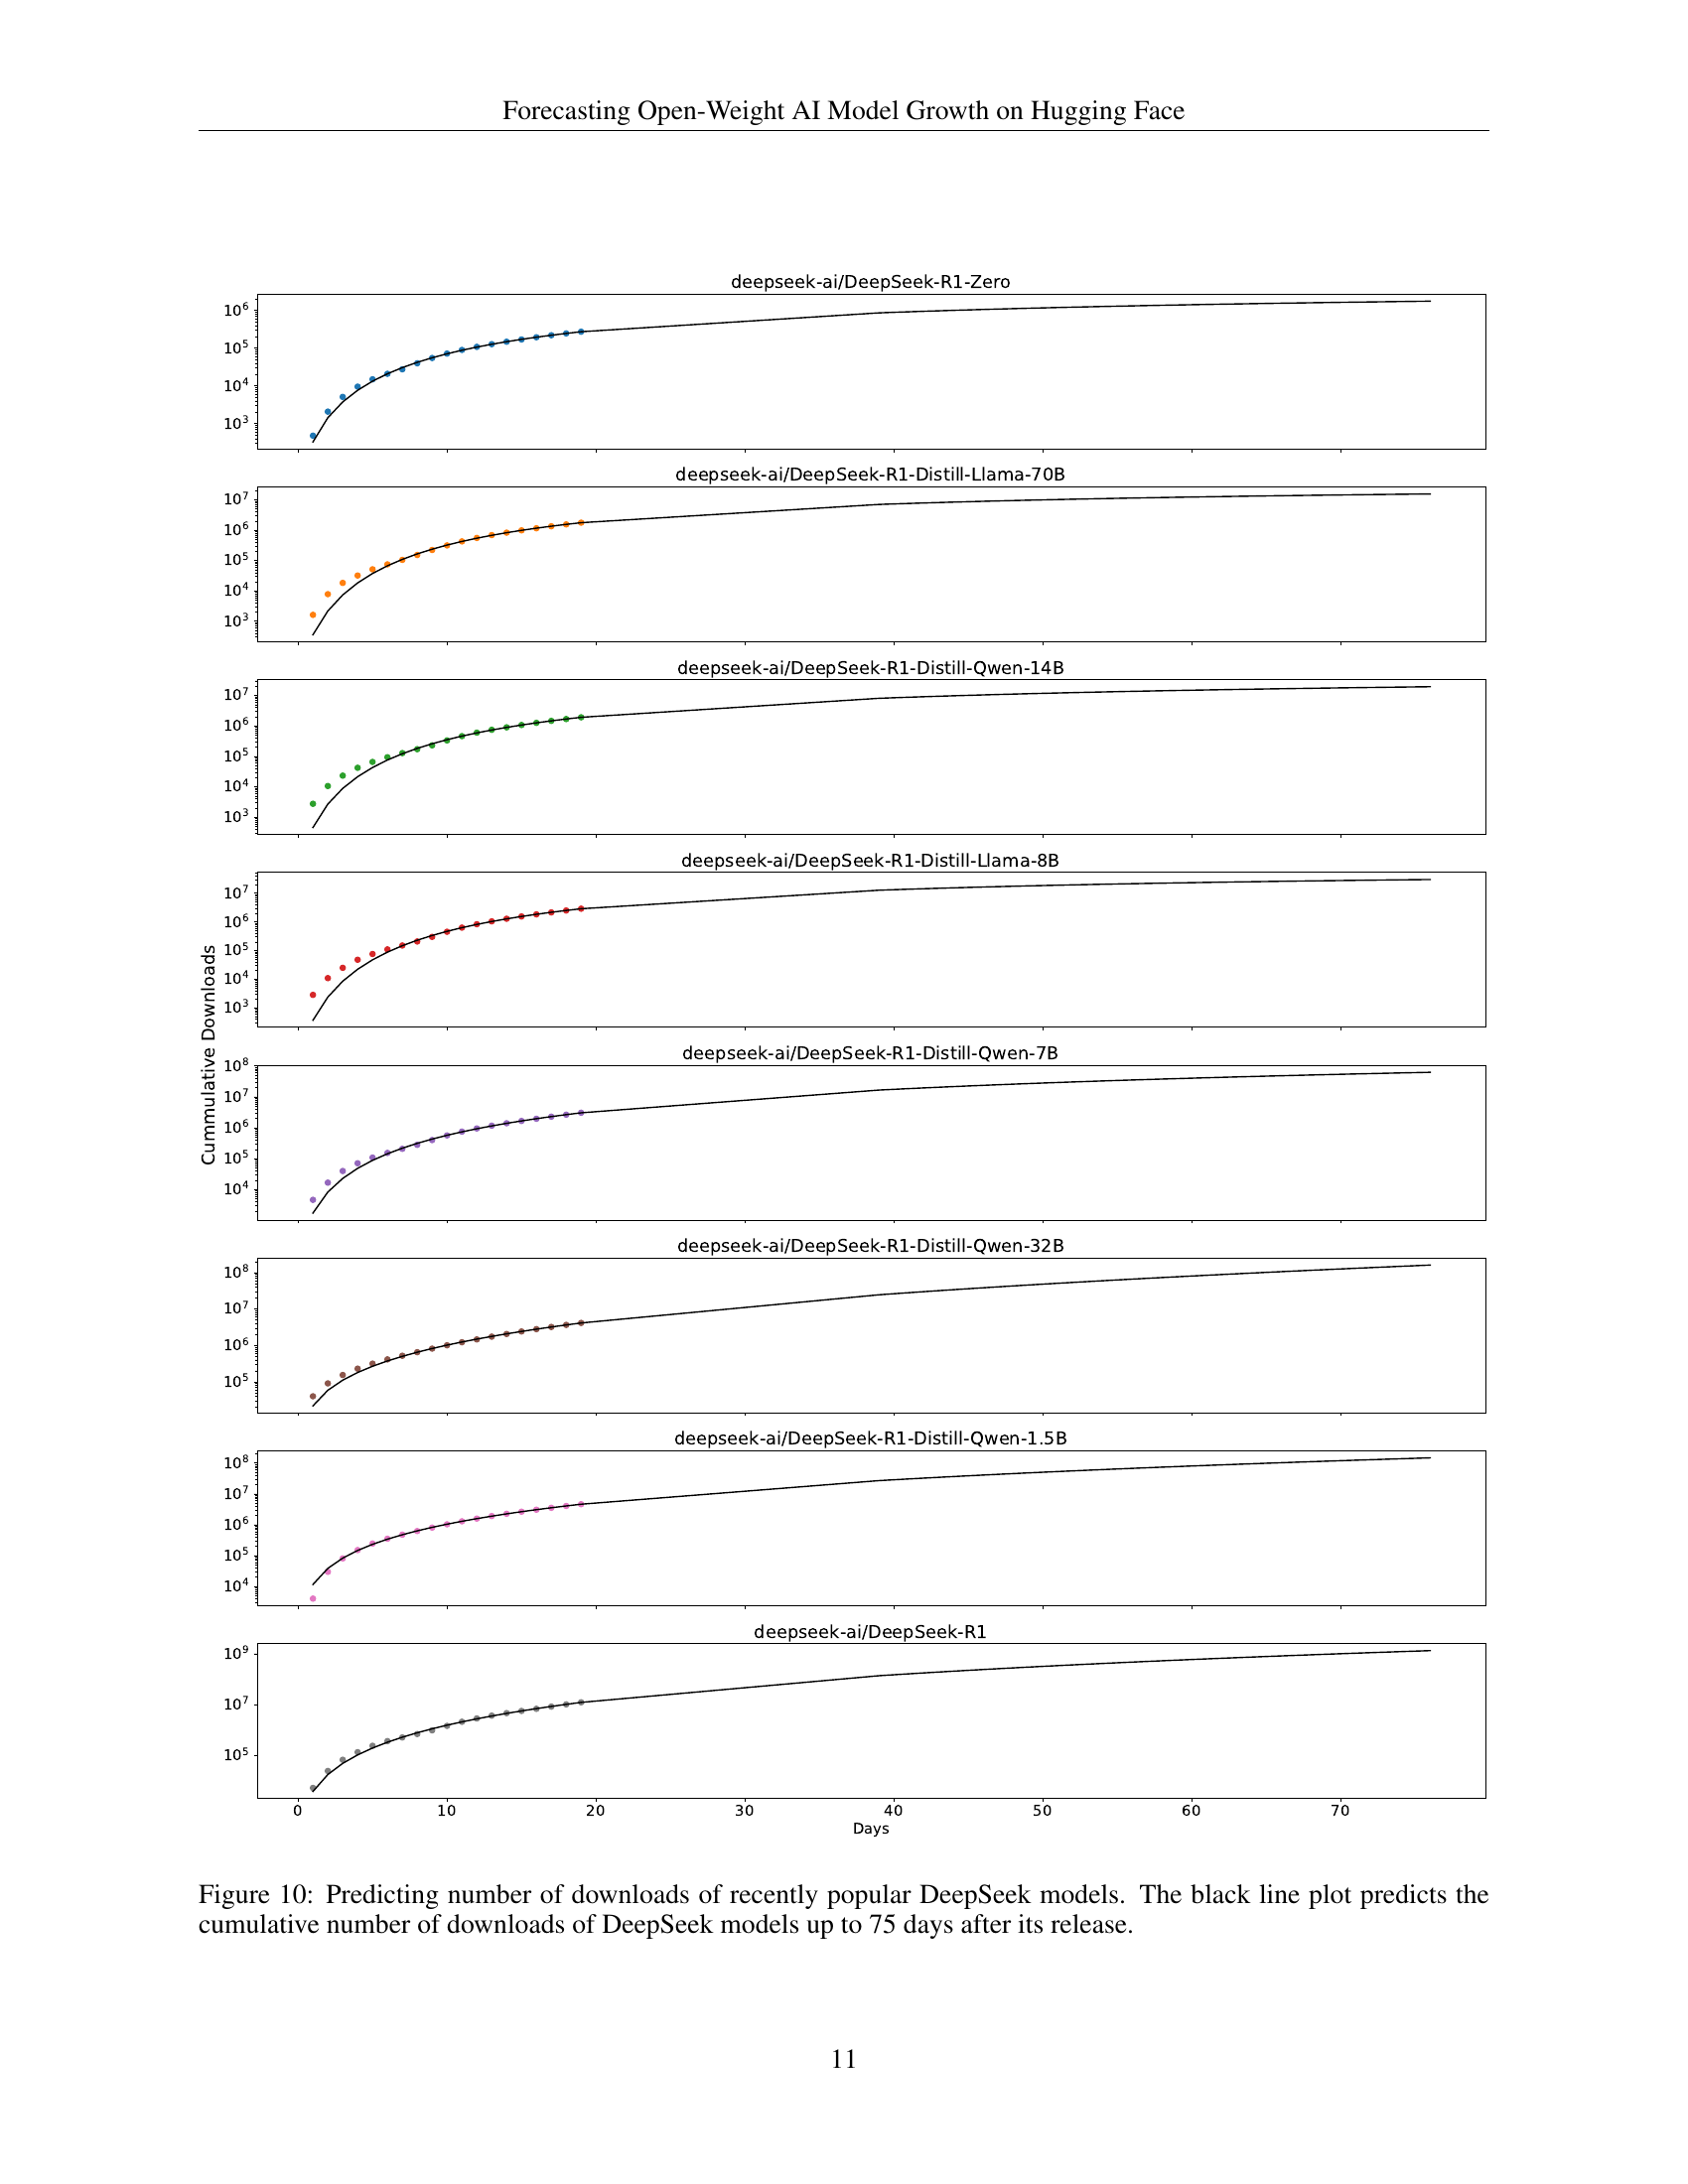
🔼 Figure 10 presents the predicted cumulative download counts for various DeepSeek models over a 75-day period following their release. Each colored line represents a different DeepSeek model variant, showing the actual download trajectory. The black line represents the model’s prediction of the cumulative downloads for each variant up to 75 days post-release. This visualization demonstrates the model’s ability to forecast the adoption trajectory of newly released open-source AI models based on early download data. The graph displays the diverse growth patterns among different DeepSeek models. Some models exhibit rapid initial adoption followed by slower growth, while others show more gradual, sustained increases in downloads.
read the caption
Figure 10: Predicting number of downloads of recently popular DeepSeek models. The black line plot predicts the cumulative number of downloads of DeepSeek models up to 75 days after its release.
Full paper#