TL;DR#
Large Language Models (LLMs) are powerful but fine-tuning them is computationally expensive. Low-Rank Adaptation (LoRA) offers a parameter-efficient alternative but often falls short of full fine-tuning performance. Existing methods use static SVD subsets for initialization, leading to suboptimal use of pre-trained knowledge. Incorporating Mixture-of-Experts (MoE) architectures improves LoRA, weight misalignment and gradient dynamics pose challenges, hindering SVD prior use. Addressing this is crucial for better efficiency and performance.
This paper introduces Great LoRA Mixture-of-Expert (GOAT), a framework that adaptively integrates relevant priors using an SVD-structured MoE, aligning optimization with full fine-tuned MoE via a theoretical scaling factor. GOAT initializes LoRA MOE experts with distinct SVD knowledge segments. The method aligns weight & gradient, ensuring the equivalent weight equals to the pre-trained weight. Experiments across 25 datasets show state-of-the-art performance, closing the gap with Full FT without modifying architecture or training algorithms.
Key Takeaways#
Why does it matter?#
This paper is crucial for efficient LLM fine-tuning. GOAT innovates prior integration and optimization, reducing the performance gap with full fine-tuning. Its broad evaluation across tasks highlights its practical relevance, opening avenues for resource-efficient AI development and inspiring future research.
Visual Insights#

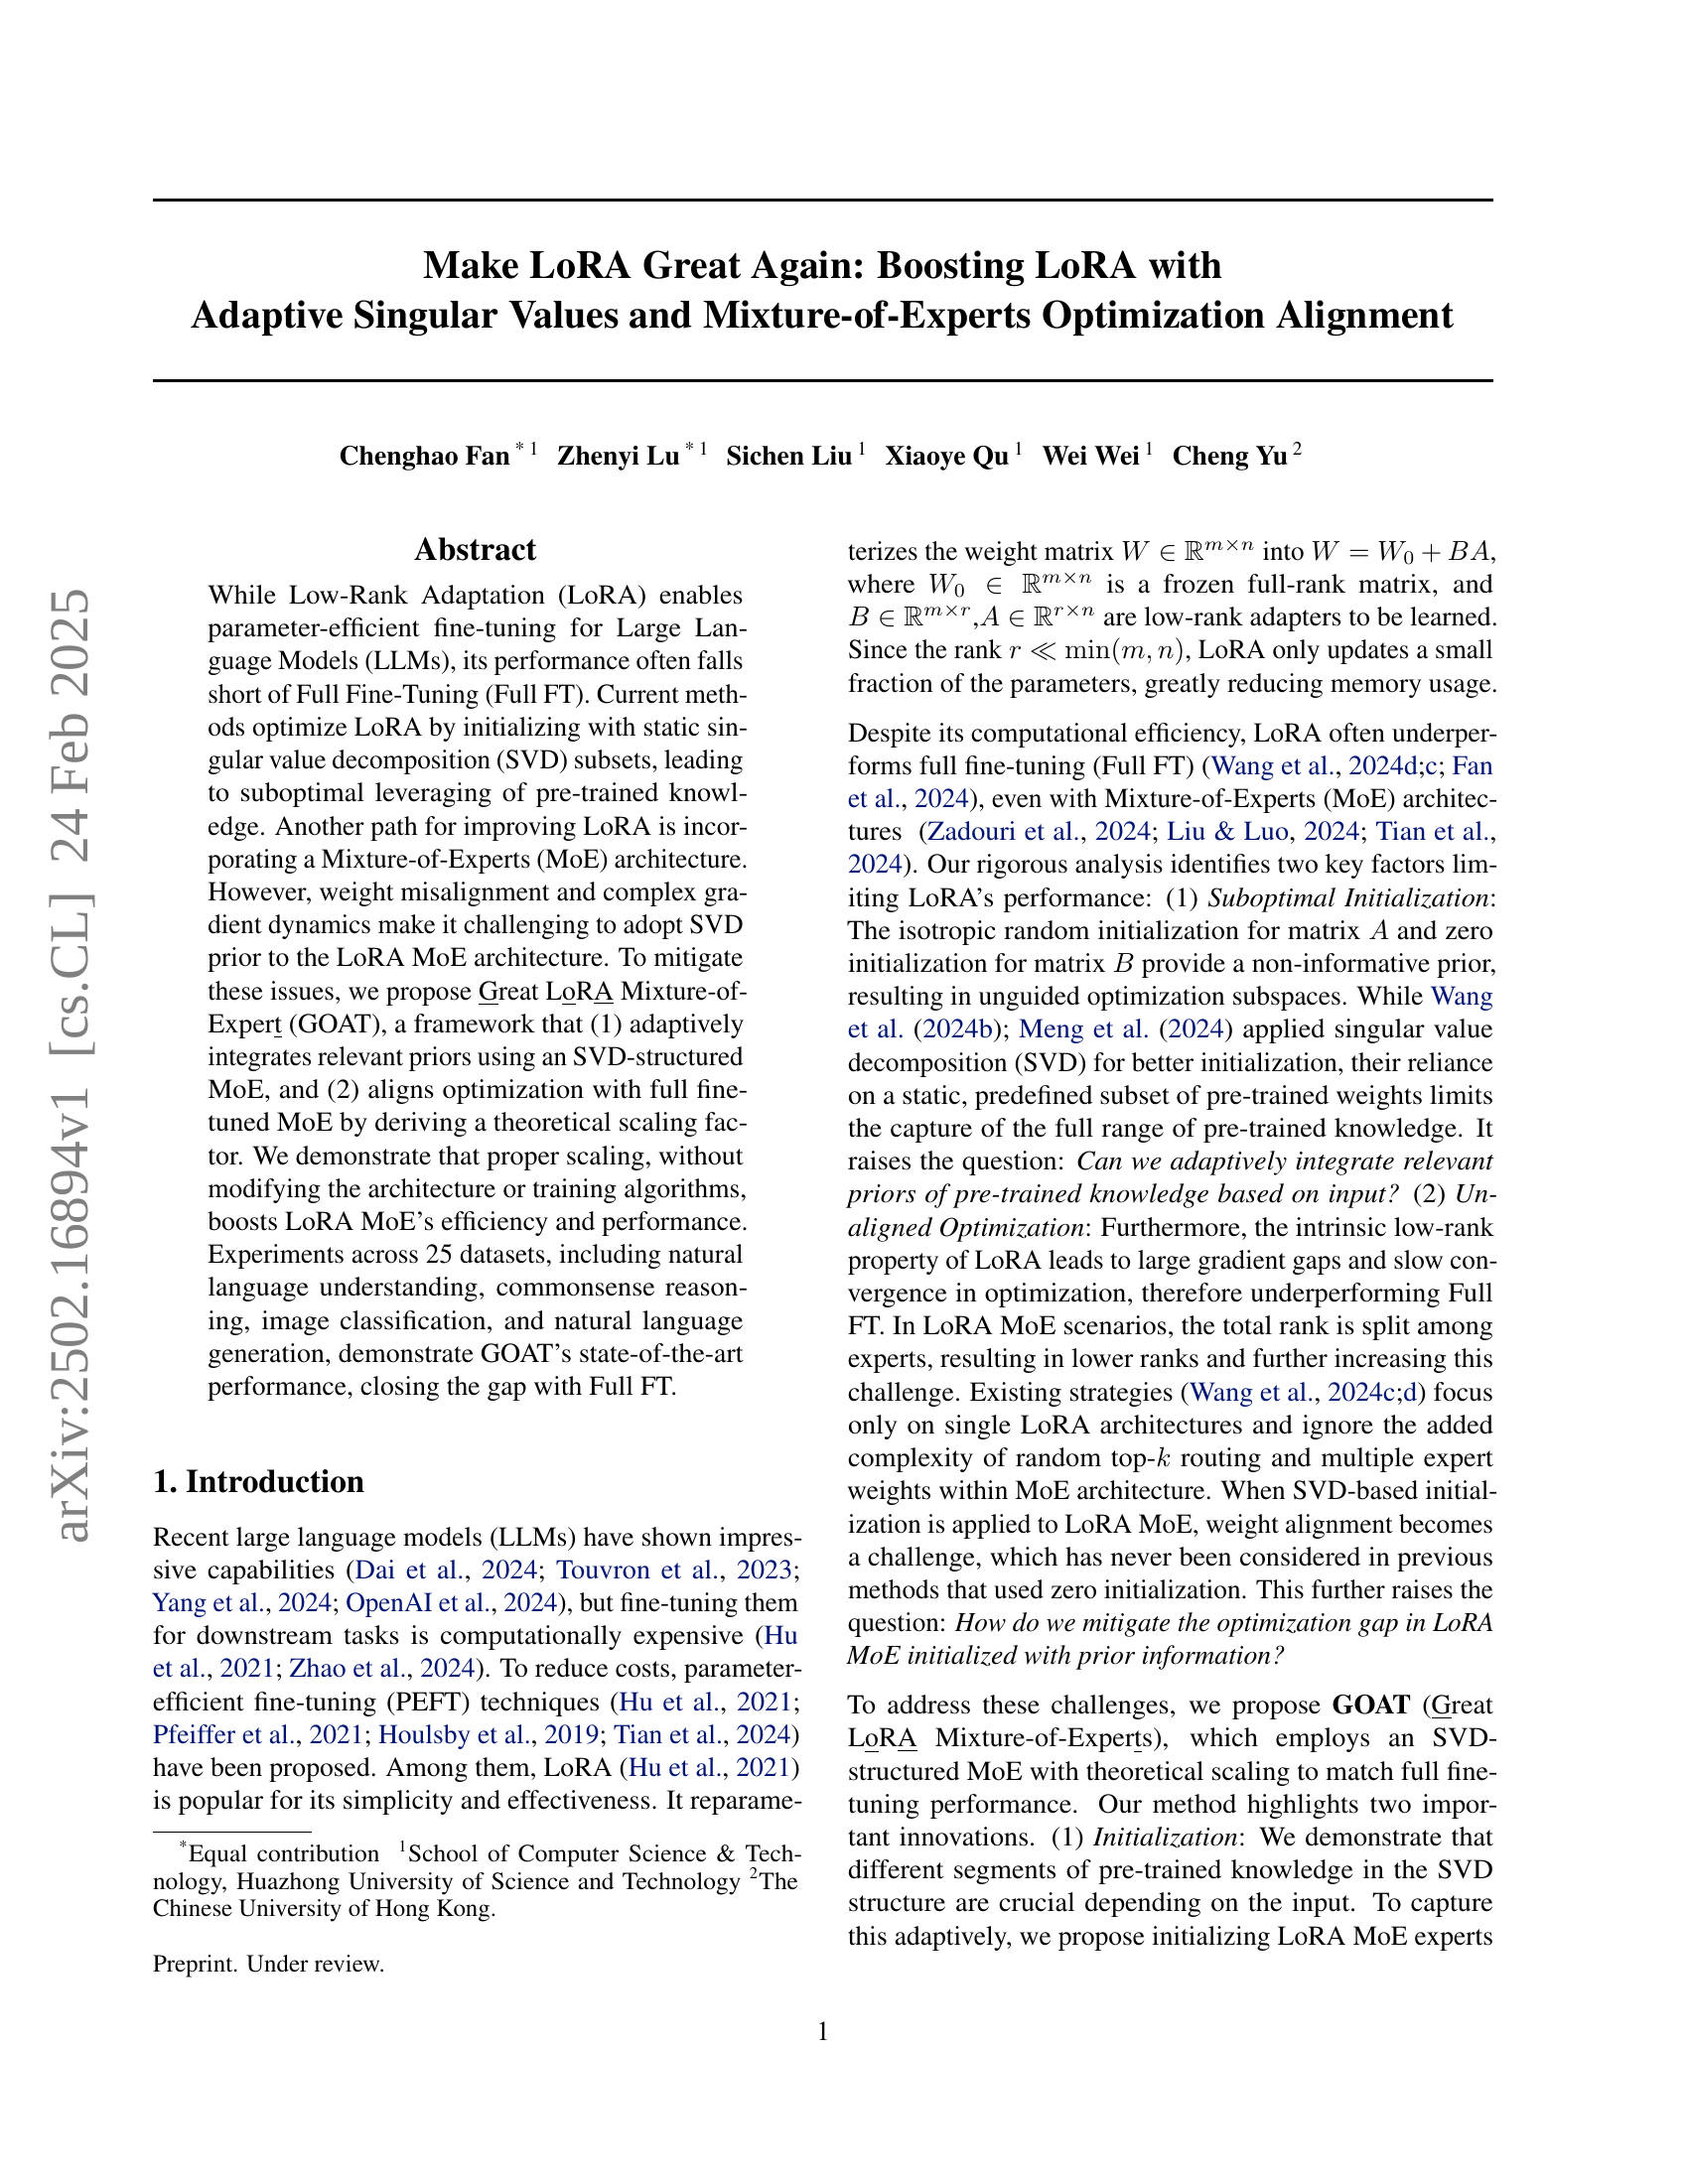
🔼 This figure visualizes the impact of different SVD segment initializations on LoRA’s performance, specifically focusing on the utilization of various singular value segments (Ui, Σi, ViT) in initializing the low-rank adapters (B and A). The experiment is conducted for two different ranks (32 and 128) to assess the effect across different dimensionality of the adapter matrices. Performance is evaluated across multiple datasets and normalized by min-max scaling for easier comparison. The x-axis shows the different SVD segments (index i), indicating which part of the pre-trained weight matrix SVD is used for initialization, and the y-axis represents the normalized performance. This helps illustrate the optimal SVD segment to utilize for initialization, demonstrating that using only the principal or minor singular values is suboptimal and that using the middle segments is more effective.
read the caption
Figure 1: The effect of initializations from different SVD segments (ui,σi,vi⊤)subscript𝑢𝑖subscript𝜎𝑖superscriptsubscript𝑣𝑖top(u_{i},\sigma_{i},v_{i}^{\top})( italic_u start_POSTSUBSCRIPT italic_i end_POSTSUBSCRIPT , italic_σ start_POSTSUBSCRIPT italic_i end_POSTSUBSCRIPT , italic_v start_POSTSUBSCRIPT italic_i end_POSTSUBSCRIPT start_POSTSUPERSCRIPT ⊤ end_POSTSUPERSCRIPT ) for rank 32 and 128. The performance normalized by min-max scaling.
| Method | # Params (%) | Cars | DTD | EuroSAT | GTSRB | RESISC45 | SUN397 | SVHN | Average |
|---|---|---|---|---|---|---|---|---|---|
| Full FT | 100 | 60.33 | 73.88 | 98.96 | 98.30 | 93.65 | 53.84 | 96.78 | 82.25 |
| Full FT MoE | 770 | 66.39 | 75.53 | 98.59 | 98.50 | 94.38 | 60.34 | 97.09 | 84.40 |
| Single LoRA Methods | |||||||||
| LoRA | 1.49 | 41.02 | 70.15 | 98.66 | 96.51 | 90.38 | 47.51 | 95.39 | 77.09 |
| LoRA (rank16) | 2.99 | 46.51 | 72.07 | 98.74 | 98.04 | 92.08 | 51.63 | 96.00 | 79.30 |
| LoRA (rank32) | 5.98 | 50.13 | 72.87 | 98.88 | 98.13 | 92.87 | 53.65 | 96.55 | 80.44 |
| DoRA | 1.49 | 40.75 | 71.91 | 98.89 | 97.71 | 90.19 | 47.54 | 95.46 | 77.49 |
| PiSSA | 1.49 | 40.41 | 69.62 | 98.48 | 95.84 | 90.58 | 47.21 | 95.84 | 76.85 |
| MiLoRA | 1.49 | 39.77 | 70.48 | 98.19 | 97.52 | 89.92 | 45.38 | 95.49 | 76.68 |
| LoRA MoE Methods | |||||||||
| MoLoRA | 2.24 | 50.83 | 73.51 | 98.63 | 97.72 | 92.58 | 52.55 | 96.00 | 80.26 |
| AdaMoLE | 2.33 | 49.47 | 71.65 | 98.52 | 97.73 | 91.95 | 52.29 | 95.82 | 79.63 |
| HydraLoRA | 1.58 | 48.42 | 72.18 | 98.40 | 97.28 | 92.93 | 51.80 | 96.06 | 79.58 |
| GOAT | 2.24 | 53.50 | 75.32 | 98.82 | 98.17 | 93.46 | 54.53 | 96.62 | 81.49 |
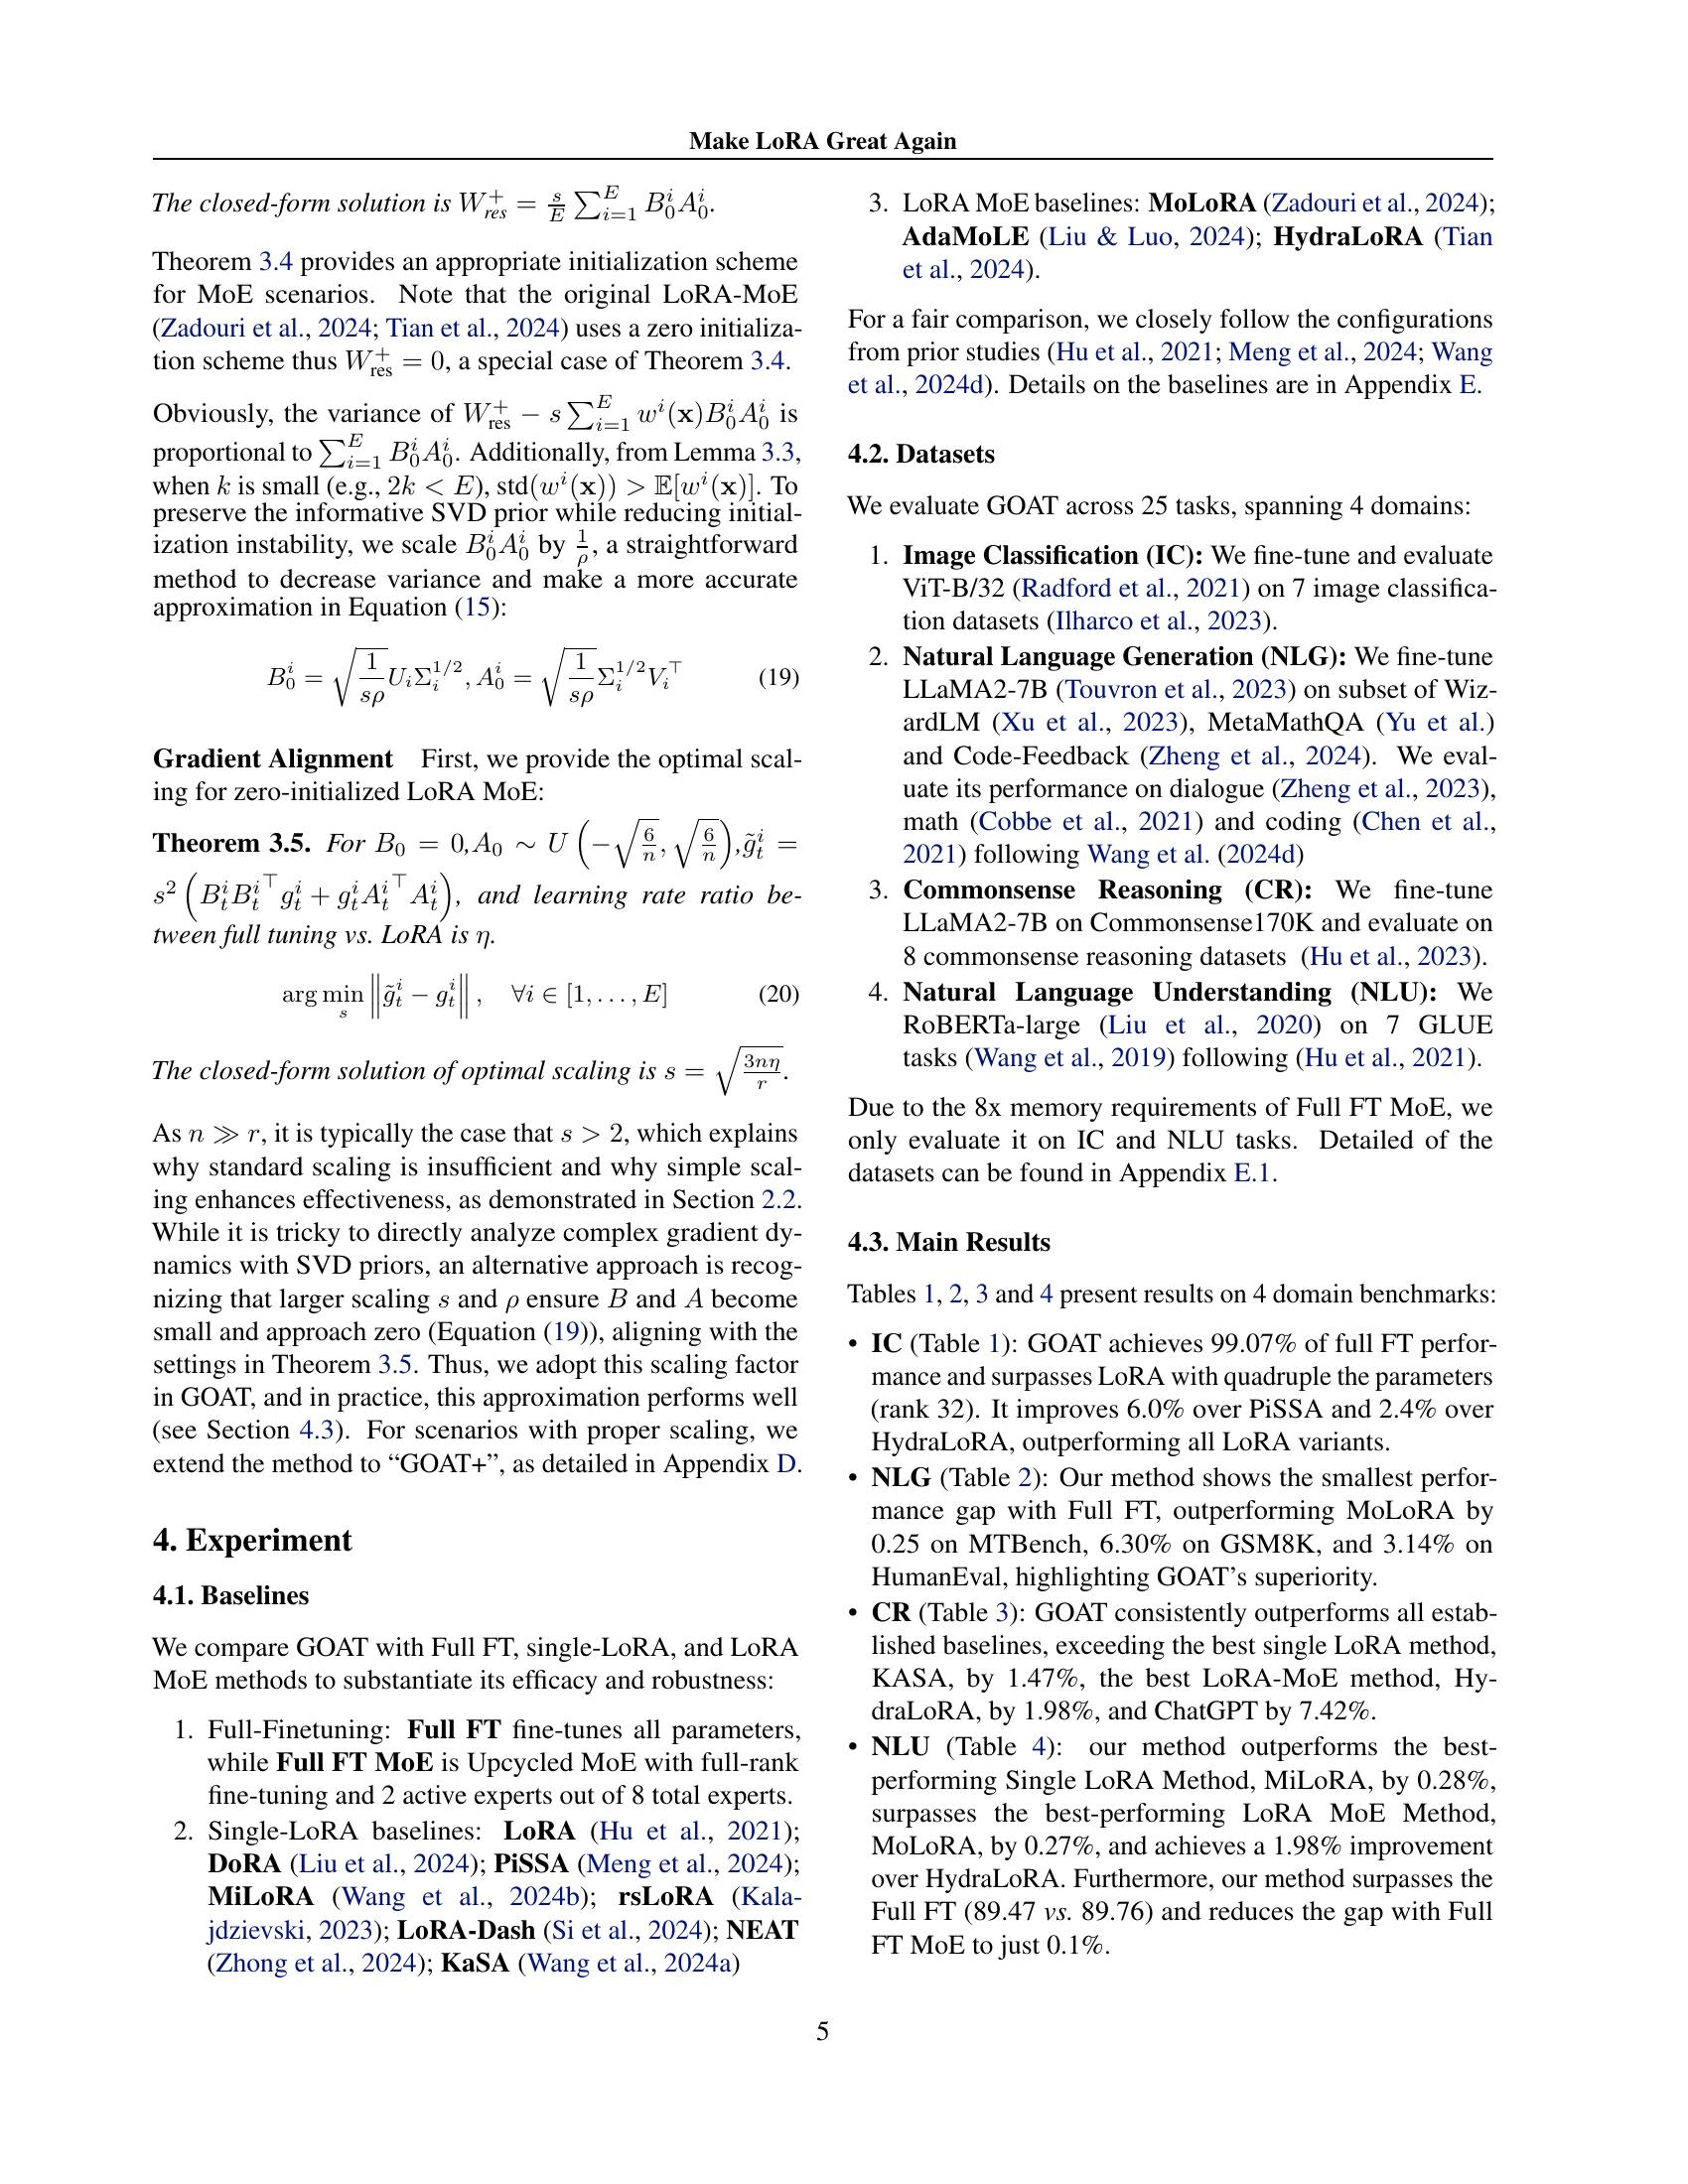
🔼 This table presents the results of an image classification experiment using CLIP ViT-B/32. Several different parameter-efficient fine-tuning (PEFT) methods were compared against full fine-tuning (FT). All methods used a total rank of 8. The performance of each method is reported across seven different image classification datasets (StanfordCars, DTD, EuroSAT, GTSRB, RESISC45, SUN397, and SVHN), enabling a comprehensive comparison of their effectiveness. The highest accuracy for each dataset is bolded.
read the caption
Table 1: We evaluate CLIP ViT-B/32 with full fine-tuning and LoRA variants with total rank 8 across StanfordCars, DTD, EuroSAT, GTSRB, RESISC45, SUN397, and SVHN datasets. Bold indicates the highest results.
In-depth insights#
Adaptive SVD MoE#
Adaptive SVD MoE is a framework integrating SVD into a Mixture of Experts (MoE), aiming to enhance model adaptability and performance. The key idea revolves around adaptively selecting different segments of pre-trained knowledge encoded within the SVD structure of weight matrices, based on the input. Instead of relying on static, predefined priors, the model dynamically activates experts associated with specific singular value segments, allowing for a more nuanced capture of relevant information. This approach addresses limitations of traditional methods that use either the principal or minor components, enabling the model to automatically leverage task-specific knowledge embedded in various segments. It enhances the original framework by addressing two questions: (1) Can it adaptively integrate relevant priors of pre-trained knowledge based on input? (2) How do we mitigate the optimization gap in LoRA MoE initialized with prior information? This adaptive selection leverages distinct singular value segments, enabling more accurate capture of pre-trained knowledge for optimal adaptation.
Prior Alignment#
Prior alignment is a crucial concept in transfer learning, particularly when fine-tuning large pre-trained models. The core idea involves carefully initializing or adapting the parameters of a smaller, task-specific model (e.g., a LoRA adapter) to reflect the knowledge already embedded in the larger, pre-trained model. Effective prior alignment facilitates faster convergence, improved generalization, and reduced risk of catastrophic forgetting. Methods for prior alignment may include techniques such as singular value decomposition (SVD) to capture important weight structures, or careful scaling factors to match the gradient magnitudes of the pre-trained model. The choice of alignment strategy often depends on the architecture and training dynamics of the models involved.
Scalable Scaling#
Scalable Scaling presents an intriguing approach to enhance model performance without significant architectural changes. By focusing on scaling factors, the method likely aims to optimize gradient flow and convergence during training, particularly in parameter-efficient fine-tuning (PEFT) scenarios. The term ‘scalable’ suggests the technique’s applicability across diverse model sizes and datasets, avoiding overfitting or underfitting issues common with fixed scaling strategies. The benefits may include faster convergence, improved generalization, and reduced computational overhead. The method possibly leverages theoretical insights to derive optimal scaling parameters, adapting to task-specific characteristics or model complexities. Furthermore, the scalable approach could explore dynamic scaling strategies, adjusting weights during training to maintain stable gradient norms and prevent imbalances. By identifying and addressing the scaling issues, the technique offers a practical means of improving efficiency and effectiveness across a wide range of tasks.
GOAT: Improves FT#
The essence of GOAT (Great LoRA Mixture-of-Experts) achieving improvements over Full Fine-Tuning (FT) lies in its architectural innovations and optimization strategies. GOAT smartly initializes its LoRA MoE experts with adaptive SVD-structured priors, allowing it to capture task-specific knowledge from pre-trained models more effectively than methods using static or non-informative priors. The theoretical scaling applied to align optimization with full fine-tuned MoE is also a key factor. By addressing weight misalignment and refining gradient dynamics. The results show state-of-the-art performance across diverse datasets, GOAT closes the performance gap with Full FT. This shows the effectiveness of adaptive prior integration and optimization alignment. Further research can explore dynamic expert allocation and the impact of different SVD segment selection strategies to potentially unlock even greater performance gains for parameter-efficient fine-tuning.
Weight Alignment#
Weight alignment is crucial for effective model training, especially in scenarios like LoRA MoE where pre-trained knowledge is integrated. The challenge lies in ensuring that the newly introduced low-rank weights (B and A) harmonize with the existing pre-trained weights (W0), preventing misalignment that could hinder optimization and performance. Misalignment can lead to inconsistent router behavior, inefficient optimization of expert weights, and ultimately, a performance gap compared to full fine-tuning. Strategies to mitigate this include carefully initializing the low-rank adapters, scaling their contribution appropriately, and aligning the gradients during optimization to ensure that the updates are congruent with the overall objective. The goal is to make the low-rank experts a suitable substitute to it’s full rank component for optimization
More visual insights#
More on figures

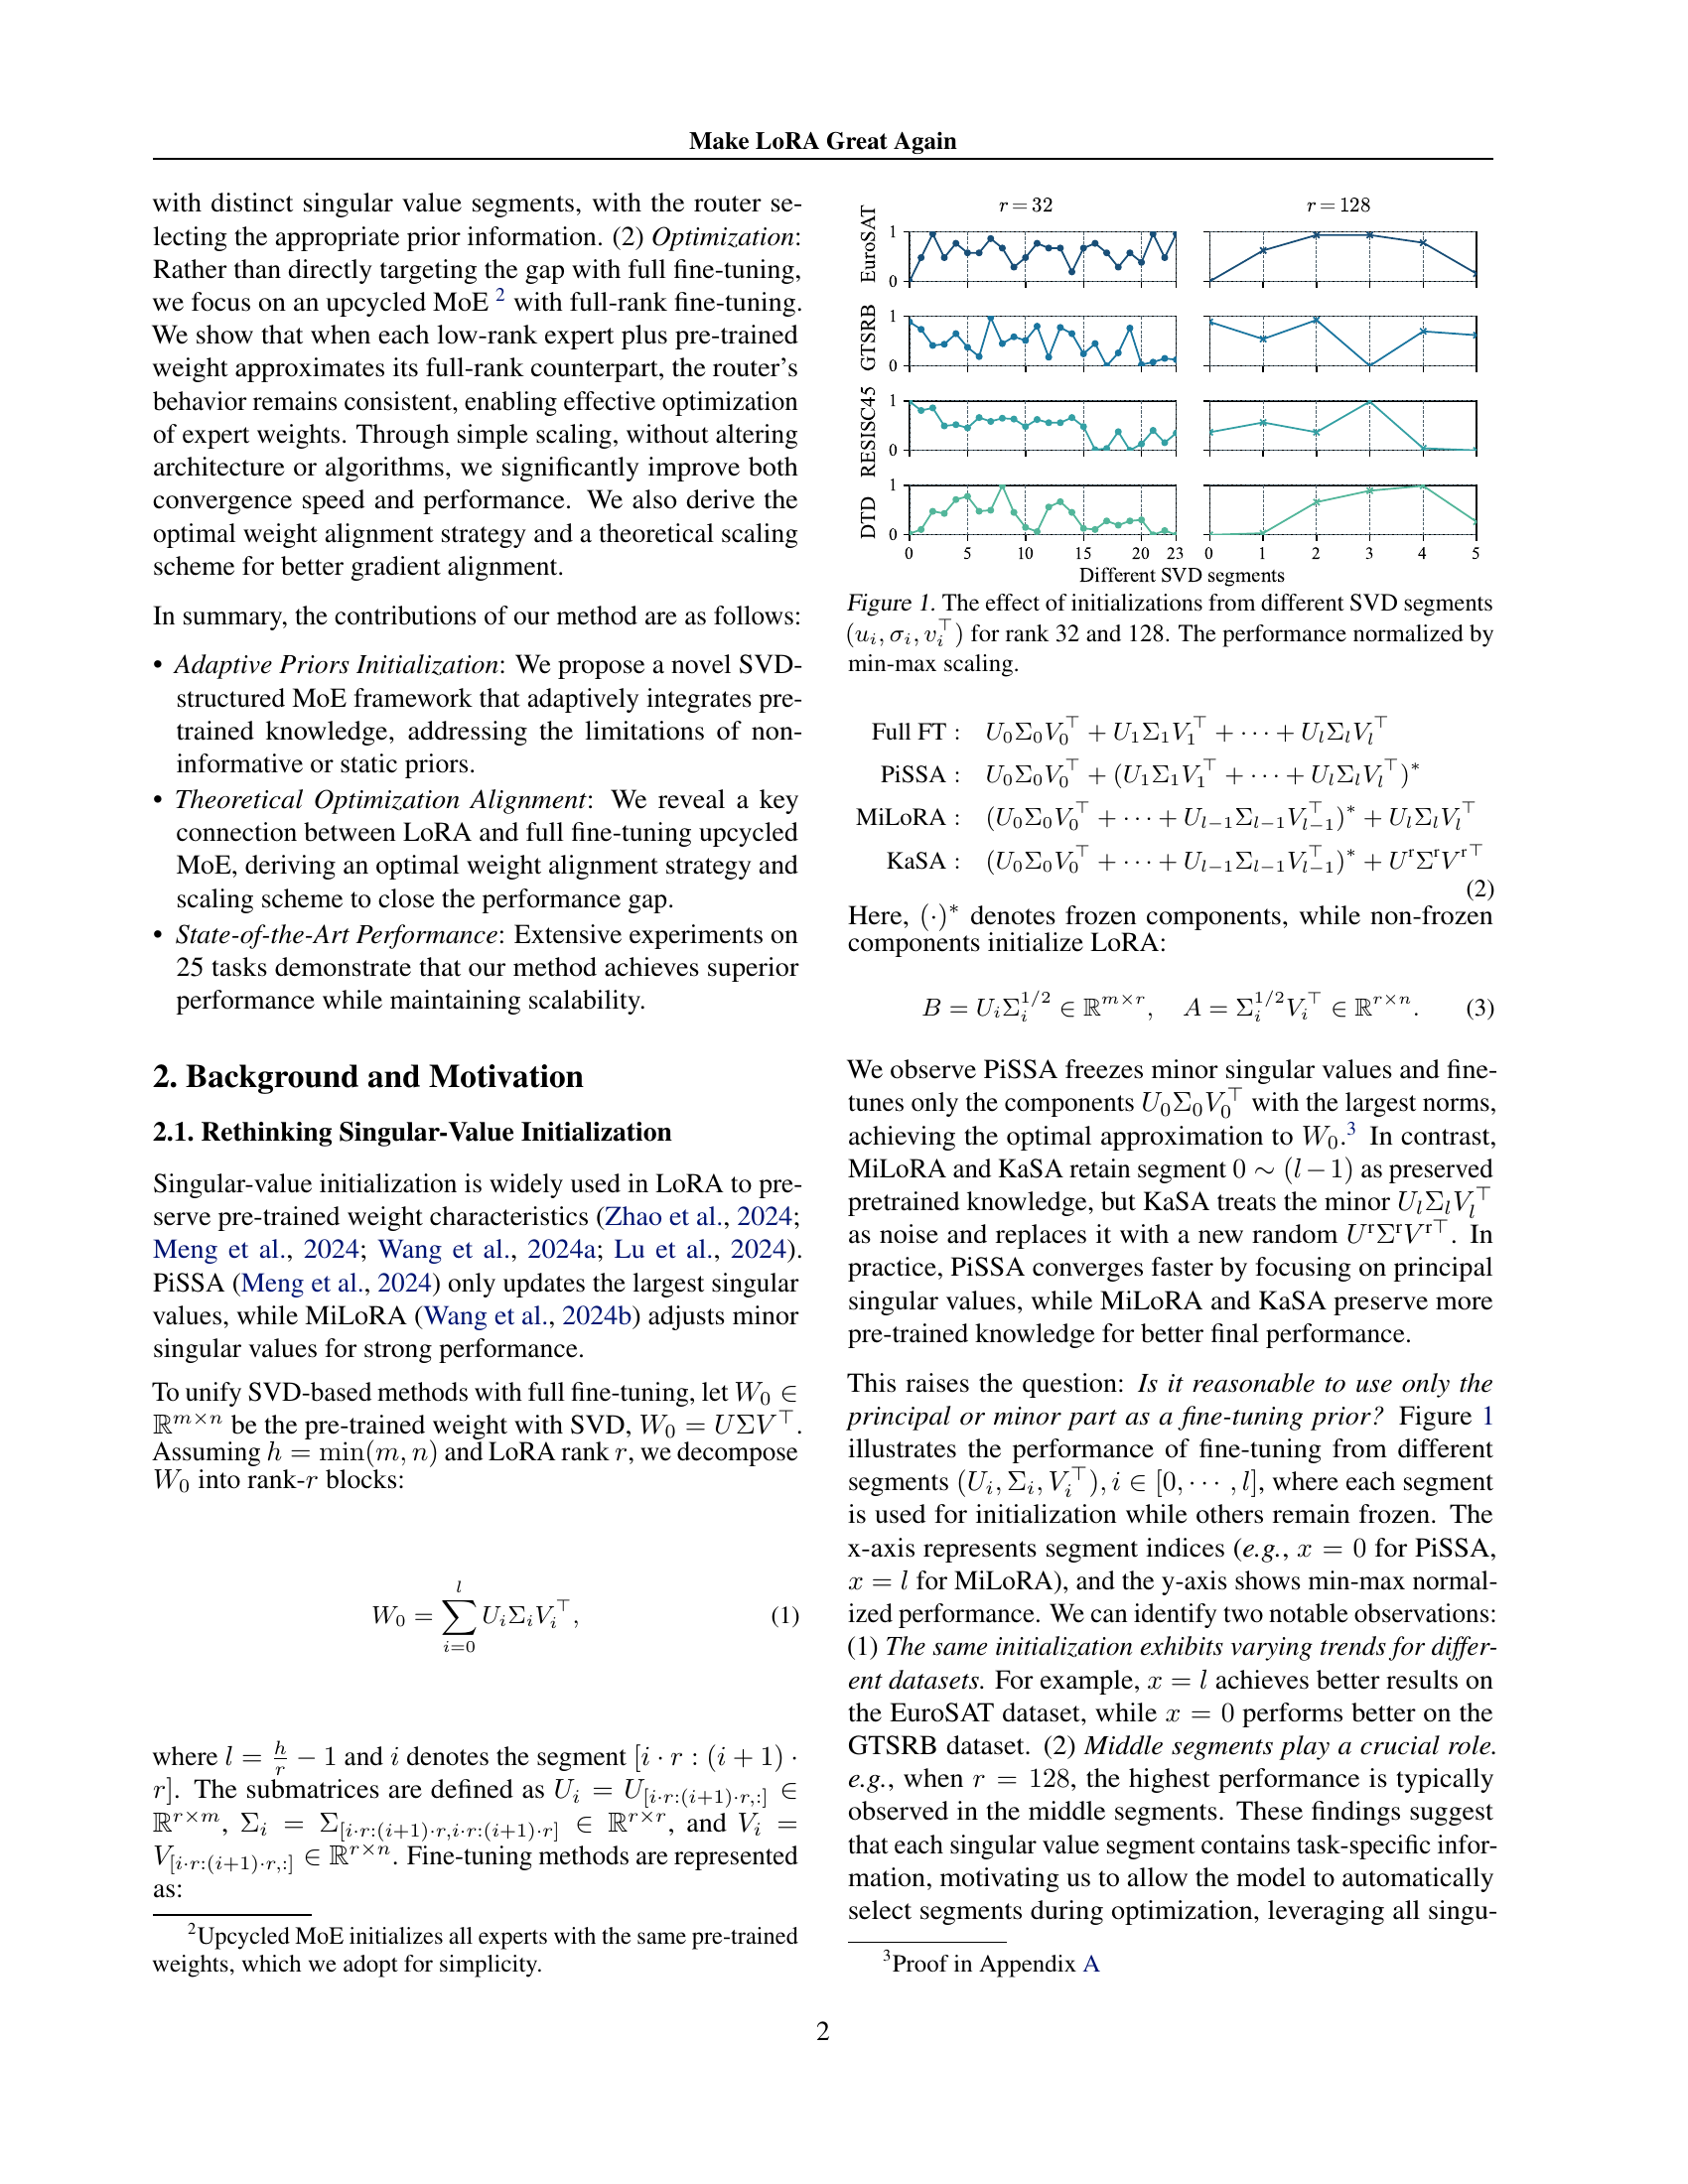
🔼 This figure visualizes the impact of scaling factor (s) and rank (r) on the performance of SVD-based Low-Rank Adaptation (LoRA). The left panel shows training loss curves, illustrating how different scaling factors affect convergence speed. The right panel displays the gradient norm, demonstrating the relationship between scaling, rank, and gradient magnitude. The figure highlights the trade-off between these factors to improve efficiency and performance of the method. For instance, with low rank (e.g., r=1), the gradient norm is small, while applying proper scaling (s=16) increases it, reducing the performance gap.
read the caption
Figure 2: SVD initialization vs. scaling s𝑠sitalic_s and rank r𝑟ritalic_r

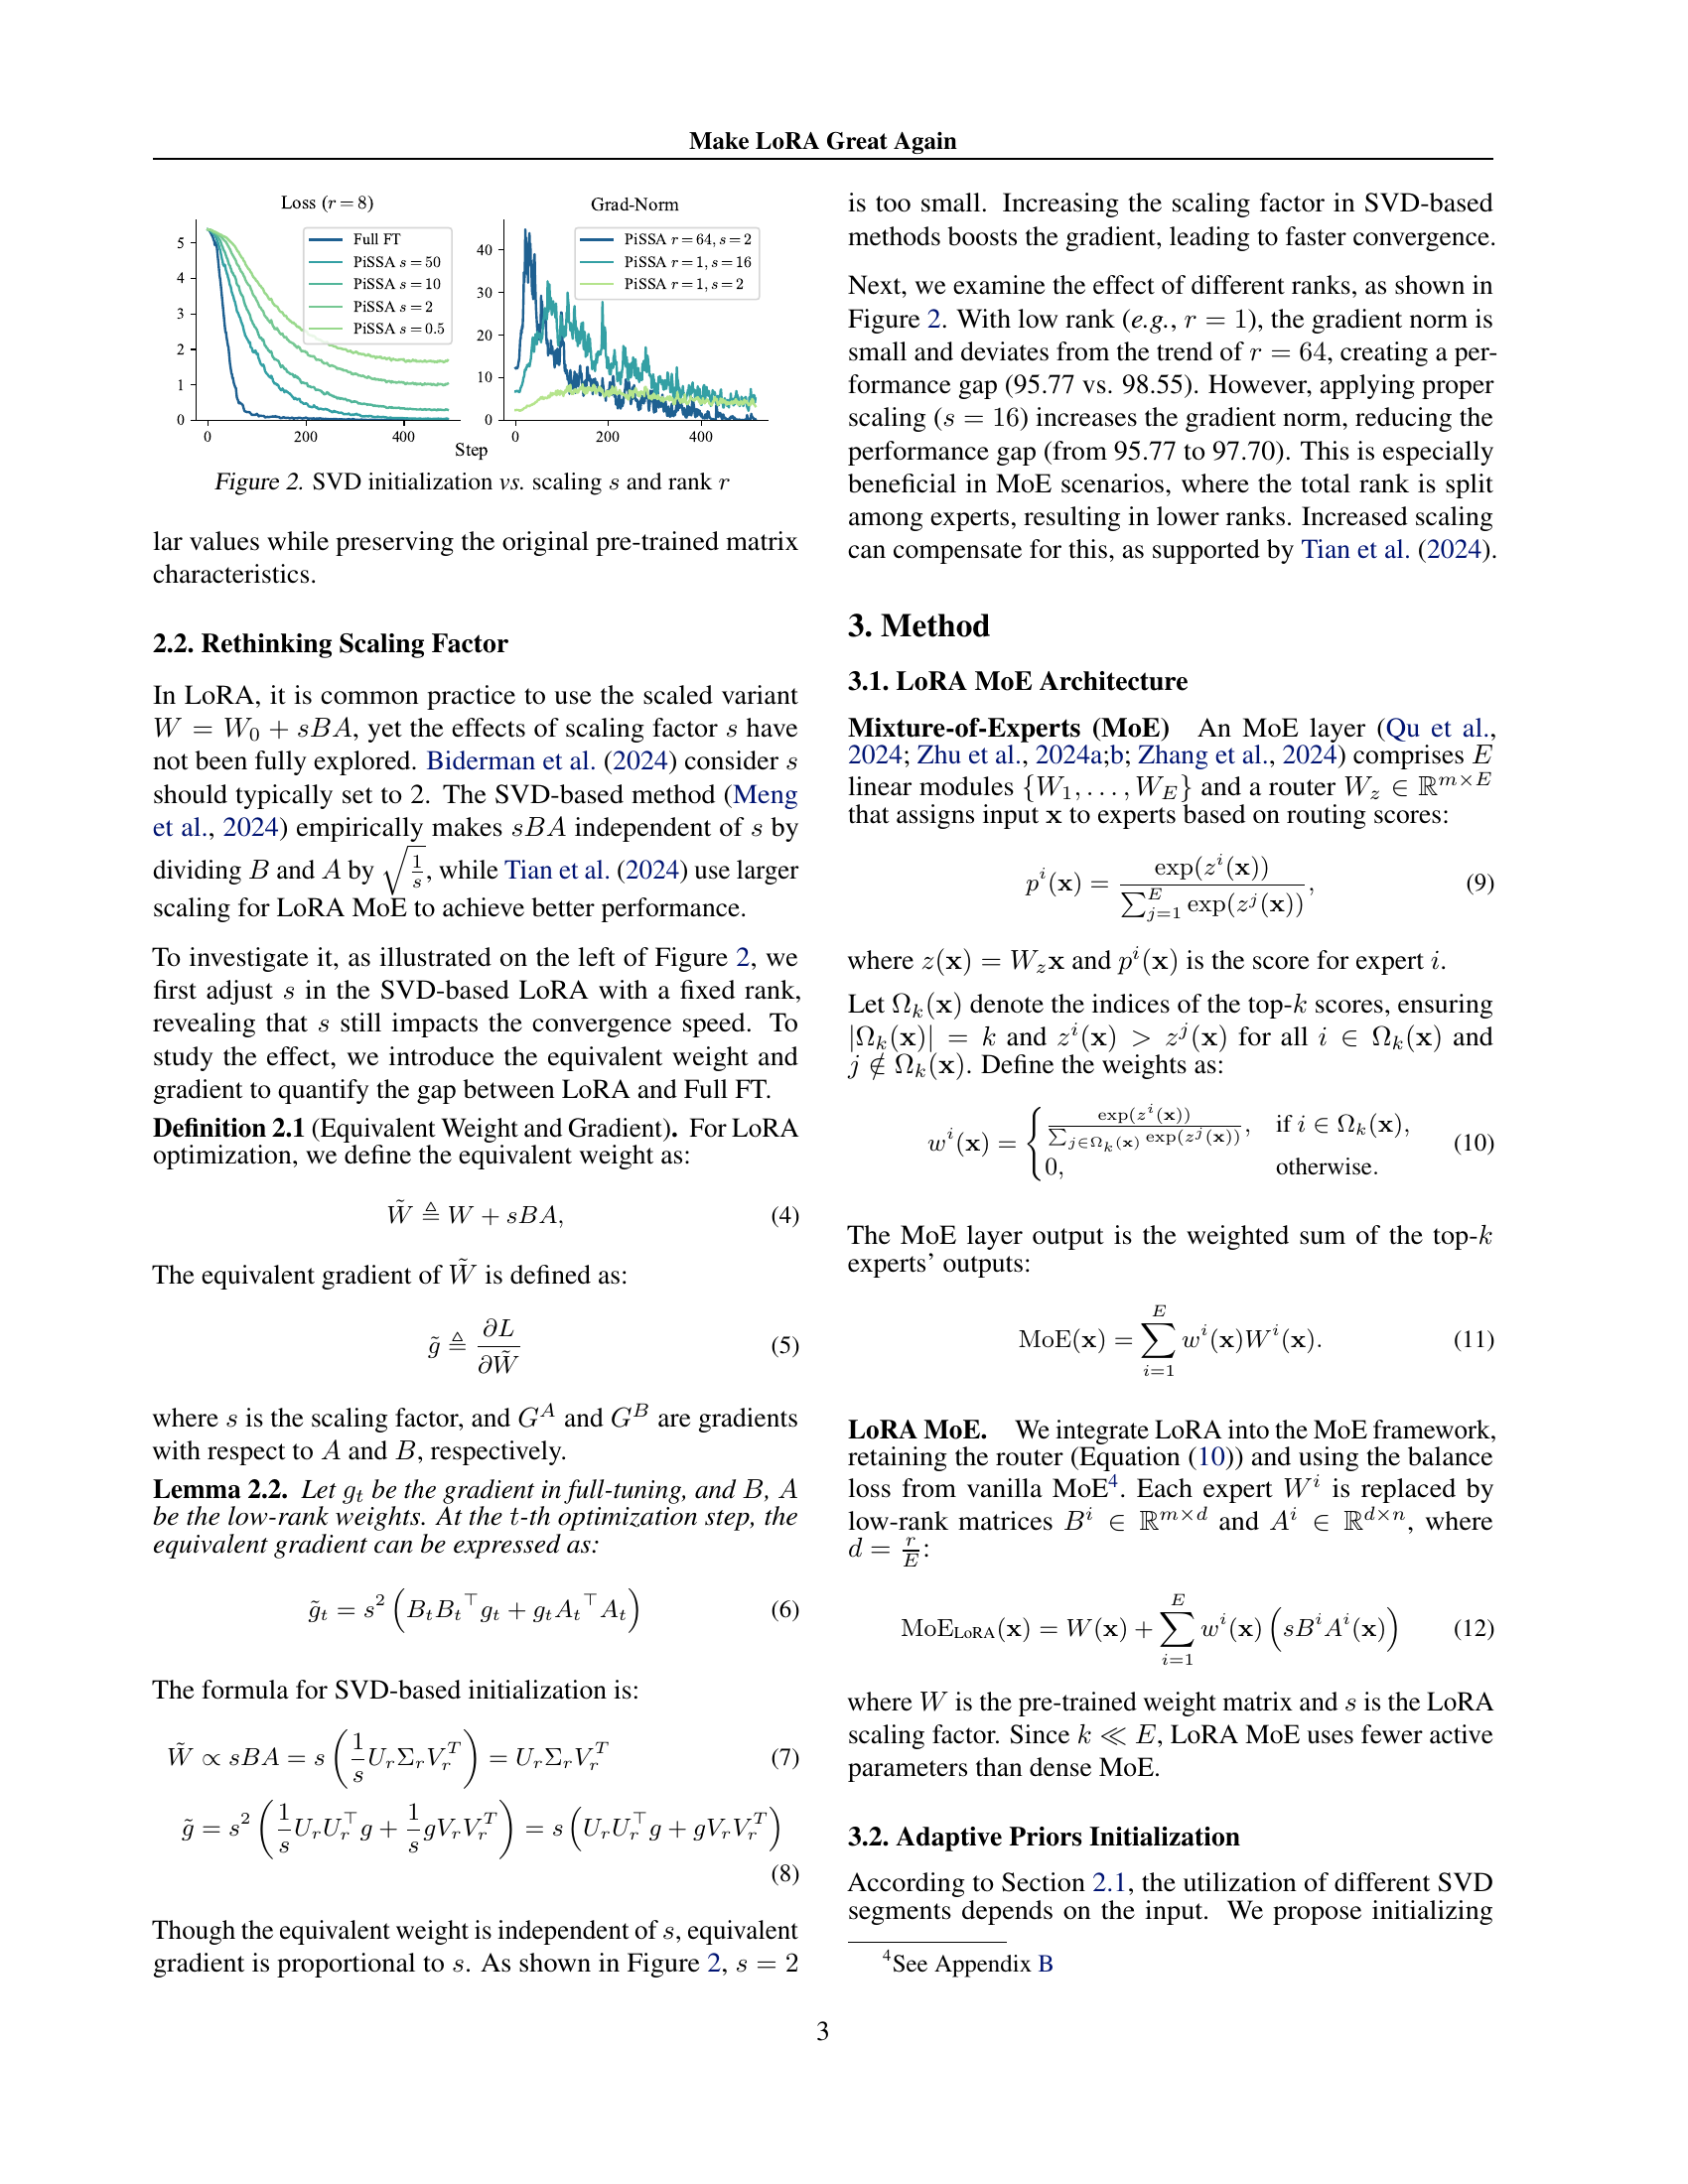
🔼 Figure 3 illustrates the core idea of the GOAT method, comparing it to standard LoRA and full MoE fine-tuning. Single Low-Rank Adaptation shows the basic LoRA method where a weight matrix is reparameterized using low-rank matrices B and A. MoE Fine-tuning depicts a full MoE architecture with multiple experts selected by a router. Subfigure (I) details the GOAT approach: replacing the single (B, A) pair with multiple (Bi, Ai) pairs. These pairs are initialized using different segments of the SVD decomposition of the pre-trained weights (W0) and selected adaptively by the router. Subfigure (II) explains how GOAT aligns optimization with an SVD-structured MoE by individually aligning each expert’s weight and scaling gradients to match full MoE fine-tuning. Wres ensures that the equivalent weight matches the pre-trained weight before optimization begins.
read the caption
Figure 3: Illustration of Our Method. Single Low-Rank Adaptation: LoRA reduces trainable parameters by reparameterizing W𝑊Witalic_W as W=W0+sBA𝑊subscript𝑊0𝑠𝐵𝐴W=W_{0}+sBAitalic_W = italic_W start_POSTSUBSCRIPT 0 end_POSTSUBSCRIPT + italic_s italic_B italic_A, with B𝐵Bitalic_B and A𝐴Aitalic_A as low-rank matrices. MoE Fine-tuning: Full MoE fine-tuning, where experts W1superscript𝑊1W^{1}italic_W start_POSTSUPERSCRIPT 1 end_POSTSUPERSCRIPT and WEsuperscript𝑊𝐸W^{E}italic_W start_POSTSUPERSCRIPT italic_E end_POSTSUPERSCRIPT are selected by the router in this moment. Subfigure (I): Our method replaces the single pair B,A𝐵𝐴B,Aitalic_B , italic_A with multiple pairs {Bi,Ai}i=1Esuperscriptsubscriptsuperscript𝐵𝑖superscript𝐴𝑖𝑖1𝐸\{B^{i},A^{i}\}_{i=1}^{E}{ italic_B start_POSTSUPERSCRIPT italic_i end_POSTSUPERSCRIPT , italic_A start_POSTSUPERSCRIPT italic_i end_POSTSUPERSCRIPT } start_POSTSUBSCRIPT italic_i = 1 end_POSTSUBSCRIPT start_POSTSUPERSCRIPT italic_E end_POSTSUPERSCRIPT, initialized from different segments of the SVD of W0subscript𝑊0W_{0}italic_W start_POSTSUBSCRIPT 0 end_POSTSUBSCRIPT and adaptively selected by the router. Subfigure (II): We align optimization with SVD-structured MoE by separately aligning each expert. Wressubscript𝑊resW_{\text{res}}italic_W start_POSTSUBSCRIPT res end_POSTSUBSCRIPT ensures the equivalent weight equals W0subscript𝑊0W_{0}italic_W start_POSTSUBSCRIPT 0 end_POSTSUBSCRIPT before optimization, and we scale each expert’s equivalent gradient to closely approximate full MoE fine-tuning.

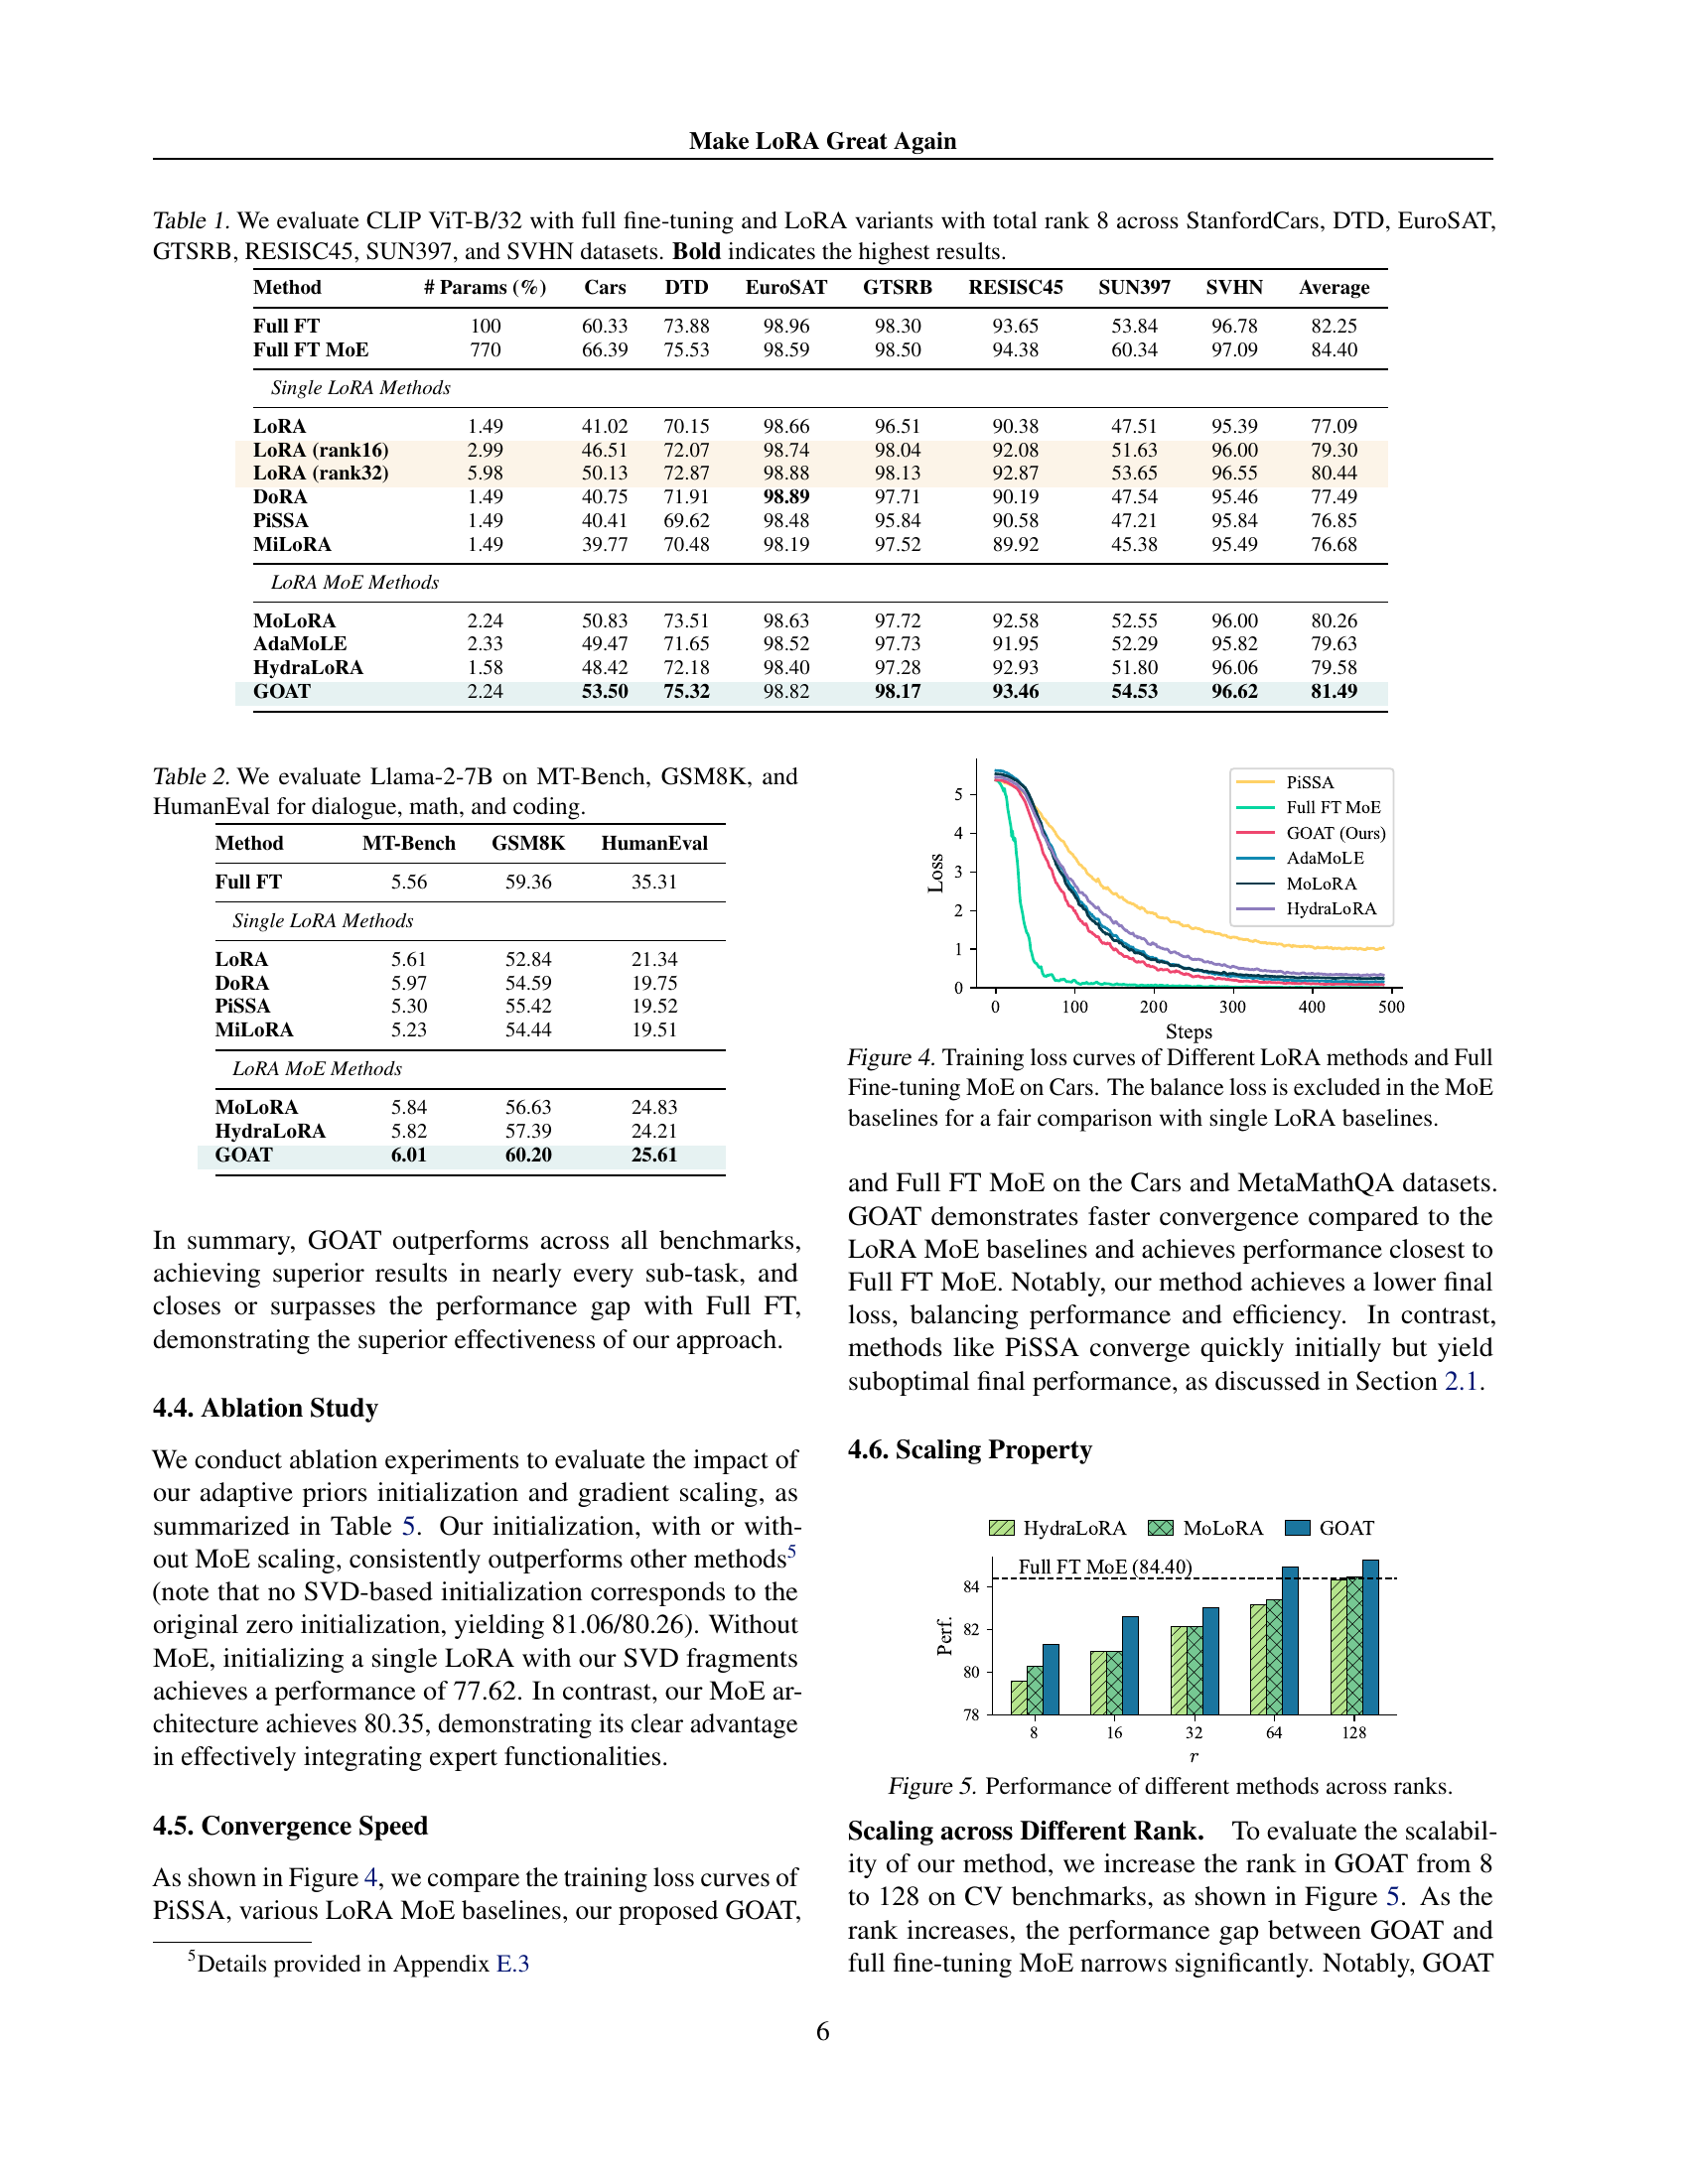
🔼 This figure displays the training loss curves for various parameter-efficient fine-tuning (PEFT) methods and the full fine-tuning Mixture-of-Experts (MoE) model on the Cars dataset. The x-axis represents the training steps, and the y-axis shows the training loss. The curves demonstrate the convergence speed and final loss achieved by each method. The MoE baselines have their balance loss excluded to allow for a more direct comparison to the single LoRA methods. This visualization allows for a comparison of the training efficiency and effectiveness of different PEFT approaches relative to the full fine-tuning model.
read the caption
Figure 4: Training loss curves of Different LoRA methods and Full Fine-tuning MoE on Cars. The balance loss is excluded in the MoE baselines for a fair comparison with single LoRA baselines.

🔼 This figure shows how the performance of different parameter-efficient fine-tuning (PEFT) methods changes as the rank of the low-rank matrices used in the methods increases. The x-axis represents the rank, ranging from 8 to 128. The y-axis represents the performance, likely measured as accuracy or a similar metric. The figure demonstrates the scalability of the GOAT method, showing how its performance narrows the gap with the full fine-tuning (FT) method as the rank increases. Other methods, such as MoLoRA and HydraLoRA, are also included for comparison.
read the caption
Figure 5: Performance of different methods across ranks.

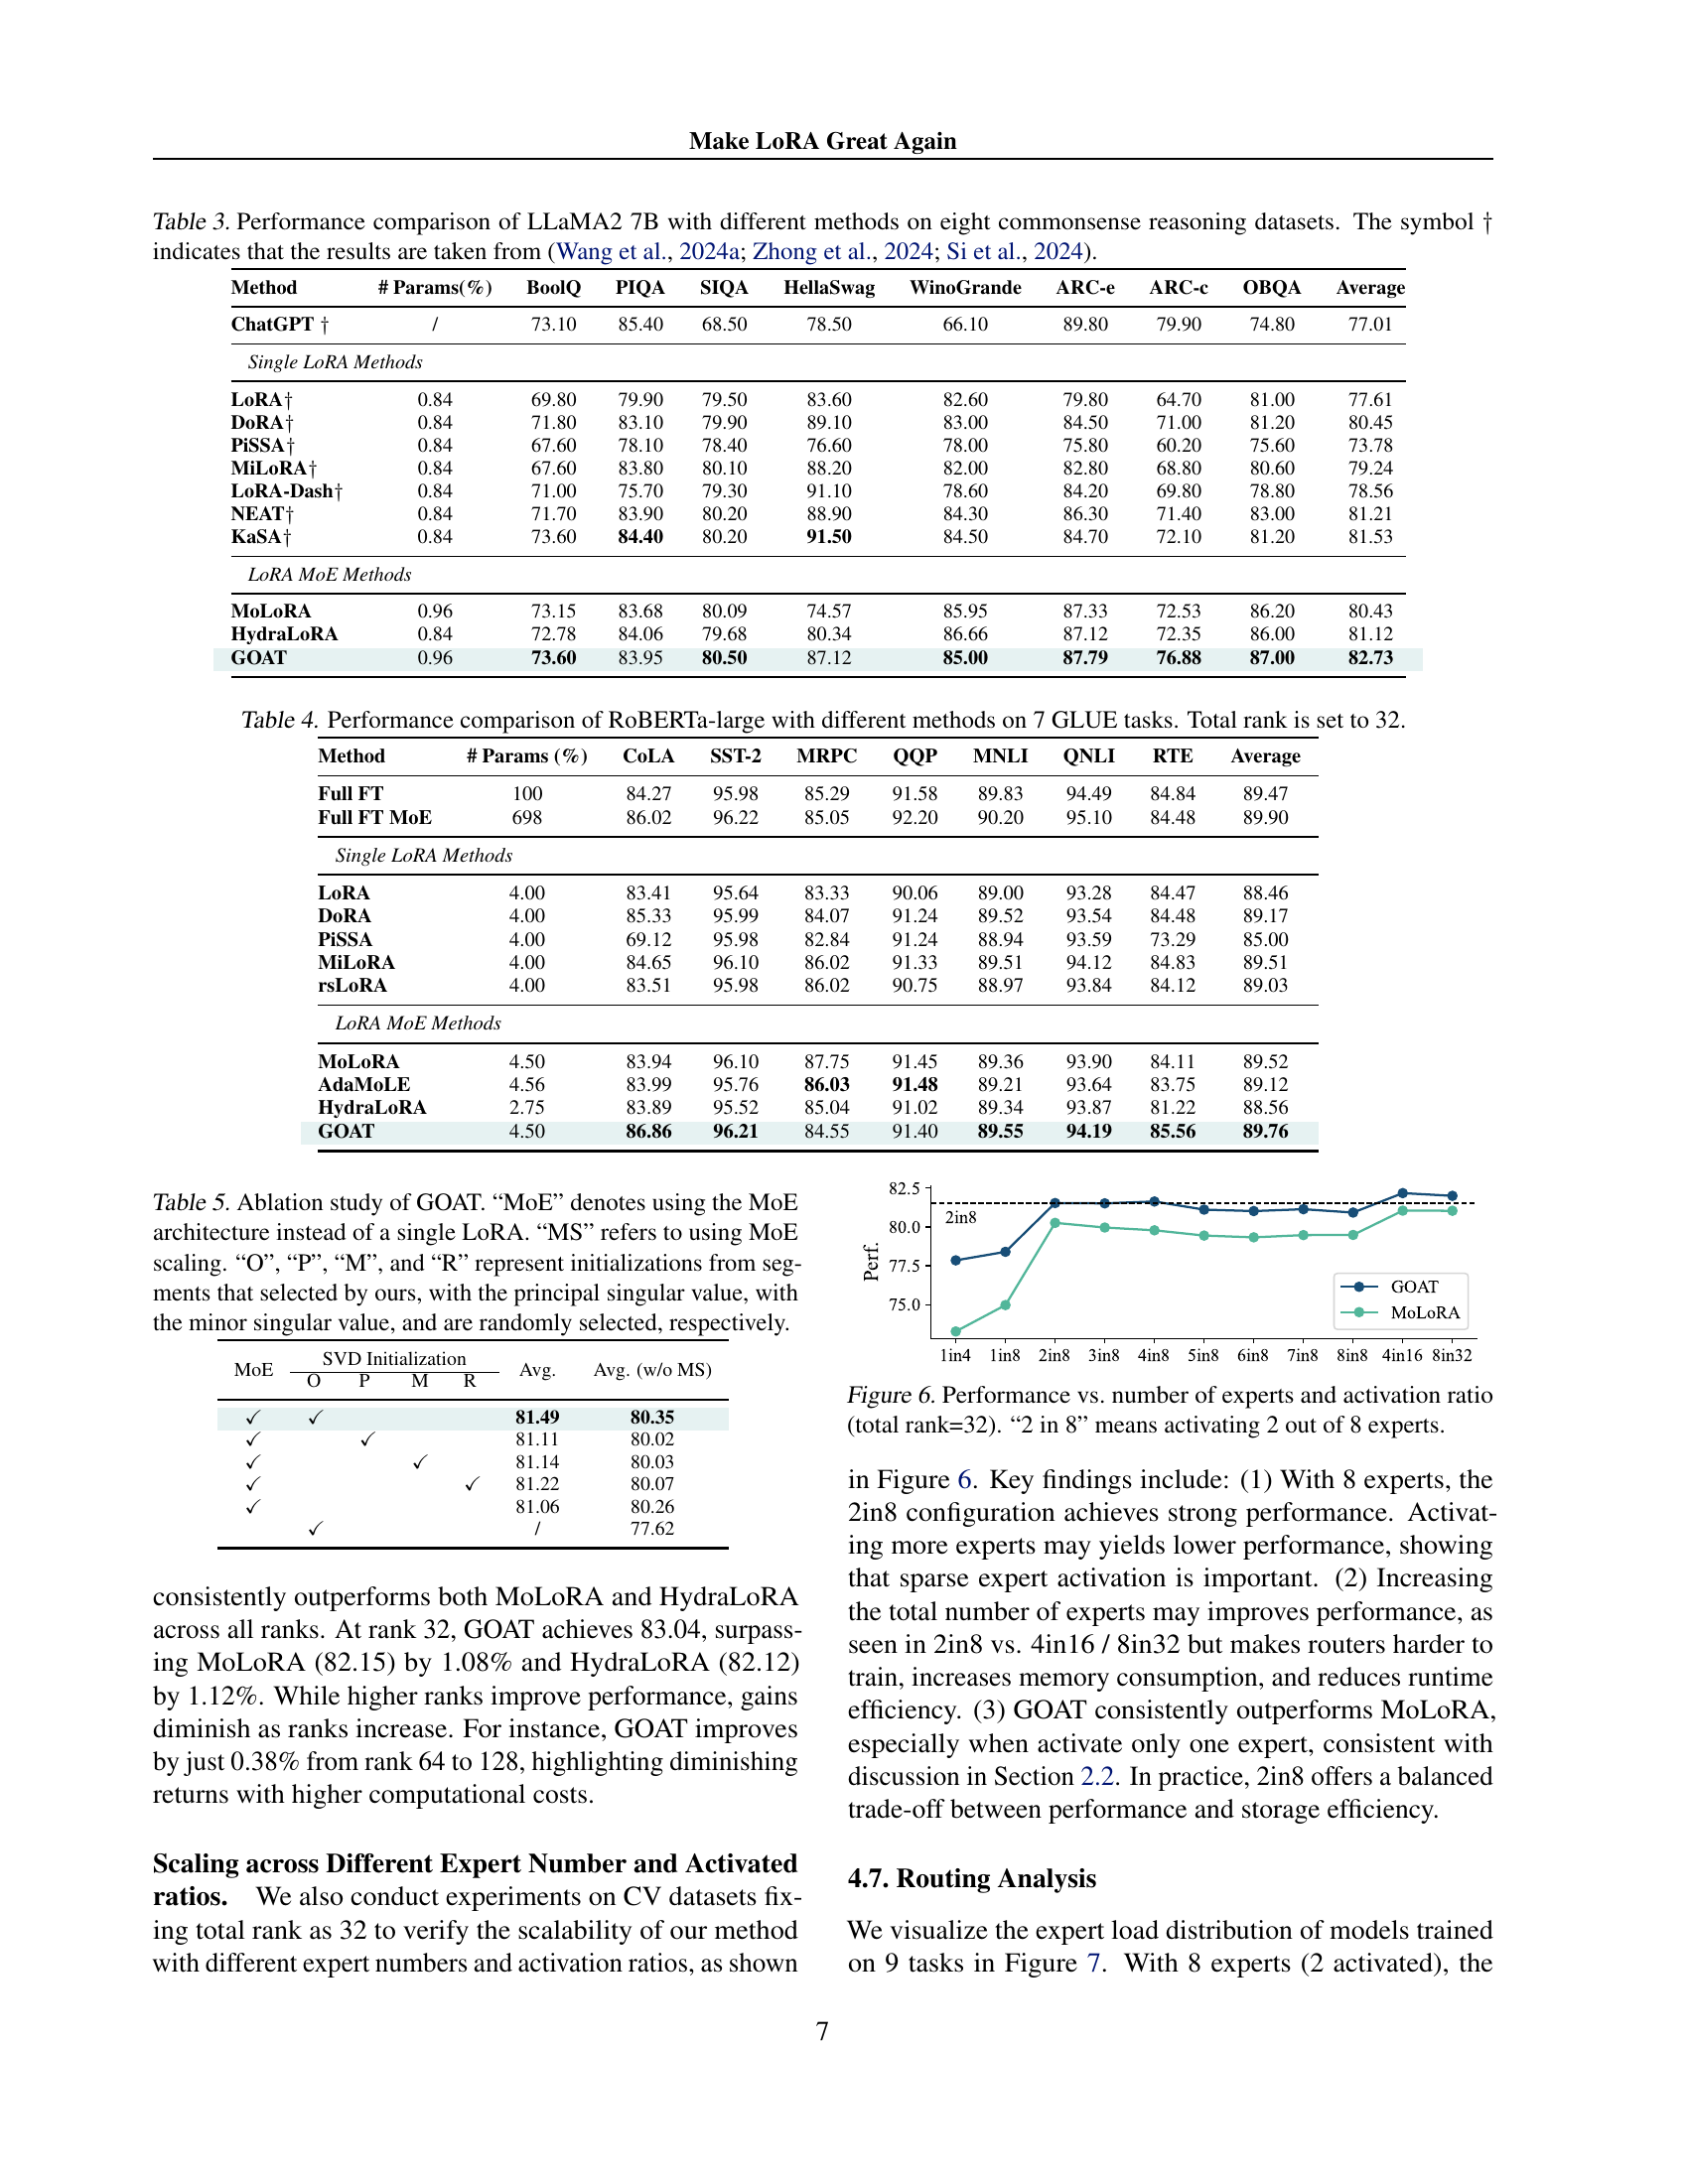
🔼 This figure demonstrates the impact of the number of experts and the activation ratio on model performance, while keeping the total rank fixed at 32. The x-axis represents different configurations, such as activating 2 out of 8 experts (‘2 in 8’), 4 out of 8, etc., demonstrating how adjusting the number of active experts and their proportion affects overall performance. The y-axis represents the model’s performance, likely measured by accuracy or a similar metric. The graph shows the performance of different methods (likely GOAT and baselines) under various expert configurations, allowing for a comparison of their relative performance under different sparsity levels. The results help to determine an optimal balance between the number of experts and the activation ratio for improved performance and efficiency.
read the caption
Figure 6: Performance vs. number of experts and activation ratio (total rank=32). “2 in 8” means activating 2 out of 8 experts.
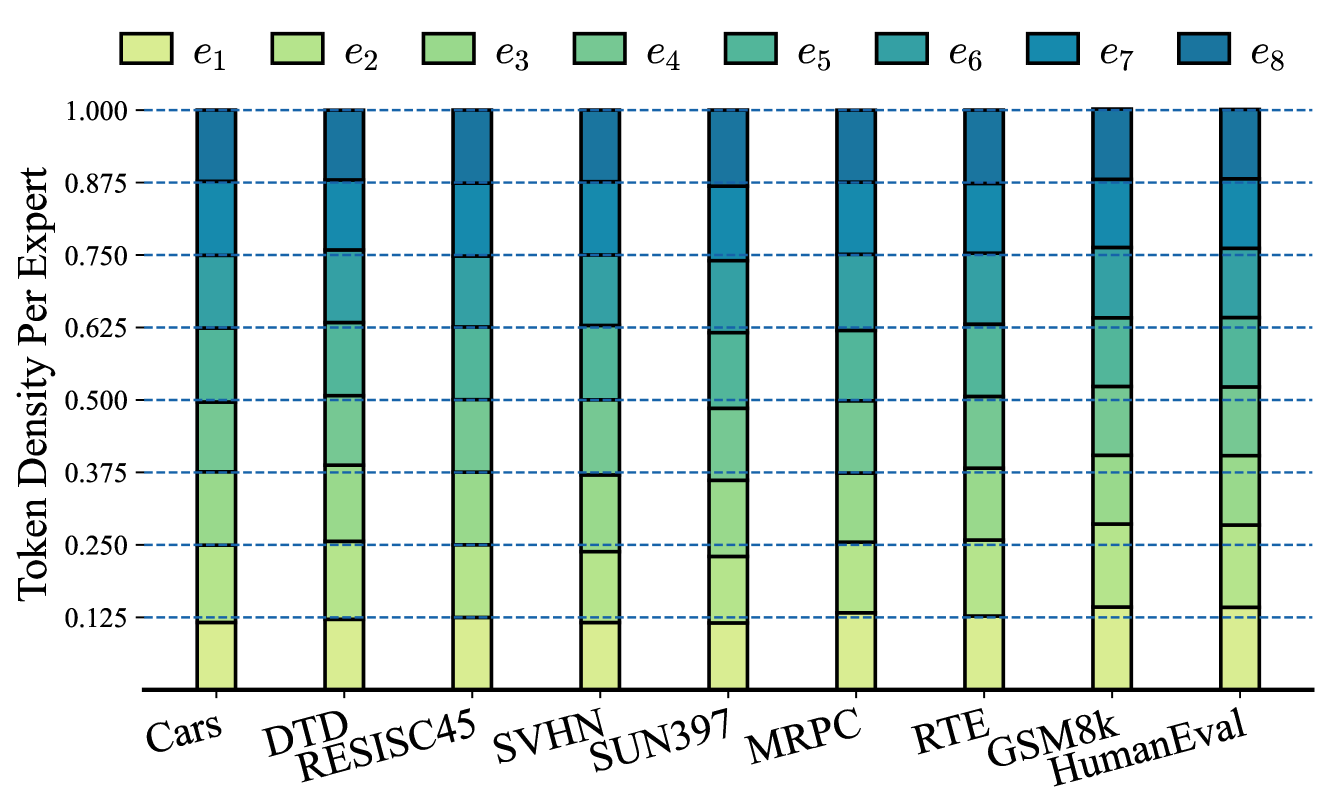
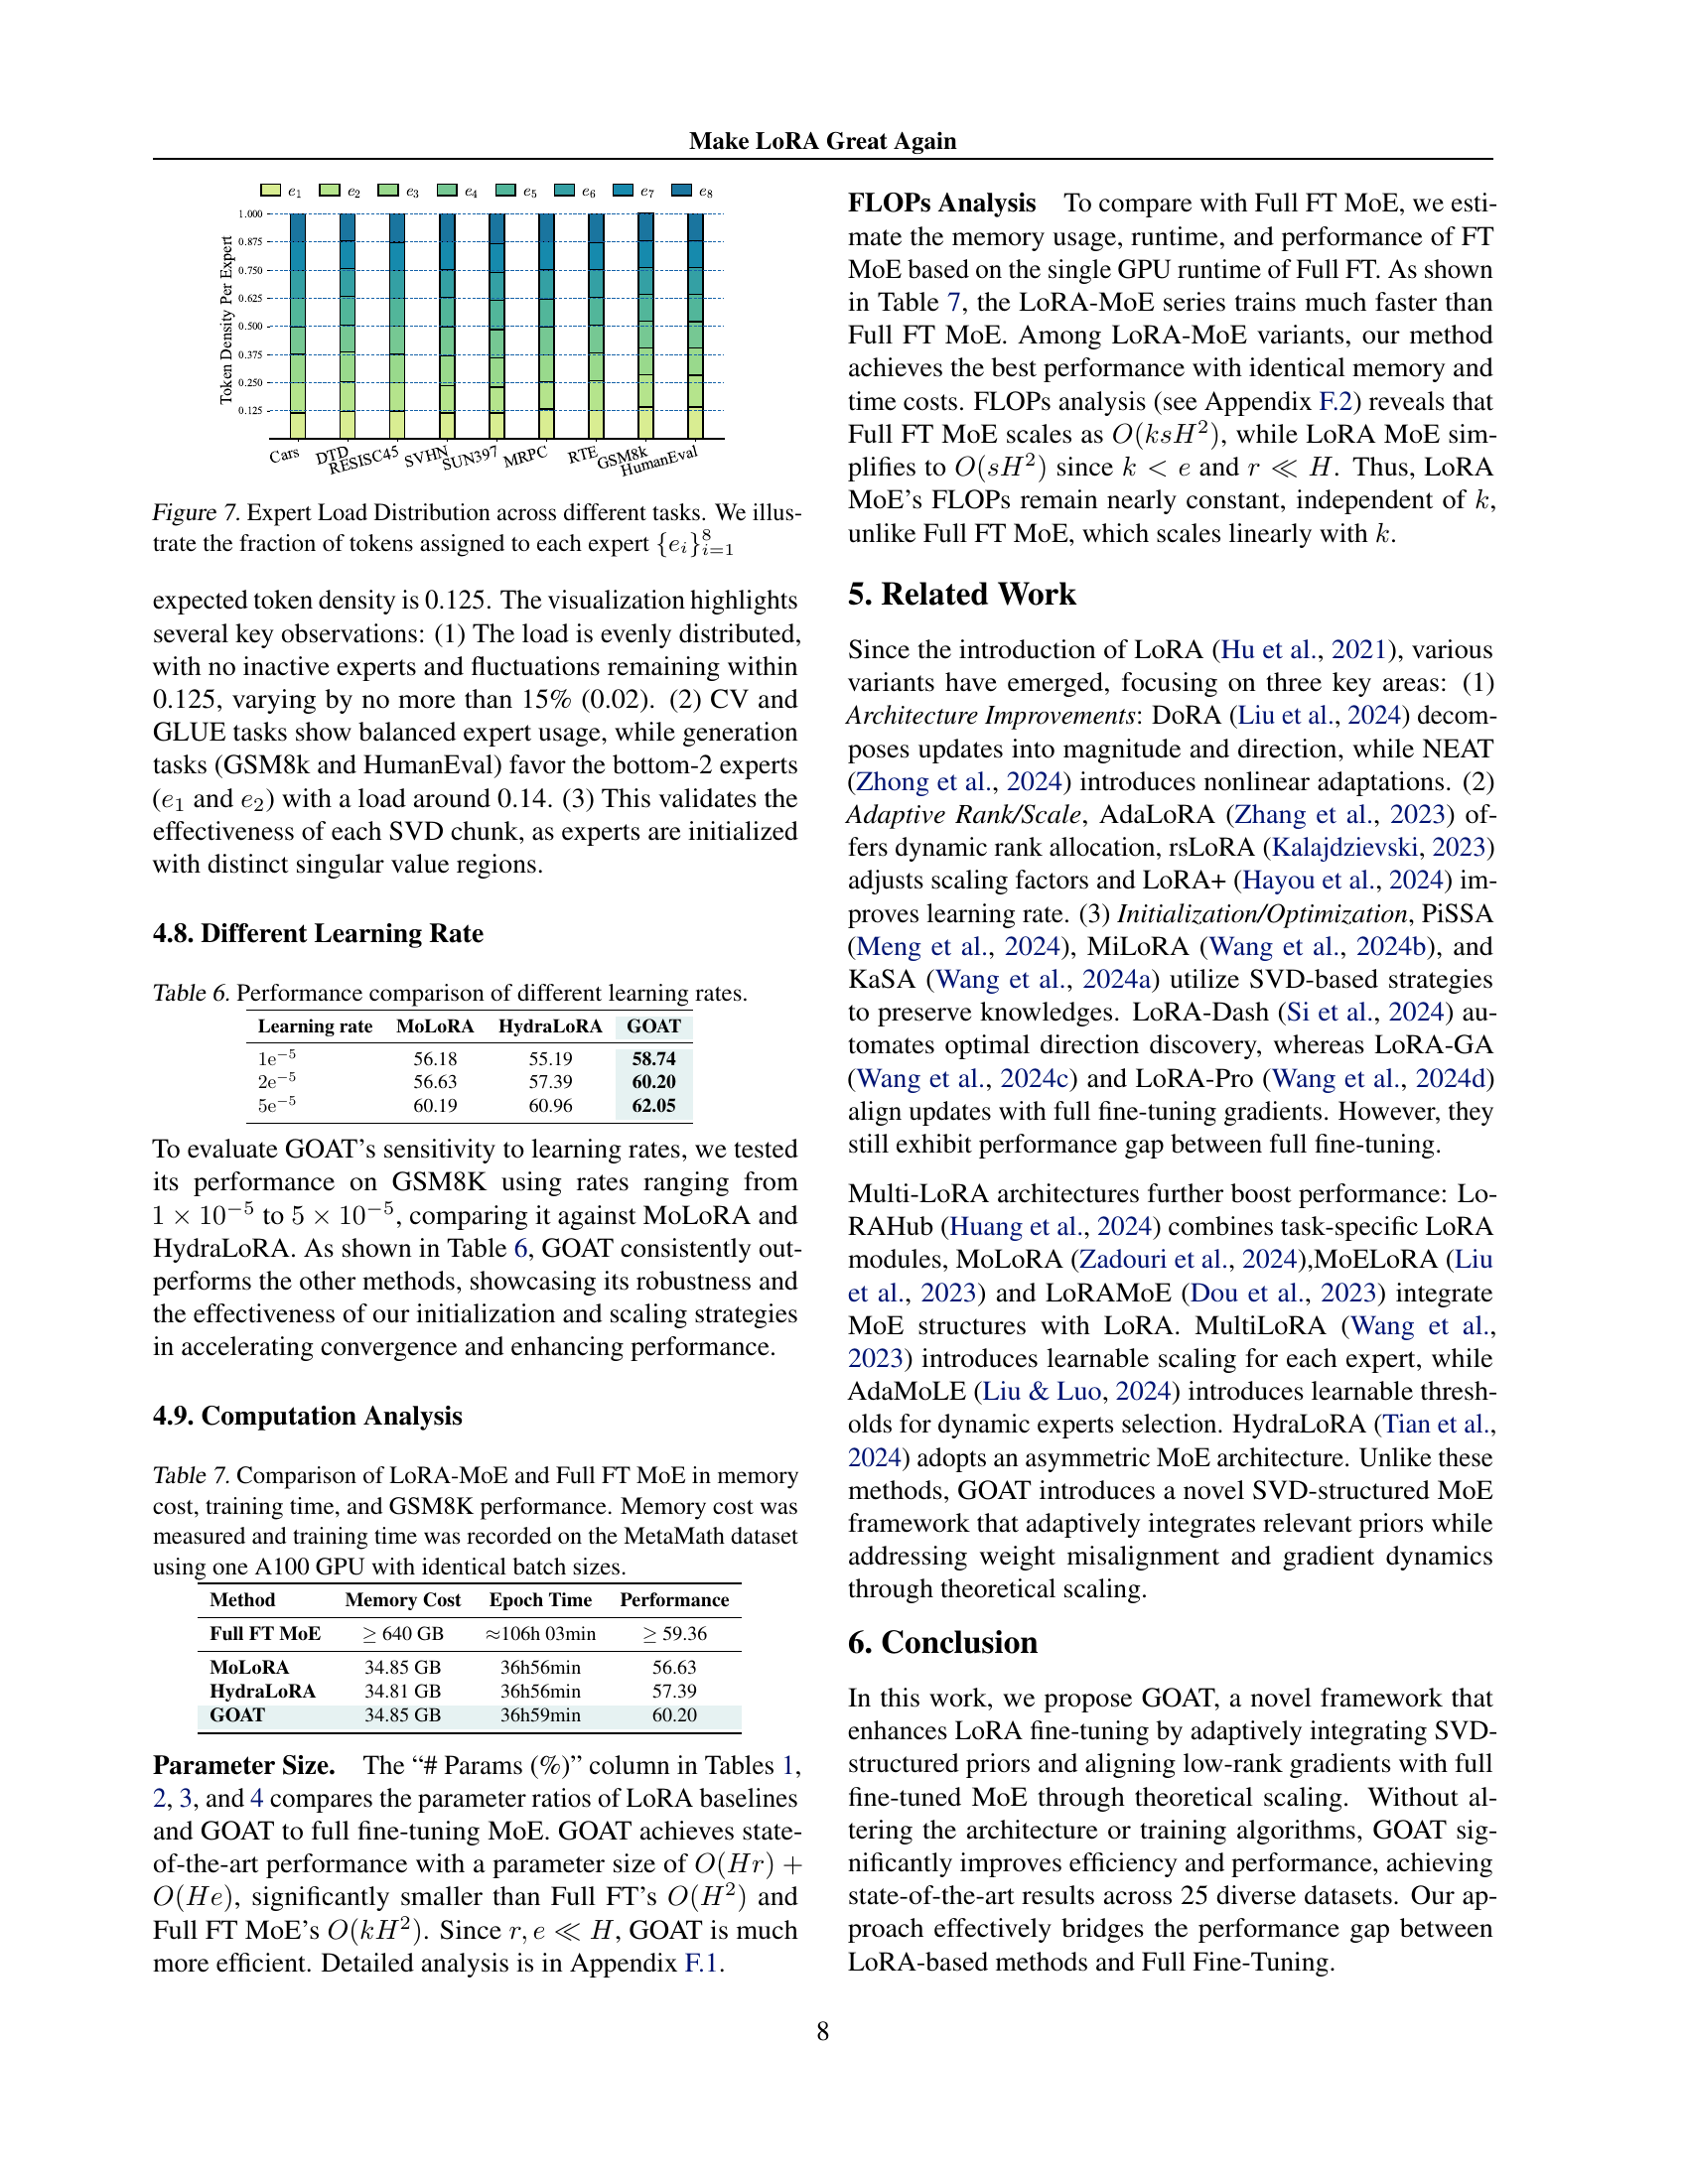
🔼 This figure visualizes the distribution of tokens processed by each of the eight experts in a Mixture-of-Experts (MoE) model across various downstream tasks. It shows the proportion of tokens handled by each expert for each task. The goal is to illustrate whether the expert load is balanced across the different tasks or if there’s any skewing towards specific experts for particular task types (e.g., image classification vs. natural language generation). Uniform distribution across experts suggests effective utilization of the MoE architecture and appropriate allocation of tasks among experts.
read the caption
Figure 7: Expert Load Distribution across different tasks. We illustrate the fraction of tokens assigned to each expert {ei}i=18superscriptsubscriptsubscript𝑒𝑖𝑖18\{e_{i}\}_{i=1}^{8}{ italic_e start_POSTSUBSCRIPT italic_i end_POSTSUBSCRIPT } start_POSTSUBSCRIPT italic_i = 1 end_POSTSUBSCRIPT start_POSTSUPERSCRIPT 8 end_POSTSUPERSCRIPT
More on tables
| Method | MT-Bench | GSM8K | HumanEval |
|---|---|---|---|
| Full FT | 5.56 | 59.36 | 35.31 |
| Single LoRA Methods | |||
| LoRA | 5.61 | 52.84 | 21.34 |
| DoRA | 5.97 | 54.59 | 19.75 |
| PiSSA | 5.30 | 55.42 | 19.52 |
| MiLoRA | 5.23 | 54.44 | 19.51 |
| LoRA MoE Methods | |||
| MoLoRA | 5.84 | 56.63 | 24.83 |
| HydraLoRA | 5.82 | 57.39 | 24.21 |
| GOAT | 6.01 | 60.20 | 25.61 |
🔼 This table presents the results of evaluating the Llama-2-7B language model on three distinct tasks: MT-Bench (a multi-turn dialogue benchmark), GSM8K (a grade-school math problem solving benchmark), and HumanEval (a code generation benchmark). The table compares the performance of the Llama-2-7B model on these tasks, likely showing various metrics such as accuracy, precision, or F1-score. The purpose is to demonstrate the model’s capabilities in different areas of natural language processing.
read the caption
Table 2: We evaluate Llama-2-7B on MT-Bench, GSM8K, and HumanEval for dialogue, math, and coding.
| Method | # Params(%) | BoolQ | PIQA | SIQA | HellaSwag | WinoGrande | ARC-e | ARC-c | OBQA | Average |
|---|---|---|---|---|---|---|---|---|---|---|
| ChatGPT | / | 73.10 | 85.40 | 68.50 | 78.50 | 66.10 | 89.80 | 79.90 | 74.80 | 77.01 |
| Single LoRA Methods | ||||||||||
| LoRA | 0.84 | 69.80 | 79.90 | 79.50 | 83.60 | 82.60 | 79.80 | 64.70 | 81.00 | 77.61 |
| DoRA | 0.84 | 71.80 | 83.10 | 79.90 | 89.10 | 83.00 | 84.50 | 71.00 | 81.20 | 80.45 |
| PiSSA | 0.84 | 67.60 | 78.10 | 78.40 | 76.60 | 78.00 | 75.80 | 60.20 | 75.60 | 73.78 |
| MiLoRA | 0.84 | 67.60 | 83.80 | 80.10 | 88.20 | 82.00 | 82.80 | 68.80 | 80.60 | 79.24 |
| LoRA-Dash | 0.84 | 71.00 | 75.70 | 79.30 | 91.10 | 78.60 | 84.20 | 69.80 | 78.80 | 78.56 |
| NEAT | 0.84 | 71.70 | 83.90 | 80.20 | 88.90 | 84.30 | 86.30 | 71.40 | 83.00 | 81.21 |
| KaSA | 0.84 | 73.60 | 84.40 | 80.20 | 91.50 | 84.50 | 84.70 | 72.10 | 81.20 | 81.53 |
| LoRA MoE Methods | ||||||||||
| MoLoRA | 0.96 | 73.15 | 83.68 | 80.09 | 74.57 | 85.95 | 87.33 | 72.53 | 86.20 | 80.43 |
| HydraLoRA | 0.84 | 72.78 | 84.06 | 79.68 | 80.34 | 86.66 | 87.12 | 72.35 | 86.00 | 81.12 |
| GOAT | 0.96 | 73.60 | 83.95 | 80.50 | 87.12 | 85.00 | 87.79 | 76.88 | 87.00 | 82.73 |
🔼 This table presents a performance comparison of different methods for commonsense reasoning on the LLaMA2 7B model. It evaluates eight commonsense reasoning datasets and compares the performance of the GOAT model with several baseline methods, including single LoRA models and LORA MoE models. Results are shown as percentages, and the symbol † indicates results taken from other published works. The table highlights the superior performance of GOAT compared to other methods, demonstrating improved accuracy across various commonsense reasoning tasks.
read the caption
Table 3: Performance comparison of LLaMA2 7B with different methods on eight commonsense reasoning datasets. The symbol ††\dagger† indicates that the results are taken from (Wang et al., 2024a; Zhong et al., 2024; Si et al., 2024).
| Method | # Params (%) | CoLA | SST-2 | MRPC | QQP | MNLI | QNLI | RTE | Average |
|---|---|---|---|---|---|---|---|---|---|
| Full FT | 100 | 84.27 | 95.98 | 85.29 | 91.58 | 89.83 | 94.49 | 84.84 | 89.47 |
| Full FT MoE | 698 | 86.02 | 96.22 | 85.05 | 92.20 | 90.20 | 95.10 | 84.48 | 89.90 |
| Single LoRA Methods | |||||||||
| LoRA | 4.00 | 83.41 | 95.64 | 83.33 | 90.06 | 89.00 | 93.28 | 84.47 | 88.46 |
| DoRA | 4.00 | 85.33 | 95.99 | 84.07 | 91.24 | 89.52 | 93.54 | 84.48 | 89.17 |
| PiSSA | 4.00 | 69.12 | 95.98 | 82.84 | 91.24 | 88.94 | 93.59 | 73.29 | 85.00 |
| MiLoRA | 4.00 | 84.65 | 96.10 | 86.02 | 91.33 | 89.51 | 94.12 | 84.83 | 89.51 |
| rsLoRA | 4.00 | 83.51 | 95.98 | 86.02 | 90.75 | 88.97 | 93.84 | 84.12 | 89.03 |
| LoRA MoE Methods | |||||||||
| MoLoRA | 4.50 | 83.94 | 96.10 | 87.75 | 91.45 | 89.36 | 93.90 | 84.11 | 89.52 |
| AdaMoLE | 4.56 | 83.99 | 95.76 | 86.03 | 91.48 | 89.21 | 93.64 | 83.75 | 89.12 |
| HydraLoRA | 2.75 | 83.89 | 95.52 | 85.04 | 91.02 | 89.34 | 93.87 | 81.22 | 88.56 |
| GOAT | 4.50 | 86.86 | 96.21 | 84.55 | 91.40 | 89.55 | 94.19 | 85.56 | 89.76 |
🔼 This table presents a comparison of the performance of different fine-tuning methods on seven tasks from the GLUE benchmark, using the RoBERTa-large model. The methods compared include full fine-tuning (Full FT), full fine-tuning with a Mixture of Experts (MoE) architecture (Full FT MoE), and several parameter-efficient fine-tuning (PEFT) methods. For each method, the table shows the percentage of parameters used compared to the full fine-tuning model and the accuracy achieved on each of the seven GLUE tasks. The total rank of low-rank adapters was set to 32 for all PEFT methods. This allows for a comparison of performance relative to the parameter count for each method.
read the caption
Table 4: Performance comparison of RoBERTa-large with different methods on 7 GLUE tasks. Total rank is set to 32.
| MoE | SVD Initialization | Avg. | Avg. (w/o MS) | |||
| O | P | M | R | |||
| ✓ | ✓ | 81.49 | 80.35 | |||
| ✓ | ✓ | 81.11 | 80.02 | |||
| ✓ | ✓ | 81.14 | 80.03 | |||
| ✓ | ✓ | 81.22 | 80.07 | |||
| ✓ | 81.06 | 80.26 | ||||
| ✓ | / | 77.62 | ||||
🔼 This ablation study analyzes the impact of different components of the GOAT model on its performance. Specifically, it compares the performance of GOAT using various initialization strategies for the low-rank adapters: the proposed adaptive prior selection (‘O’), using only the principal singular values (‘P’), only the minor singular values (‘M’), and random initialization (‘R’). It also investigates the effect of applying MoE scaling (‘MS’) on top of these initialization methods, both with and without the full MoE architecture. The results help determine the contribution of each component to GOAT’s improved efficiency and accuracy.
read the caption
Table 5: Ablation study of GOAT. “MoE” denotes using the MoE architecture instead of a single LoRA. “MS” refers to using MoE scaling. “O”, “P”, “M”, and “R” represent initializations from segments that selected by ours, with the principal singular value, with the minor singular value, and are randomly selected, respectively.
| Learning rate | MoLoRA | HydraLoRA | GOAT |
|---|---|---|---|
| 56.18 | 55.19 | 58.74 | |
| 56.63 | 57.39 | 60.20 | |
| 60.19 | 60.96 | 62.05 |
🔼 This table presents a comparison of the performance achieved by three different models (MoLoRA, HydraLoRA, and GOAT) across various learning rates. It shows how sensitive each model’s performance is to changes in learning rate and illustrates the relative robustness of GOAT compared to the other two models.
read the caption
Table 6: Performance comparison of different learning rates.
| Method | Memory Cost | Epoch Time | Performance |
|---|---|---|---|
| Full FT MoE | 640 GB | 106h 03min | 59.36 |
| MoLoRA | 34.85 GB | 36h56min | 56.63 |
| HydraLoRA | 34.81 GB | 36h56min | 57.39 |
| GOAT | 34.85 GB | 36h59min | 60.20 |
🔼 This table compares the performance of LoRA-based Mixture-of-Experts (MoE) models against the full fine-tuned MoE model. It shows a comparison across three key metrics: memory usage (in GB), training time (hours and minutes), and the performance on the GSM8K benchmark. All experiments were conducted using a single NVIDIA A100 GPU with consistent batch sizes to ensure fair comparison.
read the caption
Table 7: Comparison of LoRA-MoE and Full FT MoE in memory cost, training time, and GSM8K performance. Memory cost was measured and training time was recorded on the MetaMath dataset using one A100 GPU with identical batch sizes.
| Method | NLG(Avg.) | NLU(Avg.) | IC(Avg.) | CR(Avg.) | Avg. |
|---|---|---|---|---|---|
| GOAT | 30.60 | 89.76 | 81.49 | 82.64 | 71.12 |
| GOAT+ | 30.54 | 89.61 | 81.54 | 82.41 | 71.02 |
🔼 This table presents a comparison of the performance of the original GOAT method and its extended version, GOAT+, which is adapted for scenarios with proper scaling. The comparison is made across four different benchmark categories (NLG, NLU, IC, and CR), showing average scores for each method. This demonstrates the robustness and generalizability of the GOAT approach, even when the scaling factor is pre-adjusted.
read the caption
Table 8: Performance comparison of our method extended to properly scaled scenarios.
| Hyperparameter | Commonsense Reasoning |
|---|---|
| Batch Size | 16 |
| Rank | 32 |
| Alpha | 64 |
| Optimizer | AdamW |
| Warmup Steps | 100 |
| Dropout | 0.05 |
| Learning Rate | 1e-4 |
| Epochs | 3 |
🔼 This table lists the hyperparameters used for the commonsense reasoning task when training the GOAT model. It includes details such as batch size, rank, alpha, optimizer, warmup steps, dropout rate, learning rate, and the number of epochs. These settings are crucial for optimizing the model’s performance on this specific task.
read the caption
Table 9: Hyperparameters of the commonsense reasoning task for GOAT.
| Hyperparameter | Cars | DTD | EuroSAT | GTSRB | RESISC45 | SUN397 | SVHN |
|---|---|---|---|---|---|---|---|
| Batch Size | 512 | ||||||
| Rank | 8 | ||||||
| Alpha | 16 | ||||||
| Optimizer | AdamW | ||||||
| Warmup Steps | 100 | ||||||
| Dropout | 0.05 | ||||||
| Learning Rate | 1e-4 | ||||||
| Epochs | 35 | 76 | 12 | 11 | 15 | 14 | 4 |
🔼 This table details the hyperparameters used for training the GOAT model on image classification tasks. It shows the values used for different parameters including batch size, rank, alpha, optimizer, warmup steps, dropout, learning rate, and epochs. The specific values are listed for each of the seven datasets used in the image classification experiments: Cars, DTD, EuroSAT, GTSRB, RESISC45, SUN397, and SVHN. This information helps readers understand the experimental setup and how those parameters were chosen for the experiments.
read the caption
Table 10: Hyperparameters of the image classification task for GOAT.
| Hyperparameter | CoLA | SST-2 | MRPC | QQP | MNLI | QNLI | RTE |
|---|---|---|---|---|---|---|---|
| Batch Size | 256 | ||||||
| Rank | 8 | ||||||
| Alpha | 16 | ||||||
| Optimizer | AdamW | ||||||
| Warmup Steps | 100 | ||||||
| Dropout | 0.05 | ||||||
| Learning Rate | 1e-4 | ||||||
| Epochs | 10 | 10 | 10 | 10 | 10 | 10 | 50 |
🔼 This table details the hyperparameters used for training the GOAT model on seven natural language understanding tasks from the GLUE benchmark. It lists the batch size, rank, alpha value, optimizer, warmup steps, dropout rate, learning rate, and number of epochs used for each task. This information is crucial for reproducibility and understanding the training process of the GOAT model on these specific datasets.
read the caption
Table 11: Hyperparameters of the natural language understanding tasks for GOAT.
| Hyperparameter | Natural Language Generation |
|---|---|
| Batch Size | 32 |
| Rank | 8 |
| Alpha | 16 |
| Optimizer | AdamW |
| Warmup Steps | 100 |
| Dropout | 0.05 |
| Learning Rate | 2e-5 |
| Epochs | 5 |
🔼 This table presents the hyperparameters used for training the GOAT model on natural language generation tasks. It details the specific settings for batch size, rank, alpha (a scaling factor), optimizer (AdamW), warmup steps, dropout rate, learning rate, and number of epochs. These parameters were crucial in optimizing the model’s performance on these specific tasks.
read the caption
Table 12: Hyperparameters of the natural language generation task for GOAT.
Full paper#