TL;DR#
Key Takeaways#
Why does it matter?#
This paper is important because it highlights that test-time scaling might not generalize effectively to multilingual tasks, offering insights into the complexities of achieving true multilinguality in mathematical reasoning and guiding future research in more robust, cross-lingual methods.
Visual Insights#

🔼 This figure displays the performance of the Qwen2.5-1.5B-Math model on a multilingual mathematics benchmark (MCLM) when employing three different test-time scaling strategies: Outcome Reward Modeling (ORM), Process Reward Modeling (PRM), and Budget Forcing (BF). The x-axis represents the three test-time scaling methods. The y-axis indicates the accuracy achieved by each method. The bars show the accuracy for each method, with error bars illustrating the variability of results. Importantly, the results demonstrate that once the three scaling methods are adjusted to have roughly the same computational cost (measured in FLOPs), they all achieve similar performance on the MCLM benchmark. This suggests that the choice of test-time scaling method may be less crucial than the total computational budget used during inference.
read the caption
Figure 1: Performance of Qwen2.5-1.5B-Math with different test-time scaling strategies.——Once configured to use comparable inference FLOPs, all three methods (Outcome Reward Modeling, Process Reward Modeling, and Budget Forcing) achieve similar performance.
| Models | MGSM |
| Gemma2-9B | 78.37 |
| Qwen2.5-14B-Instruct | 82.27 |
| Qwen2.5-72B-Instruct | 88.16 |
| Mistral-Large | 89.01 |
| GPT-4o-mini | 87.36 |
| o3-mini | 89.30 |
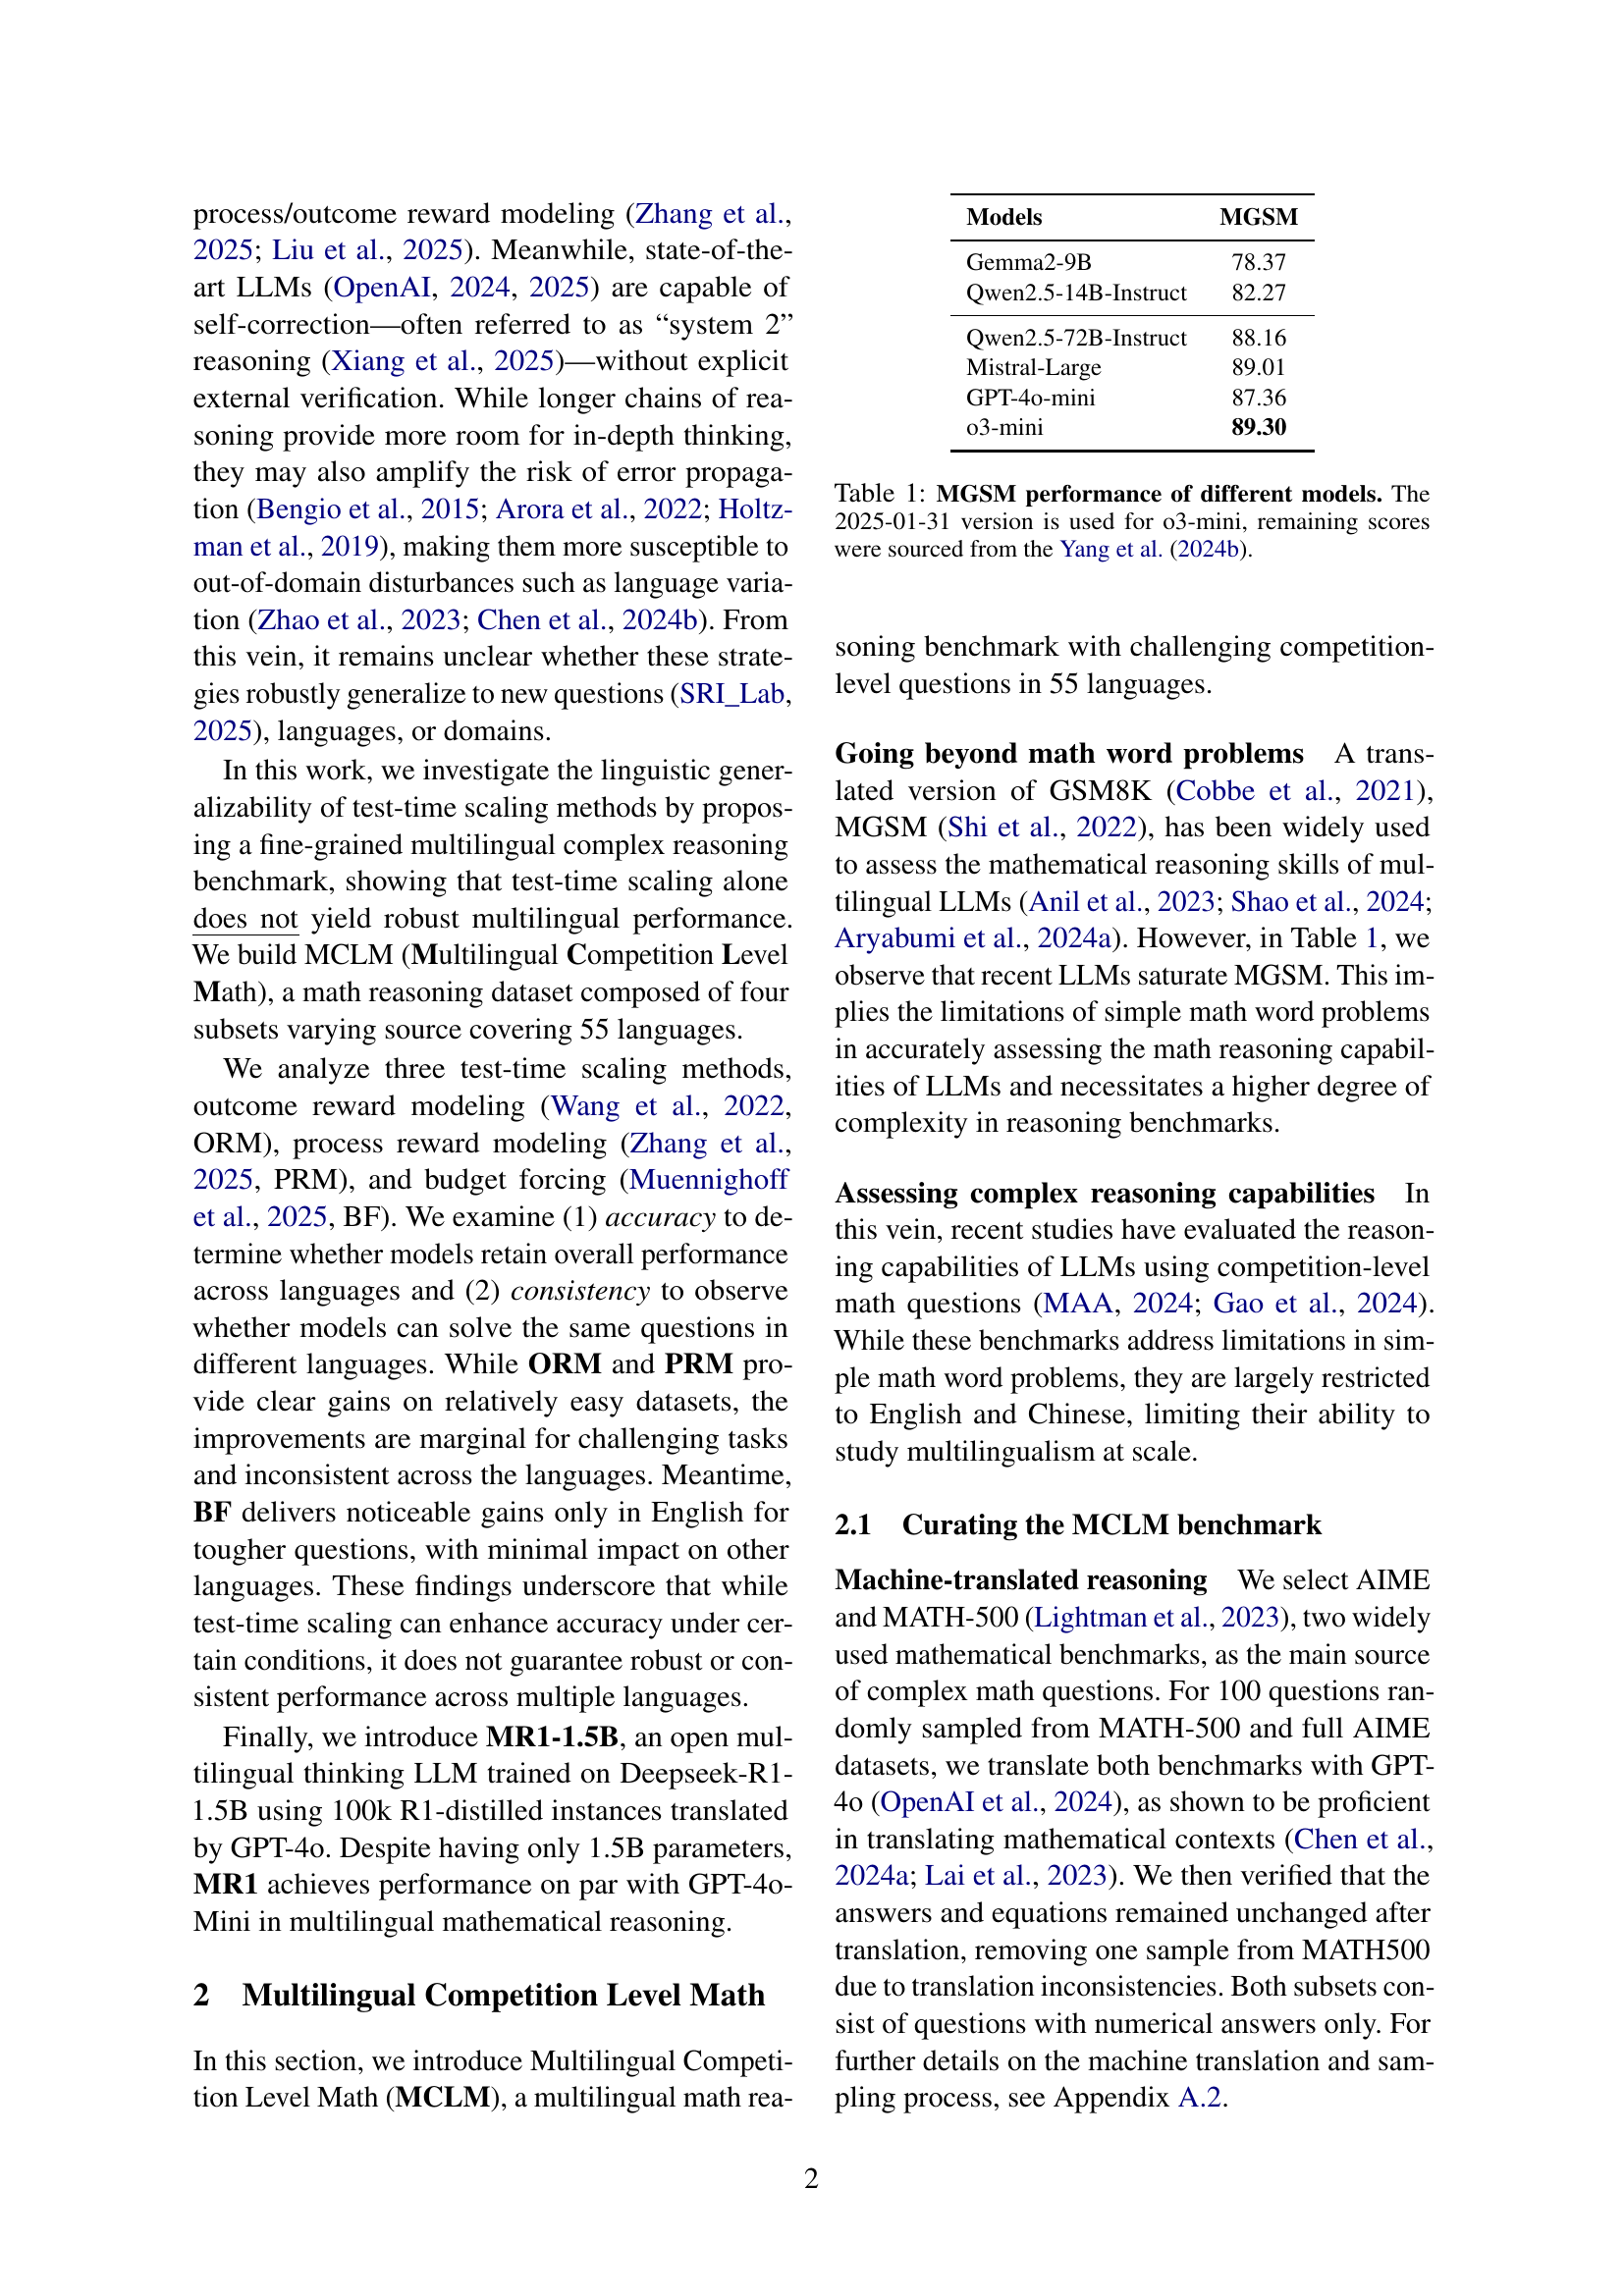
🔼 This table presents the performance of various large language models (LLMs) on the MGSM (Multilingual Generalization of Standard Math) benchmark. The MGSM benchmark tests the ability of LLMs to solve mathematical word problems. The table shows the accuracy (percentage of correctly solved problems) achieved by each model. Note that the results for the o3-mini model reflect its performance as of January 31, 2025; scores for all other models were taken from the work of Yang et al. (2024b). This table helps illustrate the capabilities of different LLMs in solving mathematical reasoning tasks in a multilingual context.
read the caption
Table 1: MGSM performance of different models. The 2025-01-31 version is used for o3-mini, remaining scores were sourced from the Yang et al. (2024b).
In-depth insights#
Test-Time Scaling#
Test-time scaling methods aim to enhance a language model’s reasoning or generation capabilities without altering the pre-trained parameters. It’s a crucial area because further scaling via pre-training becomes increasingly challenging due to data scarcity and high computational costs. The key question becomes: do the cross-lingual benefits observed in pre-training also extend to test-time scaling? Methods such as chain-of-thought prompting and scratchpads have shown promise, particularly in math and code-related tasks. Recent approaches have explored lengthening the chain-of-thought during test time, but challenges remain. Mathematical reasoning, with its expansive search space, remains relatively unexplored. One strategy involves external verifiers like best-of-N selection, Monte Carlo Tree Search, and reward modeling to navigate this complex space and refine the model’s outputs. However, the effectiveness and generalizability of these strategies in multilingual settings need further scrutiny. The study of these is important, to see whether model consistency and the correctness of the answers are coherent or not.
MCLM Benchmark#
The MCLM benchmark seems to be a novel multilingual evaluation dataset designed for complex mathematical reasoning. It likely aims to address limitations of existing benchmarks, such as MGSM, which current LLMs are saturating. The key innovation is its multilingual nature, covering a wide range of languages (potentially 55) to assess cross-lingual generalization. MCLM likely incorporates competition-level math problems (AIME and MATH) demanding more sophisticated reasoning skills than standard word problems. The inclusion of human-translated questions suggests a focus on mitigating biases from machine translation. It probably provides a more reliable measure of true mathematical reasoning capabilities in multilingual models. Given emphasis on the challenge, the MCLM likely introduces difficulty in the dataset
Beyond MGSM#
The paper acknowledges the limitations of relying solely on MGSM (a translated version of GSM8K) for evaluating mathematical reasoning in LLMs, as recent models have saturated this benchmark. The paper introduces MCLM a new benchmark to solve issues with MGSM that is designed to assess more complex reasoning capabilities, incorporating competition-level math questions from multiple sources and across a wider range of languages (55) than typical benchmarks. This is crucial because current math reasoning datasets are limited to one or two languages. MCLM mitigates translation biases by including translated data and human annotation. The paper’s approach highlights the need for benchmarks that can robustly assess cross-lingual understanding and reasoning, moving beyond simplistic tasks that no longer challenge state-of-the-art LLMs.
Limited Generality#
Limited generality is a critical consideration when evaluating the findings. While the research might demonstrate the effectiveness of test-time scaling in specific settings or with particular models, its applicability across diverse scenarios remains uncertain. Factors such as dataset characteristics, model architectures, and the choice of scaling techniques can all influence the extent to which the observed benefits generalize. Furthermore, the study’s focus on mathematical reasoning tasks might limit the transferability of its conclusions to other domains, such as natural language understanding or visual reasoning. It is crucial to acknowledge these limitations and cautiously extrapolate the results to new contexts.
Budget Scaling#
Budget Forcing, as a test-time scaling method, involves controlling the computational budget allocated to a language model during inference. Rather than solely relying on a model’s inherent capacity to generate long chain-of-thoughts, which can be unpredictable, budget forcing imposes constraints. The models are truncated and required to give answers when budget is exceeded or when falling short of a budget they are prompted for more steps. While seemingly beneficial, the paper’s findings suggest budget forcing doesn’t consistently translate to improved multilingual performance. This implies the effectiveness of test-time scaling may depend heavily on language and task characteristics, potentially indicating that benefits observed in resource-rich languages do not easily transfer to other languages.
More visual insights#
More on figures

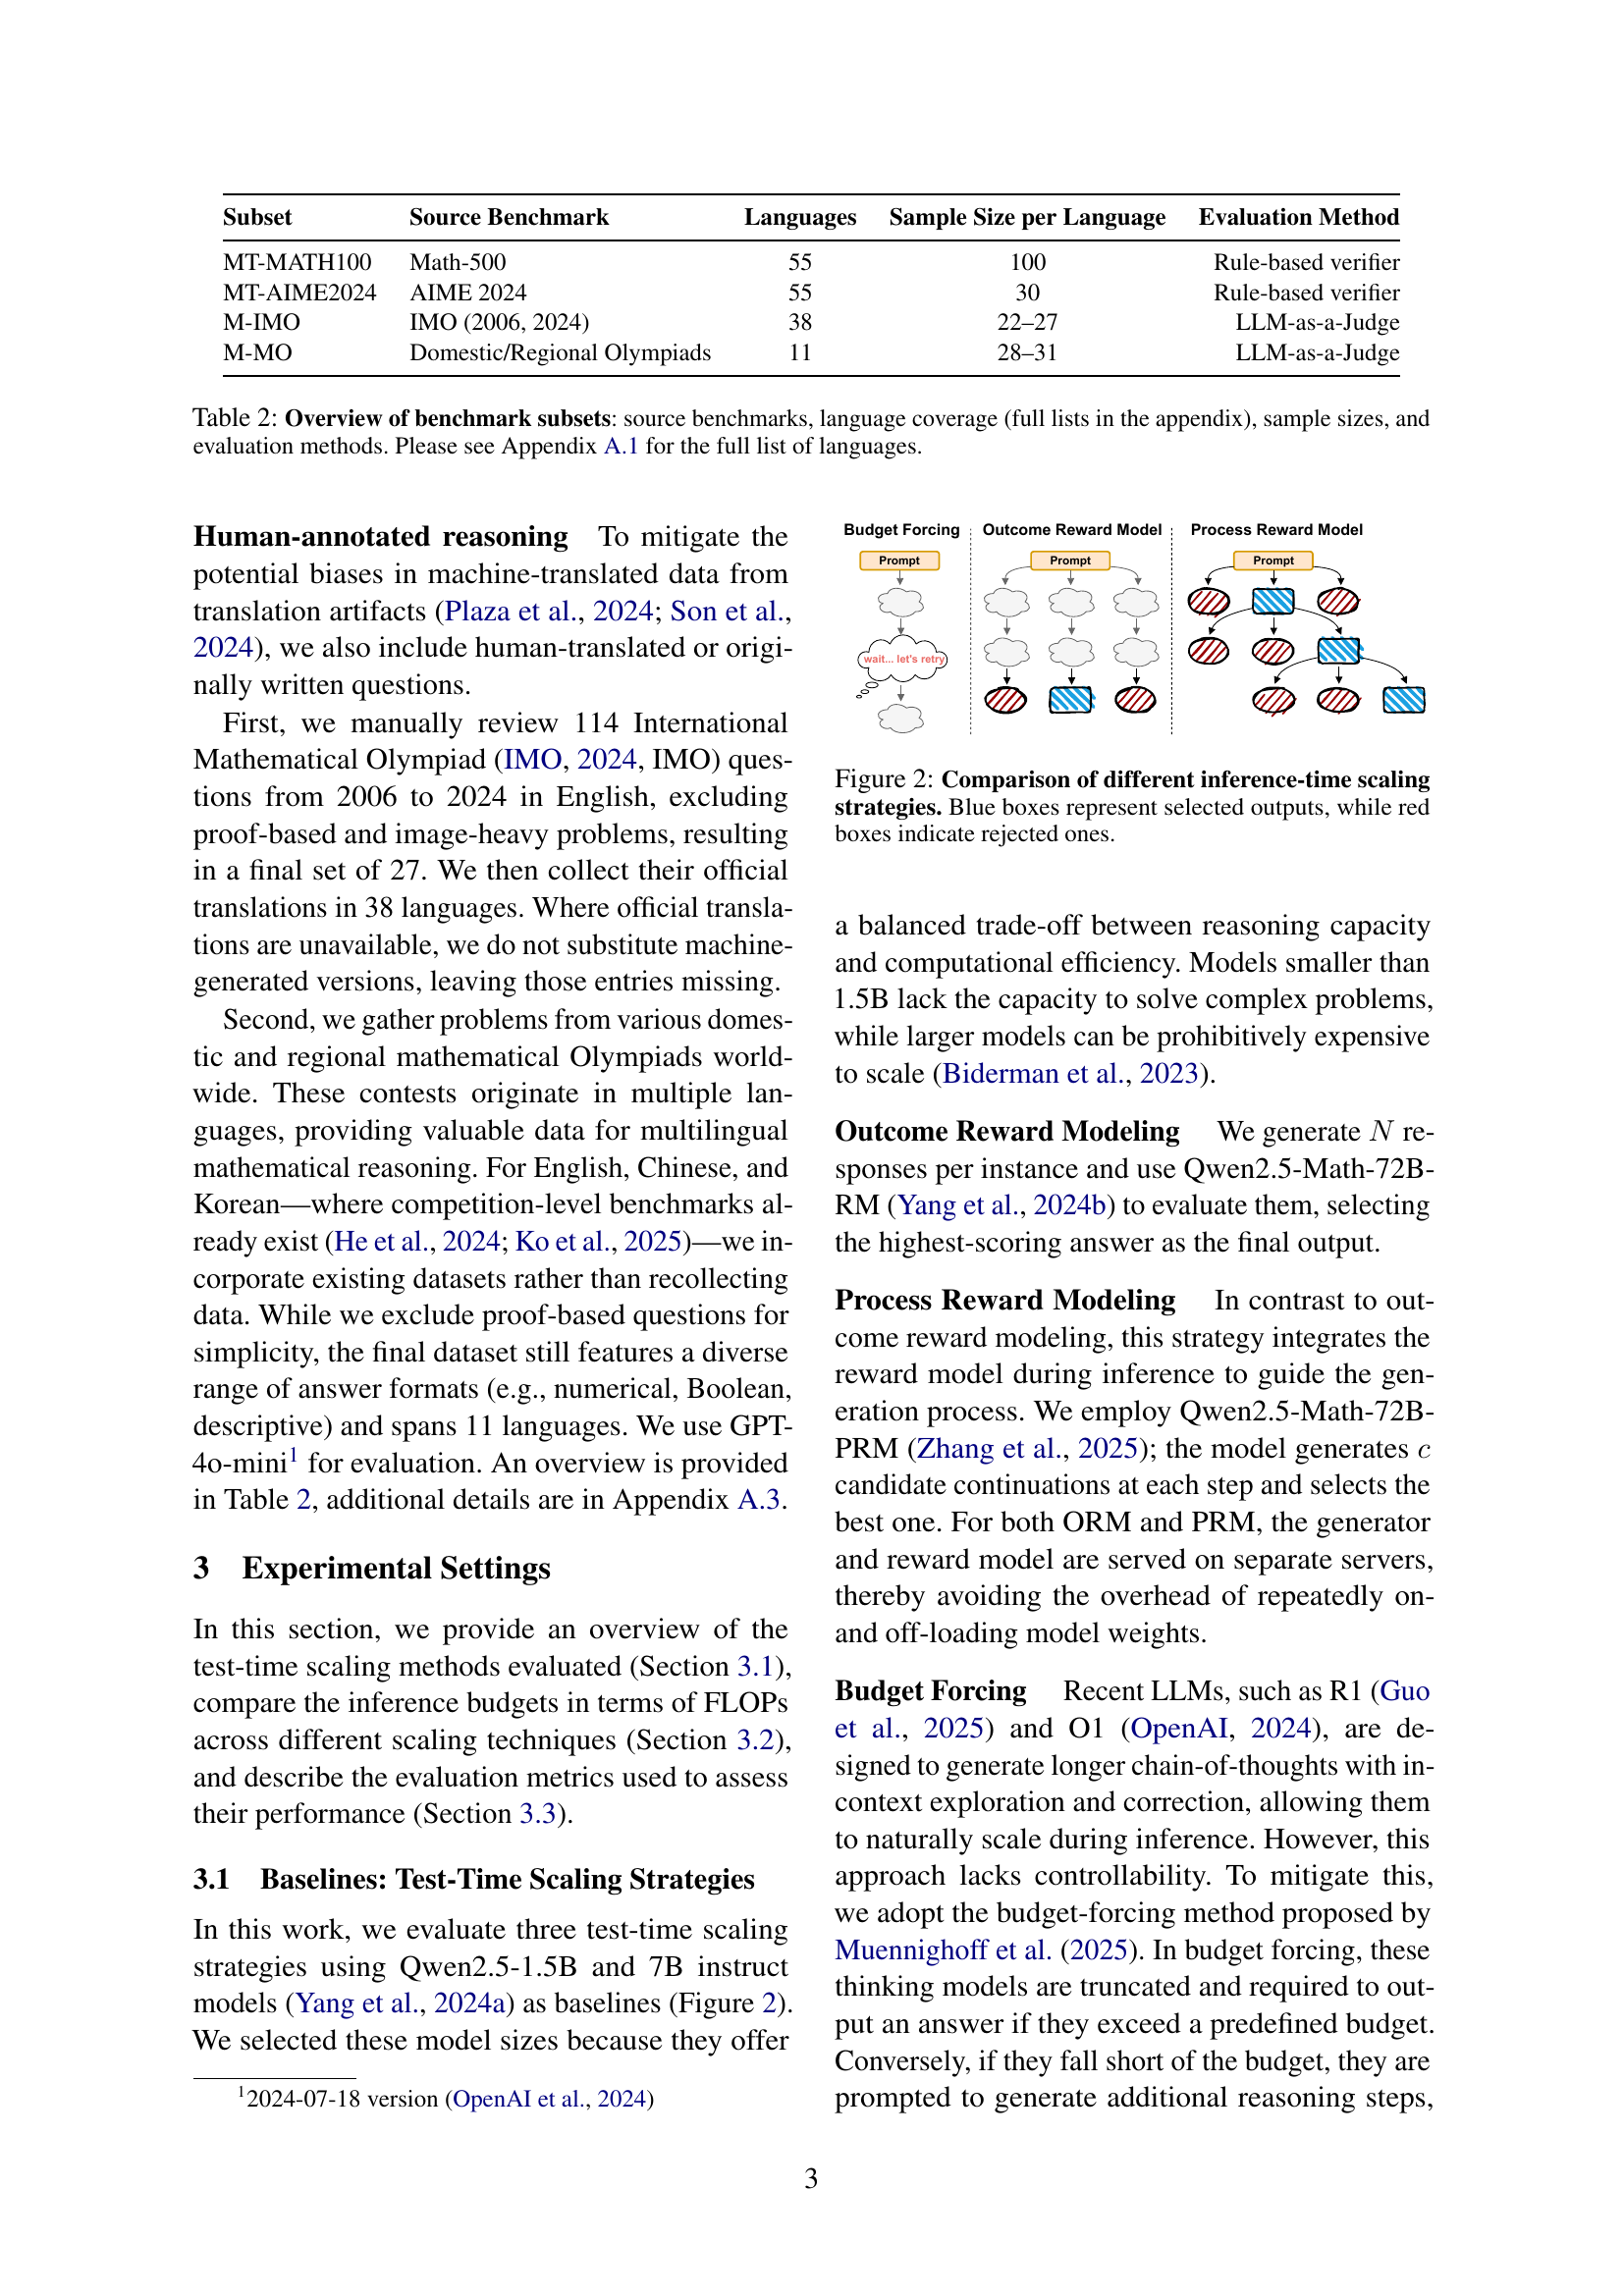
🔼 This figure illustrates three different test-time scaling strategies: Outcome Reward Modeling (ORM), Process Reward Modeling (PRM), and Budget Forcing (BF). Each strategy is represented visually. The blue boxes represent the model’s outputs that were considered correct or accepted, while the red boxes show rejected or incorrect outputs. The figure highlights the different approaches to scaling inference at test time and visually represents which outputs each method would accept or reject, emphasizing their differing processes.
read the caption
Figure 2: Comparison of different inference-time scaling strategies. Blue boxes represent selected outputs, while red boxes indicate rejected ones.

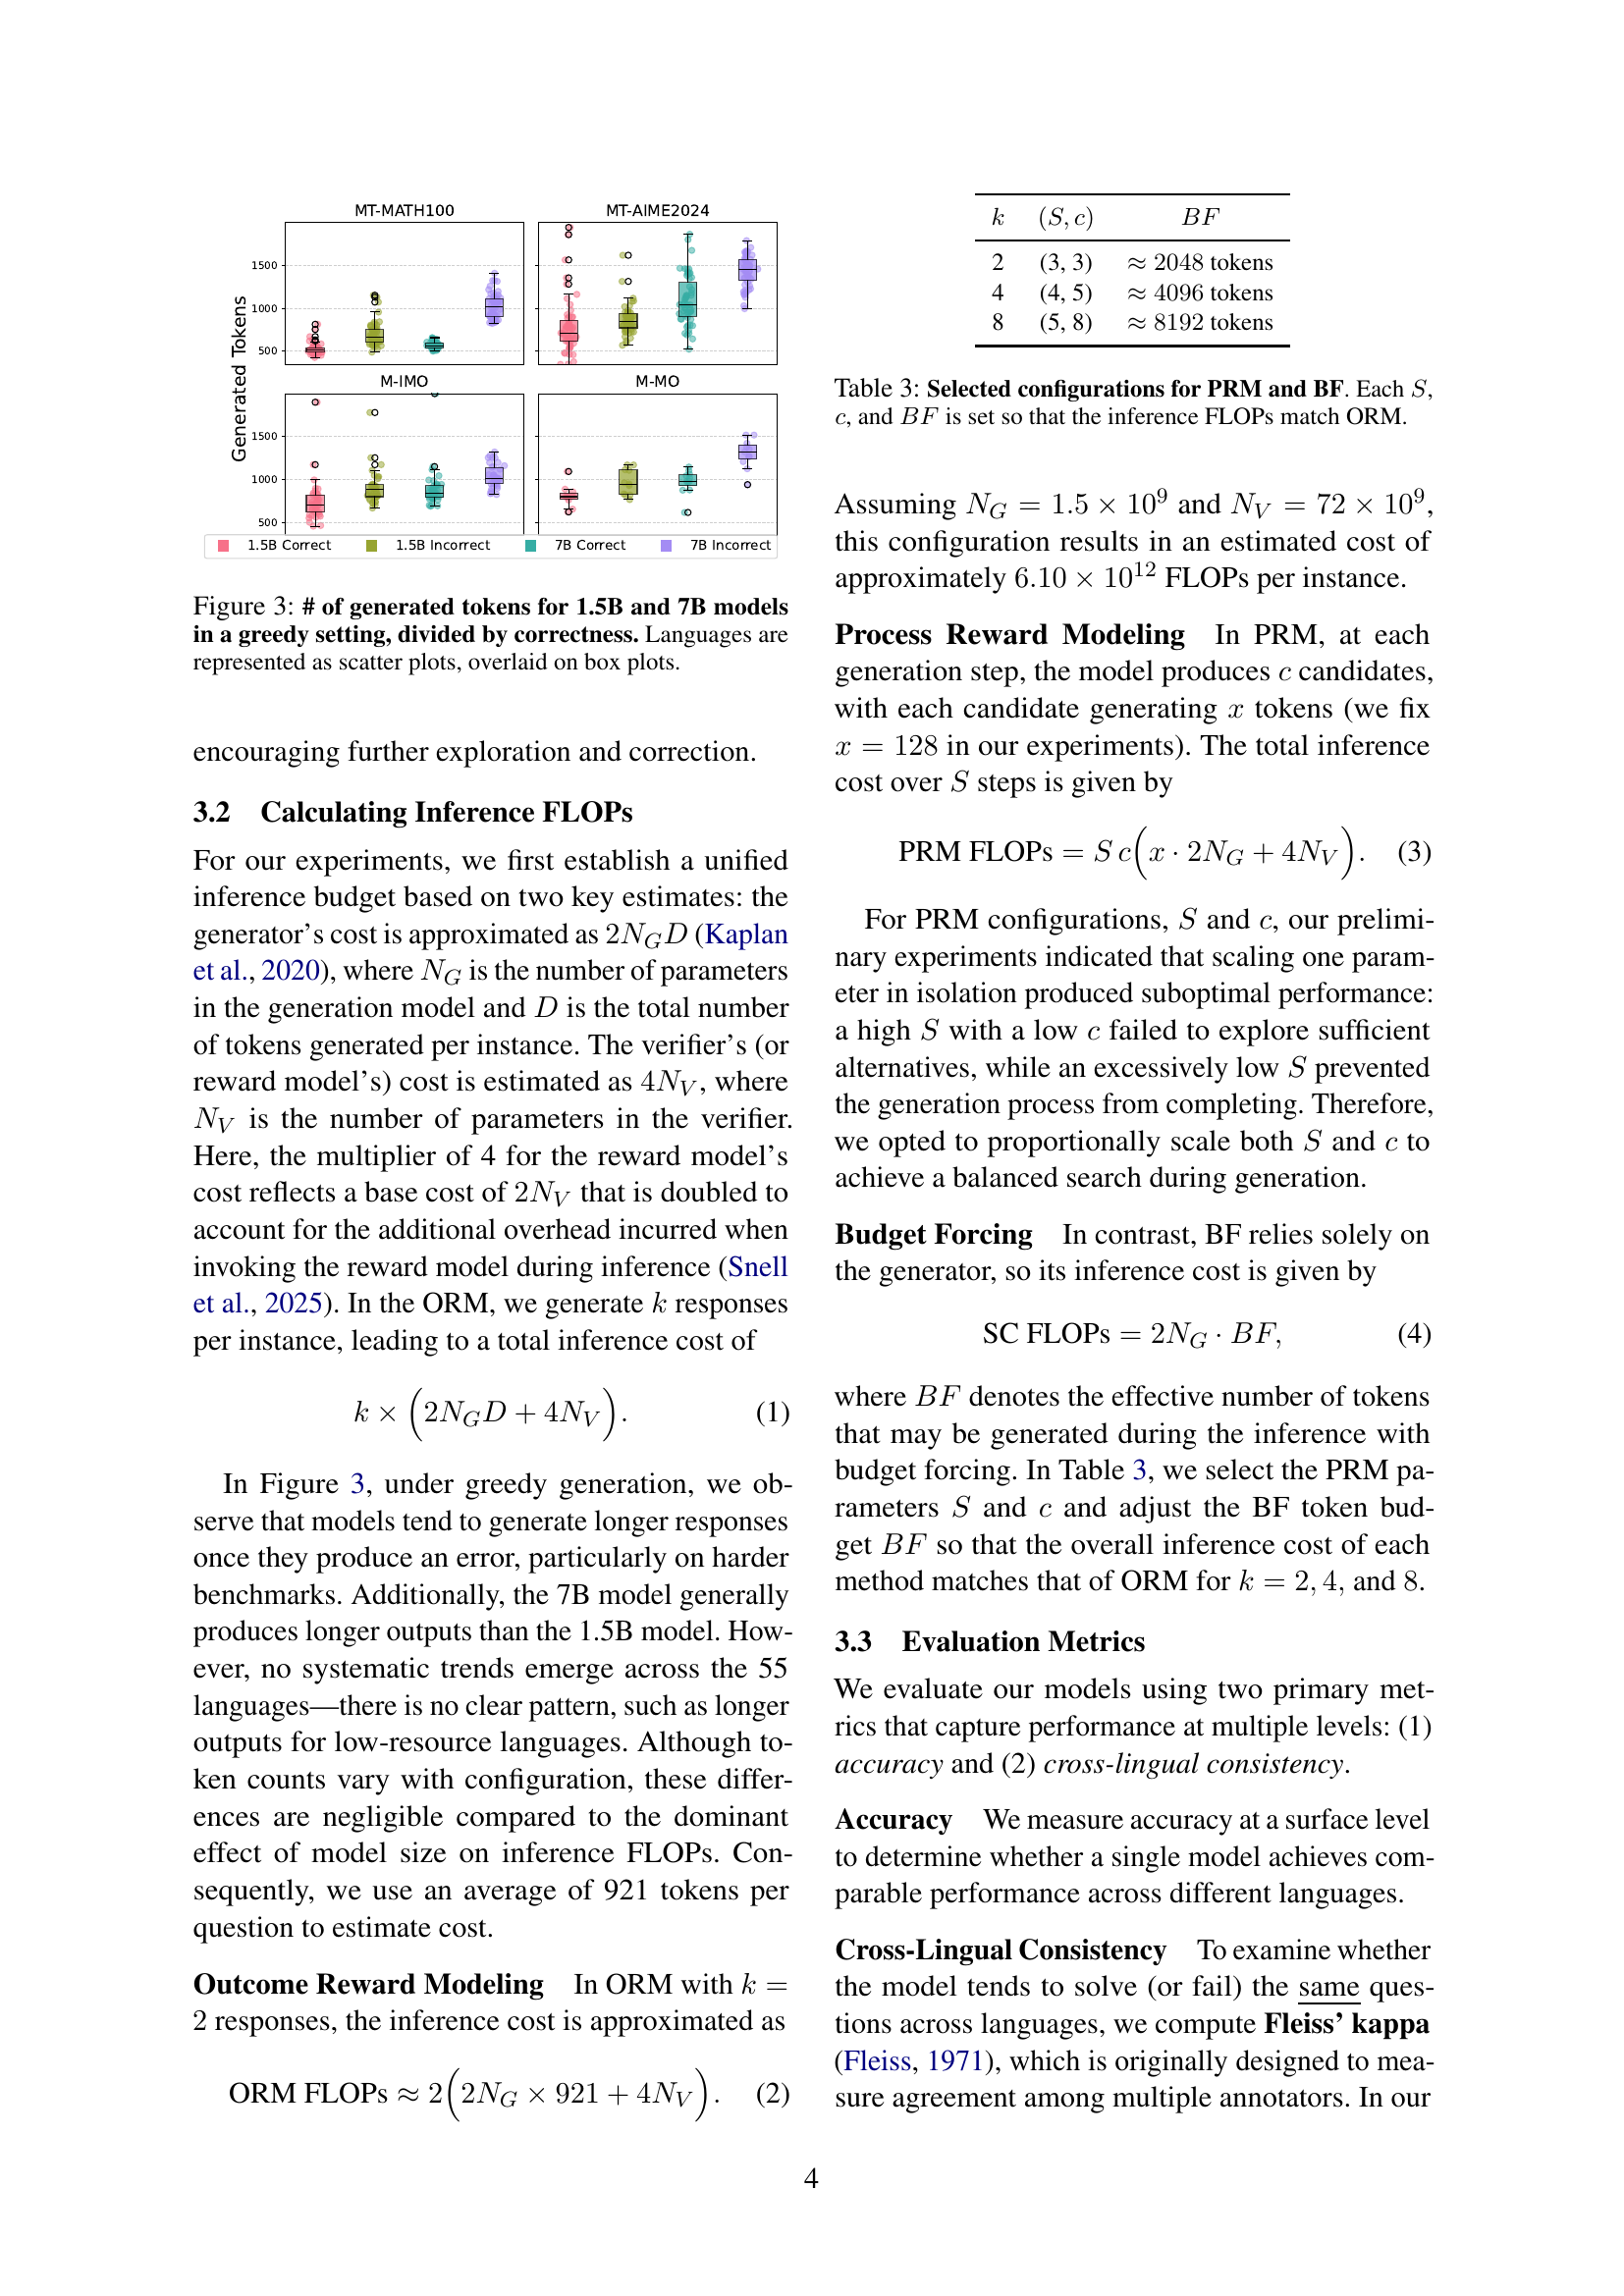
🔼 This figure displays the number of tokens generated by 1.5B and 7B parameter models during greedy decoding, categorized by whether the generated answer was correct or not. Each data point represents a single problem solved in one of the 55 languages included in the MCLM benchmark. The data is presented as a combination of box plots showing the overall distribution of token counts for each model size and correctness level, and overlaid scatter plots to show the individual data points for each language. This visualization helps to understand the relationship between model size, answer correctness, and the length of the model’s reasoning process in different languages.
read the caption
Figure 3: # of generated tokens for 1.5B and 7B models in a greedy setting, divided by correctness. Languages are represented as scatter plots, overlaid on box plots.

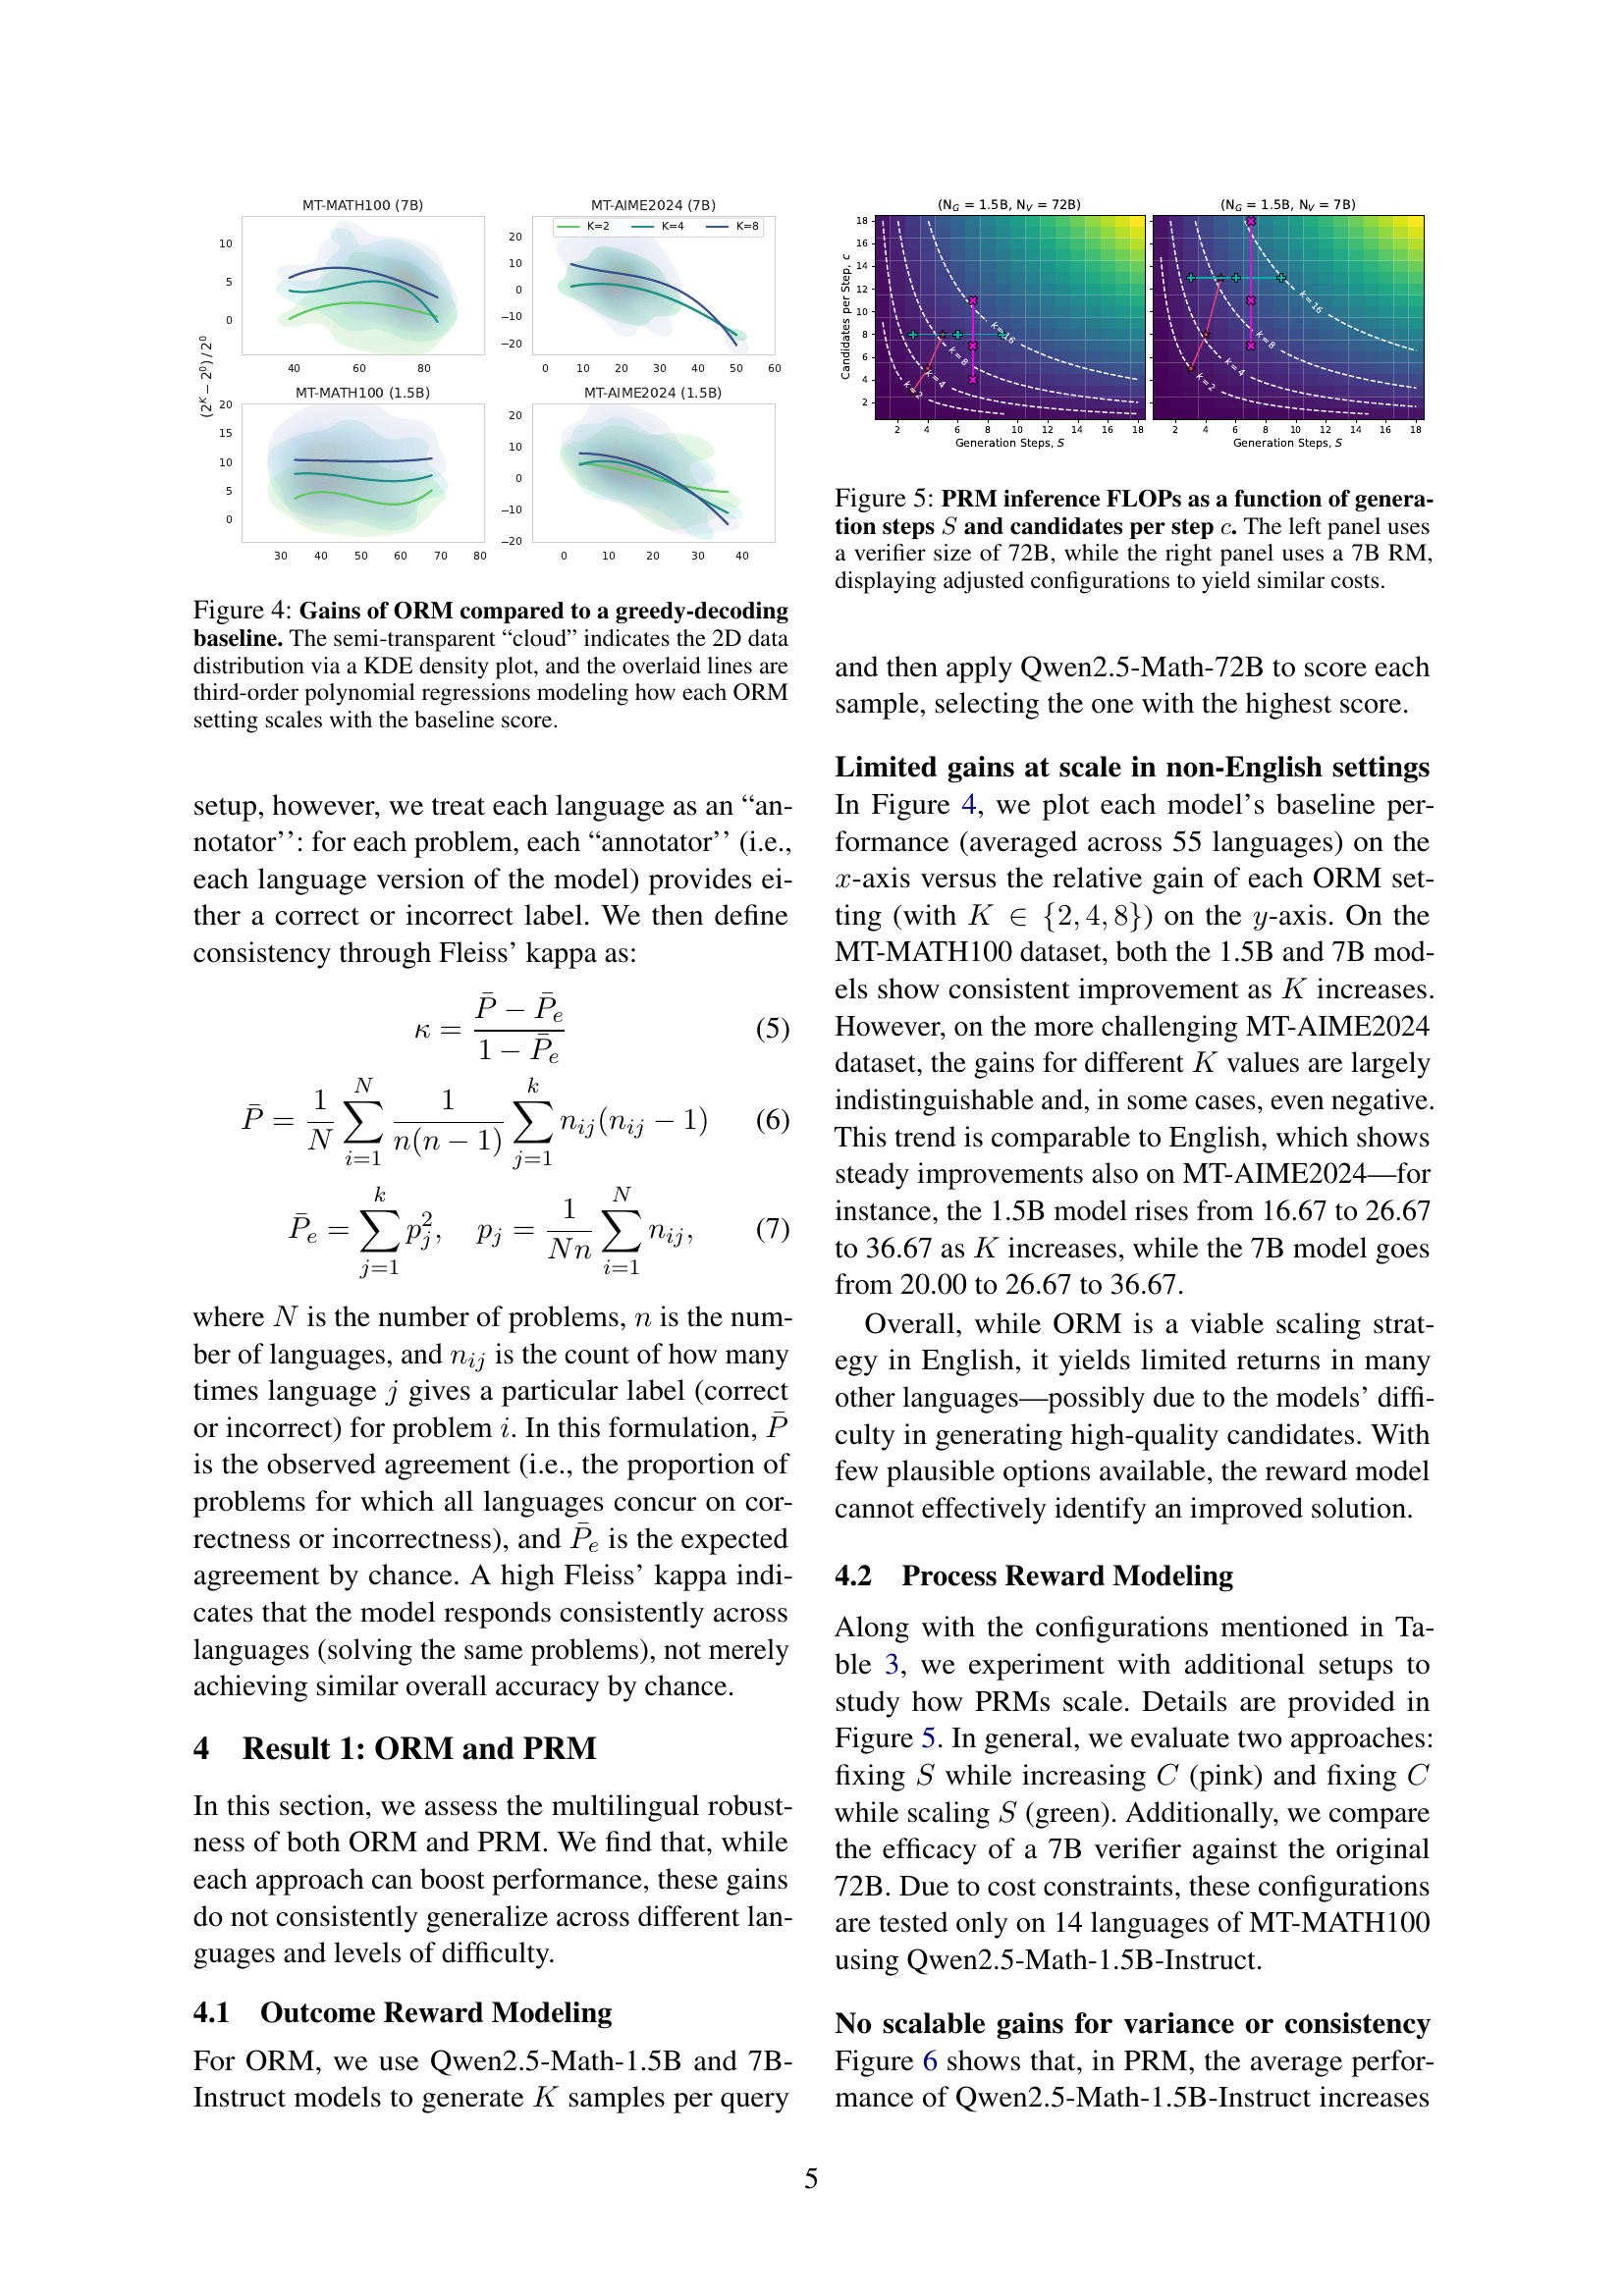
🔼 This figure displays the performance gains achieved by using Outcome Reward Modeling (ORM) compared to a standard greedy decoding approach. The x-axis represents the baseline score (obtained through greedy decoding), while the y-axis shows the improvement gained by applying the ORM method. Different ORM settings (with varying numbers of generated responses: k = 2, 4, 8) are represented by separate lines and data clouds. A KDE (Kernel Density Estimate) plot, visually depicted as a semi-transparent cloud, helps visualize the distribution of data points for each ORM setting. Third-order polynomial regression curves provide a smooth fit to the data, illustrating the relationship between the baseline score and ORM performance improvements across various settings and across the two datasets (MT-MATH100 and MT-AIME2024). This visualization helps to understand how the effectiveness of ORM varies depending on the baseline performance and which parameter settings (number of responses K) lead to the most gains in performance.
read the caption
Figure 4: Gains of ORM compared to a greedy-decoding baseline. The semi-transparent “cloud” indicates the 2D data distribution via a KDE density plot, and the overlaid lines are third-order polynomial regressions modeling how each ORM setting scales with the baseline score.

🔼 This figure illustrates the computational cost (in FLOPs) of the Process Reward Modeling (PRM) test-time scaling method. PRM involves generating multiple candidate continuations at each step of the reasoning process and selecting the best one using a reward model. The figure shows how the FLOPs change as a function of two key parameters: (1) the number of generation steps (S) and (2) the number of candidate continuations generated at each step (c). The left panel shows the FLOPs when using a large 72B parameter reward model, while the right panel shows the FLOPs when using a smaller 7B parameter reward model. Importantly, the configurations in both panels have been adjusted to ensure that the total computational cost (FLOPs) remains roughly equal for each configuration, allowing for a fair comparison of the different parameter settings.
read the caption
Figure 5: PRM inference FLOPs as a function of generation steps S𝑆Sitalic_S and candidates per step c𝑐citalic_c. The left panel uses a verifier size of 72B, while the right panel uses a 7B RM, displaying adjusted configurations to yield similar costs.

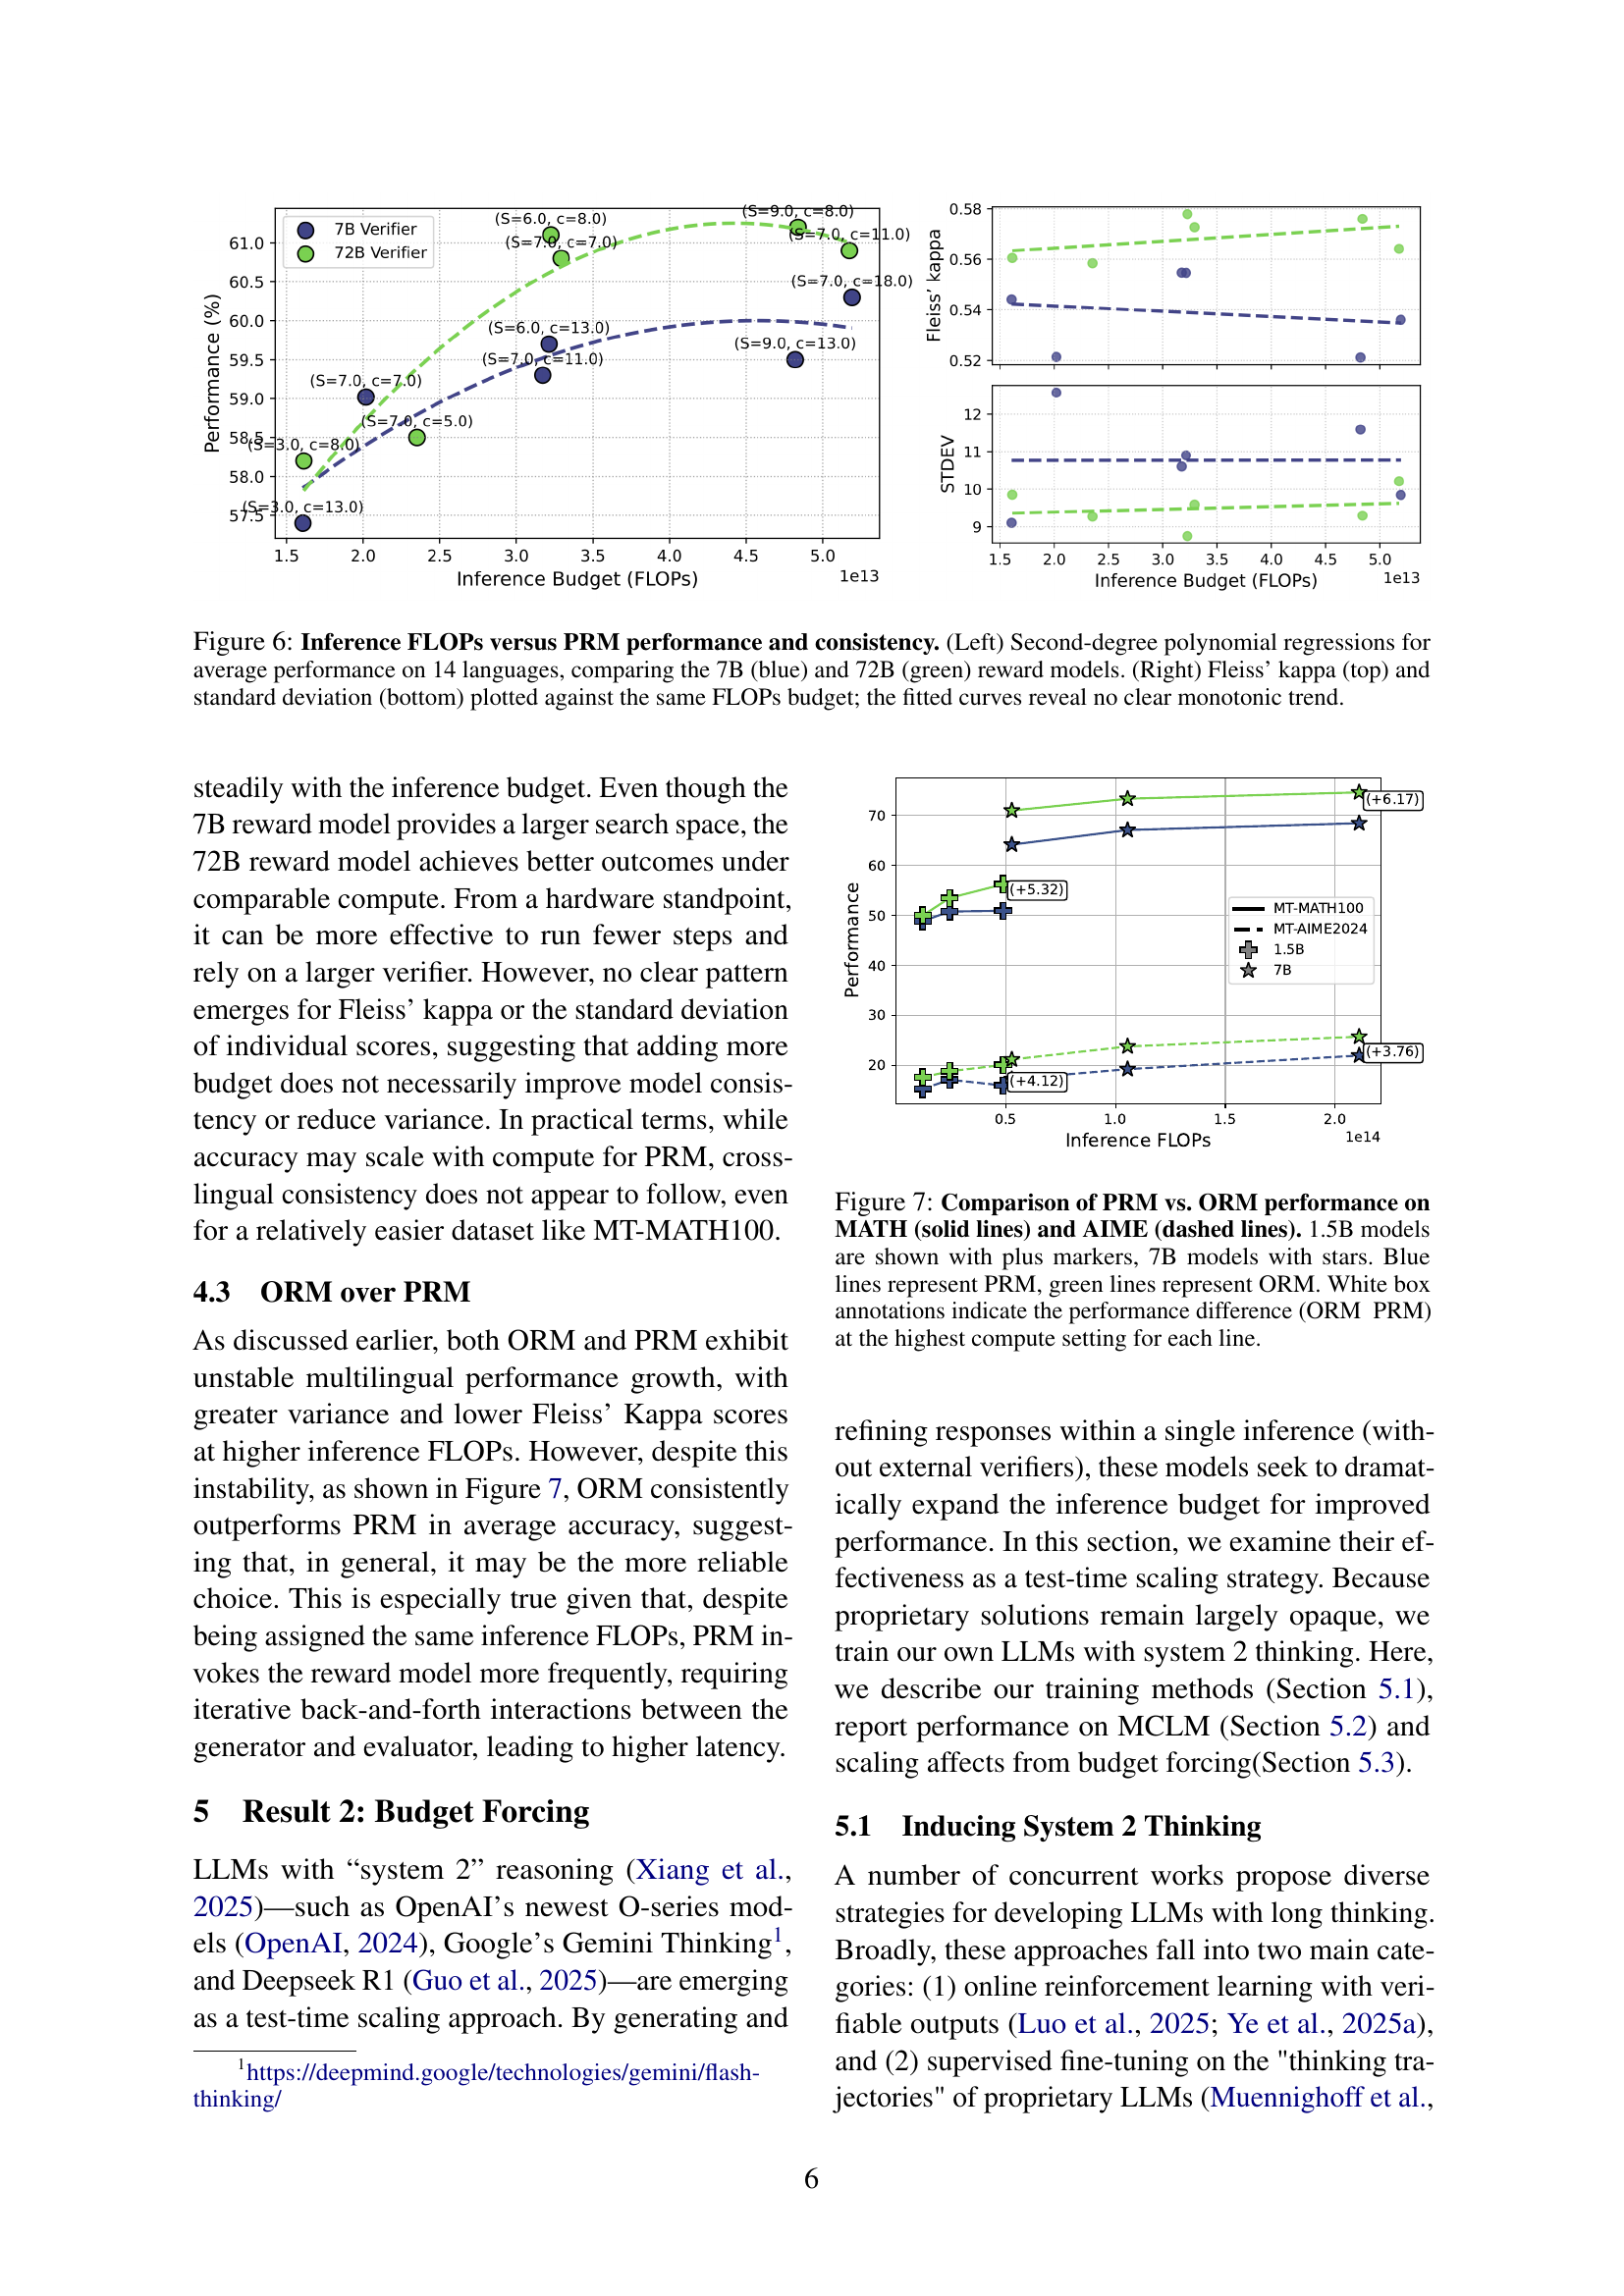
🔼 This figure analyzes the performance and consistency of the Process Reward Modeling (PRM) method across different inference FLOPs budgets. The left panel shows the average performance of PRM on 14 languages using 7B and 72B reward models, fitted with second-degree polynomial regressions. The right panel displays Fleiss’ kappa (measuring inter-annotator agreement) and standard deviation for the same 14 languages. The analysis demonstrates the relationship between the computational cost (FLOPs) and both the accuracy and consistency of PRM across languages, highlighting that increased FLOPs does not guarantee better multilingual performance or consistency.
read the caption
Figure 6: Inference FLOPs versus PRM performance and consistency. (Left) Second-degree polynomial regressions for average performance on 14 languages, comparing the 7B (blue) and 72B (green) reward models. (Right) Fleiss’ kappa (top) and standard deviation (bottom) plotted against the same FLOPs budget; the fitted curves reveal no clear monotonic trend.

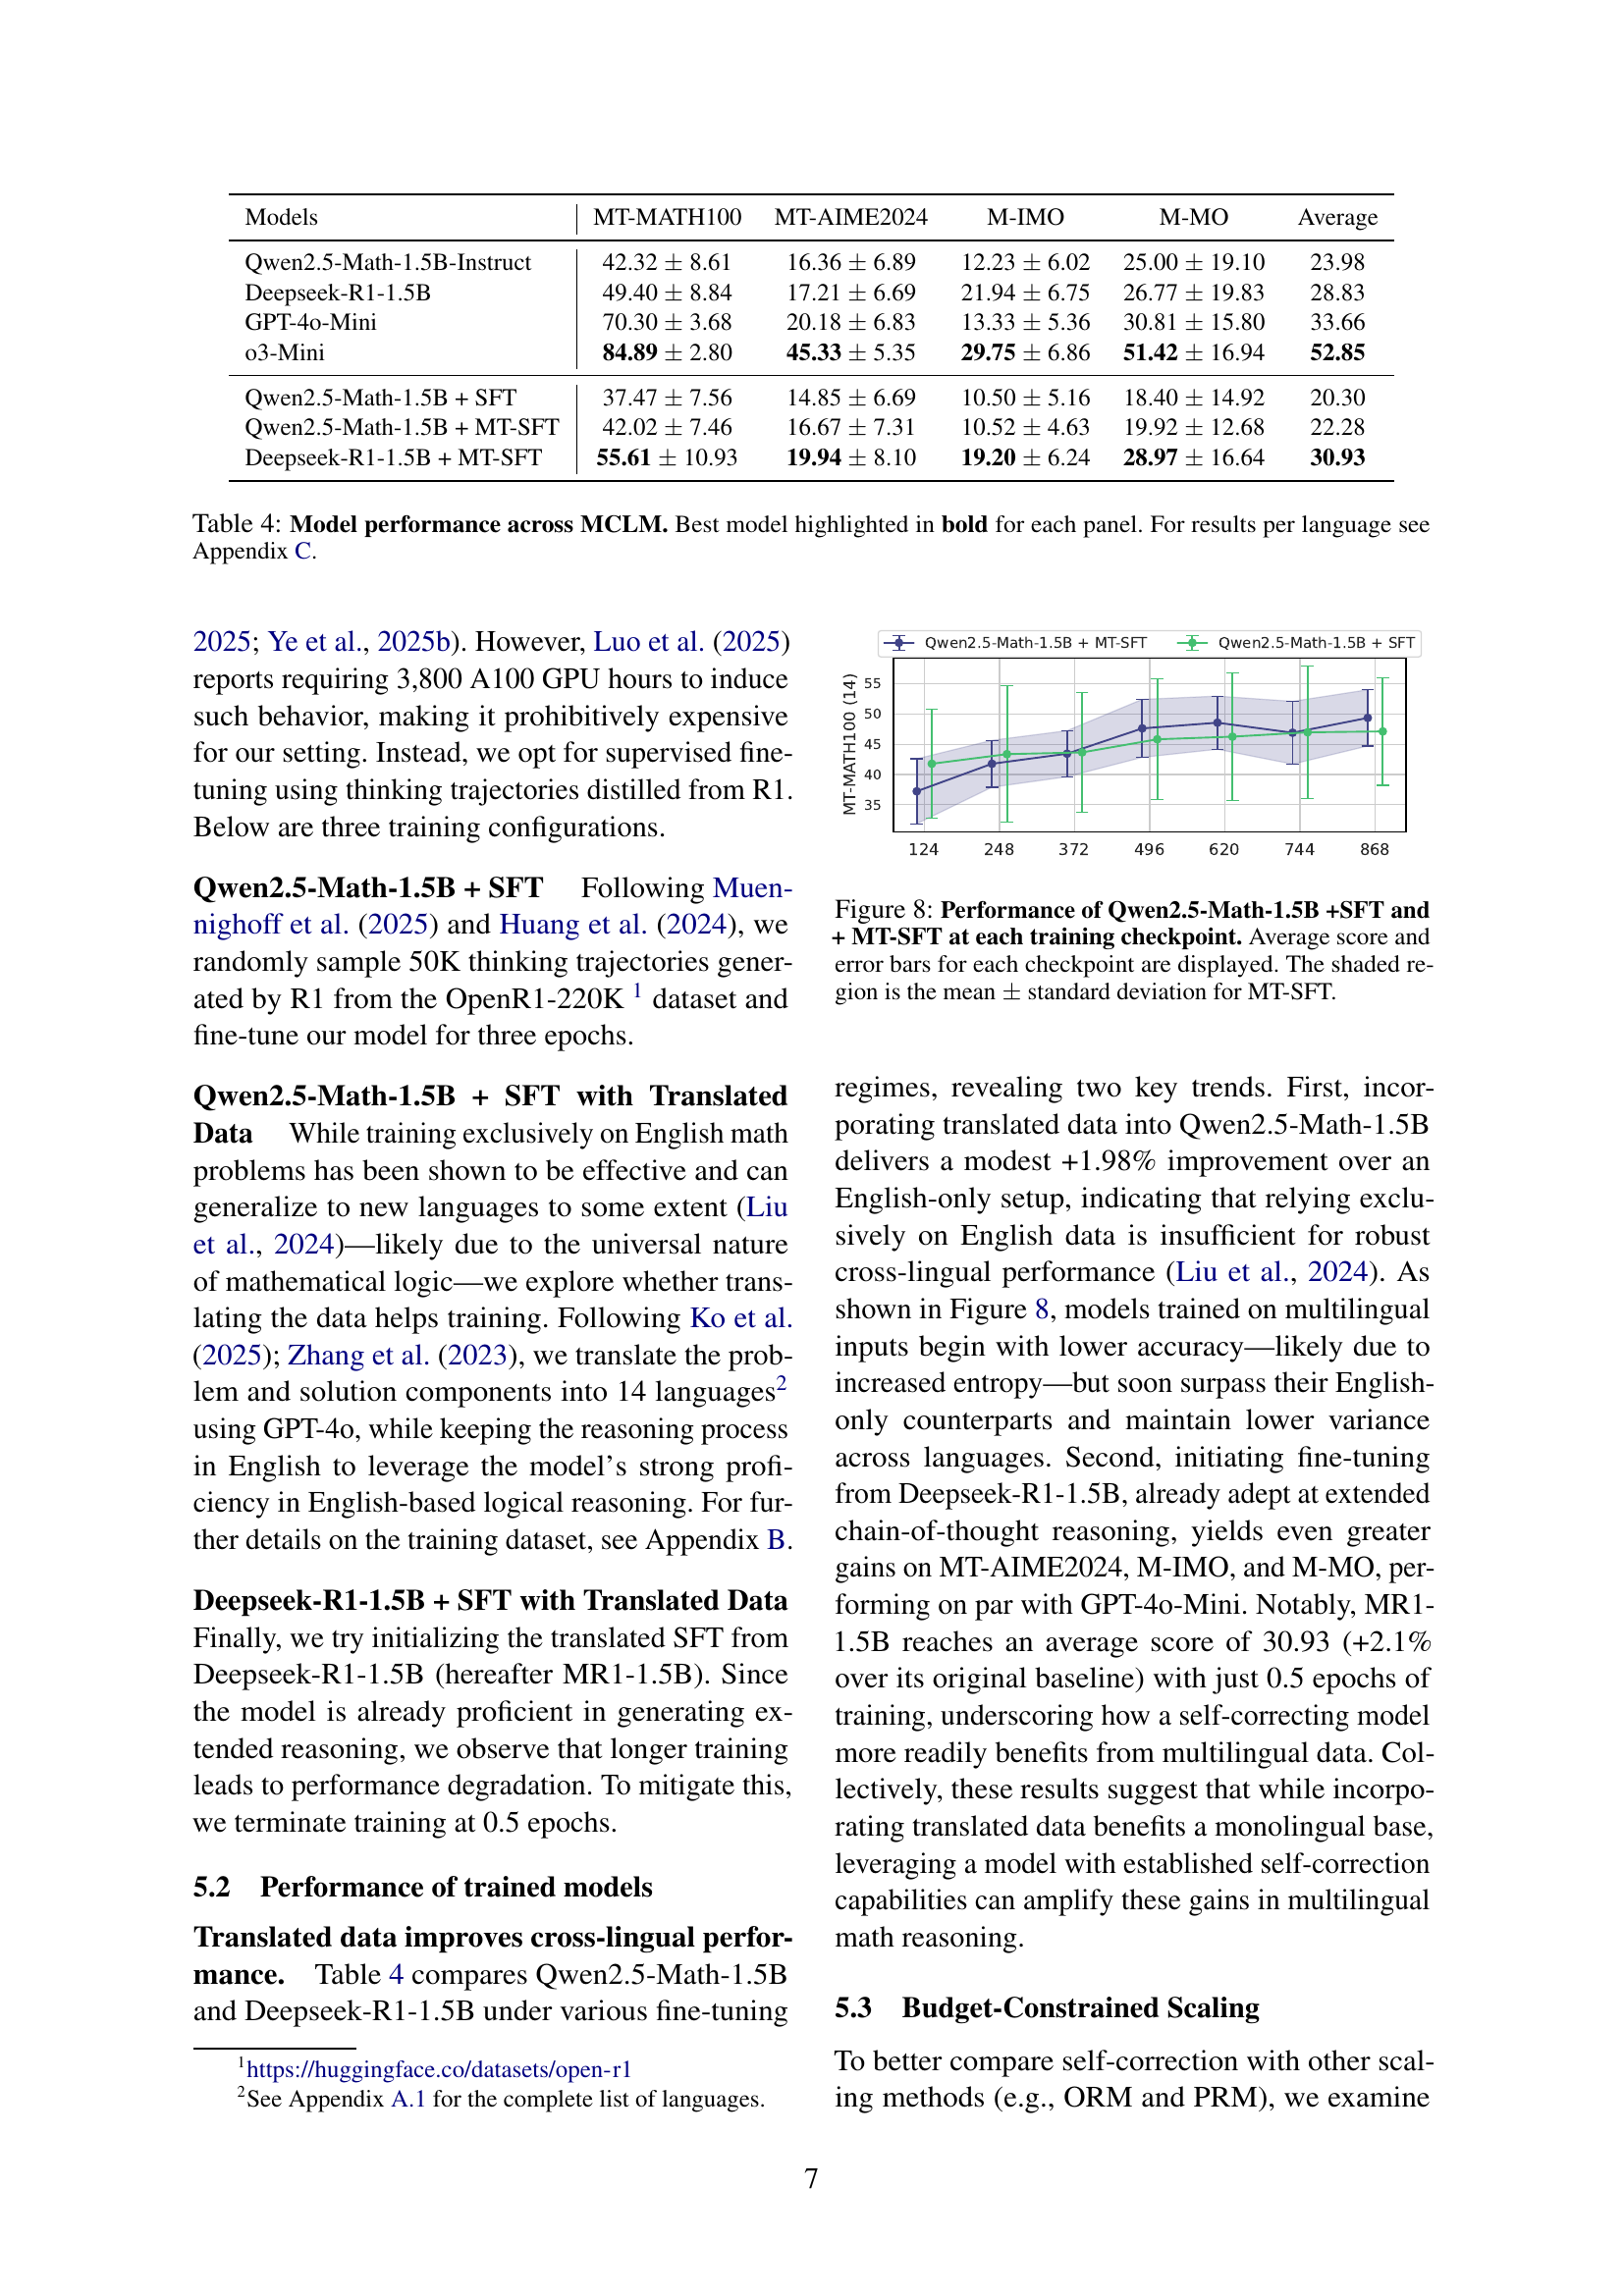
🔼 Figure 7 is a graph comparing the performance of Process Reward Modeling (PRM) and Outcome Reward Modeling (ORM) on two mathematical reasoning benchmarks: MATH and AIME. The x-axis represents the inference FLOPS (floating point operations) used, reflecting computational cost. The y-axis shows the accuracy, or percentage of correctly solved problems. Separate lines are plotted for both the 1.5B parameter model (plus markers) and the 7B parameter model (stars). Blue lines indicate PRM, while green lines represent ORM. The white boxes highlight the difference in accuracy between ORM and PRM at the highest FLOPS setting for each model/benchmark combination, illustrating how much better ORM performs than PRM at higher computational costs.
read the caption
Figure 7: Comparison of PRM vs. ORM performance on MATH (solid lines) and AIME (dashed lines). 1.5B models are shown with plus markers, 7B models with stars. Blue lines represent PRM, green lines represent ORM. White box annotations indicate the performance difference (ORM − PRM) at the highest compute setting for each line.

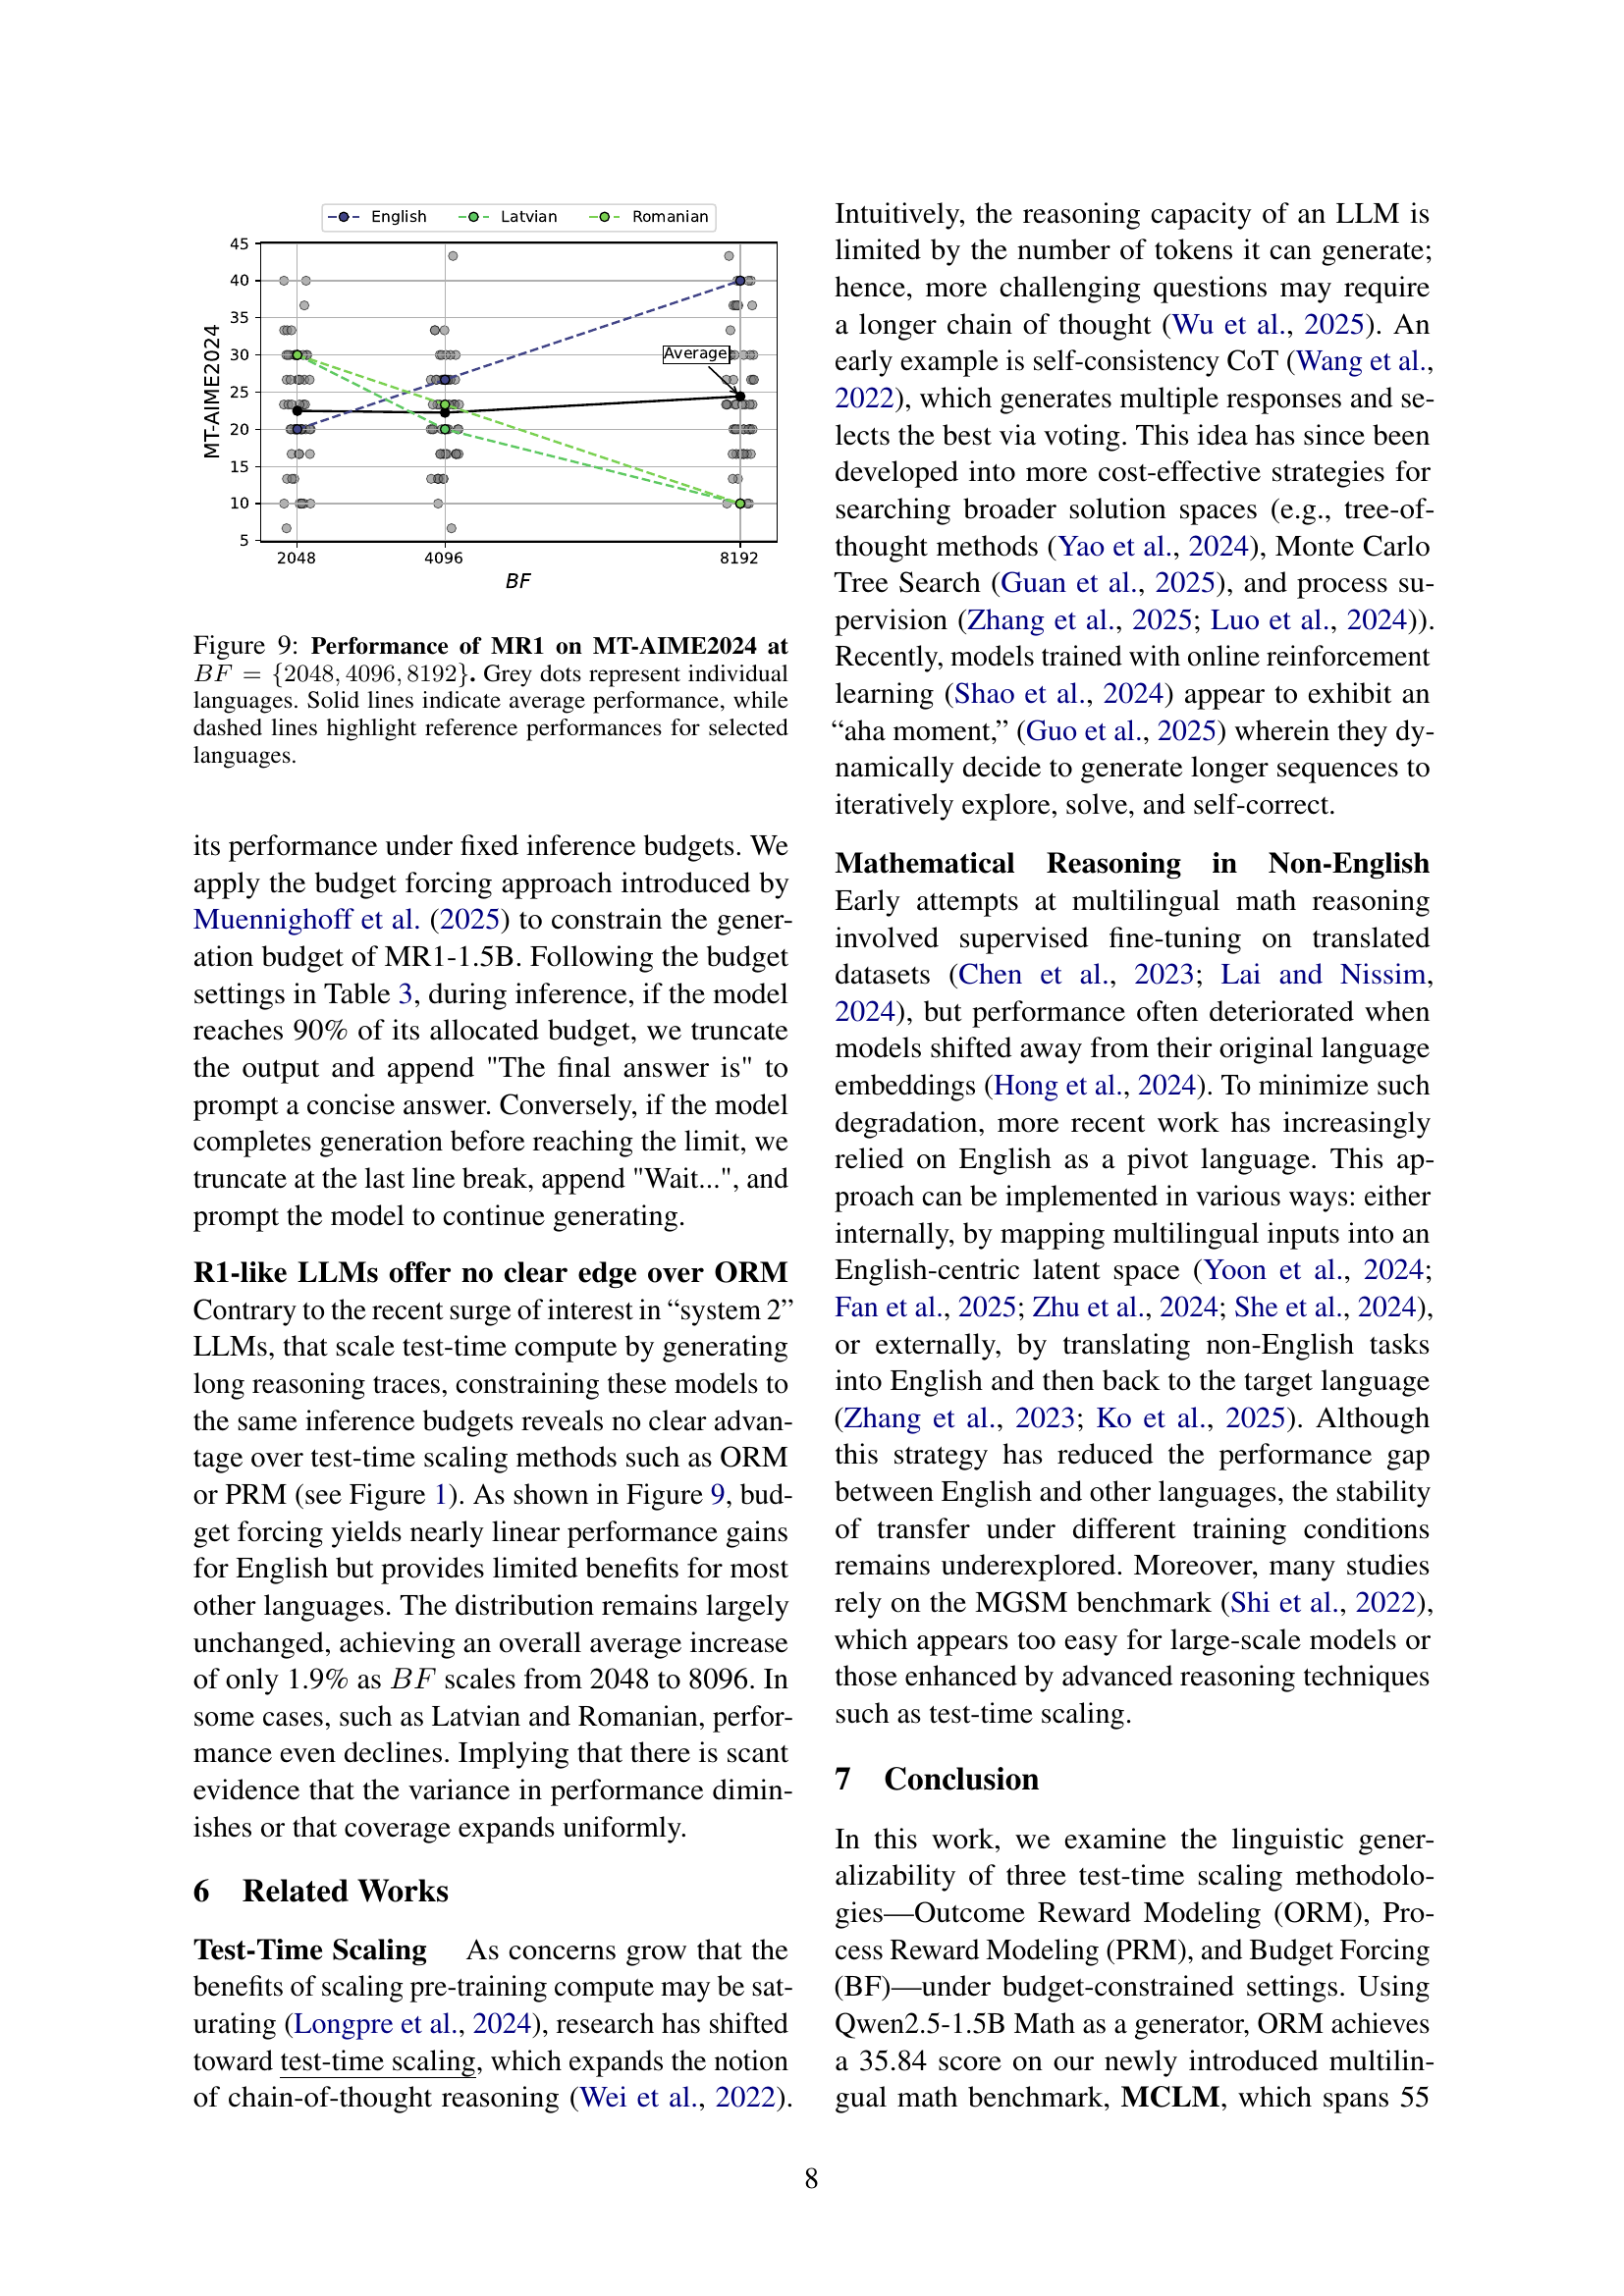
🔼 This figure shows the performance of two fine-tuned models, Qwen2.5-Math-1.5B + SFT and Qwen2.5-Math-1.5B + MT-SFT, across multiple training checkpoints. The y-axis represents the average accuracy achieved by the models, and the x-axis shows the number of training checkpoints. Error bars are included to display the variability or uncertainty in the model’s performance. The shaded region visually represents the mean plus or minus one standard deviation of the MT-SFT model’s performance, illustrating the range of its performance across different checkpoints.
read the caption
Figure 8: Performance of Qwen2.5-Math-1.5B +SFT and + MT-SFT at each training checkpoint. Average score and error bars for each checkpoint are displayed. The shaded region is the mean ±plus-or-minus\pm± standard deviation for MT-SFT.

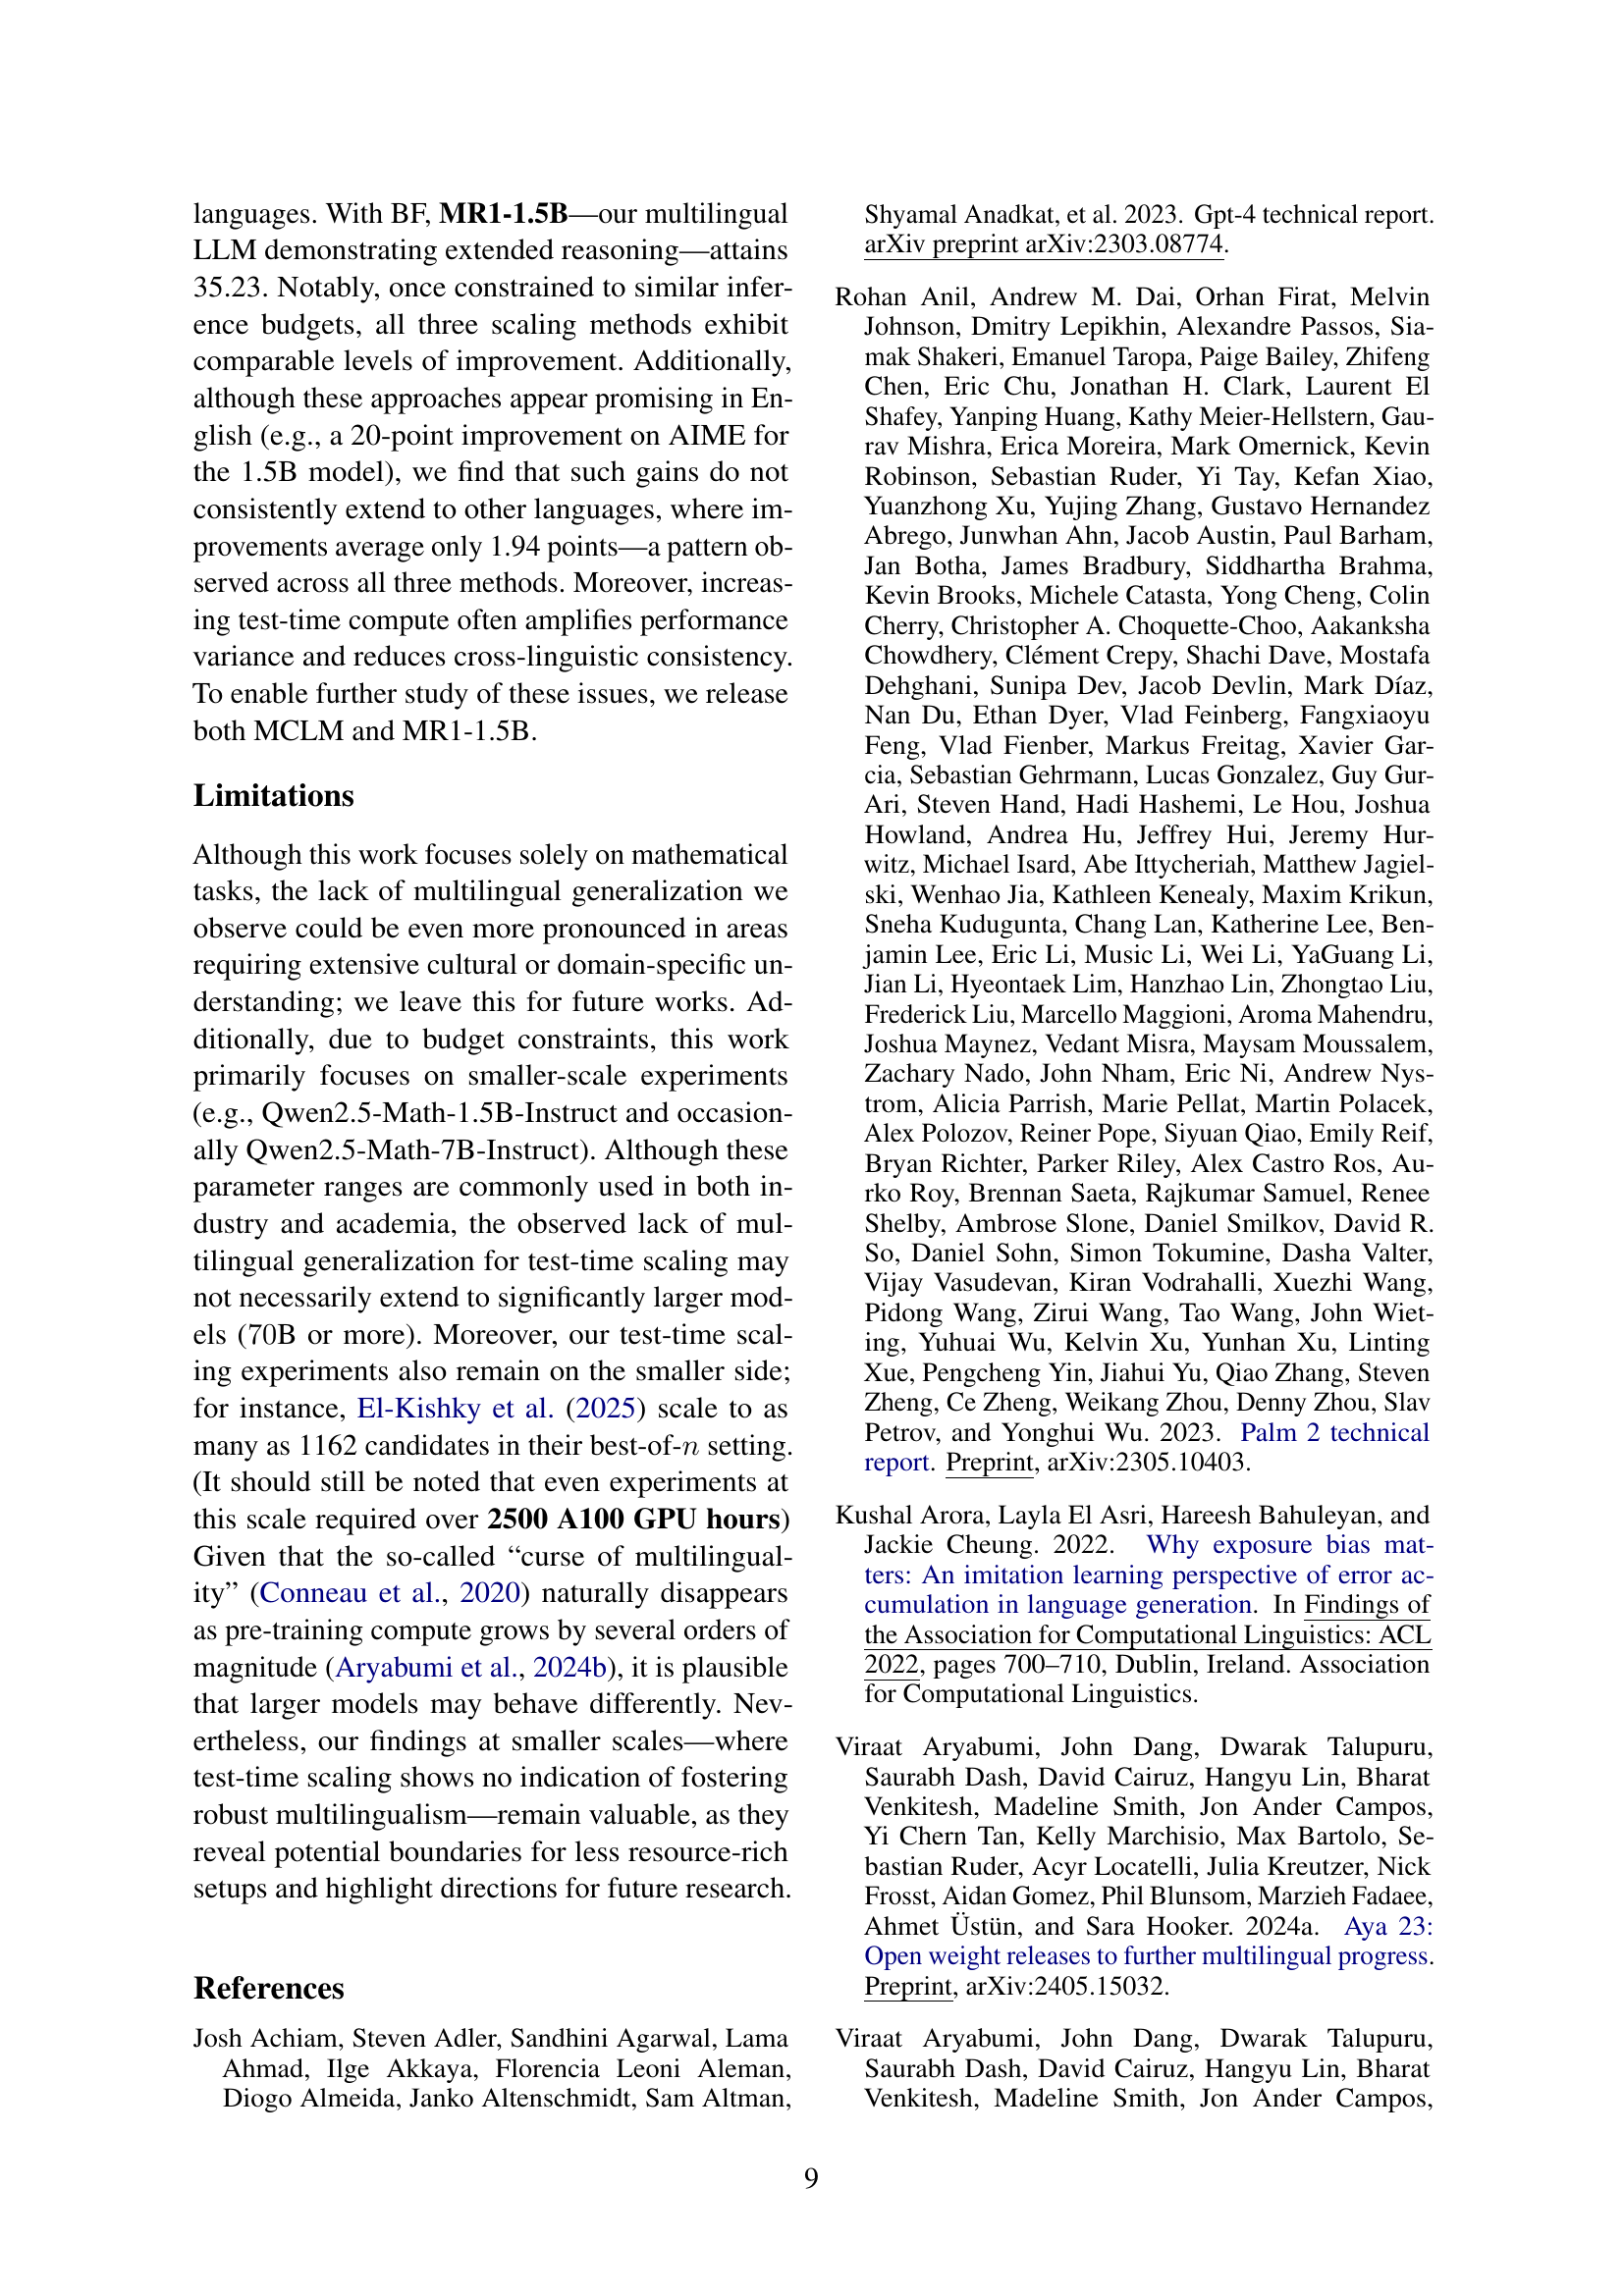
🔼 This figure shows the performance of the multilingual large language model (MR1) on the MT-AIME2024 dataset using the budget-forcing method with varying budget levels (BF = 2048, 4096, and 8192). Each point represents the performance of MR1 in a specific language, illustrating the impact of the budget on model performance across various languages. The solid lines display the average performance for each budget level, while the dashed lines highlight the performance for selected languages, serving as a reference point for comparing performance across languages and budget levels.
read the caption
Figure 9: Performance of MR1 on MT-AIME2024 at BF={2048,4096,8192}𝐵𝐹204840968192BF=\{2048,4096,8192\}italic_B italic_F = { 2048 , 4096 , 8192 }. Grey dots represent individual languages. Solid lines indicate average performance, while dashed lines highlight reference performances for selected languages.

🔼 This heatmap visualizes the selection of IMO (International Mathematical Olympiad) problems for the M-IMO subset of the MCLM benchmark. Each row represents a year from 2006 to 2024, and each column corresponds to one of the six problems (Q1-Q6) presented in each year’s competition. Green cells indicate that a problem from that year was included in the M-IMO dataset, while gray cells show problems that were excluded. This provides a clear overview of which problems across the competition years were selected for this specific subset.
read the caption
Figure 10: Heatmap representation of IMO problems from 2006 to 2024. Each row corresponds to a competition year, and each column represents a problem (Q1–Q6). Green cells indicate questions that have been included in the M-IMO subset, while gray cells represent problems that were not selected.

🔼 This figure shows the success rate of different large language models (LLMs) in solving math problems from various multilingual datasets. The x-axis represents the different LLMs used, including OLMo2 models (using base versions without instruction tuning) and Qwen2.5 models (using instruction-tuned versions). The y-axis displays the percentage of problems successfully solved by each model. The Euler-Instruct dataset stands out, demonstrating a noticeably lower success rate than others, thus highlighting its increased difficulty compared to the other datasets.
read the caption
Figure 11: Solve rates (%) of different multilingual math datasets evaluated. For the OLMo2 series, we use the base models, while for the Qwen2.5 series, the instruct-tuned variants are used. Euler-Instruct presents a significantly lower solve rate, indicating its greater difficulty.

🔼 This figure presents the results of an ablation study on the training data for multilingual mathematical reasoning. The left panel displays the accuracy of different models on MT-MATH500, using various sizes of training datasets in different languages. The right panel shows the average performance on MT-AIME2024 using the same training data configurations. The plots illustrate how the size and composition of the training data influence model performance on these two distinct mathematical reasoning benchmarks. The results reveal that more data, and the inclusion of more languages leads to better performance, especially on MT-MATH100.
read the caption
Figure 12: Model Results from Table 9. Left shows accuracy on MT-MATH500 (entire translated subset for language group (B)), and right shows average performance of MT-AIME2024.
More on tables
| Subset | Source Benchmark | Languages | Sample Size per Language | Evaluation Method |
| MT-MATH100 | Math-500 | 55 | 100 | Rule-based verifier |
| MT-AIME2024 | AIME 2024 | 55 | 30 | Rule-based verifier |
| M-IMO | IMO (2006, 2024) | 38 | 22–27 | LLM-as-a-Judge |
| M-MO | Domestic/Regional Olympiads | 11 | 28–31 | LLM-as-a-Judge |
🔼 This table details the composition of the Multilingual Competition Level Math (MCLM) benchmark dataset. It breaks down the dataset into four subsets, specifying for each subset the original source benchmark (e.g., AIME, Math-500, IMO), the number of languages represented, the number of samples per language, and the method used for evaluating the model’s performance on those samples. The table provides a high-level overview of the MCLM dataset’s structure, highlighting the diversity of languages and question types included.
read the caption
Table 2: Overview of benchmark subsets: source benchmarks, language coverage (full lists in the appendix), sample sizes, and evaluation methods. Please see Appendix A.1 for the full list of languages.
| 2 | (3, 3) | tokens |
| 4 | (4, 5) | tokens |
| 8 | (5, 8) | tokens |
🔼 This table presents the configurations used for Process Reward Modeling (PRM) and Budget Forcing (BF), two test-time scaling methods. The goal was to ensure that the computational cost (measured in FLOPs) for PRM and BF matched the cost of Outcome Reward Modeling (ORM), which served as a baseline. The table shows different combinations of parameters for PRM (number of generation steps S, number of candidate continuations c) and BF (token budget BF) such that their FLOPs are approximately equal to those of ORM for various response counts (k).
read the caption
Table 3: Selected configurations for PRM and BF. Each S𝑆Sitalic_S, c𝑐citalic_c, and BF𝐵𝐹BFitalic_B italic_F is set so that the inference FLOPs match ORM.
| Models | MT-MATH100 | MT-AIME2024 | M-IMO | M-MO | Average |
| Qwen2.5-Math-1.5B-Instruct | 42.32 8.61 | 16.36 6.89 | 12.23 6.02 | 25.00 19.10 | 23.98 |
| Deepseek-R1-1.5B | 49.40 8.84 | 17.21 6.69 | 21.94 6.75 | 26.77 19.83 | 28.83 |
| GPT-4o-Mini | 70.30 3.68 | 20.18 6.83 | 13.33 5.36 | 30.81 15.80 | 33.66 |
| o3-Mini | 84.89 2.80 | 45.33 5.35 | 29.75 6.86 | 51.42 16.94 | 52.85 |
| Qwen2.5-Math-1.5B + SFT | 37.47 7.56 | 14.85 6.69 | 10.50 5.16 | 18.40 14.92 | 20.30 |
| Qwen2.5-Math-1.5B + MT-SFT | 42.02 7.46 | 16.67 7.31 | 10.52 4.63 | 19.92 12.68 | 22.28 |
| Deepseek-R1-1.5B + MT-SFT | 55.61 10.93 | 19.94 8.10 | 19.20 6.24 | 28.97 16.64 | 30.93 |
🔼 This table presents the performance of various large language models (LLMs) on the Multilingual Competition Level Math (MCLM) benchmark. The MCLM benchmark is a challenging multilingual math reasoning dataset. The table shows the accuracy of each LLM on four different subsets of MCLM, representing varying levels of difficulty and language coverage. The best-performing model for each subset is highlighted in bold. For a more detailed breakdown of individual LLM performance per language, refer to Appendix C.
read the caption
Table 4: Model performance across MCLM. Best model highlighted in bold for each panel. For results per language see Appendix C.
| Lang. Group | Languages (ISO Codes, Sorted Alphabetically) | # Lang. |
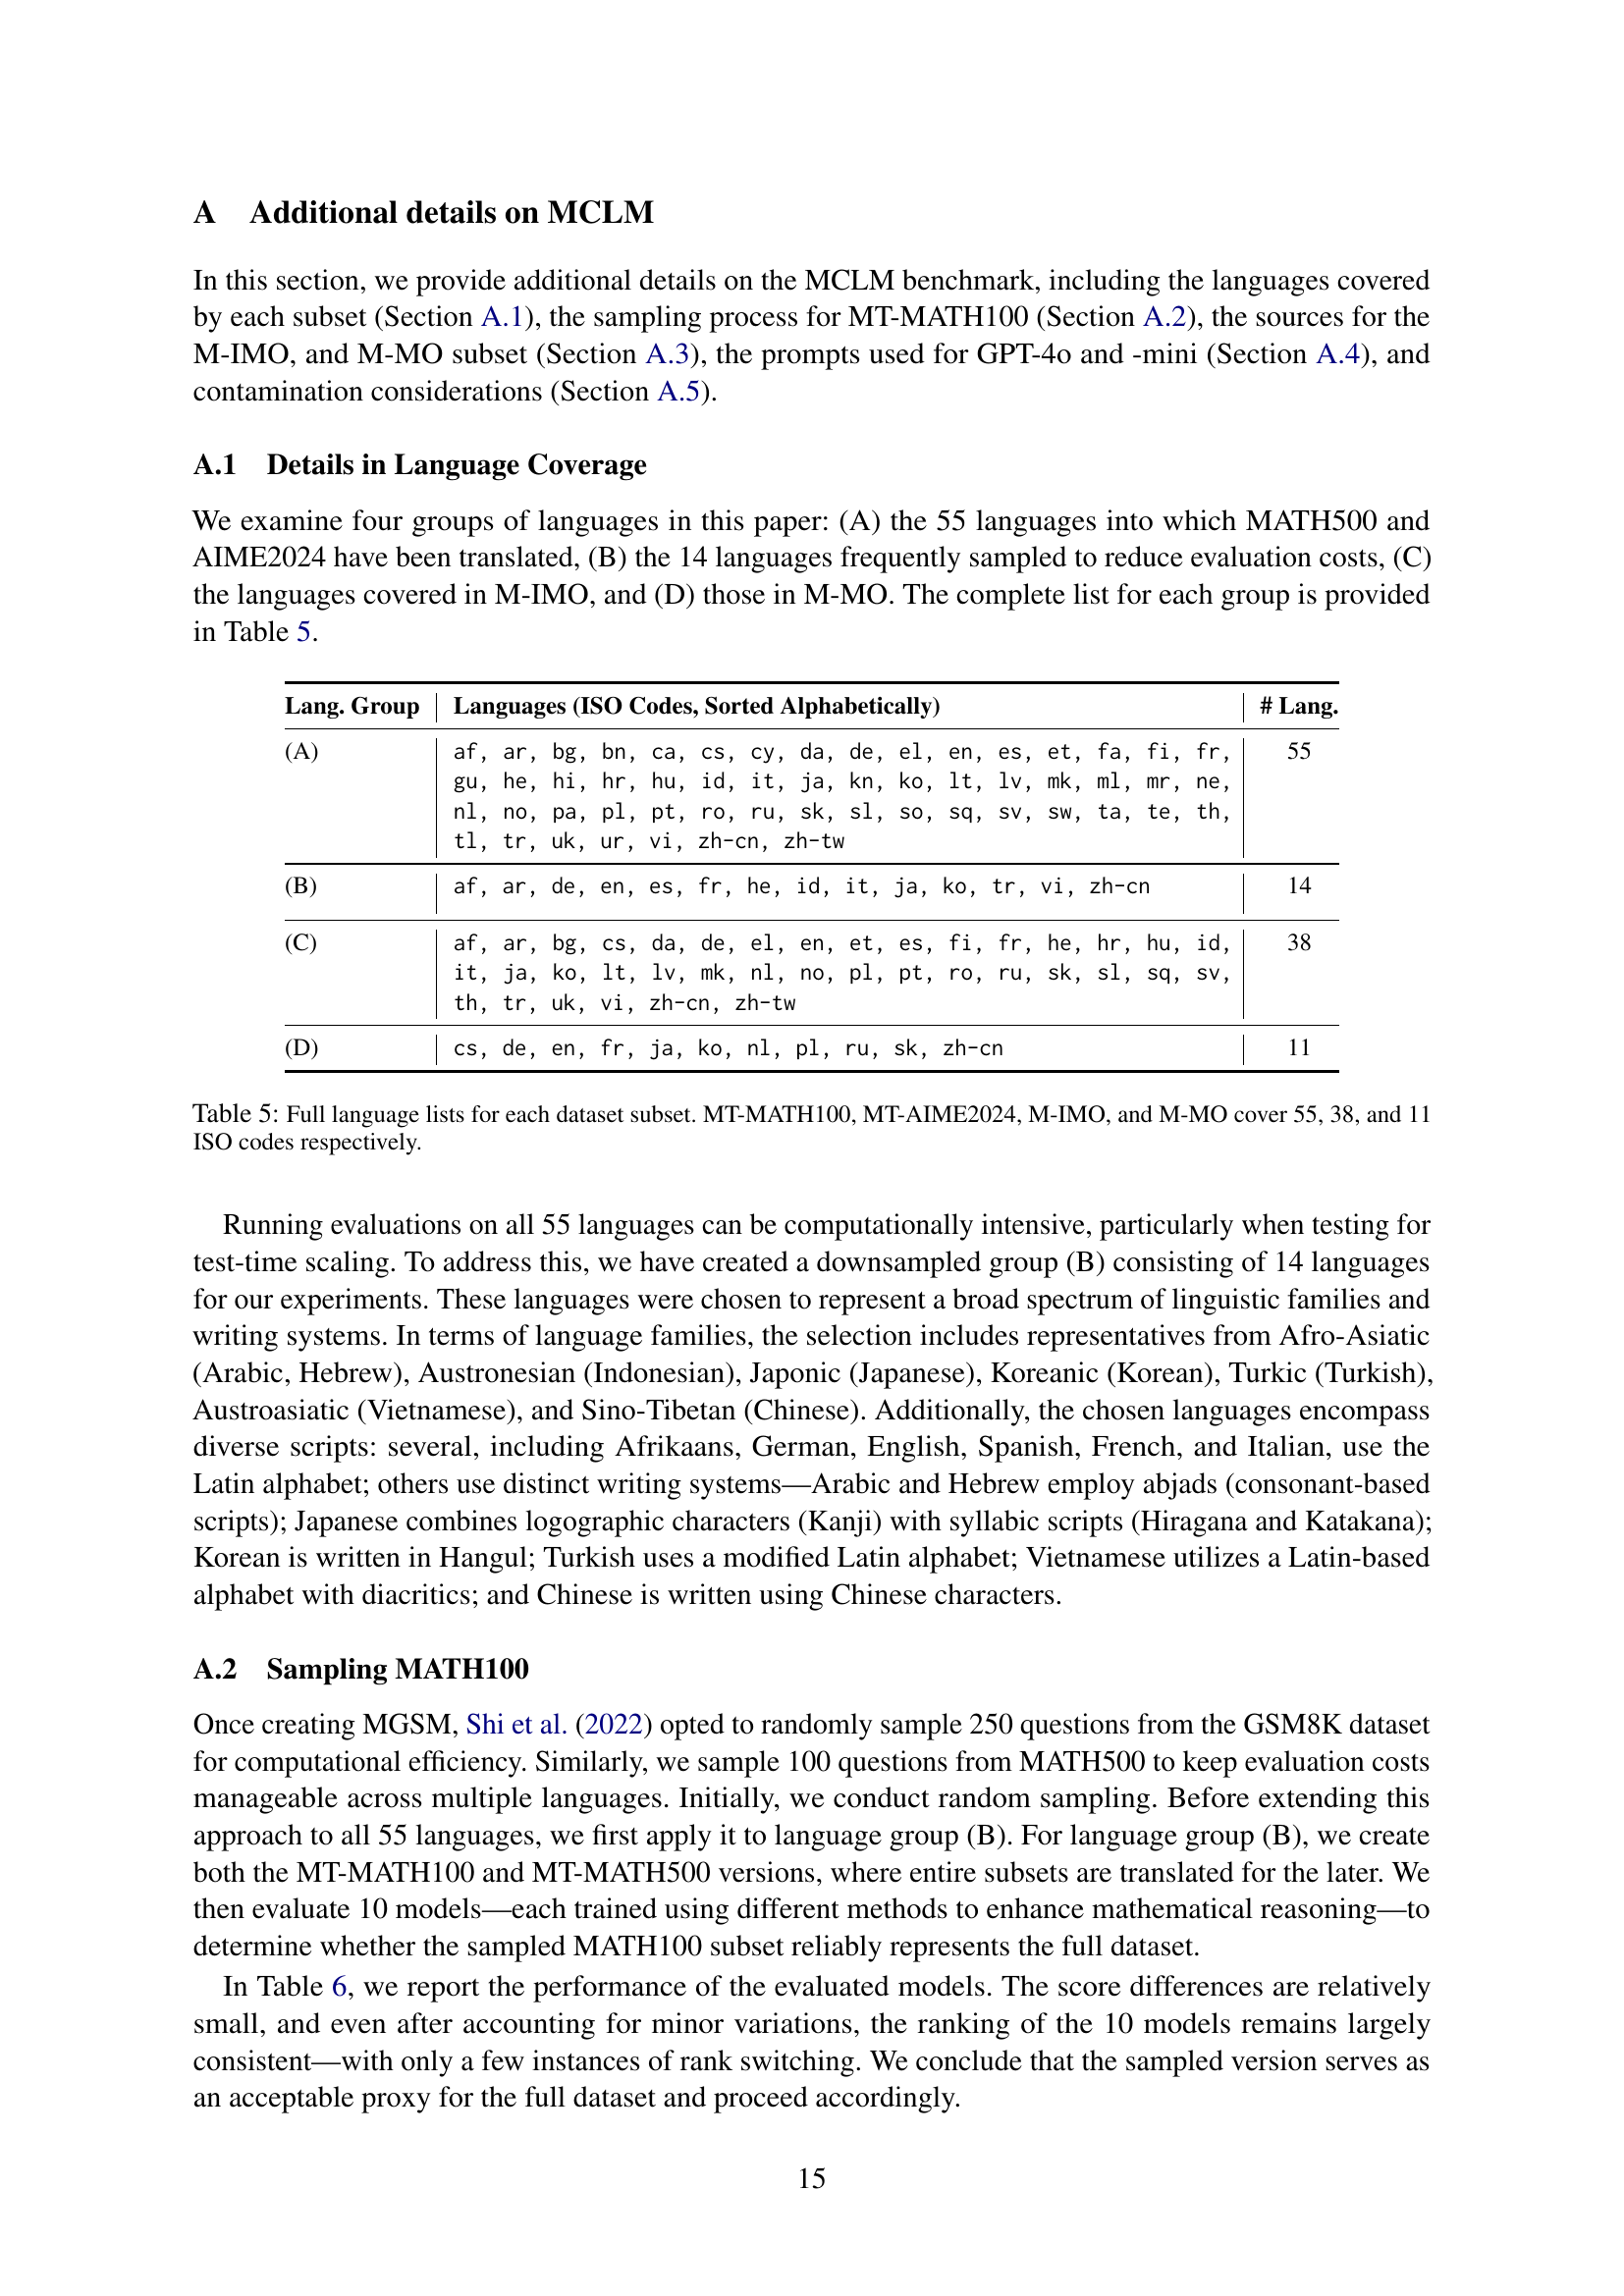
| (A) | af, ar, bg, bn, ca, cs, cy, da, de, el, en, es, et, fa, fi, fr, gu, he, hi, hr, hu, id, it, ja, kn, ko, lt, lv, mk, ml, mr, ne, nl, no, pa, pl, pt, ro, ru, sk, sl, so, sq, sv, sw, ta, te, th, tl, tr, uk, ur, vi, zh-cn, zh-tw | 55 |
| (B) | af, ar, de, en, es, fr, he, id, it, ja, ko, tr, vi, zh-cn | 14 |
| (C) | af, ar, bg, cs, da, de, el, en, et, es, fi, fr, he, hr, hu, id, it, ja, ko, lt, lv, mk, nl, no, pl, pt, ro, ru, sk, sl, sq, sv, th, tr, uk, vi, zh-cn, zh-tw | 38 |
| (D) | cs, de, en, fr, ja, ko, nl, pl, ru, sk, zh-cn | 11 |
🔼 This table lists the languages included in each subset of the MCLM benchmark. The MCLM benchmark is composed of four subsets: MT-MATH100, MT-AIME2024, M-IMO, and M-MO. Each subset uses a different selection of languages for its questions, and this table provides the full list of languages in each. The number of languages in each subset is also indicated.
read the caption
Table 5: Full language lists for each dataset subset. MT-MATH100, MT-AIME2024, M-IMO, and M-MO cover 55, 38, and 11 ISO codes respectively.
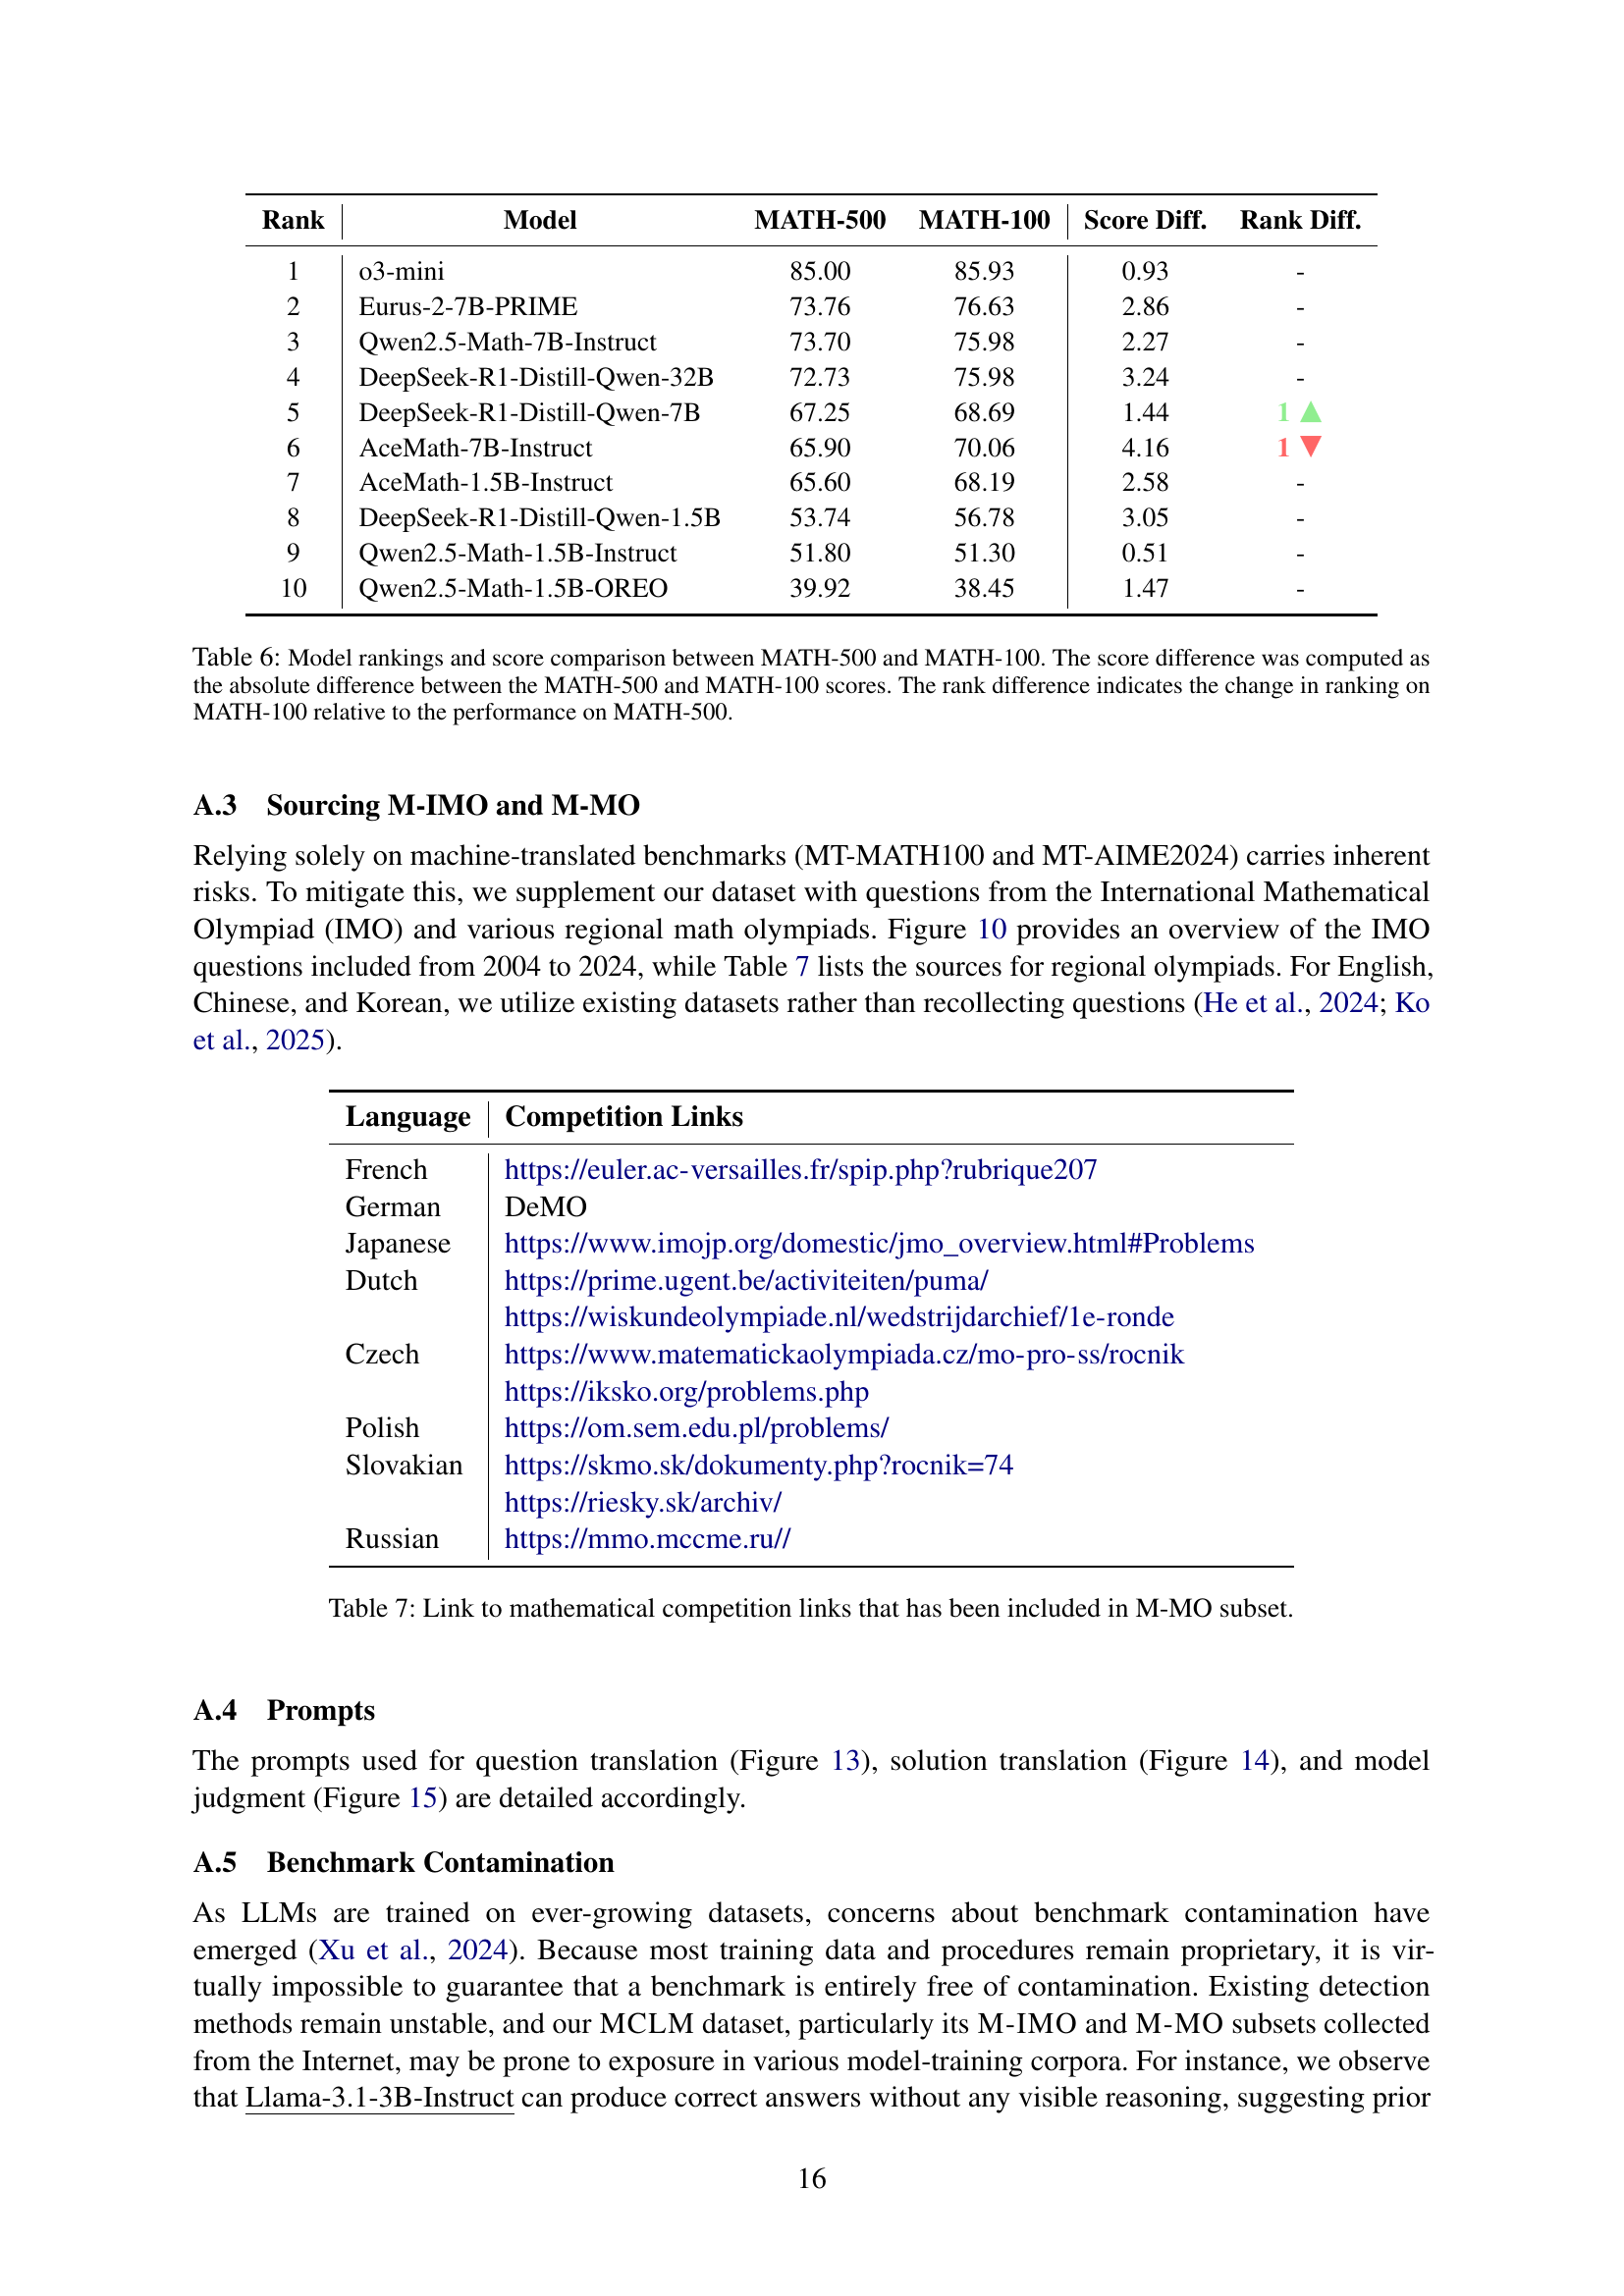
| Rank | Model | MATH-500 | MATH-100 | Score Diff. | Rank Diff. |
| 1 | o3-mini | 85.00 | 85.93 | 0.93 | - |
| 2 | Eurus-2-7B-PRIME | 73.76 | 76.63 | 2.86 | - |
| 3 | Qwen2.5-Math-7B-Instruct | 73.70 | 75.98 | 2.27 | - |
| 4 | DeepSeek-R1-Distill-Qwen-32B | 72.73 | 75.98 | 3.24 | - |
| 5 | DeepSeek-R1-Distill-Qwen-7B | 67.25 | 68.69 | 1.44 | 1 ▲ |
| 6 | AceMath-7B-Instruct | 65.90 | 70.06 | 4.16 | 1 ▼ |
| 7 | AceMath-1.5B-Instruct | 65.60 | 68.19 | 2.58 | - |
| 8 | DeepSeek-R1-Distill-Qwen-1.5B | 53.74 | 56.78 | 3.05 | - |
| 9 | Qwen2.5-Math-1.5B-Instruct | 51.80 | 51.30 | 0.51 | - |
| 10 | Qwen2.5-Math-1.5B-OREO | 39.92 | 38.45 | 1.47 | - |
🔼 This table compares the performance of ten different language models on two math problem datasets: MATH-500 and a subset of MATH-500 called MATH-100. It shows each model’s score on both datasets, the difference in scores between the two datasets for each model, and how the model’s rank changed from MATH-500 to MATH-100. This helps to assess the consistency of model performance across different dataset sizes and identifies models whose performance is particularly sensitive to dataset size changes.
read the caption
Table 6: Model rankings and score comparison between MATH-500 and MATH-100. The score difference was computed as the absolute difference between the MATH-500 and MATH-100 scores. The rank difference indicates the change in ranking on MATH-100 relative to the performance on MATH-500.
🔼 This table lists the websites of various regional and international mathematical olympiads whose problems have been included in the M-MO subset of the MCLM benchmark. It provides links to access the problems from each competition.
read the caption
Table 7: Link to mathematical competition links that has been included in M-MO subset.
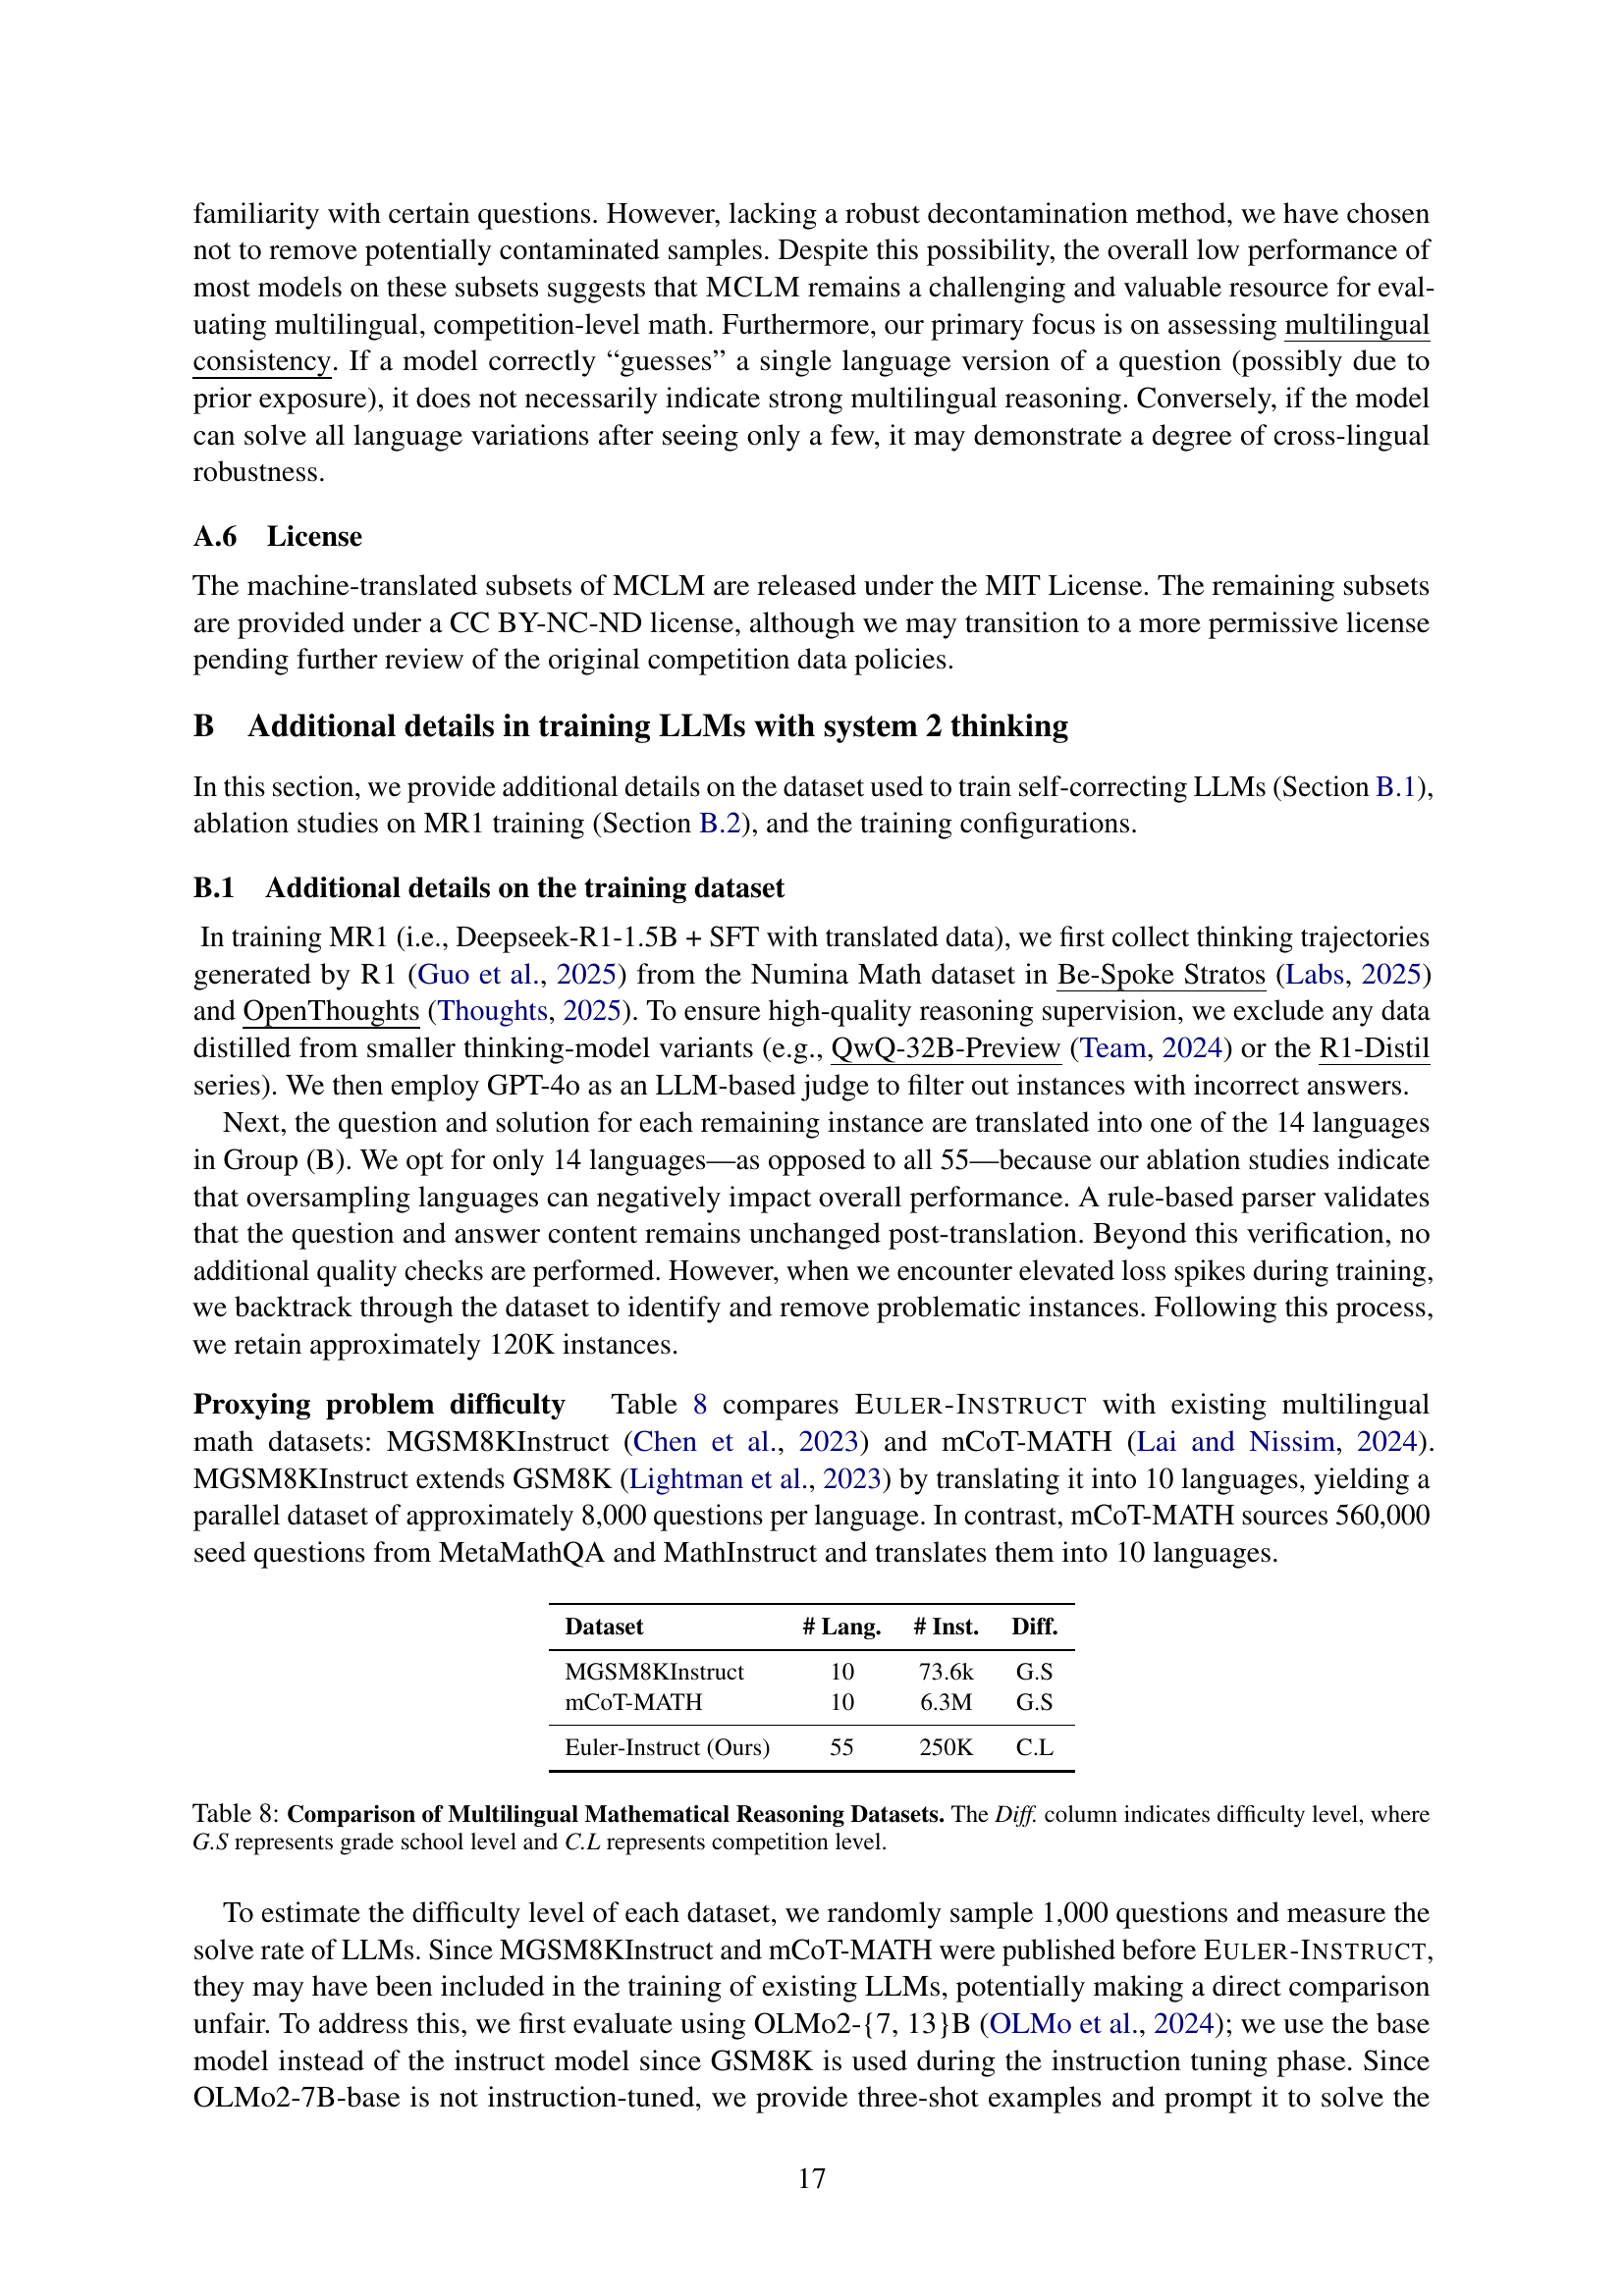
| Dataset | # Lang. | # Inst. | Diff. |
| MGSM8KInstruct | 10 | 73.6k | G.S |
| mCoT-MATH | 10 | 6.3M | G.S |
| Euler-Instruct (Ours) | 55 | 250K | C.L |
🔼 This table compares three multilingual mathematical reasoning datasets: MGSM8KInstruct, mCoT-MATH, and Euler-Instruct. For each dataset, it shows the number of languages included and the number of instances (questions). Crucially, it also indicates the difficulty level of each dataset, using ‘G.S.’ to denote grade school level and ‘C.L.’ to denote competition level. This helps to understand the relative difficulty of the datasets and their suitability for evaluating different models’ mathematical reasoning capabilities.
read the caption
Table 8: Comparison of Multilingual Mathematical Reasoning Datasets. The Diff. column indicates difficulty level, where G.S represents grade school level and C.L represents competition level.
| Languages | # Lang. | # Instances |
| ko | 1 | 24k |
| af, fr, ko | 3 | 8k |
| af, ar, fr, he, id, ko, tr | 7 | 3.5k |
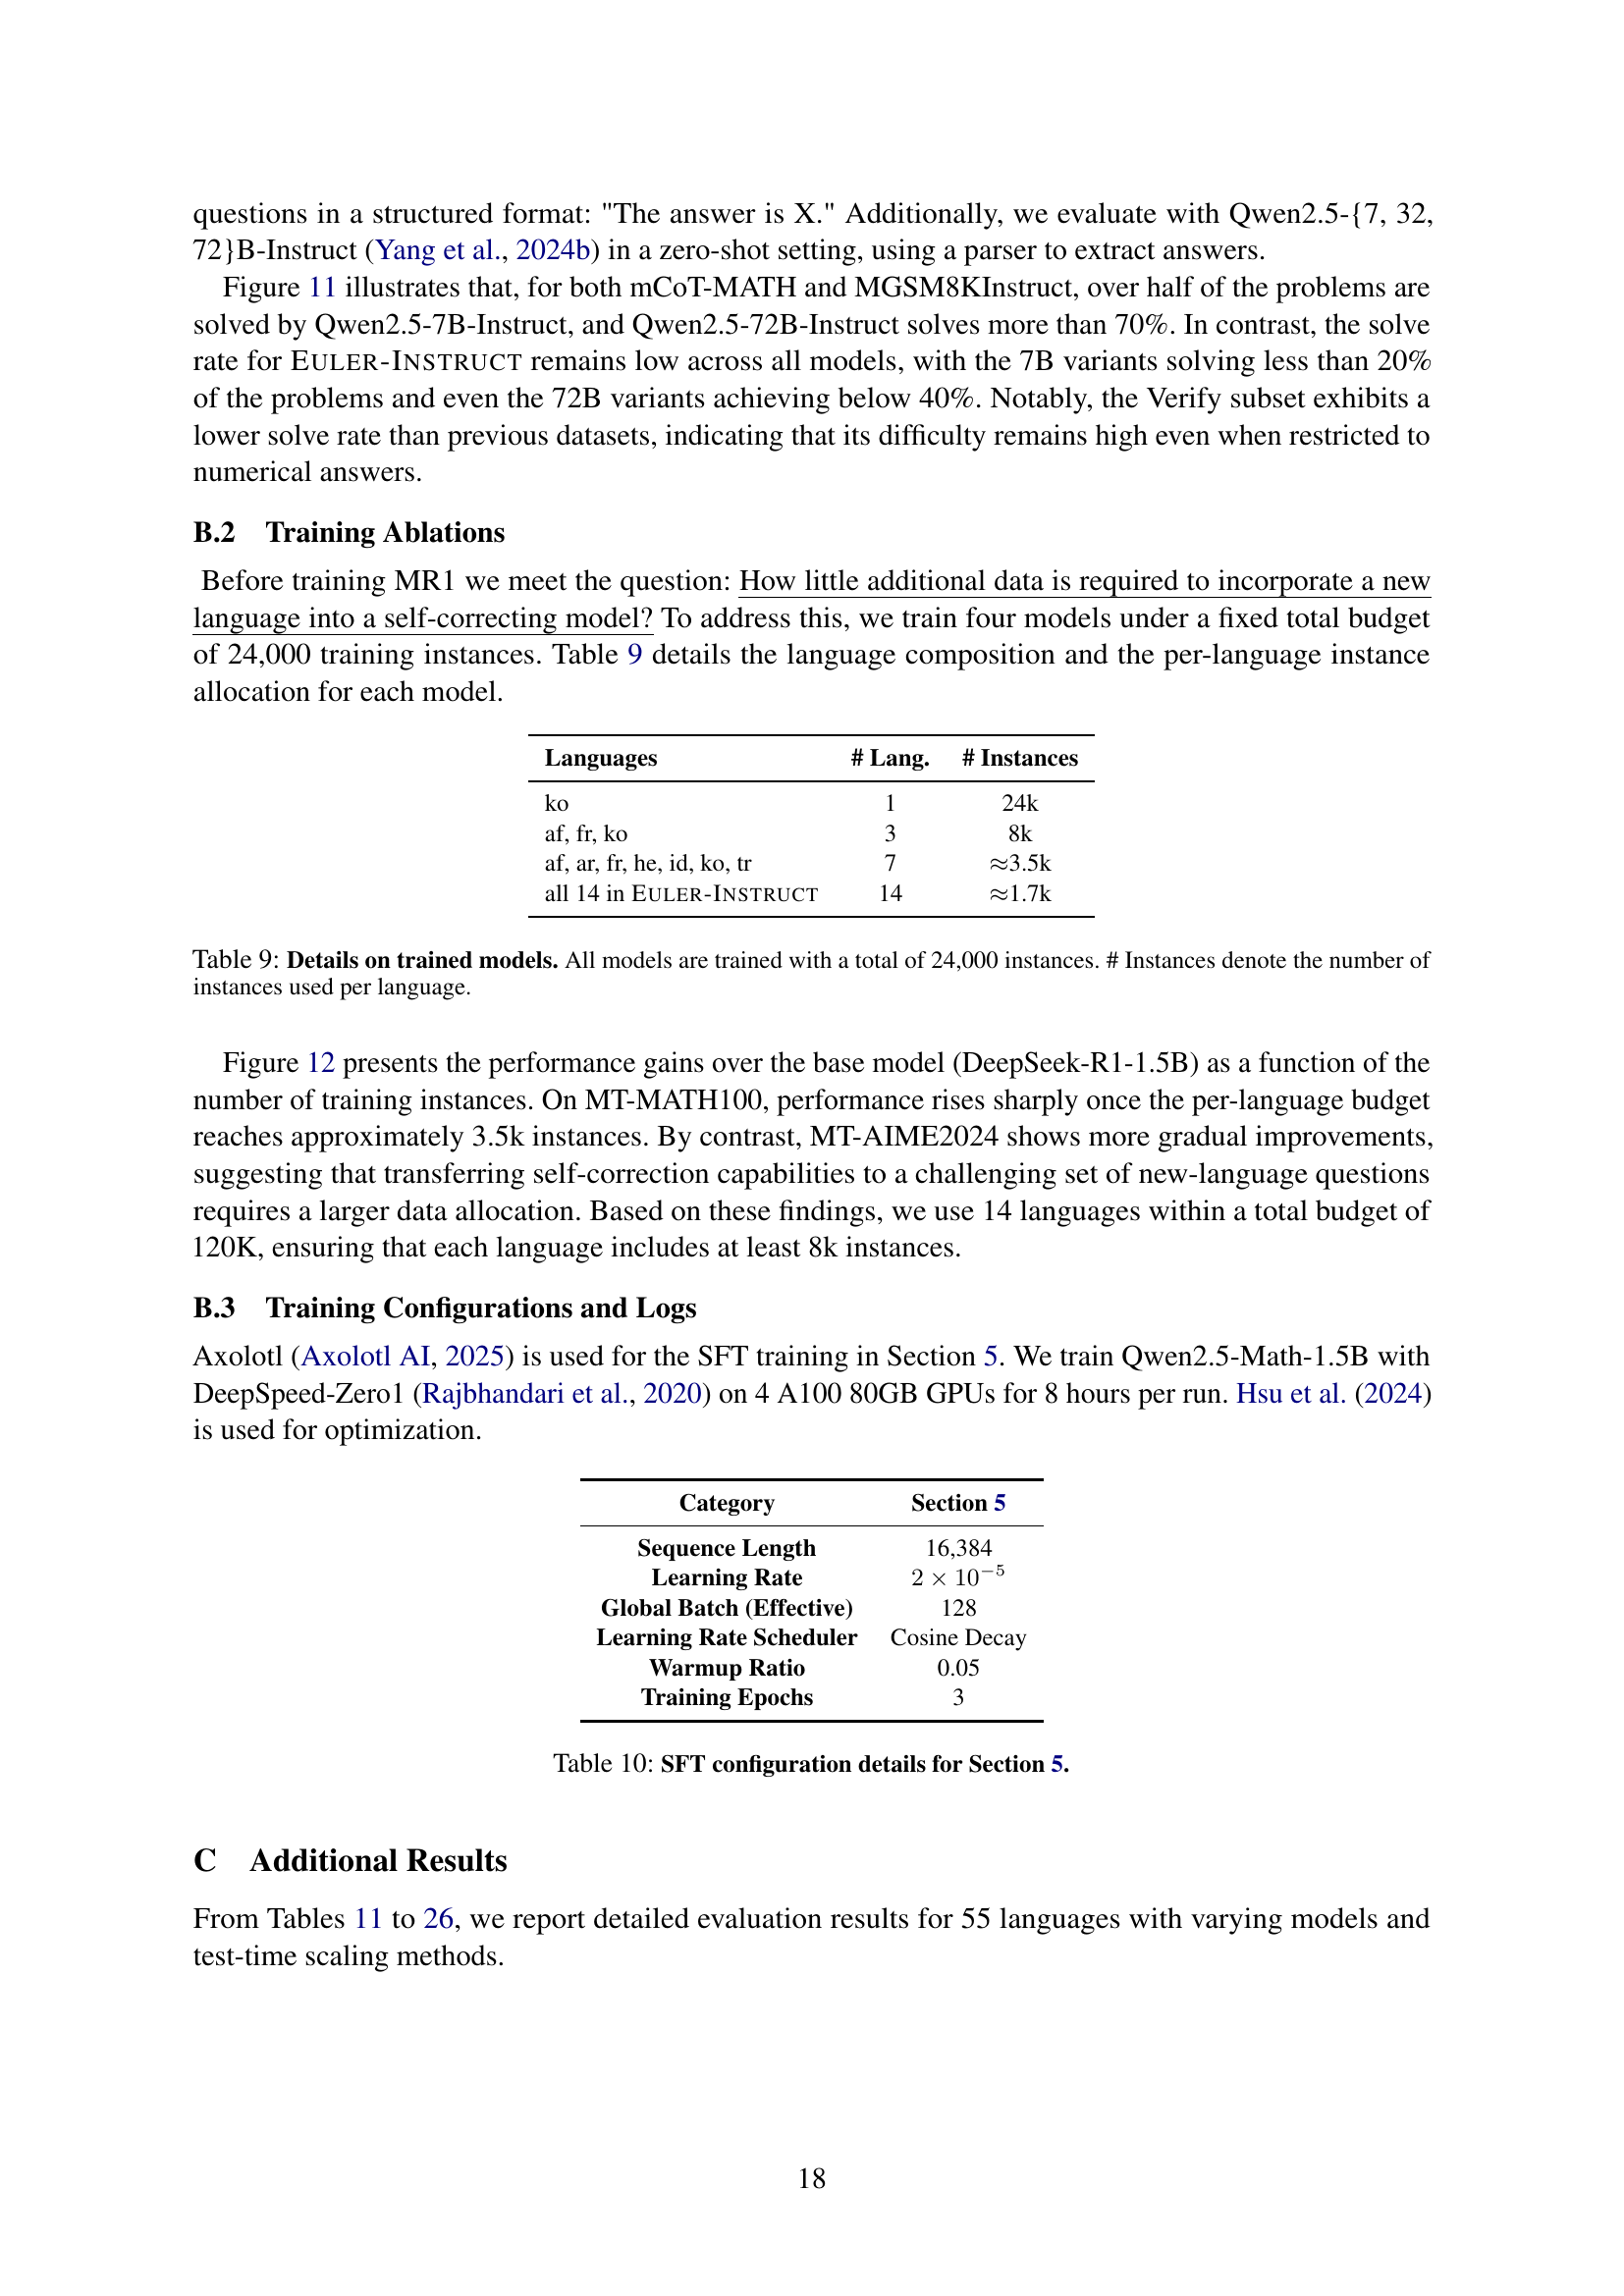
| all 14 in Euler-Instruct | 14 | 1.7k |
🔼 This table presents the details of four multilingual language models trained for improved mathematical reasoning capabilities. Each model was trained on a total of 24,000 instances, but the number of instances per language varied across the models. The table shows the languages included in the training data for each model and the number of instances used for each language in the training dataset.
read the caption
Table 9: Details on trained models. All models are trained with a total of 24,000 instances. # Instances denote the number of instances used per language.
| Category | Section 5 |
| Sequence Length | 16,384 |
| Learning Rate | |
| Global Batch (Effective) | 128 |
| Learning Rate Scheduler | Cosine Decay |
| Warmup Ratio | 0.05 |
| Training Epochs | 3 |
🔼 This table details the specific hyperparameters used for the supervised fine-tuning (SFT) process described in section 5 of the paper. It covers settings such as sequence length, learning rate, batch size, learning rate scheduler, warmup ratio, and the number of training epochs.
read the caption
Table 10: SFT configuration details for Section 5.
| Language | MT-MATH100 | MT-AIME2024 | M-IMO | M-MO |
| Afrikaans | 47.47 | 20.00 | 11.11 | |
| Albanian | 45.45 | 10.00 | 4.00 | |
| Arabic | 38.38 | 30.00 | 11.11 | |
| Bengali | 37.37 | 3.33 | ||
| Bulgarian | 39.39 | 13.33 | 7.41 | |
| Catalan | 50.51 | 23.33 | ||
| Chinese (Simplified) | 63.64 | 26.67 | 18.52 | 40.00 |
| Chinese (Traditional) | 61.62 | 20.00 | 18.52 | |
| Croatian | 49.49 | 20.00 | 7.41 | |
| Czech | 44.44 | 13.33 | 14.81 | 6.67 |
| Danish | 53.54 | 16.67 | 22.22 | |
| Dutch | 50.51 | 36.67 | 11.11 | 20.00 |
| Estonian | 39.39 | 10.00 | 4.00 | |
| Finnish | 41.41 | 16.67 | 8.00 | |
| French | 62.63 | 30.00 | 18.52 | 51.61 |
| German | 47.47 | 26.67 | 11.11 | 10.00 |
| Greek | 33.33 | 13.33 | 5.26 | |
| Gujarati | 39.39 | 10.00 | ||
| Hebrew | 38.38 | 13.33 | 3.70 | |
| Hindi | 35.35 | 6.67 | ||
| Hungarian | 51.52 | 10.00 | 8.00 | |
| Indonesian | 56.57 | 16.67 | 14.29 | |
| Italian | 51.52 | 20.00 | 20.00 | |
| Japanese | 56.57 | 16.67 | 8.00 | 0.00 |
| Kannada | 37.37 | 10.00 | ||
| Korean | 44.44 | 13.33 | 3.70 | 36.67 |
| Latvian | 40.40 | 10.00 | 12.00 | |
| Lithuanian | 45.45 | 6.67 | 18.52 | |
| Macedonian | 43.43 | 10.00 | 11.11 | |
| Malayalam | 43.43 | 23.33 | ||
| Marathi | 34.34 | 13.33 | ||
| Nepali | 36.36 | 6.67 | ||
| Norwegian | 53.54 | 23.33 | 11.11 | |
| Persian | 38.38 | 10.00 | ||
| Polish | 54.55 | 26.67 | 14.81 | 26.67 |
| Portuguese | 55.56 | 10.00 | 24.00 | |
| Punjabi | 37.37 | 16.67 | ||
| Romanian | 49.49 | 13.33 | 25.93 | |
| Russian | 59.60 | 20.00 | 16.00 | 20.00 |
| Slovak | 48.48 | 20.00 | 11.11 | 6.67 |
| Slovenian | 49.49 | 10.00 | 14.81 | |
| Somali | 42.42 | 23.33 | ||
| Spanish | 55.56 | 20.00 | 18.52 | |
| Swahili | 34.34 | 16.67 | ||
| Swedish | 58.59 | 20.00 | 8.00 | |
| Tagalog | 46.46 | 16.67 | ||
| Tamil | 38.38 | 10.00 | ||
| Telugu | 39.39 | 6.67 | ||
| Thai | 39.39 | 23.33 | 3.70 | |
| Turkish | 43.43 | 13.33 | 7.41 | |
| Ukrainian | 38.38 | 13.33 | 11.11 | |
| Urdu | 35.35 | 20.00 | ||
| Vietnamese | 44.44 | 13.33 | 7.41 | |
| Welsh | 39.39 | 16.67 | ||
| English | 67.68 | 20.00 | 18.52 | 56.67 |
| Average | 46.01 | 16.36 | 12.23 | 25.00 |
| Standard Deviation | 8.61 | 6.89 | 6.02 | 19.10 |
| Fleiss’ Kappa | 0.56 | 0.68 | 0.24 |
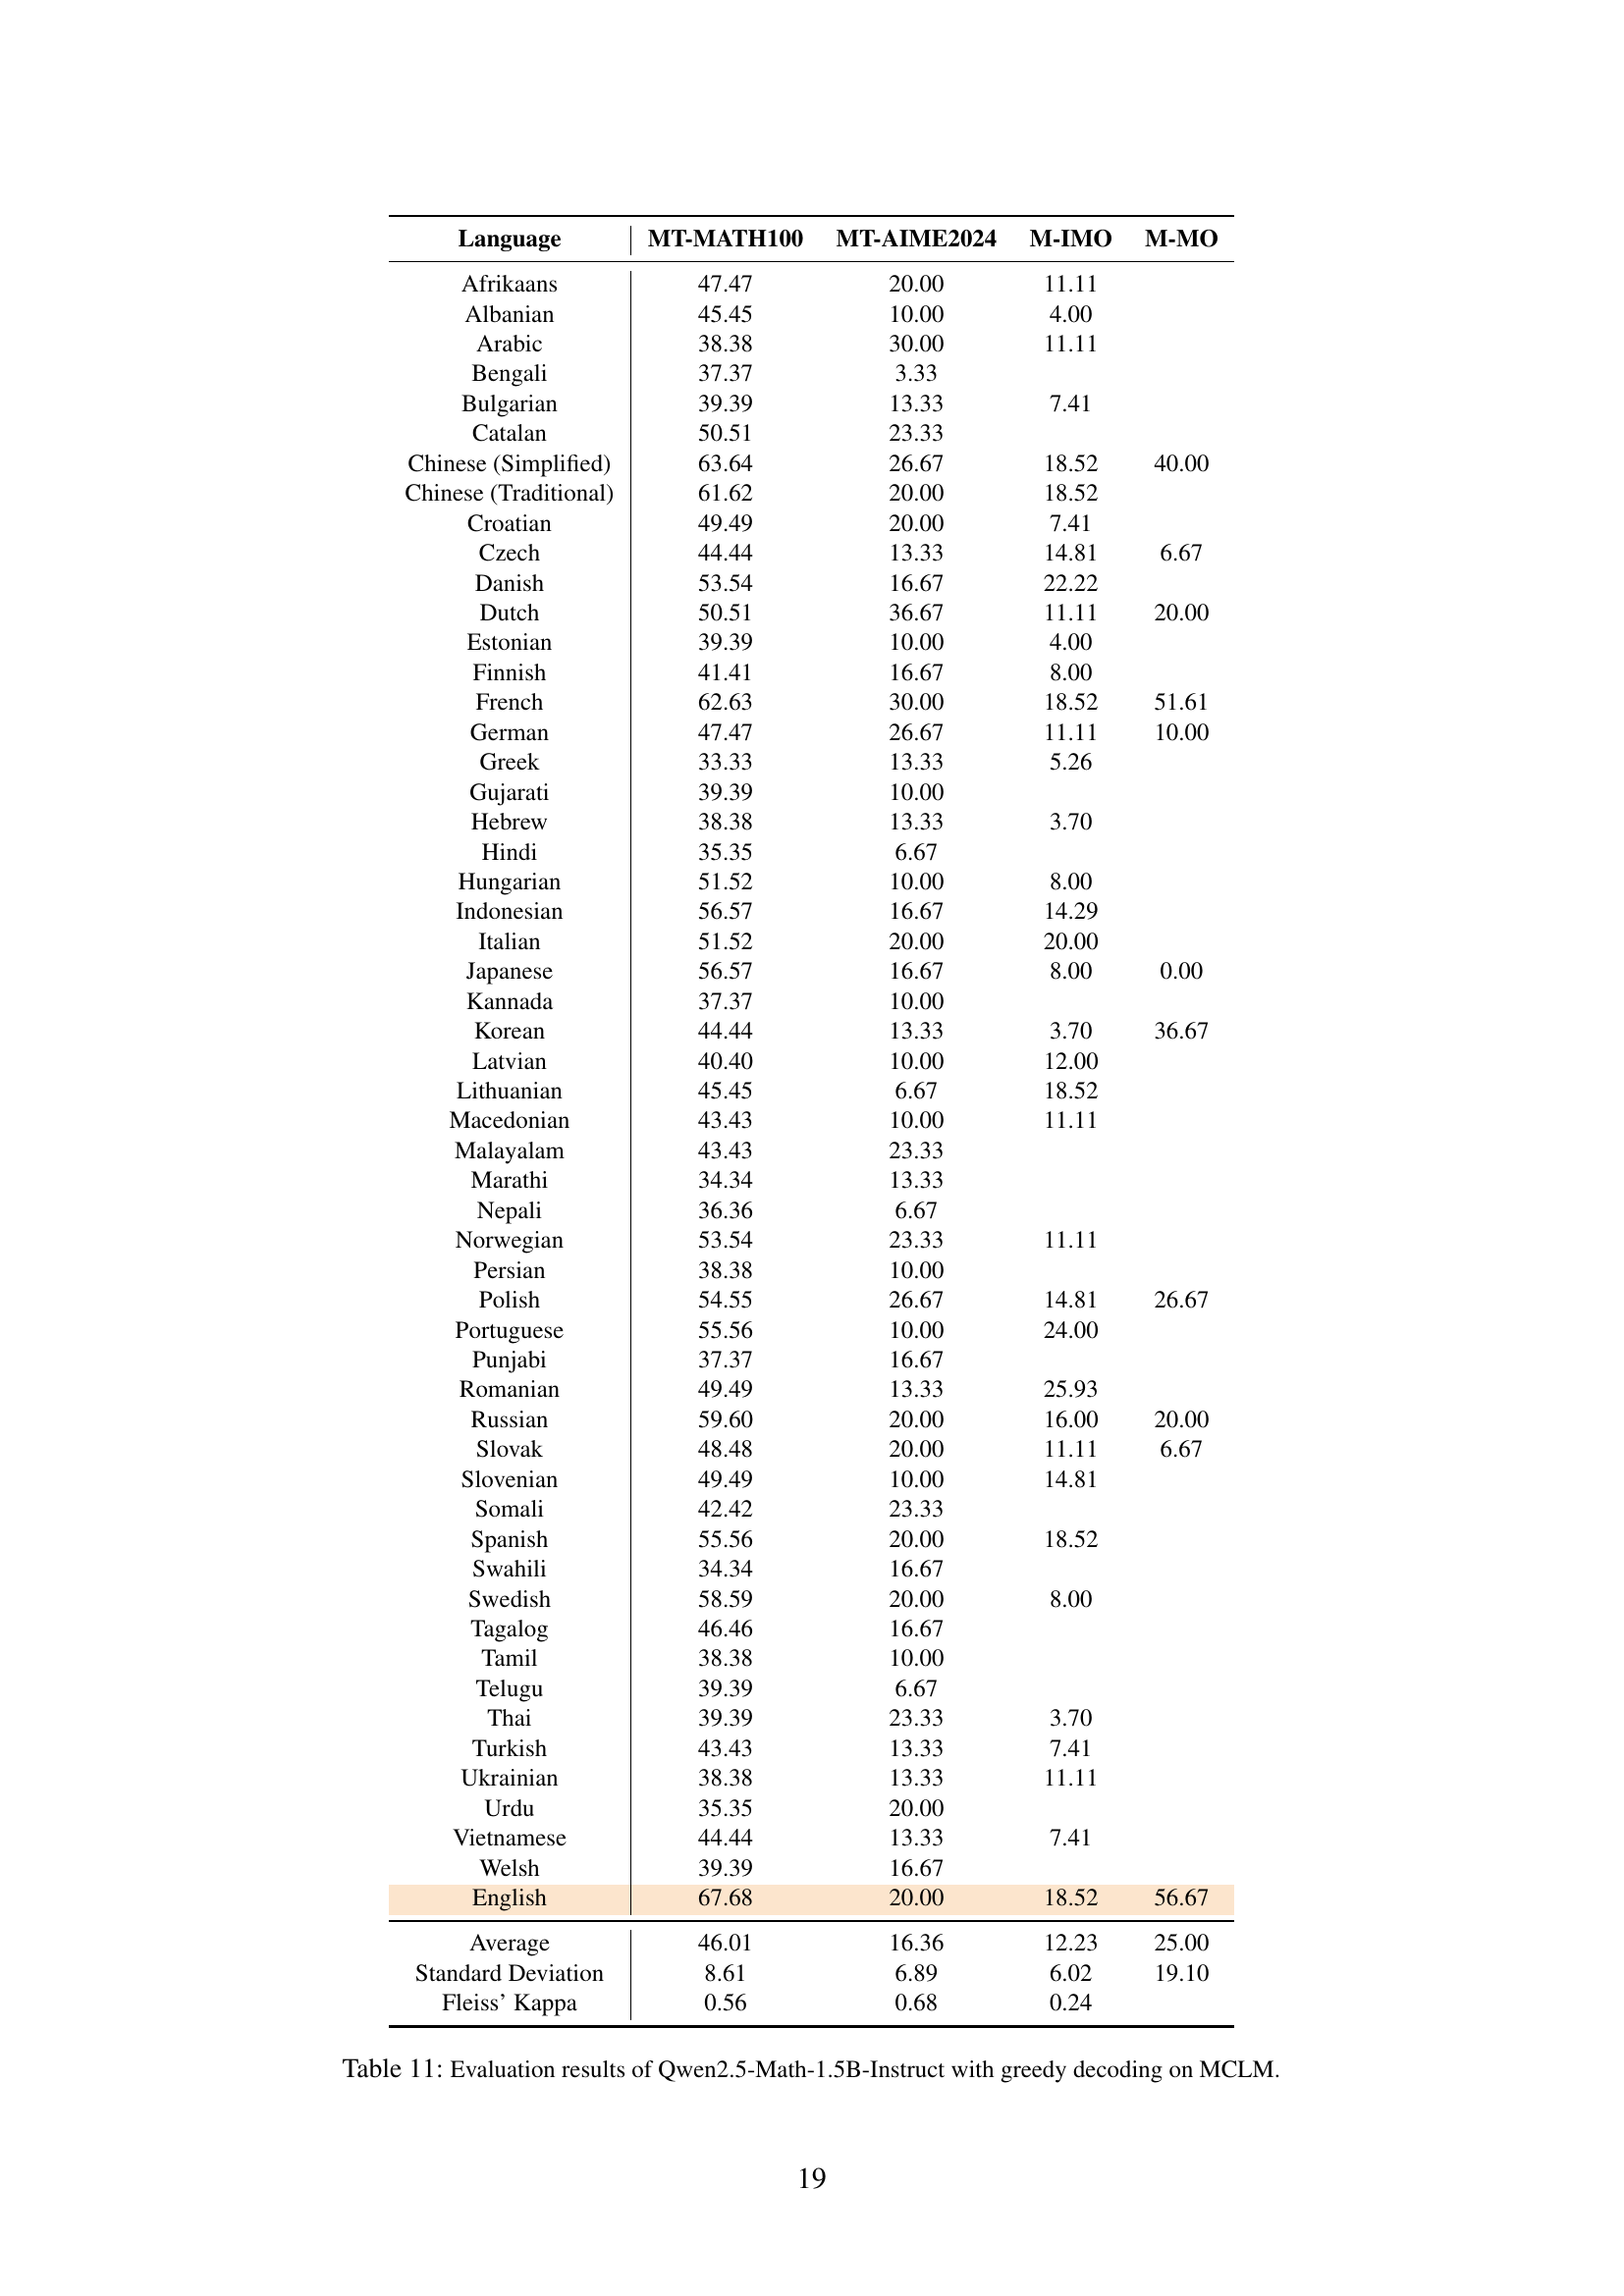
🔼 This table presents the performance of the Qwen2.5-Math-1.5B-Instruct model on the Multilingual Competition Level Math (MCLM) benchmark. The results are broken down by language, showing the model’s accuracy on four different subsets of the MCLM benchmark: MT-MATH100, MT-AIME2024, M-IMO, and M-MO. Each subset contains competition-level math problems in various languages. The table also provides the average accuracy across all languages, the standard deviation, and Fleiss’ Kappa, a measure of inter-annotator agreement (in this case, agreement across languages).
read the caption
Table 11: Evaluation results of Qwen2.5-Math-1.5B-Instruct with greedy decoding on MCLM.
| ORM (K=2) | ORM (K=4) | ORM (K=8) | ||||
| Language | MT-MATH100 | MT-AIME2024 | MT-MATH100 | MT-AIME2024 | MT-MATH100 | MT-AIME2024 |
| Afrikaans | 53.54 | 23.33 | 56.57 | 16.67 | 60.61 | 23.33 |
| Albanian | 52.53 | 10.00 | 50.51 | 10.00 | 47.47 | 13.33 |
| Arabic | 43.43 | 20.00 | 46.46 | 13.33 | 51.52 | 16.67 |
| Bengali | 41.41 | 10.00 | 40.40 | 10.00 | 41.41 | 13.33 |
| Bulgarian | 45.45 | 26.67 | 46.46 | 20.00 | 51.52 | 16.67 |
| Catalan | 59.60 | 33.33 | 63.64 | 33.33 | 61.62 | 26.67 |
| Chinese (Simplified) | 69.70 | 36.67 | 76.77 | 30.00 | 78.79 | 26.67 |
| Chinese (Traditional) | 68.69 | 13.33 | 70.71 | 20.00 | 74.75 | 26.67 |
| Croatian | 51.52 | 16.67 | 59.60 | 23.33 | 58.59 | 30.00 |
| Czech | 49.49 | 13.33 | 56.57 | 10.00 | 59.60 | 16.67 |
| Danish | 53.54 | 23.33 | 56.57 | 20.00 | 59.60 | 26.67 |
| Dutch | 51.52 | 30.00 | 57.58 | 26.67 | 63.64 | 23.33 |
| Estonian | 46.46 | 13.33 | 48.48 | 13.33 | 50.51 | 13.33 |
| Finnish | 41.41 | 13.33 | 48.48 | 20.00 | 53.54 | 20.00 |
| French | 64.65 | 40.00 | 68.69 | 33.33 | 73.74 | 30.00 |
| German | 54.55 | 23.33 | 63.64 | 23.33 | 64.65 | 30.00 |
| Greek | 39.39 | 13.33 | 44.44 | 10.00 | 47.47 | 10.00 |
| Gujarati | 44.44 | 10.00 | 43.43 | 16.67 | 47.47 | 13.33 |
| Hebrew | 44.44 | 16.67 | 46.46 | 13.33 | 49.49 | 10.00 |
| Hindi | 40.40 | 10.00 | 45.45 | 13.33 | 47.47 | 16.67 |
| Hungarian | 53.54 | 10.00 | 57.58 | 10.00 | 63.64 | 16.67 |
| Indonesian | 58.59 | 20.00 | 56.57 | 20.00 | 59.60 | 16.67 |
| Italian | 57.58 | 26.67 | 60.61 | 26.67 | 69.70 | 16.67 |
| Japanese | 59.60 | 16.67 | 66.67 | 23.33 | 70.71 | 26.67 |
| Kannada | 45.45 | 10.00 | 47.47 | 16.67 | 52.53 | 13.33 |
| Korean | 53.54 | 16.67 | 56.57 | 23.33 | 57.58 | 13.33 |
| Latvian | 45.45 | 10.00 | 51.52 | 20.00 | 54.55 | 16.67 |
| Lithuanian | 48.48 | 10.00 | 52.53 | 10.00 | 57.58 | 13.33 |
| Macedonian | 50.51 | 13.33 | 51.52 | 13.33 | 50.51 | 10.00 |
| Malayalam | 47.47 | 20.00 | 52.53 | 20.00 | 56.57 | 23.33 |
| Marathi | 39.39 | 13.33 | 43.43 | 23.33 | 43.43 | 20.00 |
| Nepali | 38.38 | 6.67 | 46.46 | 3.33 | 46.46 | 6.67 |
| Norwegian | 59.60 | 26.67 | 61.62 | 16.67 | 65.66 | 23.33 |
| Persian | 40.40 | 13.33 | 41.41 | 13.33 | 39.39 | 16.67 |
| Polish | 54.55 | 16.67 | 57.58 | 16.67 | 64.65 | 16.67 |
| Portuguese | 58.59 | 13.33 | 60.61 | 13.33 | 62.63 | 26.67 |
| Punjabi | 41.41 | 16.67 | 43.43 | 20.00 | 42.42 | 16.67 |
| Romanian | 51.52 | 23.33 | 54.55 | 23.33 | 56.57 | 20.00 |
| Russian | 60.61 | 20.00 | 65.66 | 23.33 | 68.69 | 23.33 |
| Slovak | 52.53 | 10.00 | 54.55 | 20.00 | 55.56 | 33.33 |
| Slovenian | 47.47 | 16.67 | 51.52 | 20.00 | 54.55 | 30.00 |
| Somali | 44.44 | 16.67 | 46.46 | 16.67 | 46.46 | 10.00 |
| Spanish | 58.59 | 23.33 | 65.66 | 26.67 | 68.69 | 30.00 |
| Swahili | 37.37 | 13.33 | 41.41 | 20.00 | 45.45 | 13.33 |
| Swedish | 57.58 | 20.00 | 59.60 | 23.33 | 60.61 | 20.00 |
| Tagalog | 50.51 | 16.67 | 55.56 | 20.00 | 57.58 | 23.33 |
| Tamil | 41.41 | 16.67 | 44.44 | 16.67 | 47.47 | 16.67 |
| Telugu | 42.42 | 13.33 | 46.46 | 20.00 | 48.48 | 20.00 |
| Thai | 44.44 | 10.00 | 49.49 | 20.00 | 57.58 | 13.33 |
| Turkish | 50.51 | 16.67 | 46.46 | 13.33 | 54.55 | 20.00 |
| Ukrainian | 44.44 | 23.33 | 51.52 | 16.67 | 52.53 | 26.67 |
| Urdu | 38.38 | 16.67 | 41.41 | 16.67 | 44.44 | 20.00 |
| Vietnamese | 49.49 | 23.33 | 50.51 | 30.00 | 52.53 | 33.33 |
| Welsh | 38.38 | 16.67 | 44.44 | 16.67 | 44.44 | 20.00 |
| English | 71.72 | 16.67 | 73.74 | 26.67 | 76.77 | 36.67 |
| Average | 50.01 | 17.64 | 53.50 | 18.85 | 56.25 | 20.12 |
| Standard Deviation | 8.47 | 7.05 | 8.83 | 6.23 | 9.50 | 6.97 |
| Fleiss’ Kappa | 0.57 | 0.66 | 0.60 | 0.64 | 0.61 | 0.63 |
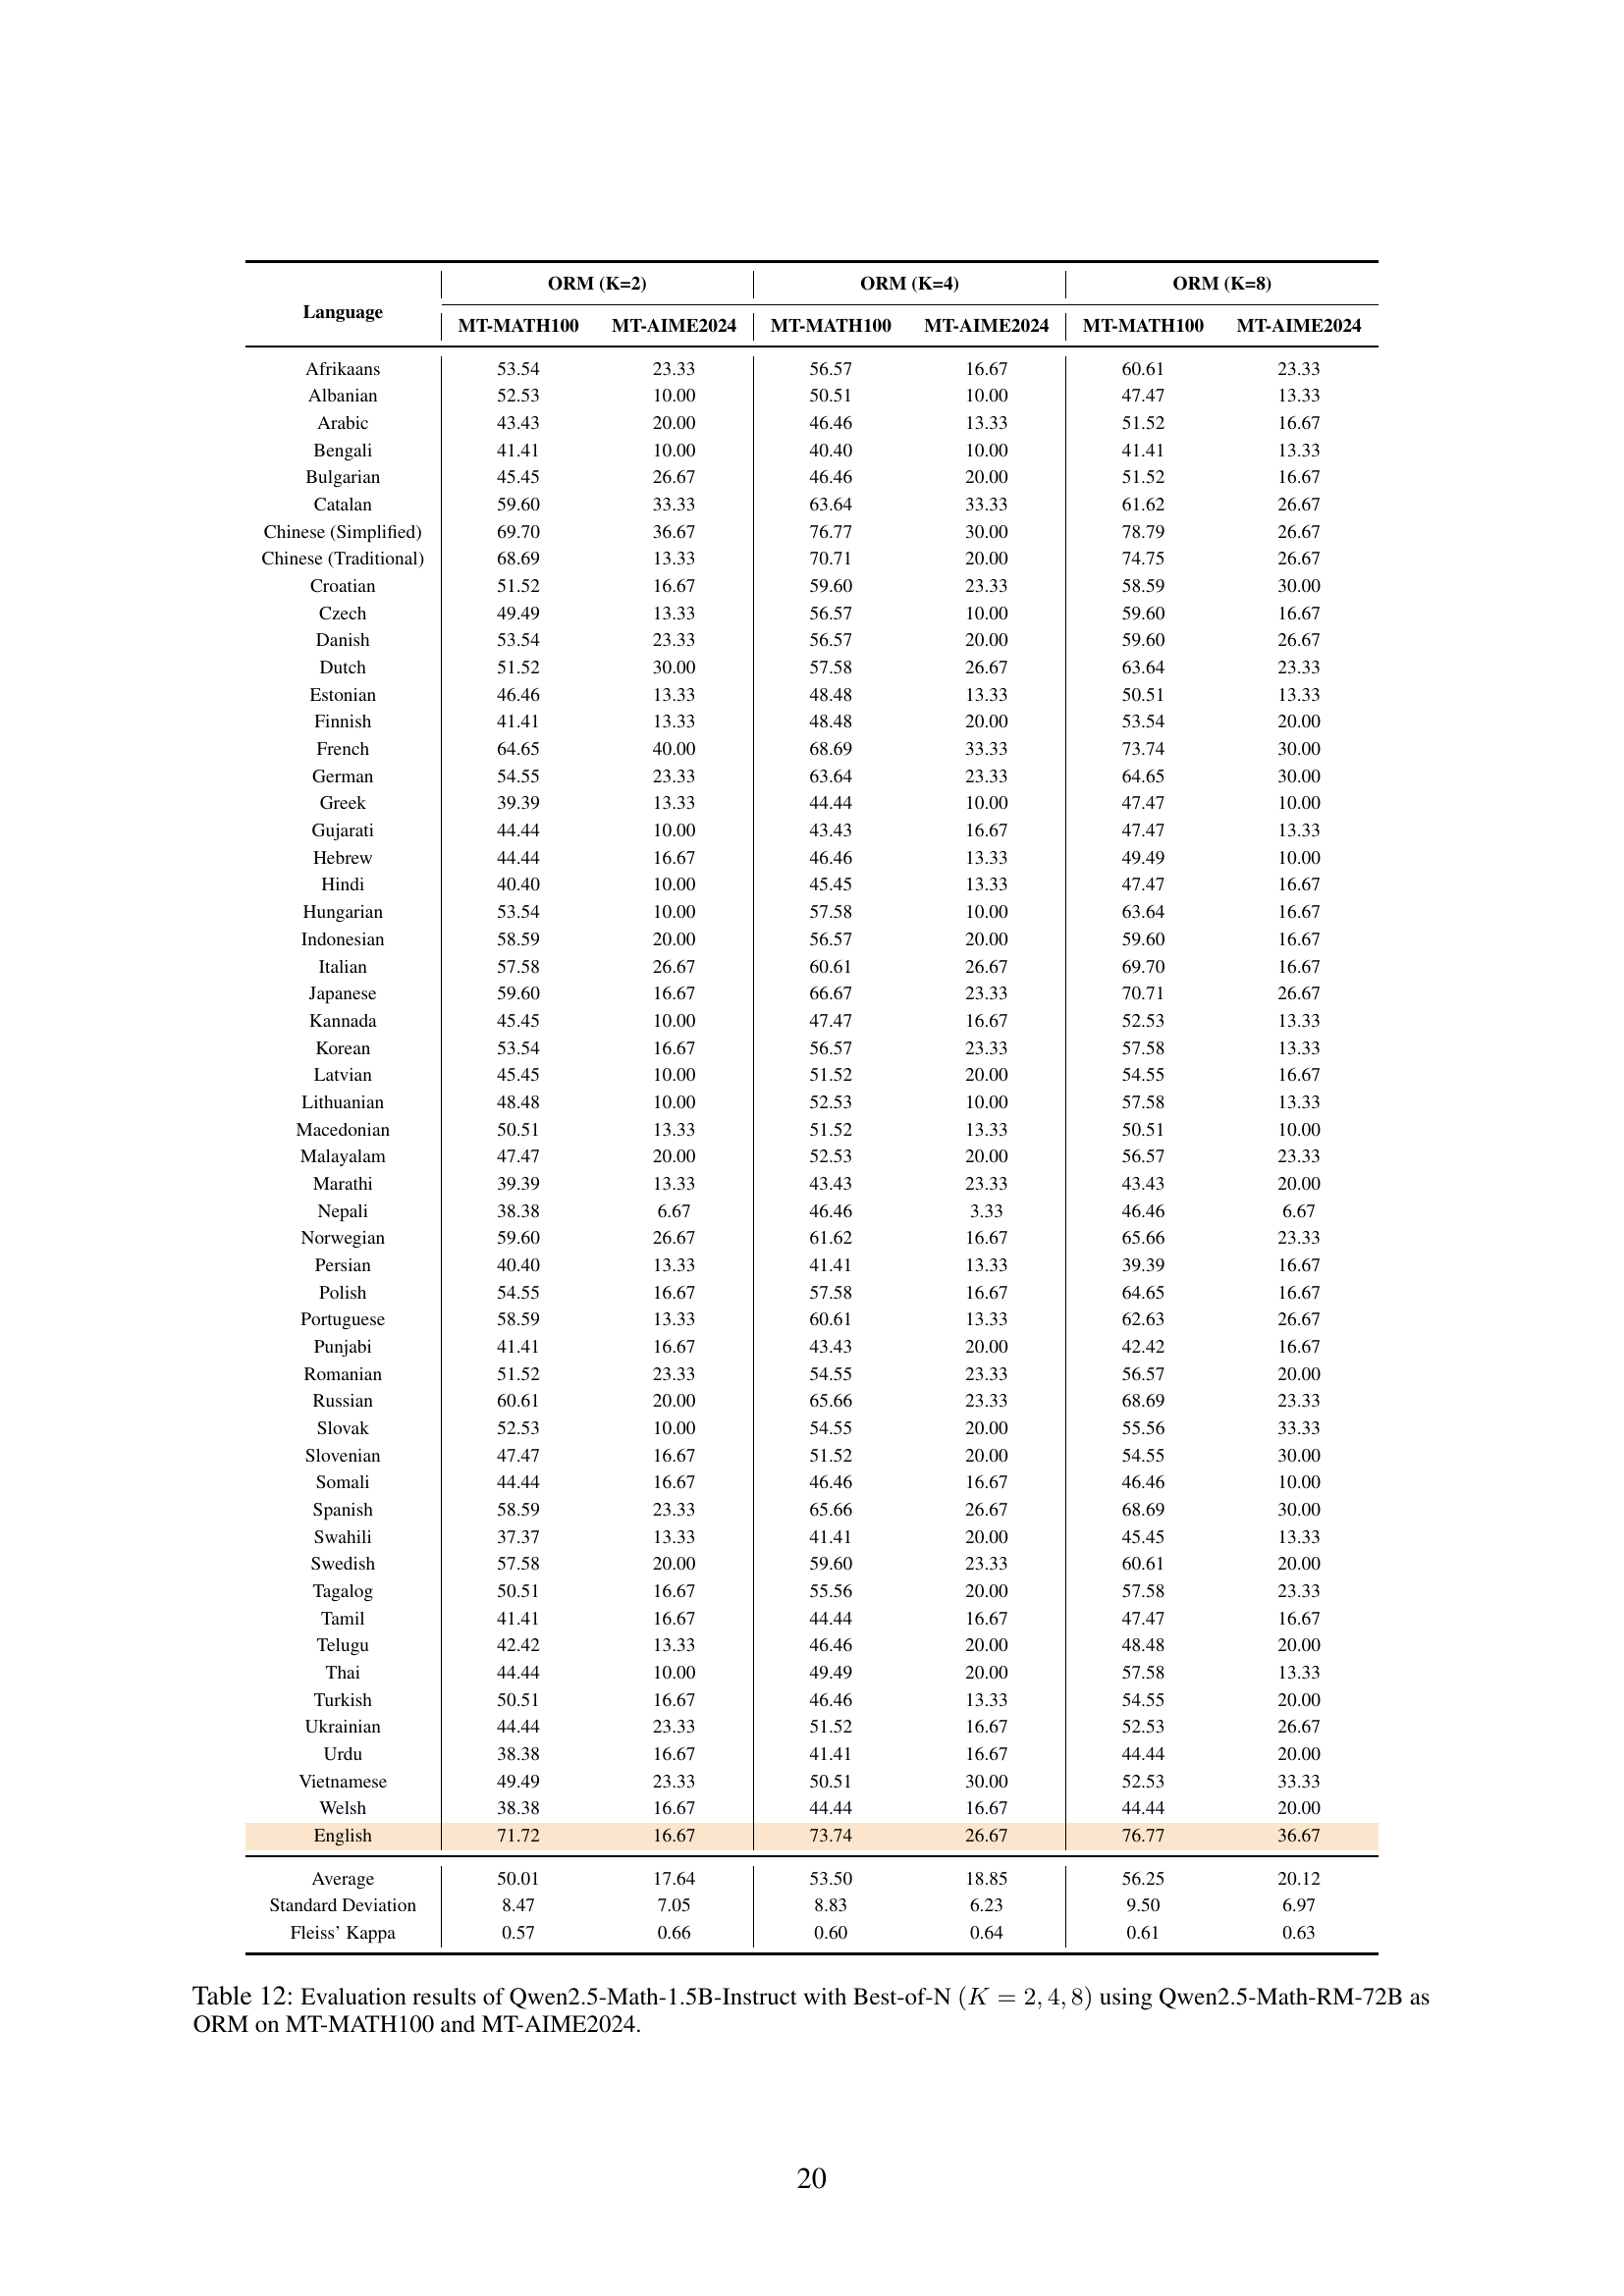
🔼 This table presents the performance of the Qwen2.5-Math-1.5B-Instruct model on the MT-MATH100 and MT-AIME2024 datasets using the Outcome Reward Modeling (ORM) test-time scaling method. The Best-of-N approach is employed, where the model generates multiple (K) responses for each problem, and the highest-scoring response (according to the Qwen2.5-Math-RM-72B reward model) is selected as the final answer. The results are shown for different values of K (2, 4, and 8), illustrating the impact of increasing the number of generated responses on the overall accuracy and consistency.
read the caption
Table 12: Evaluation results of Qwen2.5-Math-1.5B-Instruct with Best-of-N (K=2,4,8)𝐾248(K=2,4,8)( italic_K = 2 , 4 , 8 ) using Qwen2.5-Math-RM-72B as ORM on MT-MATH100 and MT-AIME2024.
| PRM (S=3, c=3) | PRM (S=4, c=5) | PRM (S=5, c=8) | ||||||
| Language | MT-MATH100 | MT-AIME2024 | MT-MATH100 | MT-AIME2024 | MT-MATH100 | MT-AIME2024 | M-IMO | M-MO |
| Afrikaans | 52.53 | 6.67 | 57.58 | 20.00 | 64.65 | 10.00 | 22.73 | |
| Albanian | 44.44 | 13.33 | 52.53 | 10.00 | 45.45 | 16.67 | 11.54 | |
| Arabic | 41.41 | 13.33 | 52.53 | 13.33 | 45.45 | 10.00 | 7.41 | |
| Bengali | 40.40 | 13.33 | 44.44 | 13.33 | 41.41 | 16.67 | ||
| Bulgarian | 42.42 | 20.00 | 42.42 | 10.00 | 55.56 | 10.00 | 11.11 | |
| Catalan | 55.56 | 10.00 | 66.67 | 26.67 | 61.62 | 26.67 | ||
| Chinese (Simplified) | 64.65 | 13.33 | 75.76 | 16.67 | 71.72 | 33.33 | 25.93 | |
| Chinese (Traditional) | 63.64 | 26.67 | 73.74 | 16.67 | 72.73 | 26.67 | 29.63 | 53.33 |
| Croatian | 50.51 | 13.33 | 51.52 | 20.00 | 54.55 | 23.33 | 14.81 | |
| Czech | 50.51 | 10.00 | 52.53 | 16.67 | 58.59 | 20.00 | 14.81 | 10.00 |
| Danish | 57.58 | 10.00 | 60.61 | 30.00 | 60.61 | 20.00 | 22.22 | |
| Dutch | 56.57 | 20.00 | 56.57 | 26.67 | 59.60 | 20.00 | 7.41 | 20.00 |
| Estonian | 47.47 | 13.33 | 51.52 | 3.33 | 49.49 | 10.00 | 11.54 | |
| Finnish | 41.41 | 10.00 | 43.43 | 6.67 | 49.49 | 10.00 | 15.38 | |
| French | 62.63 | 13.33 | 65.66 | 30.00 | 70.71 | 20.00 | 18.52 | 51.61 |
| German | 54.55 | 40.00 | 62.63 | 30.00 | 58.59 | 23.33 | 22.22 | 16.67 |
| Greek | 42.42 | 13.33 | 39.39 | 6.67 | 44.44 | 20.00 | 4.35 | |
| Gujarati | 42.42 | 6.67 | 39.39 | 13.33 | 41.41 | 13.33 | ||
| Hebrew | 46.46 | 6.67 | 42.42 | 23.33 | 47.47 | 6.67 | 7.41 | |
| Hindi | 39.39 | 10.00 | 46.46 | 20.00 | 47.47 | 10.00 | ||
| Hungarian | 57.58 | 26.67 | 61.62 | 10.00 | 57.58 | 3.33 | 19.23 | |
| Indonesian | 56.57 | 16.67 | 57.58 | 13.33 | 64.65 | 13.33 | 20.83 | |
| Italian | 61.62 | 13.33 | 61.62 | 20.00 | 67.68 | 23.33 | 23.08 | |
| Japanese | 64.65 | 20.00 | 66.67 | 26.67 | 66.67 | 16.67 | 15.38 | 7.14 |
| Kannada | 44.44 | 23.33 | 42.42 | 13.33 | 47.47 | 13.33 | ||
| Korean | 46.46 | 10.00 | 45.45 | 13.33 | 50.51 | 13.33 | 14.81 | 26.67 |
| Latvian | 47.47 | 6.67 | 50.51 | 16.67 | 51.52 | 10.00 | 15.38 | |
| Lithuanian | 42.42 | 10.00 | 49.49 | 6.67 | 45.45 | 16.67 | 14.81 | |
| Macedonian | 41.41 | 13.33 | 47.47 | 16.67 | 48.48 | 23.33 | 11.11 | |
| Malayalam | 38.38 | 16.67 | 42.42 | 16.67 | 43.43 | 13.33 | ||
| Marathi | 39.39 | 10.00 | 43.43 | 10.00 | 36.36 | 13.33 | ||
| Nepali | 41.41 | 16.67 | 41.41 | 26.67 | 42.42 | 10.00 | ||
| Norwegian | 59.60 | 23.33 | 65.66 | 30.00 | 59.60 | 26.67 | 18.52 | |
| Persian | 37.37 | 20.00 | 43.43 | 13.33 | 39.39 | 13.33 | ||
| Polish | 49.49 | 23.33 | 58.59 | 23.33 | 62.63 | 20.00 | 25.93 | 36.67 |
| Portuguese | 58.59 | 20.00 | 57.58 | 16.67 | 61.62 | 30.00 | 19.23 | |
| Punjabi | 39.39 | 20.00 | 40.40 | 13.33 | 49.49 | 6.67 | ||
| Romanian | 57.58 | 16.67 | 55.56 | 13.33 | 57.58 | 10.00 | 22.22 | |
| Russian | 53.54 | 23.33 | 65.66 | 23.33 | 64.65 | 20.00 | 15.38 | 23.33 |
| Slovak | 51.52 | 10.00 | 52.53 | 13.33 | 53.54 | 20.00 | 14.81 | |
| Slovenian | 44.44 | 23.33 | 47.47 | 16.67 | 45.45 | 26.67 | 11.11 | |
| Somali | 43.43 | 6.67 | 42.42 | 23.33 | 40.40 | 3.33 | ||
| Spanish | 60.61 | 16.67 | 65.66 | 26.67 | 72.73 | 30.00 | 29.63 | |
| Swahili | 38.38 | 13.33 | 41.41 | 13.33 | 41.41 | 10.00 | ||
| Swedish | 55.56 | 13.33 | 57.58 | 13.33 | 57.58 | 20.00 | 15.38 | |
| Tagalog | 47.47 | 20.00 | 51.52 | 10.00 | 55.56 | 10.00 | ||
| Tamil | 41.41 | 10.00 | 45.45 | 16.67 | 45.45 | 16.67 | ||
| Telugu | 42.42 | 6.67 | 45.45 | 13.33 | 48.48 | 16.67 | ||
| Thai | 39.39 | 6.67 | 47.47 | 6.67 | 50.51 | 10.00 | 14.81 | |
| Turkish | 45.45 | 13.33 | 50.51 | 23.33 | 45.45 | 10.00 | 11.11 | |
| Ukrainian | 39.39 | 6.67 | 45.45 | 23.33 | 51.52 | 6.67 | 18.52 | |
| Urdu | 39.39 | 20.00 | 40.40 | 16.67 | 42.42 | 13.33 | ||
| Vietnamese | 47.47 | 26.67 | 53.54 | 20.00 | 51.52 | 13.33 | 29.63 | |
| Welsh | 43.43 | 10.00 | 48.48 | 6.67 | 51.52 | 6.67 | ||
| English | 73.74 | 26.67 | 79.80 | 23.33 | 72.73 | 23.33 | 29.63 | 60.00 |
| Average | 48.87 | 15.33 | 52.54 | 17.15 | 53.54 | 16.00 | 17.31 | 30.54 |
| Standard Deviation | 8.76 | 6.93 | 9.98 | 6.95 | 9.71 | 7.15 | 6.44 | 18.88 |
| Fleiss’ Kappa | 0.57 | 0.78 | 0.58 | 0.61 | 0.60 | 0.62 | 0.43 | |
🔼 This table presents the performance of the Qwen2.5-Math-1.5B-Instruct model on the MCLM benchmark when using the Qwen2.5-Math-PRM-72B as a process reward model. It shows the model’s accuracy (percentage of correct answers) for three different PRM configurations (S=3, c=3; S=4, c=5; S=5, c=8) across four subsets of the MCLM benchmark (MT-MATH100, MT-AIME2024, M-IMO, M-MO) and for 55 different languages. It also provides the average accuracy across languages for each subset and configuration, the standard deviation, and Fleiss’ Kappa values, which measure the consistency of the model’s performance across different languages.
read the caption
Table 13: Evaluation results of Qwen2.5-Math-1.5B-Instruct using Qwen2.5-Math-PRM-72B as PRM on MCLM.
| MT-MATH100 | |||
| Language | PRM (S=7, c=5) | PRM (S=7, c=7) | PRM (S=7, c=11) |
| Afrikaans | 55.56 | 51.52 | 58.59 |
| Arabic | 44.44 | 42.42 | 44.44 |
| Chinese (Simplified) | 71.72 | 74.75 | 76.77 |
| French | 64.65 | 72.73 | 69.70 |
| German | 57.58 | 58.59 | 58.59 |
| Hebrew | 46.46 | 39.39 | 44.44 |
| Indonesian | 59.60 | 62.63 | 61.62 |
| Italian | 60.61 | 60.61 | 58.59 |
| Japanese | 67.68 | 67.68 | 63.64 |
| Korean | 48.48 | 45.45 | 50.51 |
| Spanish | 64.65 | 67.68 | 68.69 |
| Turkish | 50.51 | 53.54 | 48.48 |
| Vietnamese | 51.52 | 49.49 | 51.52 |
| English | 75.76 | 79.80 | 74.75 |
| Average | 58.51 | 59.02 | 59.31 |
| Standard Deviation | 9.62 | 12.57 | 10.60 |
| Fleiss’ Kappa | 0.56 | 0.57 | 0.56 |
🔼 This table presents the results of evaluating the Qwen2.5-Math-1.5B-Instruct model’s performance on the MT-MATH100 benchmark using the Process Reward Modeling (PRM) method. The PRM utilizes the Qwen2.5-Math-PRM-72B model as a verifier. A key aspect of this evaluation is that the number of generation steps is fixed at 7 (S=7). The table shows the model’s performance in terms of accuracy across multiple languages, along with the standard deviation and Fleiss’ Kappa, indicating the consistency of the model’s performance across different languages.
read the caption
Table 14: Evaluation results of Qwen2.5-Math-1.5B-Instruct using Qwen2.5-Math-PRM-72B as PRM with steps fixed at (S=7)𝑆7(S=7)( italic_S = 7 ) on MT-MATH100.
| MT-MATH100 | |||
| Language | PRM (S=3, c=8) | PRM (S=6, c=8) | PRM (S=9, c=8) |
| Afrikaans | 54.55 | 55.56 | 60.61 |
| Arabic | 41.41 | 44.44 | 52.53 |
| Chinese (Simplified) | 71.72 | 71.72 | 70.71 |
| French | 67.68 | 64.65 | 67.68 |
| German | 56.57 | 57.58 | 66.67 |
| Hebrew | 42.42 | 46.46 | 45.45 |
| Indonesian | 60.61 | 59.60 | 62.63 |
| Italian | 56.57 | 60.61 | 61.62 |
| Japanese | 63.64 | 67.68 | 62.63 |
| Korean | 47.47 | 48.48 | 48.48 |
| Spanish | 65.66 | 64.65 | 72.73 |
| Turkish | 53.54 | 50.51 | 49.49 |
| Vietnamese | 57.58 | 51.52 | 57.58 |
| English | 75.76 | 75.76 | 77.78 |
| Average | 58.23 | 58.51 | 61.18 |
| Standard Deviation | 10.22 | 9.62 | 9.65 |
| Fleiss’ Kappa | 0.56 | 0.58 | 0.58 |
🔼 This table presents the performance of the Qwen2.5-Math-1.5B-Instruct model on the MT-MATH100 subset of the MCLM benchmark. The model utilizes the Qwen2.5-Math-PRM-72B as a process reward model (PRM) during inference. A key characteristic of this experiment is that the number of candidate continuations generated at each step is fixed at 8, allowing for a controlled evaluation of PRM’s effectiveness under this specific configuration. The table shows the accuracy of the model across multiple languages, providing insights into the consistency and generalizability of PRM’s performance.
read the caption
Table 15: Evaluation results of Qwen2.5-Math-1.5B-Instruct using Qwen2.5-Math-PRM-72B as PRM with the number of candidates fixed at 8, on MT-MATH100.
| MT-MATH100 | |||
| Language | PRM (S=7, c=7) | PRM (S=7, c=11) | PRM (S=7, c=18) |
| Afrikaans | 51.52 | 58.59 | 58.59 |
| Arabic | 42.42 | 44.44 | 52.53 |
| Chinese (Simplified) | 74.75 | 76.77 | 76.77 |
| French | 72.73 | 69.70 | 71.72 |
| German | 58.59 | 58.59 | 60.61 |
| Hebrew | 39.39 | 44.44 | 41.41 |
| Indonesian | 62.63 | 61.62 | 62.63 |
| Italian | 60.61 | 58.59 | 64.65 |
| Japanese | 67.68 | 63.64 | 61.62 |
| Korean | 45.45 | 50.51 | 50.51 |
| Spanish | 67.68 | 68.69 | 68.69 |
| Turkish | 53.54 | 48.48 | 52.53 |
| Vietnamese | 49.49 | 51.52 | 51.52 |
| English | 79.80 | 74.75 | 70.71 |
| Average | 59.02 | 59.31 | 60.32 |
| Standard Deviation | 12.57 | 10.60 | 9.84 |
| Fleiss’ Kappa | 0.52 | 0.55 | 0.54 |
🔼 This table presents the results of using the Process Reward Modeling (PRM) method on the MT-MATH100 subset of the MCLM benchmark. The Qwen2.5-Math-1.5B-Instruct model was used as the generator, and the Qwen2.5-Math-PRM-7B model served as the reward model. The experiment involved generating 7 candidate continuations at each step to guide the generation process. The table shows the performance of this approach across various languages, evaluating the MT-MATH100 accuracy metric.
read the caption
Table 16: Evaluation results of Qwen2.5-Math-1.5B-Instruct using Qwen2.5-Math-PRM-7B as PRM with the number of candidates fixed at 7, on MT-MATH100.
| MT-MATH100 | |||
| Language | PRM (S=3, c=13) | PRM (S=6, c=13) | PRM (S=9, c=13) |
| Afrikaans | 55.56 | 59.60 | 54.55 |
| Arabic | 44.44 | 45.45 | 44.44 |
| Chinese (Simplified) | 75.76 | 70.71 | 79.80 |
| French | 64.65 | 71.72 | 73.74 |
| German | 55.56 | 63.64 | 61.62 |
| Hebrew | 46.46 | 43.43 | 47.47 |
| Indonesian | 56.57 | 58.59 | 61.62 |
| Italian | 62.63 | 60.61 | 61.62 |
| Japanese | 58.59 | 67.68 | 59.60 |
| Korean | 49.49 | 48.48 | 51.52 |
| Spanish | 60.61 | 73.74 | 64.65 |
| Turkish | 49.49 | 50.51 | 49.49 |
| Vietnamese | 52.53 | 48.48 | 45.45 |
| English | 71.72 | 73.74 | 77.78 |
| Average | 57.43 | 59.74 | 59.52 |
| Standard Deviation | 9.10 | 10.90 | 11.59 |
| Fleiss’ Kappa | 0.54 | 0.55 | 0.52 |
🔼 This table presents the performance of the Qwen2.5-Math-1.5B-Instruct model on the MT-MATH100 subset of the MCLM benchmark. The model utilizes the Qwen2.5-Math-PRM-7B as a process reward model (PRM). A key aspect is that the number of candidates generated at each step in the PRM process is fixed at 13. Results are shown for each language in the MT-MATH100 dataset, indicating accuracy for each language.
read the caption
Table 17: Evaluation results of Qwen2.5-Math-1.5B-Instruct using Qwen2.5-Math-PRM-7B as PRM with the number of candidates fixed at 13, on MT-MATH100.
| Language | MT-MATH100 | MT-AIME2024 | M-IMO | M-MO |
| Afrikaans | 47.47 | 36.67 | 5.56 | |
| Albanian | 31.31 | 13.33 | 8.00 | |
| Arabic | 36.36 | 23.33 | 7.41 | |
| Bengali | 33.33 | 10.00 | ||
| Bulgarian | 41.41 | 10.00 | 11.11 | |
| Catalan | 47.47 | 16.67 | ||
| Chinese (Simplified) | 57.58 | 23.33 | 18.52 | |
| Chinese (Traditional) | 43.43 | 16.67 | 22.22 | 23.33 |
| Croatian | 38.38 | 16.67 | 7.41 | |
| Czech | 33.33 | 30.00 | 3.70 | 3.33 |
| Danish | 41.41 | 23.33 | 7.41 | |
| Dutch | 45.45 | 16.67 | 7.41 | 16.67 |
| Estonian | 38.38 | 10.00 | 12.00 | |
| Finnish | 30.30 | 23.33 | 12.00 | |
| French | 39.39 | 6.67 | 7.41 | 35.48 |
| German | 45.45 | 23.33 | 18.52 | 6.67 |
| Greek | 30.30 | 16.67 | 0.00 | |
| Gujarati | 27.27 | 6.67 | ||
| Hebrew | 36.36 | 16.67 | 7.41 | |
| Hindi | 36.36 | 10.00 | ||
| Hungarian | 39.39 | 16.67 | 8.00 | |
| Indonesian | 37.37 | 13.33 | 4.76 | |
| Italian | 41.41 | 13.33 | 12.00 | |
| Japanese | 45.45 | 20.00 | 12.00 | 3.57 |
| Kannada | 32.32 | 10.00 | ||
| Korean | 39.39 | 16.67 | 14.81 | 16.67 |
| Latvian | 30.30 | 6.67 | 4.00 | |
| Lithuanian | 31.31 | 6.67 | 14.81 | |
| Macedonian | 31.31 | 0.00 | 7.41 | |
| Malayalam | 27.27 | 13.33 | ||
| Marathi | 33.33 | 13.33 | ||
| Nepali | 35.35 | 13.33 | ||
| Norwegian | 37.37 | 16.67 | 11.11 | |
| Persian | 29.29 | 20.00 | ||
| Polish | 38.38 | 6.67 | 11.11 | 13.33 |
| Portuguese | 47.47 | 20.00 | 8.00 | |
| Punjabi | 29.29 | 16.67 | ||
| Romanian | 41.41 | 10.00 | 18.52 | |
| Russian | 46.46 | 16.67 | 12.00 | 20.00 |
| Slovak | 35.35 | 16.67 | 11.11 | 10.00 |
| Slovenian | 35.35 | 23.33 | 11.11 | |
| Somali | 26.26 | 16.67 | ||
| Spanish | 46.46 | 16.67 | 11.11 | |
| Swahili | 36.36 | 6.67 | ||
| Swedish | 39.39 | 13.33 | 8.00 | |
| Tagalog | 35.35 | 13.33 | ||
| Tamil | 33.33 | 10.00 | ||
| Telugu | 34.34 | 13.33 | ||
| Thai | 30.30 | 10.00 | 7.41 | |
| Turkish | 42.42 | 6.67 | 11.11 | |
| Ukrainian | 35.35 | 3.33 | 11.11 | |
| Urdu | 28.28 | 13.33 | ||
| Vietnamese | 31.31 | 10.00 | 7.41 | |
| Welsh | 30.30 | 23.33 | ||
| English | 65.66 | 20.00 | 25.93 | 53.33 |
| Average | 37.47 | 14.85 | 10.50 | 18.40 |
| Standard Deviation | 7.56 | 6.69 | 5.16 | 14.92 |
| Fleiss’ Kappa | 0.41 | 0.13 | 0.19 |
🔼 This table presents the performance of the Qwen2.5-Math-1.5B language model after undergoing supervised fine-tuning with translated data (SFT) on the MCLM benchmark. It shows the model’s accuracy scores across various subsets of the benchmark (MT-MATH100, MT-AIME2024, M-IMO, M-MO) for 55 different languages. The average accuracy, standard deviation, and Fleiss’ kappa (a measure of inter-annotator agreement) are also provided to evaluate the model’s overall performance and consistency across languages.
read the caption
Table 18: Evaluation results of Qwen2.5-Math-1.5B-Instruct + SFT on MCLM.
| Language | MT-MATH100 | MT-AIME2024 | M-IMO | M-MO |
| Afrikaans | 39.39 | 10.00 | 13.64 | |
| Albanian | 39.39 | 16.67 | 7.69 | |
| Arabic | 41.41 | 16.67 | 14.81 | |
| Bengali | 39.39 | 30.00 | ||
| Bulgarian | 42.42 | 10.00 | 11.11 | |
| Catalan | 51.52 | 26.67 | ||
| Chinese (Simplified) | 50.51 | 23.33 | 7.41 | |
| Chinese (Traditional) | 52.53 | 20.00 | 11.11 | 13.33 |
| Croatian | 38.38 | 13.33 | 11.11 | |
| Czech | 51.52 | 23.33 | 11.11 | 10.00 |
| Danish | 40.40 | 6.67 | 3.70 | |
| Dutch | 48.48 | 20.00 | 11.11 | 20.00 |
| Estonian | 37.37 | 23.33 | 15.38 | |
| Finnish | 40.40 | 20.00 | 7.69 | |
| French | 46.46 | 10.00 | 7.41 | 32.26 |
| German | 49.49 | 10.00 | 7.41 | 3.33 |
| Greek | 28.28 | 20.00 | 17.39 | |
| Gujarati | 42.42 | 13.33 | ||
| Hebrew | 39.39 | 13.33 | 3.70 | |
| Hindi | 45.45 | 13.33 | ||
| Hungarian | 43.43 | 40.00 | 11.54 | |
| Indonesian | 51.52 | 16.67 | 16.67 | |
| Italian | 48.48 | 13.33 | 11.54 | |
| Japanese | 50.51 | 6.67 | 11.54 | 3.57 |
| Kannada | 32.32 | 10.00 | ||
| Korean | 55.56 | 10.00 | 11.11 | 26.67 |
| Latvian | 42.42 | 10.00 | 15.38 | |
| Lithuanian | 36.36 | 13.33 | 7.41 | |
| Macedonian | 39.39 | 13.33 | 18.52 | |
| Malayalam | 34.34 | 26.67 | ||
| Marathi | 37.37 | 23.33 | ||
| Nepali | 42.42 | 16.67 | ||
| Norwegian | 42.42 | 10.00 | 3.70 | |
| Persian | 47.47 | 10.00 | ||
| Polish | 38.38 | 10.00 | 14.81 | 20.00 |
| Portuguese | 50.51 | 26.67 | 11.54 | |
| Punjabi | 29.29 | 16.67 | ||
| Romanian | 45.45 | 6.67 | 11.11 | |
| Russian | 57.58 | 13.33 | 7.69 | 36.67 |
| Slovak | 47.47 | 20.00 | 7.41 | |
| Slovenian | 39.39 | 23.33 | 18.52 | |
| Somali | 22.22 | 26.67 | ||
| Spanish | 44.44 | 16.67 | 0.00 | |
| Swahili | 34.34 | 6.67 | ||
| Swedish | 42.42 | 10.00 | 3.85 | |
| Tagalog | 35.35 | 6.67 | ||
| Tamil | 36.36 | 23.33 | ||
| Telugu | 36.36 | 13.33 | ||
| Thai | 34.34 | 26.67 | 14.81 | |
| Turkish | 39.39 | 23.33 | 7.41 | |
| Ukrainian | 49.49 | 10.00 | 7.41 | |
| Urdu | 32.32 | 20.00 | ||
| Vietnamese | 47.47 | 10.00 | 18.52 | |
| Welsh | 28.28 | 20.00 | ||
| English | 51.52 | 26.67 | 7.41 | 40.00 |
| Average | 42.02 | 16.67 | 10.52 | 20.58 |
| Standard Deviation | 7.46 | 7.31 | 4.63 | 13.17 |
| Fleiss’ Kappa | 0.40 | 0.13 | 0.25 |
🔼 This table presents the performance of the Qwen2.5-Math-1.5B-Instruct model after multilingual fine-tuning (MT-SFT) on the MCLM benchmark. It shows the model’s accuracy scores for each of the four subsets of MCLM (MT-MATH100, MT-AIME2024, M-IMO, M-MO) across 55 different languages. Additionally, it includes the average accuracy across all languages, the standard deviation indicating the variability of performance, and Fleiss’ Kappa measuring the consistency of the model’s performance across languages.
read the caption
Table 19: Evaluation results of Qwen2.5-Math-1.5B-Instruct + MT-SFT on MCLM.
| Language | MT-MATH100 | MT-AIME2024 | M-IMO | M-MO |
| Afrikaans | 58.59 | 20.00 | 11.11 | |
| Albanian | 46.46 | 30.00 | 16.00 | |
| Arabic | 51.52 | 20.00 | 18.52 | |
| Bengali | 56.57 | 10.00 | ||
| Bulgarian | 57.58 | 16.67 | 11.11 | |
| Catalan | 64.65 | 30.00 | ||
| Chinese (Simplified) | 69.70 | 16.67 | 25.93 | |
| Chinese (Traditional) | 67.68 | 20.00 | 18.52 | 33.33 |
| Croatian | 59.60 | 36.67 | 18.52 | |
| Czech | 57.58 | 33.33 | 18.52 | 16.67 |
| Danish | 56.57 | 16.67 | 14.81 | |
| Dutch | 64.65 | 30.00 | 22.22 | 23.33 |
| Estonian | 39.39 | 6.67 | 12.00 | |
| Finnish | 52.53 | 16.67 | 20.00 | |
| French | 63.64 | 26.67 | 29.63 | 48.39 |
| German | 63.64 | 16.67 | 25.93 | 26.67 |
| Greek | 38.38 | 13.33 | 10.53 | |
| Gujarati | 47.47 | 3.33 | ||
| Hebrew | 61.62 | 23.33 | 7.41 | |
| Hindi | 61.62 | 23.33 | ||
| Hungarian | 55.56 | 26.67 | 24.00 | |
| Indonesian | 69.70 | 13.33 | 23.81 | |
| Italian | 69.70 | 36.67 | 28.00 | |
| Japanese | 62.63 | 16.67 | 12.00 | 3.57 |
| Kannada | 42.42 | 16.67 | ||
| Korean | 61.62 | 20.00 | 11.11 | 30.00 |
| Latvian | 49.49 | 6.67 | 20.00 | |
| Lithuanian | 40.40 | 23.33 | 14.81 | |
| Macedonian | 59.60 | 23.33 | 25.93 | |
| Malayalam | 41.41 | 3.33 | ||
| Marathi | 39.39 | 23.33 | ||
| Nepali | 50.51 | 10.00 | ||
| Norwegian | 67.68 | 13.33 | 18.52 | |
| Persian | 61.62 | 13.33 | ||
| Polish | 62.63 | 16.67 | 22.22 | 23.33 |
| Portuguese | 75.76 | 23.33 | 16.00 | |
| Punjabi | 42.42 | 13.33 | ||
| Romanian | 58.59 | 26.67 | 22.22 | |
| Russian | 68.69 | 33.33 | 20.00 | 26.67 |
| Slovak | 58.59 | 13.33 | 11.11 | 20.00 |
| Slovenian | 56.57 | 30.00 | 14.81 | |
| Somali | 30.30 | 20.00 | ||
| Spanish | 69.70 | 30.00 | 25.93 | |
| Swahili | 42.42 | 20.00 | ||
| Swedish | 54.55 | 13.33 | 20.00 | |
| Tagalog | 47.47 | 23.33 | ||
| Tamil | 40.40 | 16.67 | ||
| Telugu | 36.36 | 23.33 | ||
| Thai | 59.60 | 13.33 | 29.63 | |
| Turkish | 61.62 | 36.67 | 22.22 | |
| Ukrainian | 67.68 | 16.67 | 18.52 | |
| Urdu | 50.51 | 20.00 | ||
| Vietnamese | 61.62 | 13.33 | 33.33 | |
| Welsh | 34.34 | 16.67 | ||
| English | 67.68 | 20.00 | 14.81 | 66.67 |
| Average | 55.61 | 19.94 | 19.20 | 28.97 |
| Standard Deviation | 10.93 | 8.10 | 6.24 | 16.64 |
| Fleiss’ Kappa | 0.47 | 0.30 | 0.19 |
🔼 This table presents the performance of the DeepSeek-R1-1.5B language model, fine-tuned with multilingual supervised fine-tuning (MT-SFT), on the Multilingual Competition Level Math (MCLM) benchmark. It shows the model’s accuracy scores across four subsets of MCLM: MT-MATH100, MT-AIME2024, M-IMO, and M-MO, each covering different sets of math problems and languages. The results are broken down by language, and the table also includes the average performance across all languages and metrics such as standard deviation and Fleiss’ Kappa to assess the consistency of the model’s performance across various languages.
read the caption
Table 20: Evaluation results of DeepSeek-R1-1.5B + MT-SFT on MCLM.
| BF (N=2048) | BF (N=4096) | BF (N=8192) | ||||
| Language | MT-AIME2024 | MT-AIME2024 | MT-MATH100 | MT-AIME2024 | M-IMO | M-MO |
| Afrikaans | 23.33 | 23.33 | 59.60 | 30.00 | 9.09 | |
| Albanian | 23.33 | 26.67 | 48.48 | 26.67 | 7.69 | |
| Arabic | 16.67 | 23.33 | 60.61 | 26.67 | 14.81 | |
| Bengali | 33.33 | 30.00 | 54.55 | 23.33 | ||
| Bulgarian | 33.33 | 33.33 | 61.62 | 26.67 | 22.22 | |
| Catalan | 20.00 | 43.33 | 64.65 | 43.33 | ||
| Chinese (Simplified) | 20.00 | 16.67 | 69.70 | 16.67 | 22.22 | |
| Chinese (Traditional) | 26.67 | 26.67 | 70.71 | 36.67 | 18.52 | 40.00 |
| Croatian | 30.00 | 30.00 | 60.61 | 30.00 | 37.04 | |
| Czech | 40.00 | 20.00 | 62.63 | 20.00 | 29.63 | 33.33 |
| Danish | 30.00 | 33.33 | 61.62 | 30.00 | 22.22 | |
| Dutch | 10.00 | 23.33 | 70.71 | 36.67 | 25.93 | 20.00 |
| Estonian | 23.33 | 16.67 | 40.40 | 20.00 | 15.38 | |
| Finnish | 20.00 | 33.33 | 51.52 | 20.00 | 30.77 | |
| French | 16.67 | 23.33 | 72.73 | 16.67 | 25.93 | 51.61 |
| German | 26.67 | 20.00 | 75.76 | 26.67 | 25.93 | 30.00 |
| Greek | 6.67 | 13.33 | 42.42 | 16.67 | 21.74 | |
| Gujarati | 16.67 | 16.67 | 51.52 | 16.67 | ||
| Hebrew | 33.33 | 23.33 | 60.61 | 16.67 | 14.81 | |
| Hindi | 26.67 | 10.00 | 61.62 | 20.00 | ||
| Hungarian | 30.00 | 26.67 | 58.59 | 23.33 | 26.92 | |
| Indonesian | 10.00 | 30.00 | 73.74 | 30.00 | 25 | |
| Italian | 20.00 | 26.67 | 74.75 | 36.67 | 23.08 | |
| Japanese | 20.00 | 16.67 | 63.64 | 36.67 | 23.08 | 7.14 |
| Kannada | 10.00 | 13.33 | 49.49 | 10.00 | ||
| Korean | 16.67 | 23.33 | 64.65 | 20.00 | 11.11 | 40.00 |
| Latvian | 30.00 | 20.00 | 52.53 | 10.00 | 23.08 | |
| Lithuanian | 10.00 | 6.67 | 46.46 | 26.67 | 18.52 | |
| Macedonian | 20.00 | 20.00 | 63.64 | 23.33 | 25.93 | |
| Malayalam | 10.00 | 13.33 | 51.52 | 13.33 | ||
| Marathi | 20.00 | 26.67 | 51.52 | 23.33 | ||
| Nepali | 30.00 | 13.33 | 54.55 | 20.00 | ||
| Norwegian | 26.67 | 26.67 | 65.66 | 20.00 | 18.52 | |
| Persian | 26.67 | 23.33 | 62.63 | 36.67 | ||
| Polish | 23.33 | 20.00 | 66.67 | 16.67 | 14.81 | 23.33 |
| Portuguese | 20.00 | 26.67 | 79.80 | 20.00 | 15.38 | |
| Punjabi | 23.33 | 26.67 | 51.52 | 20.00 | ||
| Romanian | 30.00 | 23.33 | 60.61 | 10.00 | 22.22 | |
| Russian | 36.67 | 30.00 | 72.73 | 30.00 | 23.08 | 30.00 |
| Slovak | 40.00 | 23.33 | 66.67 | 30.00 | 25.93 | |
| Slovenian | 20.00 | 20.00 | 60.61 | 33.33 | 25.93 | |
| Somali | 20.00 | 16.67 | 35.35 | 16.67 | ||
| Spanish | 30.00 | 30.00 | 71.72 | 40.00 | 18.52 | |
| Swahili | 13.33 | 13.33 | 41.41 | 30.00 | ||
| Swedish | 13.33 | 16.67 | 62.63 | 23.33 | 19.23 | |
| Tagalog | 10.00 | 20.00 | 52.53 | 23.33 | ||
| Tamil | 26.67 | 20.00 | 44.44 | 23.33 | ||
| Telugu | 13.33 | 16.67 | 44.44 | 20.00 | ||
| Thai | 26.67 | 13.33 | 64.65 | 23.33 | 11.11 | |
| Turkish | 20.00 | 16.67 | 61.62 | 16.67 | 33.33 | |
| Ukrainian | 30.00 | 26.67 | 73.74 | 23.33 | 22.22 | |
| Urdu | 23.33 | 20.00 | 46.46 | 20.00 | ||
| Vietnamese | 20.00 | 26.67 | 62.63 | 40.00 | 25.93 | |
| Welsh | 20.00 | 16.67 | 42.42 | 13.33 | ||
| English | 20.00 | 26.67 | 71.72 | 40.00 | 22.22 | 76.67 |
| Average | 22.48 | 22.24 | 59.45 | 24.42 | 21.55 | 35.21 |
| Standard Deviation | 7.94 | 6.85 | 10.52 | 8.32 | 6.44 | 19.01 |
| Fleiss’ Kappa | 0.33 | 0.37 | 0.44 | 0.32 | 0.19 | |
🔼 This table presents the performance of the Qwen2.5-Math-1.5B-Instruct model on the MCLM benchmark using the Budget Forcing test-time scaling method. Three different budget levels (BF = 2048, 4096, 8192) are tested. The results are shown for each of the four subsets of the MCLM benchmark (MT-MATH100, MT-AIME2024, M-IMO, M-MO) and for each language. Metrics include average accuracy and the Fleiss’ kappa to measure cross-lingual consistency.
read the caption
Table 21: Evaluation results of Qwen2.5-Math-1.5B-Instruct with Budget Forcing (BF=2048,4096,8192𝐵𝐹204840968192BF=2048,4096,8192italic_B italic_F = 2048 , 4096 , 8192).
| Language | MT-MATH100 | MT-AIME2024 | M-IMO | M-MO |
| Afrikaans | 72.73 | 13.33 | 27.78 | |
| Albanian | 60.61 | 16.67 | 20 | |
| Arabic | 76.77 | 13.33 | 14.81 | |
| Bengali | 72.73 | 16.67 | ||
| Bulgarian | 72.73 | 16.67 | ||
| Catalan | 73.74 | 20.00 | ||
| Chinese (Simplified) | 77.78 | 20.00 | 7.41 | |
| Chinese (Traditional) | 73.74 | 23.33 | 11.11 | 56.67 |
| Croatian | 73.74 | 30.00 | 22.22 | |
| Czech | 75.76 | 20.00 | 11.11 | 16.67 |
| Danish | 72.73 | 23.33 | 18.52 | |
| Dutch | 77.78 | 16.67 | 18.52 | 23.33 |
| Estonian | 57.58 | 13.33 | 20 | |
| Finnish | 70.71 | 20.00 | 16 | |
| French | 77.78 | 20.00 | 25.93 | 48.39 |
| German | 76.77 | 23.33 | 25.93 | 26.67 |
| Greek | 64.65 | 13.33 | 10.53 | |
| Gujarati | 55.56 | 16.67 | ||
| Hebrew | 71.72 | 20.00 | 7.41 | |
| Hindi | 70.71 | 30.00 | ||
| Hungarian | 71.72 | 26.67 | 20 | |
| Indonesian | 69.70 | 20.00 | 19.05 | |
| Italian | 78.79 | 23.33 | 12 | |
| Japanese | 76.77 | 23.33 | 16 | 3.57 |
| Kannada | 57.58 | 20.00 | 40 | |
| Korean | 77.78 | 20.00 | 14.81 | |
| Latvian | 59.60 | 13.33 | 20 | |
| Lithuanian | 61.62 | 16.67 | 25.93 | |
| Macedonian | 77.78 | 16.67 | 22.22 | |
| Malayalam | 56.57 | 10.00 | ||
| Marathi | 63.64 | 16.67 | ||
| Nepali | 67.68 | 20.00 | ||
| Norwegian | 73.74 | 23.33 | 22.22 | |
| Persian | 74.75 | 30.00 | ||
| Polish | 71.72 | 16.67 | 22.22 | 26.67 |
| Portuguese | 78.79 | 26.67 | 20 | |
| Punjabi | 58.59 | 16.67 | ||
| Romanian | 76.77 | 23.33 | 14.81 | |
| Russian | 77.78 | 20.00 | 20 | 43.33 |
| Slovak | 74.75 | 23.33 | 18.52 | 23.33 |
| Slovenian | 71.72 | 23.33 | 14.81 | |
| Somali | 38.38 | 6.67 | ||
| Spanish | 75.76 | 30.00 | 14.81 | |
| Swahili | 46.46 | 13.33 | ||
| Swedish | 76.77 | 16.67 | 24 | |
| Tagalog | 60.61 | 16.67 | ||
| Tamil | 54.55 | 10.00 | ||
| Telugu | 60.61 | 16.67 | ||
| Thai | 73.74 | 20.00 | 14.81 | |
| Turkish | 70.71 | 20.00 | 7.41 | |
| Ukrainian | 76.77 | 23.33 | 14.81 | |
| Urdu | 63.64 | 50.00 | ||
| Vietnamese | 76.77 | 26.67 | 14.81 | |
| Welsh | 50.51 | 20.00 | ||
| English | 83.84 | 20.00 | 22.22 | 46.67 |
| Average | 69.33 | 20.12 | 17.64 | 32.30 |
| Standard Deviation | 9.42 | 6.57 | 5.38 | 15.92 |
| Fleiss Kappa | 0.61 | 0.51 | 0.38 | 15.81 |
🔼 This table presents the performance of the Qwen2.5-Math-7B-Instruct model on the Multilingual Competition Level Math (MCLM) benchmark. For each of the 55 languages included in MCLM, the table shows the model’s accuracy scores on four different subsets of the benchmark: MT-MATH100, MT-AIME2024, M-IMO, and M-MO. These subsets represent different difficulty levels and question types within the benchmark. The table also provides the average accuracy across all languages, the standard deviation, and Fleiss’ kappa, a measure of inter-rater reliability. This provides a comprehensive assessment of the model’s multilingual performance.
read the caption
Table 22: Evaluation results of Qwen2.5-Math-7B-Instruct with greedy decoding on MCLM.
| ORM (K=2) | ORM (K=4) | ORM (K=8) | ||||
| Language | MT-MATH100 | MT-AIME2024 | MT-MATH100 | MT-AIME2024 | MT-MATH100 | MT-AIME2024 |
| Afrikaans | 74.75 | 16.67 | 73.74 | 26.67 | 76.77 | 33.33 |
| Albanian | 68.69 | 20.00 | 65.66 | 26.67 | 68.69 | 26.67 |
| Arabic | 76.77 | 13.33 | 82.83 | 23.33 | 83.84 | 20.00 |
| Bengali | 69.70 | 16.67 | 75.76 | 16.67 | 74.75 | 16.67 |
| Bulgarian | 73.74 | 16.67 | 77.78 | 20.00 | 79.80 | 16.67 |
| Catalan | 75.76 | 26.67 | 77.78 | 20.00 | 76.77 | 30.00 |
| Chinese_(Simplified) | 77.78 | 20.00 | 81.82 | 26.67 | 82.83 | 26.67 |
| Chinese_(Traditional) | 77.78 | 23.33 | 81.82 | 23.33 | 81.82 | 23.33 |
| Croatian | 75.76 | 30.00 | 78.79 | 33.33 | 78.79 | 33.33 |
| Czech | 75.76 | 20.00 | 81.82 | 23.33 | 81.82 | 23.33 |
| Danish | 73.74 | 26.67 | 72.73 | 43.33 | 74.75 | 43.33 |
| Dutch | 76.77 | 20.00 | 78.79 | 26.67 | 81.82 | 40.00 |
| Estonian | 62.63 | 16.67 | 64.65 | 23.33 | 65.66 | 30.00 |
| Finnish | 73.74 | 23.33 | 77.78 | 33.33 | 75.76 | 33.33 |
| French | 81.82 | 23.33 | 81.82 | 20.00 | 81.82 | 26.67 |
| German | 78.79 | 33.33 | 81.82 | 40.00 | 83.84 | 40.00 |
| Greek | 65.66 | 20.00 | 67.68 | 23.33 | 70.71 | 16.67 |
| Gujarati | 58.59 | 13.33 | 59.60 | 20.00 | 64.65 | 16.67 |
| Hebrew | 73.74 | 13.33 | 75.76 | 20.00 | 76.77 | 30.00 |
| Hindi | 70.71 | 26.67 | 75.76 | 26.67 | 75.76 | 36.67 |
| Hungarian | 73.74 | 26.67 | 76.77 | 20.00 | 76.77 | 23.33 |
| Indonesian | 75.76 | 30.00 | 76.77 | 33.33 | 77.78 | 43.33 |
| Italian | 79.80 | 26.67 | 79.80 | 26.67 | 82.83 | 33.33 |
| Japanese | 78.79 | 23.33 | 79.80 | 30.00 | 80.81 | 23.33 |
| Kannada | 55.56 | 13.33 | 57.58 | 13.33 | 59.60 | 20.00 |
| Korean | 79.80 | 16.67 | 76.77 | 23.33 | 77.78 | 26.67 |
| Latvian | 61.62 | 16.67 | 65.66 | 10.00 | 66.67 | 10.00 |
| Lithuanian | 63.64 | 20.00 | 68.69 | 30.00 | 69.70 | 20.00 |
| Macedonian | 76.77 | 16.67 | 80.81 | 20.00 | 79.80 | 23.33 |
| Malayalam | 59.60 | 10.00 | 62.63 | 16.67 | 68.69 | 23.33 |
| Marathi | 65.66 | 26.67 | 68.69 | 20.00 | 69.70 | 16.67 |
| Nepali | 64.65 | 13.33 | 69.70 | 16.67 | 68.69 | 16.67 |
| Norwegian | 72.73 | 26.67 | 74.75 | 30.00 | 76.77 | 33.33 |
| Persian | 76.77 | 23.33 | 75.76 | 23.33 | 76.77 | 16.67 |
| Polish | 77.78 | 10.00 | 78.79 | 10.00 | 78.79 | 16.67 |
| Portuguese | 81.82 | 26.67 | 80.81 | 36.67 | 83.84 | 40.00 |
| Punjabi | 58.59 | 20.00 | 59.60 | 16.67 | 62.63 | 26.67 |
| Romanian | 79.80 | 23.33 | 81.82 | 26.67 | 79.80 | 30.00 |
| Russian | 78.79 | 26.67 | 82.83 | 20.00 | 86.87 | 26.67 |
| Slovak | 77.78 | 30.00 | 79.80 | 33.33 | 81.82 | 30.00 |
| Slovenian | 73.74 | 13.33 | 78.79 | 20.00 | 78.79 | 23.33 |
| Somali | 38.38 | 6.67 | 42.42 | 13.33 | 44.44 | 20.00 |
| Spanish | 75.76 | 26.67 | 78.79 | 26.67 | 81.82 | 30.00 |
| Swahili | 48.48 | 13.33 | 49.49 | 20.00 | 51.52 | 23.33 |
| Swedish | 77.78 | 30.00 | 76.77 | 30.00 | 77.78 | 30.00 |
| Tagalog | 58.59 | 13.33 | 65.66 | 10.00 | 66.67 | 16.67 |
| Tamil | 59.60 | 16.67 | 65.66 | 10.00 | 62.63 | 10.00 |
| Telugu | 61.62 | 20.00 | 63.64 | 23.33 | 62.63 | 16.67 |
| Thai | 76.77 | 16.67 | 79.80 | 23.33 | 77.78 | 30.00 |
| Turkish | 76.77 | 26.67 | 79.80 | 26.67 | 79.80 | 26.67 |
| Ukrainian | 77.78 | 23.33 | 78.79 | 23.33 | 79.80 | 26.67 |
| Urdu | 66.67 | 33.33 | 67.68 | 30.00 | 72.73 | 30.00 |
| Vietnamese | 73.74 | 33.33 | 76.77 | 33.33 | 80.81 | 36.67 |
| Welsh | 51.52 | 20.00 | 53.54 | 16.67 | 56.57 | 6.67 |
| English | 84.85 | 26.67 | 84.85 | 30.00 | 86.87 | 26.67 |
| Average | 70.98 | 21.21 | 73.35 | 23.82 | 74.62 | 25.76 |
| Standard Deviation | 9.46 | 6.52 | 9.20 | 7.41 | 8.86 | 8.37 |
| Fleiss’ Kappa | 0.62 | 0.55 | 0.65 | 0.57 | 0.67 | 0.57 |
🔼 This table presents the performance of the Qwen2.5-Math-7B-Instruct model on the MT-MATH100 and MT-AIME2024 datasets using the Outcome Reward Modeling (ORM) method with different numbers of generated responses (K=2, 4, 8). It shows the average accuracy, standard deviation, and Fleiss’ Kappa scores for each model variant and dataset, providing insights into the model’s performance and consistency across multiple attempts and languages.
read the caption
Table 23: Evaluation results of Qwen2.5-Math-7B-Instruct with Best-of-N (K=2,4,8)𝐾248(K=2,4,8)( italic_K = 2 , 4 , 8 ) using Qwen2.5-Math-RM-72B as ORM on MT-MATH100 and MT-AIME2024.
| PRM (S=3, c=3) | PRM (S=4, c=5) | PRM (S=5, c=8) | ||||
| Language | MT-MATH100 | MT-AIME2024 | MT-MATH100 | MT-AIME2024 | MT-MATH100 | MT-AIME2024 |
| Afrikaans | 70.71 | 20.00 | 70.71 | 16.67 | 70.71 | 20.00 |
| Albanian | 60.61 | 16.67 | 62.63 | 33.33 | 61.62 | 26.67 |
| Arabic | 65.66 | 26.67 | 78.79 | 26.67 | 82.83 | 30.00 |
| Bengali | 67.68 | 16.67 | 70.71 | 10.00 | 68.69 | 23.33 |
| Bulgarian | 69.70 | 20.00 | 74.75 | 10.00 | 75.76 | 30.00 |
| Catalan | 72.73 | 16.67 | 70.71 | 20.00 | 71.72 | 16.67 |
| Chinese (Simplified) | 72.73 | 16.67 | 73.74 | 33.33 | 78.79 | 30.00 |
| Chinese (Traditional) | 71.72 | 16.67 | 76.77 | 20.00 | 77.78 | 23.33 |
| Croatian | 69.70 | 20.00 | 72.73 | 16.67 | 70.71 | 33.33 |
| Czech | 69.70 | 16.67 | 77.78 | 10.00 | 73.74 | 30.00 |
| Danish | 63.64 | 23.33 | 69.70 | 33.33 | 66.67 | 30.00 |
| Dutch | 71.72 | 6.67 | 72.73 | 26.67 | 75.76 | 26.67 |
| Estonian | 46.46 | 20.00 | 51.52 | 13.33 | 59.60 | 20.00 |
| Finnish | 64.65 | 16.67 | 66.67 | 13.33 | 72.73 | 33.33 |
| French | 73.74 | 20.00 | 72.73 | 16.67 | 76.77 | 26.67 |
| German | 73.74 | 10.00 | 68.69 | 10.00 | 76.77 | 26.67 |
| Greek | 63.64 | 16.67 | 64.65 | 13.33 | 67.68 | 13.33 |
| Gujarati | 56.57 | 13.33 | 56.57 | 26.67 | 55.56 | 13.33 |
| Hebrew | 66.67 | 10.00 | 68.69 | 20.00 | 75.76 | 26.67 |
| Hindi | 58.59 | 16.67 | 63.64 | 20.00 | 72.73 | 13.33 |
| Hungarian | 68.69 | 16.67 | 69.70 | 30.00 | 72.73 | 20.00 |
| Indonesian | 69.70 | 26.67 | 68.69 | 20.00 | 72.73 | 10.00 |
| Italian | 71.72 | 16.67 | 77.78 | 30.00 | 73.74 | 23.33 |
| Japanese | 71.72 | 23.33 | 75.76 | 16.67 | 76.77 | 13.33 |
| Kannada | 46.46 | 16.67 | 53.54 | 10.00 | 54.55 | 16.67 |
| Korean | 69.70 | 16.67 | 72.73 | 13.33 | 74.75 | 16.67 |
| Latvian | 59.60 | 10.00 | 63.64 | 13.33 | 63.64 | 16.67 |
| Lithuanian | 55.56 | 20.00 | 62.63 | 13.33 | 65.66 | 16.67 |
| Macedonian | 69.70 | 16.67 | 75.76 | 16.67 | 75.76 | 23.33 |
| Malayalam | 49.49 | 20.00 | 57.58 | 23.33 | 52.53 | 20.00 |
| Marathi | 56.57 | 20.00 | 55.56 | 23.33 | 57.58 | 23.33 |
| Nepali | 51.52 | 16.67 | 61.62 | 20.00 | 52.53 | 23.33 |
| Norwegian | 69.70 | 20.00 | 67.68 | 20.00 | 69.70 | 26.67 |
| Persian | 71.72 | 26.67 | 71.72 | 16.67 | 72.73 | 23.33 |
| Polish | 61.62 | 13.33 | 67.68 | 13.33 | 76.77 | 10.00 |
| Portuguese | 72.73 | 10.00 | 71.72 | 26.67 | 79.80 | 26.67 |
| Punjabi | 46.46 | 13.33 | 45.45 | 10.00 | 52.53 | 20.00 |
| Romanian | 66.67 | 13.33 | 70.71 | 33.33 | 77.78 | 30.00 |
| Russian | 75.76 | 16.67 | 76.77 | 16.67 | 76.77 | 33.33 |
| Slovak | 70.71 | 23.33 | 75.76 | 26.67 | 70.71 | 13.33 |
| Slovenian | 70.71 | 23.33 | 72.73 | 30.00 | 74.75 | 20.00 |
| Somali | 40.40 | 3.33 | 42.42 | 10.00 | 42.42 | 6.67 |
| Spanish | 71.72 | 13.33 | 77.78 | 20.00 | 80.81 | 23.33 |
| Swahili | 48.48 | 6.67 | 42.42 | 10.00 | 44.44 | 16.67 |
| Swedish | 70.71 | 16.67 | 76.77 | 36.67 | 71.72 | 26.67 |
| Tagalog | 55.56 | 23.33 | 59.60 | 16.67 | 58.59 | 13.33 |
| Tamil | 50.51 | 10.00 | 55.56 | 3.33 | 57.58 | 20.00 |
| Telugu | 53.54 | 13.33 | 58.59 | 20.00 | 54.55 | 20.00 |
| Thai | 67.68 | 10.00 | 71.72 | 16.67 | 71.72 | 26.67 |
| Turkish | 63.64 | 20.00 | 71.72 | 20.00 | 64.65 | 16.67 |
| Ukrainian | 75.76 | 20.00 | 77.78 | 26.67 | 79.80 | 20.00 |
| Urdu | 57.58 | 26.67 | 62.63 | 20.00 | 66.67 | 23.33 |
| Vietnamese | 72.73 | 23.33 | 73.74 | 13.33 | 73.74 | 33.33 |
| Welsh | 50.51 | 20.00 | 43.43 | 13.33 | 45.45 | 20.00 |
| English | 73.74 | 23.33 | 75.76 | 20.00 | 75.76 | 23.33 |
| Average | 64.17 | 17.27 | 67.09 | 19.27 | 68.45 | 22.00 |
| Standard Deviation | 9.25 | 5.33 | 9.65 | 7.61 | 10.02 | 6.56 |
| Fleiss’ Kappa | 0.56 | 0.56 | 0.54 | 0.57 | 0.56 | 0.59 |
🔼 This table presents the performance of the Qwen2.5-Math-7B-Instruct model on the MT-MATH100 and MT-AIME2024 subsets of the MCLM benchmark when employing the Qwen2.5-Math-PRM-72B model as a process reward model (PRM). It shows the average accuracy, standard deviation, and Fleiss’ Kappa scores for each dataset. The table displays the results for various process reward modeling configurations which control the number of generation steps (S) and candidate continuations (c) to explore and balance the trade-off between reasoning capacity and computational cost.
read the caption
Table 24: Evaluation results of Qwen2.5-Math-7B-Instruct using Qwen2.5-Math-PRM-72B as PRM on MT-MATH100 and MT-AIME2024.
| Language | MT-MATH100 | MT-AIME2024 | M-IMO | M-MO |
| Afrikaans | 73.74 | 23.33 | 9.09 | |
| Albanian | 66.67 | 20.00 | 15.38 | |
| Arabic | 71.72 | 16.67 | 3.70 | |
| Bengali | 64.65 | 3.33 | ||
| Bulgarian | 72.73 | 20.00 | 18.52 | |
| Catalan | 70.71 | 26.67 | ||
| Chinese (Simplified) | 70.71 | 23.33 | 14.81 | |
| Chinese (Traditional) | 69.70 | 23.33 | 11.11 | 26.67 |
| Croatian | 72.73 | 16.67 | 18.52 | |
| Czech | 71.72 | 33.33 | 11.11 | 36.67 |
| Danish | 71.72 | 23.33 | 22.22 | |
| Dutch | 69.70 | 20.00 | 3.70 | 3.33 |
| Estonian | 76.77 | 16.67 | 15.38 | |
| Finnish | 72.73 | 6.67 | 15.38 | |
| French | 70.71 | 23.33 | 14.81 | 48.39 |
| German | 73.74 | 20.00 | 18.52 | 26.67 |
| Greek | 71.72 | 10.00 | 13.04 | |
| Gujarati | 67.68 | 13.33 | ||
| Hebrew | 71.72 | 10.00 | 7.41 | |
| Hindi | 70.71 | 6.67 | ||
| Hungarian | 73.74 | 26.67 | 11.54 | |
| Indonesian | 68.69 | 13.33 | 16.67 | |
| Italian | 72.73 | 23.33 | 11.54 | |
| Japanese | 70.71 | 30.00 | 7.69 | 7.14 |
| Kannada | 61.62 | 23.33 | ||
| Korean | 72.73 | 26.67 | 22.22 | 36.67 |
| Latvian | 69.70 | 20.00 | 7.69 | |
| Lithuanian | 68.69 | 16.67 | 7.41 | |
| Macedonian | 71.72 | 20.00 | 22.22 | |
| Malayalam | 62.63 | 23.33 | ||
| Marathi | 63.64 | 20.00 | ||
| Nepali | 67.68 | 10.00 | ||
| Norwegian | 75.76 | 30.00 | 11.11 | |
| Persian | 66.67 | 26.67 | ||
| Polish | 72.73 | 13.33 | 22.22 | 26.67 |
| Portuguese | 70.71 | 26.67 | 7.69 | |
| Punjabi | 69.70 | 16.67 | ||
| Romanian | 73.74 | 26.67 | 11.11 | |
| Russian | 73.74 | 23.33 | 15.38 | 50.00 |
| Slovak | 72.73 | 20.00 | 18.52 | |
| Slovenian | 72.73 | 16.67 | 7.41 | |
| Somali | 57.58 | 20.00 | ||
| Spanish | 71.72 | 26.67 | 14.81 | |
| Swahili | 65.66 | 23.33 | ||
| Swedish | 72.73 | 23.33 | 23.08 | |
| Tagalog | 71.72 | 20.00 | ||
| Tamil | 67.68 | 20.00 | ||
| Telugu | 66.67 | 16.67 | ||
| Thai | 70.71 | 26.67 | 7.41 | |
| Turkish | 71.72 | 10.00 | 11.11 | |
| Ukrainian | 73.74 | 23.33 | 14.81 | |
| Urdu | 68.69 | 23.33 | ||
| Vietnamese | 71.72 | 6.67 | 14.81 | |
| Welsh | 65.66 | 26.67 | ||
| English | 75.76 | 33.33 | 7.41 | 50.00 |
| Average | 70.30 | 20.18 | 13.33 | 30.81 |
| Standard Deviation | 3.68 | 6.83 | 5.36 | 15.80 |
| Fleiss’ Kappa | 0.71 | 0.33 | 0.25 |
🔼 This table presents the performance of the GPT-4-mini language model on the Multilingual Competition Level Math (MCLM) benchmark. The results are obtained using greedy decoding, which means the model generates its response without any additional test-time scaling or refinement strategies. The table displays the accuracy scores for the model across four subsets of MCLM: MT-MATH100, MT-AIME2024, M-IMO, and M-MO, along with overall average performance, standard deviation, and Fleiss’ Kappa score. Each row in the table represents a different language included in the MCLM benchmark, allowing for the analysis of the model’s performance across diverse languages and problem types. The Fleiss’ Kappa score is a measure of inter-rater reliability in this case reflecting the consistency of model performance across languages.
read the caption
Table 25: Evaluation results of gpt-4o-mini with greedy decoding on MCLM.
| Language | MT-MATH100 | MT-AIME2024 | M-IMO | M-MO |
| Afrikaans | 85.86 | 46.67 | 33.33 | |
| Albanian | 86.87 | 53.33 | 28.00 | |
| Arabic | 86.87 | 43.33 | 22.22 | |
| Bengali | 86.87 | 43.33 | ||
| Bulgarian | 87.88 | 46.67 | 40.74 | |
| Catalan | 87.88 | 53.33 | ||
| Chinese (Simplified) | 85.86 | 50 | 25.93 | |
| Chinese (Traditional) | 84.85 | 40 | 29.63 | 66.67 |
| Croatian | 84.85 | 46.67 | 33.33 | |
| Czech | 84.85 | 36.67 | 29.63 | 53.33 |
| Danish | 85.86 | 40 | 40.74 | |
| Dutch | 86.87 | 50 | 33.33 | 40.00 |
| Estonian | 83.84 | 50 | 28.00 | |
| Finnish | 84.85 | 40 | 28.00 | |
| French | 86.87 | 43.33 | 29.63 | 67.74 |
| German | 86.87 | 43.33 | 33.33 | 43.33 |
| Greek | 87.88 | 56.67 | 21.05 | |
| Gujarati | 83.84 | 46.67 | ||
| Hebrew | 81.82 | 40 | 7.41 | |
| Hindi | 83.84 | 43.33 | ||
| Hungarian | 86.87 | 53.33 | 28.00 | |
| Indonesian | 84.85 | 43.33 | 33.33 | |
| Italian | 82.83 | 50 | 36.00 | |
| Japanese | 86.87 | 50 | 16.00 | 17.86 |
| Kannada | 86.87 | 43.33 | ||
| Korean | 77.78 | 46.67 | 25.93 | 60.00 |
| Latvian | 87.88 | 46.67 | 32.00 | |
| Lithuanian | 85.86 | 46.67 | 33.33 | |
| Macedonian | 83.84 | 43.33 | 33.33 | |
| Malayalam | 85.86 | 46.67 | ||
| Marathi | 83.84 | 36.67 | ||
| Nepali | 79.8 | 46.67 | ||
| Norwegian | 82.83 | 53.33 | 22.22 | |
| Persian | 87.88 | 53.33 | ||
| Polish | 81.82 | 43.33 | 37.04 | 40.00 |
| Portuguese | 82.83 | 36.67 | 36.00 | |
| Punjabi | 87.88 | 43.33 | ||
| Romanian | 81.82 | 40 | 40.74 | |
| Russian | 85.86 | 56.67 | 20.00 | 50.00 |
| Slovak | 87.88 | 46.67 | 33.33 | 46.67 |
| Slovenian | 85.86 | 46.67 | 29.63 | |
| Somali | 87.88 | 50 | ||
| Spanish | 72.73 | 50 | 29.63 | |
| Swahili | 86.87 | 43.33 | ||
| Swedish | 79.8 | 43.33 | 28.00 | |
| Tagalog | 85.86 | 46.67 | ||
| Tamil | 84.85 | 43.33 | ||
| Telugu | 82.83 | 33.33 | ||
| Thai | 84.85 | 40 | 22.22 | |
| Turkish | 84.85 | 40 | 33.33 | |
| Ukrainian | 84.85 | 50 | 29.63 | |
| Urdu | 84.85 | 36.67 | ||
| Vietnamese | 85.86 | 46.67 | 37.04 | |
| Welsh | 85.86 | 46.67 | ||
| English | 83.84 | 36.67 | 29.63 | 80.00 |
| Average | 84.89 | 45.33 | 29.75 | 51.42 |
| Standard Deviation | 2.80 | 5.35 | 6.86 | 16.94 |
| Fleiss’ Kappa | 0.88 | 0.73 | 0.44 |
🔼 This table presents the performance of the o3-mini model on the Multilingual Competition Level Math (MCLM) benchmark. It shows the accuracy of the model for each of the four subsets of the MCLM benchmark (MT-MATH100, MT-AIME2024, M-IMO, and M-MO), broken down by language. The table also includes the average performance across all languages, the standard deviation, and Fleiss’ kappa, a measure of inter-annotator agreement, reflecting the consistency of the model’s performance across different languages.
read the caption
Table 26: Evaluation results of o3-mini with greedy decoding on MCLM.
Full paper#