TL;DR#
Traditional recommendation systems use a multi-stage approach: retrieving potential items then ranking them. Generative retrieval-based recommendation systems (GRs) directly generate items, but haven’t matched the accuracy of multi-stage systems. This paper tackles the challenge of creating a single model that can handle item recommendations effectively.
The paper introduces OneRec, an end-to-end generative framework. OneRec replaces the traditional cascaded learning with a unified generative model, which includes an encoder-decoder structure and an iterative preference alignment module. The method surpasses current complex recommendation systems, showing a substantial improvement in a real-world short video platform.
Key Takeaways#
Why does it matter?#
This paper introduces a novel generative recommendation framework, paving the way for more effective and personalized content delivery. It offers new insights for building end-to-end recommendation systems and preference learning, inspiring future work to explore generative models for various real-world applications and user experience enhancements.
Visual Insights#

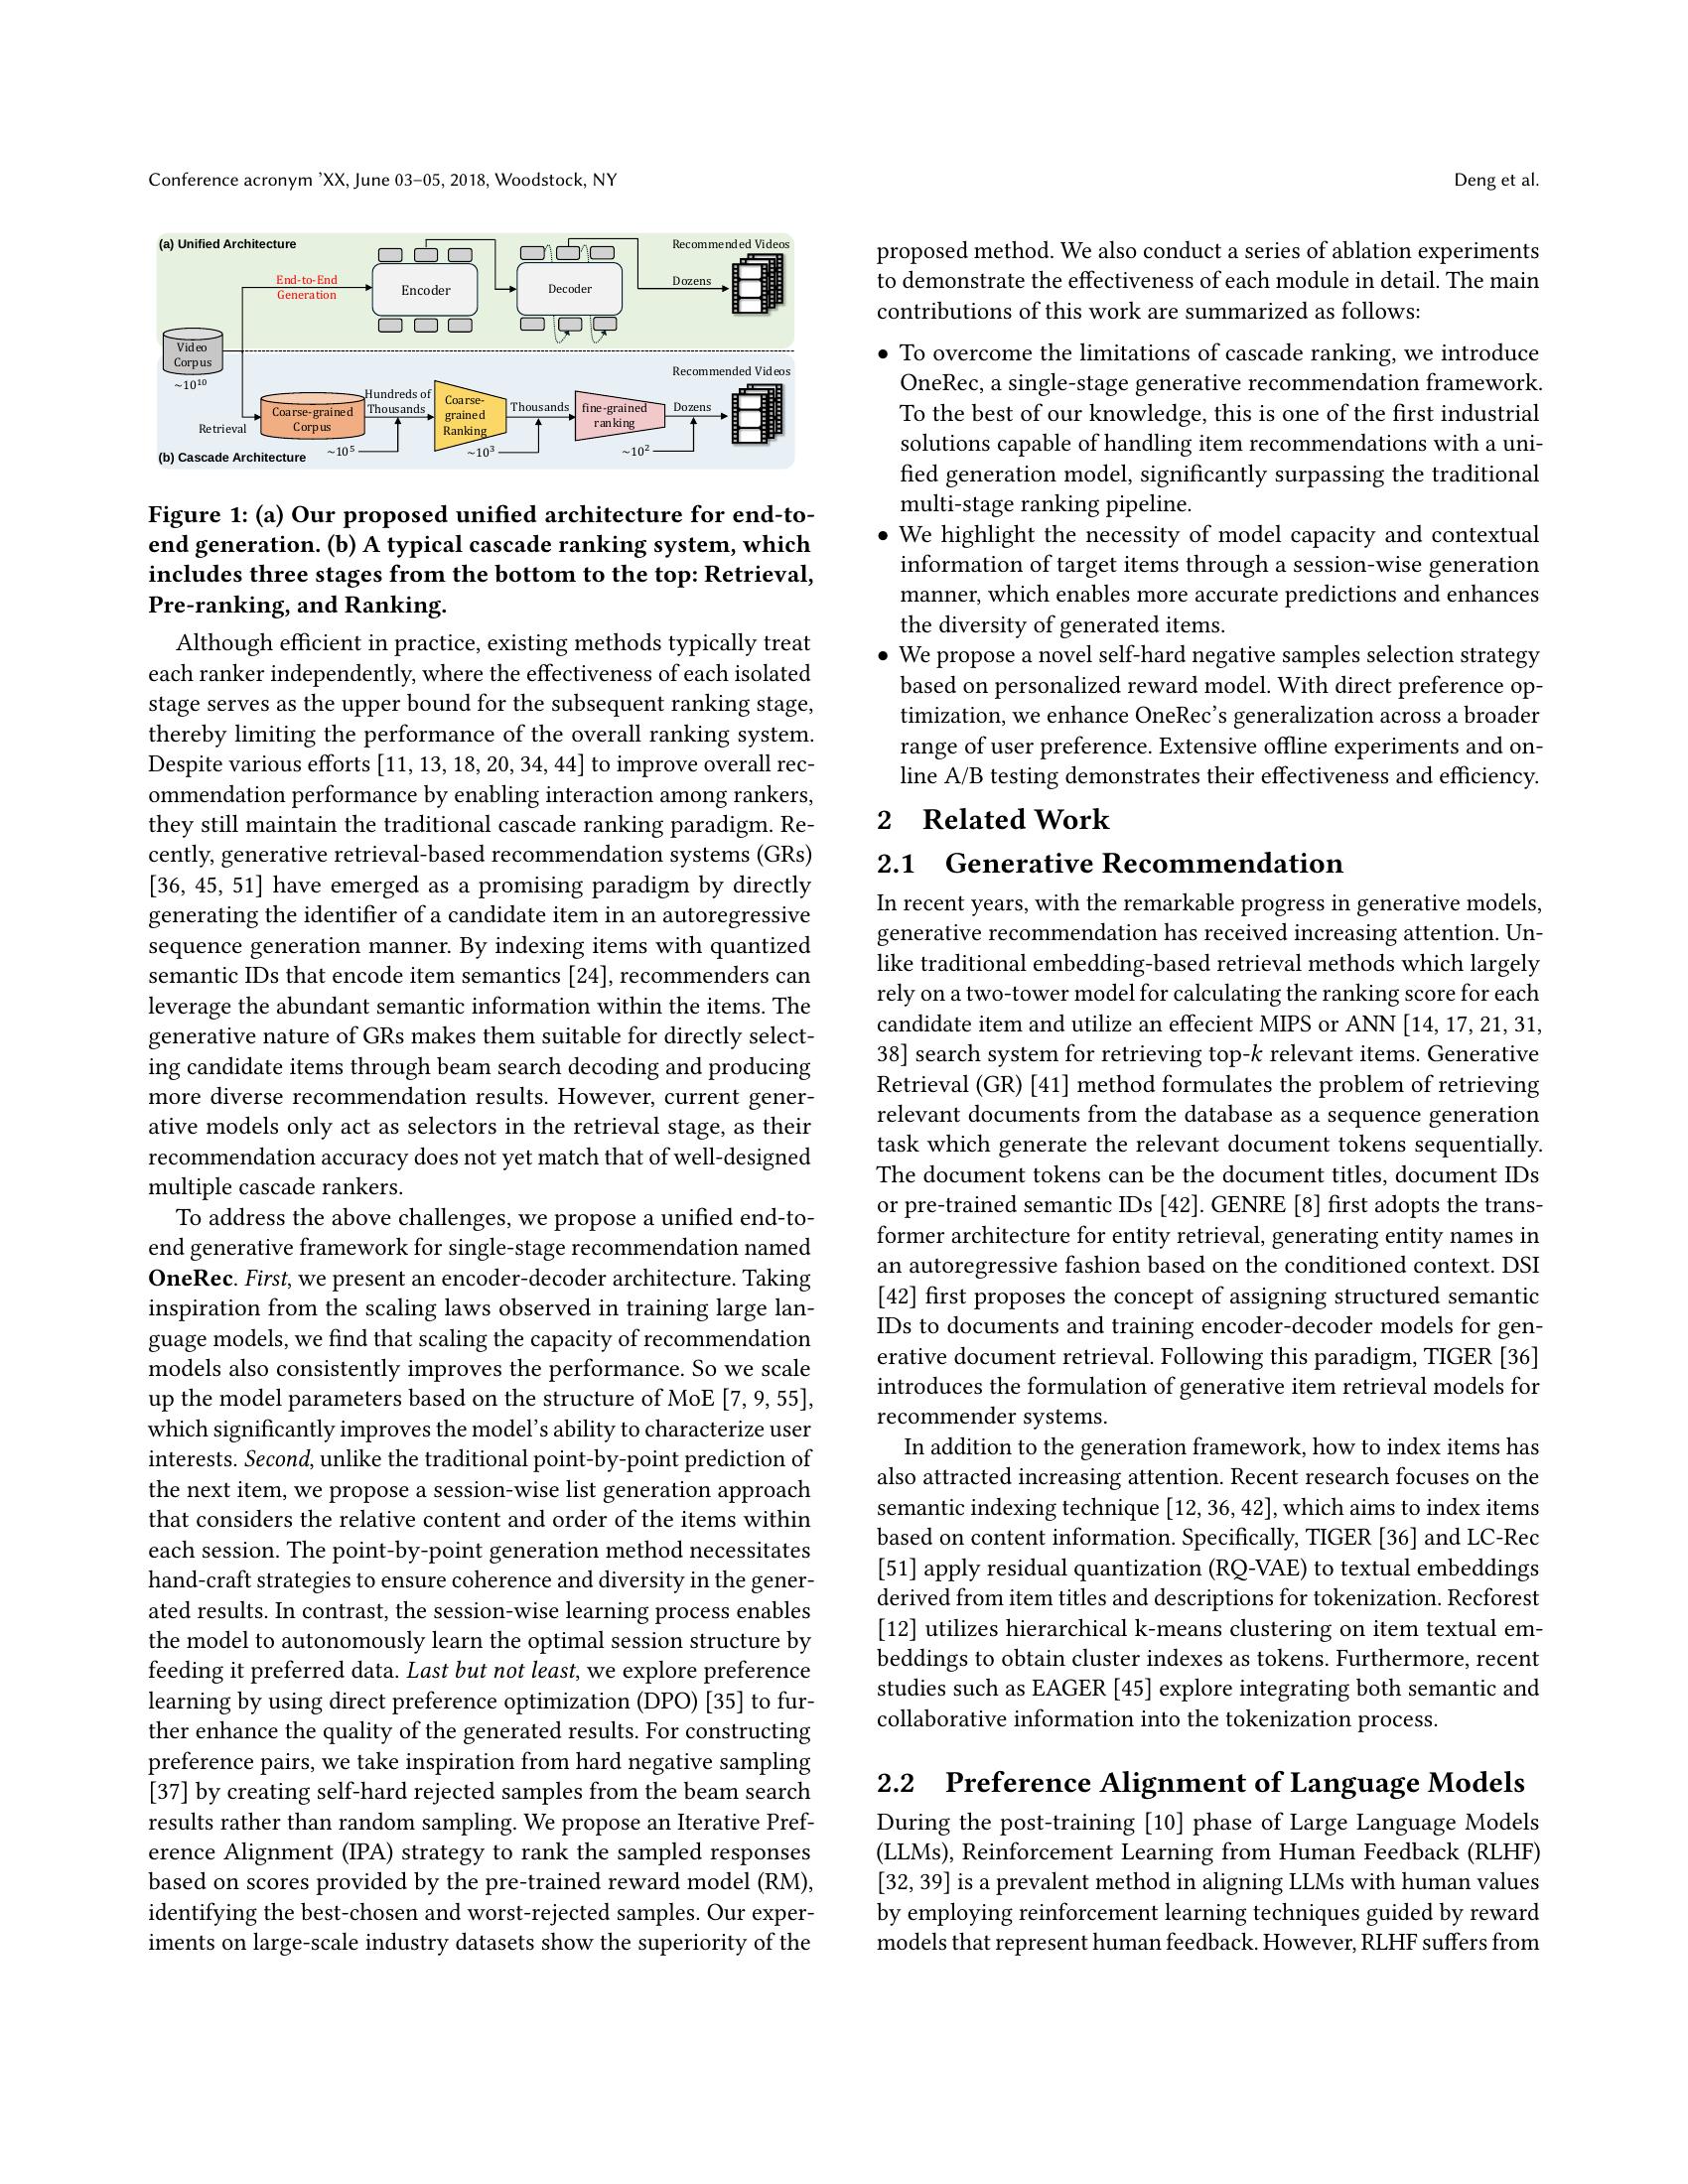
🔼 Figure 1 illustrates two different recommendation system architectures. (a) shows the proposed OneRec model, which is a unified end-to-end architecture for generating recommendations. This model directly generates a list of recommended items, unlike traditional systems. (b) depicts a typical cascade ranking system, which uses a three-stage pipeline: Retrieval (identifying a large set of candidates), Pre-ranking (filtering the candidates to a smaller subset), and Ranking (ordering the remaining candidates). This figure visually contrasts the simplicity and directness of OneRec with the complexity of the traditional approach.
read the caption
Figure 1. (a) Our proposed unified architecture for end-to-end generation. (b) A typical cascade ranking system, which includes three stages from the bottom to the top: Retrieval, Pre-ranking, and Ranking.
| Model | Watching-Time Metrics | Interaction Metrics | ||||||
|---|---|---|---|---|---|---|---|---|
| swt | vtr | wtr | ltr | |||||
| mean | max | mean | max | mean | max | mean | max | |
| Pointwise Discriminative Method | ||||||||
| \cdashline1-9 SASRec | 0.03750.002 | 0.08030.005 | 0.43130.013 | 0.58010.013 | 0.002940.001 | 0.009780.001 | 0.03140.002 | 0.06040.004 |
| BERT4Rec | 0.03360.002 | 0.07060.004 | 0.41920.014 | 0.56330.013 | 0.002810.001 | 0.009320.001 | 0.03160.002 | 0.06060.004 |
| FDSA | 0.03250.002 | 0.06830.005 | 0.41450.015 | 0.55880.014 | 0.002710.001 | 0.009210.001 | 0.03130.002 | 0.06040.003 |
| \cdashline1-9 Pointwise Generative Method | ||||||||
| \cdashline1-9 TIGER-0.1B | 0.08790.007 | 0.12860.010 | 0.58260.016 | 0.66250.017 | 0.002770.001 | 0.006710.001 | 0.03160.004 | 0.05410.007 |
| TIGER-1B | 0.08730.006 | 0.13680.010 | 0.58270.015 | 0.67760.015 | 0.002920.001 | 0.007580.001 | 0.03230.004 | 0.05790.008 |
| \cdashline1-9 Listwise Generative Method | ||||||||
| \cdashline1-9 OneRec-0.1B | 0.09730.010 | 0.15010.015 | 0.60010.021 | 0.69810.021 | 0.003260.001 | 0.008700.001 | 0.03490.009 | 0.06420.015 |
| OneRec-1B | 0.09910.008 | 0.15290.012 | 0.60390.020 | 0.70130.020 | 0.003490.001 | 0.009190.002 | 0.03600.005 | 0.06600.008 |
| \cdashline1-9 Listwise Generative Method with Preference Alignment | ||||||||
| \cdashline1-9 OneRec-1BDPO | 0.10140.010 | 0.15950.015 | 0.61270.017 | 0.71160.016 | 0.003390.001 | 0.008960.001 | 0.03510.004 | 0.06440.008 |
| OneRec-1BIPO | 0.09790.003 | 0.15280.005 | 0.60000.007 | 0.70120.007 | 0.003350.001 | 0.009050.001 | 0.03500.003 | 0.06540.004 |
| OneRec-1BcDPO | 0.09930.006 | 0.15470.008 | 0.60300.011 | 0.70300.009 | 0.003390.001 | 0.009010.001 | 0.03550.006 | 0.06520.009 |
| OneRec-1BrDPO | 0.10050.006 | 0.15550.008 | 0.60710.014 | 0.70590.011 | 0.003390.001 | 0.008990.001 | 0.03570.004 | 0.06570.006 |
| OneRec-1BCPO | 0.09930.008 | 0.15380.012 | 0.60450.021 | 0.70290.018 | 0.003430.001 | 0.009110.002 | 0.03570.008 | 0.06590.014 |
| OneRec-1BsimPO | 0.09950.008 | 0.15360.013 | 0.60470.016 | 0.70220.015 | 0.003490.001 | 0.009180.001 | 0.03600.005 | 0.06590.008 |
| OneRec-1BS-DPO | 0.10210.008 | 0.15750.013 | 0.60960.016 | 0.70700.015 | 0.003450.001 | 0.009090.001 | 0.03610.004 | 0.06590.008 |
| \cdashline1-9 OneRec-1BIPA | 0.10250.009 | 0.19330.017 | 0.61410.020 | 0.76460.021 | 0.003540.001 | 0.009920.001 | 0.03970.004 | 0.12030.010 |
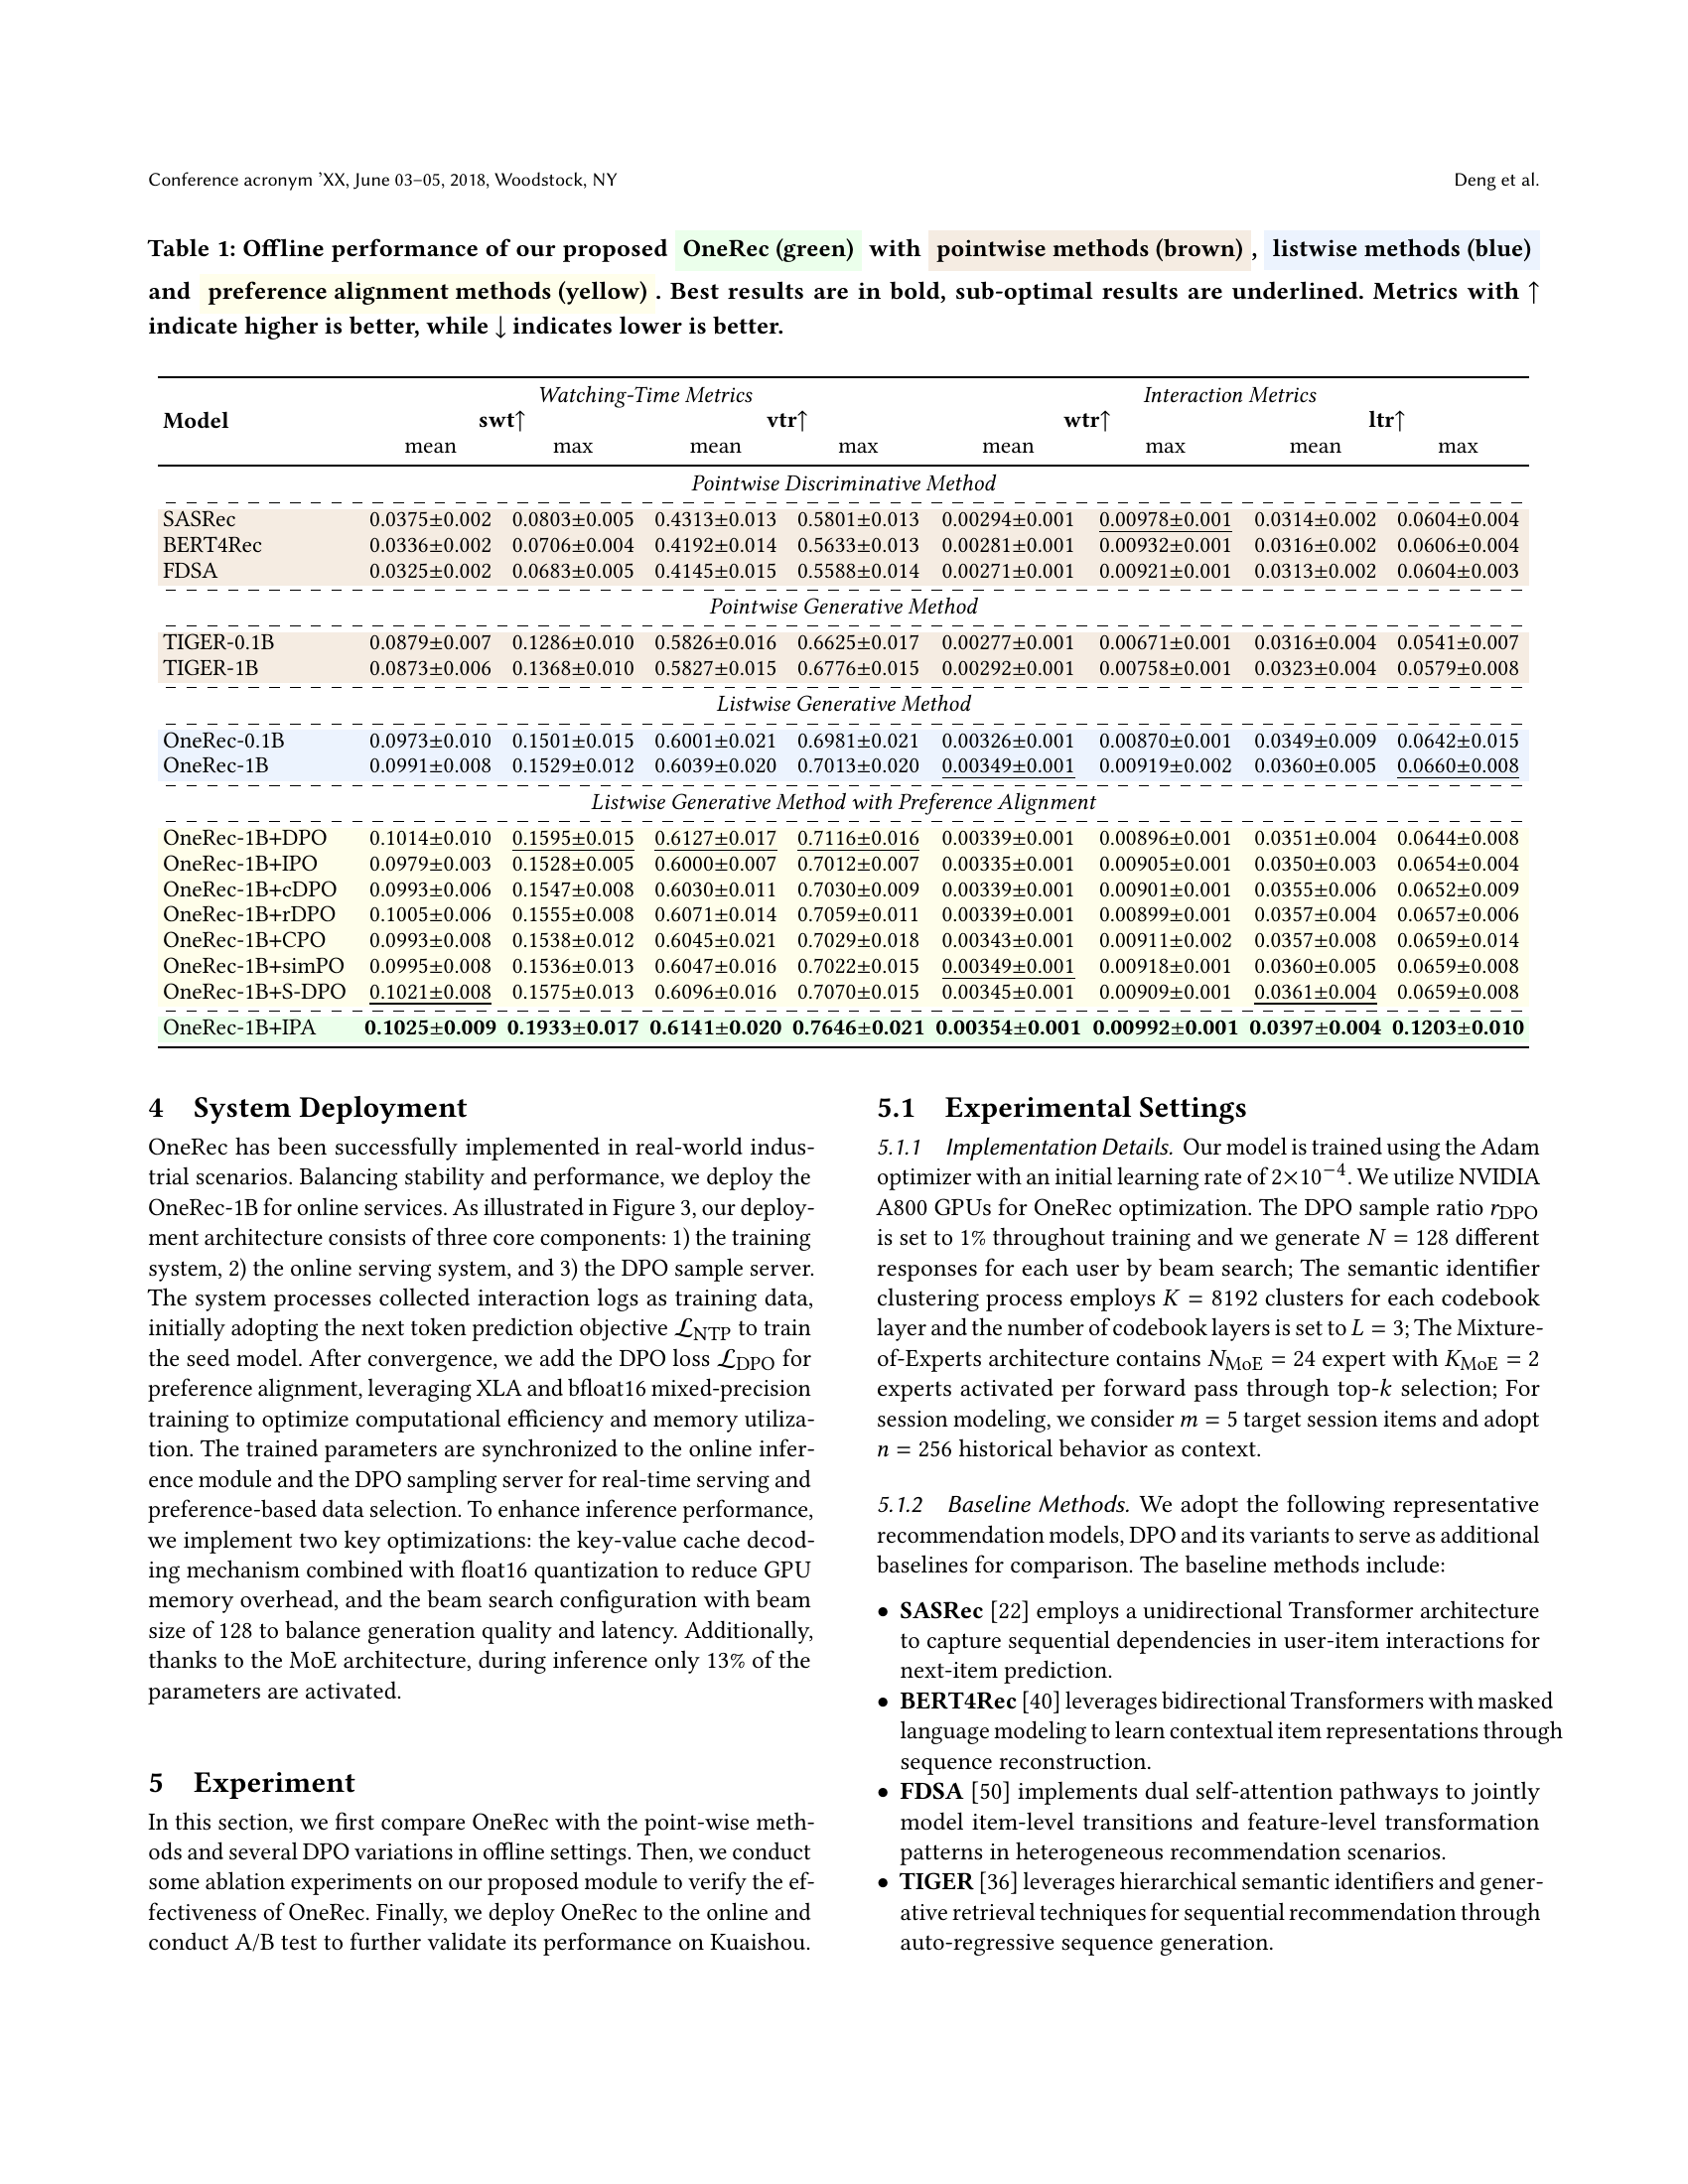
🔼 This table presents a comparison of the offline performance of the proposed OneRec model against various baseline methods. These baselines are categorized into pointwise methods, listwise methods, and preference alignment methods, each representing different approaches to recommendation. The OneRec model is highlighted in green, pointwise methods in brown, listwise methods in blue, and preference alignment methods in yellow. The best performance for each metric is shown in bold, while near-optimal results are underlined. Metrics are evaluated according to whether a higher or lower value is preferable, indicated by arrows (↑ for higher is better, ↓ for lower is better). The metrics used assess both watching time (e.g., total watch time) and user interaction (e.g., likes, follows).
read the caption
Table 1. Offline performance of our proposed OneRec (green) with pointwise methods (brown), listwise methods (blue) and preference alignment methods (yellow). Best results are in bold, sub-optimal results are underlined. Metrics with ↑↑\uparrow↑ indicate higher is better, while ↓↓\downarrow↓ indicates lower is better.
In-depth insights#
Generative Rec#
Generative recommendation (GR) systems represent a paradigm shift, moving away from traditional methods that rely on two-tower models and nearest neighbor searches. GR directly generates item identifiers in an autoregressive manner, leveraging semantic IDs to encode item information. This approach harnesses the power of sequence generation, enabling the model to produce more diverse and contextually relevant recommendations. However, GR models have limitations in accuracy compared to cascade ranking. Addressing these limitations is crucial for realizing the full potential of GR in real-world recommendation scenarios, requiring innovations in model architecture, training strategies, and integration with existing ranking pipelines. Future research can address the challenges by exploring novel techniques to improve the accuracy, diversity, and scalability of generative recommendation systems. These advancements can potentially lead to a new generation of recommenders.
OneRec Model#
The OneRec model introduces a unified approach to recommendation, replacing traditional cascaded systems with a single generative framework. This shift aims to overcome limitations where each stage’s effectiveness caps the subsequent one. OneRec leverages an encoder-decoder structure, capturing user history to predict item interest. A key innovation is the use of sparse Mixture-of-Experts (MoE), scaling capacity without proportional FLOPs increase. The model adopts a session-wise generation approach, predicting item lists for contextual coherence, contrasting point-by-point methods. An Iterative Preference Alignment (IPA) module, combined with Direct Preference Optimization (DPO), enhances generated content quality. IPA tackles sparse user-item data by using a reward model to simulate user generation, customizing sampling based on online learning attributes, thus aligning recommendations with user preferences efficiently.
Iterative Align#
Iterative alignment, in the context of recommendation systems, represents a crucial strategy for refining model behavior to better reflect user preferences. This process involves repeatedly adjusting the model’s parameters based on feedback, aiming to minimize the discrepancy between predicted and desired outcomes. Such alignment often leverages techniques like reinforcement learning or preference optimization, where the model learns from user interactions or explicit feedback signals to iteratively improve its recommendations. The iterative nature allows the model to adapt to evolving user tastes and preferences, ensuring long-term relevance and satisfaction. By continuously refining its understanding of user needs, the system becomes more adept at delivering personalized and engaging content.
Offline vs Online#
The distinction between offline and online methodologies is crucial in evaluating recommender systems. Offline evaluation allows for controlled experimentation and rapid iteration using historical data, enabling the assessment of various models and hyperparameter tuning. However, it often suffers from a disconnect from real-world user behavior, as it cannot capture the dynamic nature of user preferences and the impact of the recommendation system itself on user interactions. Online A/B testing, on the other hand, provides a more realistic assessment by deploying the system to a subset of real users and measuring its impact on key metrics such as click-through rate, conversion rate, and user engagement. While online testing offers higher fidelity, it is often more expensive and time-consuming, and may be subject to confounding factors such as seasonality and external events. Therefore, a balanced approach that combines offline and online evaluation is often the most effective strategy for developing and deploying successful recommender systems.
Scaling OneRec#
Based on the text, it seems scaling the OneRec model leads to significant and consistent accuracy gains. The experiments reveal that expanding OneRec from 0.05B to 1B parameters demonstrably improves performance, showcasing the benefits of larger model capacity. OneRec-0.1B shows a maximum accuracy gain of 14.45%, when compared to the OneRec-0.05B model. Further scaling to 0.2B, 0.5B, and 1B continues to produce accuracy gains of 5.09%, 5.70%, and 5.69% respectively. This suggests that the OneRec architecture effectively leverages increased model size, indicating a well-designed framework capable of capturing complex user preferences and item relationships. It’s likely that with more parameters, the model becomes more adept at discerning subtle patterns and contextual nuances, leading to more relevant and accurate recommendations.
More visual insights#
More on figures

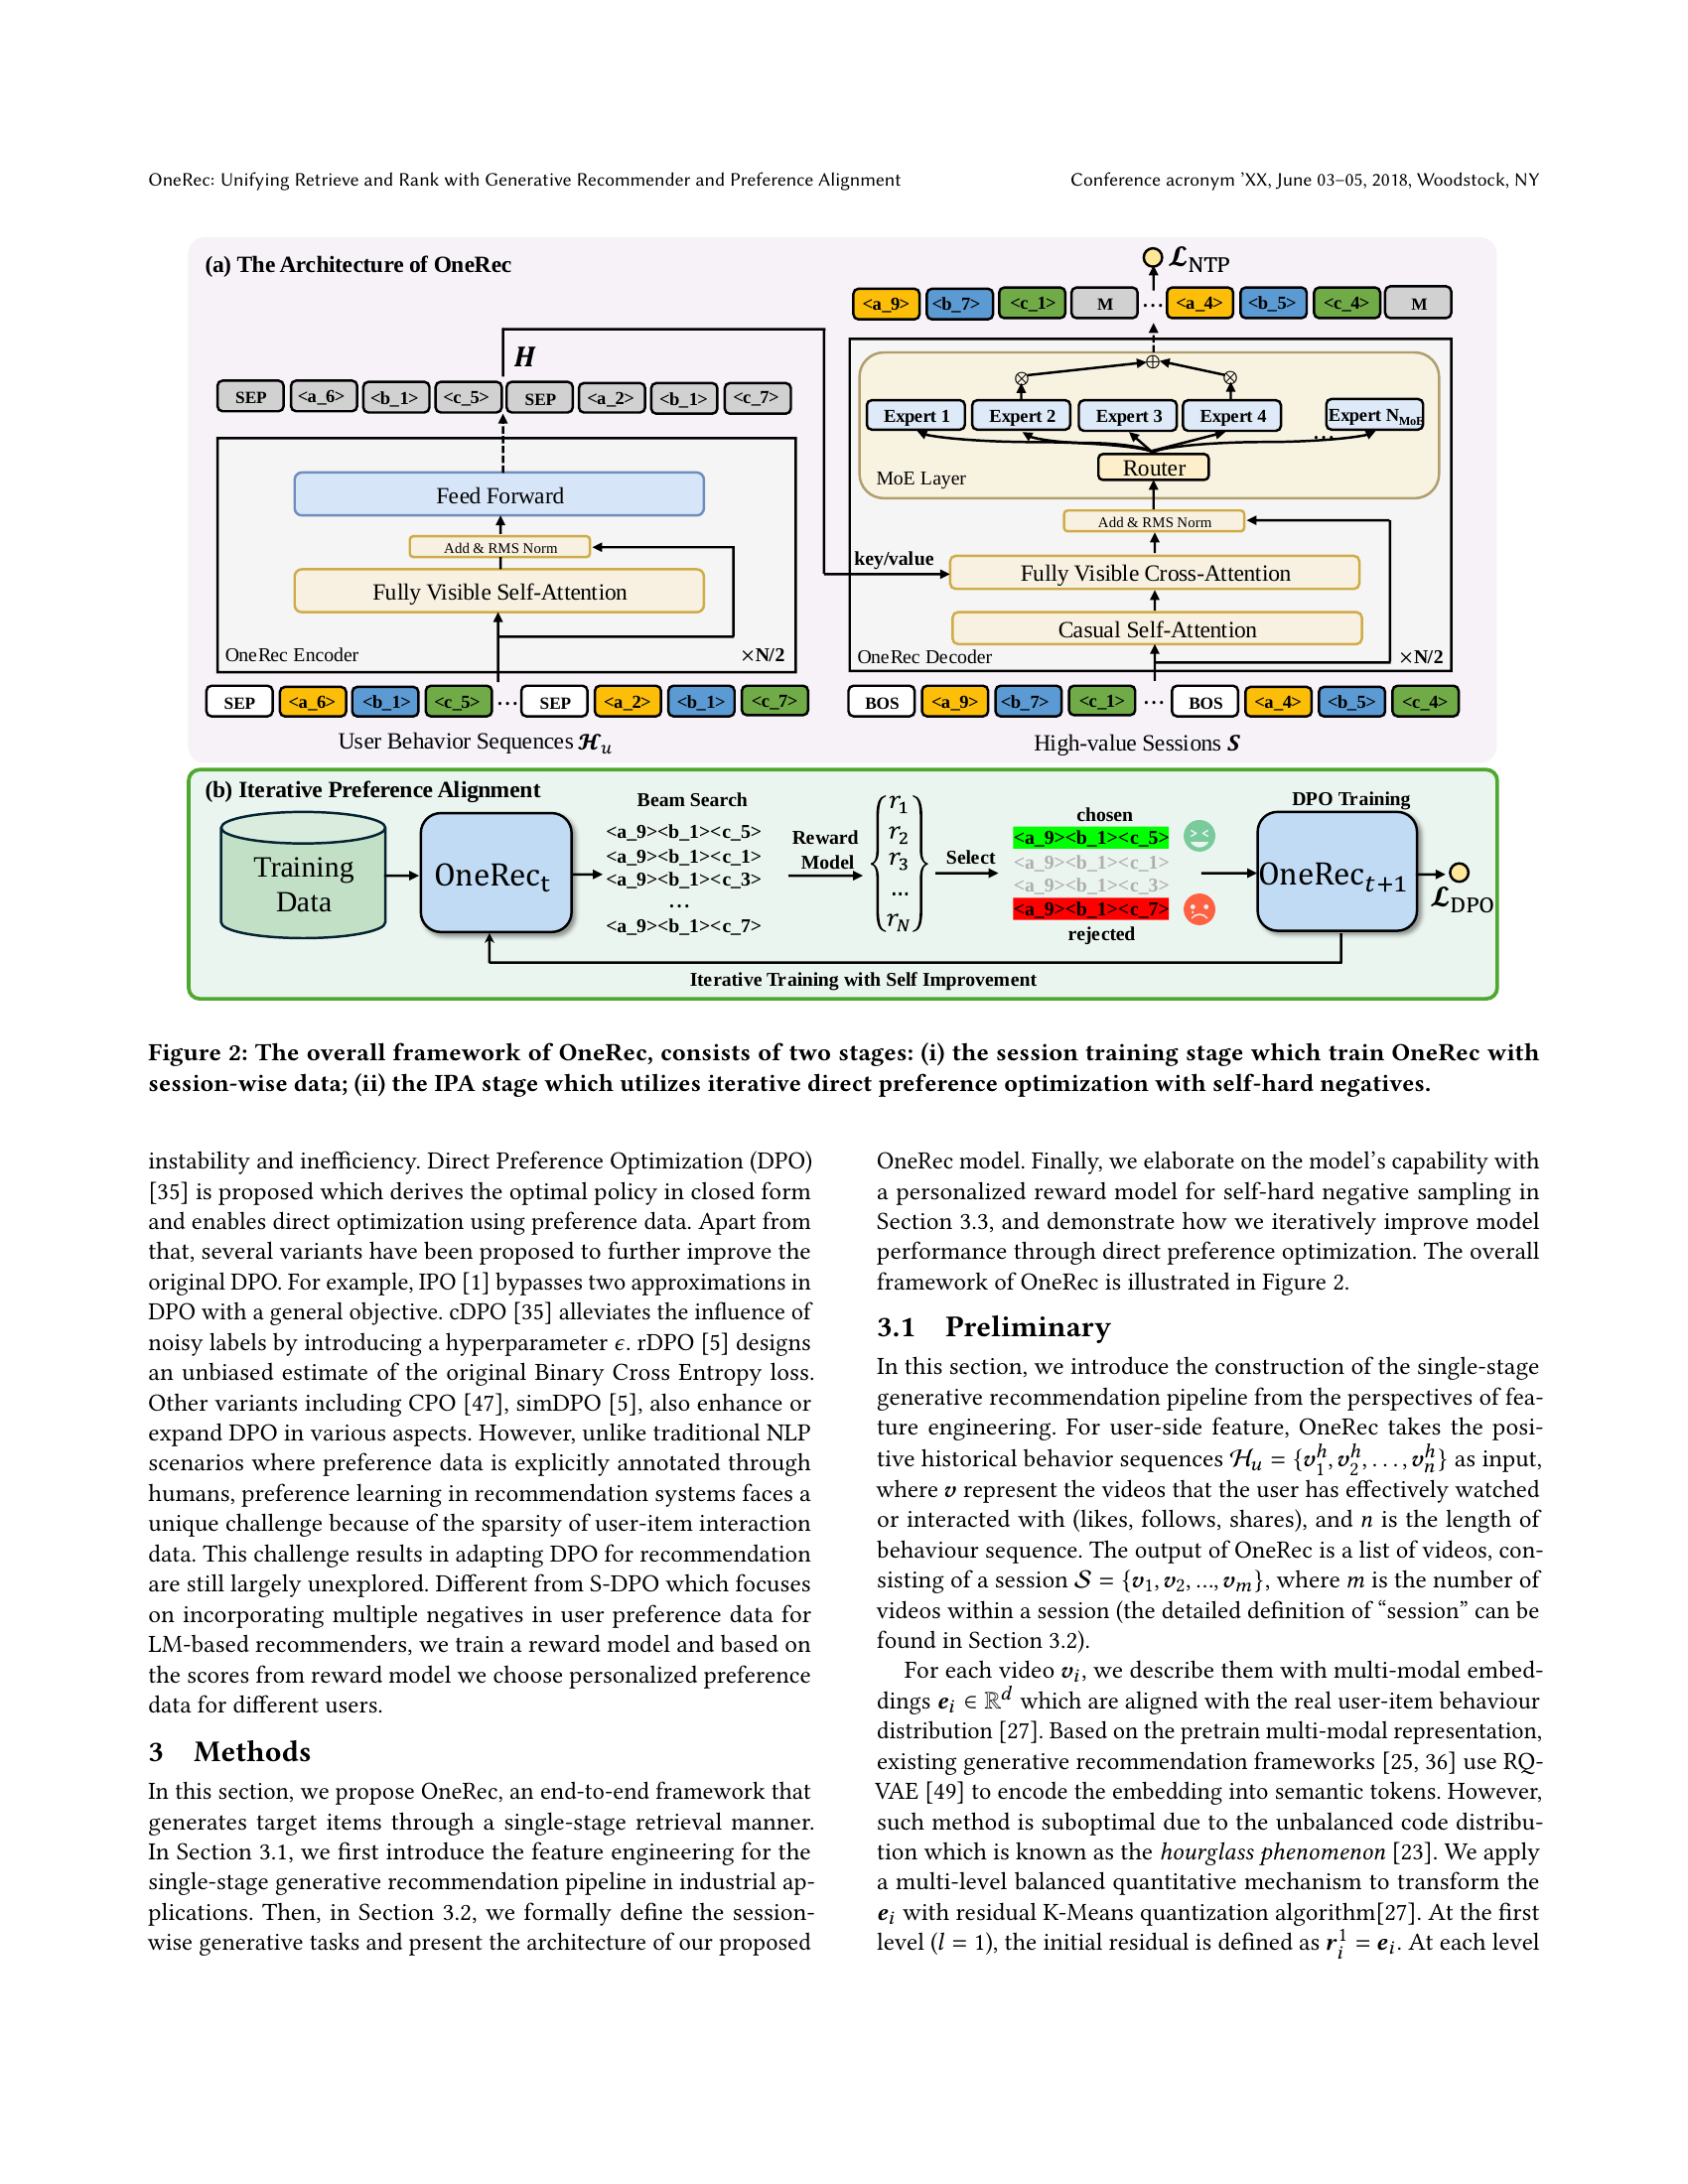
🔼 This figure illustrates the two-stage training process of the OneRec model. The first stage focuses on training OneRec using session-wise data, which means that the model learns to generate relevant sequences of videos for each user session. The second stage employs an Iterative Preference Alignment (IPA) module which leverages iterative direct preference optimization using self-hard negatives to improve the quality of generated recommendations. Self-hard negatives are generated from the beam search results, ensuring high-quality preference pairs are used to refine the model’s preferences. This iterative refinement process aims to align the model’s generated recommendations more closely with actual user preferences.
read the caption
Figure 2. The overall framework of OneRec, consists of two stages: (i) the session training stage which train OneRec with session-wise data; (ii) the IPA stage which utilizes iterative direct preference optimization with self-hard negatives.

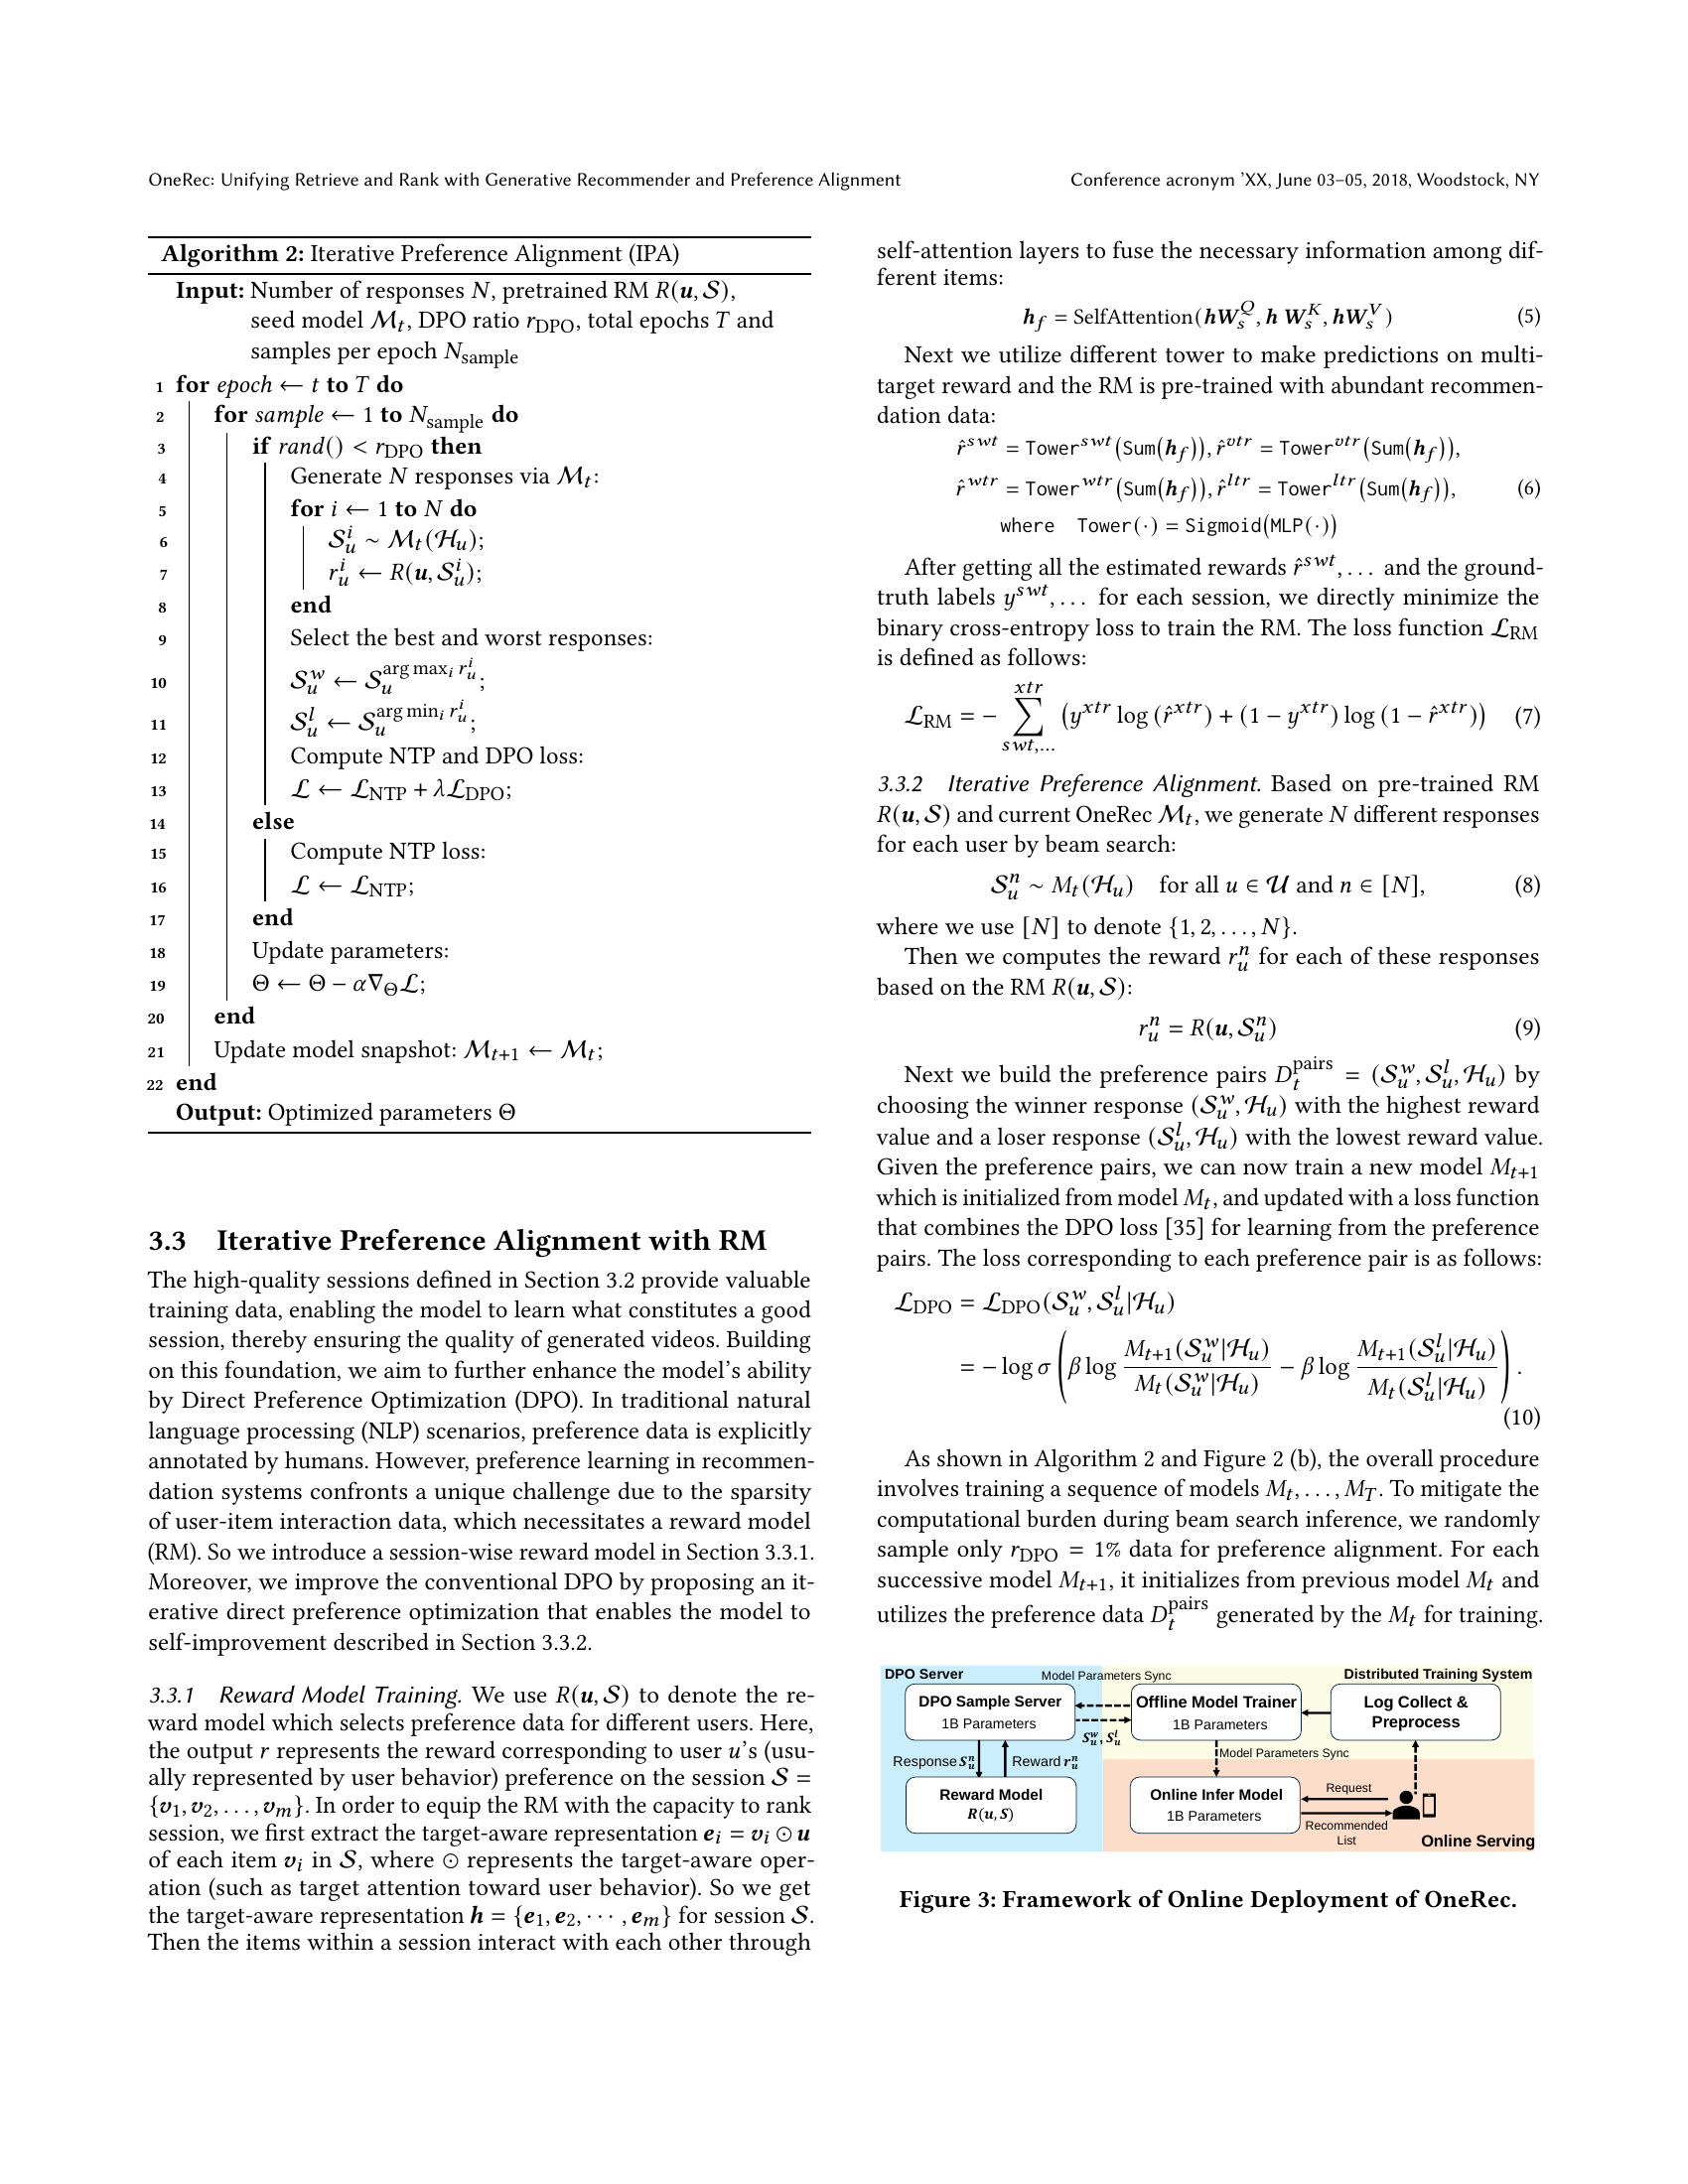
🔼 This figure illustrates the online deployment architecture of the OneRec model. It shows how the trained model parameters are synchronized to both an online inference model and a DPO sample server. The online inference model serves user requests in real-time, while the DPO sample server provides preference data for model updates. The system also includes modules for log collection, preprocessing, and distributed training. The architecture is optimized for efficiency and stability, using techniques like key-value caching, float16 quantization, and beam search.
read the caption
Figure 3. Framework of Online Deployment of OneRec.

🔼 This ablation study investigates the impact of varying the DPO (Direct Preference Optimization) sample ratio on model performance. The x-axis represents the DPO sample ratio, ranging from 1% to 5%. The y-axis displays the resulting performance metrics for different aspects of the recommendation system (e.g., session watch time, view probability, follow probability, like probability). The results demonstrate that increasing the sample ratio from 1% yields only marginal performance improvements, indicating a diminishing return. A 1% sample ratio is identified as the optimal balance between performance gain and computational efficiency. Beyond this point, the additional computational cost outweighs any minor performance increases.
read the caption
Figure 4. The ablation study on DPO sample ratio rDPOsubscript𝑟DPOr_{\rm DPO}italic_r start_POSTSUBSCRIPT roman_DPO end_POSTSUBSCRIPT. The results indicate that a 1% ratio of DPO training leads to significant gains but further increase the sample ratio results in limited improvements.

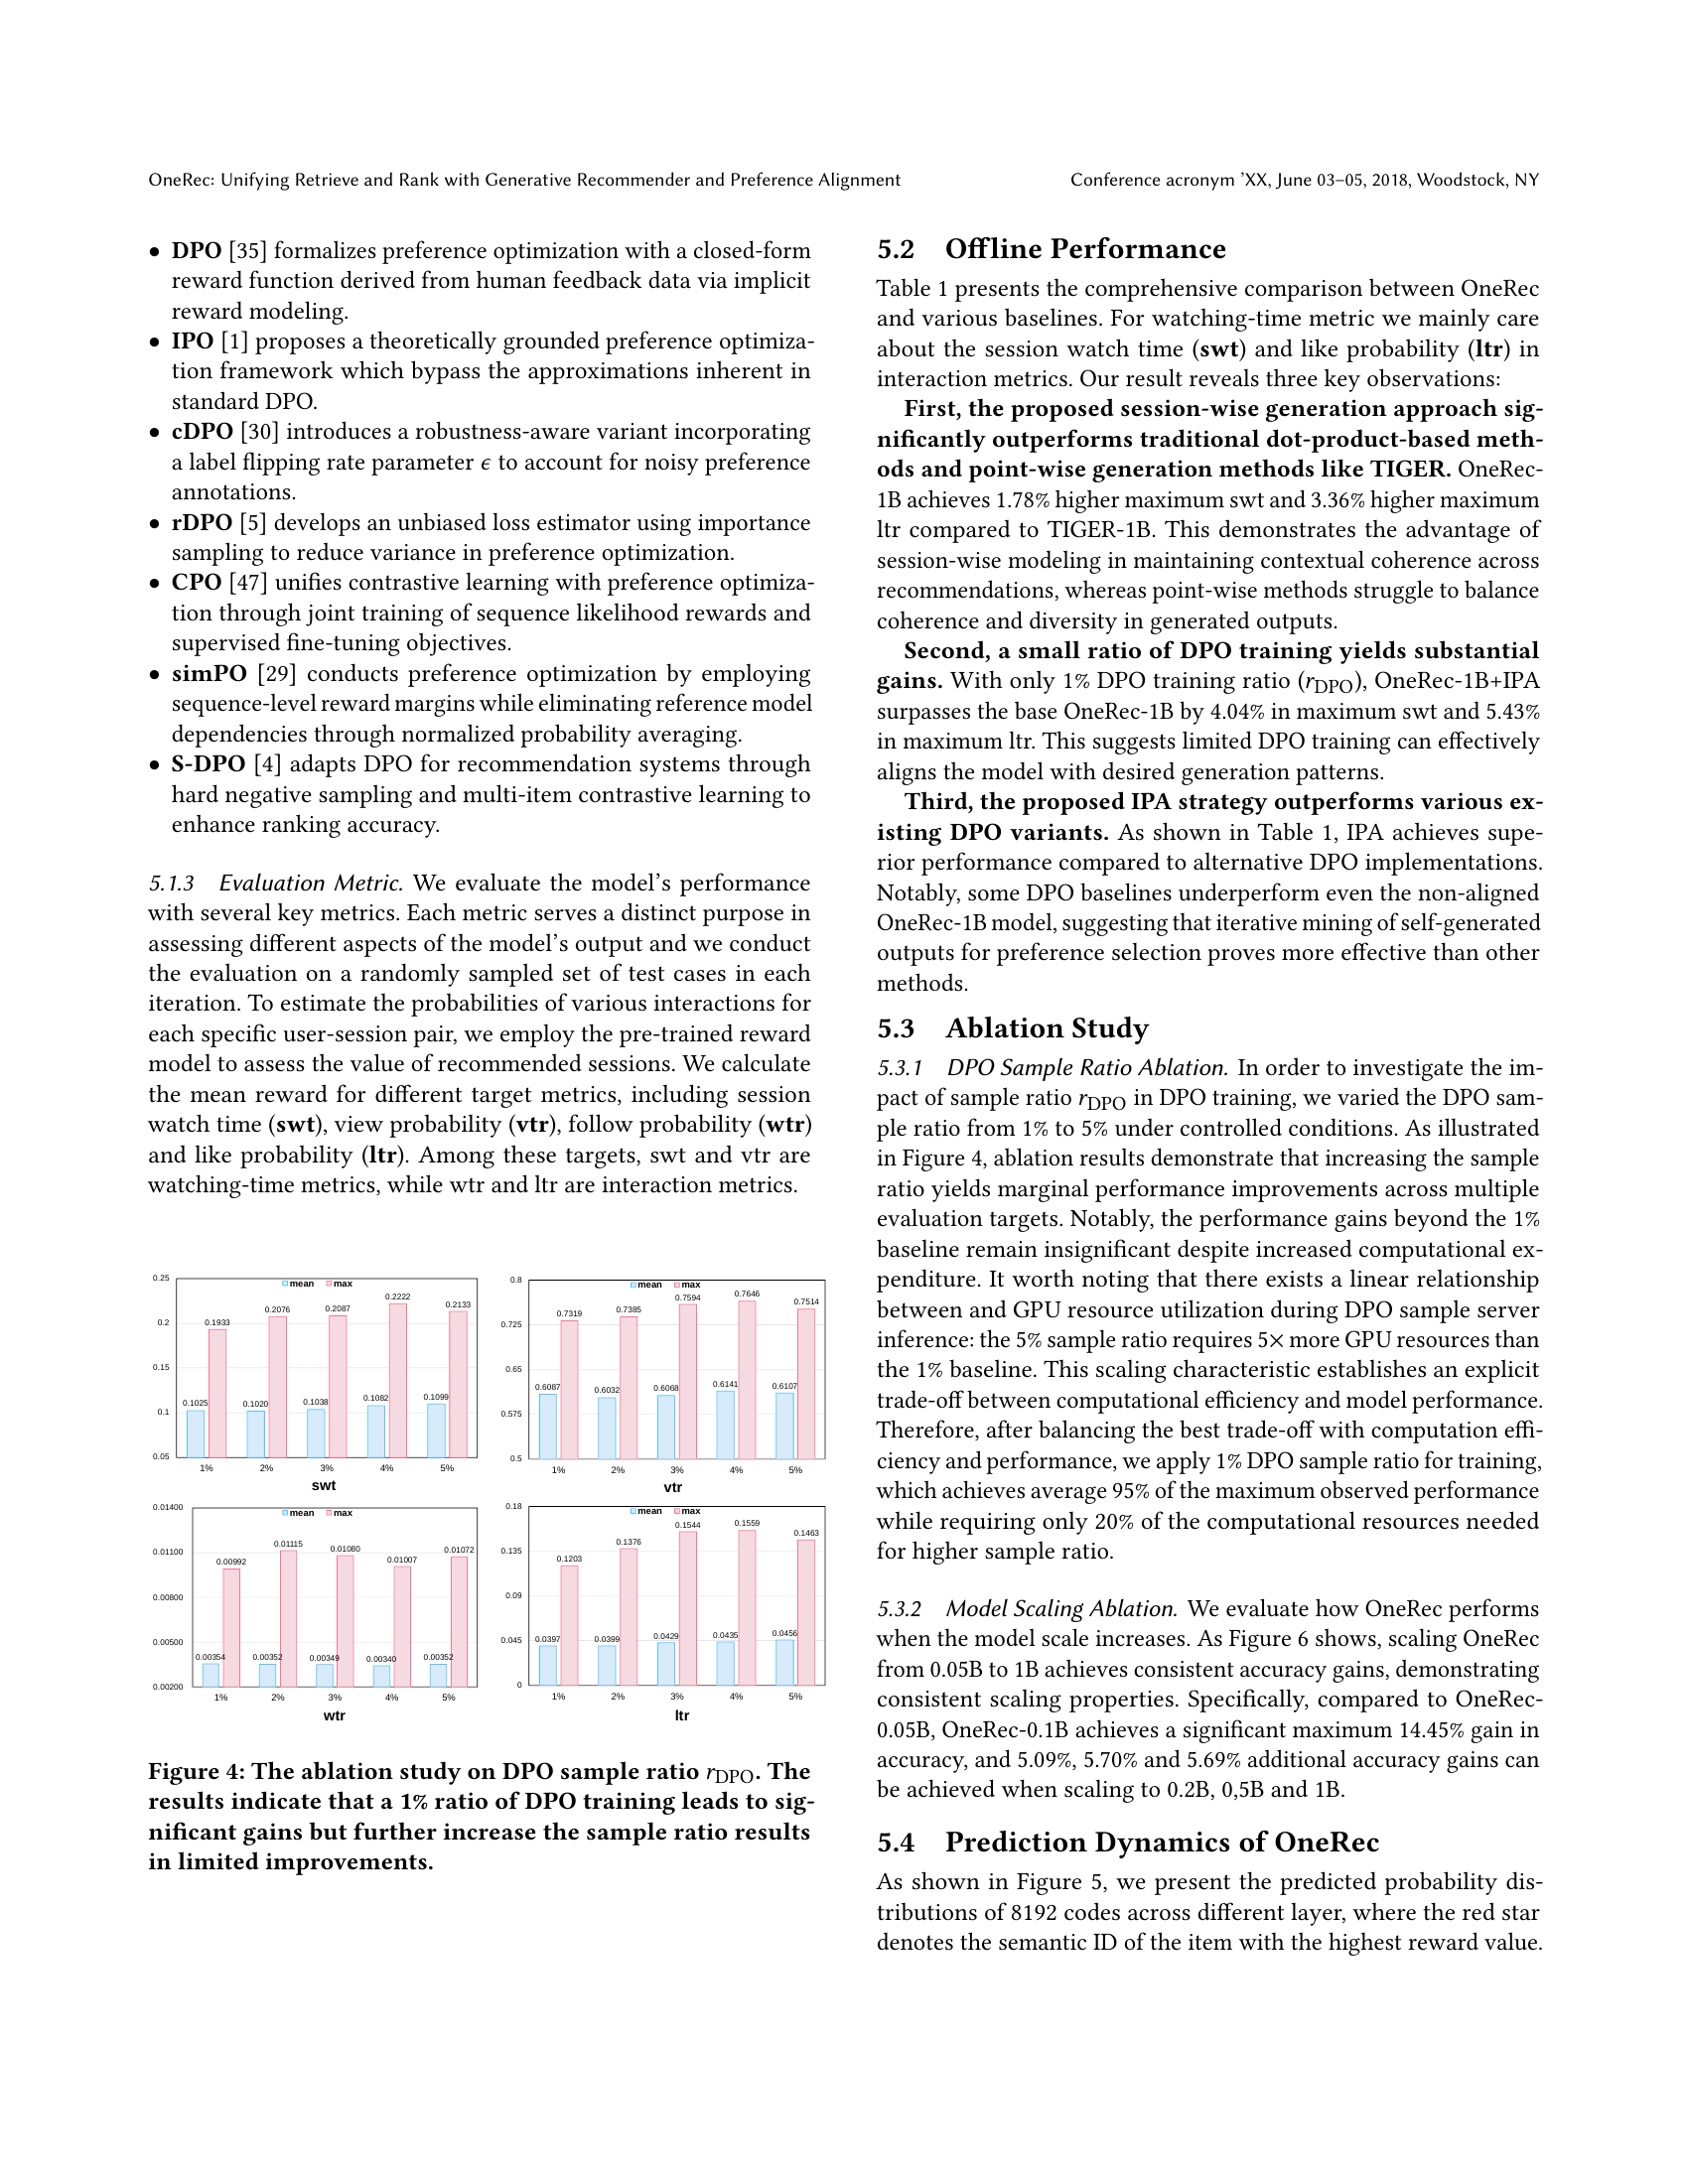
🔼 Figure 5 presents a detailed visualization of the probability distributions generated by the softmax layer for each level of semantic IDs within the OneRec model. The probability distributions show how the model assigns probabilities to different semantic IDs at various stages of processing. Each plot displays the distribution for a particular layer, illustrating how the model’s confidence in certain semantic IDs evolves as it processes the data across different layers. The red star highlights the specific semantic ID that receives the highest reward value from the reward model, indicating the model’s top choice at that layer. This visualization effectively demonstrates the hierarchical refinement process within the model as it progresses towards a final prediction, providing insight into how the uncertainty and confidence of the model change as more context is considered.
read the caption
Figure 5. The visualization of the probability distribution of the softmax output for each layer of the semantic ID. The red star represents the sematic ID of item which has the highest reward value.

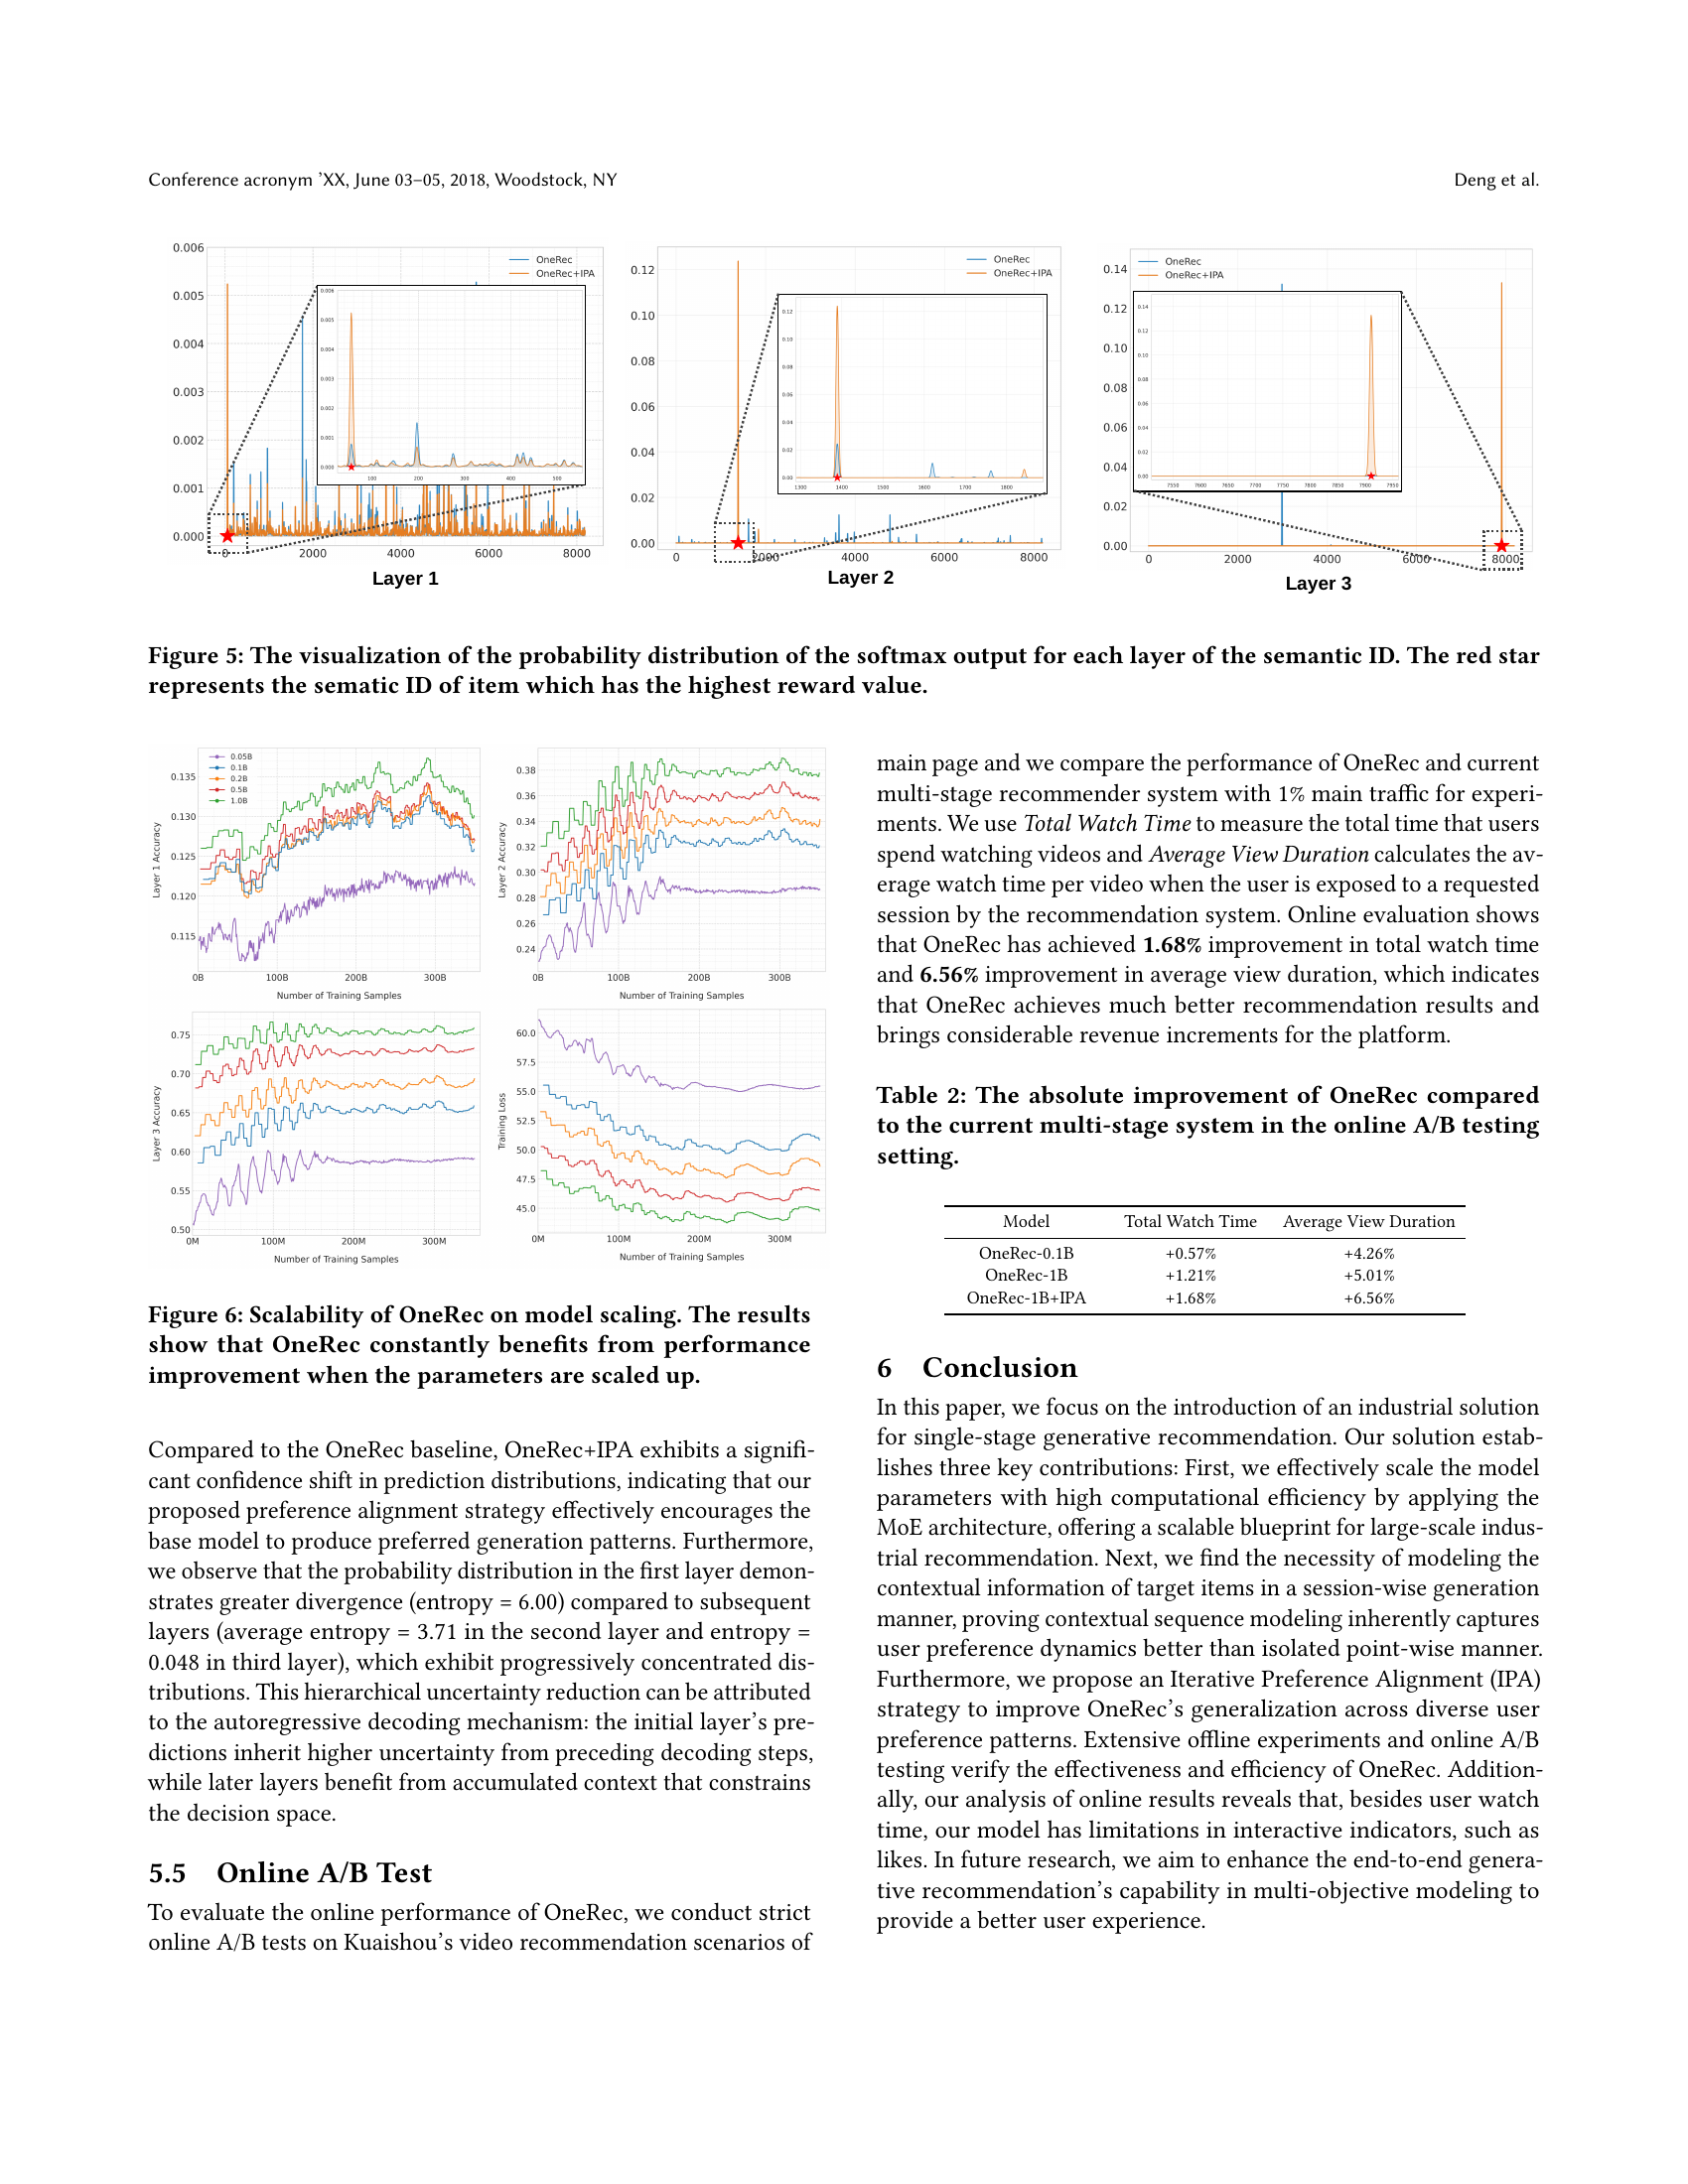
🔼 Figure 6 demonstrates the impact of model size on OneRec’s performance. Multiple lines graph the performance against increasing model parameters (x-axis) for various metrics, including accuracy on different layers (Layer 1, Layer 2, Layer 3) and training loss. The results show a consistent positive correlation between model size and performance across all metrics, indicating OneRec effectively leverages increased model capacity to improve accuracy and reduce loss.
read the caption
Figure 6. Scalability of OneRec on model scaling. The results show that OneRec constantly benefits from performance improvement when the parameters are scaled up.
Full paper#