TL;DR#
Building interactable replicas of articulated objects faces challenges in integrating information across object states, limiting reconstruction accuracy and dynamics modeling, especially for complex multi-part objects. Current methods also rely on pre-trained models, neglect motion information, and struggle with accurate pixel matching across states, which leads to unstable learning and limits joint learning.
To address these issues, the paper introduces ArtGS, leveraging 3D Gaussians and canonical Gaussians with coarse-to-fine initialization to align part information. The use of skinning-inspired dynamics module enhances mesh reconstruction and articulation learning. Experiments showed ArtGS excels in joint parameter estimation and part mesh reconstruction, especially for complex multi-part objects. It enhances reconstruction quality/efficiency and offers design analyses, highlighting potential future improvements.
Key Takeaways#
Why does it matter?#
ArtGS offers high-quality, efficient reconstruction of articulated objects, enhancing robotics, AR/VR, and digital twin applications. It provides scalability for complex models & sets a benchmark for future research in this field.
Visual Insights#
| Metric | Method | Synthetic Objects | Real Objects | ||||||||||||
| FoldChair | Fridge | Laptop† | Oven† | Scissor | Stapler | USB | Washer | Blade | Storage† | All | Fridge | Storage | All | ||
| Axis Ang | Ditto | 89.35 | 89.30 | 3.12 | 0.96 | 4.50 | 89.86 | 89.77 | 89.51 | 79.54 | 6.32 | 54.22 | 1.71 | 5.88 | 3.80 |
| PARIS* | 15.7929.3 | 2.935.3 | 0.030.0 | 7.4323.4 | 16.6232.1 | 8.1715.3 | 0.710.8 | 18.4023.3 | 41.2831.4 | 0.030.0 | 11.1416.1 | 1.900.0 | 30.1010.4 | 16.005.2 | |
| CSG-reg | 0.100.0 | 0.270.0 | 0.470.0 | 0.350.1 | 0.280.0 | 0.300.0 | 11.7810.5 | 71.936.3 | 7.645.0 | 2.822.5 | 9.602.4 | 8.920.9 | 69.719.6 | 39.315.2 | |
| 3Dseg-reg | - | - | 2.340.11 | - | - | - | - | - | 9.407.5 | - | - | - | - | - | |
| DTA | 0.030.0 | 0.090.0 | 0.070.0 | 0.220.1 | 0.100.0 | 0.070.0 | 0.110.0 | 0.360.1 | 0.200.1 | 0.090.0 | 0.130.0 | 2.080.0 | 13.643.6 | 7.861.8 | |
| Ours | 0.010.0 | 0.030.0 | 0.010.0 | 0.010.0 | 0.050.0 | 0.010.0 | 0.040.0 | 0.020.0 | 0.030.0 | 0.010.0 | 0.020.0 | 2.090.0 | 3.470.3 | 2.780.2 | |
| Axis Pos | Ditto | 3.77 | 1.02 | 0.01 | 0.13 | 5.70 | 0.20 | 5.41 | 0.66 | - | - | 2.11 | 1.84 | - | 1.84 |
| PARIS* | 0.250.5 | 1.132.6 | 0.000.0 | 0.050.2 | 1.591.7 | 4.673.9 | 3.353.1 | 3.283.1 | - | - | 1.791.5 | 0.500.0 | - | 0.500.0 | |
| CSG-reg | 0.020.0 | 0.000.0 | 0.200.2 | 0.180.0 | 0.010.0 | 0.020.0 | 0.010.0 | 2.131.5 | - | - | 0.320.2 | 1.461.1 | - | 1.461.1 | |
| 3Dseg-reg | - | - | 0.100.0 | - | - | - | - | - | - | - | - | - | - | - | |
| DTA | 0.010.0 | 0.010.0 | 0.010.0 | 0.010.0 | 0.020.0 | 0.020.0 | 0.000.0 | 0.050.0 | - | - | 0.020.0 | 0.590.0 | - | 0.590.0 | |
| Ours | 0.000.0 | 0.000.0 | 0.010.0 | 0.000.0 | 0.000.0 | 0.010.0 | 0.000.0 | 0.000.0 | - | - | 0.000.0 | 0.470.0 | - | 0.470.0 | |
| Part Motion | Ditto | 99.36 | F | 5.18 | 2.09 | 19.28 | 56.61 | 80.60 | 55.72 | F | 0.09 | 39.87 | 8.43 | 0.38 | 4.41 |
| PARIS* | 127.3475.0 | 45.2658.5 | 0.030.0 | 9.1328.8 | 68.3664.8 | 107.7668.1 | 96.9367.8 | 49.7726.5 | 0.360.2 | 0.300.0 | 50.5239.0 | 1.580.0 | 0.570.1 | 1.070.1 | |
| CSG-reg | 0.130.0 | 0.290.0 | 0.350.0 | 0.580.0 | 0.200.0 | 0.440.0 | 10.489.3 | 158.998.8 | 0.050.0 | 0.040.0 | 17.161.8 | 14.820.1 | 0.640.1 | 7.730.1 | |
| 3Dseg-reg | - | - | 1.610.1 | - | - | - | - | - | 0.150.0 | - | - | - | - | - | |
| DTA | 0.100.0 | 0.120.0 | 0.110.0 | 0.120.0 | 0.370.6 | 0.080.0 | 0.150.0 | 0.280.1 | 0.000.0 | 0.000.0 | 0.130.1 | 1.850.0 | 0.140.0 | 1.000.0 | |
| Ours | 0.030.0 | 0.040.0 | 0.020.0 | 0.020.0 | 0.040.0 | 0.010.0 | 0.030.0 | 0.030.0 | 0.000.0 | 0.000.0 | 0.020.0 | 1.940.0 | 0.040.0 | 0.990.0 | |
| CD-s | Ditto | 33.79 | 3.05 | 0.25 | 2.52 | 39.07 | 41.64 | 2.64 | 10.32 | 46.90 | 9.18 | 18.94 | 47.01 | 16.09 | 31.55 |
| PARIS* | 10.205.8 | 8.8212.0 | 0.160.0 | 3.180.3 | 15.5813.3 | 2.481.9 | 1.950.5 | 12.193.7 | 1.400.7 | 8.670.8 | 6.463.9 | 11.641.5 | 20.252.8 | 15.942.1 | |
| CSG-reg | 1.69 | 1.45 | 0.32 | 3.93 | 3.26 | 2.22 | 1.95 | 4.53 | 0.59 | 7.06 | 2.70 | 6.33 | 12.55 | 9.44 | |
| 3Dseg-reg | - | - | 0.76 | - | - | - | - | - | 66.31 | - | - | - | - | - | |
| DTA | 0.180.0 | 0.620.0 | 0.300.0 | 4.600.1 | 3.556.1 | 2.910.1 | 2.320.1 | 4.560.1 | 0.550.0 | 4.900.5 | 2.450.7 | 2.360.1 | 10.980.1 | 6.670.1 | |
| Ours | 0.260.3 | 0.520.0 | 0.630.0 | 3.880.0 | 0.610.3 | 3.830.1 | 2.250.2 | 6.430.1 | 0.540.0 | 7.310.2 | 2.630.1 | 1.640.2 | 2.930.3 | 2.290.3 | |
| CD-m | Ditto | 141.11 | 0.99 | 0.19 | 0.94 | 20.68 | 31.21 | 15.88 | 12.89 | 195.93 | 2.20 | 42.20 | 50.60 | 20.35 | 35.48 |
| PARIS* | 17.9724.9 | 7.2311.5 | 0.150.0 | 6.5410.6 | 16.6516.6 | 30.4637.0 | 10.176.9 | 265.27248.7 | 117.99213.0 | 52.3411.0 | 52.4858.0 | 77.8526.8 | 474.57227.2 | 276.21127.0 | |
| CSG-reg | 1.91 | 21.71 | 0.42 | 256.99 | 1.95 | 6.36 | 29.78 | 436.42 | 26.62 | 1.39 | 78.36 | 442.17 | 521.49 | 481.83 | |
| 3Dseg-reg | - | - | 1.01 | - | - | - | - | - | 6.23 | - | - | - | - | - | |
| DTA | 0.150.0 | 0.270.0 | 0.130.0 | 0.440.0 | 10.1119.4 | 1.130.5 | 1.470.0 | 0.450.0 | 2.050.3 | 0.360.0 | 1.662.0 | 1.120.0 | 30.782.6 | 15.951.3 | |
| Ours | 0.540.1 | 0.210.0 | 0.130.0 | 0.890.2 | 0.640.4 | 0.520.1 | 1.220.1 | 0.450.2 | 1.120.2 | 1.020.4 | 0.670.2 | 0.660.2 | 6.283.6 | 3.471.9 | |
| CD-w | Ditto | 6.80 | 2.16 | 0.31 | 2.51 | 1.70 | 2.38 | 2.09 | 7.29 | 42.04 | 3.91 | 7.12 | 6.50 | 14.08 | 10.29 |
| PARIS* | 4.376.4 | 5.534.7 | 0.260.0 | 3.180.3 | 3.903.6 | 5.275.9 | 1.780.2 | 10.112.8 | 0.580.1 | 7.800.4 | 4.282.4 | 8.991.4 | 32.108.2 | 20.554.8 | |
| CSG-reg | 0.48 | 0.98 | 0.40 | 3.00 | 1.70 | 1.99 | 1.20 | 4.48 | 0.56 | 4.00 | 1.88 | 5.71 | 14.29 | 10.00 | |
| 3Dseg-reg | - | - | 0.81 | - | - | - | - | - | 0.78 | - | - | - | - | - | |
| DTA | 0.270.0 | 0.700.0 | 0.320.0 | 4.240.1 | 0.410.0 | 1.920.0 | 1.170.0 | 4.480.2 | 0.360.0 | 3.990.4 | 1.790.1 | 2.080.1 | 8.980.1 | 5.530.1 | |
| Ours | 0.430.2 | 0.580.0 | 0.500.0 | 3.580.0 | 0.670.3 | 2.630.0 | 1.280.0 | 5.990.1 | 0.610.0 | 5.210.1 | 2.150.1 | 1.290.1 | 3.230.1 | 2.260.1 | |
| Time (min) | DTA | 29 | 30 | 31 | 29 | 28 | 29 | 31 | 28 | 27 | 28 | 29 | 29 | 29 | 29 |
| Ours | 9 | 8 | 7 | 7 | 7 | 7 | 7 | 8 | 7 | 8 | 8 | 9 | 9 | 9 | |
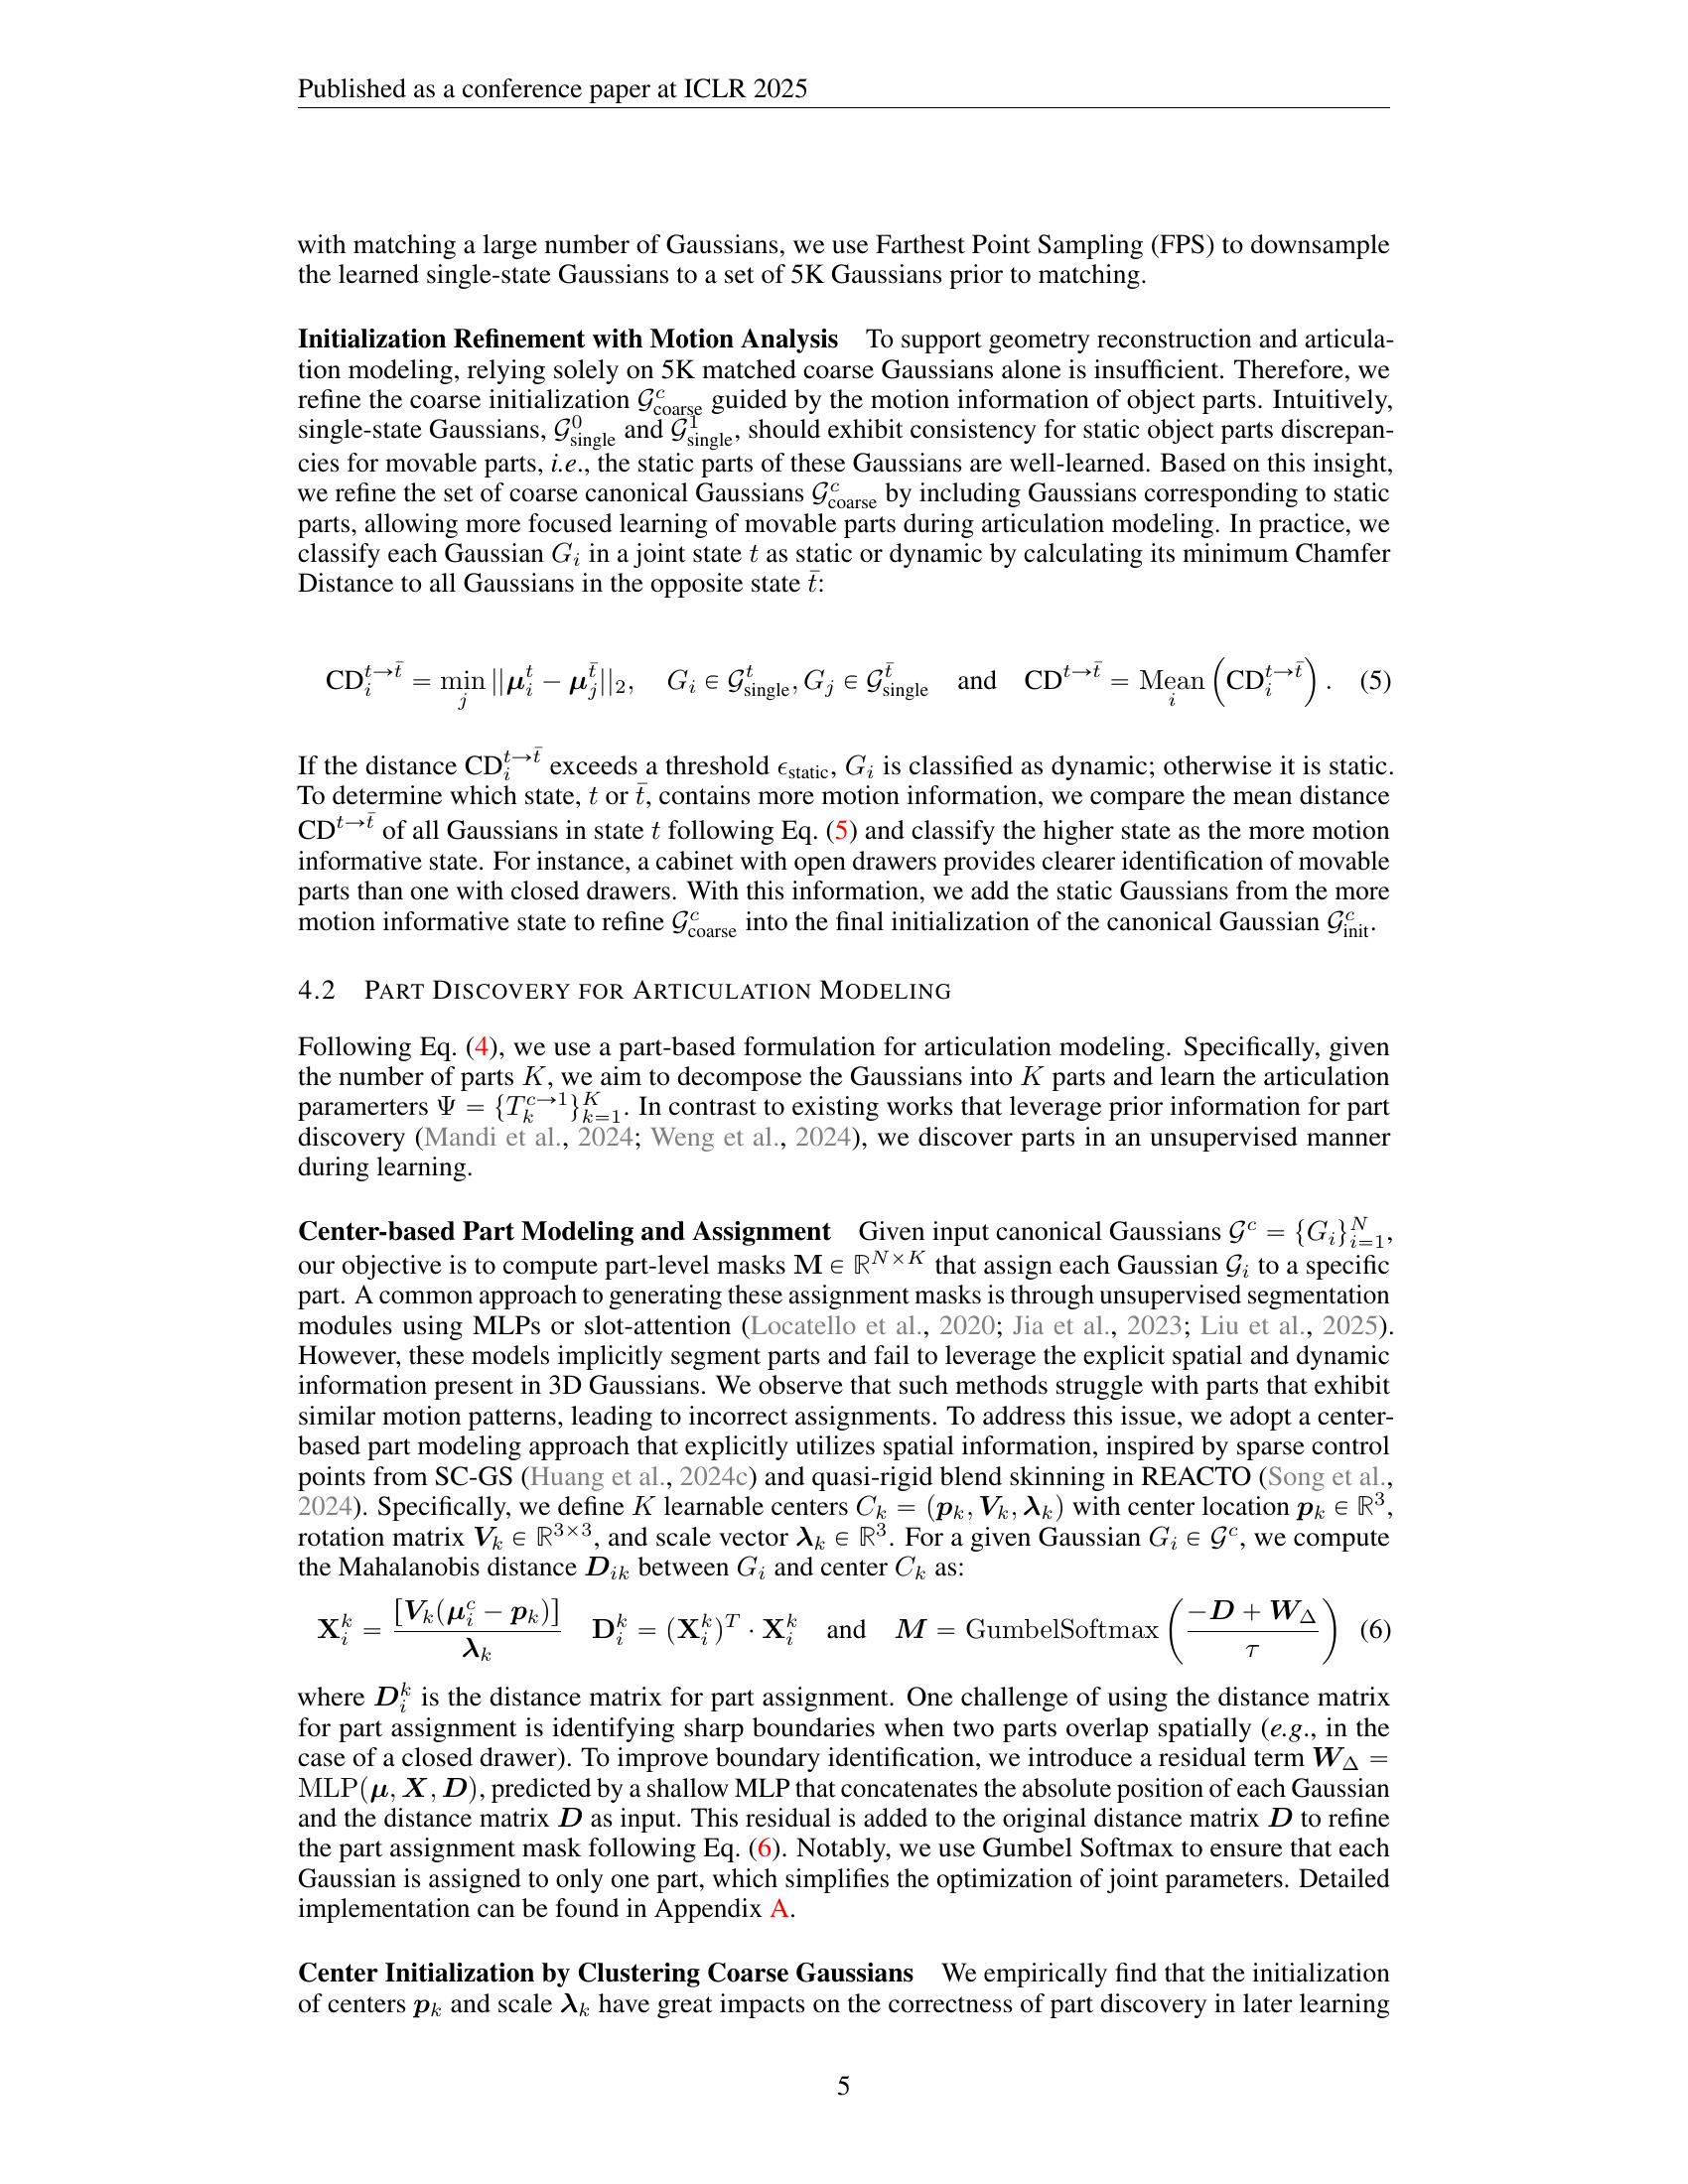
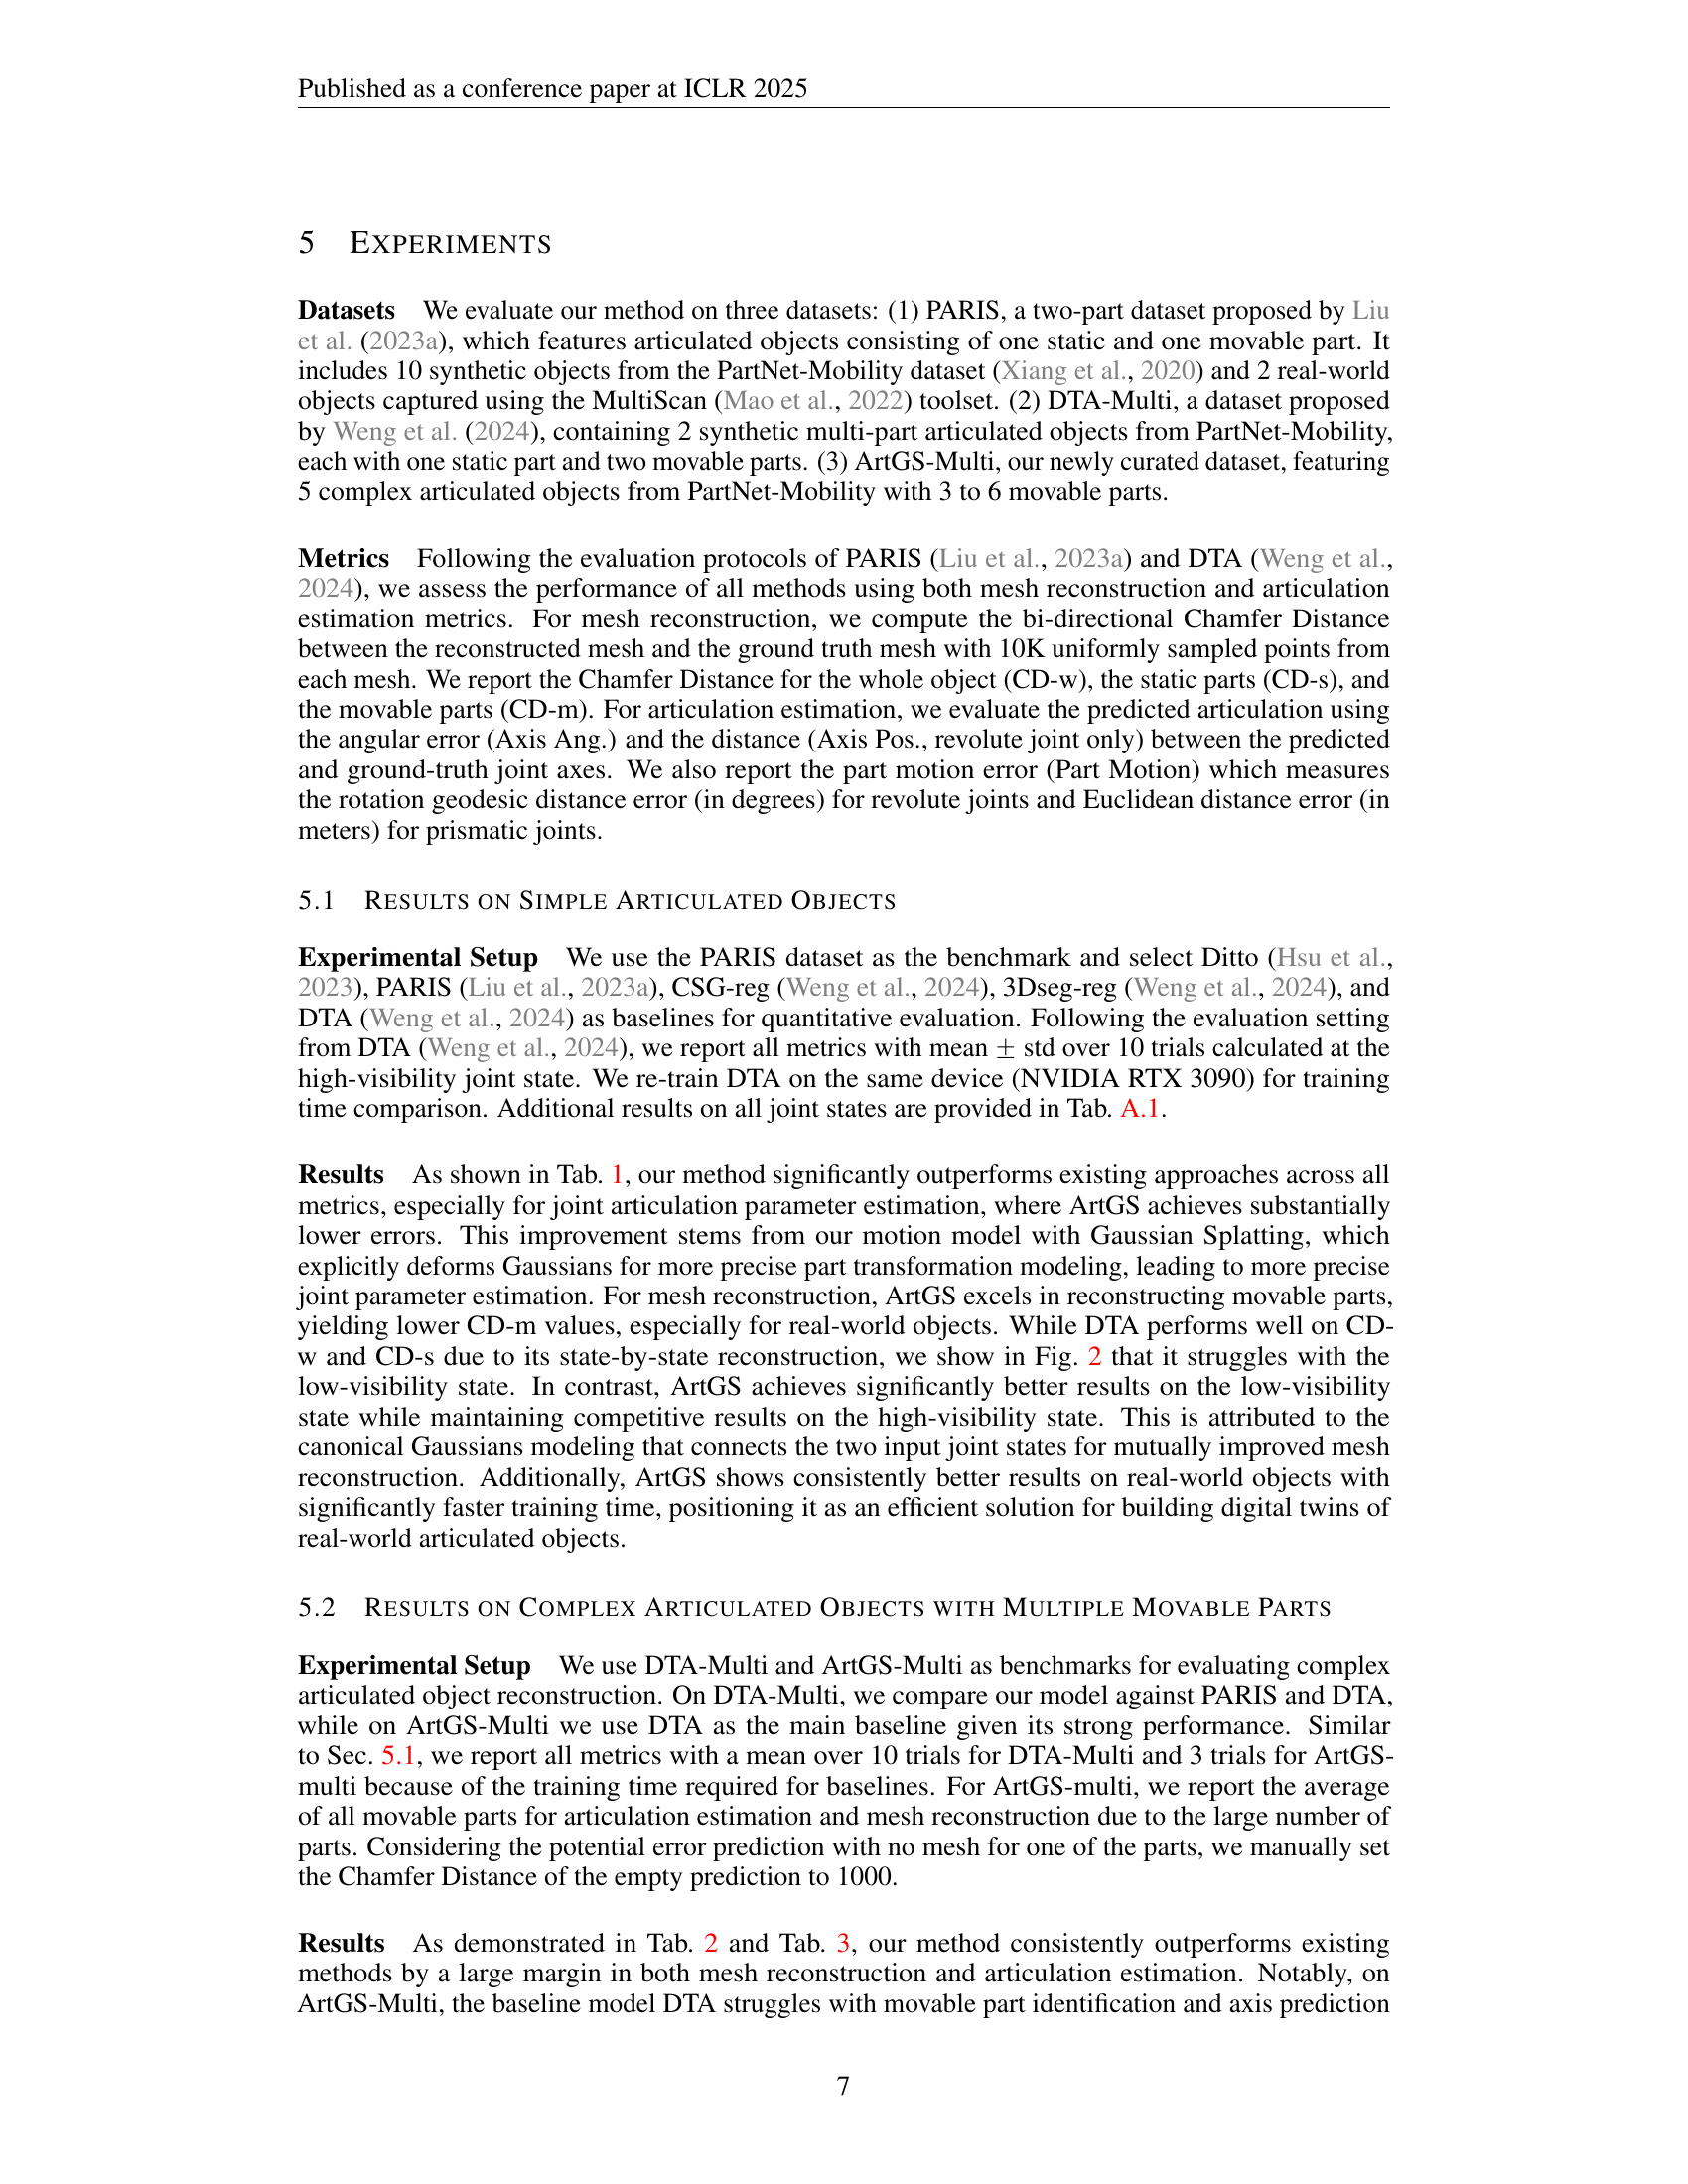
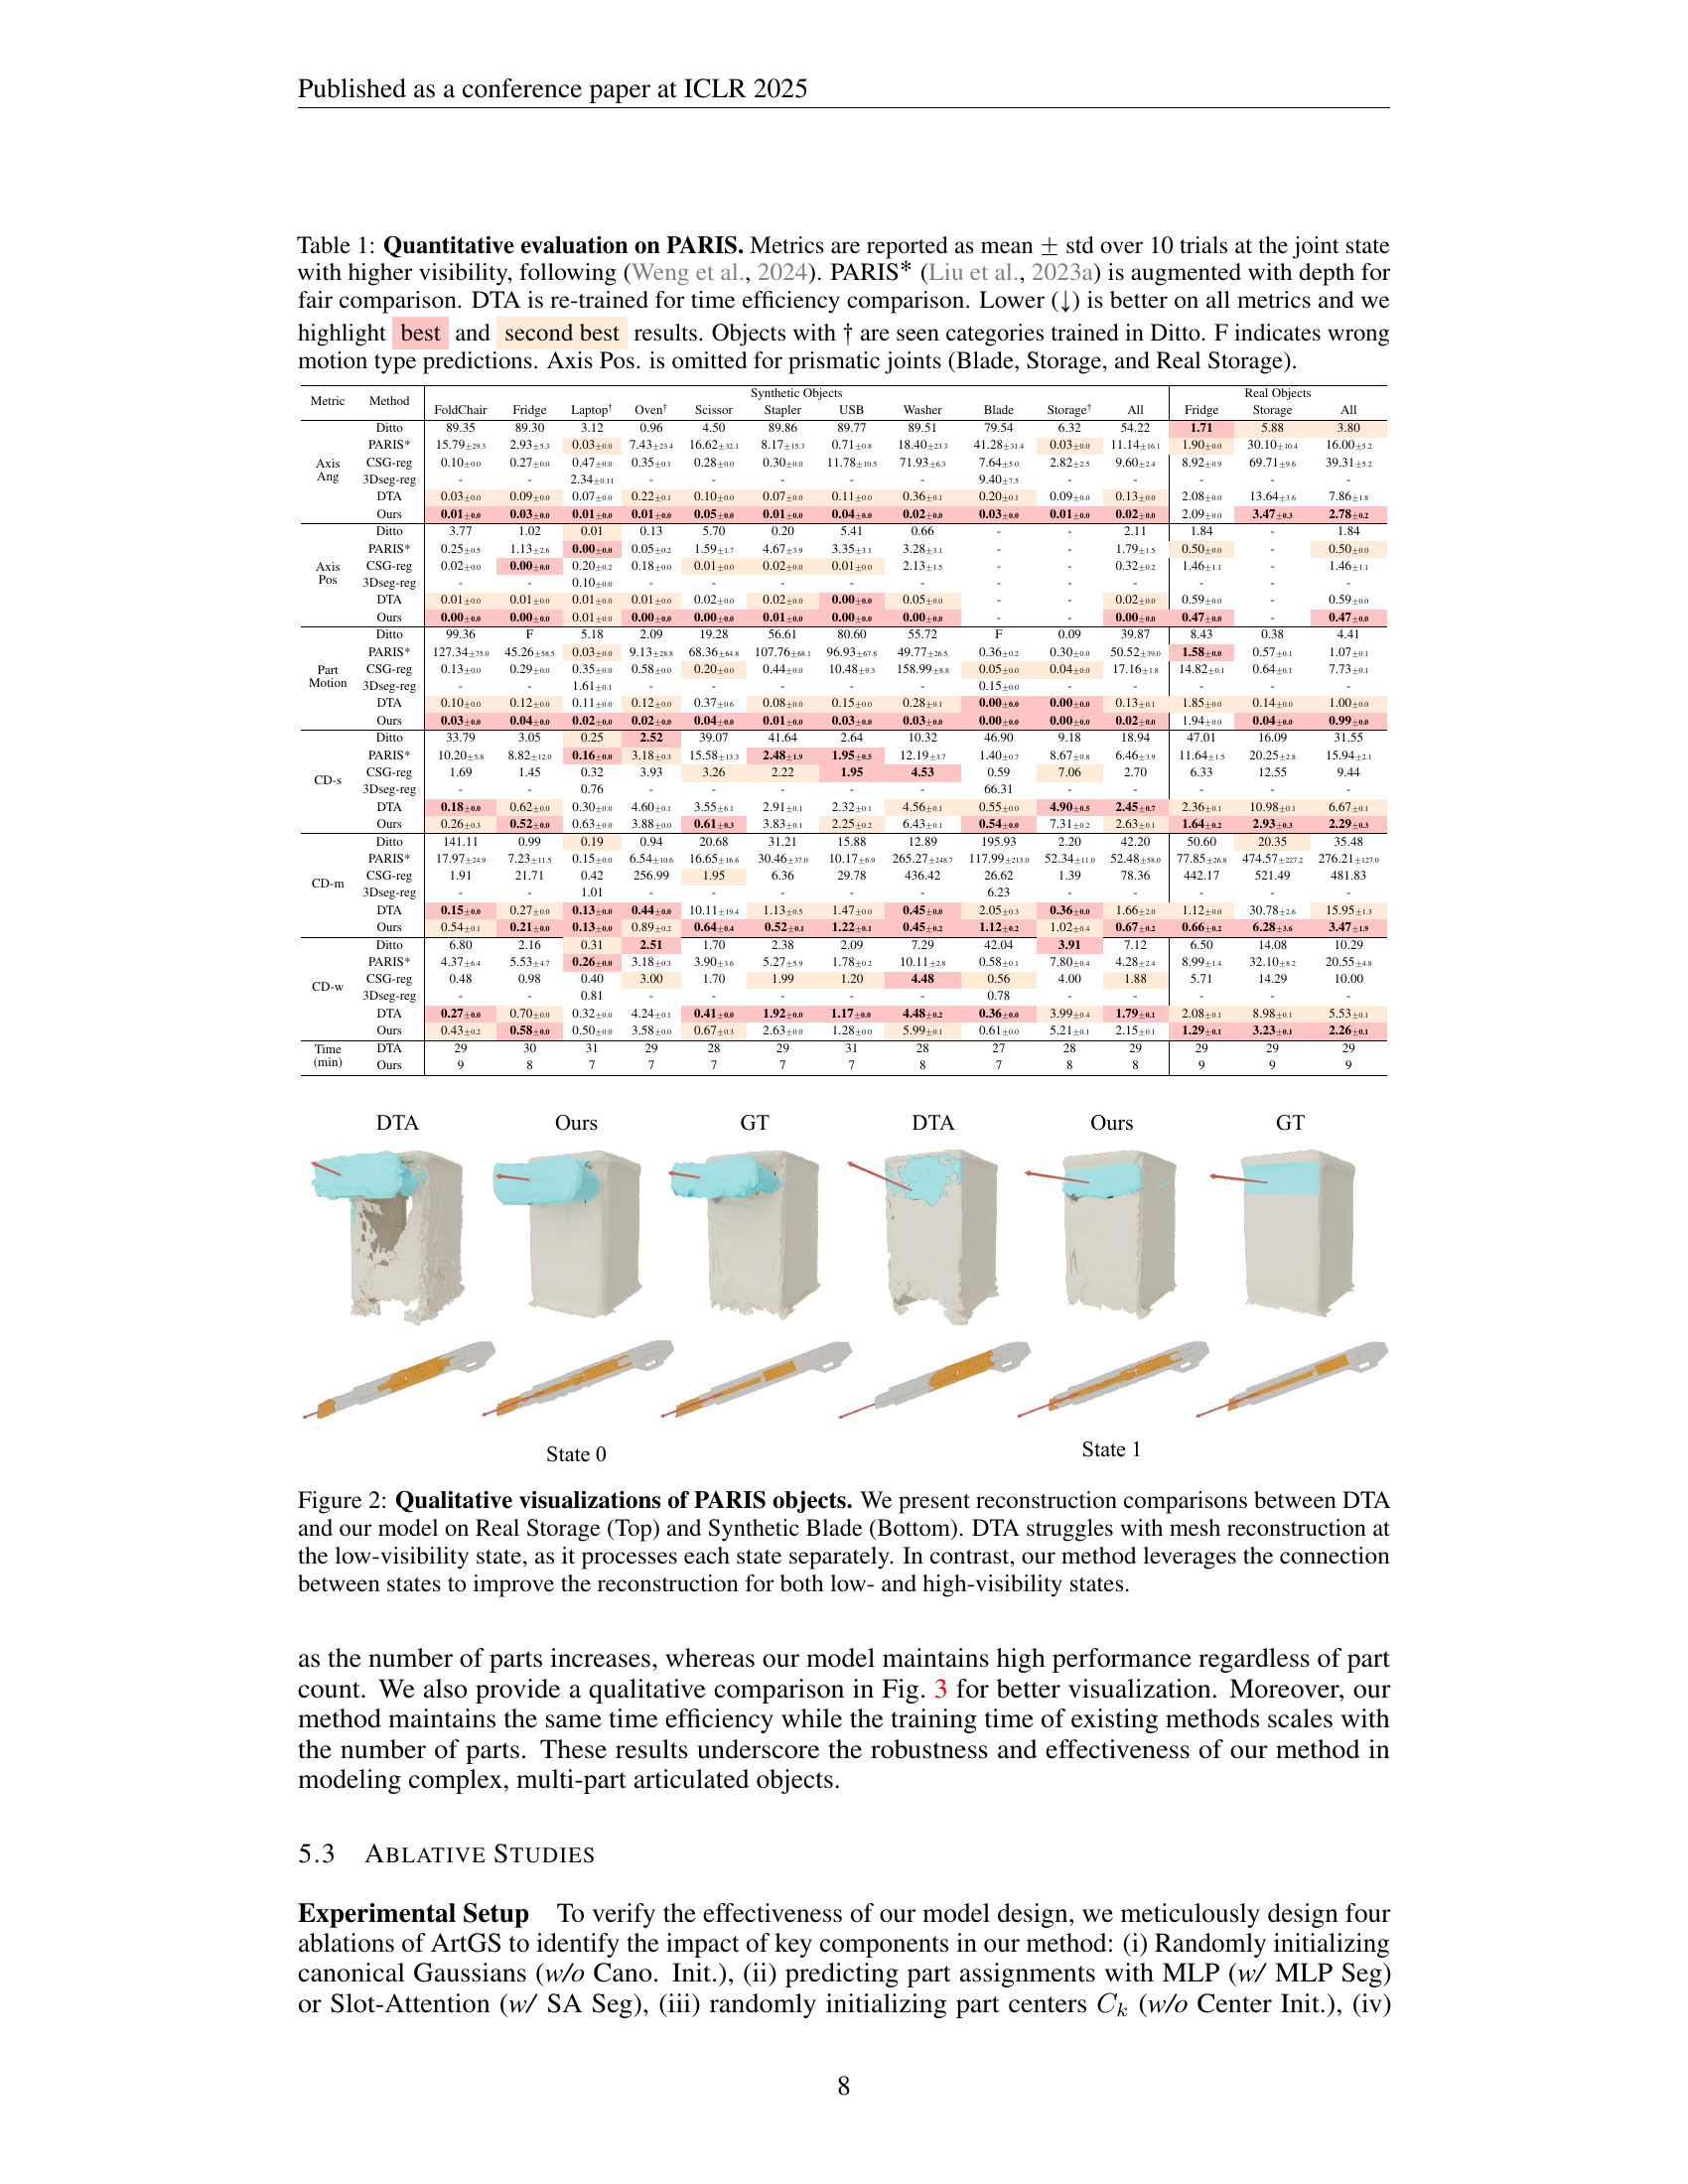
🔼 Table 1 presents a quantitative comparison of different methods for articulated object reconstruction on the PARIS dataset. The PARIS dataset contains both synthetic and real-world objects, each with one static and one moving part. The metrics used are commonly used for articulated object benchmarks and include measures of mesh reconstruction accuracy (Chamfer distance for the whole object (CD-w), static parts (CD-s), and moving parts (CD-m)) and articulation parameter estimation accuracy (angular error for joint axis and distance error for revolute joints). The results show the average and standard deviation over 10 trials and are given for the high-visibility joint state. The table also notes that the PARIS dataset used was augmented with depth data and that DTA was retrained for efficiency comparison. The best and second best results are highlighted to aid in readability. Finally, notes explain the meaning of F and why the Axis Pos metric is omitted for some objects.
read the caption
Table 1: Quantitative evaluation on PARIS. Metrics are reported as mean ±plus-or-minus\pm± std over 10 trials at the joint state with higher visibility, following (Weng et al., 2024). PARIS∗ (Liu et al., 2023a) is augmented with depth for fair comparison. DTA is re-trained for time efficiency comparison. Lower (↓↓\downarrow↓) is better on all metrics and we highlight best and second best results. Objects with ††\dagger† are seen categories trained in Ditto. F indicates wrong motion type predictions. Axis Pos. is omitted for prismatic joints (Blade, Storage, and Real Storage).
In-depth insights#
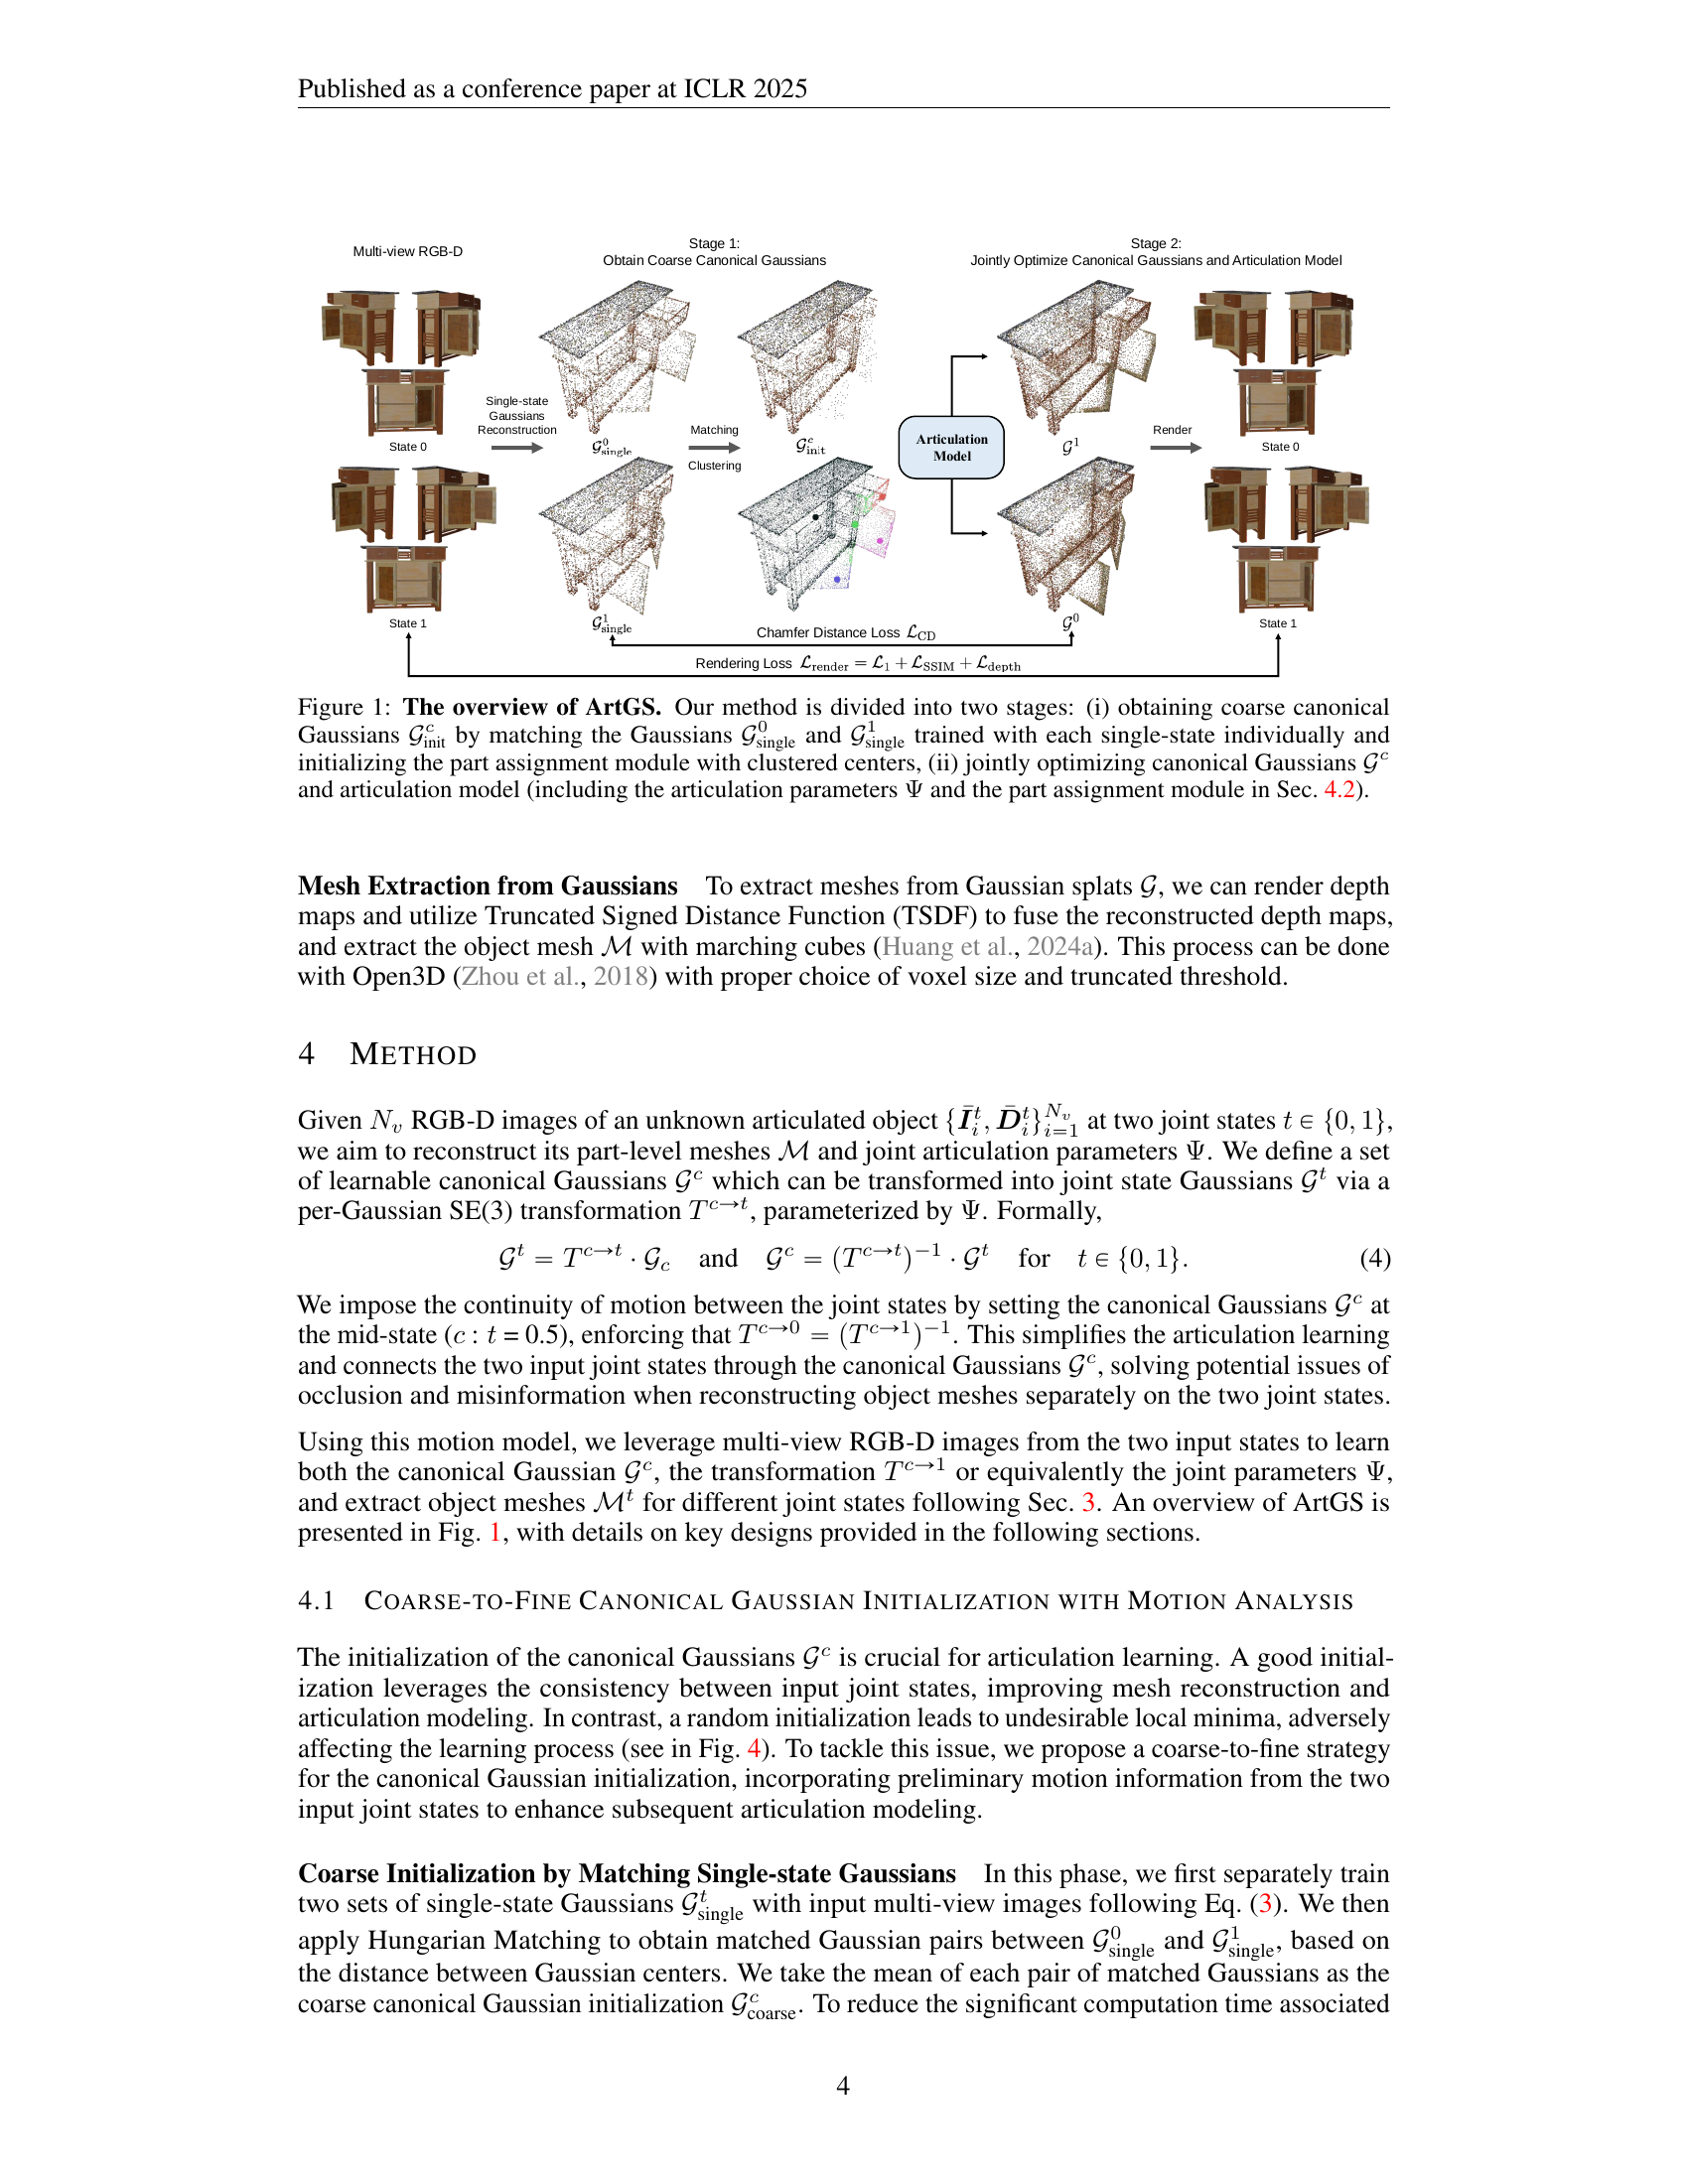
ArtGS: Overview#
ArtGS appears to be a novel approach to reconstructing articulated objects from multi-view images, leveraging 3D Gaussians for representation. The core idea seems to revolve around efficiently integrating information across different object states to improve reconstruction accuracy. The method likely involves canonical Gaussians with a coarse-to-fine initialization strategy, and a skinning-inspired part dynamics modeling module to enhance both mesh reconstruction and articulation learning. The emphasis seems to be on handling complex multi-part articulated objects, addressing limitations of existing methods that struggle with integrating information across different object states, and part dynamics modeling, particularly for multi-part objects, indicating a significant advancement in the field.
Gaussians Refined#
Refining Gaussians in this context likely involves iteratively improving the parameters of the 3D Gaussians used to represent the articulated object. This could encompass adjusting their position, covariance (shape), opacity, and color to better fit the observed multi-view images and enforce articulation constraints. The refinement process probably uses a loss function that combines photometric consistency (matching rendered images to input views) with geometric regularization and articulation priors. Key is to leverage motion cues between states for guiding the refining, making them canonical. The optimization strategy is crucial, balancing exploration (allowing Gaussians to move and change significantly) with exploitation (fine-tuning existing Gaussians). Coarse-to-fine is the key in initialization and skinning-inspired clustering for refinement.
Part Discovery#
Part discovery in articulated object reconstruction is crucial for understanding object functionality and enabling realistic interactions. Accurately identifying individual parts is challenging due to occlusions, varying appearances, and complex kinematic relationships. Successful part discovery enables finer-grained control over object manipulation and a deeper understanding of object dynamics, improving sim-to-real transfer in robotics. Unsupervised techniques leverage geometric cues and motion patterns to segment objects, while supervised methods rely on pre-existing part annotations or learned priors. The ability to discover object parts is tightly coupled to understanding articulation parameters; errors in one domain may lead to errors in another. Effectively addressing this requires joint optimization strategies, while further work needs more emphasis on how part discovery can benefit interactive tasks.
State Alignment#
State alignment is crucial for articulated object reconstruction, especially when dealing with limited views. Existing methods often struggle to effectively integrate information across different object states, leading to inaccuracies in part-mesh reconstruction and dynamics modeling. A key challenge is to simultaneously learn and align fine-grained object parts across different states, which is essential for accurately reconstructing complex articulated objects. Techniques that can effectively bridge the gap between different object states, such as using canonical Gaussians, are essential for enabling accurate deformation modeling and improving both mesh reconstruction and articulation learning. Proper initialization and update schemes for these representations can further enhance the accuracy and efficiency of state alignment, leading to more robust and reliable reconstruction results. This careful alignment process is key to building interactable digital replicas.
Limited States#
The paper acknowledges that the current approach, ArtGS, is limited to modeling articulated objects using only two states, which might not fully represent real-world complexity, especially multi-part objects. As part count increases, distinguishing parts with similar joint axes and motion patterns becomes a challenge, complicating segmentation. Potential future research includes extending ArtGS to handle multiple states sequentially, and adapting ArtGS for reconstruction from monocular video, leveraging temporal information to infer a continuous range of articulation states. It allows better understanding of the object movement.
More visual insights#
More on tables
| Object | Method | Axis Ang 0 | Axis Ang 1 | Axis Pos 0 | Axis Pos 1 | Part Motion 0 | Part Motion 1 | CD-s | CD-m 0 | CD-m 1 | CD-w | Time (min) |
| Fridge-m | PARIS | 34.52 | 15.91 | 3.60 | 1.63 | 86.21 | 105.86 | 8.52 | 526.19 | 160.86 | 15.00 | - |
| DTA | 0.25 | 0.06 | 0.01 | 0.01 | 0.23 | 0.08 | 0.63 | 0.44 | 0.53 | 0.88 | 32 | |
| Ours | 0.02 | 0.00 | 0.00 | 0.00 | 0.02 | 0.03 | 0.62 | 0.07 | 0.18 | 0.75 | 8 | |
| Storage-m | PARIS | 43.26 | 26.18 | 10.42 | - | 79.84 | 0.64 | 8.56 | 128.62 | 266.71 | 8.66 | - |
| DTA | 0.17 | 0.40 | 0.04 | - | 0.13 | 0.00 | 0.86 | 0.20 | 0.25 | 0.97 | 32 | |
| Ours | 0.01 | 0.02 | 0.01 | - | 0.01 | 0.00 | 0.78 | 0.19 | 0.27 | 0.93 | 8 |
🔼 This table presents a quantitative comparison of the performance of different methods on the DTA-Multi dataset, which contains complex articulated objects with multiple moving parts. Ten independent trials were conducted for each method, using different random seeds to ensure robustness. The metrics used to evaluate performance include angular error and distance error for joint axes, motion error for individual parts, and Chamfer distance for mesh reconstruction (CD-s for static parts, CD-m for movable parts, and CD-w for the whole object). Lower values indicate better performance. Note that Joint 1 of the ‘Storage-m’ object is prismatic, so Axis Pos. data is not available for this specific joint.
read the caption
Table 2: Quantitative evaluation on DTA-Multi. We report averaged metrics over 10 trials with different random seeds. Lower (↓↓\downarrow↓) is better on all metrics. Joint 1 of “Storage-m” is prismatic with no Axis Pos.
| Object | Method | Axis Ang | Axis Pos | Part Motion | CD-s | CD-m | CD-w | Time (min) |
| Table 25493 (4 parts) | DTA | 24.35 | - | 0.12 | 0.59 | 104.38 | 0.55 | 34 |
| Ours | 1.16 | - | 0.00 | 0.74 | 3.53 | 0.74 | 8 | |
| Table 31249 (5 parts) | DTA | 20.62 | 4.2 | 30.8 | 1.39 | 230.38 | 1.00 | 37 |
| Ours | 0.04 | 0.00 | 0.01 | 1.22 | 3.09 | 1.16 | 8 | |
| Storage 45503 (4 parts) | DTA | 51.18 | 2.44 | 43.77 | 5.74 | 246.63 | 0.88 | 35 |
| Ours | 0.02 | 0.00 | 0.03 | 0.75 | 0.13 | 0.88 | 8 | |
| Storage 47468 (7 parts) | DTA | 19.07 | 0.31 | 10.67 | 0.82 | 476.91 | 0.71 | 45 |
| Ours | 0.14 | 0.02 | 0.62 | 0.67 | 3.70 | 0.70 | 8 | |
| Oven 101908 (4 parts) | DTA | 17.83 | 6.51 | 31.80 | 1.17 | 359.16 | 1.01 | 35 |
| Ours | 0.04 | 0.01 | 0.23 | 1.08 | 0.25 | 1.03 | 8 |
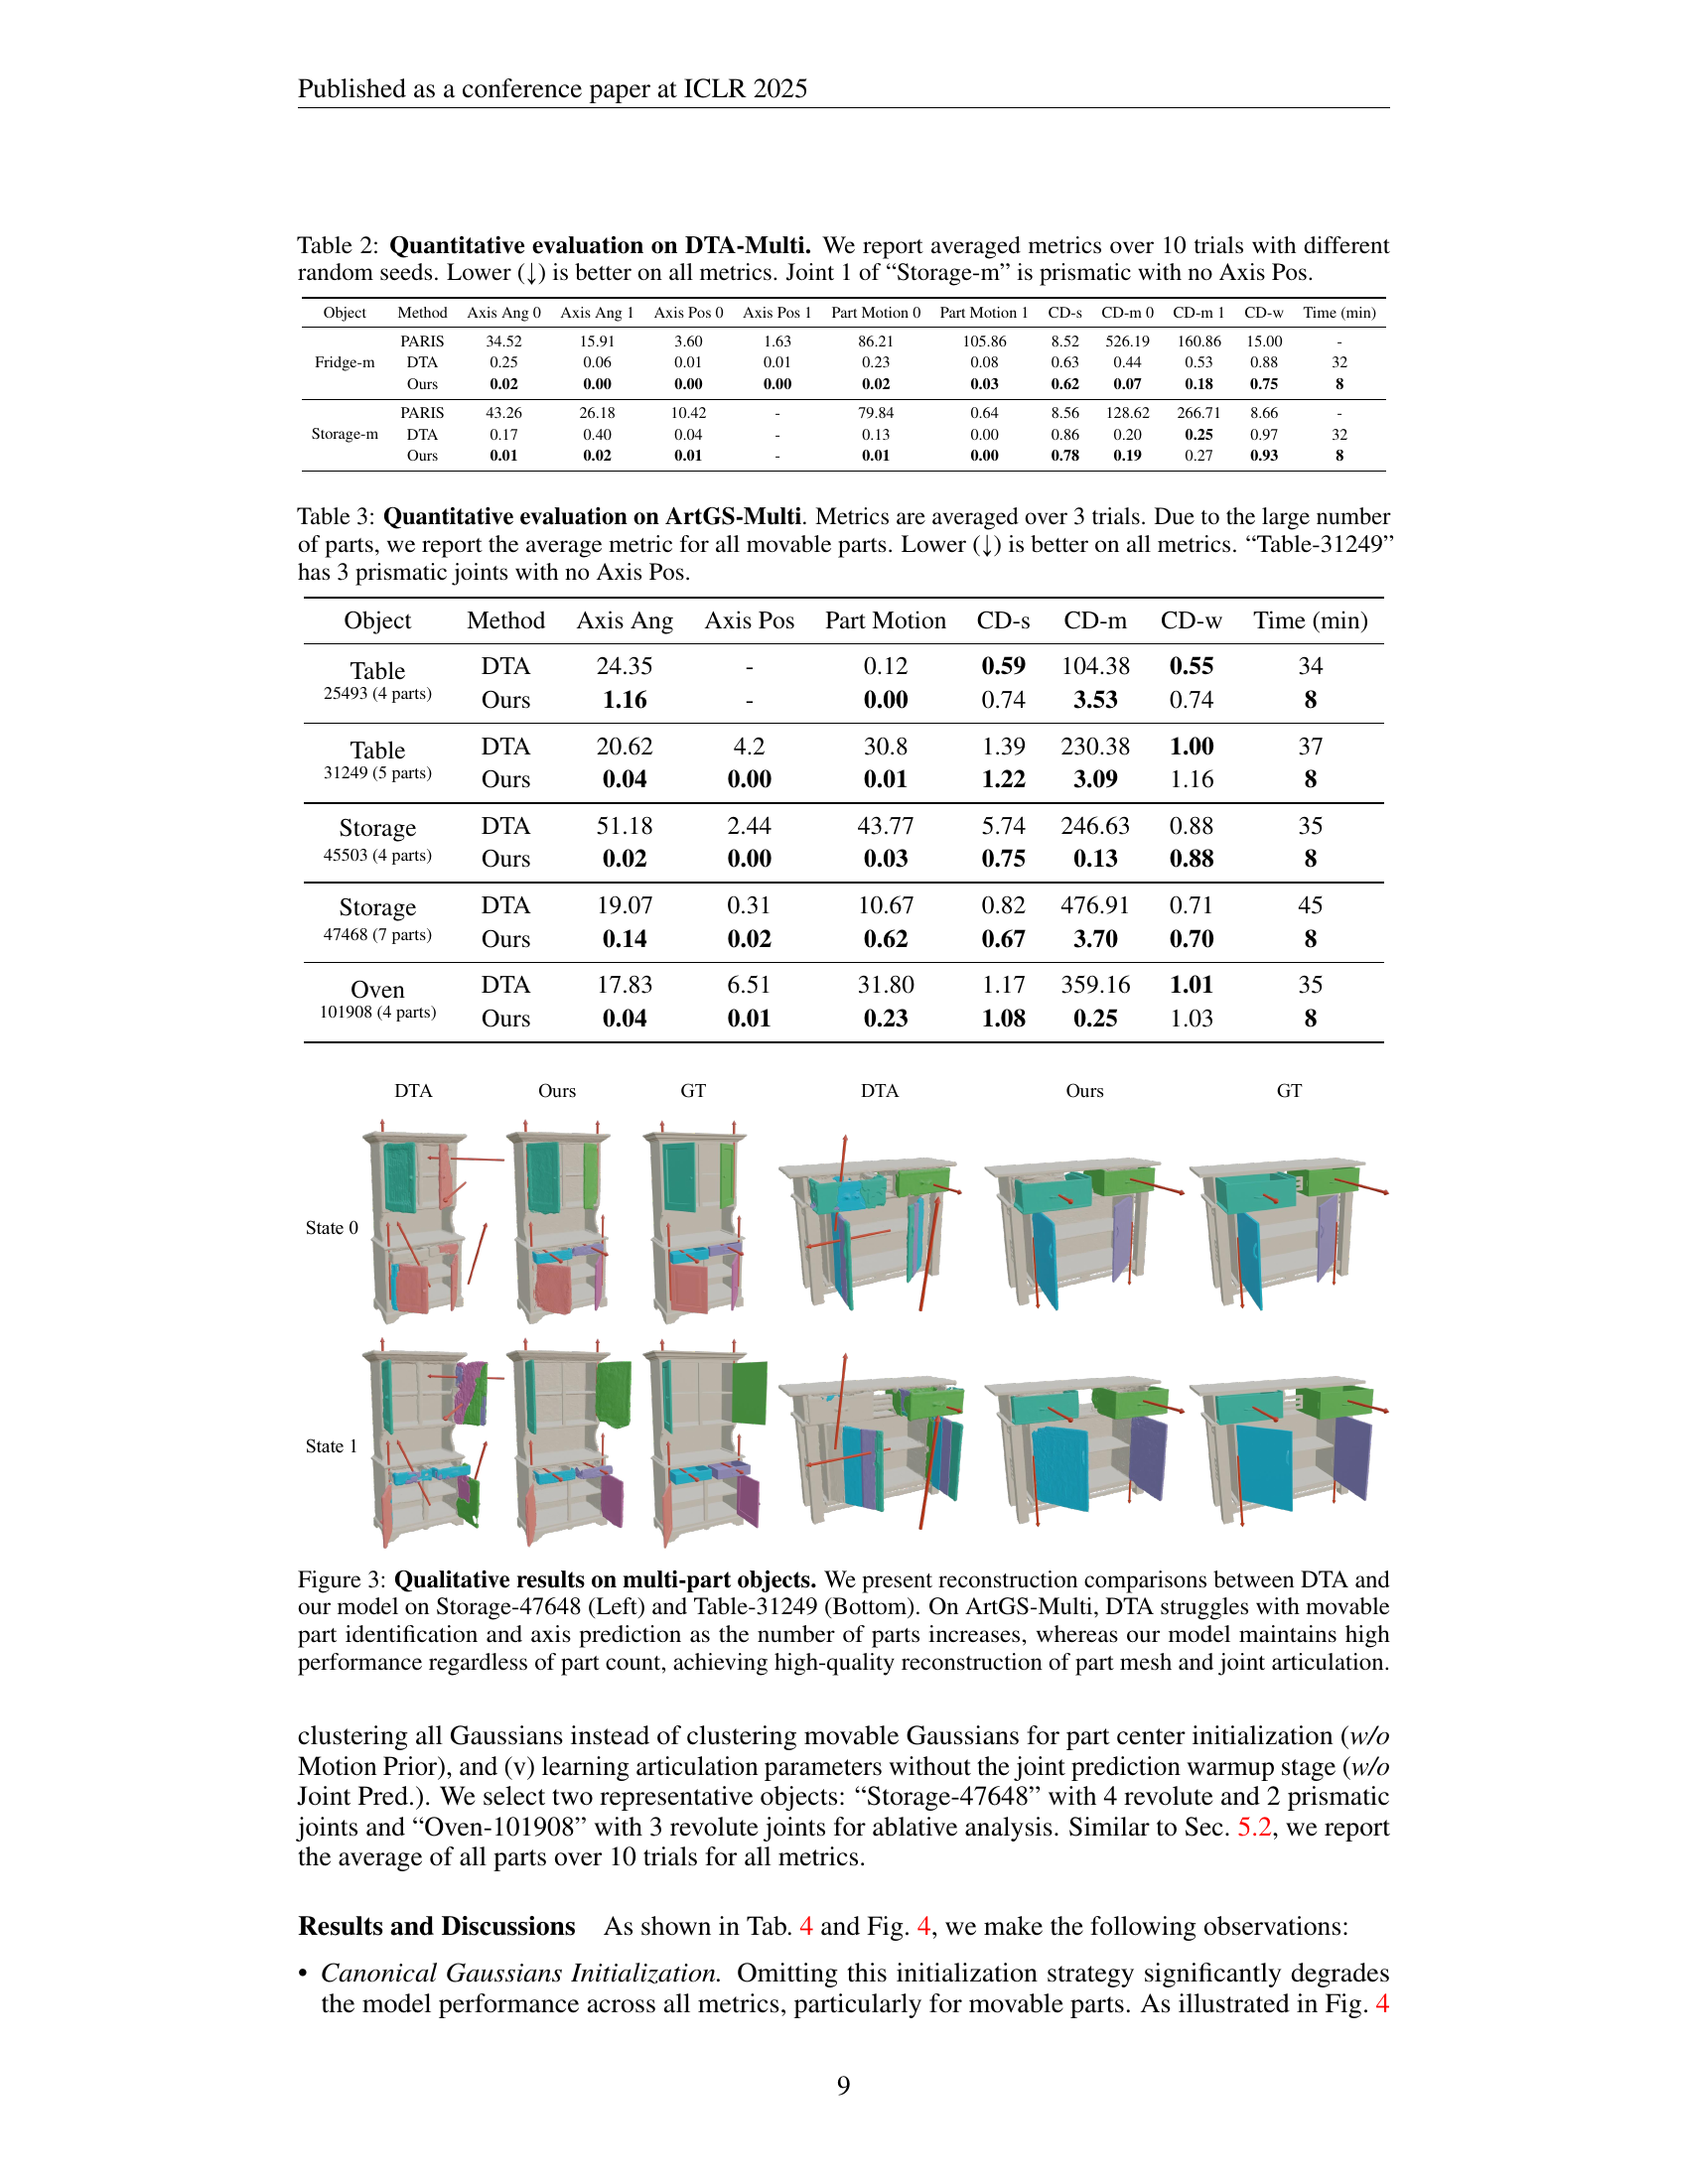
🔼 This table presents a quantitative evaluation of the ArtGS model on the ArtGS-Multi dataset, which consists of complex articulated objects with multiple movable parts. The evaluation metrics include average angular error and positional error for joint axes (Axis Ang, Axis Pos), average part motion error (Part Motion), and Chamfer distance (CD) for mesh reconstruction (CD-s for static parts, CD-m for movable parts, and CD-w for the whole object). Results are averaged over three trials due to the high computational cost of evaluating these complex models. Because of the large number of parts in the ArtGS-Multi dataset, the table reports the average metric over all movable parts for each object. Note that the “Table-31249” object has three prismatic joints, so the Axis Pos metric is not reported for that object.
read the caption
Table 3: Quantitative evaluation on ArtGS-Multi. Metrics are averaged over 3 trials. Due to the large number of parts, we report the average metric for all movable parts. Lower (↓↓\downarrow↓) is better on all metrics. “Table-31249” has 3 prismatic joints with no Axis Pos.
| Method | Storage 47648 (7 parts) | Oven 101908 (4 parts) | ||||||||||
| Axis Ang | Axis Pos | Part Motion | CD-s | CD-m | CD-w | Axis Ang | Axis Pos | Part Motion | CD-s | CD-m | CD-w | |
| Full | 0.14 | 0.02 | 0.62 | 0.67 | 3.70 | 0.70 | 0.04 | 0.01 | 0.23 | 1.08 | 0.25 | 1.03 |
| w/o Cano. init. | 24.15 | 0.73 | 20.61 | 0.83 | 495.07 | 1.25 | 57.87 | 2.95 | 54.45 | 1.73 | 1030.19 | 2.36 |
| w/o Center Init. | 52.78 | 0.83 | 33.04 | 1.09 | 344.19 | 1.69 | 28.94 | 2.36 | 22.46 | 1.41 | 8.86 | 2.13 |
| w/o Motion Prior | 26.74 | 0.22 | 21.16 | 258.23 | 599.46 | 1.15 | 40.08 | 0.98 | 41.06 | 1.75 | 503.44 | 2.35 |
| w/o Joint Pred. | 0.16 | 0.02 | 0.72 | 0.67 | 3.90 | 0.71 | 0.04 | 0.01 | 0.23 | 1.08 | 0.25 | 1.03 |
| w/ MLP Seg | 21.84 | 3.46 | 31.43 | 1.82 | 664.25 | 1.28 | 12.08 | 3.33 | 27.28 | 7.78 | 126.95 | 2.19 |
| w/ SA Seg | 25.43 | 0.7 | 23.22 | 1.52 | 459.89 | 1.16 | 58.04 | 4.53 | 51.28 | 1.26 | 496.64 | 2.35 |
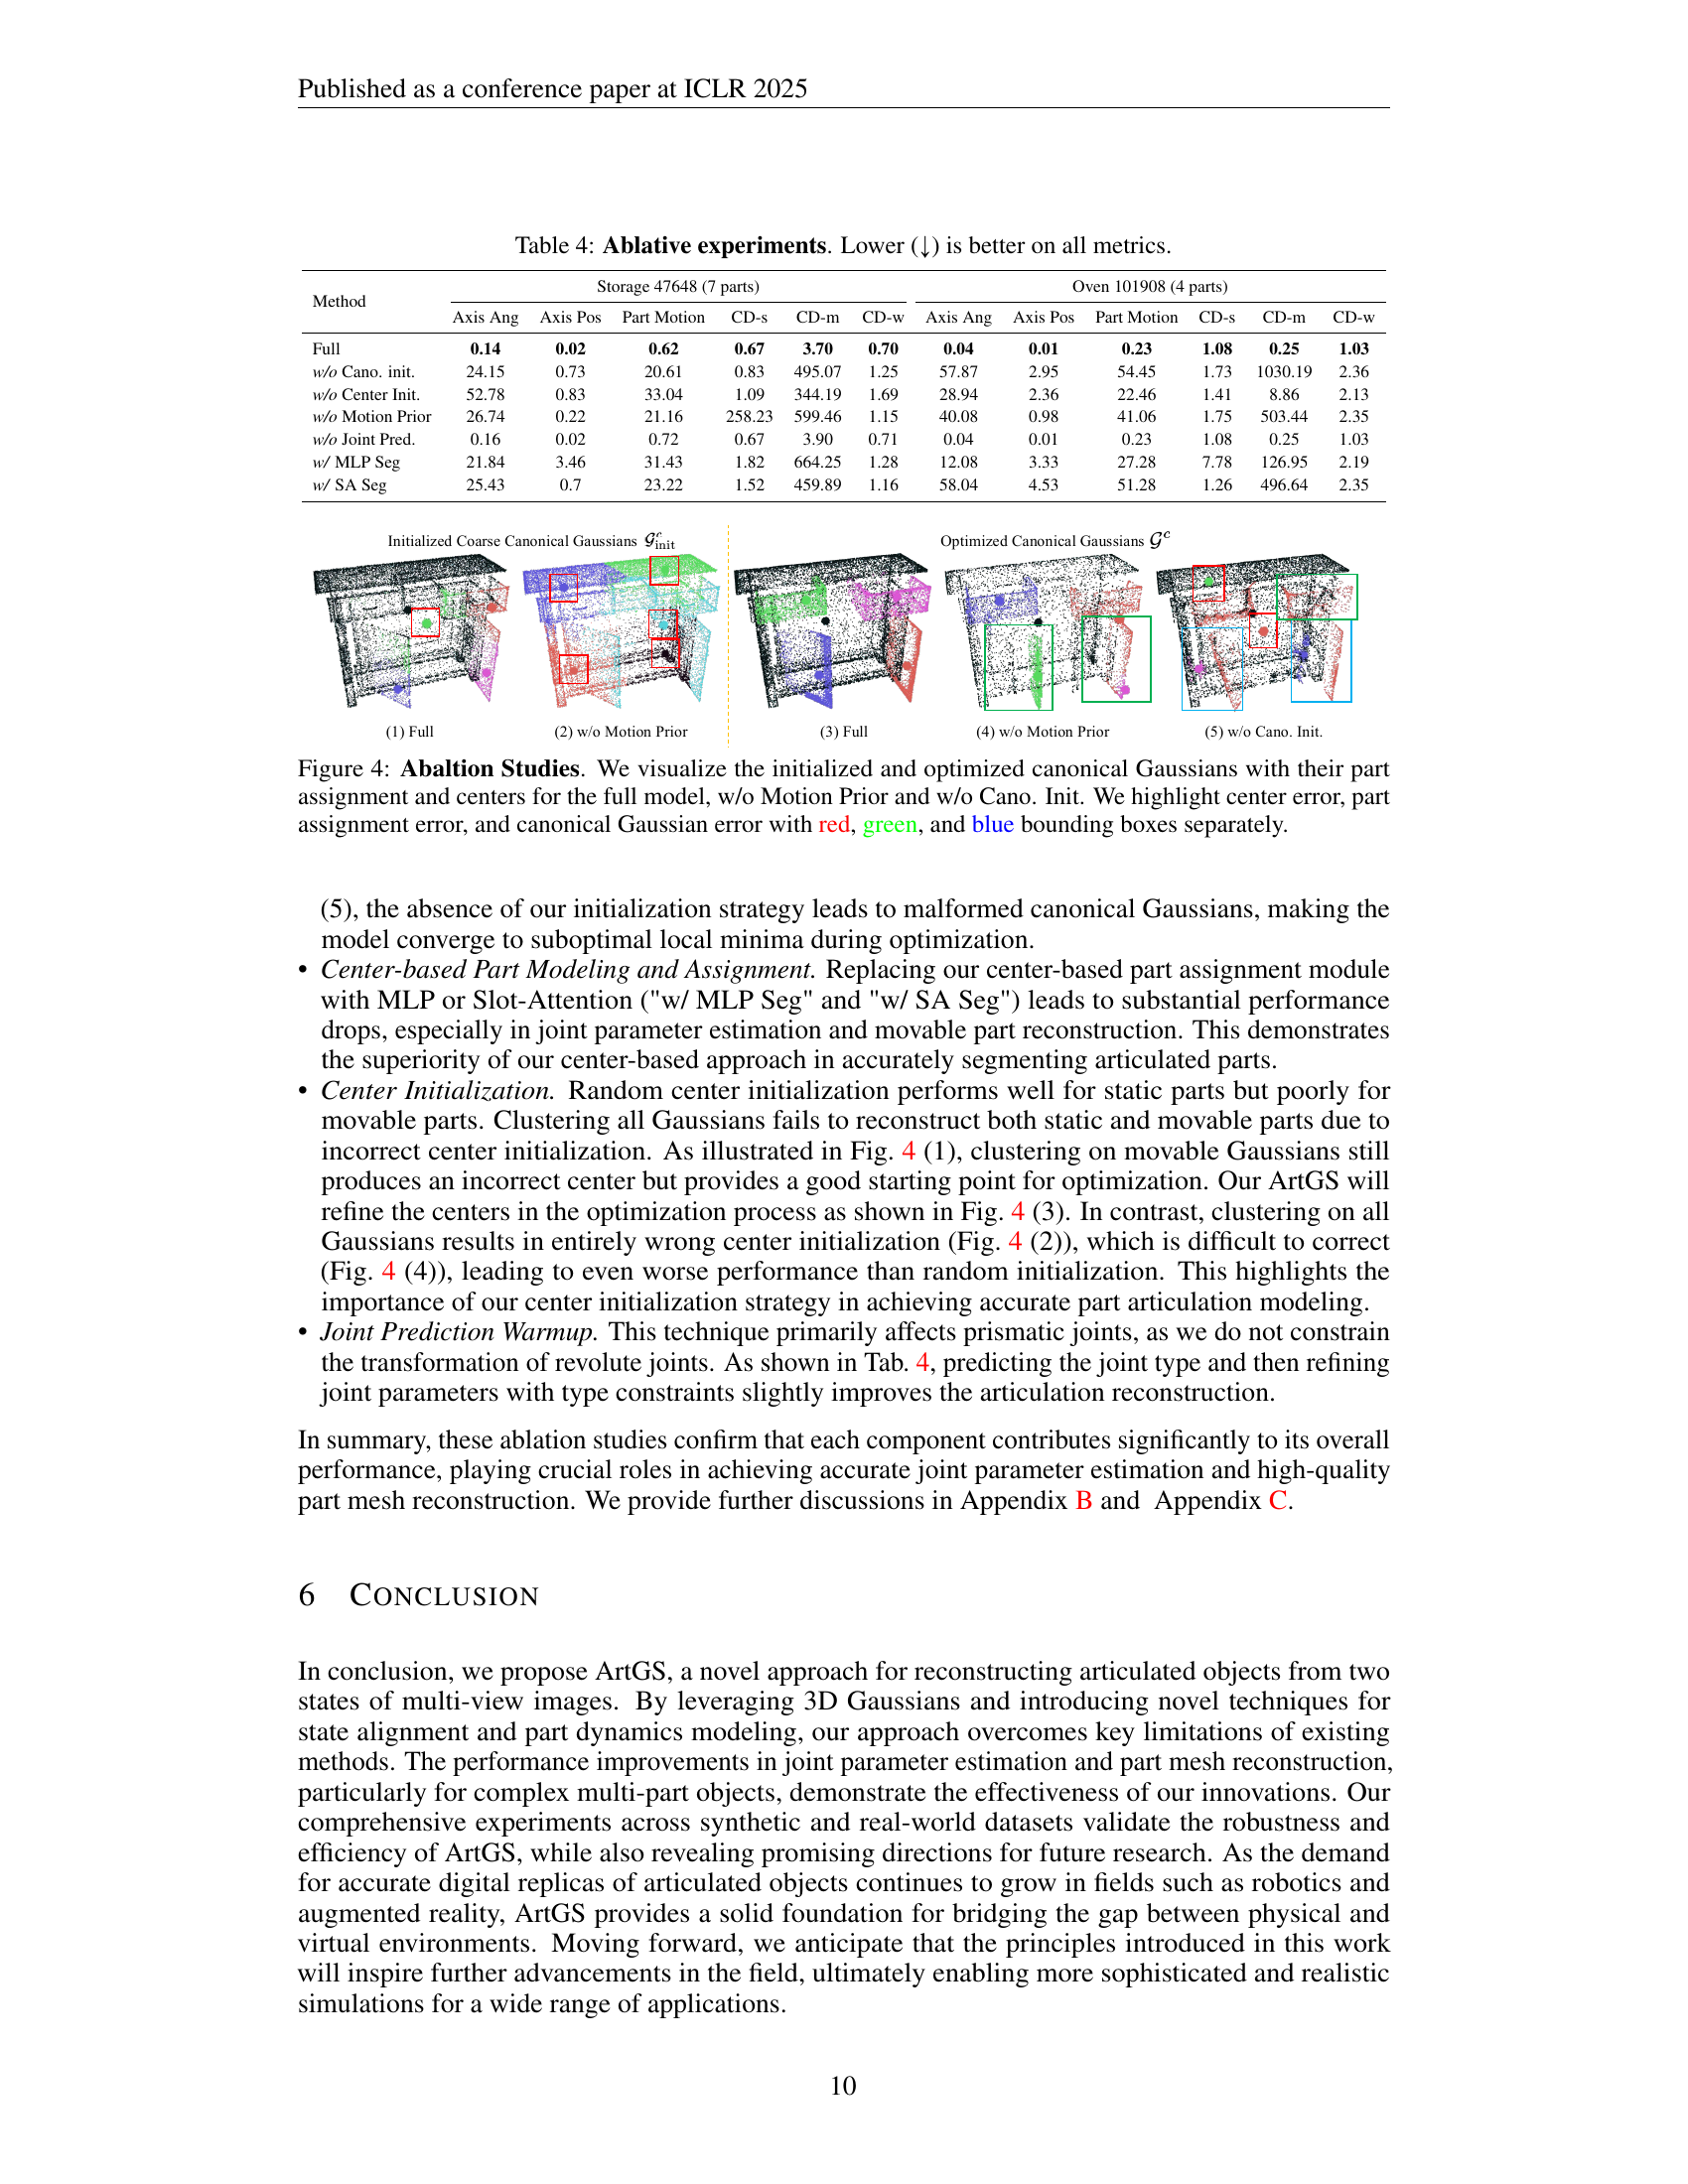
🔼 This table presents the results of ablation studies conducted to evaluate the impact of individual components of the ArtGS model. The table shows quantitative results across multiple metrics (Axis Ang, Axis Pos, Part Motion, CD-s, CD-m, CD-w) for two different objects (Storage-47648 and Oven-101908) from the ArtGS-Multi dataset. Each row represents a different experimental configuration, removing one component of the model to assess its contribution. The ‘Full’ row indicates the complete ArtGS model, while the other rows show results when removing key components such as the canonical Gaussian initialization, center initialization, motion priors, joint prediction warm-up, and different part assignment methods. Lower values for all metrics indicate better performance. This analysis helps to understand the individual contributions of each component to the overall effectiveness of ArtGS.
read the caption
Table 4: Ablative experiments. Lower (↓↓\downarrow↓) is better on all metrics.
| Metric | Method | Synthetic Objects | Real Objects | ||||||||||||
| FoldChair | Fridge | Laptop | Oven | Scissor | Stapler | USB | Washer | Blade | Storage | All | Fridge | Storage | All | ||
| Axis Ang | DTA-0 | 0.03 | 0.09 | 0.07 | 0.22 | 0.10 | 0.06 | 0.11 | 0.36 | 0.20 | 0.07 | 0.13 | 2.08 | 13.64 | 7.86 |
| Ours-0 | 0.01 | 0.03 | 0.01 | 0.01 | 0.05 | 0.01 | 0.04 | 0.02 | 0.03 | 0.01 | 0.02 | 2.09 | 3.47 | 2.78 | |
| DTA-1 | 0.04 | 0.10 | 0.07 | 0.23 | 0.10 | 0.07 | 0.11 | 0.36 | 0.26 | 0.09 | 0.14 | 2.07 | 8.08 | 5.08 | |
| Ours-1 | 0.01 | 0.03 | 0.01 | 0.01 | 0.05 | 0.01 | 0.04 | 0.02 | 0.03 | 0.01 | 0.02 | 2.09 | 3.47 | 2.78 | |
| DTA-m | 0.04 | 0.10 | 0.07 | 0.22 | 0.10 | 0.06 | 0.11 | 0.36 | 0.23 | 0.08 | 0.14 | 2.08 | 10.86 | 6.47 | |
| Ours-m | 0.01 | 0.03 | 0.01 | 0.01 | 0.05 | 0.01 | 0.04 | 0.02 | 0.03 | 0.01 | 0.02 | 2.09 | 3.47 | 2.78 | |
| Axis Pos | DTA-0 | 0.01 | 0.01 | 0.01 | 0.01 | 0.03 | 0.02 | 0.00 | 0.04 | - | - | 0.02 | 0.59 | - | 0.59 |
| Ours-0 | 0.00 | 0.00 | 0.01 | 0.00 | 0.00 | 0.01 | 0.00 | 0.00 | - | - | 0.00 | 0.47 | - | 0.47 | |
| DTA-1 | 0.01 | 0.01 | 0.01 | 0.01 | 0.02 | 0.02 | 0.00 | 0.05 | - | - | 0.02 | 0.59 | - | 0.59 | |
| Ours-1 | 0.00 | 0.00 | 0.01 | 0.00 | 0.00 | 0.01 | 0.00 | 0.00 | - | - | 0.00 | 0.47 | - | 0.47 | |
| DTA-m | 0.01 | 0.01 | 0.01 | 0.01 | 0.03 | 0.02 | 0.00 | 0.04 | - | - | 0.02 | 0.59 | - | 0.59 | |
| Ours-m | 0.00 | 0.00 | 0.01 | 0.00 | 0.00 | 0.01 | 0.00 | 0.00 | - | - | 0.00 | 0.47 | - | 0.47 | |
| Part Motion | DTA-0 | 0.10 | 0.12 | 0.11 | 0.12 | 0.38 | 0.08 | 0.15 | 0.28 | 0.00 | 0.00 | 0.13 | 1.85 | 0.14 | 1.00 |
| Ours-0 | 0.03 | 0.04 | 0.02 | 0.02 | 0.04 | 0.01 | 0.03 | 0.03 | 0.00 | 0.00 | 0.02 | 1.94 | 0.04 | 0.99 | |
| DTA-1 | 0.09 | 0.13 | 0.11 | 0.13 | 0.37 | 0.08 | 0.14 | 0.28 | 0.00 | 0.00 | 0.13 | 1.85 | 0.09 | 0.97 | |
| Ours-1 | 0.03 | 0.04 | 0.02 | 0.02 | 0.04 | 0.01 | 0.03 | 0.03 | 0.00 | 0.00 | 0.02 | 1.94 | 0.04 | 0.99 | |
| DTA-m | 0.09 | 0.12 | 0.11 | 0.12 | 0.38 | 0.08 | 0.15 | 0.28 | 0.00 | 0.00 | 0.13 | 1.85 | 0.12 | 0.99 | |
| Ours-m | 0.03 | 0.04 | 0.02 | 0.02 | 0.04 | 0.01 | 0.03 | 0.03 | 0.00 | 0.00 | 0.02 | 1.94 | 0.04 | 0.99 | |
| CD-s | DTA-0 | 0.18 | 0.62 | 0.32 | 4.60 | 3.30 | 2.68 | 2.32 | 4.77 | 0.55 | 4.71 | 2.41 | 2.36 | 10.98 | 6.67 |
| Ours-0 | 0.26 | 0.52 | 0.59 | 3.88 | 0.62 | 3.85 | 2.25 | 6.41 | 0.54 | 7.47 | 2.64 | 1.64 | 2.93 | 2.29 | |
| DTA-1 | 0.19 | 0.63 | 0.30 | 4.58 | 3.55 | 2.91 | 2.90 | 4.56 | 0.45 | 4.90 | 2.50 | 2.59 | 9.60 | 6.10 | |
| Ours-1 | 0.26 | 0.48 | 0.63 | 4.00 | 0.61 | 3.83 | 2.56 | 6.43 | 0.54 | 7.31 | 2.67 | 2.01 | 4.02 | 3.02 | |
| DTA-m | 0.19 | 0.62 | 0.31 | 4.59 | 3.43 | 2.79 | 2.61 | 4.66 | 0.50 | 4.80 | 2.46 | 2.48 | 10.29 | 6.39 | |
| Ours-m | 0.26 | 0.50 | 0.61 | 3.94 | 0.61 | 3.84 | 2.41 | 6.42 | 0.54 | 7.39 | 2.65 | 1.82 | 3.48 | 2.65 | |
| CD-m | DTA-0 | 0.15 | 0.27 | 0.16 | 0.44 | 17.38 | 2.34 | 1.47 | 0.37 | 2.05 | 0.36 | 2.50 | 1.12 | 30.78 | 15.95 |
| Ours-0 | 0.54 | 0.21 | 0.14 | 0.89 | 0.65 | 0.88 | 1.22 | 1.54 | 1.12 | 1.03 | 0.82 | 0.66 | 6.28 | 3.47 | |
| DTA-1 | 0.13 | 0.30 | 0.13 | 0.45 | 10.11 | 1.13 | 1.51 | 0.45 | 61.38 | 0.36 | 7.60 | 1.85 | 365.74 | 183.80 | |
| Ours-1 | 0.12 | 0.21 | 0.13 | 0.76 | 0.64 | 0.52 | 1.43 | 0.45 | 1.01 | 1.02 | 0.63 | 1.31 | 87.81 | 44.56 | |
| DTA-m | 0.14 | 0.28 | 0.15 | 0.44 | 13.75 | 1.73 | 1.49 | 0.41 | 31.72 | 0.36 | 5.05 | 1.48 | 198.26 | 99.88 | |
| Ours-m | 0.33 | 0.21 | 0.14 | 0.82 | 0.65 | 0.70 | 1.33 | 1.00 | 1.06 | 1.02 | 0.73 | 0.99 | 47.05 | 24.02 | |
| CD-w | DTA-0 | 0.27 | 0.70 | 0.35 | 4.24 | 0.42 | 2.13 | 1.17 | 4.59 | 0.36 | 4.09 | 1.83 | 2.08 | 8.98 | 5.53 |
| Ours-0 | 0.43 | 0.58 | 0.47 | 3.58 | 0.69 | 3.13 | 1.28 | 6.12 | 0.61 | 5.13 | 2.20 | 1.29 | 3.23 | 2.26 | |
| DTA-1 | 0.26 | 0.70 | 0.32 | 4.27 | 0.41 | 1.92 | 1.52 | 4.48 | 0.38 | 3.99 | 1.83 | 2.19 | 9.03 | 5.61 | |
| Ours-1 | 0.30 | 0.59 | 0.50 | 3.71 | 0.67 | 2.63 | 1.87 | 5.99 | 0.65 | 5.21 | 2.21 | 1.45 | 2.45 | 1.95 | |
| DTA-m | 0.26 | 0.70 | 0.34 | 4.25 | 0.41 | 2.02 | 1.34 | 4.53 | 0.37 | 4.04 | 1.83 | 2.13 | 9.01 | 5.57 | |
| Ours-m | 0.36 | 0.59 | 0.48 | 3.64 | 0.68 | 2.88 | 1.58 | 6.05 | 0.63 | 5.17 | 2.21 | 1.37 | 2.84 | 2.11 | |
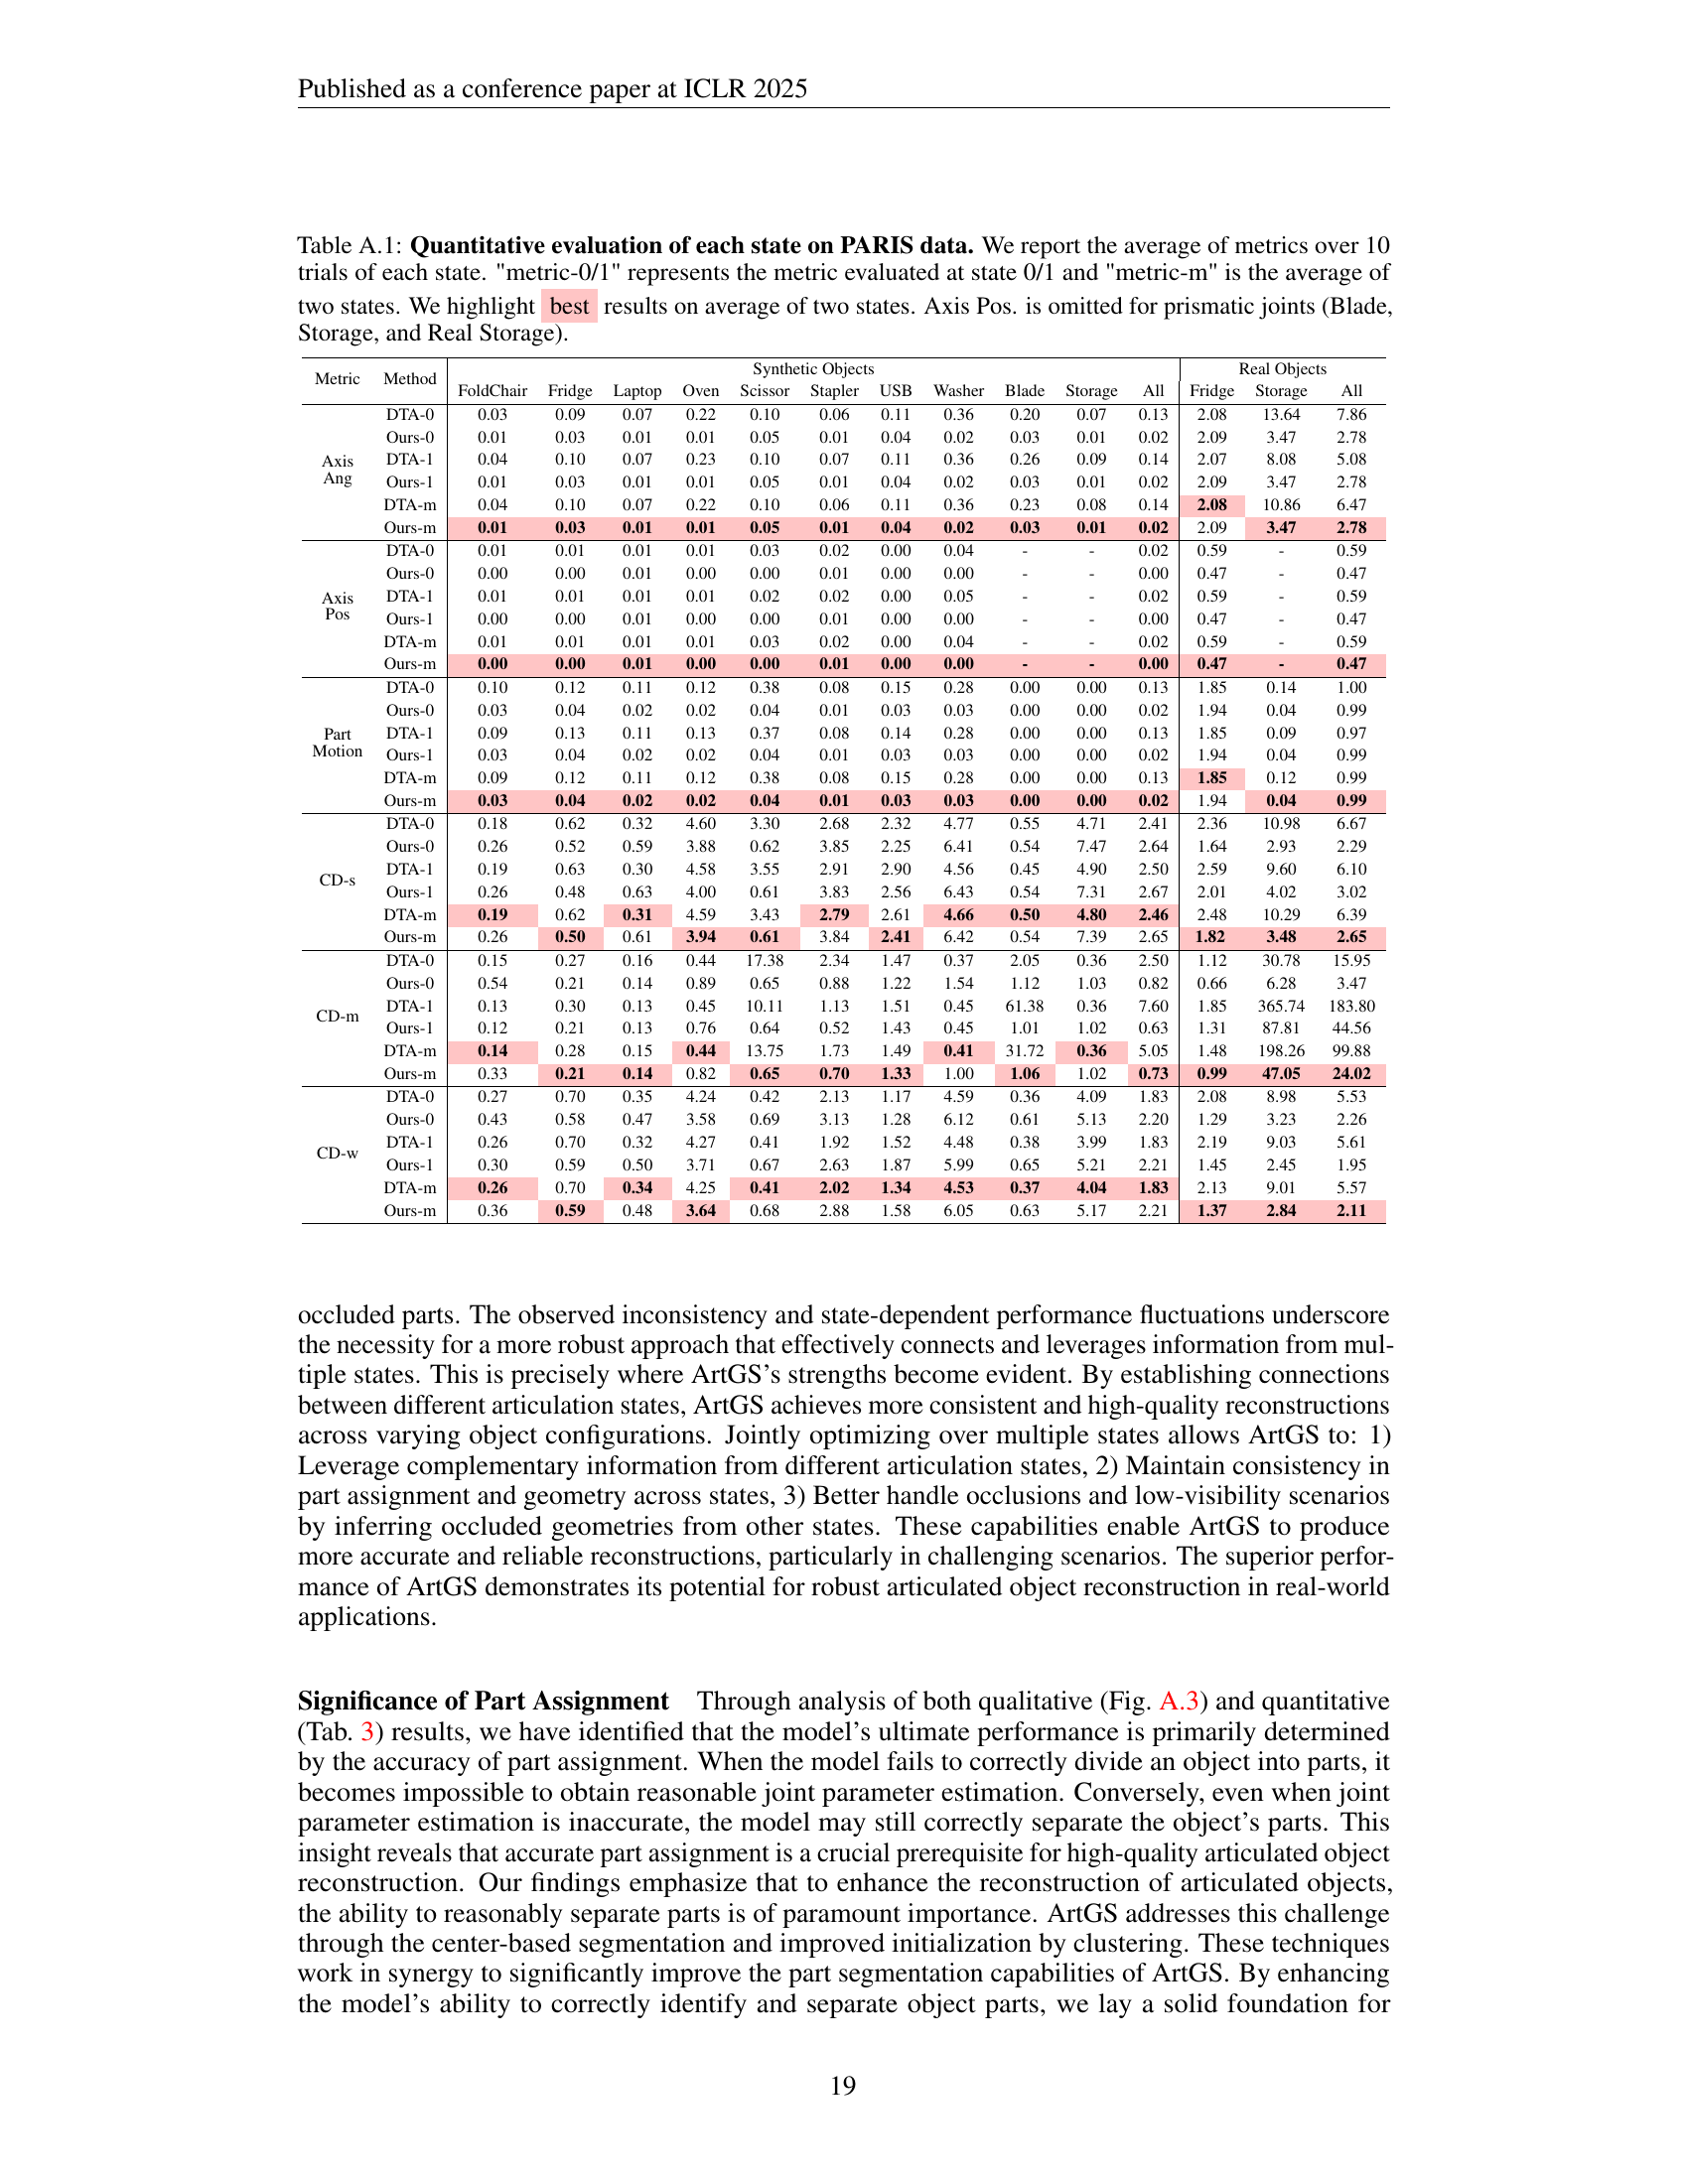
🔼 Table A.1 presents a comprehensive quantitative analysis of the PARIS dataset, evaluating model performance across different states (0 and 1) of articulated objects. For each object, it provides the average of ten trials’ results for key metrics: Axis Angle, Axis Position (omitted for prismatic joints), Part Motion, and Chamfer Distance (CD) for the whole object, static parts, and movable parts. The ‘metric-m’ column indicates the average over both states. The best result (lowest error) among the two states for each metric is highlighted. This table helps to understand how model accuracy changes depending on the specific state and object.
read the caption
Table A.1: Quantitative evaluation of each state on PARIS data. We report the average of metrics over 10 trials of each state. 'metric-0/1' represents the metric evaluated at state 0/1 and 'metric-m' is the average of two states. We highlight best results on average of two states. Axis Pos. is omitted for prismatic joints (Blade, Storage, and Real Storage).
| Metric | Method | FoldChair | Fridge | Laptop | Oven | Scissor | Stapler | USB | Washer | All |
| Axis Pos | DTA | 0.530.3 | 0.620.3 | 1.100.7 | 1.491.0 | 2.482.8 | 2.211.8 | 0.350.2 | 4.532.8 | 1.661.2 |
| Ours | 0.480.2 | 0.440.2 | 0.390.3 | 0.550.4 | 0.160.1 | 0.930.4 | 0.080.1 | 0.330.3 | 0.420.3 |
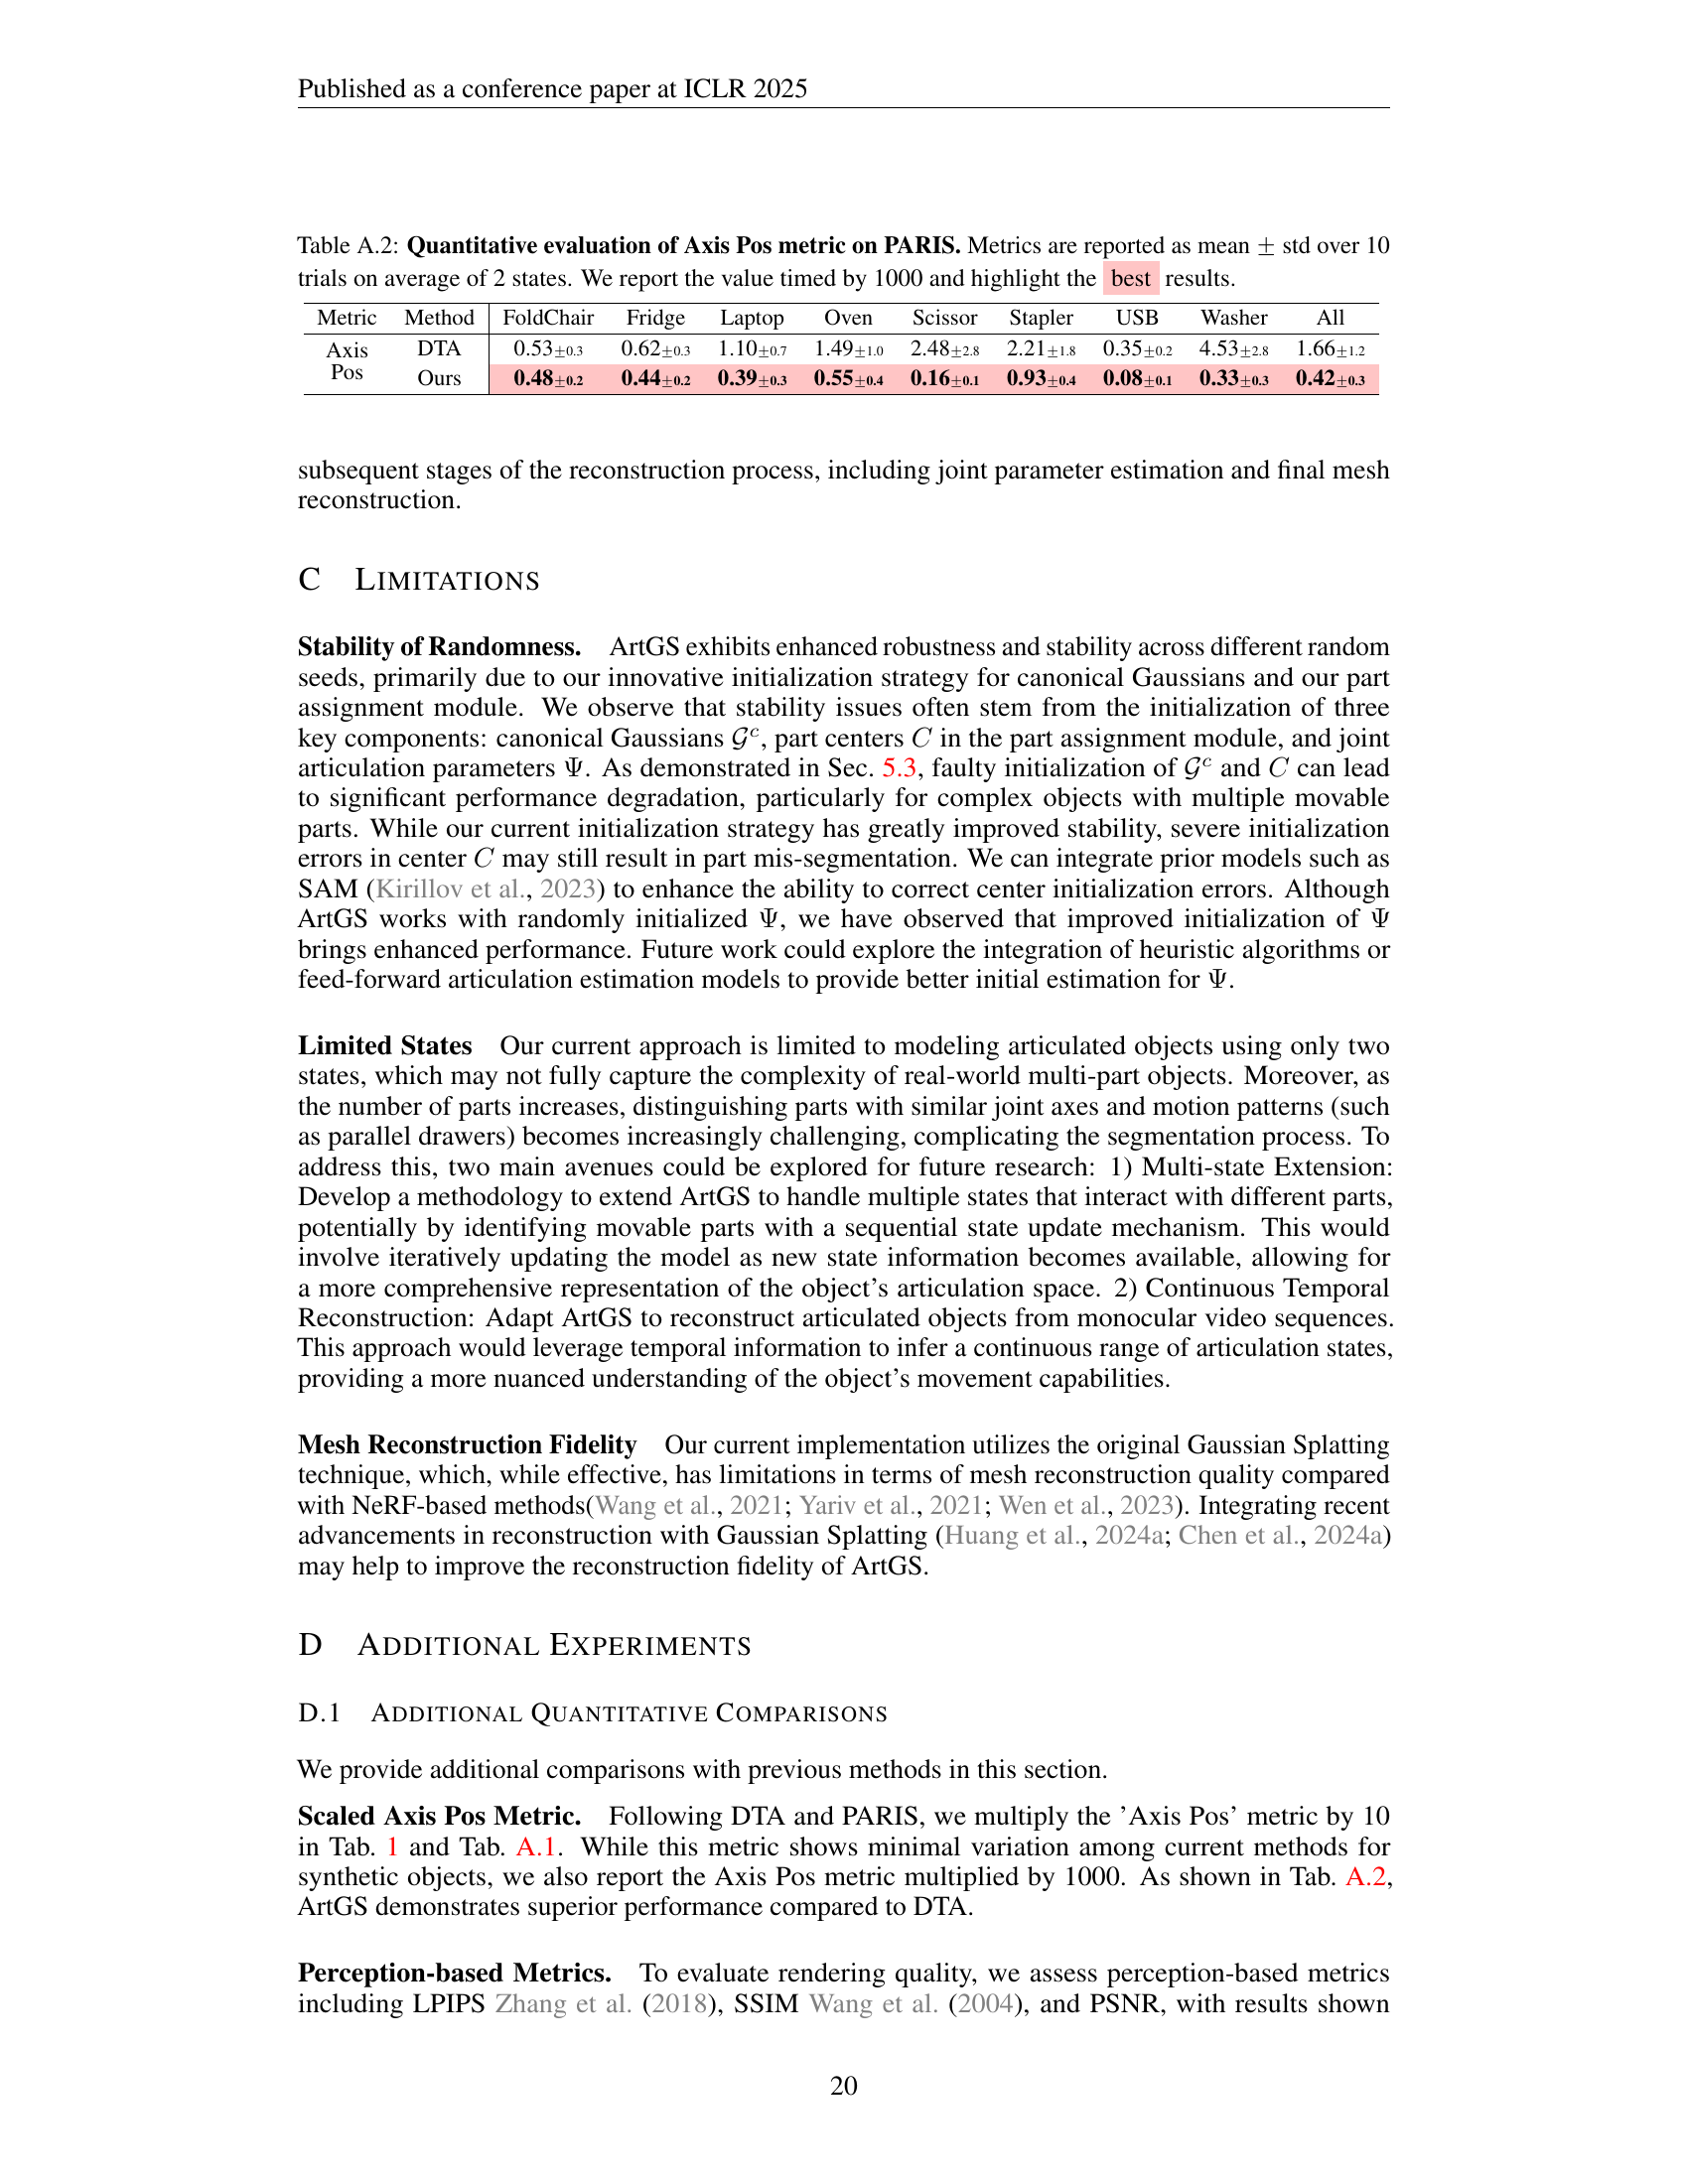
🔼 This table presents a quantitative evaluation of the accuracy of articulation parameter estimation, specifically focusing on the ‘Axis Pos’ metric. The data is averaged over ten trials for each object in the PARIS dataset, considering both states (two different configurations). The values are multiplied by 1000 for better visualization and the best results are highlighted to enable easy comparison across different objects.
read the caption
Table A.2: Quantitative evaluation of Axis Pos metric on PARIS. Metrics are reported as mean ±plus-or-minus\pm± std over 10 trials on average of 2 states. We report the value timed by 1000 and highlight the best results.
| Metric | Method | Synthetic Objects | Real Objects | ||||||||||||
| FoldChair | Fridge | Laptop | Oven | Scissor | Stapler | USB | Washer | Blade | Storage | All | Fridge | Storage | All | ||
| PSNR | PARIS | 31.50 | 37.67 | 37.26 | 35.30 | 38.37 | 38.49 | 39.07 | 40.08 | 38.29 | 36.18 | 37.22 | 25.29 | 27.13 | 26.21 |
| Ours | 34.46 | 37.11 | 34.09 | 37.06 | 38.29 | 39.13 | 39.64 | 38.50 | 41.16 | 37.24 | 37.67 | 27.05 | 25.38 | 26.22 | |
| SSIM | PARIS | 0.985 | 0.994 | 0.991 | 0.980 | 0.996 | 0.995 | 0.992 | 0.991 | 0.996 | 0.993 | 0.991 | 0.898 | 0.953 | 0.926 |
| Ours | 0.997 | 0.993 | 0.988 | 0.995 | 0.998 | 0.999 | 0.998 | 0.995 | 0.999 | 0.992 | 0.995 | 0.939 | 0.930 | 0.935 | |
| PARIS | 0.045 | 0.032 | 0.020 | 0.045 | 0.015 | 0.019 | 0.029 | 0.029 | 0.017 | 0.095 | 0.035 | 0.188 | 0.139 | 0.164 | |
| Ours | 0.036 | 0.041 | 0.045 | 0.054 | 0.014 | 0.011 | 0.016 | 0.052 | 0.004 | 0.097 | 0.037 | 0.114 | 0.188 | 0.151 | |
🔼 This table presents a quantitative evaluation of perception-based metrics on the PARIS dataset. The metrics used are Peak Signal-to-Noise Ratio (PSNR), Structural Similarity Index (SSIM), and Learned Perceptual Image Patch Similarity (LPIPS). Results are averaged over the two states of each object in the dataset (open and closed). The best-performing method for each metric and object is highlighted for better readability and comparison.
read the caption
Table A.3: Quantitative evaluation for perception-based metrics on PARIS data. We report the results on average of two states. We highlight best results.
| Metric | Method | Synthetic Objects | Real Objects | ||||||||||||
| FoldChair | Fridge | Laptop | Oven | Scissor | Stapler | USB | Washer | Blade | Storage | All | Fridge | Storage | All | ||
| CD-w | DTA | 0.26 | 0.70 | 0.34 | 4.25 | 0.41 | 2.02 | 1.34 | 4.53 | 0.37 | 4.04 | 1.83 | 2.13 | 9.01 | 5.57 |
| TSDF with gt depth | 0.30 | 0.56 | 0.47 | 3.60 | 0.49 | 2.78 | 1.60 | 5.73 | 0.54 | 5.13 | 2.12 | 3.15 | 131.86 | 67.51 | |
| Ours | 0.36 | 0.59 | 0.48 | 3.64 | 0.68 | 2.88 | 1.58 | 6.05 | 0.63 | 5.17 | 2.21 | 1.37 | 2.84 | 2.11 | |
🔼 This table presents a quantitative comparison of whole mesh reconstruction performance on the PARIS dataset. It shows the average Chamfer Distance (CD-w) metric calculated over 10 trials for each of the methods being compared. The results are broken down by object category and include results for both states (the average of two states is also included) allowing for direct comparison of reconstruction quality across different articulation states. The best performing method for each object category is indicated in bold.
read the caption
Table A.4: Quantitative comparison for whole mesh reconstruction on PARIS data. We report the average of CD-w over 10 trials. We bold best results on average of two states.
Full paper#